Abstract
The liquid–liquid phase separation (LLPS) behavior of Fe50Cu50 melt from 3500 K to 300 K with different rapid quenching is investigated by molecular dynamics (MD) simulation based on the embedded atom method (EAM). The liquid undergoes metastable phase separation by spinodal decomposition in the undercooled regime and subsequently solidifies into three different Fe-rich microstructures: the interconnected-type structure is kept in the glass and crystal at a higher cooling rate, while the Fe-rich droplets are found to crystalize at a lower cooling rate. During the crystallization process, only Fe-rich clusters can act as the solid nuclei. The twinning planes can be observed in the crystal and only the homogeneous atomic stacking shows mirror symmetry along the twinning boundary. Our present work provides atomic-scale understanding of LLPS melt during the cooling process.
1. Introduction
The typical microstructure of phase separation is classified into an interconnected structure or a droplet-like structure by mechanisms such as spinodal decomposition and nucleation growth [1,2,3]. The liquid–liquid phase separation (LLPS) occurs first above the liquidus or in the undercooled liquid, after which each liquid region undergoes a liquid-to-glass or liquid-to-crystal transition through a combination of rapid quenching techniques and container-less undercooling, resulting in the formation of a two-phase amorphous alloy, two-phase crystal or one-phase crystal, one-phase amorphous alloy. Because the LLPS competes with crystallization, relatively, in metallic alloy, it is difficult to obtain the interconnected structures by spinodal decomposition [4,5,6]. Thus, most of the microstructures obtained by the phase separating alloy are the droplet structure, which is formed by nucleation and the growth reaction. The successful fabrication of two-phase crystal makes it useful in various industrial applications, such as bearing materials and electronic packaging materials. The bulk glass with a nano-sized separated phase shows high strength and toughness [7,8,9,10,11] due to the enhancing overall plastic deformability through the formation of a multiple-branched shear band [7,10,11]. The size, shape and distribution of the second phase, controlled by the cooling rate, show great influence on the final properties of glass or crystal after rapid solidification. However, the vitrification and crystallization of phase-separated metallic liquid at atomic level is still unknown.
A metastable miscibility gap exists at higher temperatures [4] in the Fe–Cu phase diagram due to its positive mixing enthalpy; while others think that Fe–Cu alloys are completely miscible in the stable liquid state, the system shows a wide metastable miscibility gap at rather low undercooling values [5]. Thus, the Fe–Cu system provides a model system to study LLPS. LLPS of the Fe–Cu system is very difficult to observe because of its high temperature and opaque characteristics. In our earlier paper, the LLPS behavior of liquid Fe–Cu above the liquidus line has been studied by molecular dynamics (MD) simulation [12]; in addition, MD simulation has also been performed to explore the structural and dynamical heterogeneity of Fe75Cu25 melts, which separate into Cu-rich droplets surrounded by the Fe-rich matrix controlled by nucleation and the growth mechanism [13]. However, the separation process of Fe–Cu melts, especially the formation of metallic glass and crystal after separation, is not involved in literature, although the liquid phase separation and metallic glass formation in the Fe–Cu-based alloy has also been reported [14,15,16,17]. MD calculation, in combination with a reasonable potential model, has been applied as a powerful tool to study the properties of liquid alloy. The objective of the present work is to investigate the separation mechanism of Fe50Cu50 melt as well as the subsequent glass and crystal formation after separation during rapid cooling by computing the structure, thermodynamics and dynamics parameters.
2. Simulation Details
In this study, calculations have been performed using the Fe–Cu potential according to G. Bonny [18]. The simulations are performed at zero external pressure in order to allow for a direct comparison to experiments under ambient pressure. Systems of N = 25,600 atoms are put in a cubic simulation box with periodic boundary conditions. To observe the structural change clearly, the box size along the x y z direction are set to 40 L, 40 L and 4 L (L is the crystal lattice of the Fe) respectively. The number ratio of Fe and Cu is 1:1. MD simulations in isothermal-isobaric (NPT) ensemble were performed by the large-scale atomistic/molecular massively parallel simulator (LAMMPS, distributed by Sandia National Laboratories, a US Department of Energy laboratory), and Newton’s equations of motion are integrated with the velocity form of the Verlet algorithm using a time step of 1 fs. The masses of Fe and Cu atoms are set to mFe = 58.587 amu and mCu = 63.546 amu. Firstly, the system is fully equilibrated at 3500 K by performing runs: 2 × 10⁵ time steps in NPT systems. To keep temperature constant, we apply the Andersen thermostat where, after every 100 cycles, we have chosen new velocities from a Maxwell–Boltzmann distribution in accordance with the temperature of the system. Next, equilibrated configuration obtained from simulation is used as an initial configuration for the following cooling process. The temperatures considered are from 3500 K to 300 K at a cooling rate of 6.4 × 10¹² K/s, 6.4 × 10¹¹ K/s and 1.28 × 10¹¹ K/s respectively, to examine the glass formation and crystallization processes. The configurations are recorded every 200 K. The atom configurations are reported every 10 K to explore the thermodynamics properties during phase transition.
3. Results and Discussion
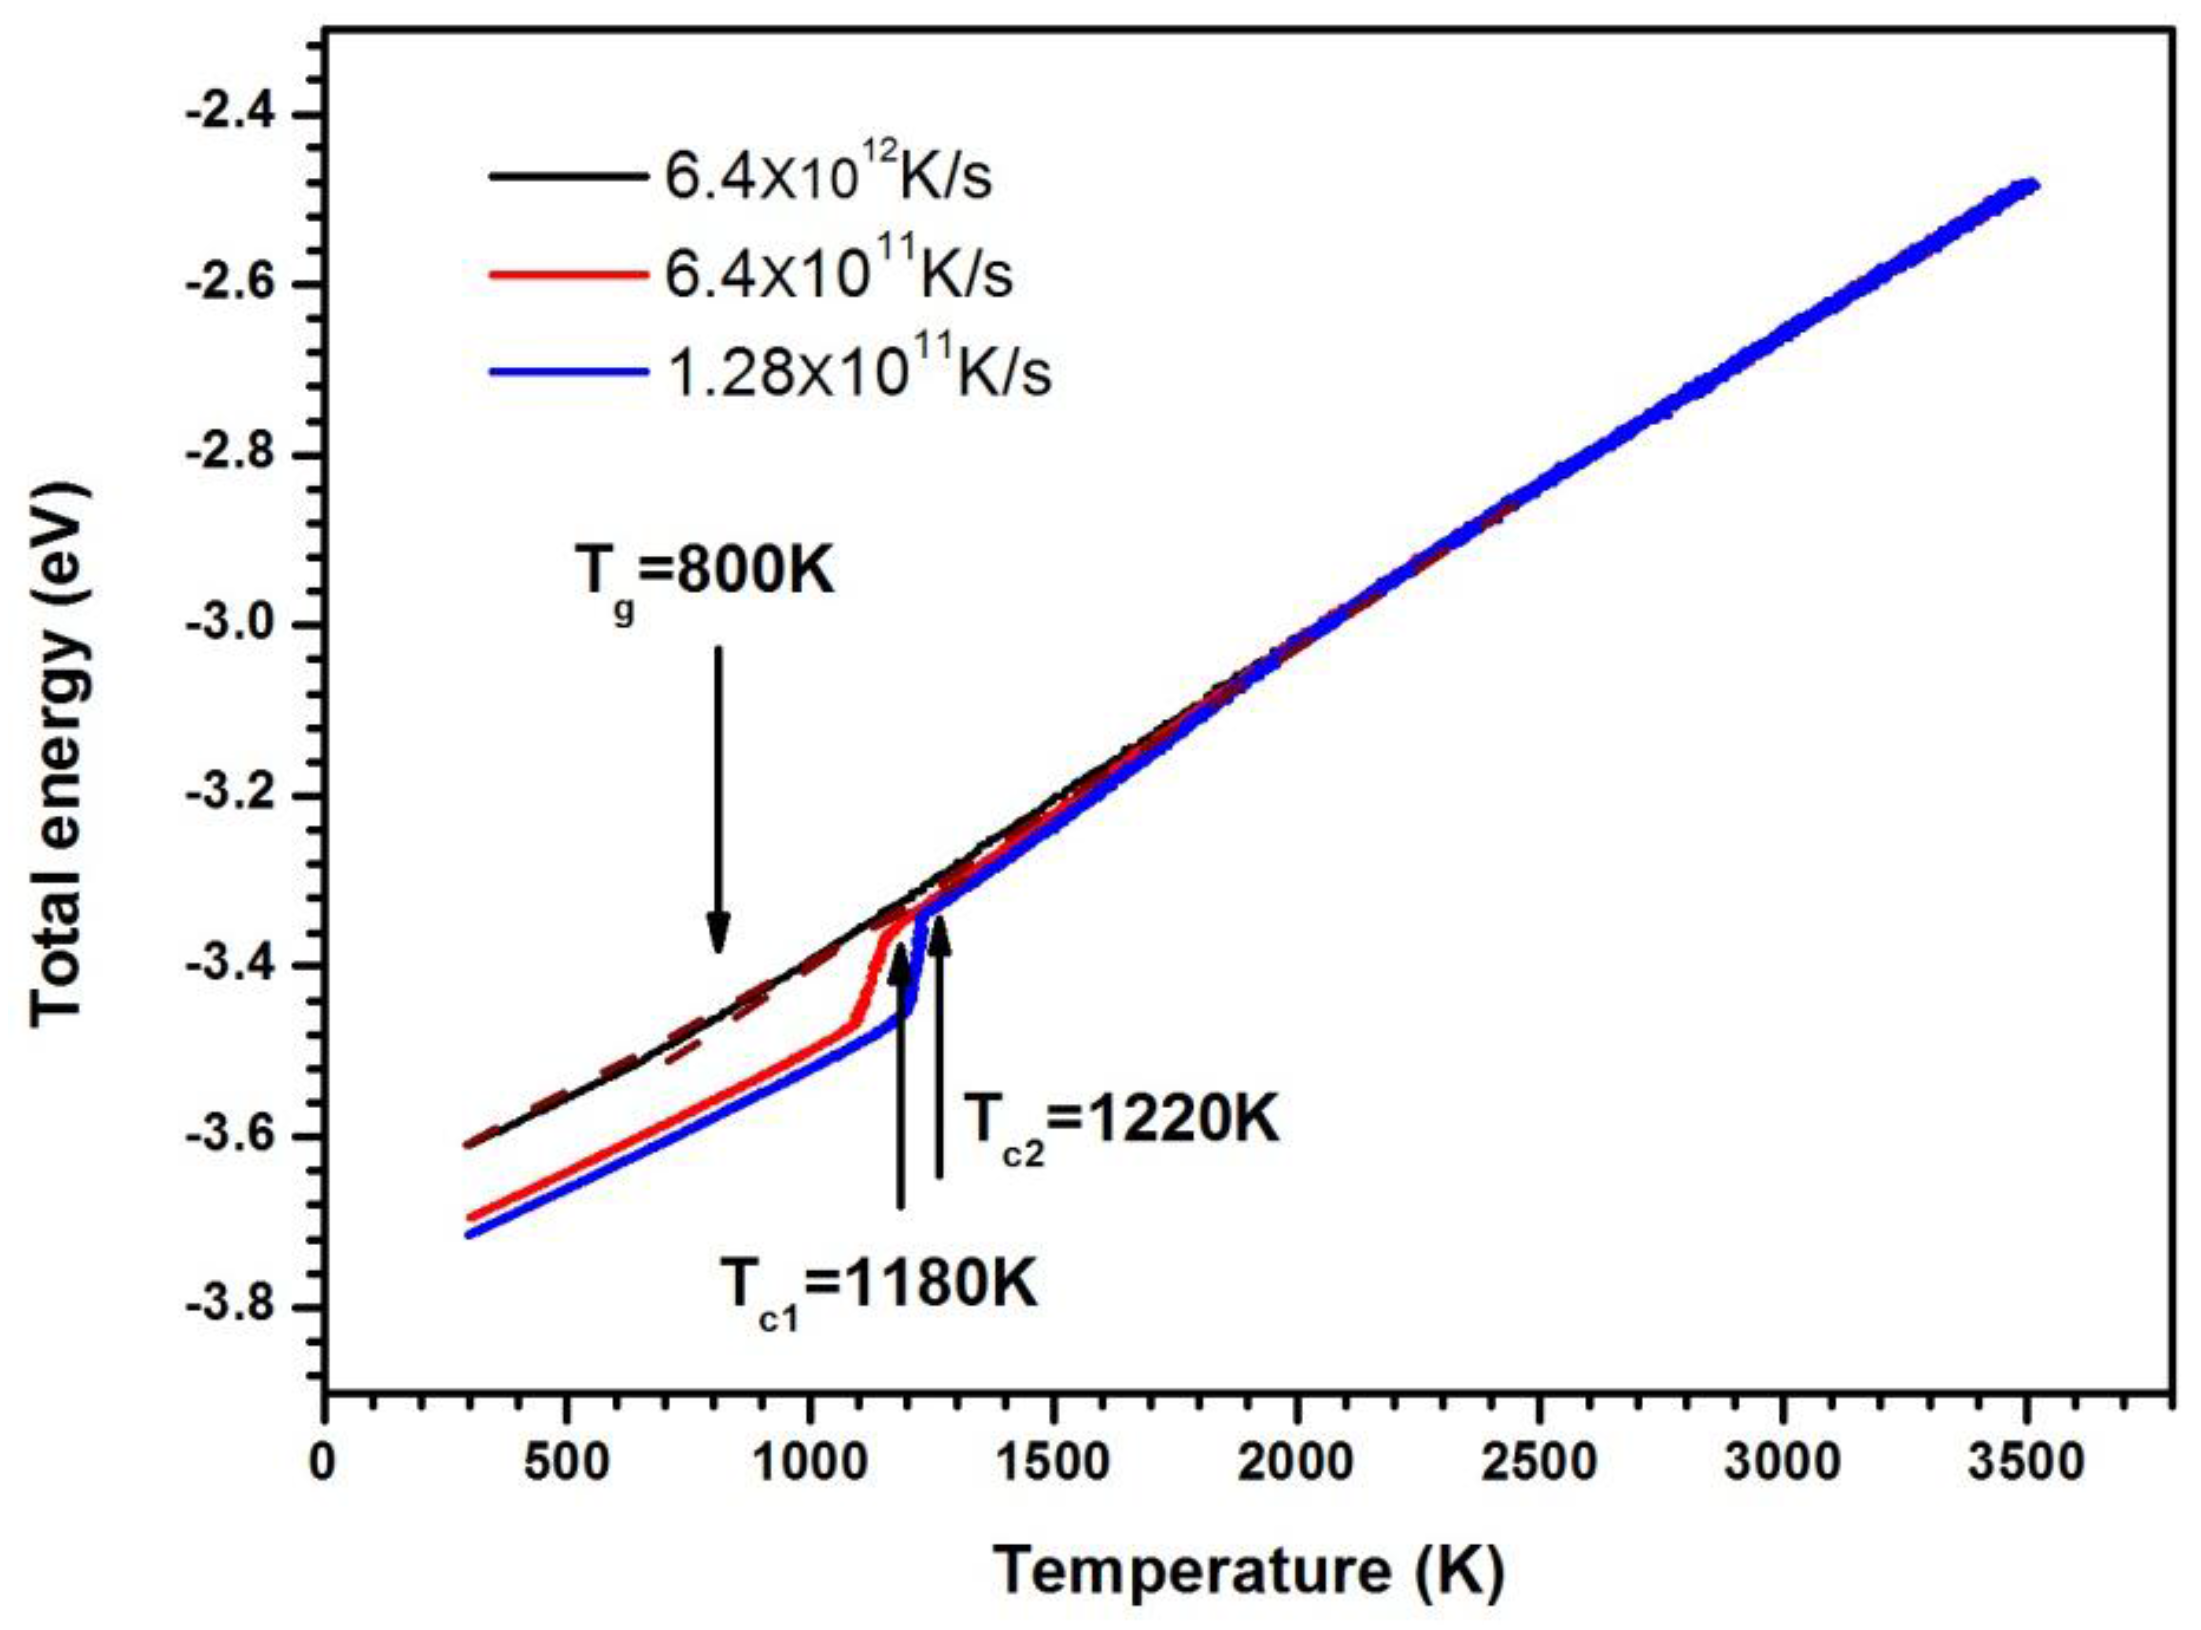
Figure 1 shows the average energy of atoms versus the temperature. The curve is nearly straight in the high and low temperature regime at the cooling rate of 6.4 × 10¹² K/s. The changes in energy are continuous. This is a typical feature of glass formation. The glass transition temperature Tg for a model system is defined by the temperature at the intersection of the extrapolations of the liquid and glassy plots. In Figure 1, Tg is estimated to be approximately 800 K at this cooling rate. The energy–temperature curves decrease abruptly at low temperature, and the undercooled liquid becomes crystal as the cooling rate is 6.4 × 10¹¹ K/s and 1.28 × 10¹¹ K/s; the higher the cooling rate, the lower the crystallization temperature, as shown in Figure 1.
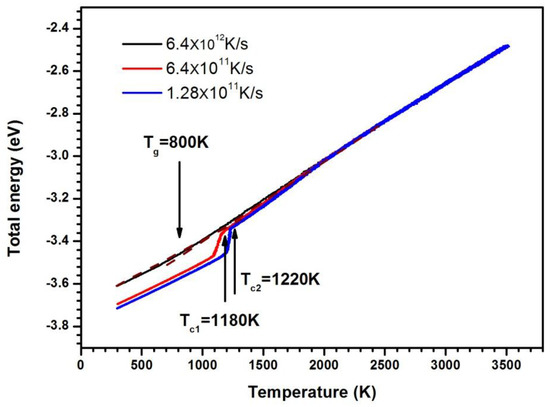
Figure 1.
The average atom energy as a function of temperature.
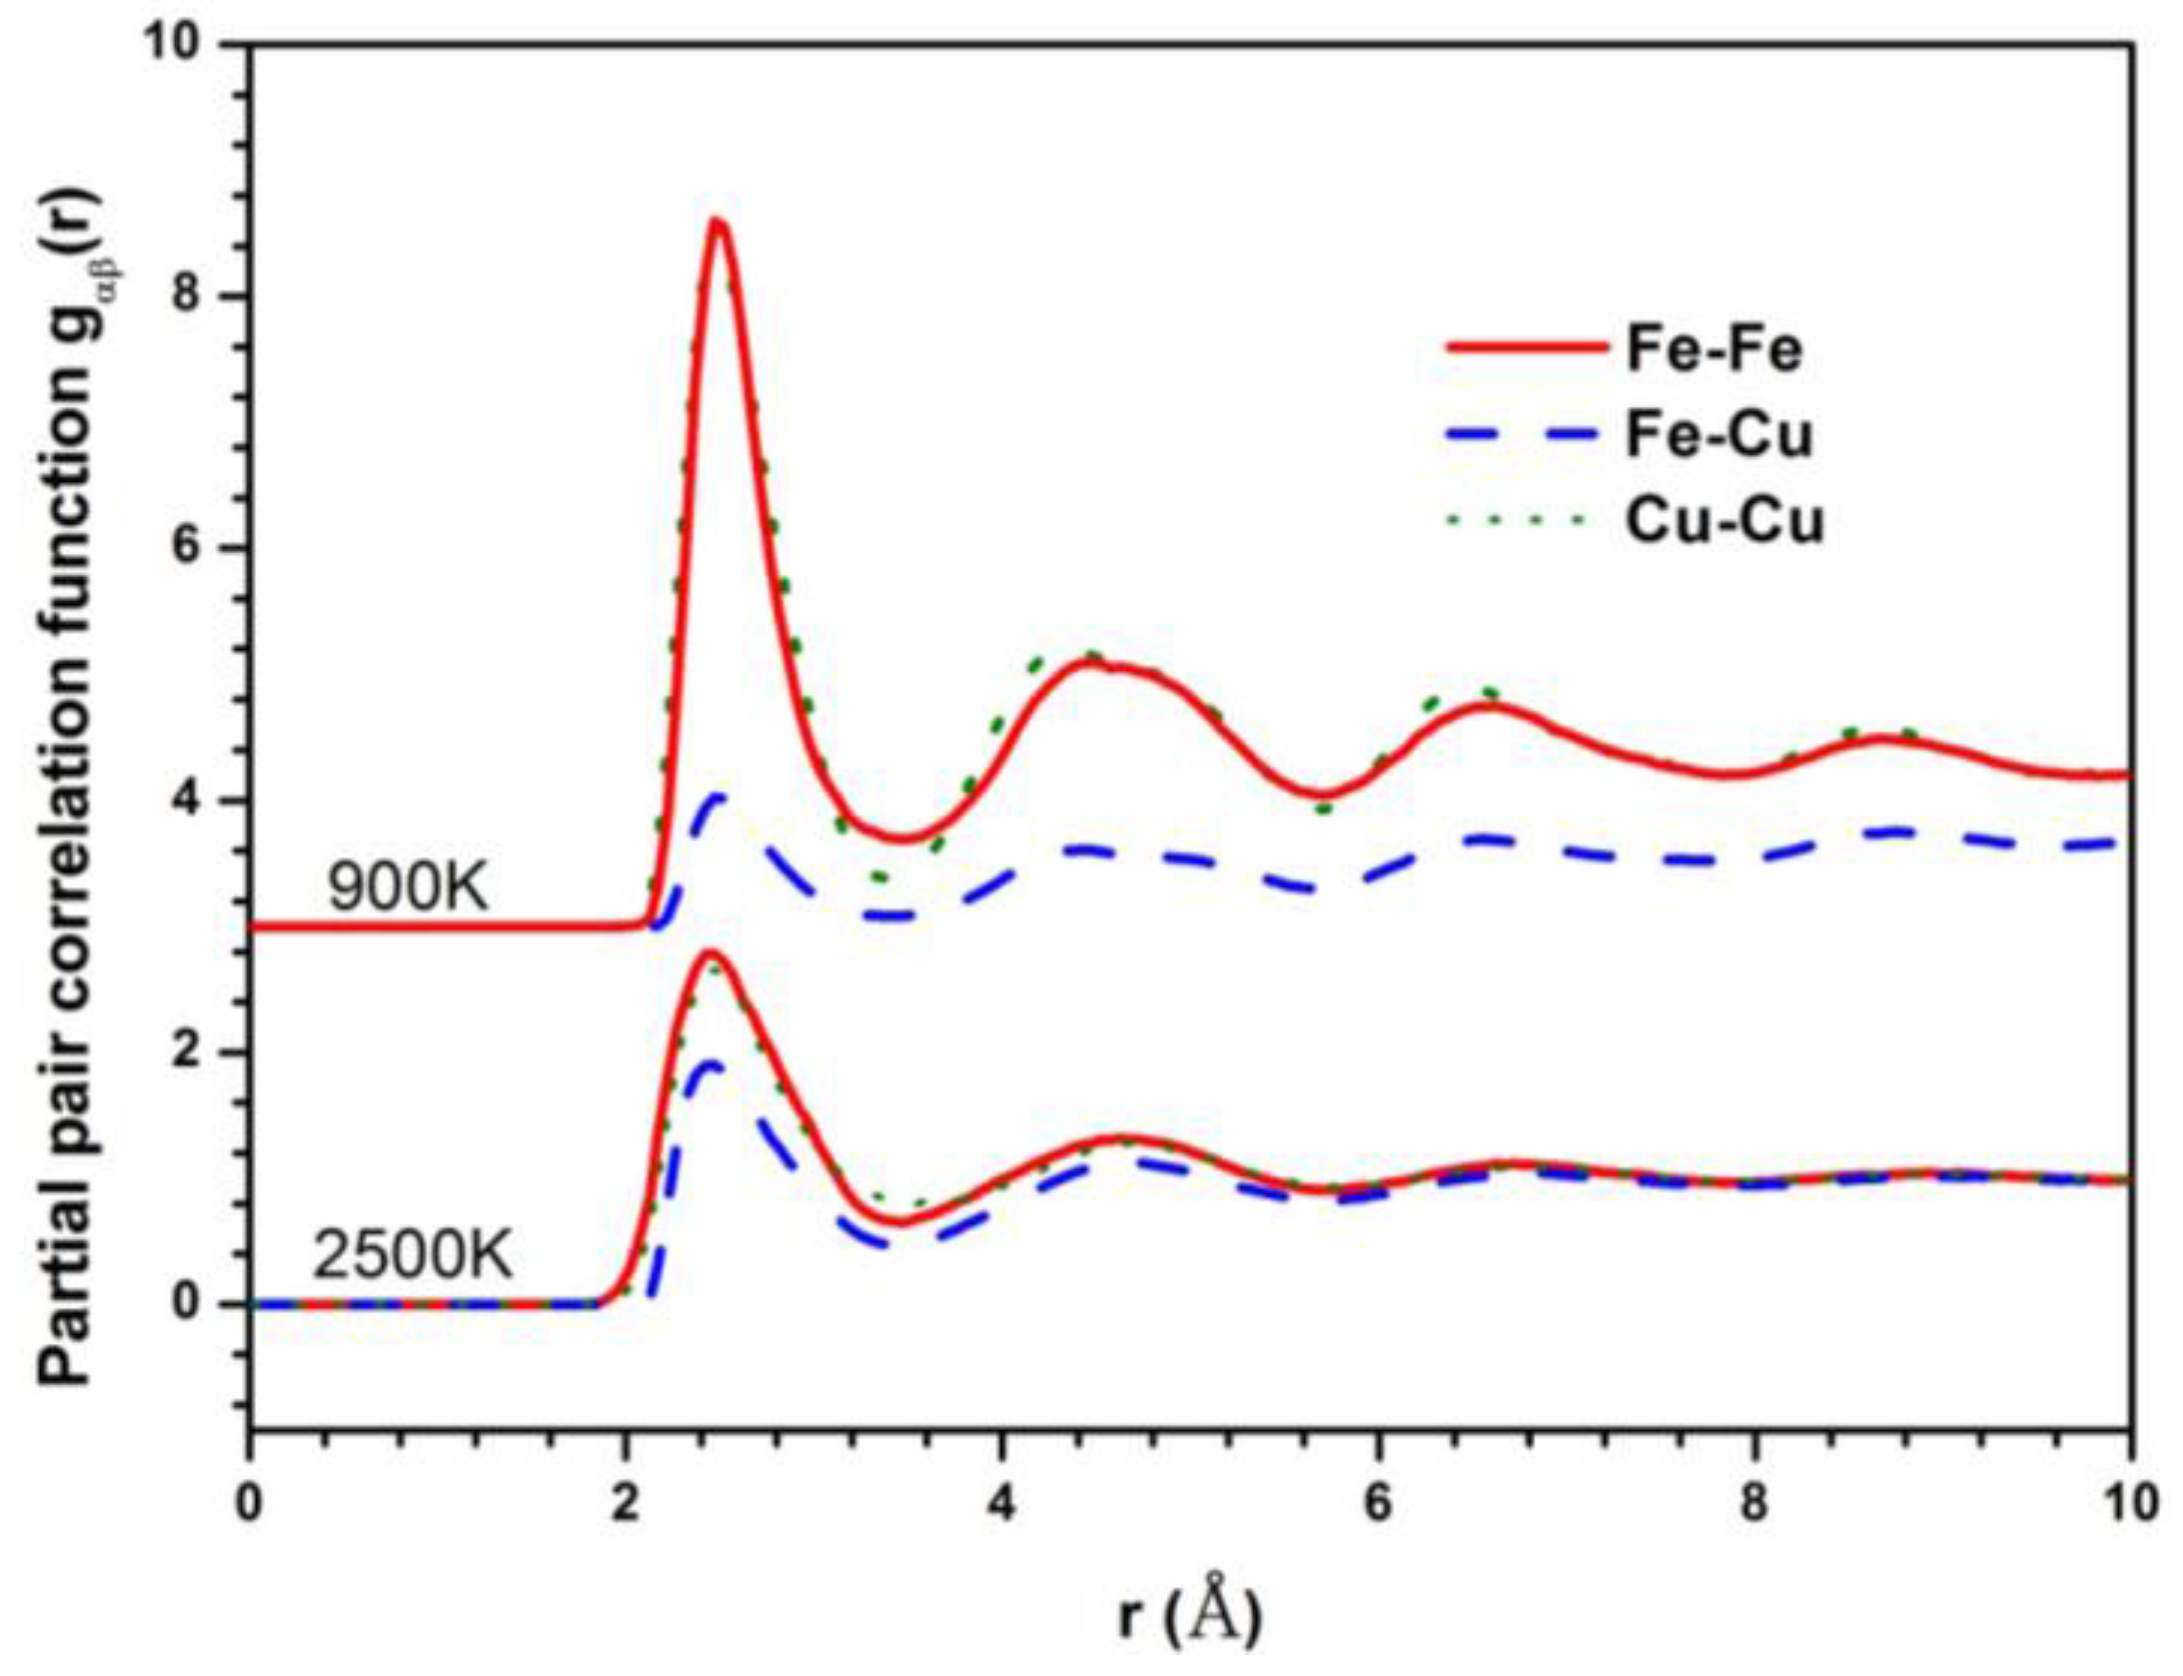
The Fe–Fe partial pair correlation functions (PPCF) in the liquid and glass state are shown in Figure 2 to explore the structural difference between the liquid and undercooled liquid in the phase separation system. The PPCFs during the crystallization process at the cooling rate of 6.4 × 10¹¹ K/s show the same tendency, except that the crystallization peak occurs at lower temperature. They are not listed in the paper. The gFe-Fe(r) and gCu-Cu(r) show similar behavior, having almost the same height of the first peak, much higher than that of gFe-Cu(r) in the undercooled liquid. It can be deduced that there is a stronger interaction of homogeneous atom pairs than heterogeneous atom pairs in Fe50Cu50 melt. In particular, the height difference of the first peak between homogeneous atom pairs and heterogeneous atom pairs is more predominant at lower temperature, indicating that the stronger LLPS happens in the glass rather than in the liquid.
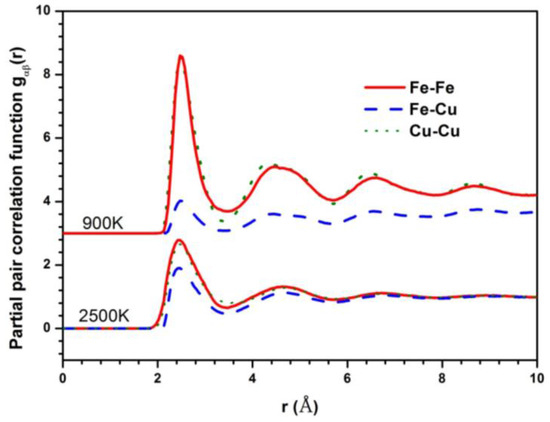
Figure 2.
Partial pair correlation functions (PPCFs) of Fe50Cu50 at 2500 K and 900 K respectively.
The coordination number is also calculated to explore its local packing of Fe50Cu50 during the whole cooling process. Usually, the physical scene of short-range order can be observed from the measured curves of the pair correlation functions (PCF) from which the coordination number may be obtained. As we can infer from the Fe–Fe pairs, the coordination number (CN) at the temperature of 3500 K is 7.8, a little higher than that of the Cu–Cu pairs (7.3), and higher than that of the Fe–Cu pairs (about 6.0). The changes of three partial CNs is slow as the temperature is higher than 2000 K; after that, the strong increases of CN for Fe–Fe and Cu–Cu pairs is found and on the contrary, the sharp decreases for Fe–Cu pairs is also quite obvious. The number of Fe neighbors around the Fe atom and the number of Cu atoms around the Cu atom are about 12 at the temperature of 700 K. Opposite to that of homogeneous atom pairs, the number of Cu atoms around the Fe atom is only about 2 at 700 K, in agreement with the behavior observed for PPCFs. Fe atoms prefer to accept the Fe atom as their neighbor and Cu atoms prefer to accept the Cu atom as their neighbor. Although the critical temperature [19,20] of LLPS cannot be determined exactly by the CN, a sudden increase of homogeneous pairs and decrease of heterogeneous pairs also indicates the occurrence of phase separation. The critical temperature is estimated roughly to be 2000 K, since the obvious increase of CN for Cu–Cu and Fe–Fe pairs and the decrease for Cu–Fe pairs after 2000 K can be observed from Figure 3. The total numbers around Cu neighbors, keeping almost unchanged during the whole cooling process, is about 13.
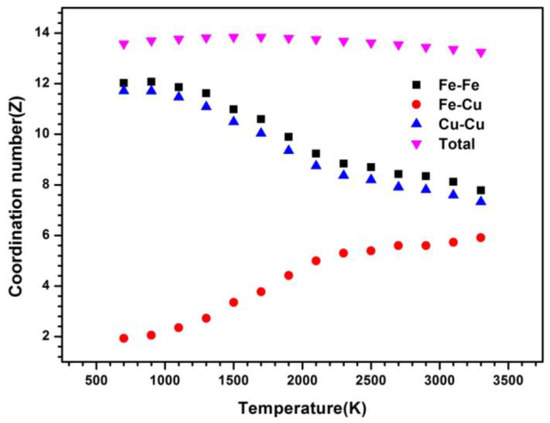
Figure 3.
Coordination number versus temperature at a cooling rate of 6.4 × 10¹² K/s.
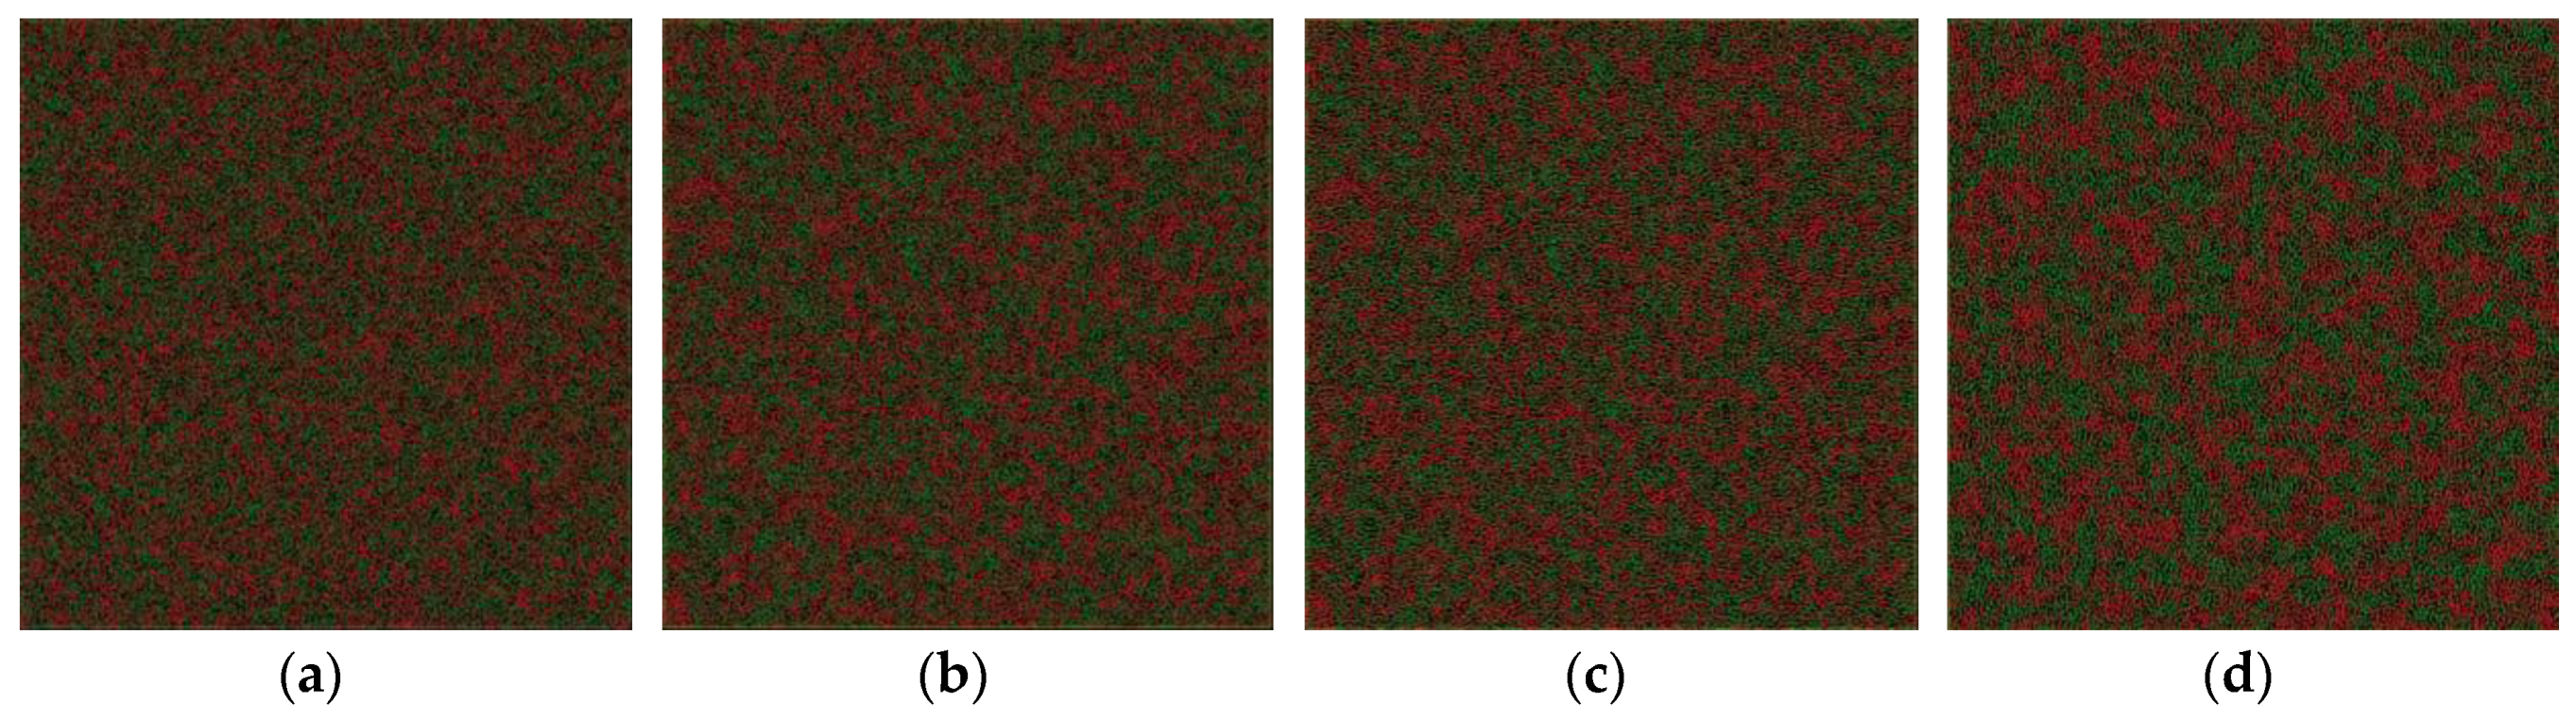
The critical temperature is higher than the glass transition temperature of 800 K. It encourages us to further explore the relationship between the phase separation mechanism and the glass transition and crystal formation under a certain undercooling. In addition, it is possible to investigate the effect of the cooling rate on the formation of phase-separated micro-structure. The phase separation process can be explored by observing the atom configuration at various temperatures at the cooling rate of 6.4 × 10¹² K/s, shown in Figure 4. For comparison, the atom snapshot at the cooling rate of 6.4 × 10¹¹ K/s and 1.28 × 10¹¹ K/s are also shown in Figure 5 and Figure 6, respectively. The configuration seems to be homogeneous at 2800 K (Figure 4a), while it exhibits structural heterogeneity during the cooling process with the aggregation of Fe-rich atom clusters among the Cu-rich matrix. The LLPS is not evident until the temperature decreases to 1900 K, shown in Figure 4c, where the interconnected-type structure is formed by spinodal decomposition. At the primary separation period during the spinodal decomposition process, the interfacial energy differences between two liquids are quite small due to their similar initial compositions, and the interconnected-type structure without an obvious interface can be formed through atom diffusion. After that, the liquid phase with a small volume fraction will be transformed to a spherical droplet because of the increasing composition difference between two liquids [3]. The interconnected-type structure formed in our simulation system is hardly transformed to a spherical droplet due to such a high cooling rate, thus it is kept in the glass at low temperature, as shown in Figure 4d.
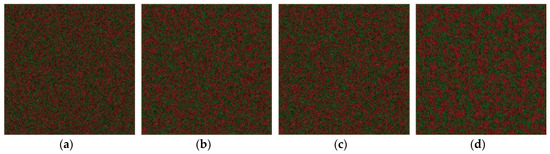
Figure 4.
Atom snapshot of Fe50Cu50 at different temperatures at the cooling rate of 6.4 × 10¹² K/s. (a–d) correspond to the atomic configuration at temperature of 2800 K, 2200 K, 1900 K, 800 K, respectively.

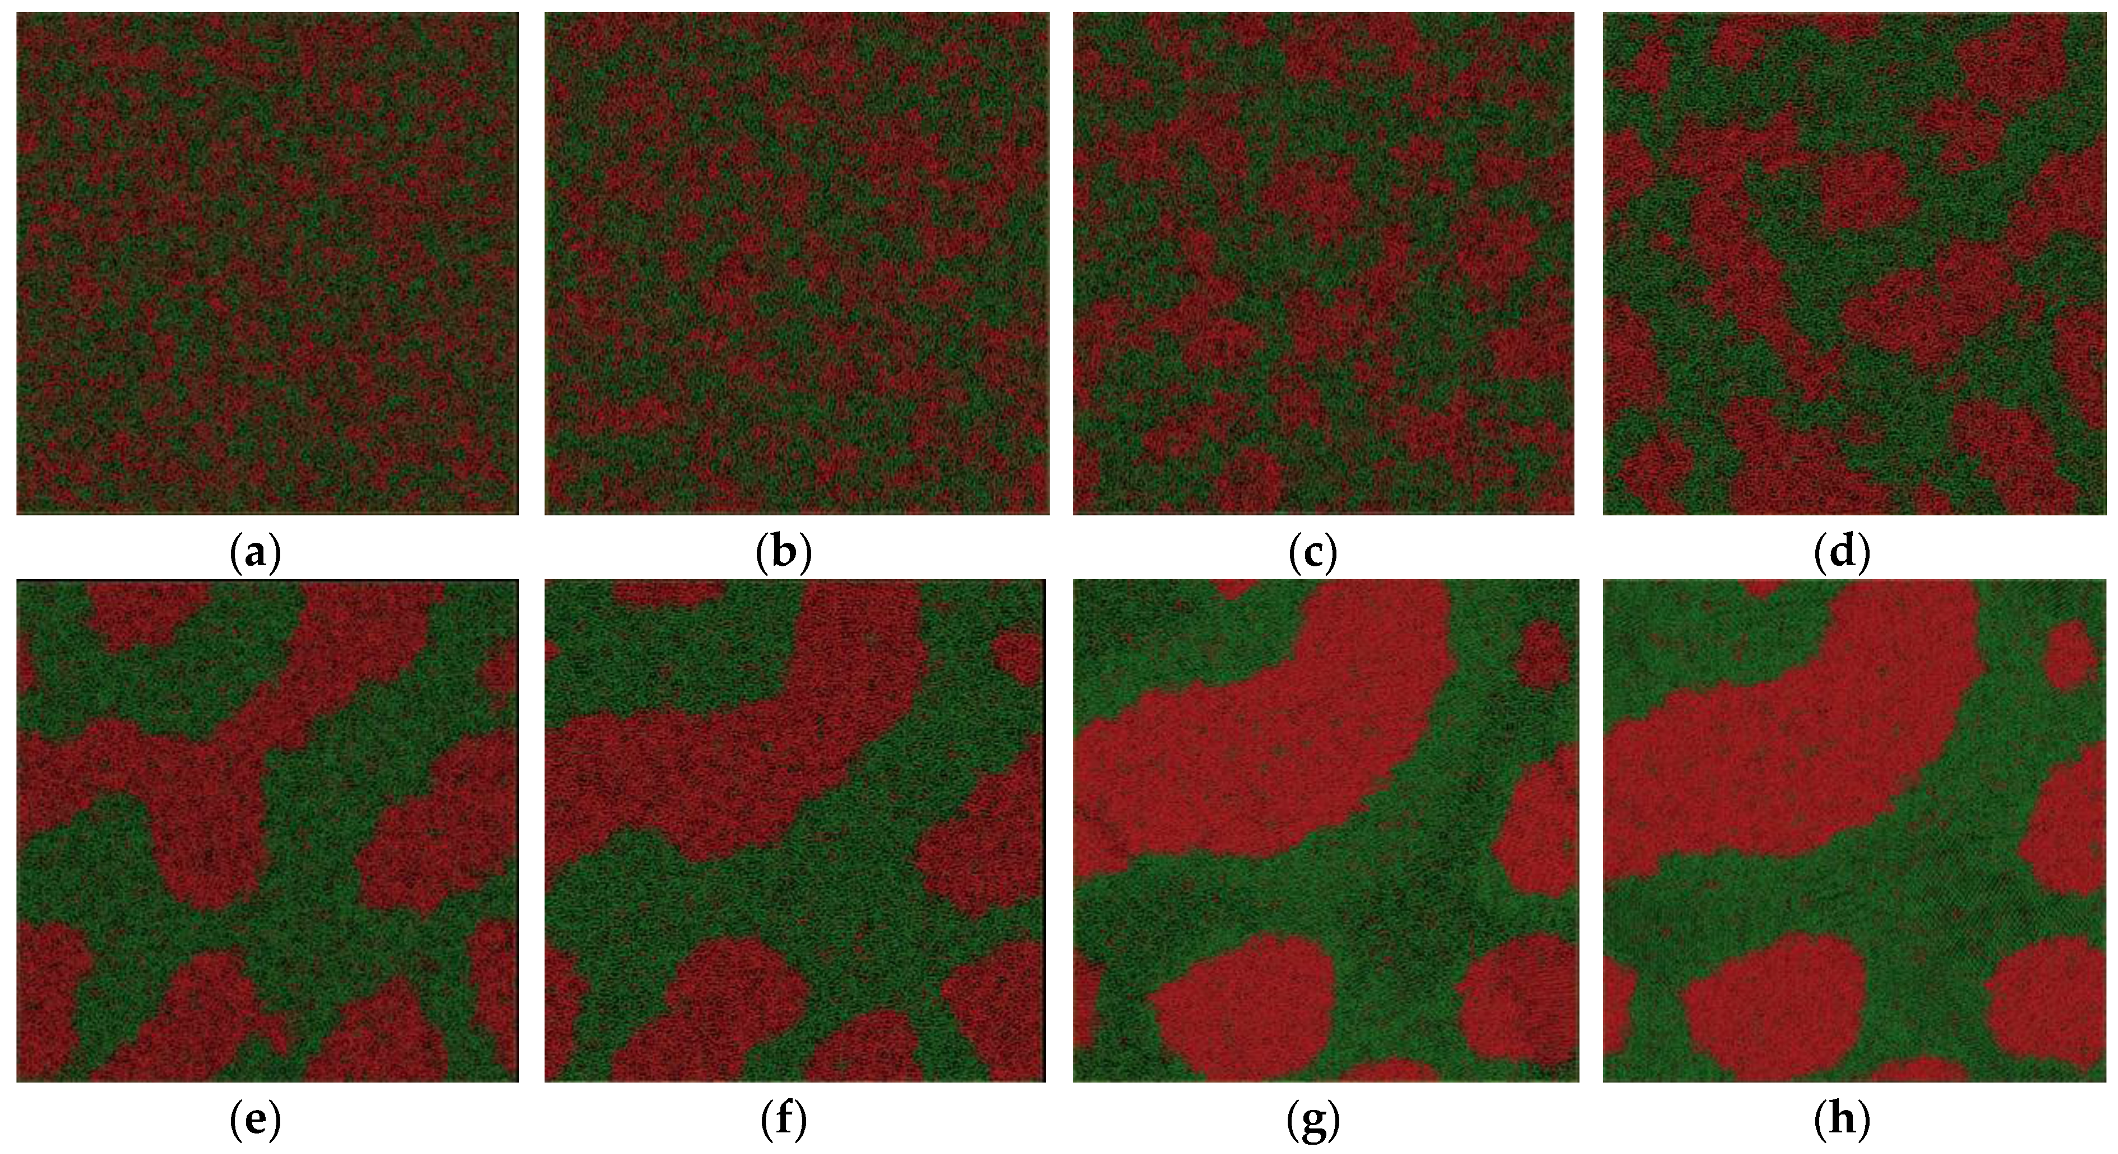
Figure 5.
Atom snapshot of Fe50Cu50 at different temperatures at the cooling rate of 6.4 × 10¹¹ K/s. (a–f) correspond to the atomic configuration at temperature of 2000 K, 1800 K, 1600 K, 1400 K, 1200 K, 1000 K, respectively.
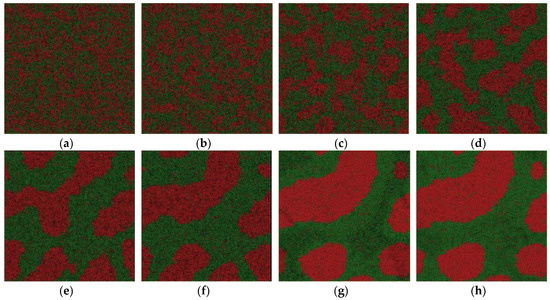
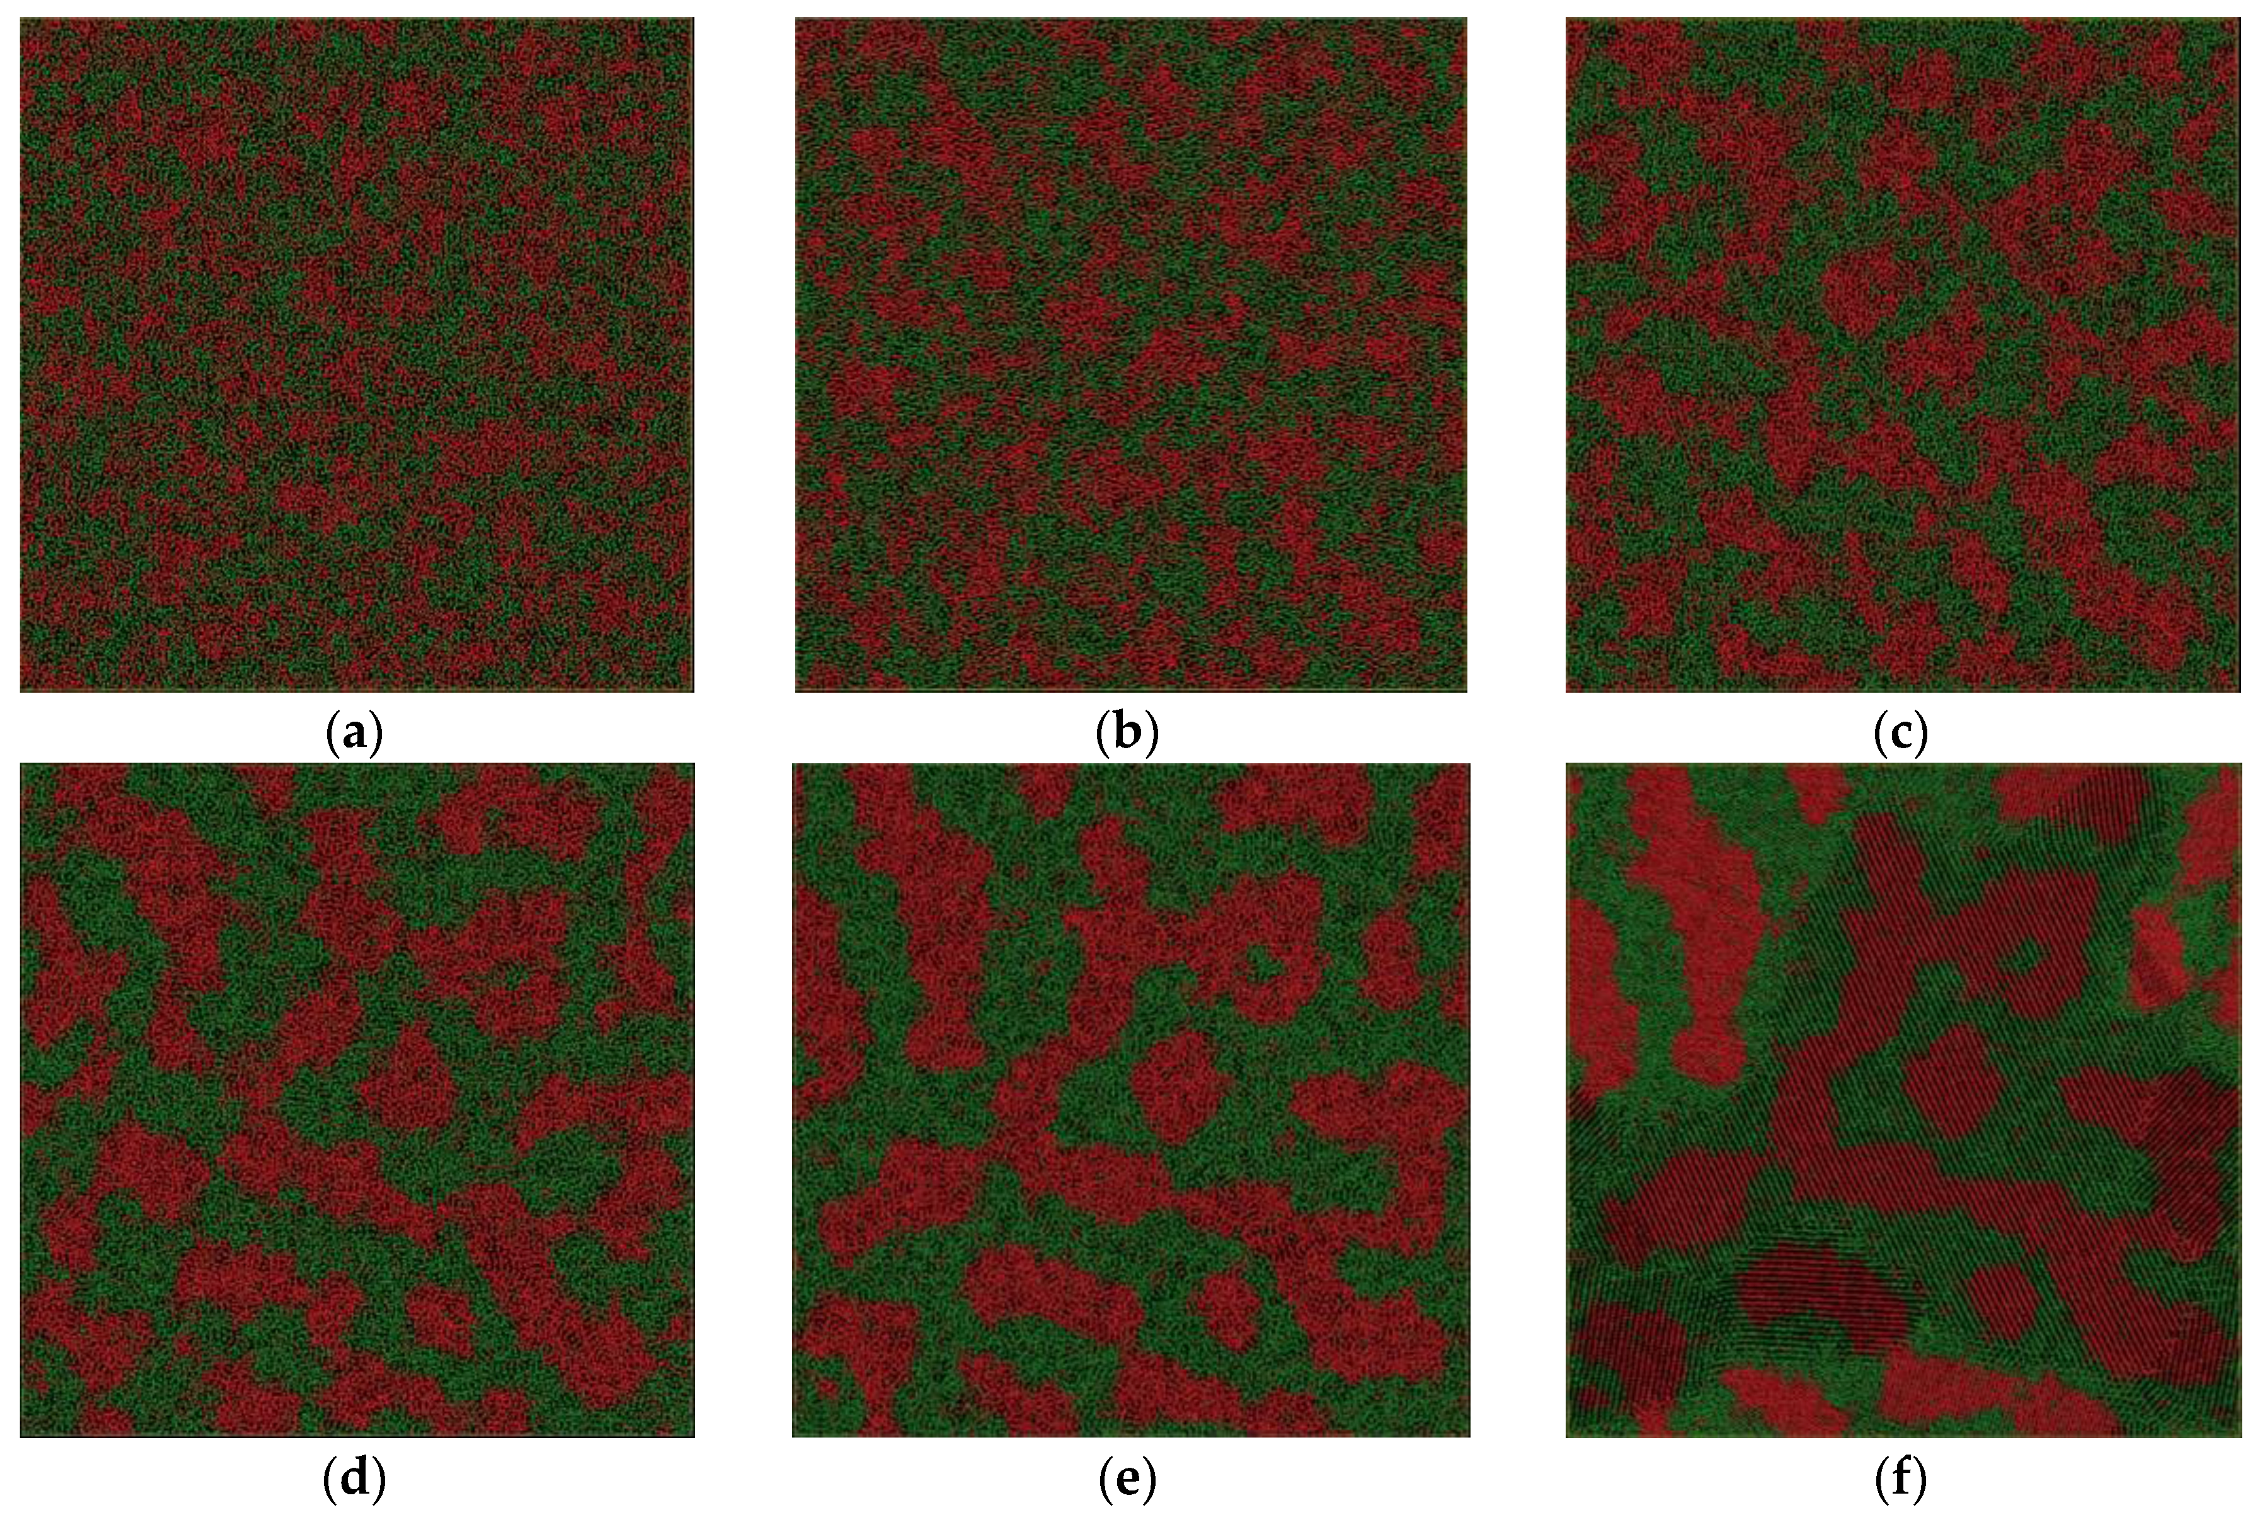
Figure 6.
Atom snapshot of Fe50Cu50 at different temperatures at the cooling rate of 1.28 × 10¹¹ K/s. (a–h) correspond to the atomic configuration at temperature of 2000 K, 1800 K, 1600 K, 1400 K, 1200 K, 1100 K, 1000 K, 800 K, respectively.
We depict the atom configuration at various temperatures at the cooling rate of 6.4 × 10¹¹ K/s in our simulation system, shown in Figure 5. Although the spinodal decomposition reaction happens at about 2000 K, no obvious sudden change in structure can be observed; the LLPS is a continuous process. The homogeneous atom pairs begin to aggregate and the Fe-rich phase precipitates in the liquid. The domain size of the new liquid phase becomes bigger and bigger by spontaneous concentration fluctuation with decreasing temperature, as shown in Figure 5b–e. In contrast to the configuration at the cooling rate of 6.4 × 10¹² K/s, the interconnected-type structure is more pronounced. The crystallization temperature is about 1170 K at the cooling rate and the interconnected-type structure is kept in the crystal, although some small Fe-rich droplets occur in both liquid and solid. Generally speaking, the spherical droplet is still not totally formed due to the relatively higher cooling rate. However, what would happen if the cooling rate were further decreased?
For comparison, we depict the atom configuration at various temperatures at the cooling rate of 1.28 × 10¹¹ K/s in our simulation system, shown in Figure 6. The crystallization temperature that we determined from the energy–temperature curve is about 1200 K. Despite the crystal formation at low temperature, the atom configuration is quite different from that obtained at a higher cooling rate of 6.4 × 10¹¹ K/s. The interconnected-type structure is the most pronounced among the three atom snapshots. In contrast to the former two groups of configurations, the interconnected-type structure disappears gradually, and a Fe-rich spherical droplet is formed, as shown in Figure 6a–f, although the spheroidizing process is not completely finished. The crystallization process starts at temperature of 1200 K. The final configuration is a mixture of all kinds of droplets with different shapes. To summarize, Fe50Cu50 melt separates into Fe-rich liquid and Cu-rich liquid controlled by the spinodal decomposition mechanism at a temperature of about 2000 K; the selection of interconnected or droplet-type structure of the separated glass phases or crystal phases depends on the cooling rate. Once the interconnected-type structure is formed, it cannot be broken easily because of the limited atom diffusion under a certain undercooling at a higher cooling rate; high cooling rates mean higher glass transition temperature or lower crystallization temperature. The diffusion of the homogeneous atom is too slow to form the droplet-like structure as it reaches the glass transition temperature or crystallization temperature. Fe50Cu50 melt undergoes phase separation by spinodal decomposition at three cooling rates. The droplet-type structure will be formed as the cooling rate is relatively low; it cannot be formed finally as the cooling rate is relatively large. Sohn [21] reported the LLPS process of Gd-Zr-Al-Ni melts by spinodal decomposition when the degree of undercooling is relatively large, and by nucleation and the growth mechanism when the degree of undercooling is relatively low. In our opinion, the spinodal decomposition reaction happens in Fe50Cu50 melts whether at the higher or lower cooling rate, which only determine the final micro-morphology in crystal.
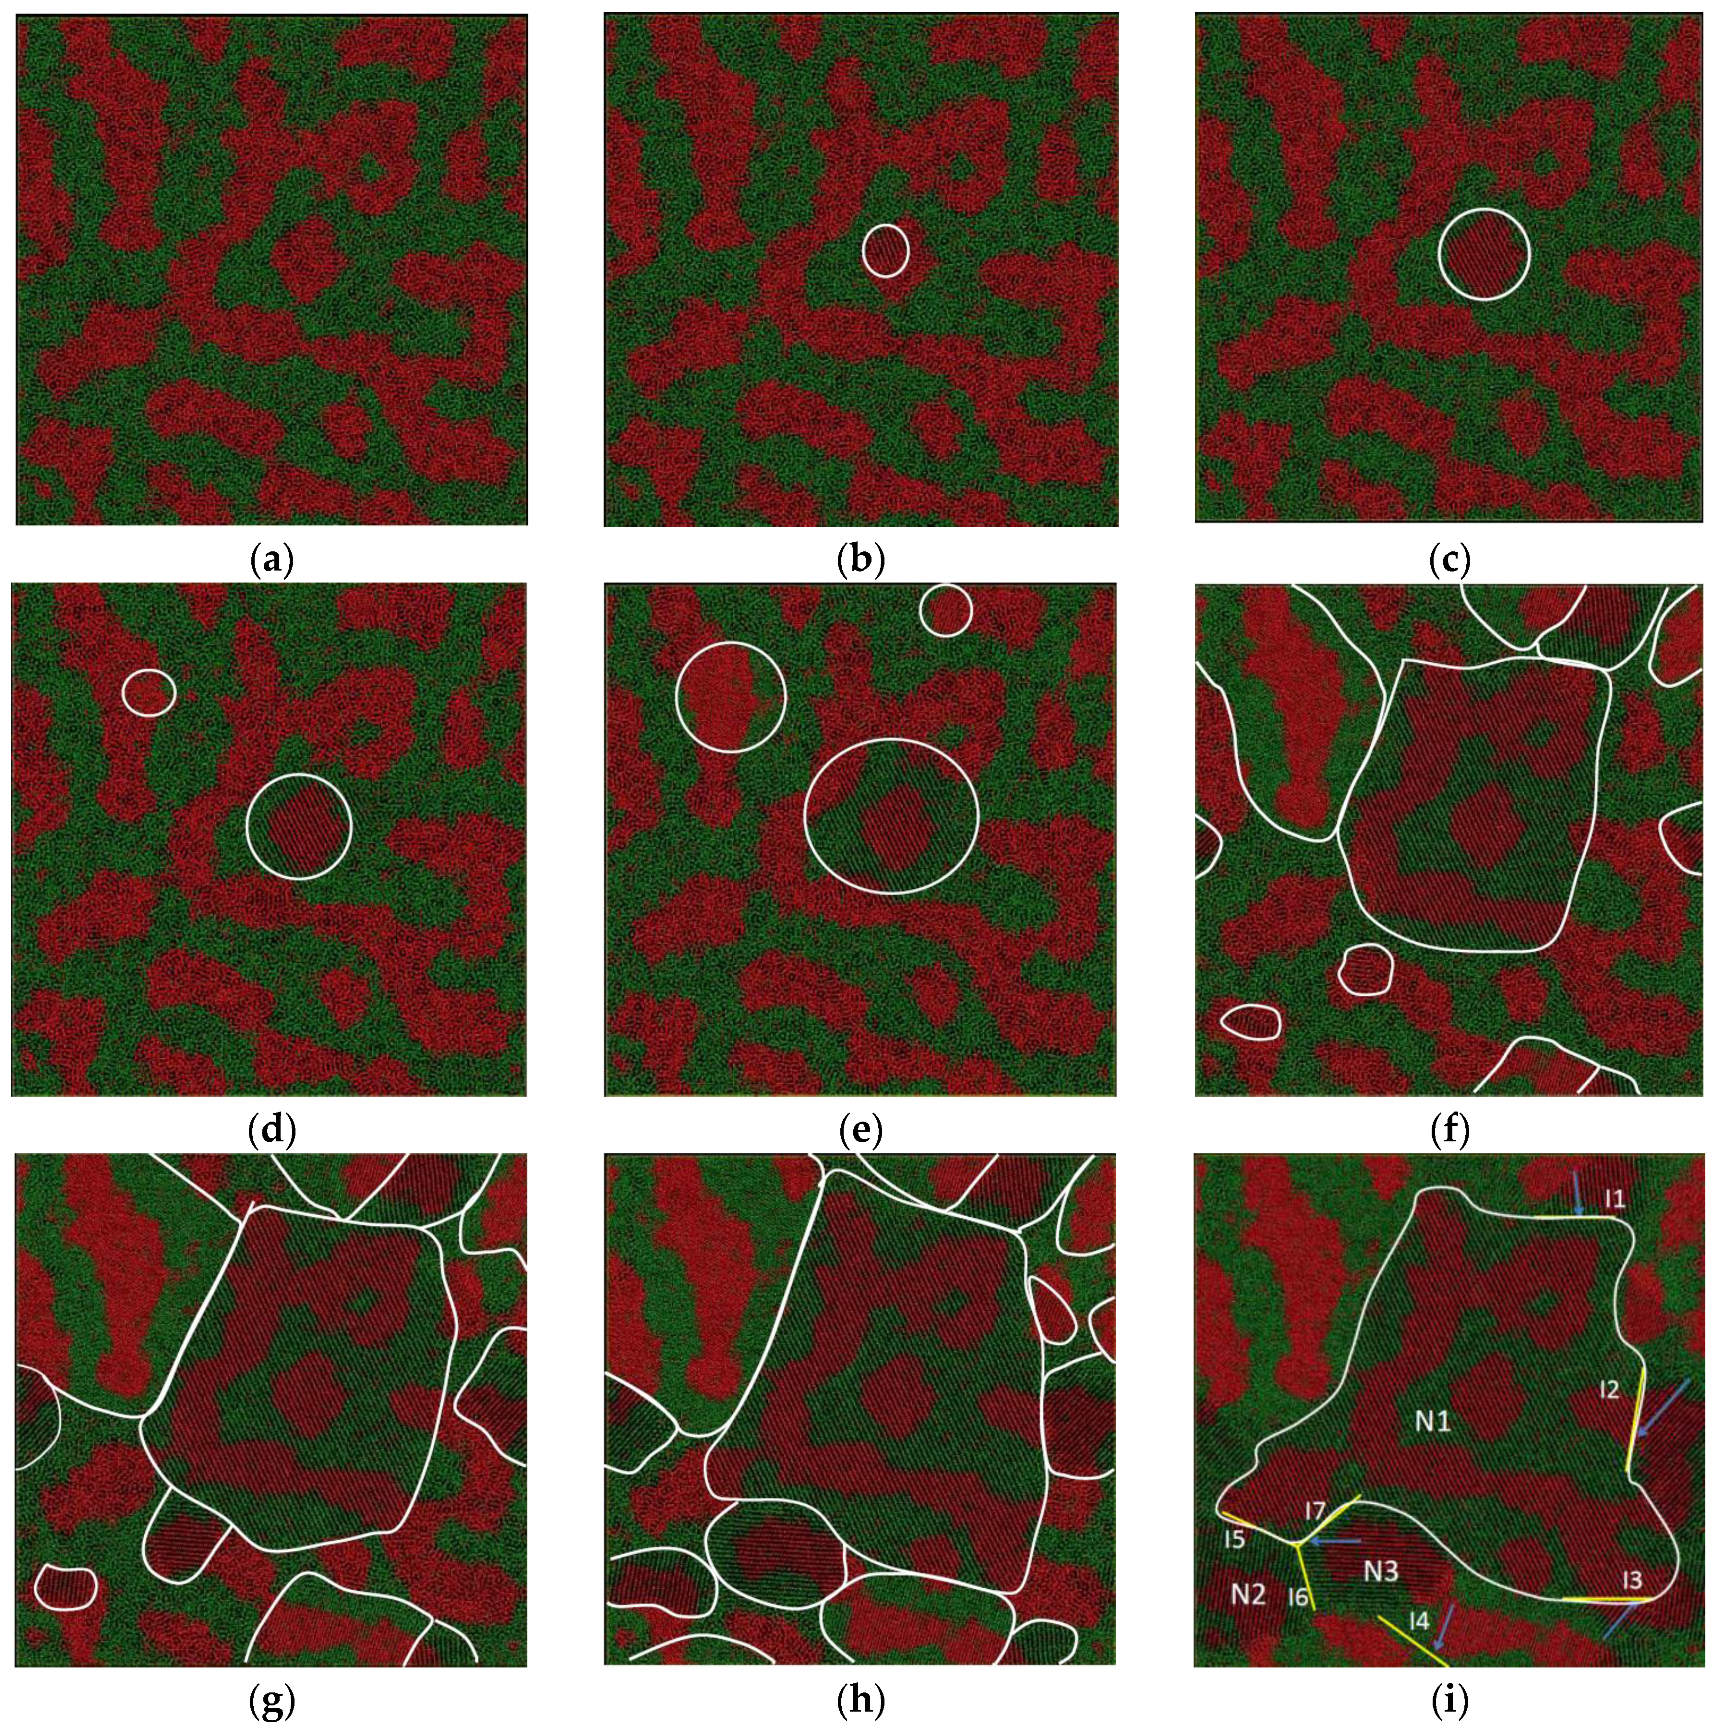
We depict the atom configuration at various temperatures during the crystallization process at the cooling rate of 6.4 × 10¹¹ K/s, shown in Figure 7. The system is still in a liquid state at the temperature of 1180 K, and no solid nucleus can be found in Figure 7a. While a small nucleus with Fe-rich composition can be observed in Figure 7b, the grain begins to grow around the nucleus along the [110] crystal direction. The new nucleus forms at the temperature of 1150 K, shown in Figure 7d. The number of nuclei is almost unchanged until the temperature is decreased to 1110 K. Only Fe-rich clusters can act as the solid nuclei due to the higher melting point of Fe than that of Cu. The grain N1 becomes the biggest one among all the grains. The solute redistribution at the liquid–solid interface is restricted because of the high cooling rate. The solid morphology is quite similar to that of liquid, as shown in Figure 7a–i.
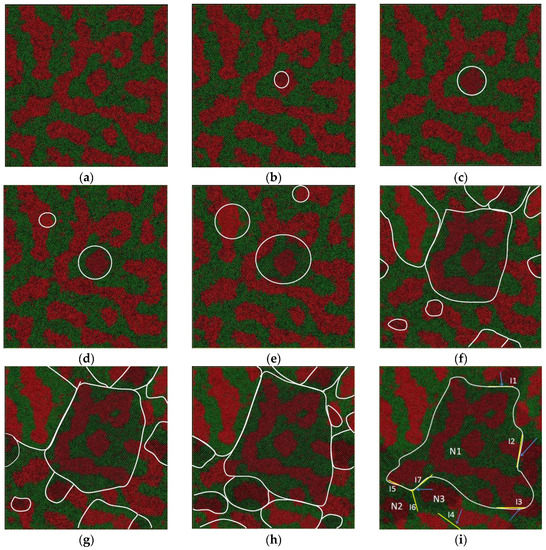
Figure 7.
Atom snapshot of Fe50Cu50 during the crystallization process at the cooling rate of 6.4 × 10¹¹ K/s. (a–i) correspond to the atomic configuration at temperature of 1180 K, 1170 K, 1160 K, 1150 K, 1140 K, 1110 K, 1100 K, 1090 K, 1060 K, respectively.
In addition, there are many twinning planes in the crystal as shown in Figure 7i. The interfaces I1, I2, I3, I5 and I7 are the boundary of grain N1 connected with other grains. The nucleus N1 is formed at the temperature of 1170 K, a little higher than that of the other four grains at a temperature of 1110 K. Surprisingly, the homogeneous atoms are arranged on both sides of the twinning boundary. As we can see along the interface I1, the atomic stacking of Cu shows mirror symmetry with respect to the adjacent grains; along the interface I2, the Fe atoms are arranged symmetrically on both its sides. The grains N1, N2 and N3 are connected to each other, and three-fold symmetry twinning planes are formed, as shown in Figure 7i. The nuclei of grain N2 and N3 are formed at almost the same temperature, shown in (f). The existence of the twinning plane may decrease the interface energy, especially the coherent twinning interface. The different grains have random crystallographic orientations, separated by high-angle grain boundaries. As shown in Figure 7i, the orientation angle between {110} planes of the adjacent grains marked with I1, I2 and I3 is 155°, 65°, and 92° respectively. The three dihedral angles in our simulation system are 126°, 122°, and 112°; the deviation between the maximum and the minimum angle is 14°. This is due to the high cooling rate; there is not enough time and driving force for the grains to adjust their crystal orientations and merge with each other.
In summary, the crystallization process can be roughly divided into two stages. In the first state (1110 K < T < 1180 K), a few nuclei emerge in the liquid matrix, and the size is quite small, and then it grows quickly by consuming liquid atoms. Furthermore, the total energy decreases sharply. In the following stage II (1110 K < T < 1060 K), a large number of nuclei emerge in the liquid matrix and the total energy successively falls off; the total number of grains keeps unchanged at this stage. During the rapid solidification process of LLPS melts, the twin crystal can be formed in two ways: the first is that the two solid nuclei form at different temperatures—the one formed at higher temperature grows quickly along a certain crystal direction, and becomes a bigger grain, the others formed at lower temperature grow slowly and the grain size is smaller. There is a coherent interface between the edge of the bigger one and the smaller ones, as shown in Figure 7i. The interfaces I1, I2, I3, I5 and I7 are the twinning boundary formed by the grain N1 with another five smaller grains; the second is that the two nuclei form at the same temperature and grow at almost the same rate. The two grains meet at the grain boundary and form the coherent twining boundary, as shown in Figure 7i. The interface I6 is the twinning boundary formed by the grain N2 and N3.
4. Conclusions
The liquid PCFs and CN, as well as the atom snapshot as a function of temperature during the rapid solidification, are calculated by molecular dynamics simulation to explore the LLPS behavior of Fe50Cu50 melt from 3500 K to 300 K. Fe50Cu50 melt undergoes LLPS in the undercooled regime by spinodal decomposition and subsequently solidifies into three different morphologies at three different cooling rates. At the cooling rate of 6.4 × 10¹² K/s, the interconnected-type structure is kept in the glass; at the cooling rate of 6.4 × 10¹¹ K/s, the interconnected-type structure is more pronounced and kept in the crystal, although some small Fe-rich droplets occur in both liquid and solid; at the cooling rate of 1.28 × 10¹¹ K/s, the droplet-type structure is formed in the crystal.
Only Fe-rich clusters can act as the solid nucleus; it emerges in the liquid matrix at the temperature of 1170 K, and grows up quickly by consuming liquid atoms. A large number of nuclei emerge in the liquid matrix at the temperature of 1110 K, and the total number of grains keeps unchanged during the following crystallization process. We also find the twinning plane in the final crystal, and only the homogeneous atoms are arranged along the twinning boundary, which is the typical feature of phase separation crystal. The different grains have random crystallographic orientations, separated by high-angle grain boundaries. There is not enough time and driving force for the grains to adjust their crystal orientations and merge with each other. The solute redistribution at the liquid–solid interface is restricted because of the high cooling rate.
Acknowledgments
The authors thank National Science Foundation of China (No. 51371108) for financial support. The numerical calculations in this paper have been done on the supercomputing system in the Supercomputing Center, Shandong University, Weihai.
Author Contributions
Yun Cheng and Li Wang conceived and designed the experiments; Wenchao Cui, Yuyang Wang and Yuncheng performed the experiments and analyzed the data; Chuanxiao Peng, Yun Cheng, and Shenghai Wang contributed reagents/materials/analysis tools; Yun Cheng wrote the paper.
Conflicts of Interest
The authors declare no conflict of interest. The founding sponsors had no role in the design of the study; in the collection, analyses, or interpretation of data; in the writing of the manuscript, and in the decision to publish the results.
References
- Kim, D.H.; Kim, W.T.; Park, E.S.; Mattern, N.; Eckert, J. Phase separation in metallic glasses. Prog. Mater. Sci. 2013, 58, 1103–1172. [Google Scholar] [CrossRef]
- Bailey, A.E.; Poon, W.C.K.; Christianson, R.J.; Schofield, A.B.; Gasser, U.; Prasad, V.; Manley, S.; Segre, P.N.; Cipelletti, L.; Meyer, W.V.; et al. Spinodal decomposition in a model colloid-polymer mixture in microgravity. Phys. Rev. Lett. 2007, 99, 205701. [Google Scholar] [CrossRef] [PubMed]
- Ren, Q.; Wang, N.; Zhang, L.; Wang, J.Y.; Zheng, Y.P.; Yao, W.J. The effects of spinodal decomposition and nucleation on phase separation. Acta Phys. Sin. 2012, 61, 196401. [Google Scholar]
- Wang, C.P.; Liu, X.J.; Ohnuma, I.; Kainuma, R.; Ishida, K. Formation of immiscible alloy powders with egg-type microstructure. Science 2002, 297, 990–993. [Google Scholar] [CrossRef] [PubMed]
- Wilde, G.; Perepezko, J.H. Critical-point wetting at the metastable chemical binodal in undercooled Fe-Cu alloys. Acta Mater. 1999, 47, 3009–3021. [Google Scholar] [CrossRef]
- Curiotto, S.; Pryds, N.H.; Johnson, E.; Battezzati, L. Liquid-liquid phase separation and remixing in the Cu-Co system. Metall. Mater. Trans. A 2006, 37, 2361–2368. [Google Scholar] [CrossRef]
- Park, J.M.; Han, J.H.; Mattern, N.; Kim, D.H.; Eckert, J. Designing Zr-Cu-Co-Al bulk metallic glasses with phase separation mediated plasticity. Metall. Mater. Trans. A 2012, 43, 2598–2603. [Google Scholar] [CrossRef]
- Pan, J.; Liu, L.; Chan, K.C. Enhanced plasticity by phase separation in CuZrAl bulk metallic glass with micro-addition of Fe. Scr. Mater. 2009, 60, 822–825. [Google Scholar] [CrossRef]
- Pan, J.; Chan, K.C.; Chen, Q.; Li, N.; Guo, S.F.; Liu, L. The effect of microalloying on mechanical properties in CuZrAl bulk metallic glass. J. Alloys Compd. 2010, 504, S74–S77. [Google Scholar] [CrossRef]
- Greer, A.L.; Ma, E. Bulk metallic glasses: At the cutting edge of metals research. MRS Bull. 2007, 32, 611–619. [Google Scholar] [CrossRef]
- Greer, A.L.; Cheng, Y.Q.; Ma, E. Shear bands in metallic glasses. Mater. Sci. Eng. R Rep. 2013, 74, 71–132. [Google Scholar] [CrossRef]
- Fang, T.; Wang, L.; Peng, C.X.; Qi, Y. Liquid immiscibility in an Fe-Cu alloy by molecular dynamics simulation. J. Phys. Condens. Matter 2012, 24, 505103. [Google Scholar] [CrossRef] [PubMed]
- Qi, Y.; Wang, L.; Wang, S.H.; Li, X.L.; Cui, W.C. Structural and dynamical heterogeneity of undercooled Fe75Cu25 melts with miscibility gap. J. Alloys Compd. 2014, 615, 962–968. [Google Scholar] [CrossRef]
- Yamauchi, I.; Irie, T.; Sakaguchi, H. Metastable liquid separation in undercooled Fe-Cu and Fe-Cu-Si melts containing a small B concentration and their solidification structure. J. Alloys Compd. 2005, 403, 211–216. [Google Scholar] [CrossRef]
- Nagase, T.; Yokoyama, A.; Umakoshi, Y. Formation of nanocrystalline globules and metallic glass in Fe70−xCuxZr10B20 (x = 0–70) alloys. Mater. Trans. 2006, 47, 1105–1114. [Google Scholar] [CrossRef]
- Nagase, T.; Yokoyama, A.; Umakoshi, Y. Multi-scale crystalline Cu globule dispersed Fe-based metallic glass formation by multi-step liquid phase separation. J. Alloys Compd. 2010, 494, 295–300. [Google Scholar] [CrossRef]
- Koziel, T.; Zielinska-Lipiec, A.; Latuch, J.; Kac, S. Microstructure and properties of the in situ formed amorphous-crystalline composites in the Fe-Cu-based immiscible alloys. J. Alloys Compd. 2011, 509, 4891–4895. [Google Scholar] [CrossRef]
- Bonny, G.; Pasianot, R.C.; Castin, N.; Malerba, L. Ternary Fe-Cu-Ni many-body potential to model reactor pressure vessel steels: First validation by simulated thermal annealing. Phil. Mag. 2009, 89, 3531–3546. [Google Scholar] [CrossRef]
- Horbach, J.; Das, S.K.; Griesche, A. Self-diffusion and interdiffusion in Al80Ni20 melts: Simulation and experiment. Phys. Rev. B 2007, 75, 174304. [Google Scholar] [CrossRef]
- Das, S.K.; Horbach, J.; Binder, K.; Fisher, M.E.; Sengers, J.V. Static and dynamic critical behavior of a symmetrical binary fluid: A computer simulation. J. Chem. Phys. 2006, 125, 024506. [Google Scholar] [CrossRef] [PubMed]
- Sohn, S.W.; Yook, W.; Kim, W.T.; Kim, D.H. Phase separation in bulk-type Gd-Zr-Al-Ni metallic glass. Intermetallics 2012, 23, 57–62. [Google Scholar] [CrossRef]

© 2017 by the authors. Licensee MDPI, Basel, Switzerland. This article is an open access article distributed under the terms and conditions of the Creative Commons Attribution (CC BY) license ( http://creativecommons.org/licenses/by/4.0/).