AISI 304 Welding Fracture Resistance by a Charpy Impact Test with a High Speed Sampling Rate


Abstract
:1. Introduction
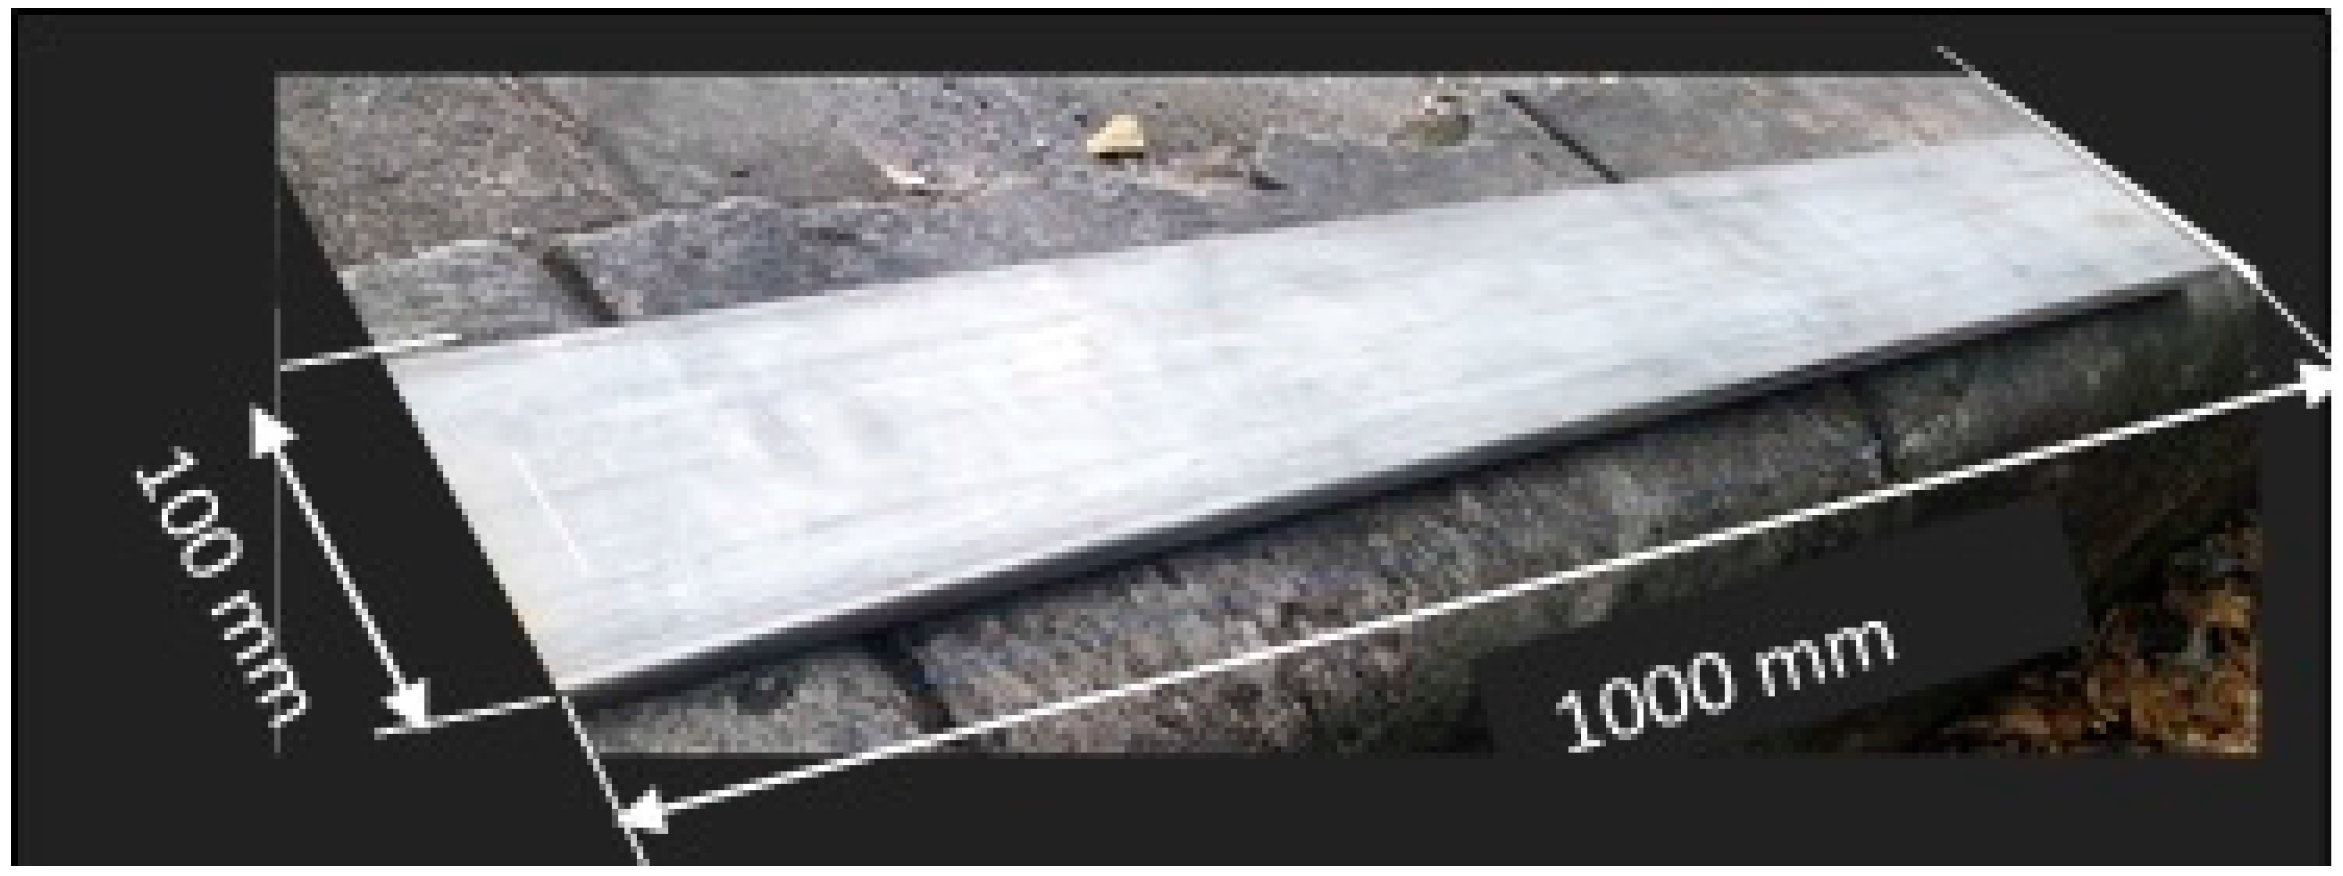
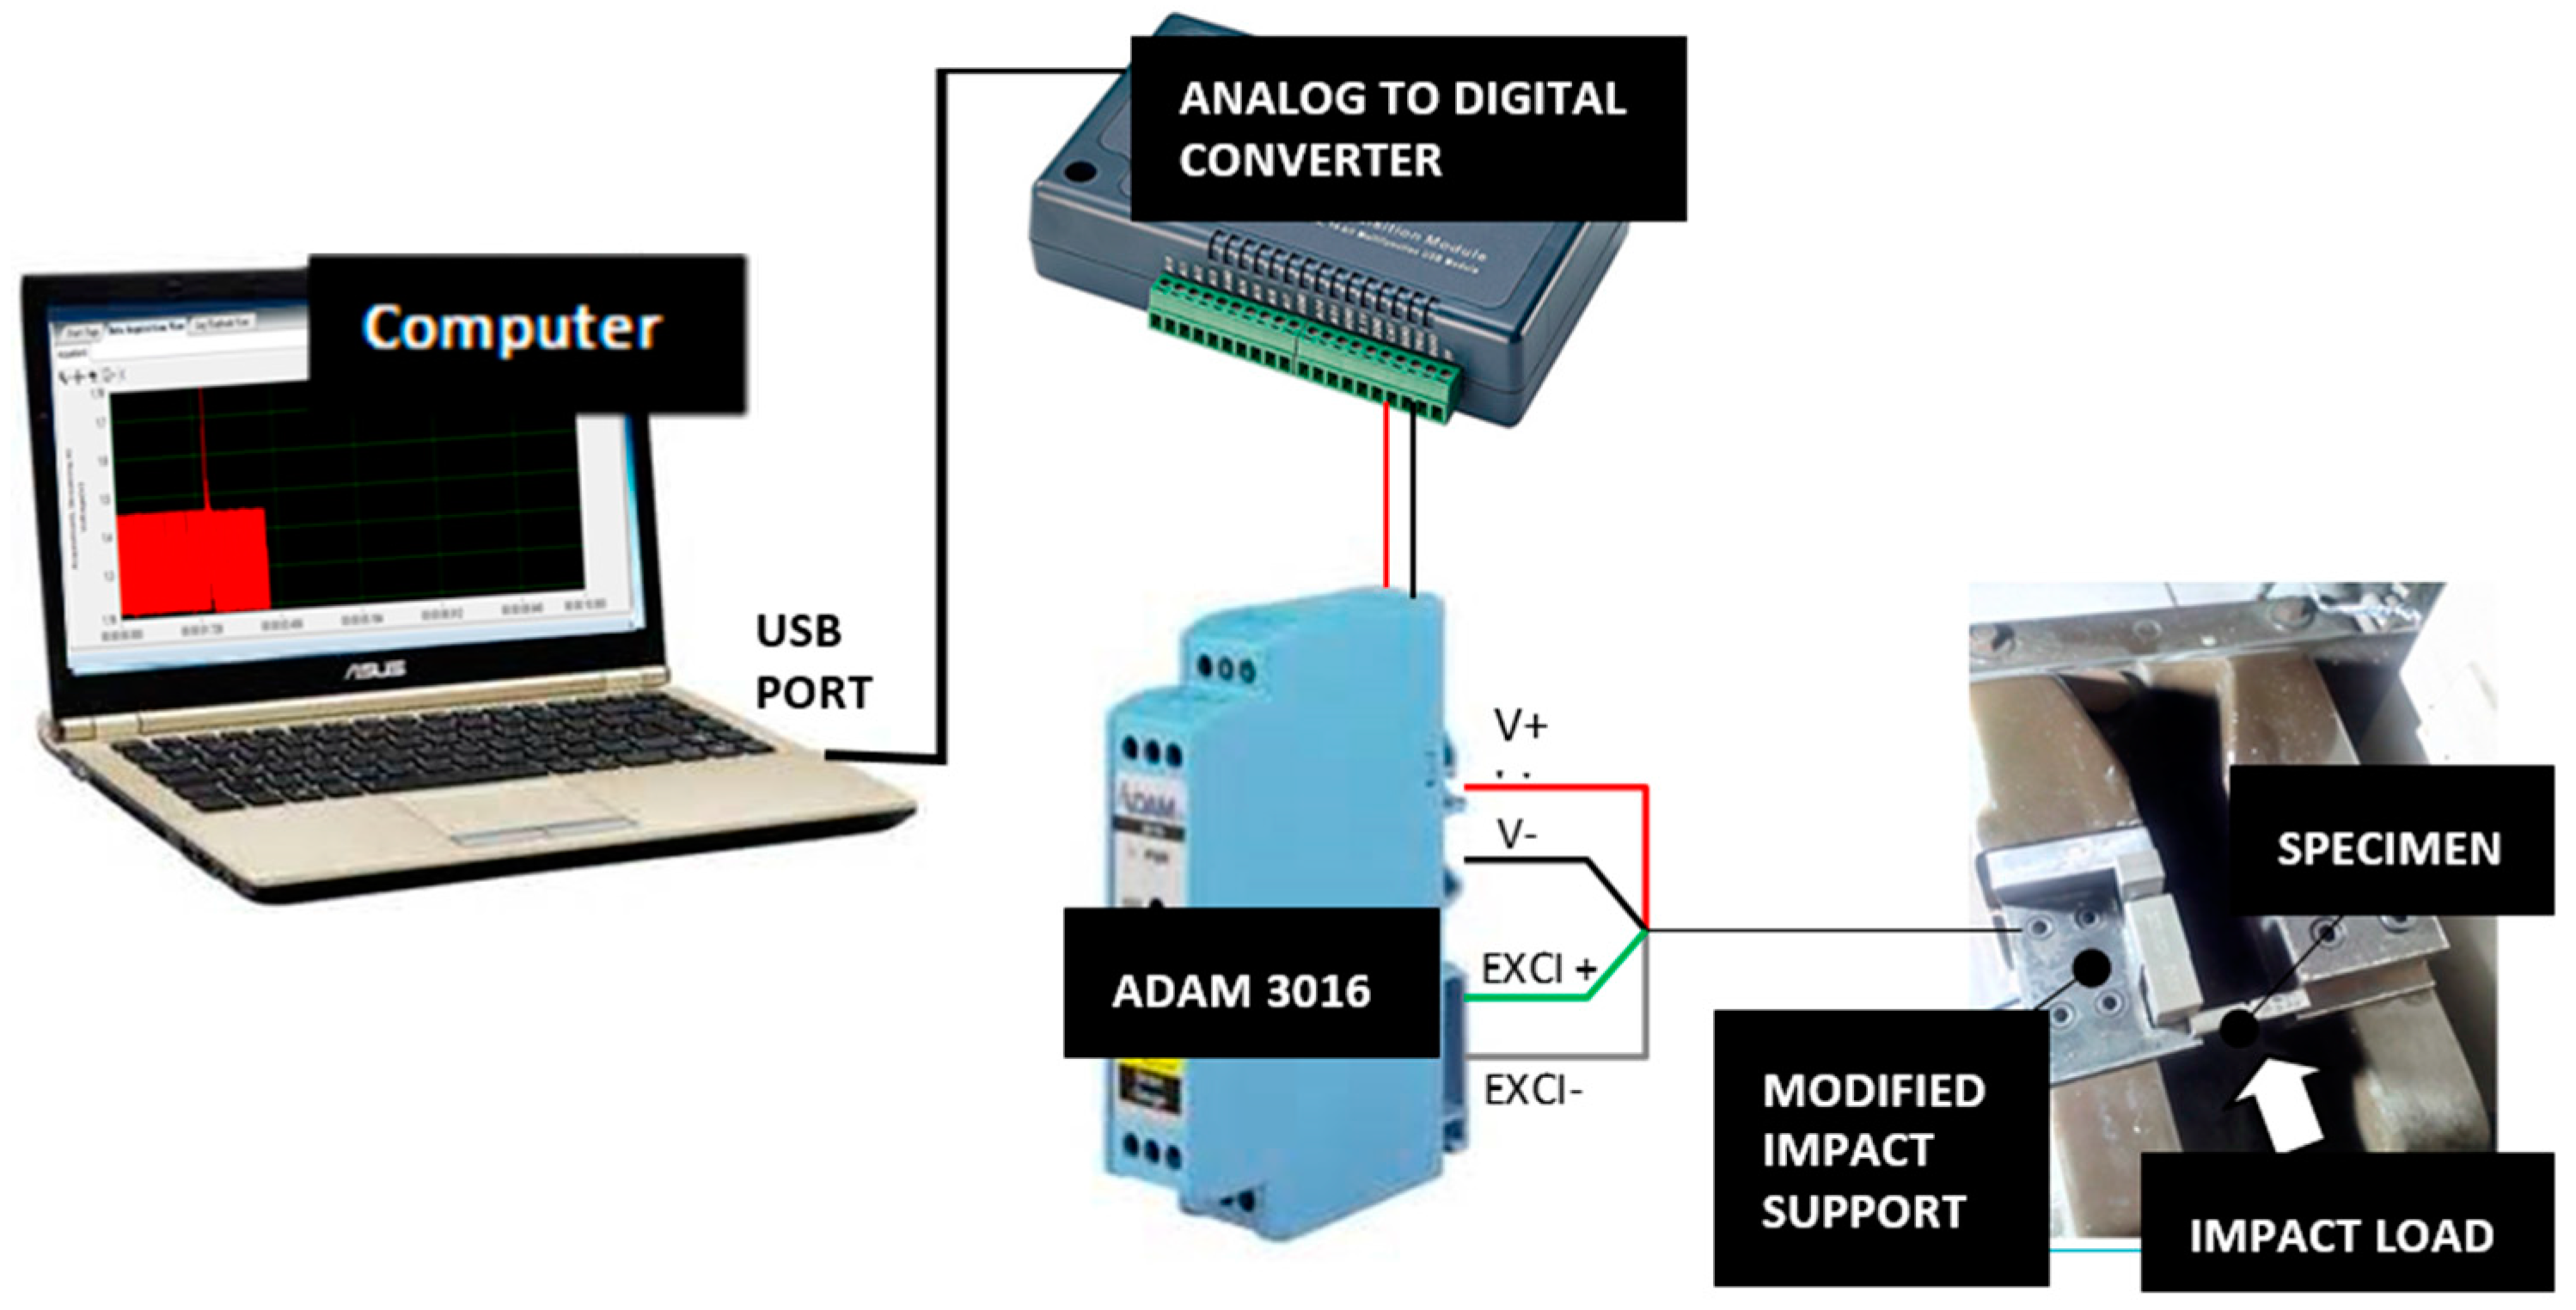
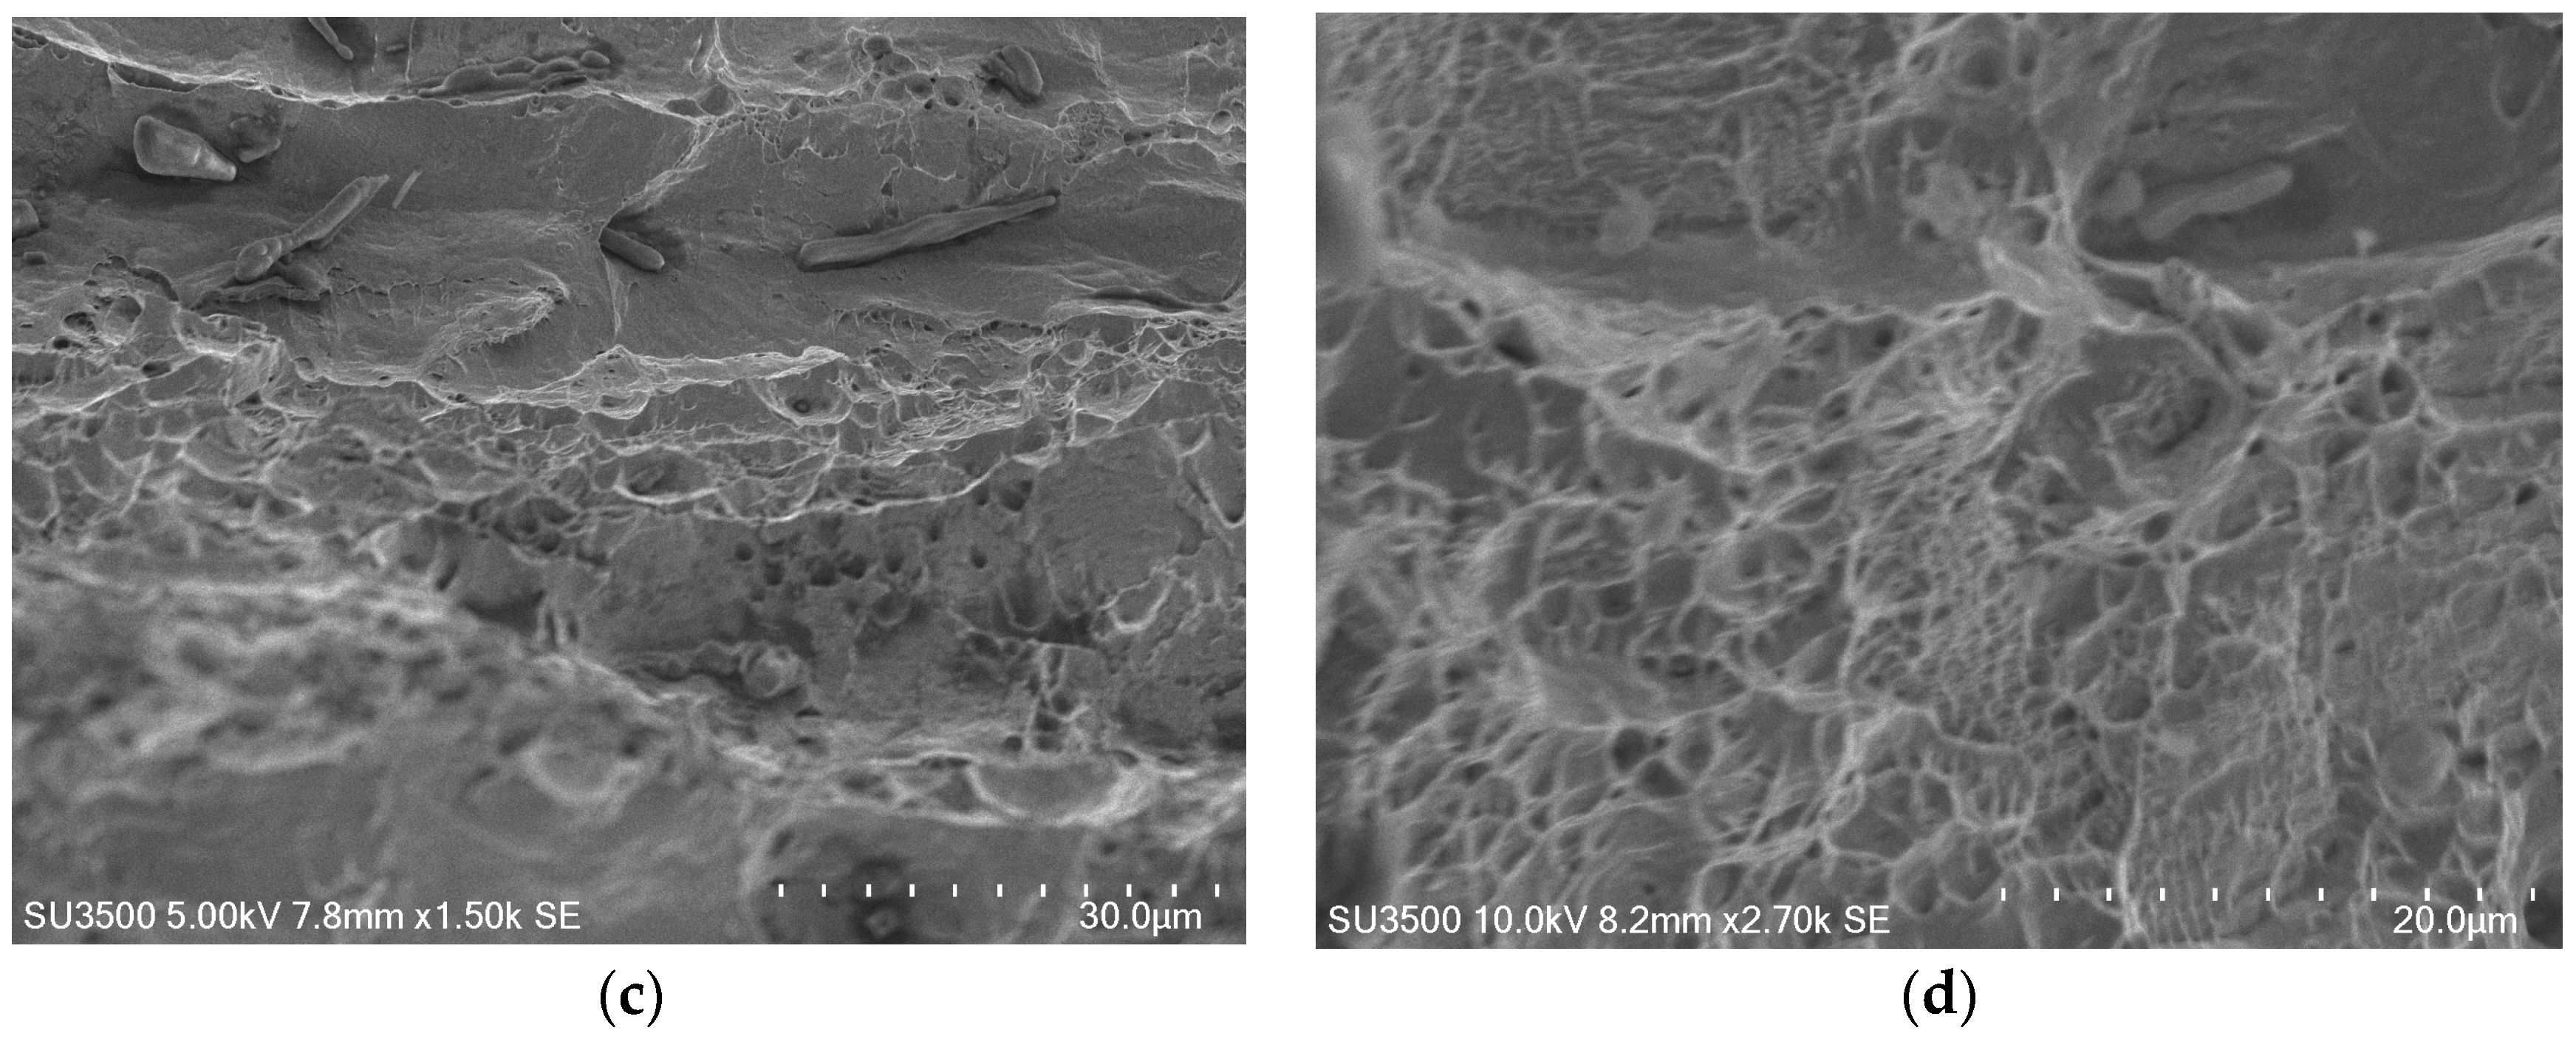
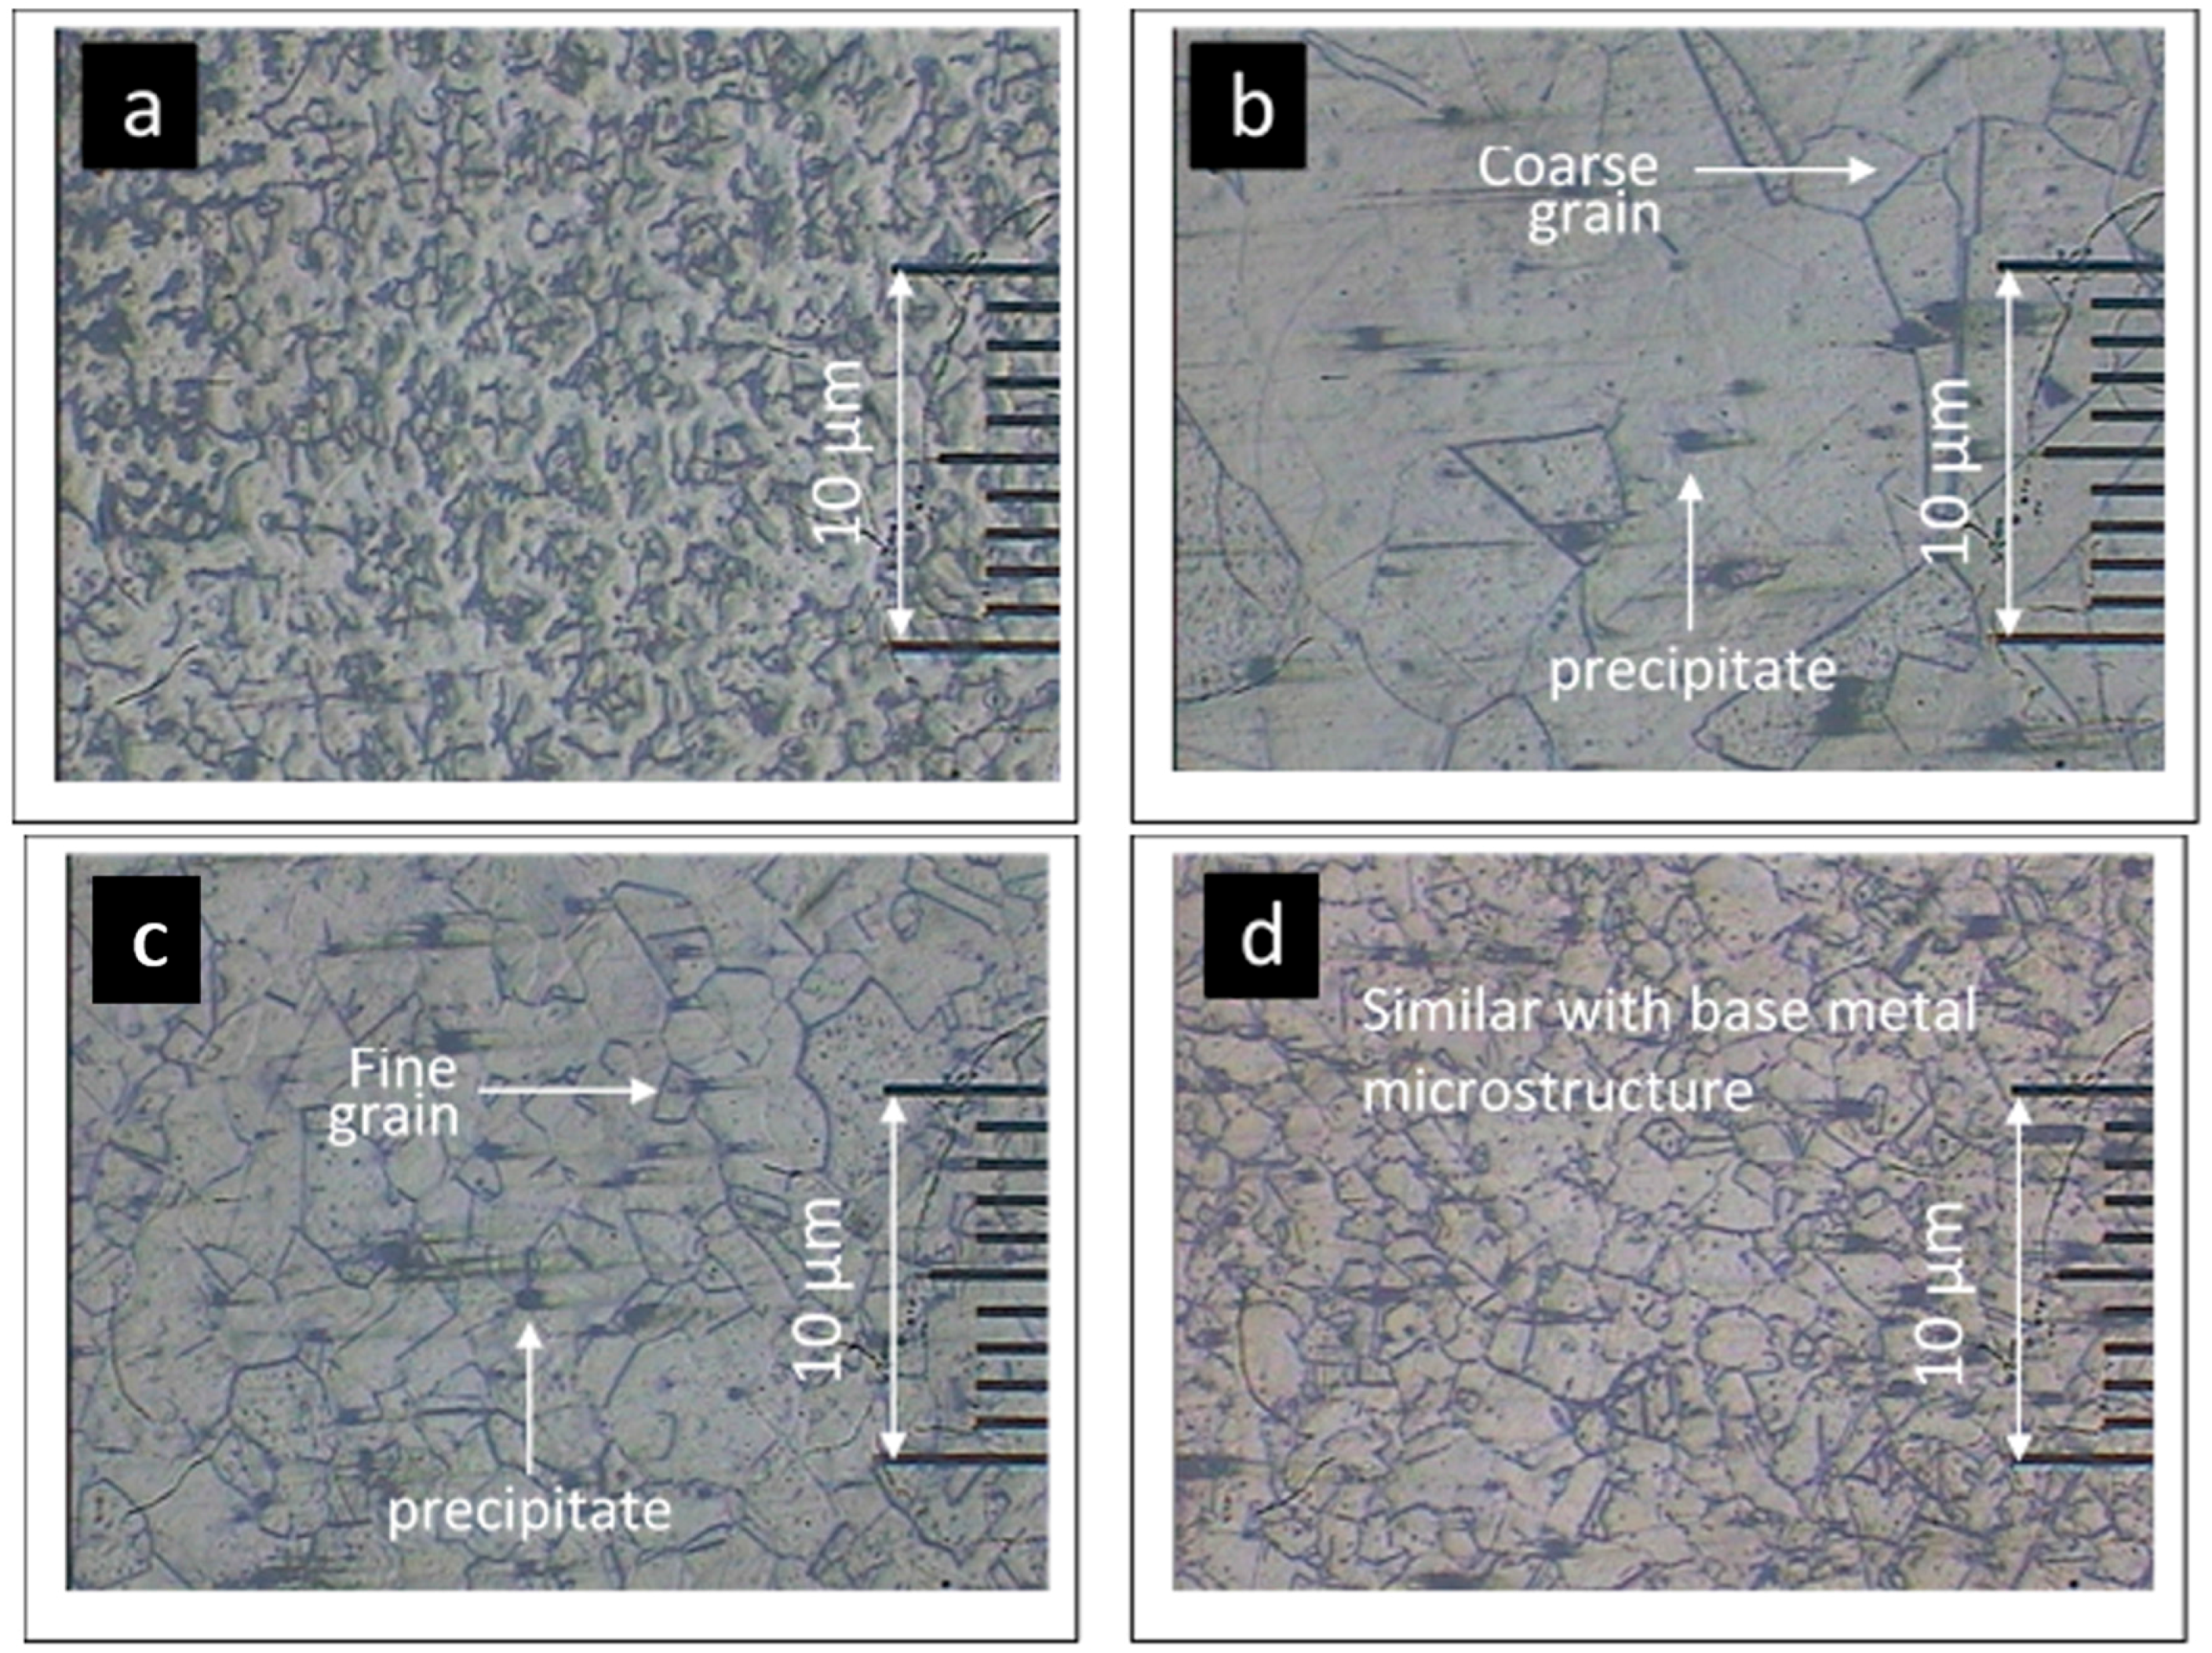
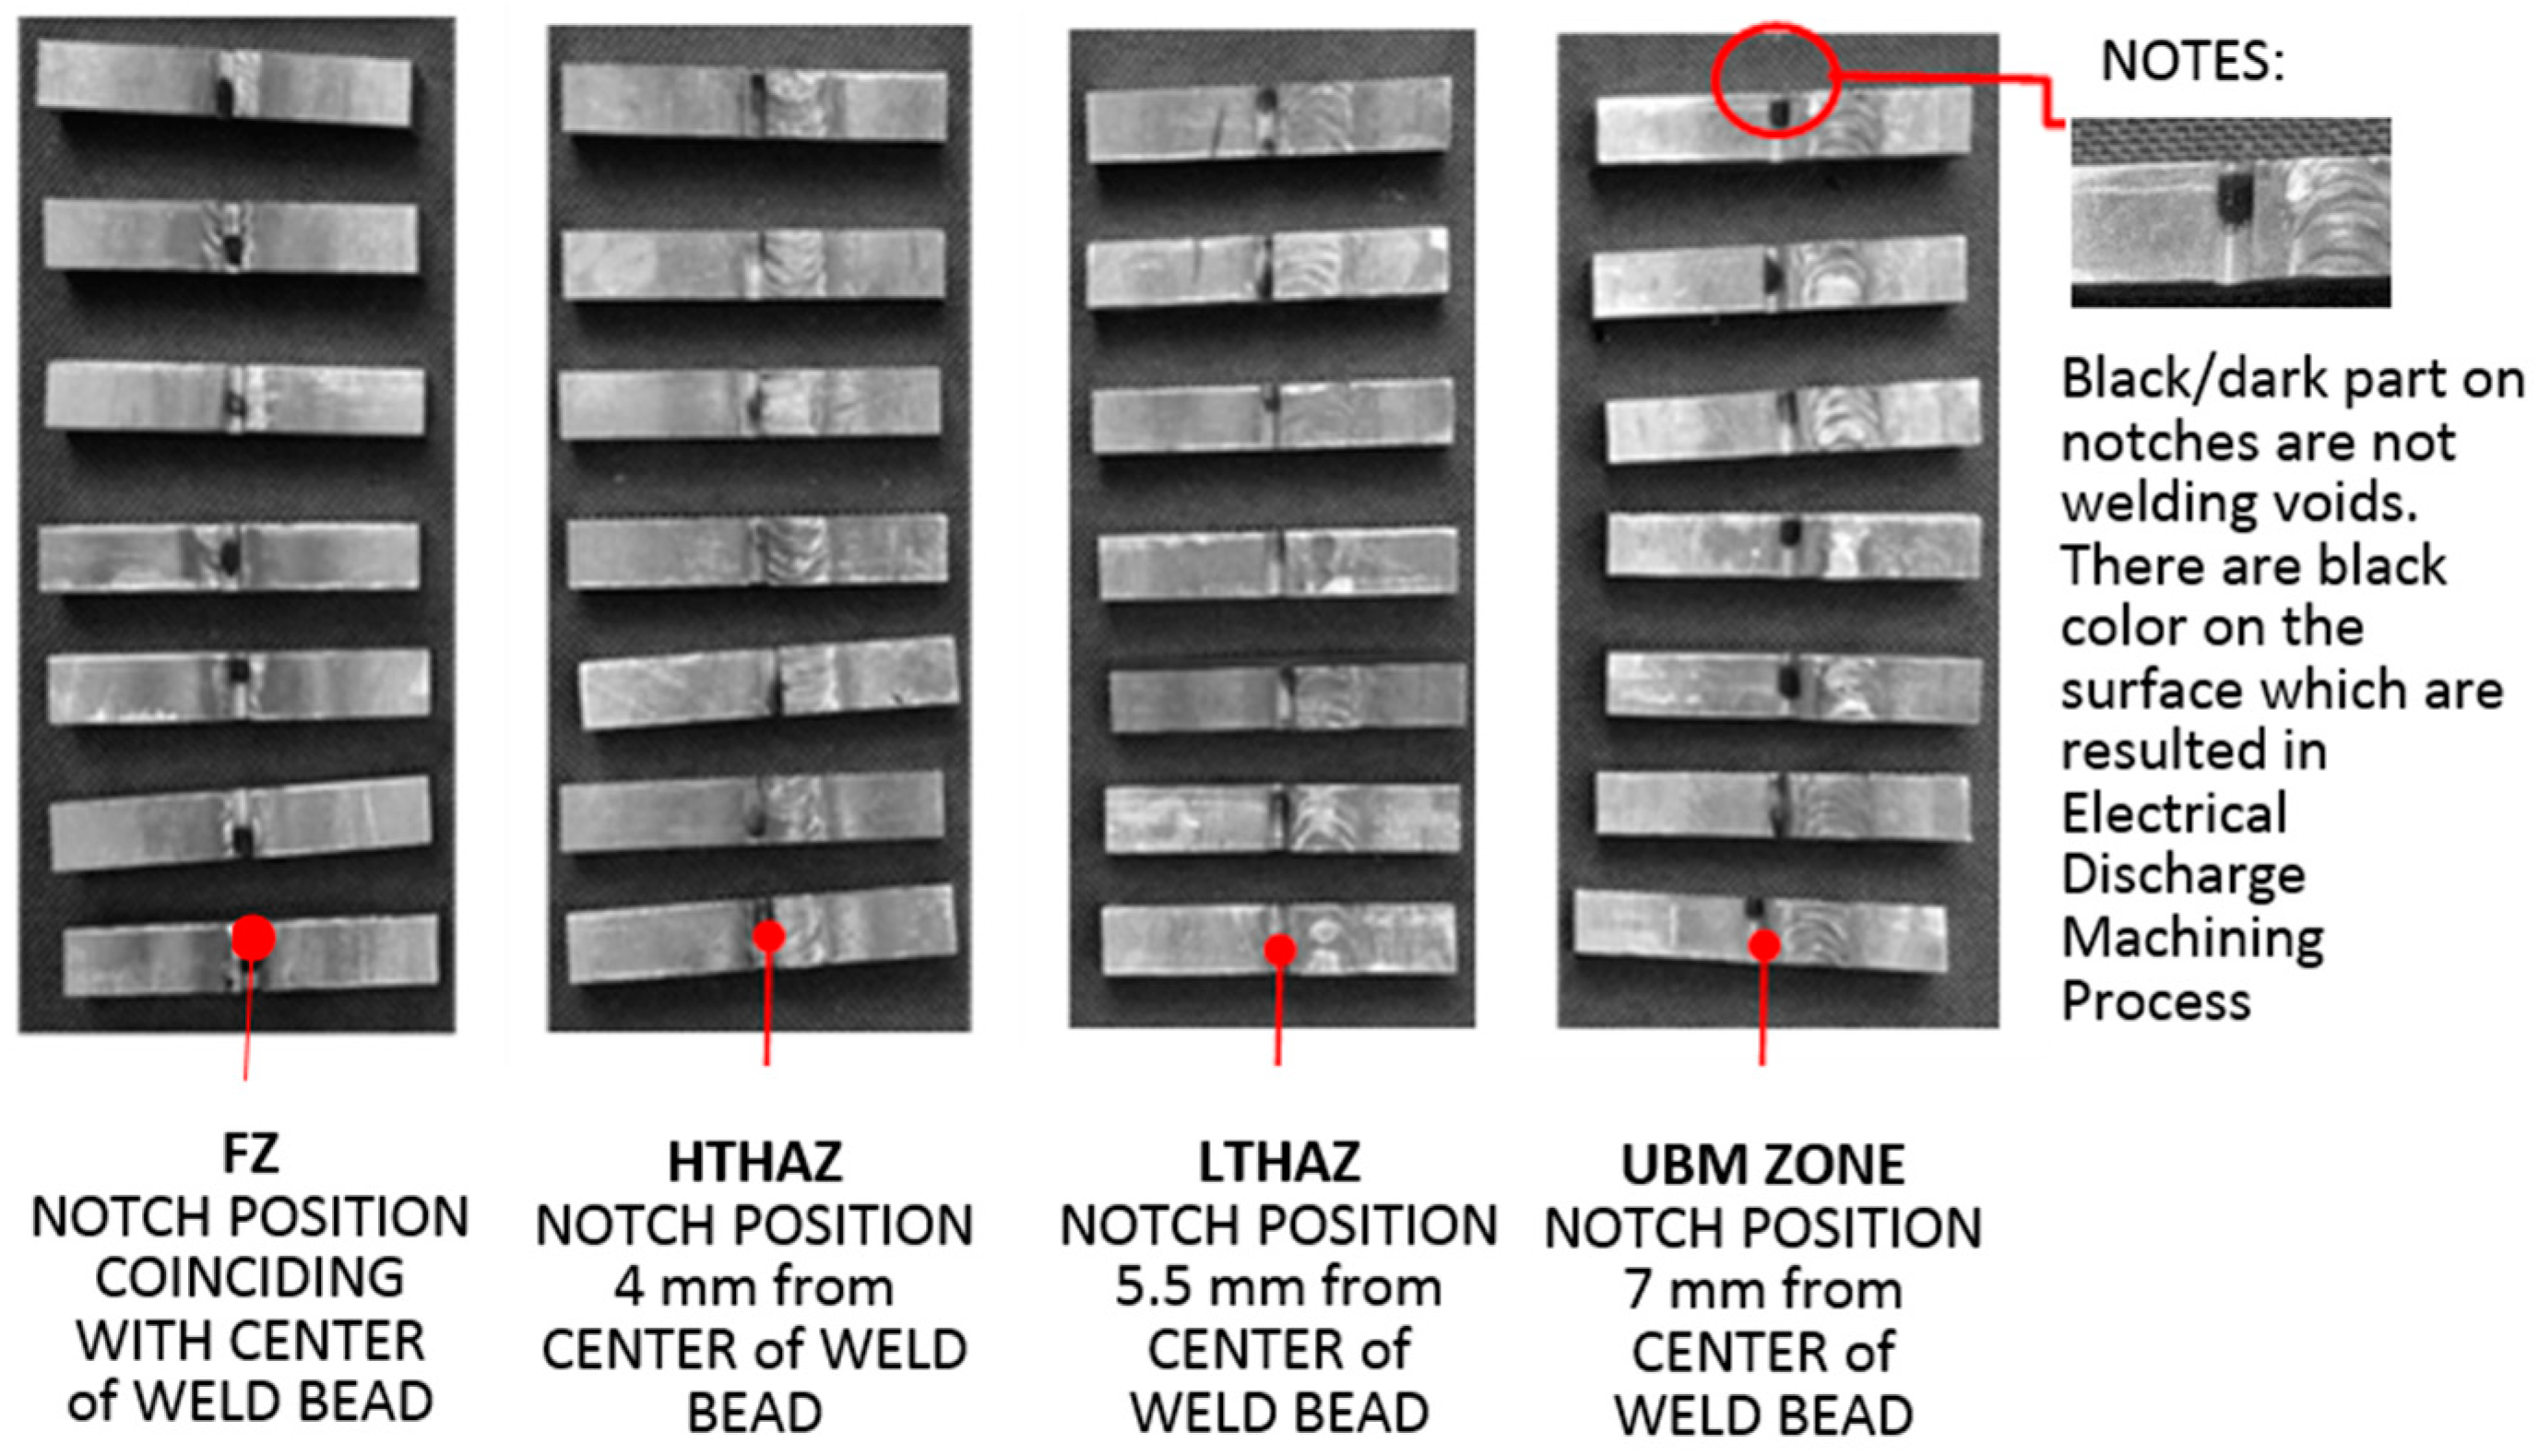
2. Experimental Method
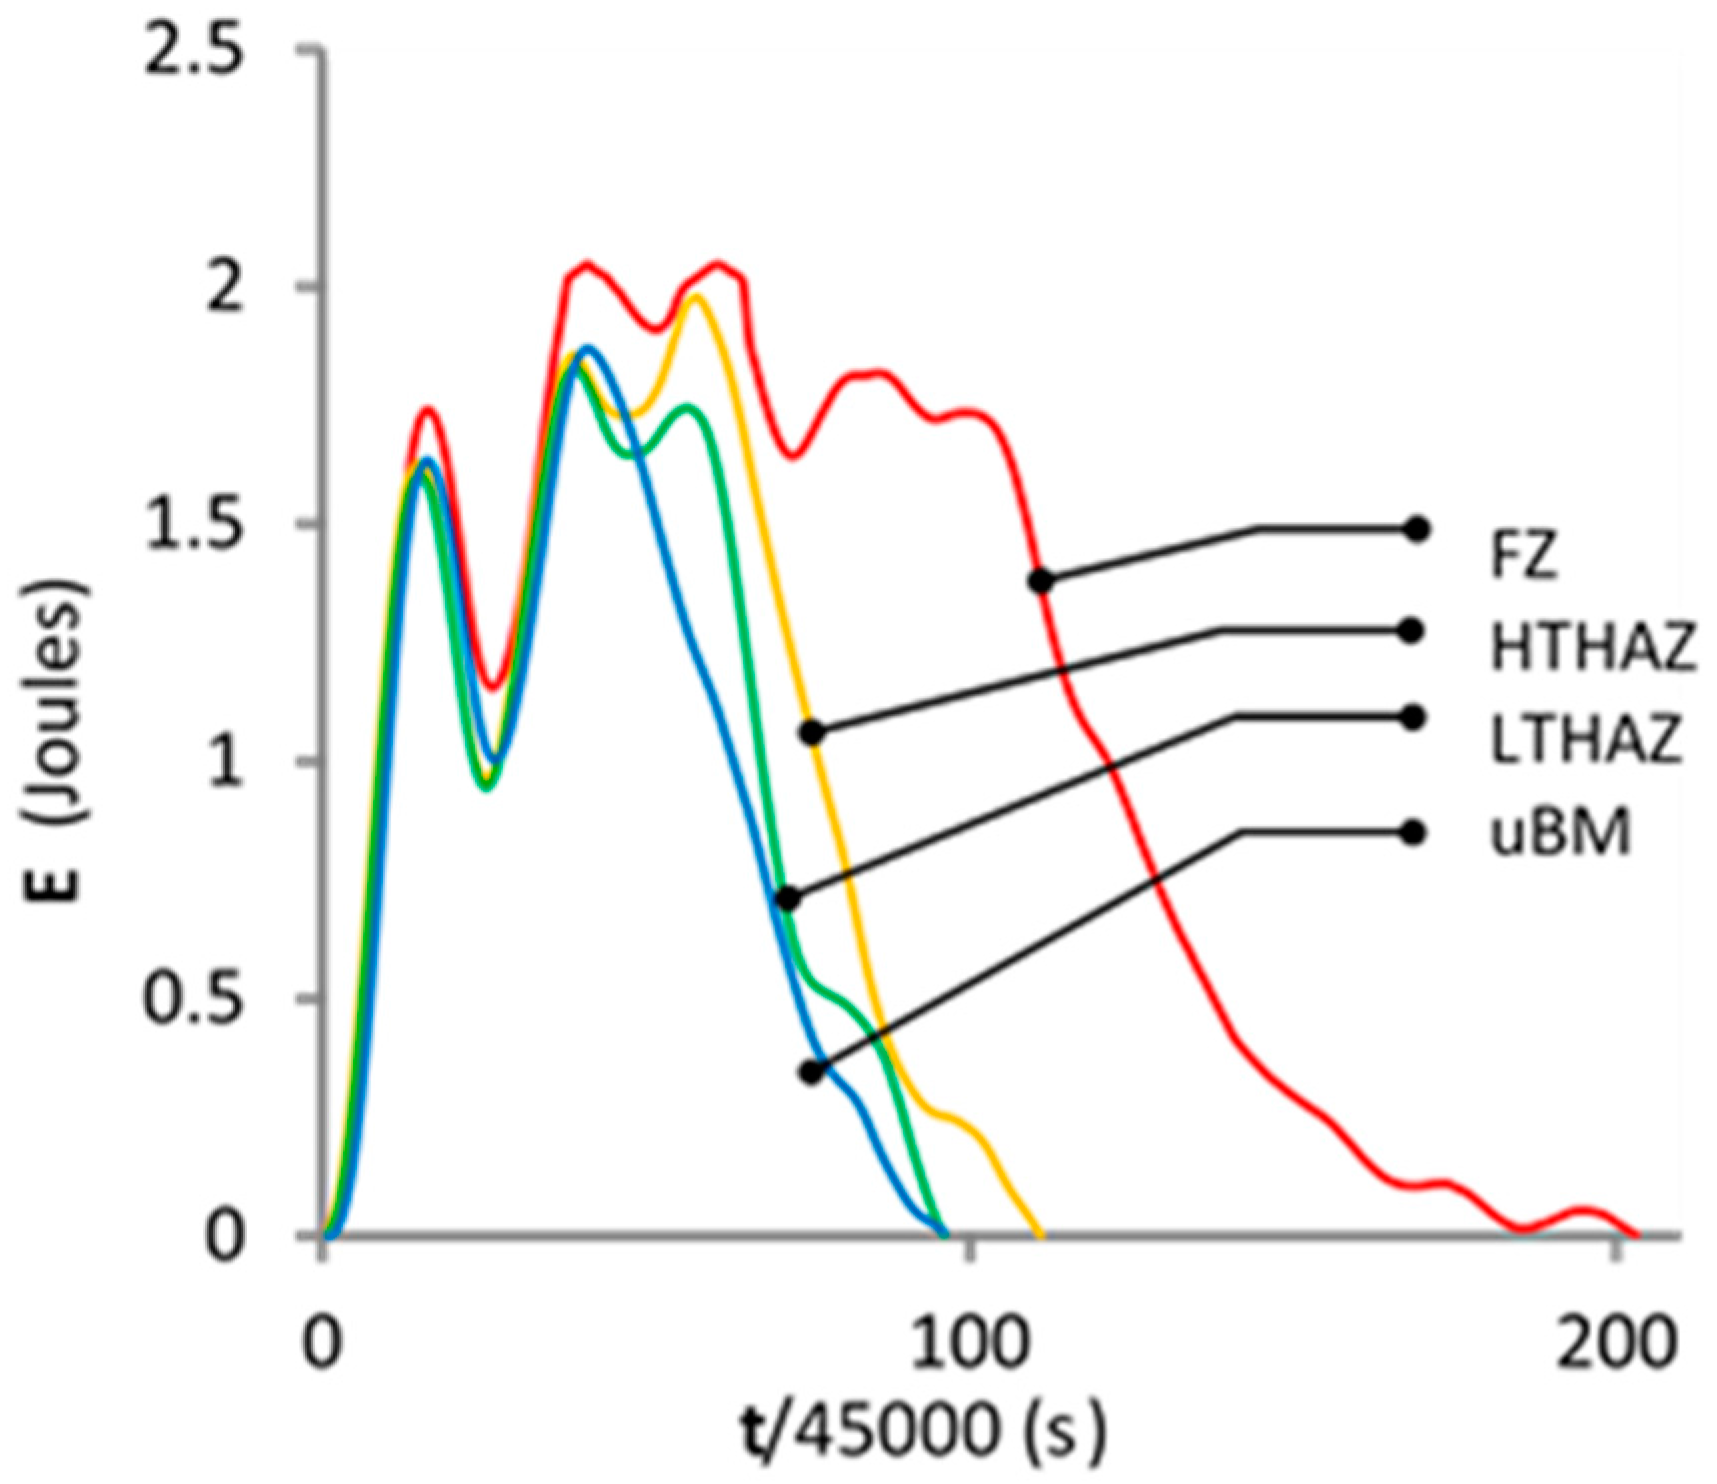
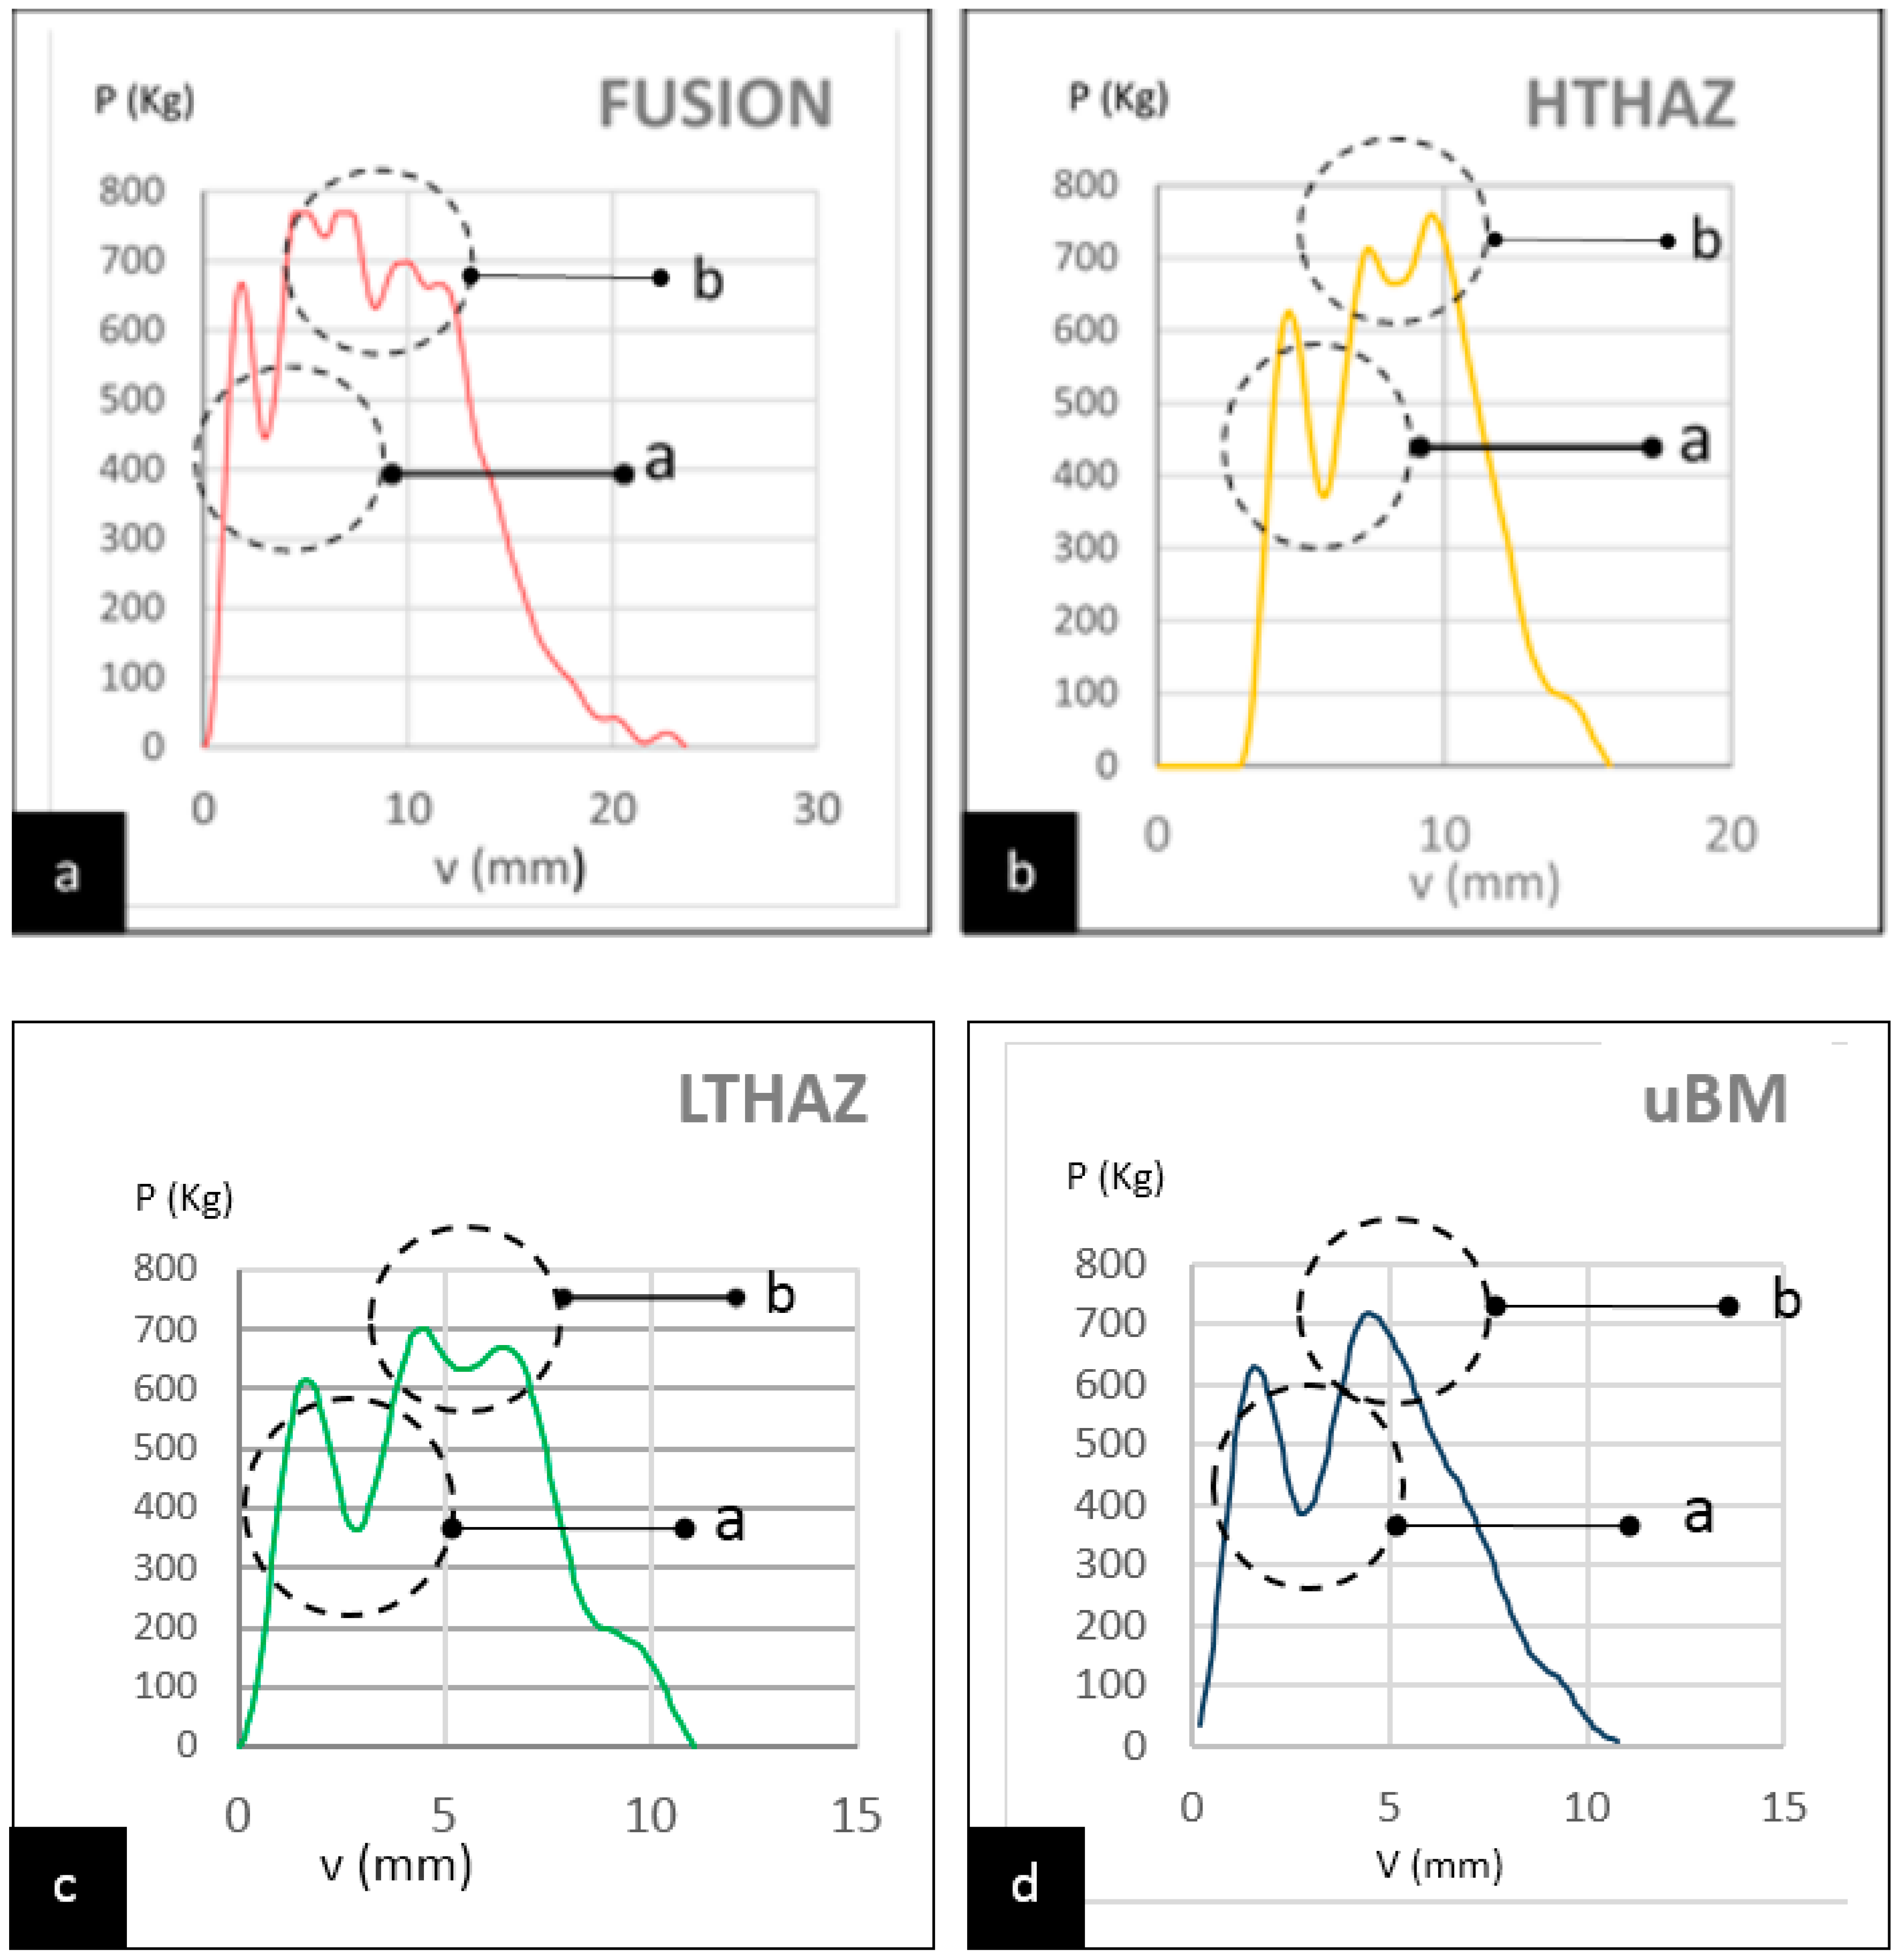
3. Study Results
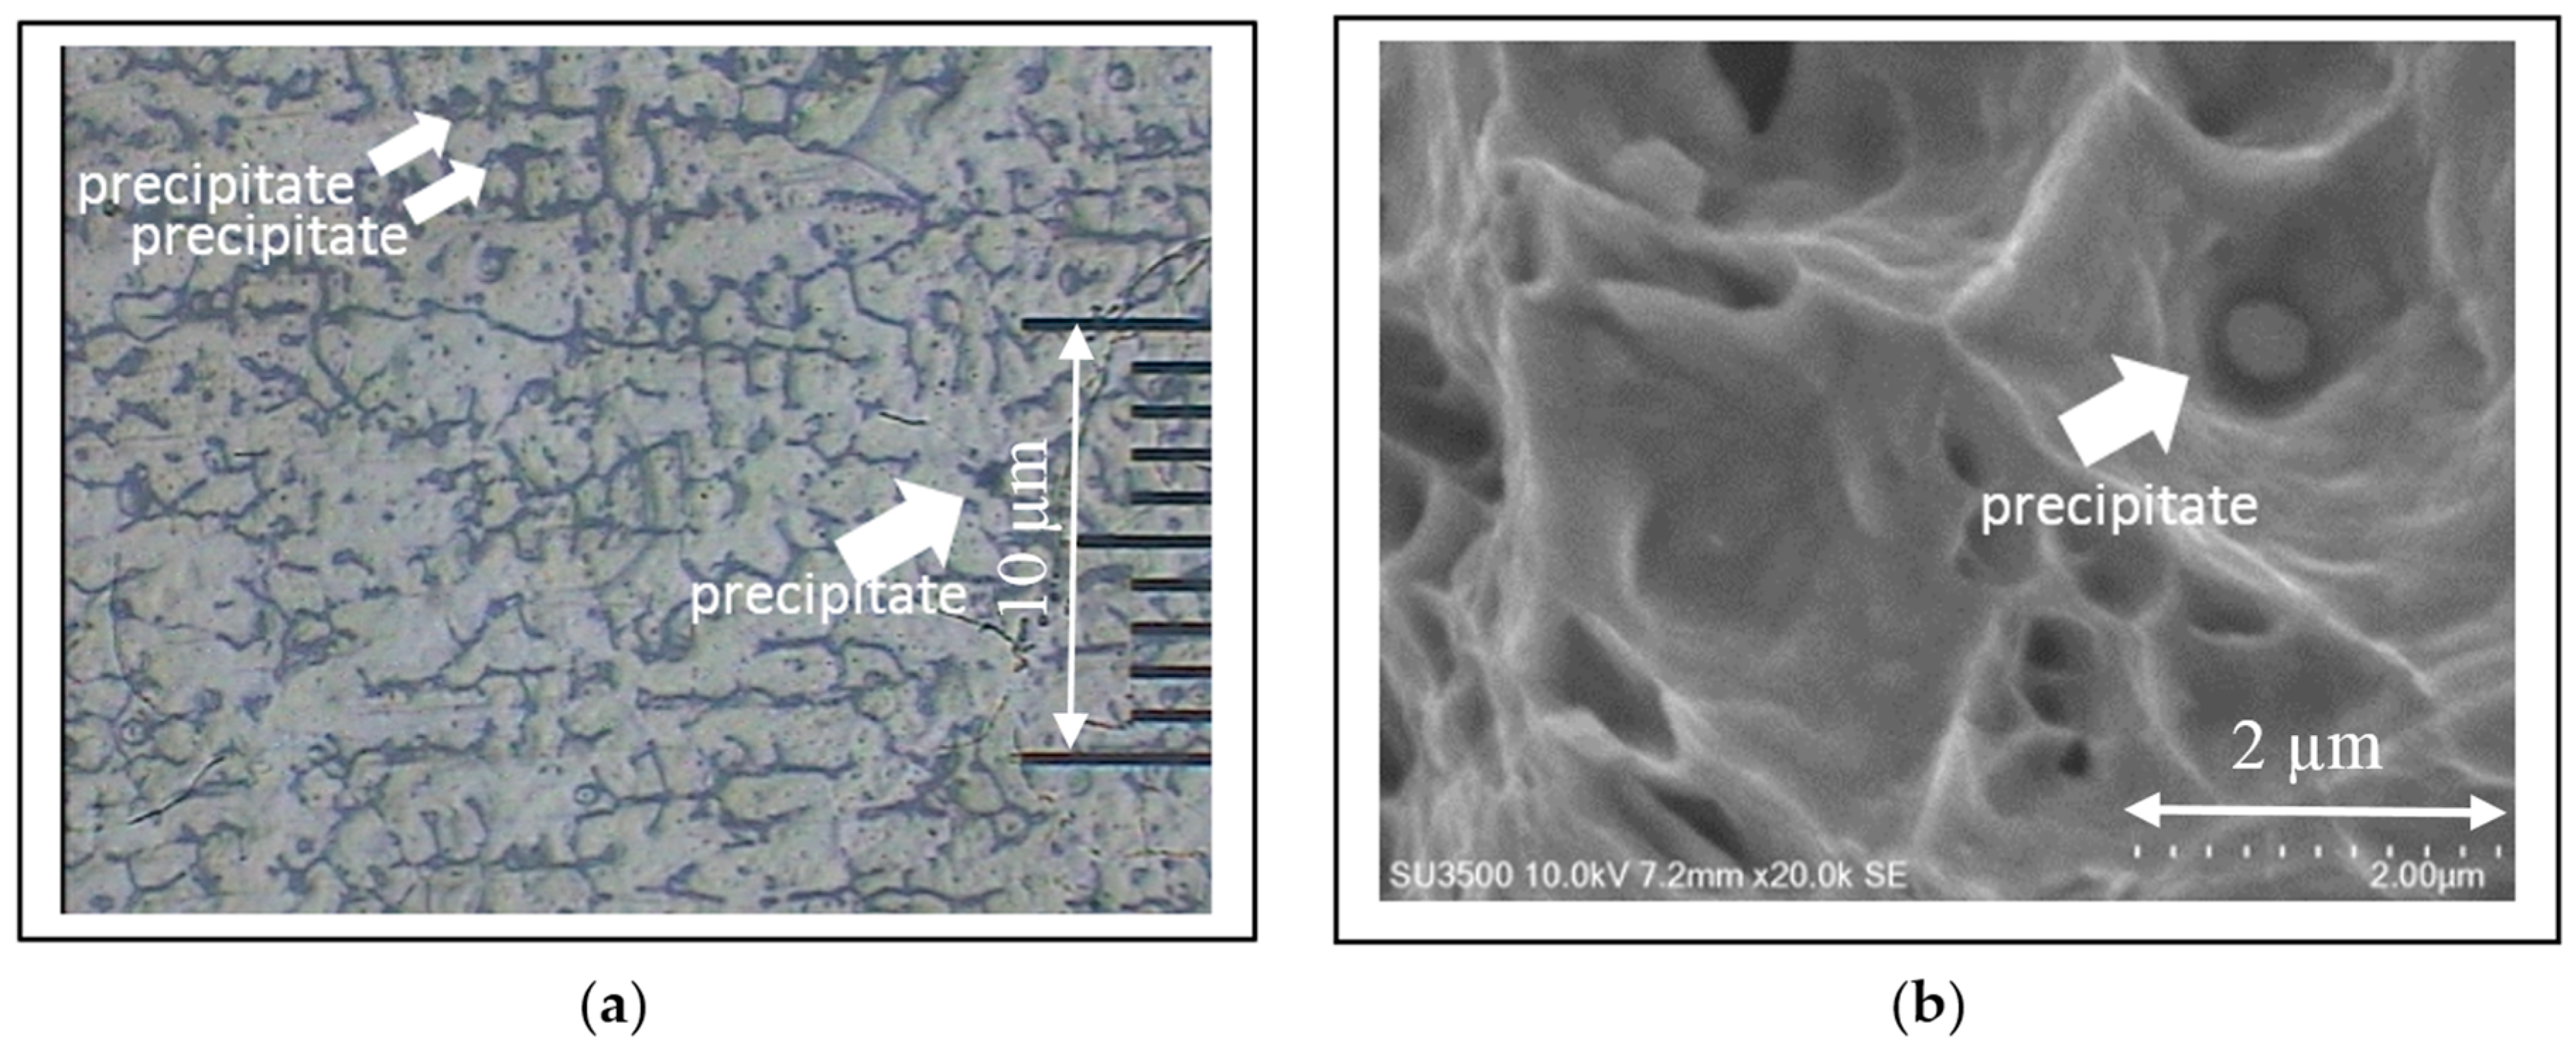
4. Discussion
5. Conclusions
Acknowledgments
Author Contributions
Conflicts of Interest
References
- Brandon, P.P. Fracture Toughness: Evaluation of Testing Procedure to Simplify JIc Calculations. Master’s Thesis, University of Tennessee, Knoxville, TN, USA, May 2005. [Google Scholar]
- Lee, K. Elastic-Plastic Fracture Toughness Determination under Some Difficult Conditions. Ph.D. Thesis, University of Tennessee, Knoxville, TN, USA, August 1995. [Google Scholar]
- Broek, D. Elementary Engineering Fracture Mechanics, 4th ed.; Kluwer Academic Publishers: Dordrecht, The Netherlands, 1986. [Google Scholar]
- Zhang, X.; Gao, H. A Study of Impact Toughness of Intercritically Reheated Coarsed-Grain of Heat Effected Zone of Two Type X80 Grade Pipeline Steel; Spesial Issue on WSE2011; Transaction of JWRI: Osaka, Japan, 2011. [Google Scholar]
- Purnomo, P.; Soenoko, R.; Suprapto, A.; Irawan, Y.S. Impact Fracture Toughness Evaluation by Essential Work of Fracture Method in High Density Polyethylene Filled with Zeolite. FME Trans. 2016, 44, 180–186. [Google Scholar] [CrossRef]
- Kim, H.; Kang, M.; Jung, H.J.; Kim, H.S.; Bae, C.M.; Lee, S. Mechanisms of toughness improvement in Charpy impact and fracture toughness tests of non-heat-treating cold-drawn steelbar. Mater. Sci. Eng. 2013, 571, 38–48. [Google Scholar] [CrossRef]
- Pamnania, R.; Jayakumarb, T.; Vasudevanb, M.; Sakthivelb, T. Investigations on the impact toughness of HSLA steel arc welded joints. J. Manuf. Process. 2016, 21, 75–86. [Google Scholar] [CrossRef]
- Landes, J.D.; Zhou, Z.; Lee, K.; Herrera, R. Normalization Method for Developing J-R Curves with the LMN function. J. Test. Eval. 1991, 19, 305–311. [Google Scholar]
- Lee, K.; Landes, J.D. Developing J-R Curves without Displacement Measurement Using Normalization. In Fracture Mechanics: Twenty-Third Symposium; Chona, R., Ed.; ASTM International: Philadelphia, PA, USA, 1993; pp. 133–167. [Google Scholar]
- Chaouadi, R.; Puzzolante, J.L. Crack resistance determination from the charpy impact test. In Proceedings of the 16th European Conference of Fracture, Alexandroupolis, Greece, 3–7 July 2006; pp. 515–516. [Google Scholar]
- Terán, G.; Colindres, S.C.; Herrera, D.A.; Velázquez, J.C.; Cueto, F.M. Estimation of fracture toughness KIC from Charpy impact test data in T-welded connections repaired by grinding and wet welding. Eng. Fract. Mech. 2016, 153, 351–359. [Google Scholar] [CrossRef]
- Kapp, J.A.; Underwood, J.H. Correlation between Fracture Toughness, Charpy V-Notch Impact Energy, and Yield Strength for ASTM A723 Steel; Technical Report, ARCCB-MR-92008; U.S. Army Ardec Benet Laboratories: Watervliet, NY, USA, 1992.
- ASTM E23-02. Standard Test Methods for Notched Bar Impact Testing of Metallic Materials; ASTM Committee E28: West Conshohocken, PA, USA, May 2005. [Google Scholar]
- McGuire, M.F. Stainless Steels for Design Engineers, 1st ed.; ASM International: Geauga County, OH, USA, 2008. [Google Scholar]
- Janssen, M.; van Leeuwen, M.B.; de Leon Mendes, M.F. Fracture Toughness of High-Chromium White Cast Iron in Relation to the Primary Carbide Morphology. In Proceedings of the 13th European Conference on Fracture, San Sebastian, Spain, 6–9 September 2000. [Google Scholar]
- Ding, Y. Effects of Elevated Temperature Exposure on the Microstructural Evolution of Ni(Cr)-Cr3C2 Coated 304 Stainless Steel. Ph.D. Thesis, University of Nottingham, Nottingham, UK, June 2009. [Google Scholar]
- Young, S.Y. Thermodynamic Study on B and Fe Substituted Cr23C6 Using First-Principles Calculations. Master’s Thesis, Pohang University of Science and Technology, Pohang, Korea, 15 April 2010. [Google Scholar]
- Fujita, N. Modelling Carbide Precipitation in Alloy Steels. Ph.D. Thesis, University of Cambridge, Cambridge, UK, February 2000. [Google Scholar]
- Bhadeshia, H.K. Design of Ferritic Creep-resistant Steels. ISIJ Int. 2001, 41, 626–640. [Google Scholar] [CrossRef]
- Gharehbaghi, A. Precipitation Study in a High Temperature Austenitic Stainless Steel Using Low Voltage Energy Dispersive X-ray Spectroscopy. Master’s Thesis, Royal Institute of Technology, Stockholm, Sweden, March 2012. [Google Scholar]
- Joshua, P. Mechanical Properties of Materials; Springer: New York, NY, USA, 2013; pp. 236–239. ISBN 978-94-007-4341-0. [Google Scholar]
- Dieter, G.E. Mechanical Metallurgy; McGraw-Hill Publishing Company: New York, NY, USA, 1986. [Google Scholar]
- Callister, W.D. Fundamentals of Materials Science and Engineering, 2nd ed.; Wiley & Sons: Hoboken, NJ, USA, 2004. [Google Scholar]
- Thosmas, H.C. Mechanical Behavior of Materials, 2nd ed.; Waveland Press, Inc.: Long Grove, IL, USA, 2005. [Google Scholar]
- Chen, J.; Verreman, Y.; Lanteigne, J. On fracture toughness JIC testing of martensitic Stainless Steels. In Proceedings of the13th International Conference on Fracture, Beijing, China, 16–21 June 2013. [Google Scholar]


| Element | C | Cr | Mn | Mo | Ni | P | Si | S | O | N |
|---|---|---|---|---|---|---|---|---|---|---|
| Weight % | 0.041 | 18.4 | 0.19 | 0.19 | 8.5 | 0.031 | 0.54 | 0.014 | 0.025 | 0.062 |
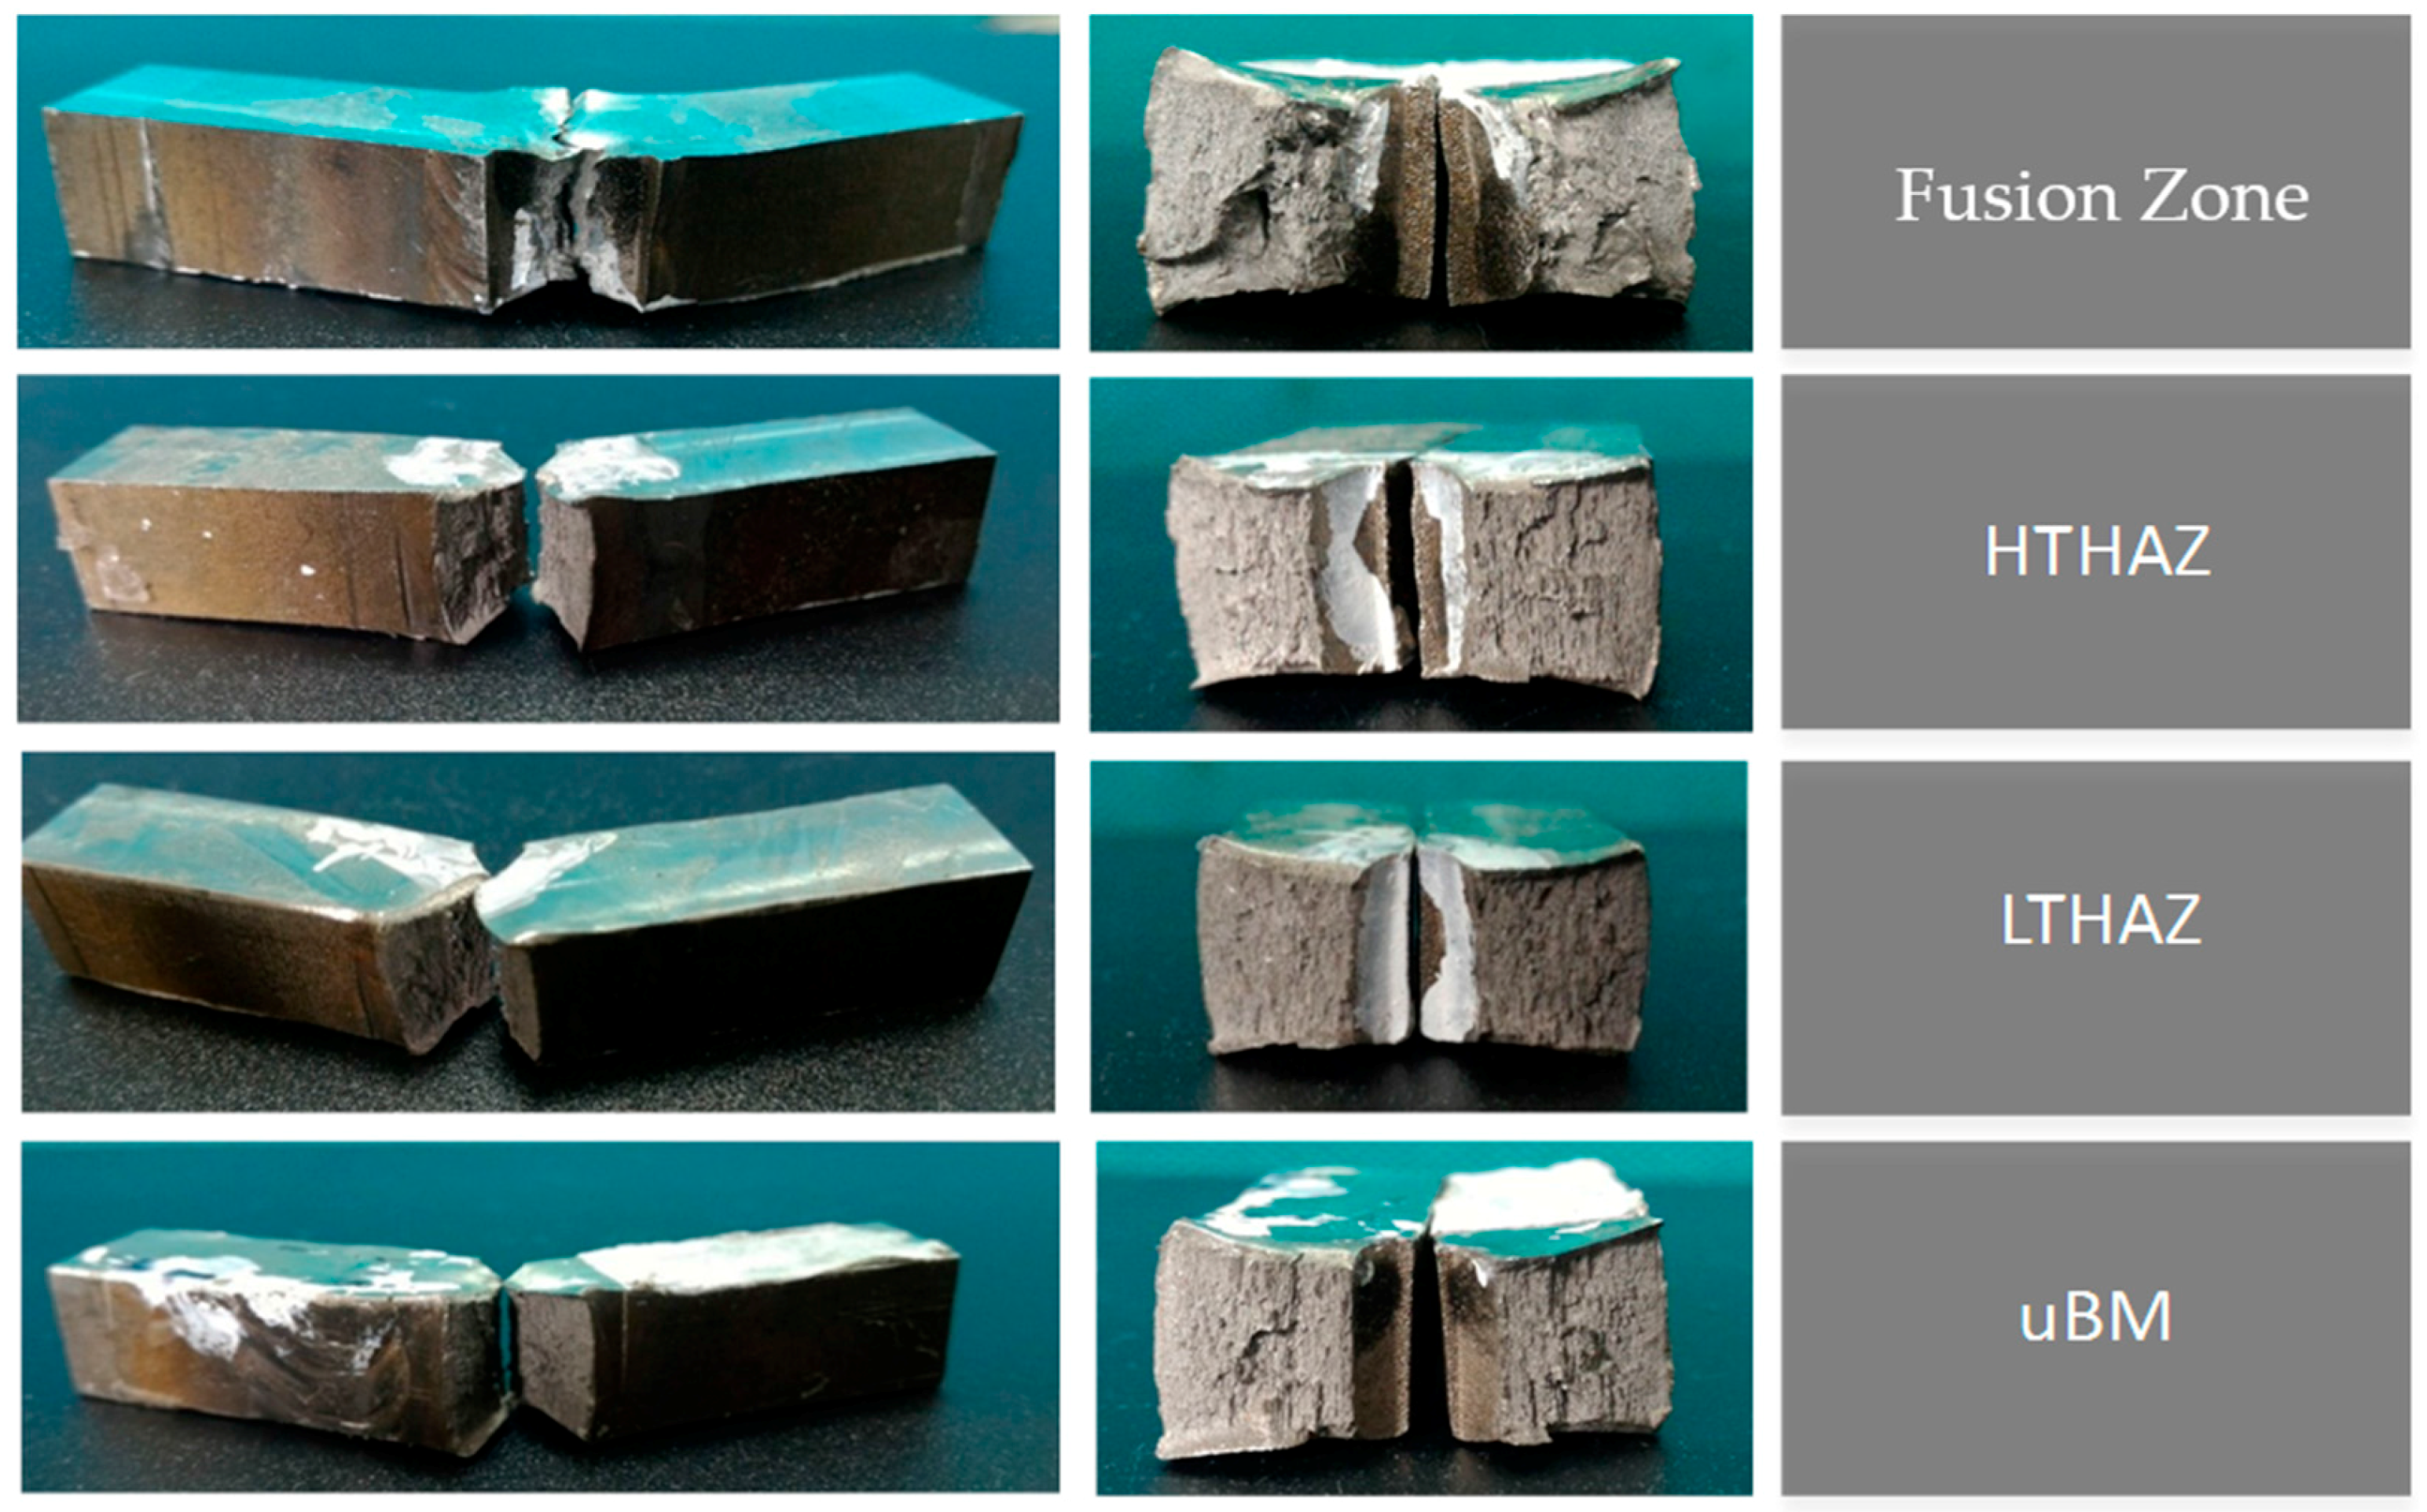
| Welding Process | 141/Gas Tungsten Arc Welding (GTAW) |
| Welding position | PA/1G-Down hand |
| Joint Type | Butt Joint |
| Parents Material Specification | AISI 304 |
| Preparation Cleaning | Mechanical |
| Welding Sequence | (1) Clean the surface (brush & grinding); (2) Dry 50 °C, tack welding & welding; (3) 1 Layer filled weld only in straight layer; (4) Visual control of welding seam; (5) Next layer in straight layer |
| Filler Metal | High-Performance Stainless Steel Welding Electro Rod-ER 308 L, Post drying: dry store, Slow cooling, argon shielding gas |
| Other Information | Preheat temp: plate dray > 25 °C, welder’s test: welding position European Standard EN 287-1.PF |
| Methods | Total Impact Energy (Joules) | |||
|---|---|---|---|---|
| Fusion Zone | HTHAZ | LTHAZ | Unaffected Base Metal | |
| Area under load line | 252.9 | 130.9 | 109.9 | 100.36 |
| Indicator on impact machine | 214.8 | 114.5 | 99.5 | 90 |
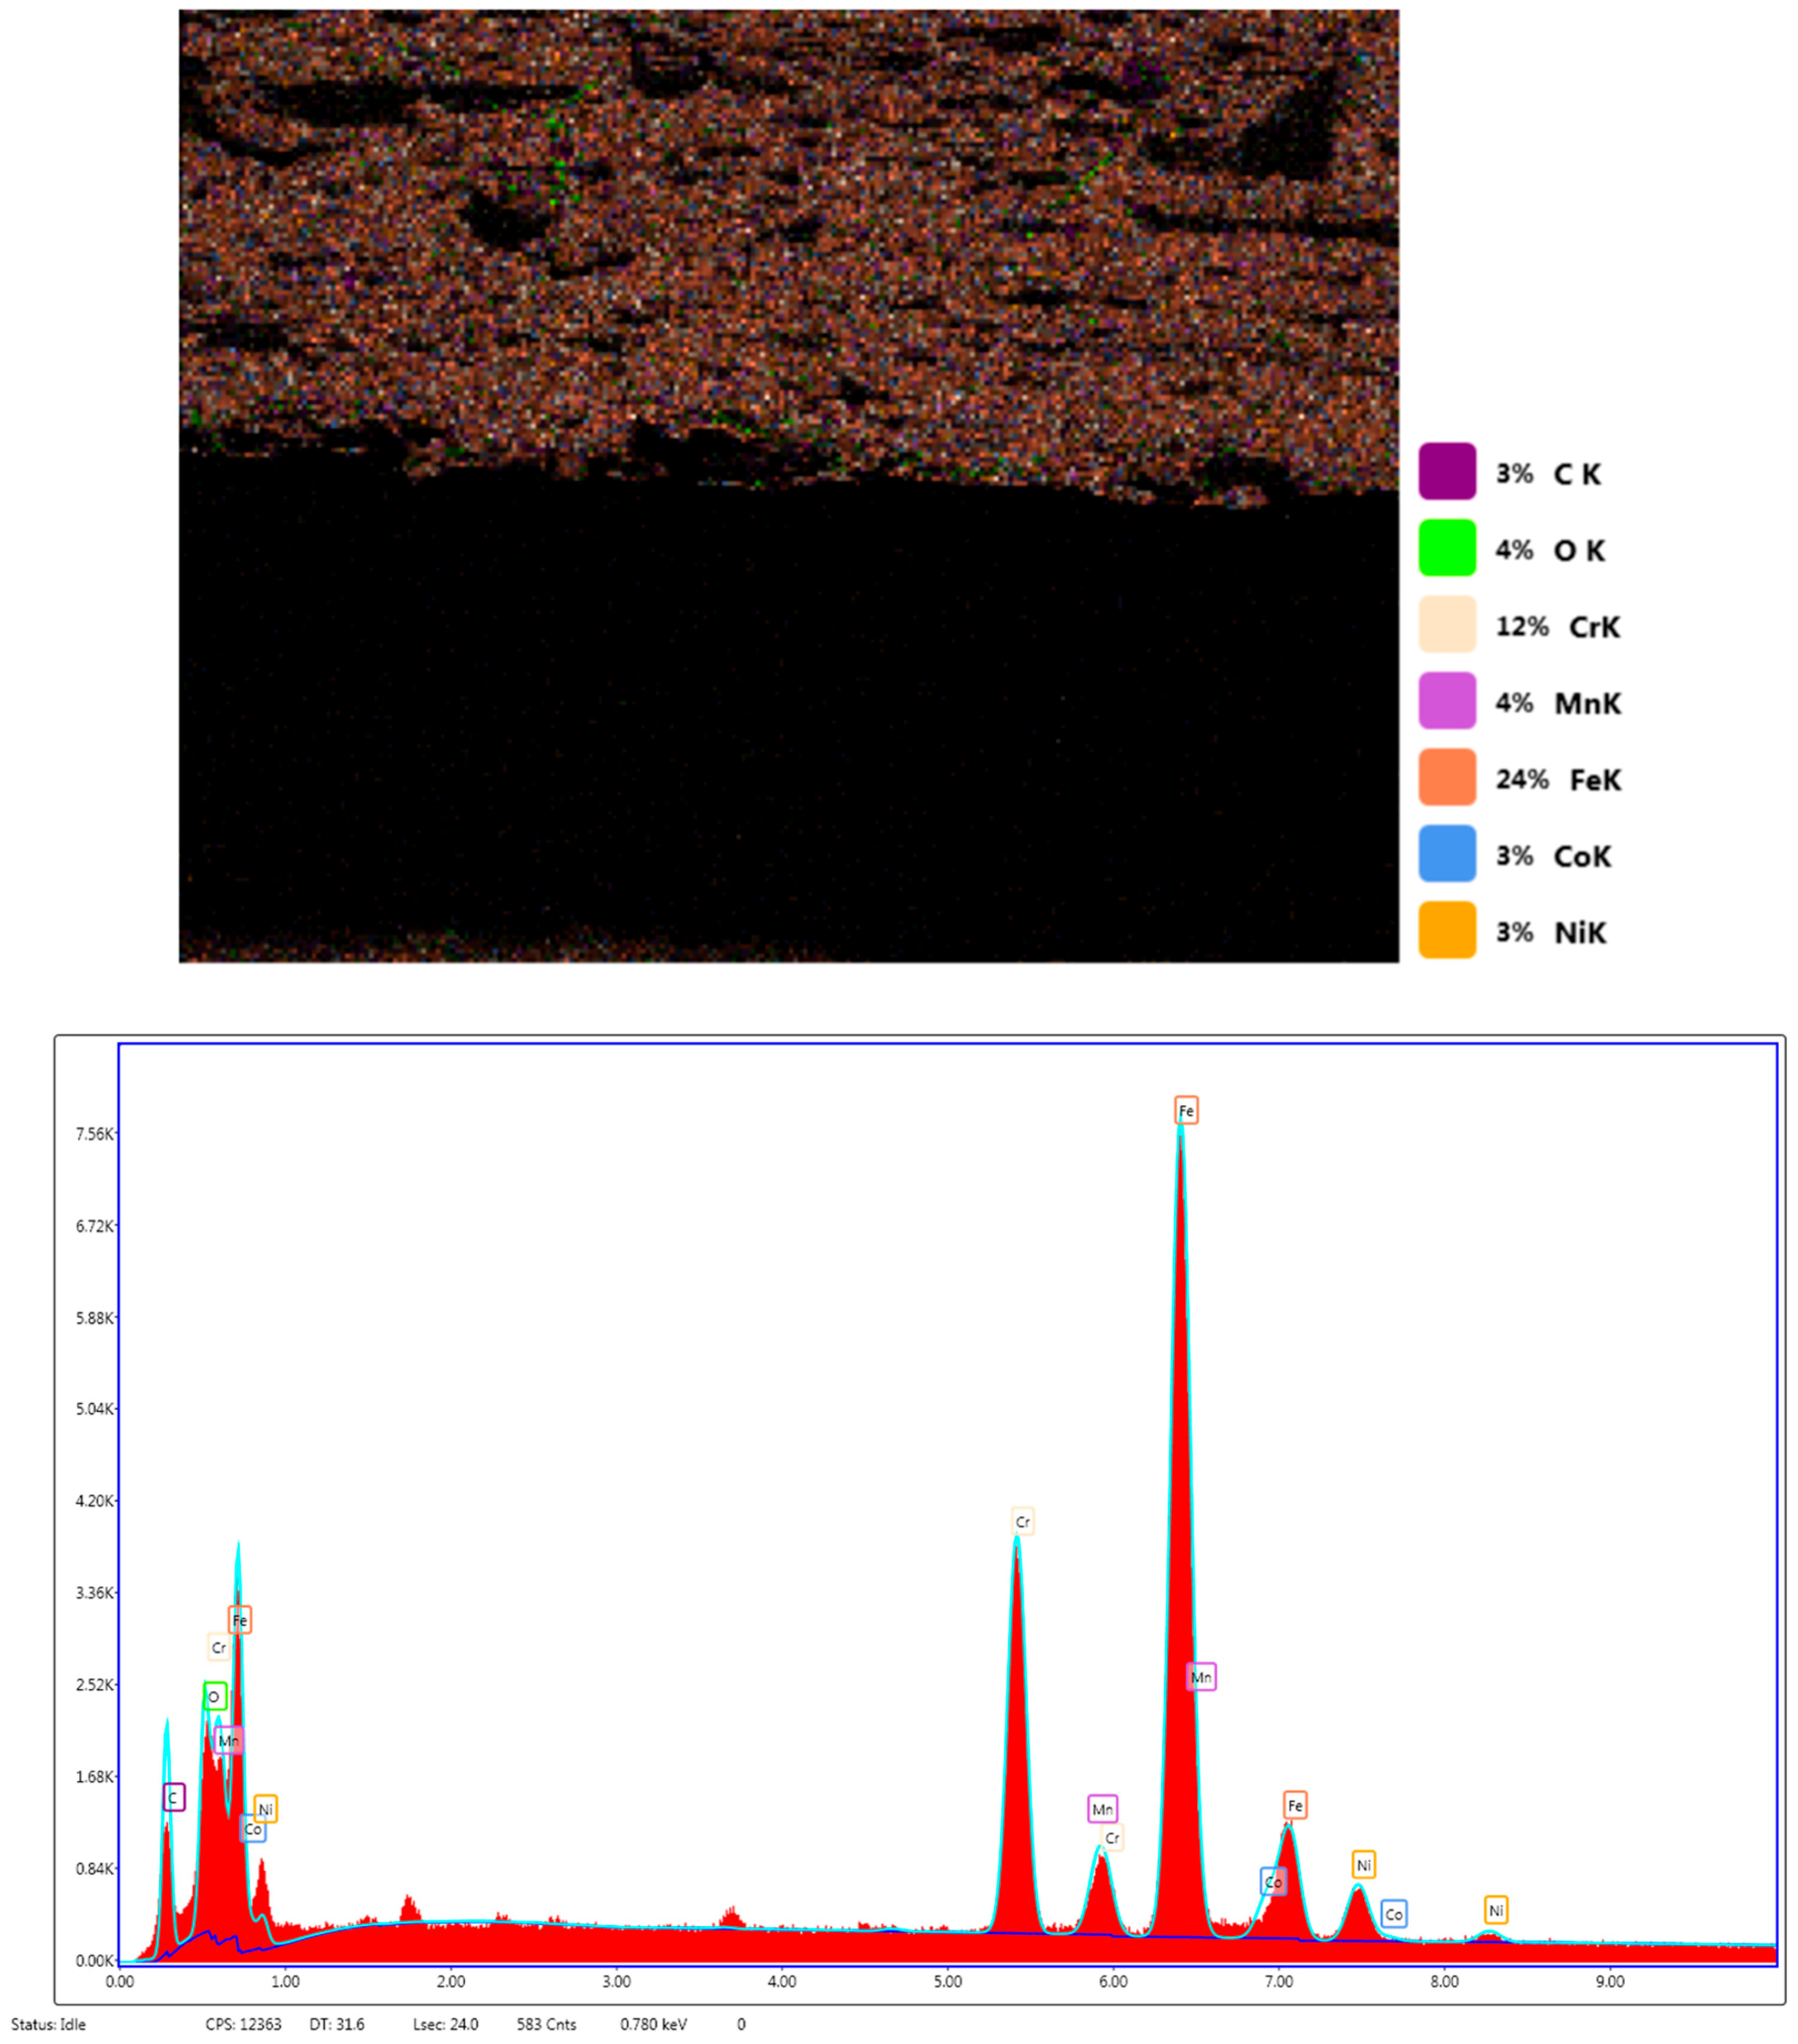
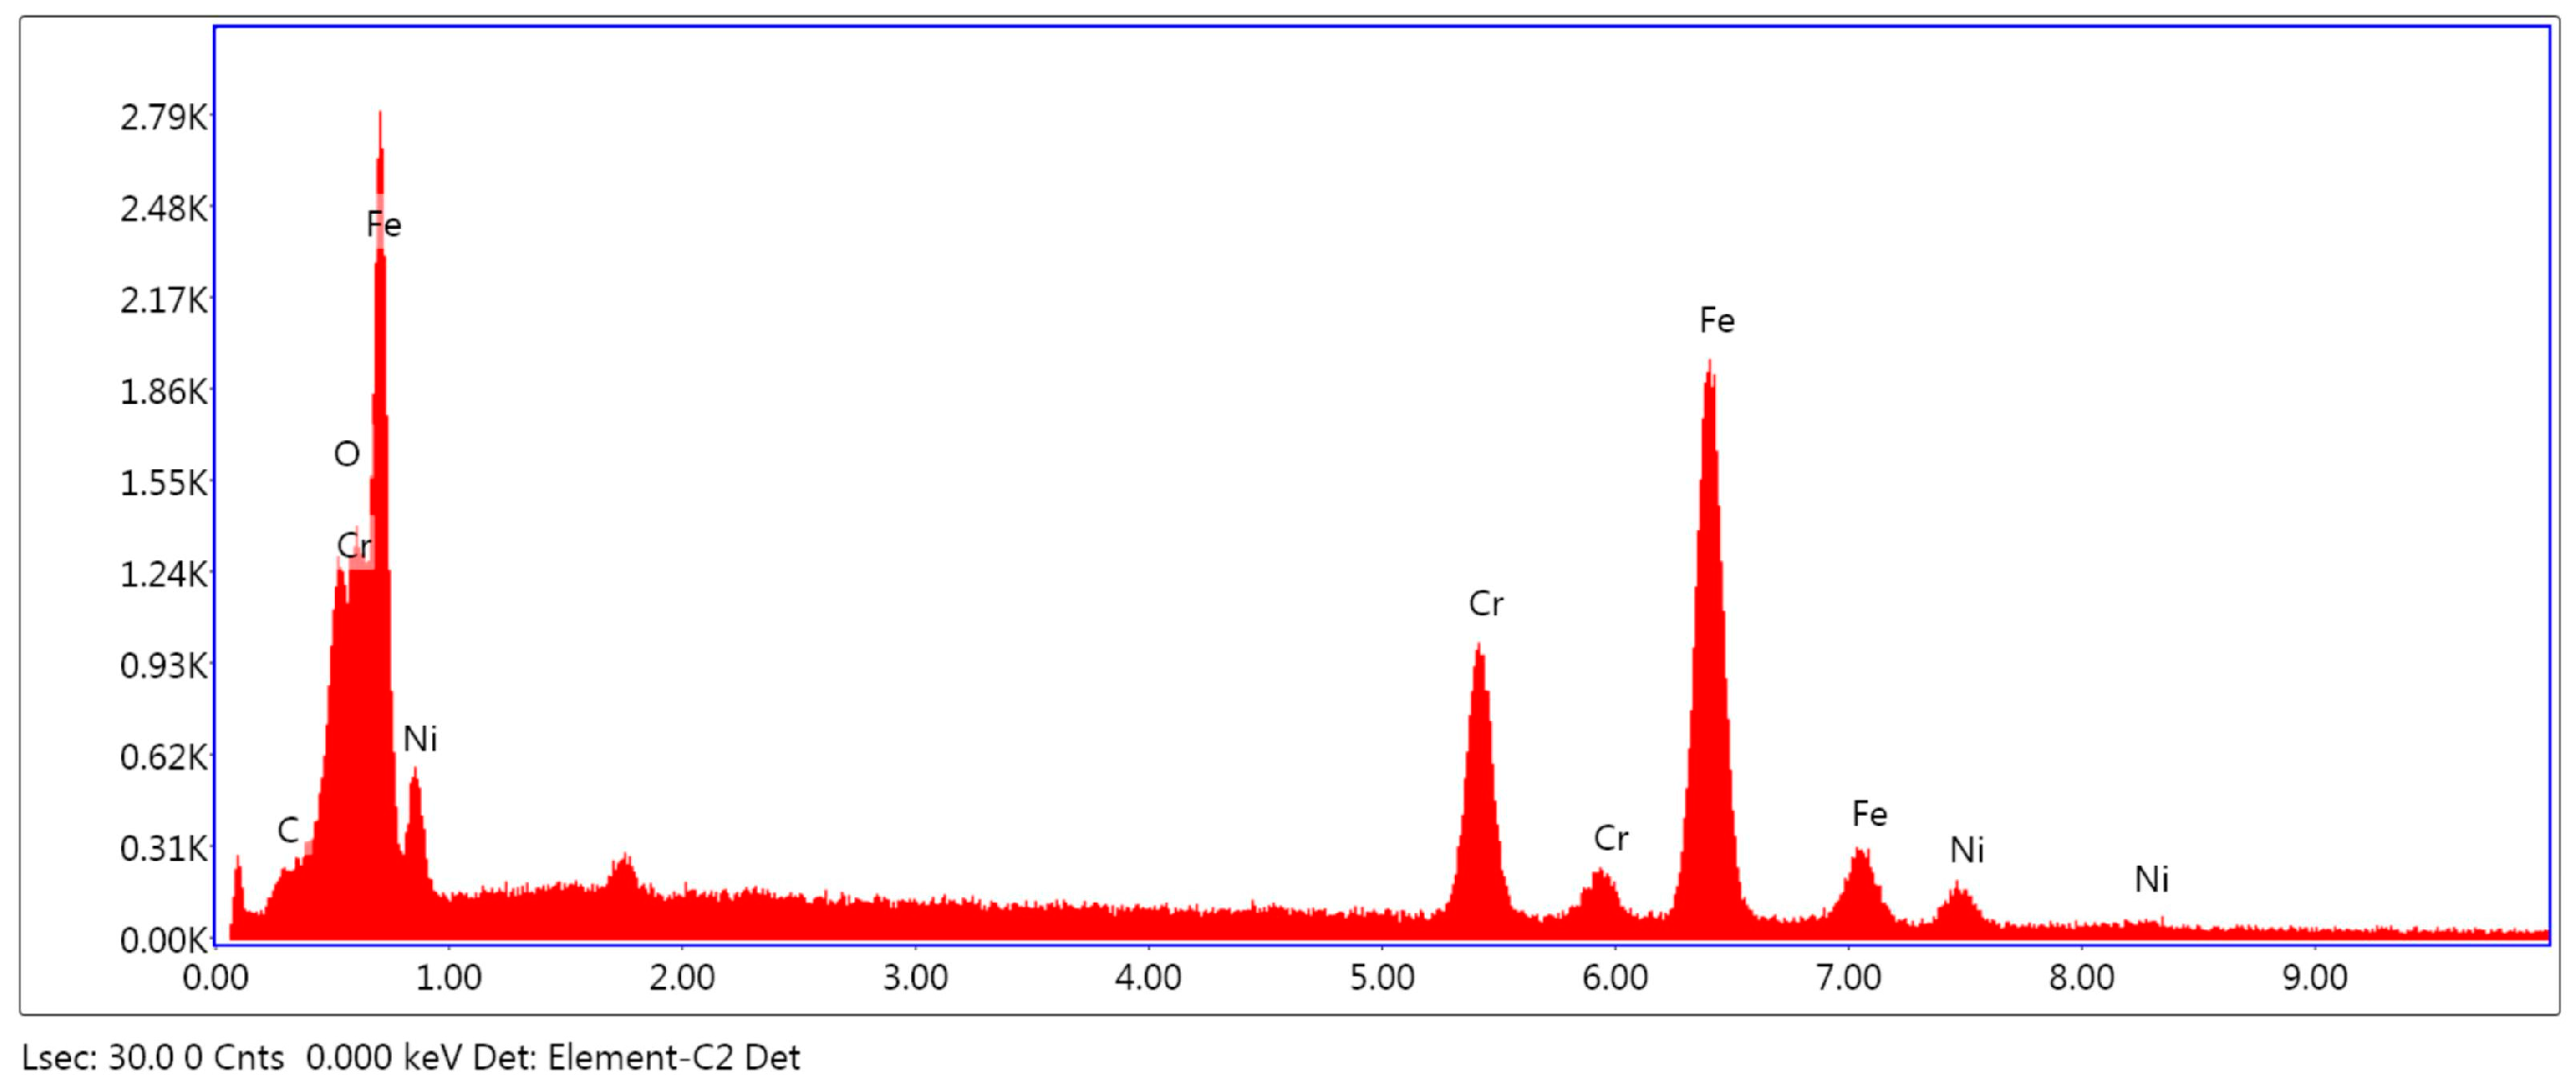
| Element | Weight % | Atomic % | Net Int. | Error % | Kratio | Z | R | A | F |
|---|---|---|---|---|---|---|---|---|---|
| C K | 5.72 | 20.77 | 117.24 | 10.85 | 0.0202 | 1.3170 | 0.8525 | 0.2677 | 1.0000 |
| O K | 2.53 | 6.90 | 148.64 | 11.45 | 0.0168 | 1.2605 | 0.8775 | 0.5259 | 1.0000 |
| Cr K | 17.37 | 14.57 | 421.19 | 4.46 | 0.2045 | 0.9726 | 1.0013 | 0.9964 | 1.2145 |
| Fe K | 66.70 | 52.07 | 915.48 | 3.39 | 0.6566 | 0.9667 | 1.0094 | 0.9841 | 1.0348 |
| Ni K | 7.67 | 5.69 | 67.14 | 12.08 | 0.0738 | 0.9751 | 1.0145 | 0.9501 | 1.0383 |
| Formula | Units | Equation Number |
|---|---|---|
| Rolfe–Novak–Barson [()2 = 0.64 ( − 0.01)] | Mpa , Mpa, J | (2) |
| Welding Research Council (WRC) 265 [()2 = 0.54 ( − 0.02) ] | Mpa , Mpa, J | (3) |
| Robert and Newton [KIC = 0.804 ( − 0.0098)0.5] | Mpa , Mpa, J | (4) |
| Sailors and Corten [KIC = 14.6 ()0.50] | Mpa , Mpa, J | (5) |
| Marandet and Sanz [KIC = 19 ()0.50] | Mpa , Mpa, J | (6) |
| Materials Standard Institution, Stockholm INSTA [KIC = 12 ] | Mpa , J | (7) |
| Formula | FZ | HTHAZ | LTHAZ | UBM | ||||
|---|---|---|---|---|---|---|---|---|
| KIC | JIC | KIC | JIC | KIC | JIC | KIC | JIC | |
| Rolfe–Novak–Barson | 185.750 | 172.516 | 133.101 | 88.58 | 121.763 | 74.132 | 116.248 | 67.568 |
| Welding Research Council (WRC) 265 | 169.889 | 144.312 | 121.236 | 73.491 | 110.725 | 61.301 | 105.605 | 55.763 |
| Robert and Newton | 174.275 | 151.859 | 89.497 | 40.049 | 74.905 | 28.054 | 68.275 | 23.308 |
| Sailors and Corten | 269.540 | 363.261 | 139.513 | 97.319 | 117.131 | 68.598 | 106.963 | 57.206 |
| Marandet and Sanz | 456.484 | 1041.89 | 236.274 | 279.128 | 198.369 | 196.752 | 181.149 | 164.076 |
| INSTA | 182.088 | 165.780 | 94.248 | 44.413 | 79.128 | 31.306 | 72.259 | 26.107 |
| Methods | FZ (kJ/m2) | HTHAZ (kJ/m2) | LTHAZ (kJ/m2) | UBM (kJ/m2) |
|---|---|---|---|---|
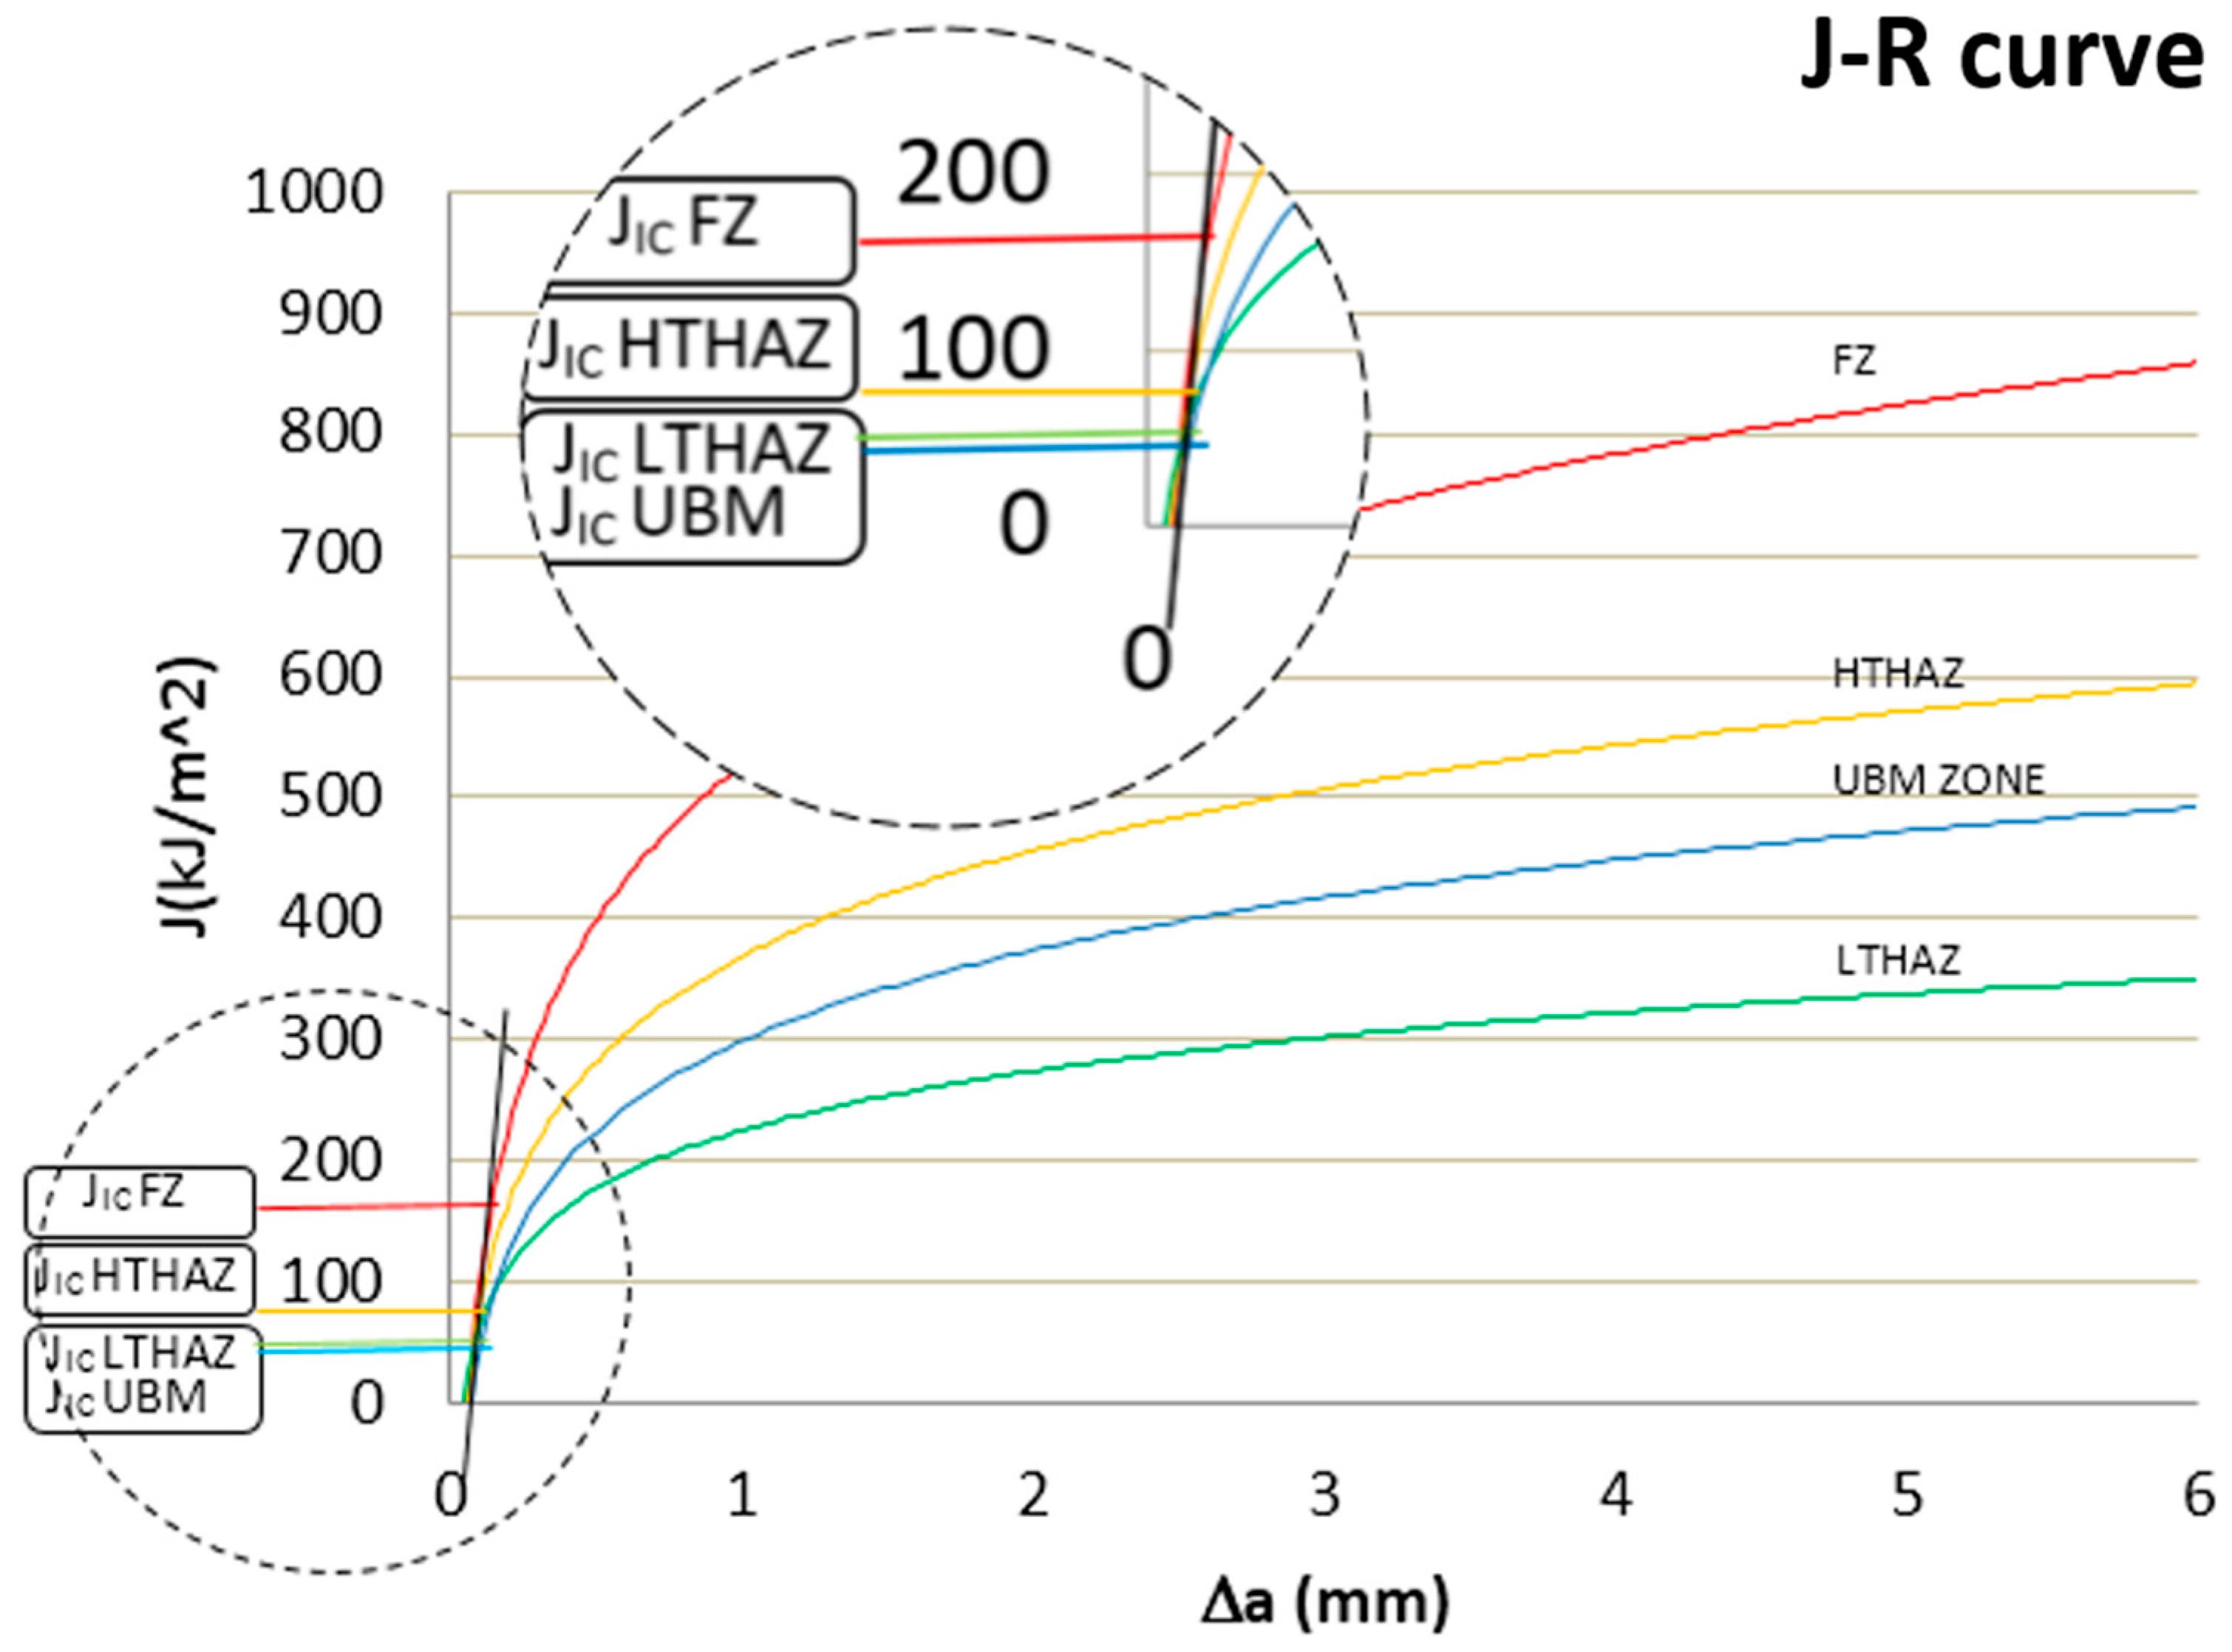
| Graphical methods | 170 | 85 | 60 | 50 |
| The most corresponding calculated values | 172.516 Rolve–Novak–Barson | 88.58 Rolve–Novak–Barson | 61.301 WRC-265 | 55.763 WRC-265 |
© 2017 by the authors. Licensee MDPI, Basel, Switzerland. This article is an open access article distributed under the terms and conditions of the Creative Commons Attribution (CC BY) license (http://creativecommons.org/licenses/by/4.0/).
Share and Cite
Riyanta, B.; Wardana, I.N.G.; Irawan, Y.S.; Agus Choiron, M. AISI 304 Welding Fracture Resistance by a Charpy Impact Test with a High Speed Sampling Rate. Metals 2017, 7, 543. https://doi.org/10.3390/met7120543
Riyanta B, Wardana ING, Irawan YS, Agus Choiron M. AISI 304 Welding Fracture Resistance by a Charpy Impact Test with a High Speed Sampling Rate. Metals. 2017; 7(12):543. https://doi.org/10.3390/met7120543
Chicago/Turabian StyleRiyanta, Bambang, I. N. G. Wardana, Yudy Surya Irawan, and Moch. Agus Choiron. 2017. "AISI 304 Welding Fracture Resistance by a Charpy Impact Test with a High Speed Sampling Rate" Metals 7, no. 12: 543. https://doi.org/10.3390/met7120543
APA StyleRiyanta, B., Wardana, I. N. G., Irawan, Y. S., & Agus Choiron, M. (2017). AISI 304 Welding Fracture Resistance by a Charpy Impact Test with a High Speed Sampling Rate. Metals, 7(12), 543. https://doi.org/10.3390/met7120543