Article

The Electrochemical Investigation of the Corrosion Rates of Welded Pipe ASTM A106 Grade B

by
Trinet Yingsamphancharoen
1,2,3,
Nakarin Srisuwan
2,4 and
Aphichart Rodchanarowan
1,2,*
1
Department of Materials Engineering, Faculty of Engineering, Kasetsart University, 50 Ngamwongwan Rd., Ladyao, Chatuchak, Bangkok 10900, Thailand
2
Center of Welding Engineering and Metallurgical Inspection, Science and Technology Research Institute, King Mongkut’s University of Technology North Bangkok, 1518, Pracharat 1 Road, Wongsawang, Bangsue, Bangkok 10800, Thailand
3
Department of Welding Engineering and Technology, College of Indrustrial Technology, King Mongkut’s University of Technology North Bangkok, 1518, Pracharat 1 Road, Wongsawang, Bangsue, Bangkok 10800, Thailand
4
Thai-French Innovation Institute, King Mongkut’s University of Technology North Bangkok, Bangsue, Bangkok 10800, Thailand
*
Author to whom correspondence should be addressed.
Metals 2016, 6(9), 207; https://doi.org/10.3390/met6090207
Submission received: 6 July 2016 / Revised: 9 August 2016 / Accepted: 15 August 2016 / Published: 31 August 2016

Abstract

:
The aim of this work was to investigate the corrosion rate of welded carbon steel pipe (ASTM (American Society for Testing and Materials) A106 Grade B) by GTAW under the currents of 60, 70, and 80 A. All welded pipes satisfied weld procedure specifications and were verified by a procedure qualification record. The property of used materials was in agreement with the ASME standard: section IX. The welded pipe was used for schematic model corrosion measurements applied in 3.5 wt % NaCl at various flow rates and analyzed by using the electrochemical technique with Tafel’s equation. The results showed the correlation between the flow rate and the corrosion rate of the pipe; the greater the flow rate, the higher corrosion rate. Moreover, the welded pipe from the welding current of 70 A exhibited higher tensile strength and corrosion resistance than those from currents of 60 and 80 A. It indicated that the welding current of 70 A produced optimum heat for the welding of A106 pipe grade B. In addition, the microstructure of the welded pipe was observed by SEM. The phase transformation and crystallite size were analyzed by XRD and Sherrer’s equation. The results suggested that the welding current could change the microstructure and phase of the welded pipe causing change in the corrosion rate.

Graphical Abstract

1. Introduction

Piping systems play a critical role in the transportation of chemicals both liquid and gas from one location to another. An A106 from American society for testing and materials standard (ASTM) which also covered in American society of mechanical engineers standard (ASME) of S/A 106 is a carbon steel pipe with excellent mechanical properties and thermal resistance. The welding method can easily produce piping for fluid systems which can support extreme conditions such as highly concentrated chemicals and high pressure steam. Many advantages of the A106 welded pipe have been previously investigated. However, a more in-depth look at the effect of corrosion on the piping is needed [1,2]. The heat transfer of the welding process has the potential to change the microstructure of the piping materials. The effects on the microstructure can be varied depending on the locality which is divided into three zones: the base zone, the heat-affected zone (HAZ), and the fusion zone. Additionally, the rate of corrosion can vary between these zones. The HAZ, which is located between the base and fusion zones, can have a high degree of sensitivity to corrosion. This increased sensitivity is due to the fact that the HAZ position exhibits more metallurgical changes, increasing the rate of corrosion [3].
The corrosion process occurs when metal is exposed to a flowing corrosive environment which combines the processes of electrochemical corrosion and mechanical wear, otherwise known as erosion-corrosion. Corrosion resistance can be defined as a synergy or combination of multiple factors. It can make a substantial contribution to the total area of the components which are exposed to corrosion. However, the effects can be magnified in highly corrosive environments such as on offshore rigs, in energy conversion systems, and in transport systems [4,5,6]. Flow-accelerated corrosion or flow-assisted corrosion (FAC) is a corrosion mechanism in which the surface layer of a metal is dissolved by fast fluid particles. The base of the metal corrodes to create an oxide which results in a loss of metal [7]. Corrosion and FAC of metal can cause a significant issue in many engineering applications [5,6,7,8,9,10,11,12,13]. Pipe corrosion may hold a specific importance for marine and offshore pipes because they are in direct contact with various solid-liquid particles such as water, sand, oil, and chemicals. Both mechanisms were proposed to explain the synergistic effect. For example, the serious problems from erosion-corrosion occurred in the seawater circulation pumps in the Tianwan nuclear power plant (China) due to the sand in the flow [14].
An electrochemical technique called the ASTM G5-14 standard (Figure 1) is an option for increasing the efficiency of corrosive investigation by means of the following four factors: (1) an anode as an electrode for electron discharges; (2) a cathode as an electrode that acts as an electron receptor; (3) electrolyte as a media solution for the movement of ions movement; (4) an electrical path for electron transfer [15]. Other parameters such as temperature, oxygen content, and acidity can influence the oxidation and reduction processes in such a way as to increase or decrease the rate of corrosion. The fluid found in the interior of the pipe can accelerate the deterioration due to wearing and corrosion simultaneously based on the electrochemical power input from potentiostat to the sample (working electrode) via helping from the terminals (counter electrode). The electrolyte solution accelerates the corrosion across the surface. The measurement of the electrical properties of the sample changing through the reference electrodes (Tafel plot) produces a line polarization known as a polarization curve.
As previously mentioned, this research is focused on studying the effects of the welding current and flow condition of the electrolyte on the corrosion of the welded pipe, carbon steel A106, by using the electrochemical technique with the condition of simulated seawater for investigative purposes.

2. Experimental Procedure

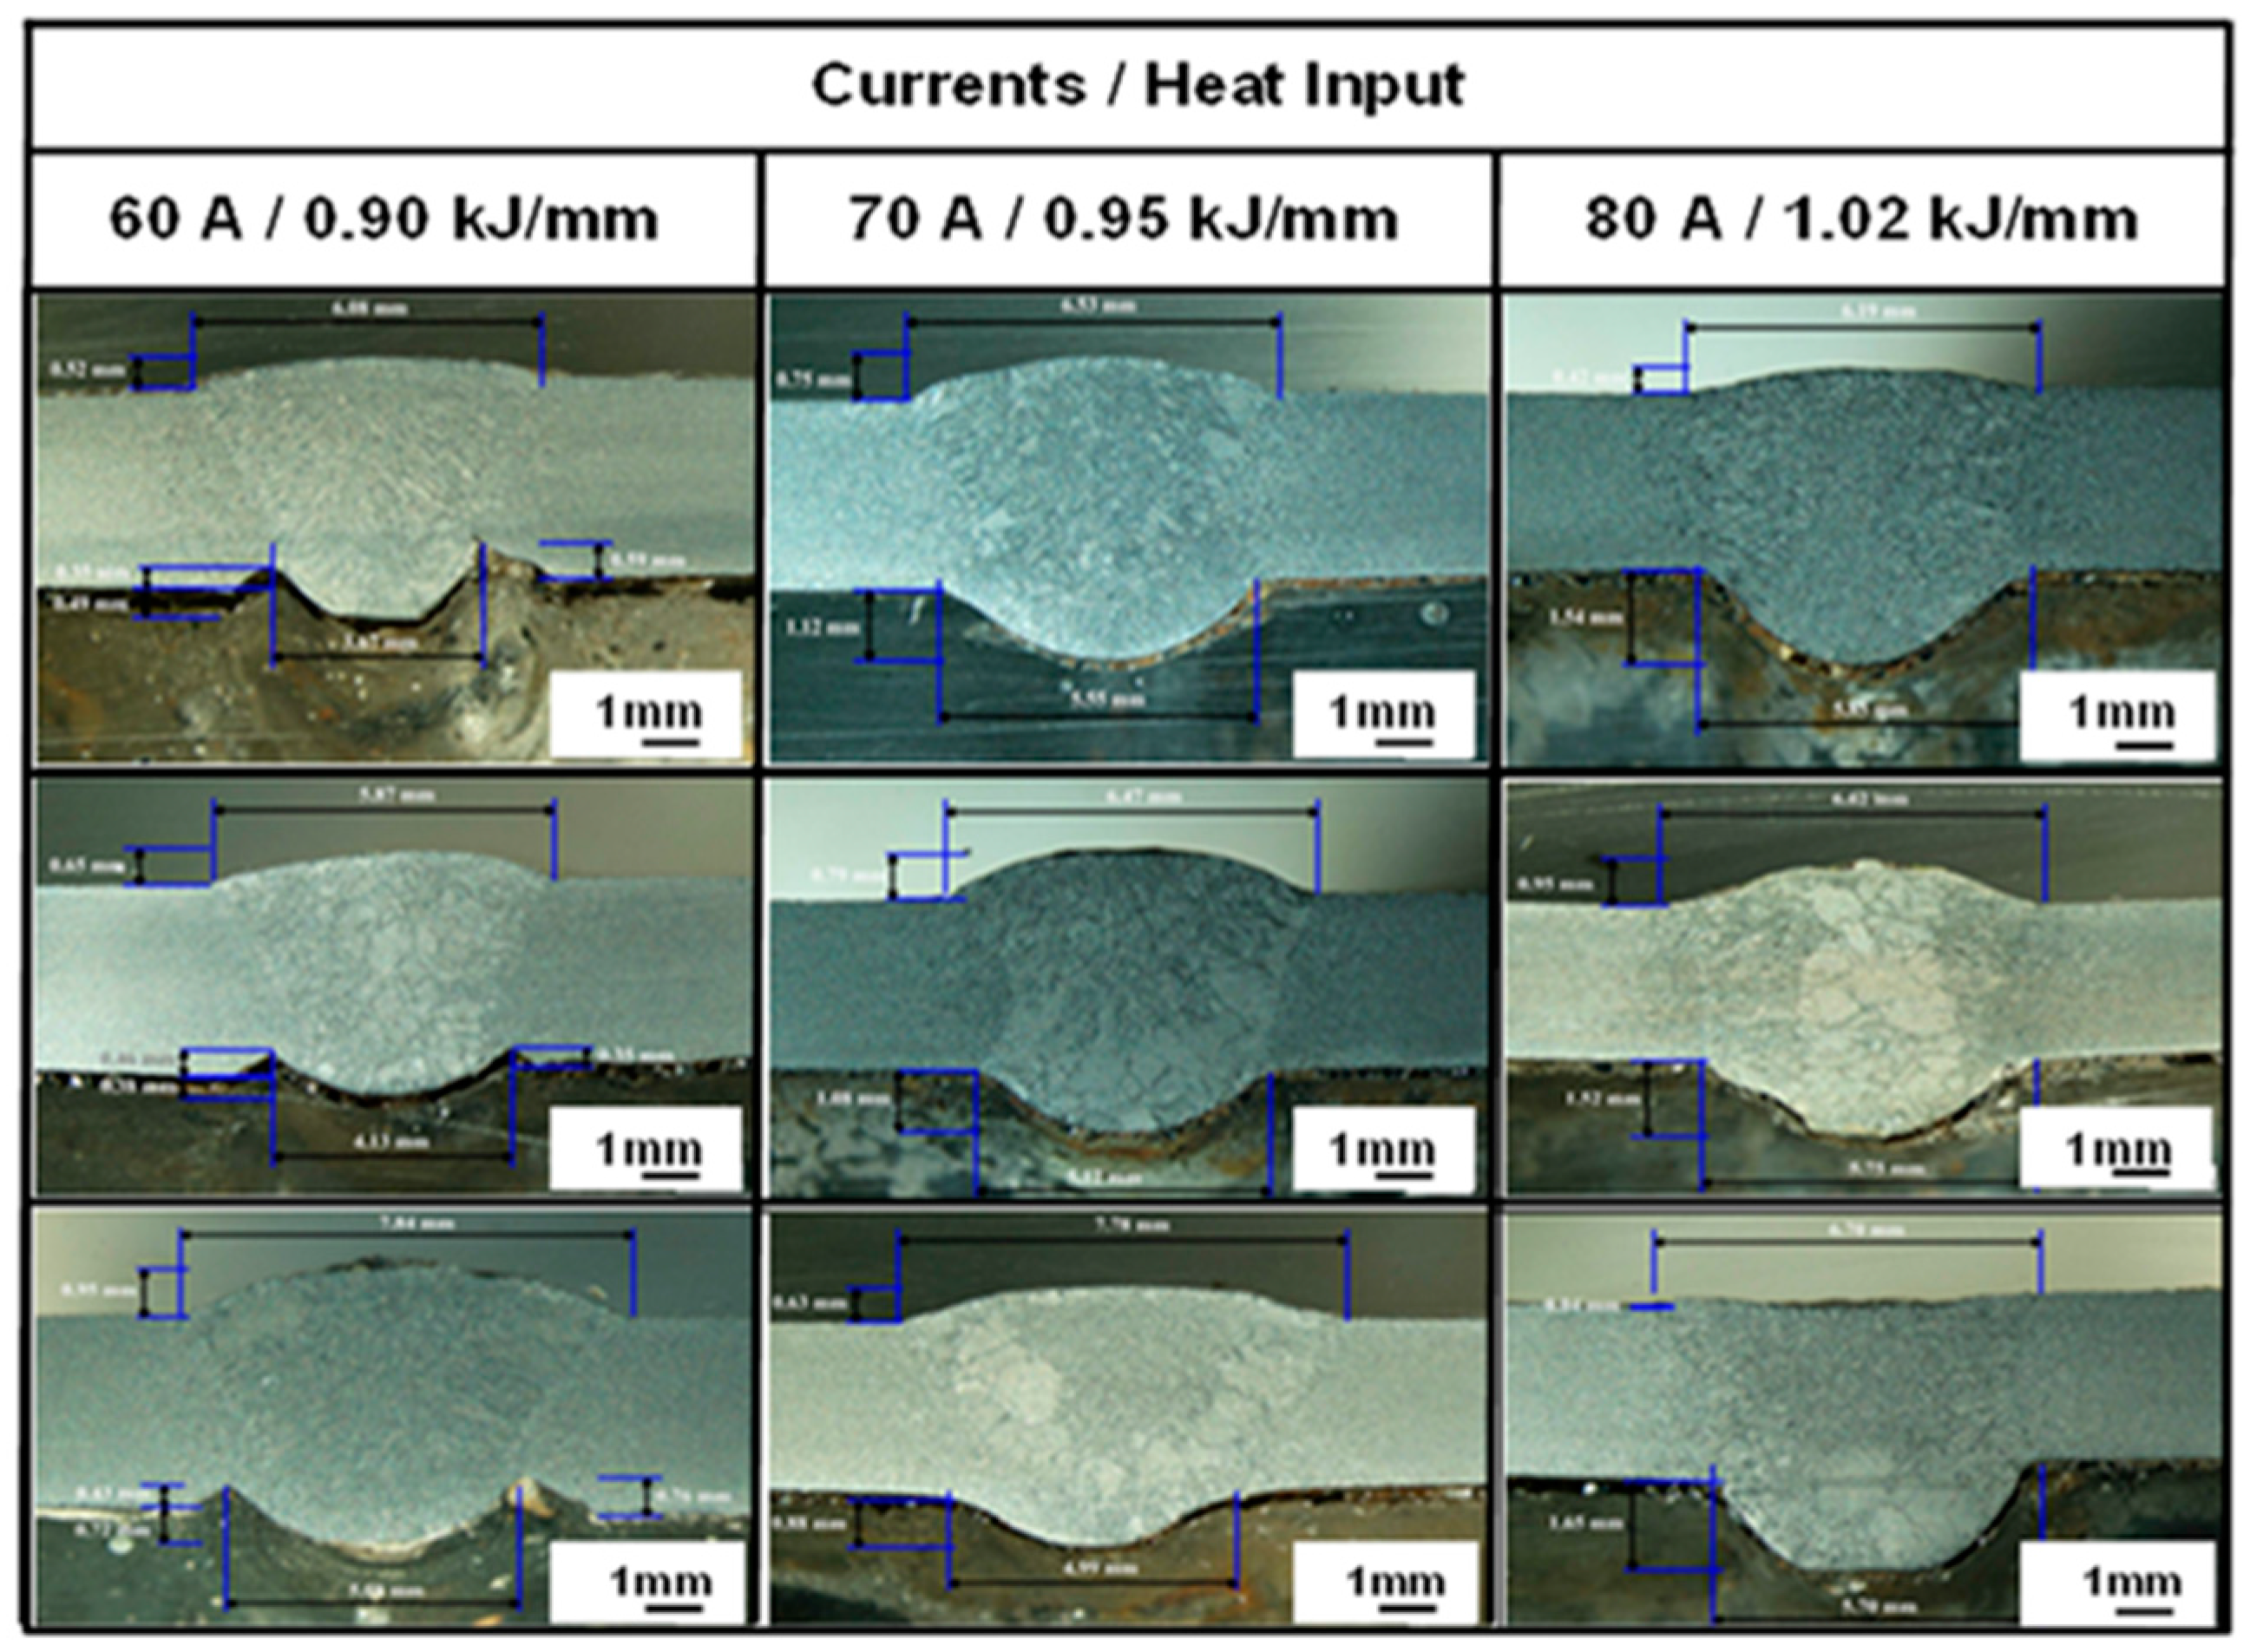
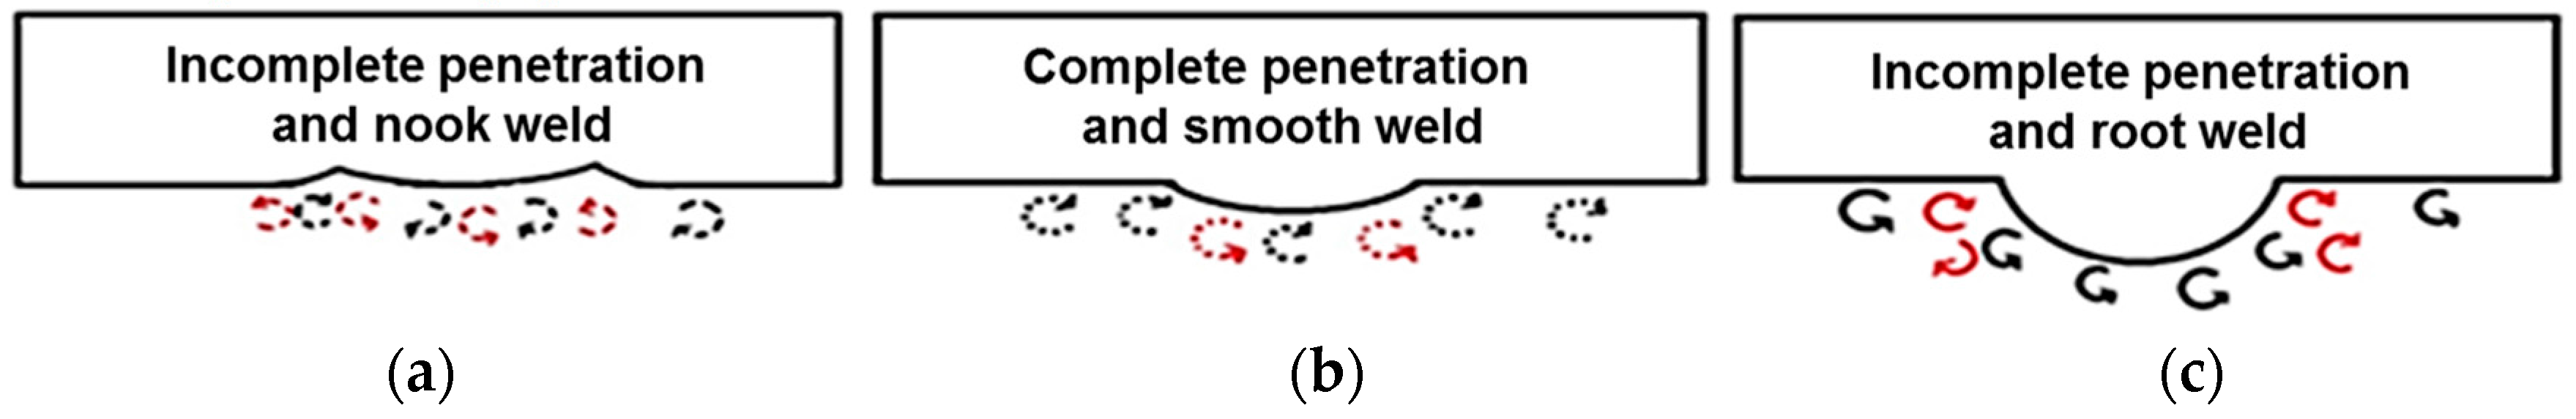
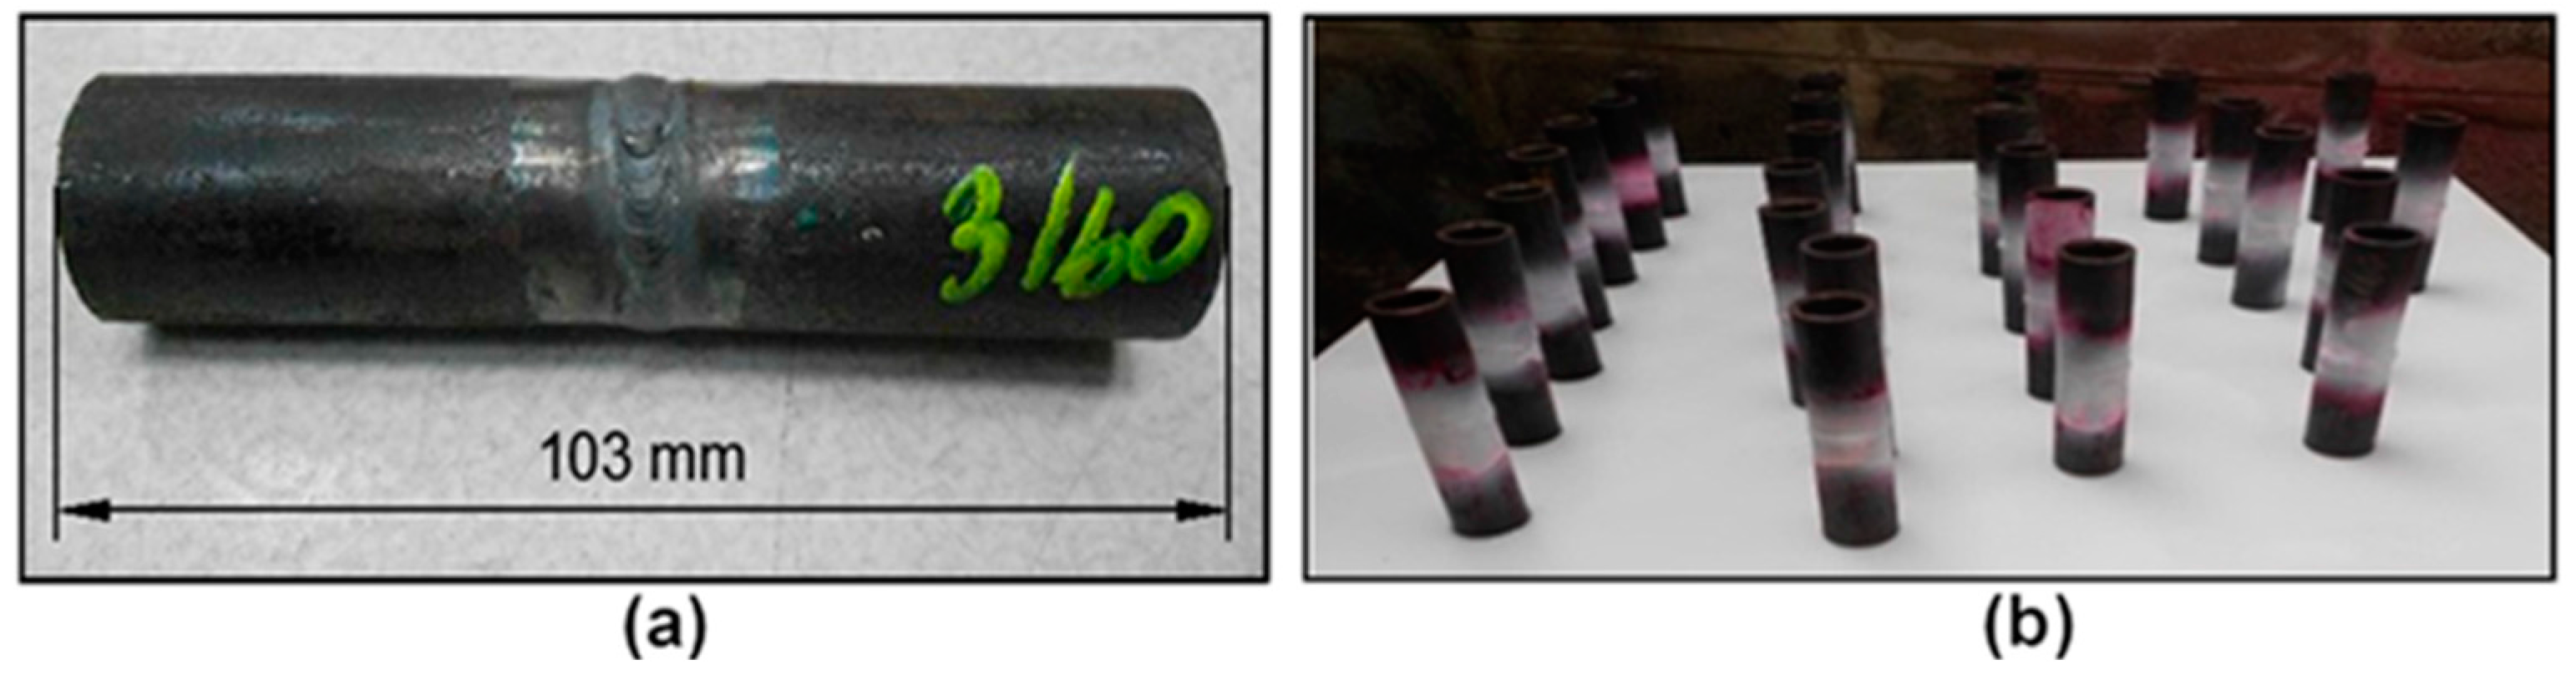
2.1. Materials Preparation and Welding
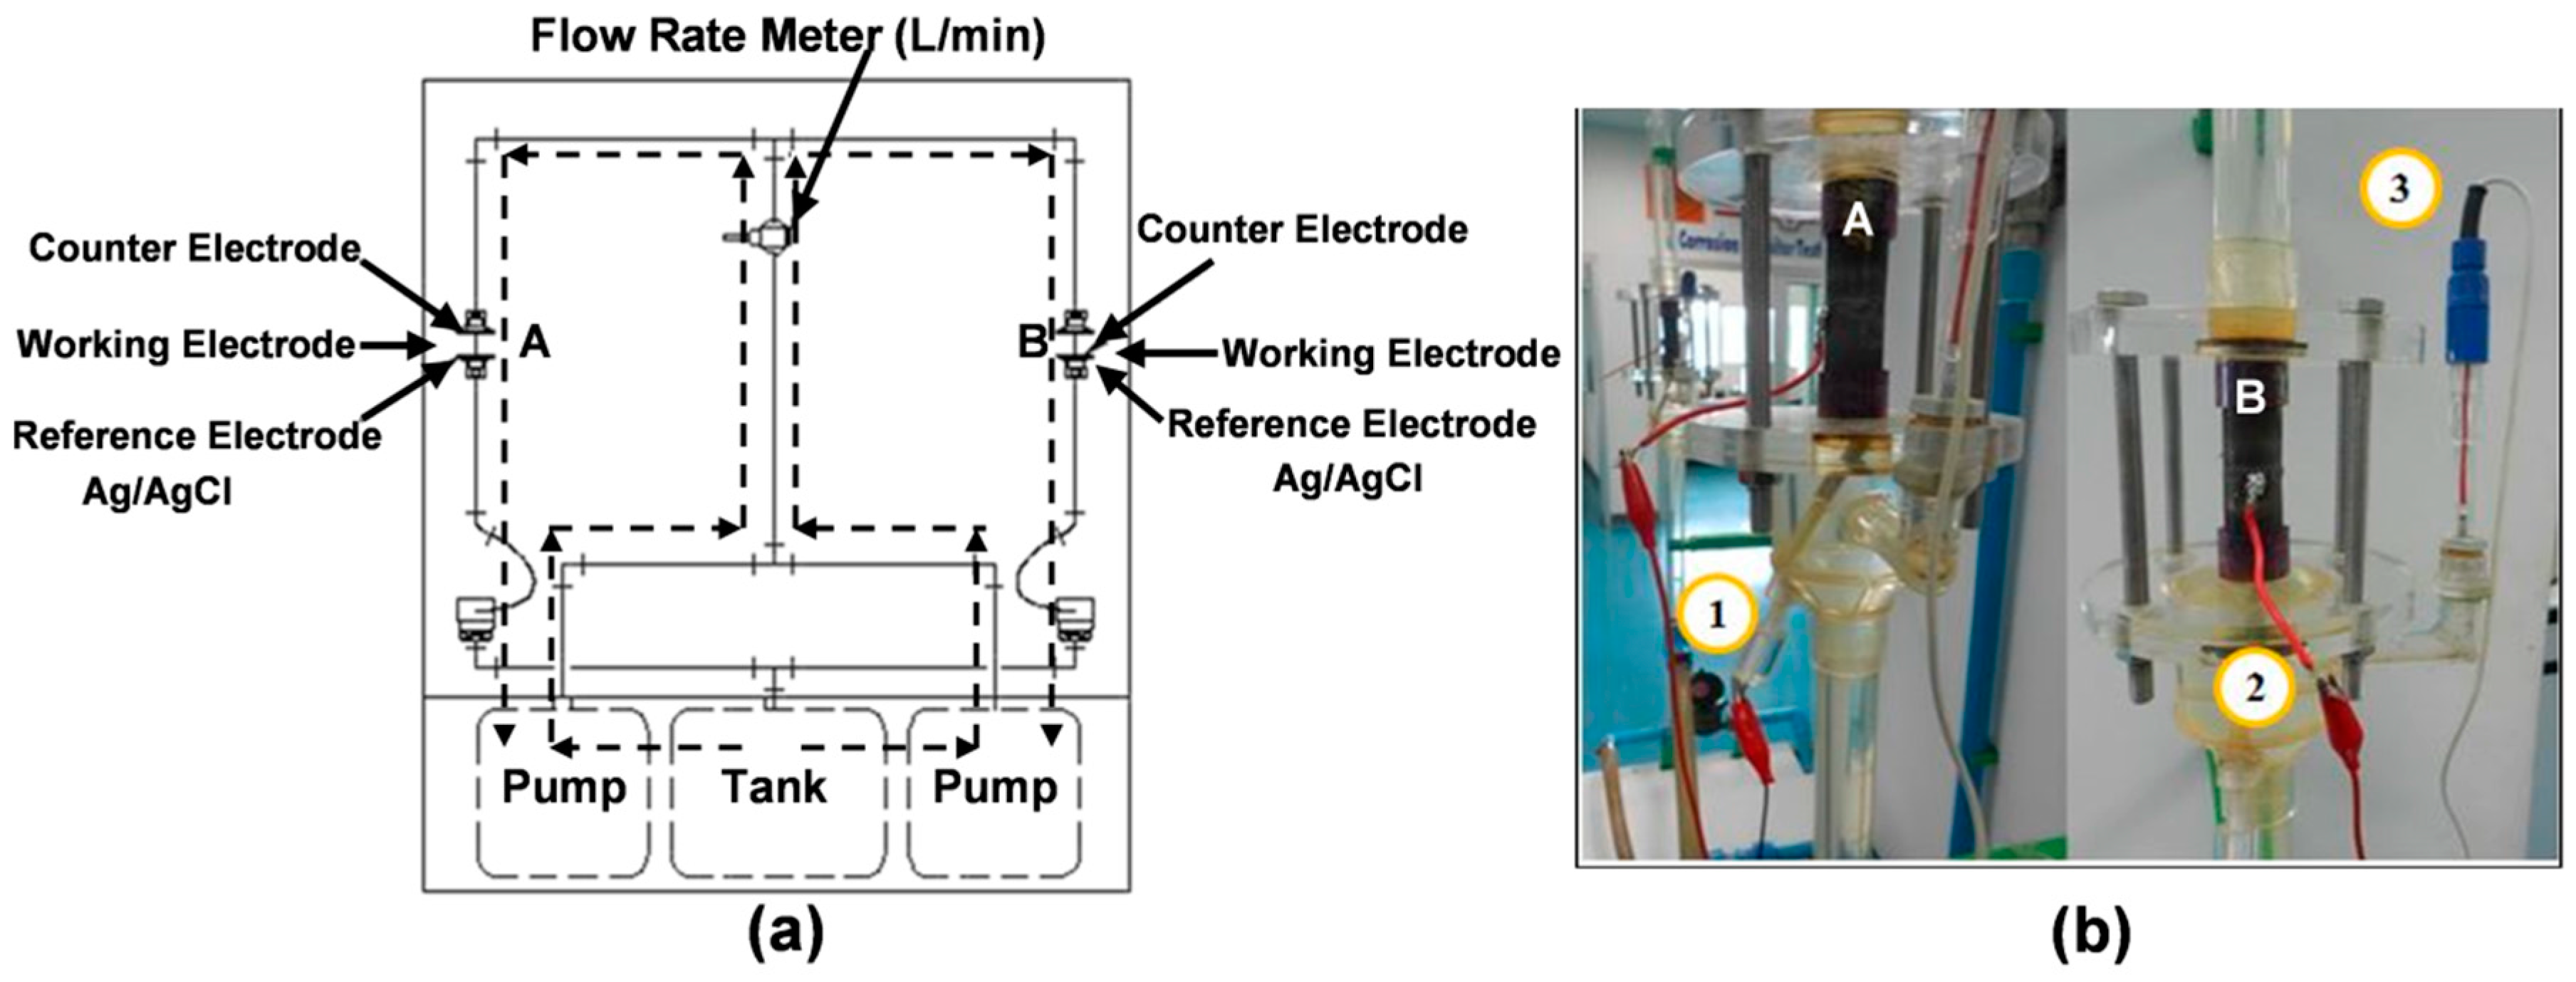
In this study, ASTM A106 grade B carbon steel pipe (OD = 21.7 mm, ID = 16.1 mm, length 103 mm) was used as a based piping specimen for further weldments [16]. The chemical composition of the ASTM A106 grade B carbon steel pipe obtained using a spectrometer is shown in Table 1. The chemical composition of the ER70S-6 solid electrodes used in electrochemical study were also obtained using a spectrometer as shown in Table 2. No traces of Ti, Zr, or Al were found in the electrode.
The welding procedure specifications (WPS) was used to weld all the piping specimens based on the ASME section IX [17]. To ensure that the WPS (supplementary materails) could produce a good weld, the welded specimens obtained from various welding currents were tested for the ultimate tensile (according to the ASME section IX) and infiltration (ASME section V article 6 [18]) for making the procedure qualification record (PQR). The piping specimens were welded using the gas tungsten arc welding (GTAW) technique [19,20]. The welding currents used in the study were 60 A (0.90 kJ/mm of heating values), 70 A (0.95 kJ/mm of heating values) and 80 A (1.02 kJ/mm of heating values).

2.2. Corrosion Test

The corrosion was tested by the standard method of ASTM G5-14 using potentiostat instrument, Autolab series PGSTAT 30 model. The probes of the working electrode (WE) and the counter electrode (CE) were platinum while the reference electrode (RE) was Ag/AgCl. For electrochemical cell installation, the potentiostat instrument was connected to the corrosion circulator as shown in Figure 1a.
The testing process can be explained as followed steps. Firstly, 3.5 wt % of sodium chloride (NaCl, Ar-grade, Fluka) solution was prepared for using as a simulated seawater with a total volume of 40 liters. The NaCl was added into the circulator tank which was connected with the electrode wires in the potentiostat. Next, the welded pipe specimens were input to the corrosion circulator at the points A and B as shown in Figure 1a,b. The testing system was turned on with a temperate controlled system set at 25 °C. The NaCl solution was pumped through both lines of the circulator with controlled flow rates of 15, 20 and 25 L/min (dash line in Figure 1a). The Reynold’s number (Re) was calculated from all of flow testing which had a result higher than 4000. It indicated that the solution flow in the pipe were turbulent [21]. After the process was completed, the Tafel plot was applied for analyzing the corrosion rate from the changing of voltage and current level of polarization curve.

2.3. Characterization and Equipment

All standard equipment penetrant testing (PT) were carried out by MIL-I-25135, ASTM-E165, UTM of Standard Instron, and emission spectrometer. For corrosion rate measurements, potentiostat (Autolab series PGSTAT 30 model) was used to obtain the polarization plots. In addition, microstructures of the welded specimens were observed using a scanning electron microscope (SEM: JEOL JSM-6310F, MA, USA). The structural phase of welded specimen was characterized by X-ray diffraction (XRD: Philips X-Pert-MPD X-ray diffractometer with CuKα radiation, Eindhoven, The Netherlands). In addition, the crystallite size of welded pipe was calculated by Scherrer’s equation [22].

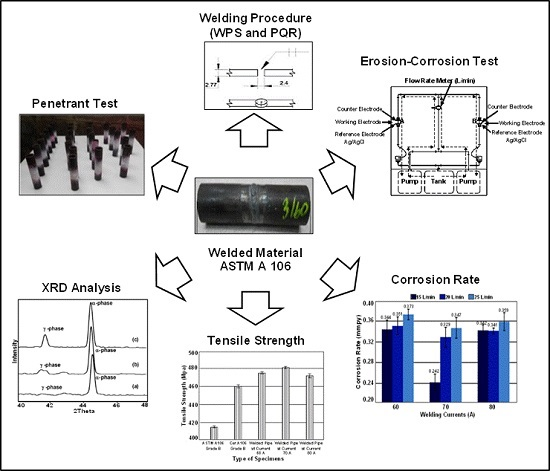
3. Results and Discussion

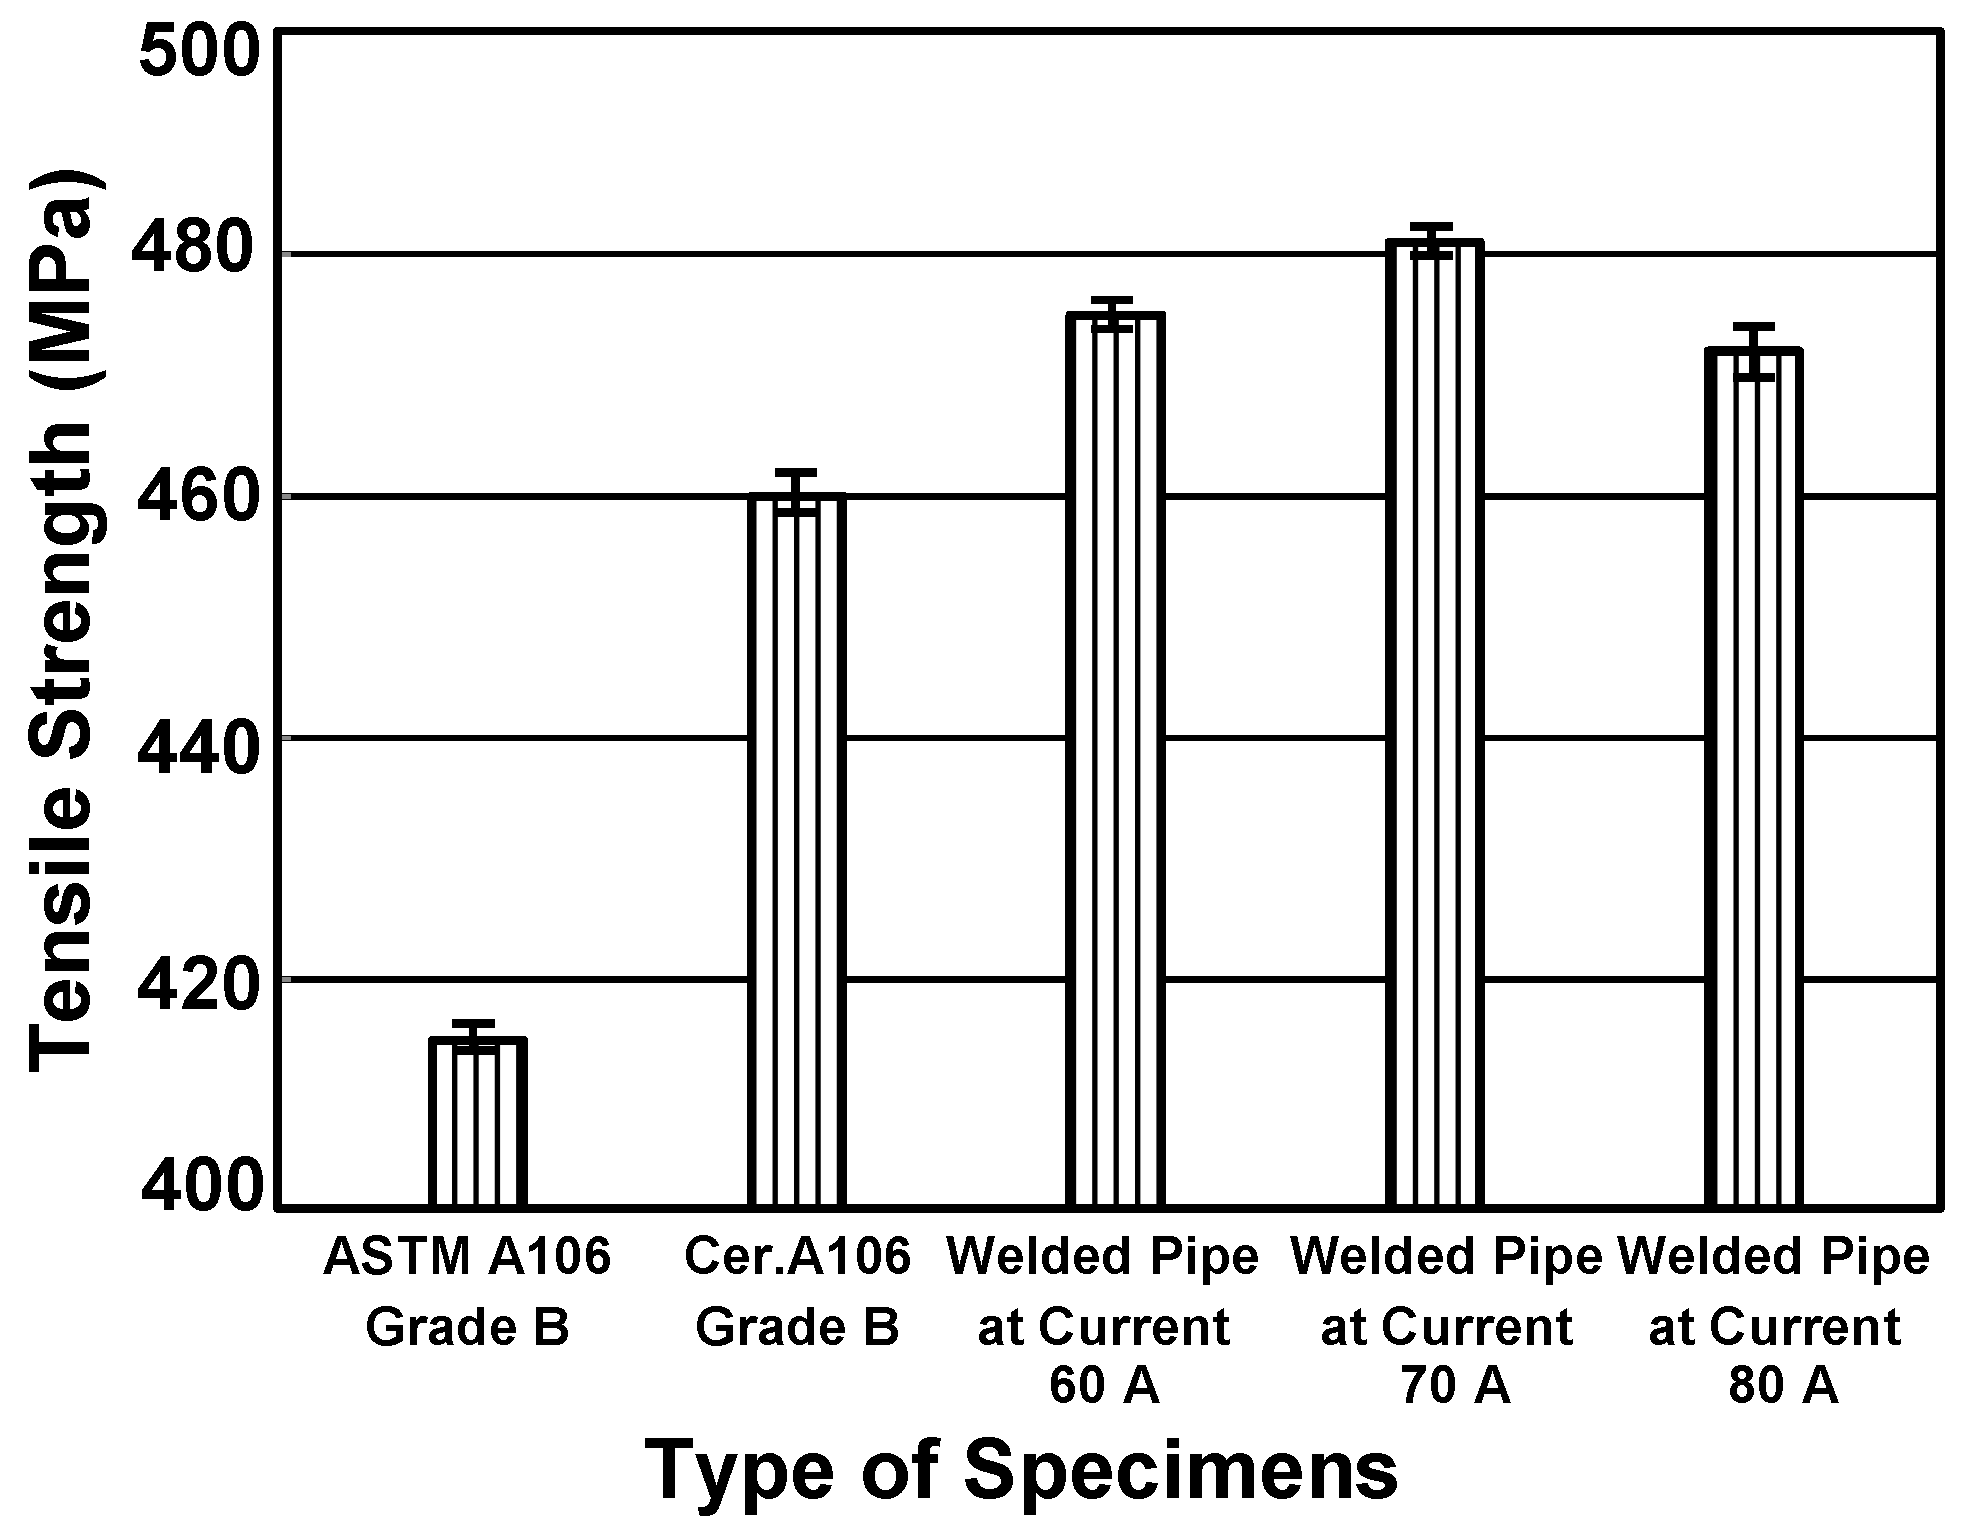
3.1. Material Verification

According to WPS for A106 welded pipe, a weld connection of a 103 mm distance was used as a welded piping specimen as shown in Figure 2a. Following the penetrant testing procedure, the surfaces of the specimens were cleaned. The work-piece was sprayed, covering all over the specimen, and left for 10 min for opening the surface penetrant. After that, the specimens (Figure 2b) were wiped down to remove excess penetrant and then wiped with a cleaning solution again to ensure that the excess penetrant near the weld area was removed.
Figure 3 showed the ultimate tensile strength of ASTM A106 grade B pipe, certified A106 grade B pipe, and welded pipes from various welding currents of 60, 70 and 80 A. The maximum loads of specimens at various welding currents of 60, 70 and 80 A were found to be 475, 481, and 472 MPa, respectively. These satisfied values were higher than those of ATSM A106 and certified A106 grade B pipe. The results also confirmed that the welding currents at 60, 70 and 80 A did not change or affect the tensile properties of the welded pipes directly.

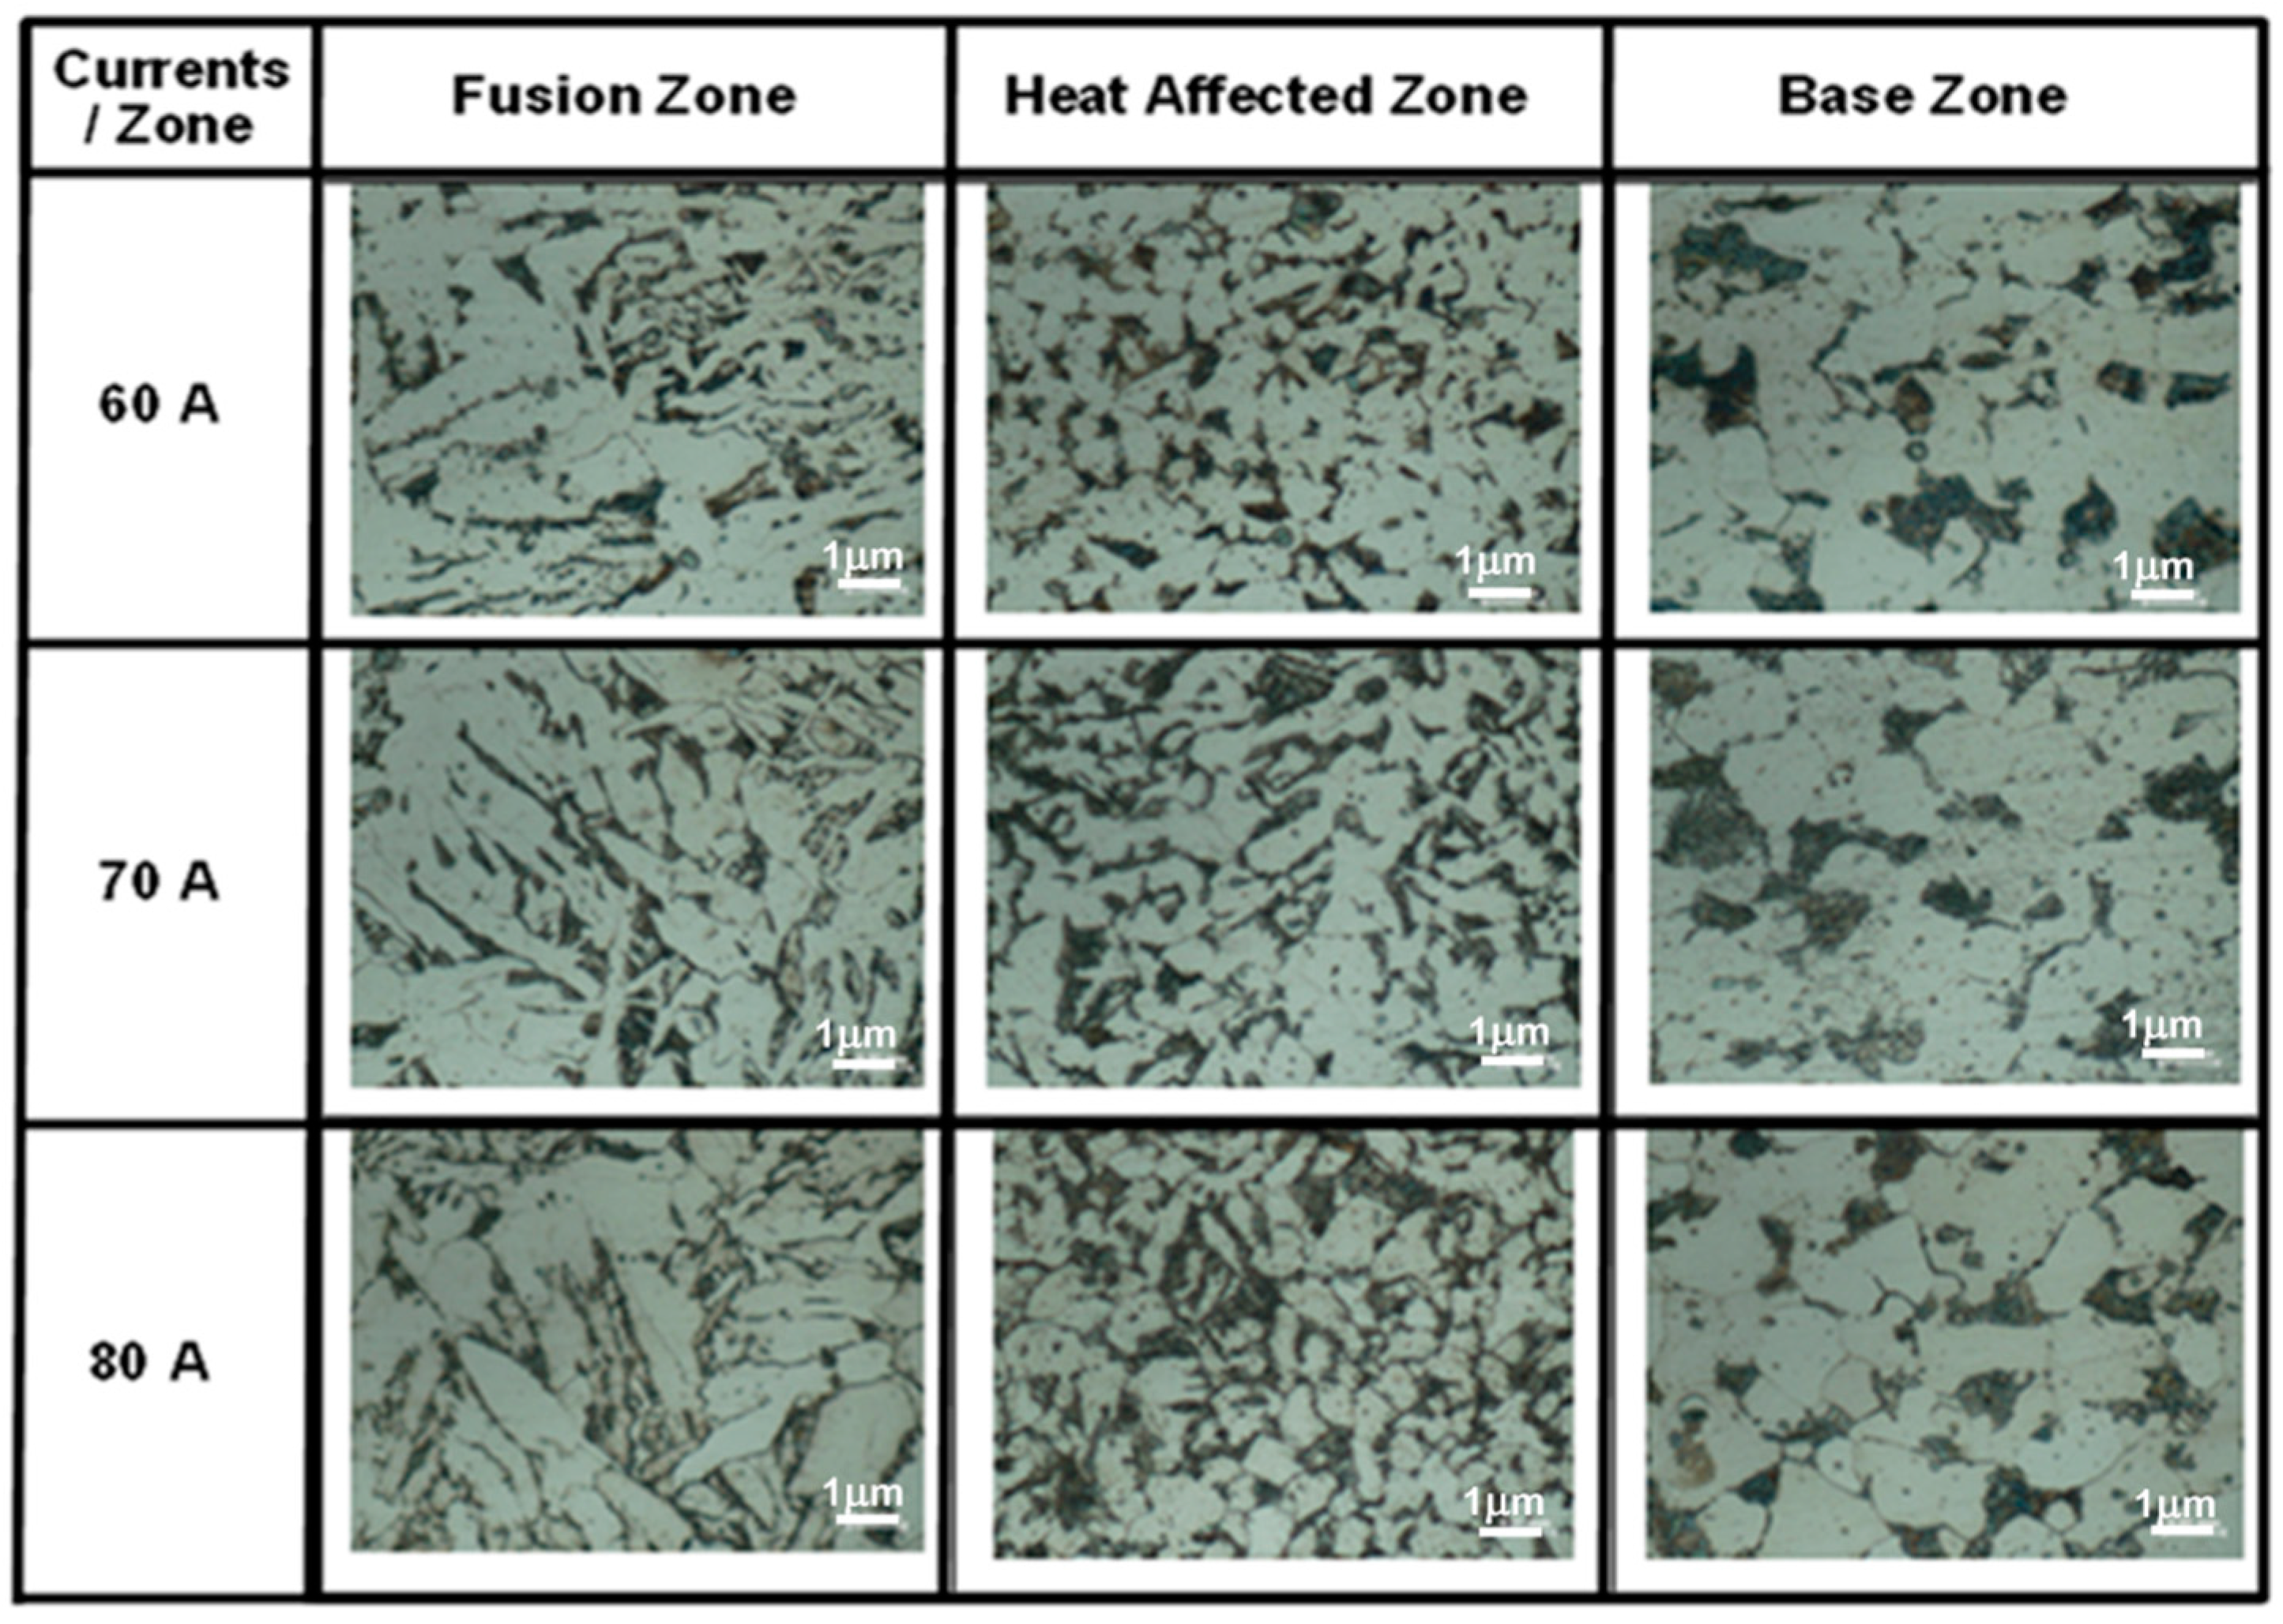
3.2. Microstructure Observation

Figure 4 illustrated the microstructures of the weld specimens in areas of the fusion zone, the heat-affected zone, and the base zone by using SEM. It was found that the heat input had an effect on the microstructure and properties of the specimens. The different heat inputs from varied welding power changed the metallurgical structure of the welded specimens which could contribute to the corrosion behavior. Generally, the welding metal fillers were selected by properties advantageous for welding. Also, the high temperature of the weld zone caused a complete melt which exhibited a decreased rate of erosion. In our case, the overall structure of carbon steel pipe, ASTM A106, was the ferrite phase (body-centered cubic, BCC; α). However, the heat-affected zone (HAZ) was found to have a combination of ferrite and austenite (face-centered cubic, FCC; γ). It made this area consist of different densities and galvanic corrosions, resulting in the potential to be corroded more readily. Considering the HAZ of the welded specimen with varied welding heat, it was found that the welding power of 70 A had a more satisfied structure of the mixed boundary phases between BCC and FCC than those from welding powers of 60 and 80 A.

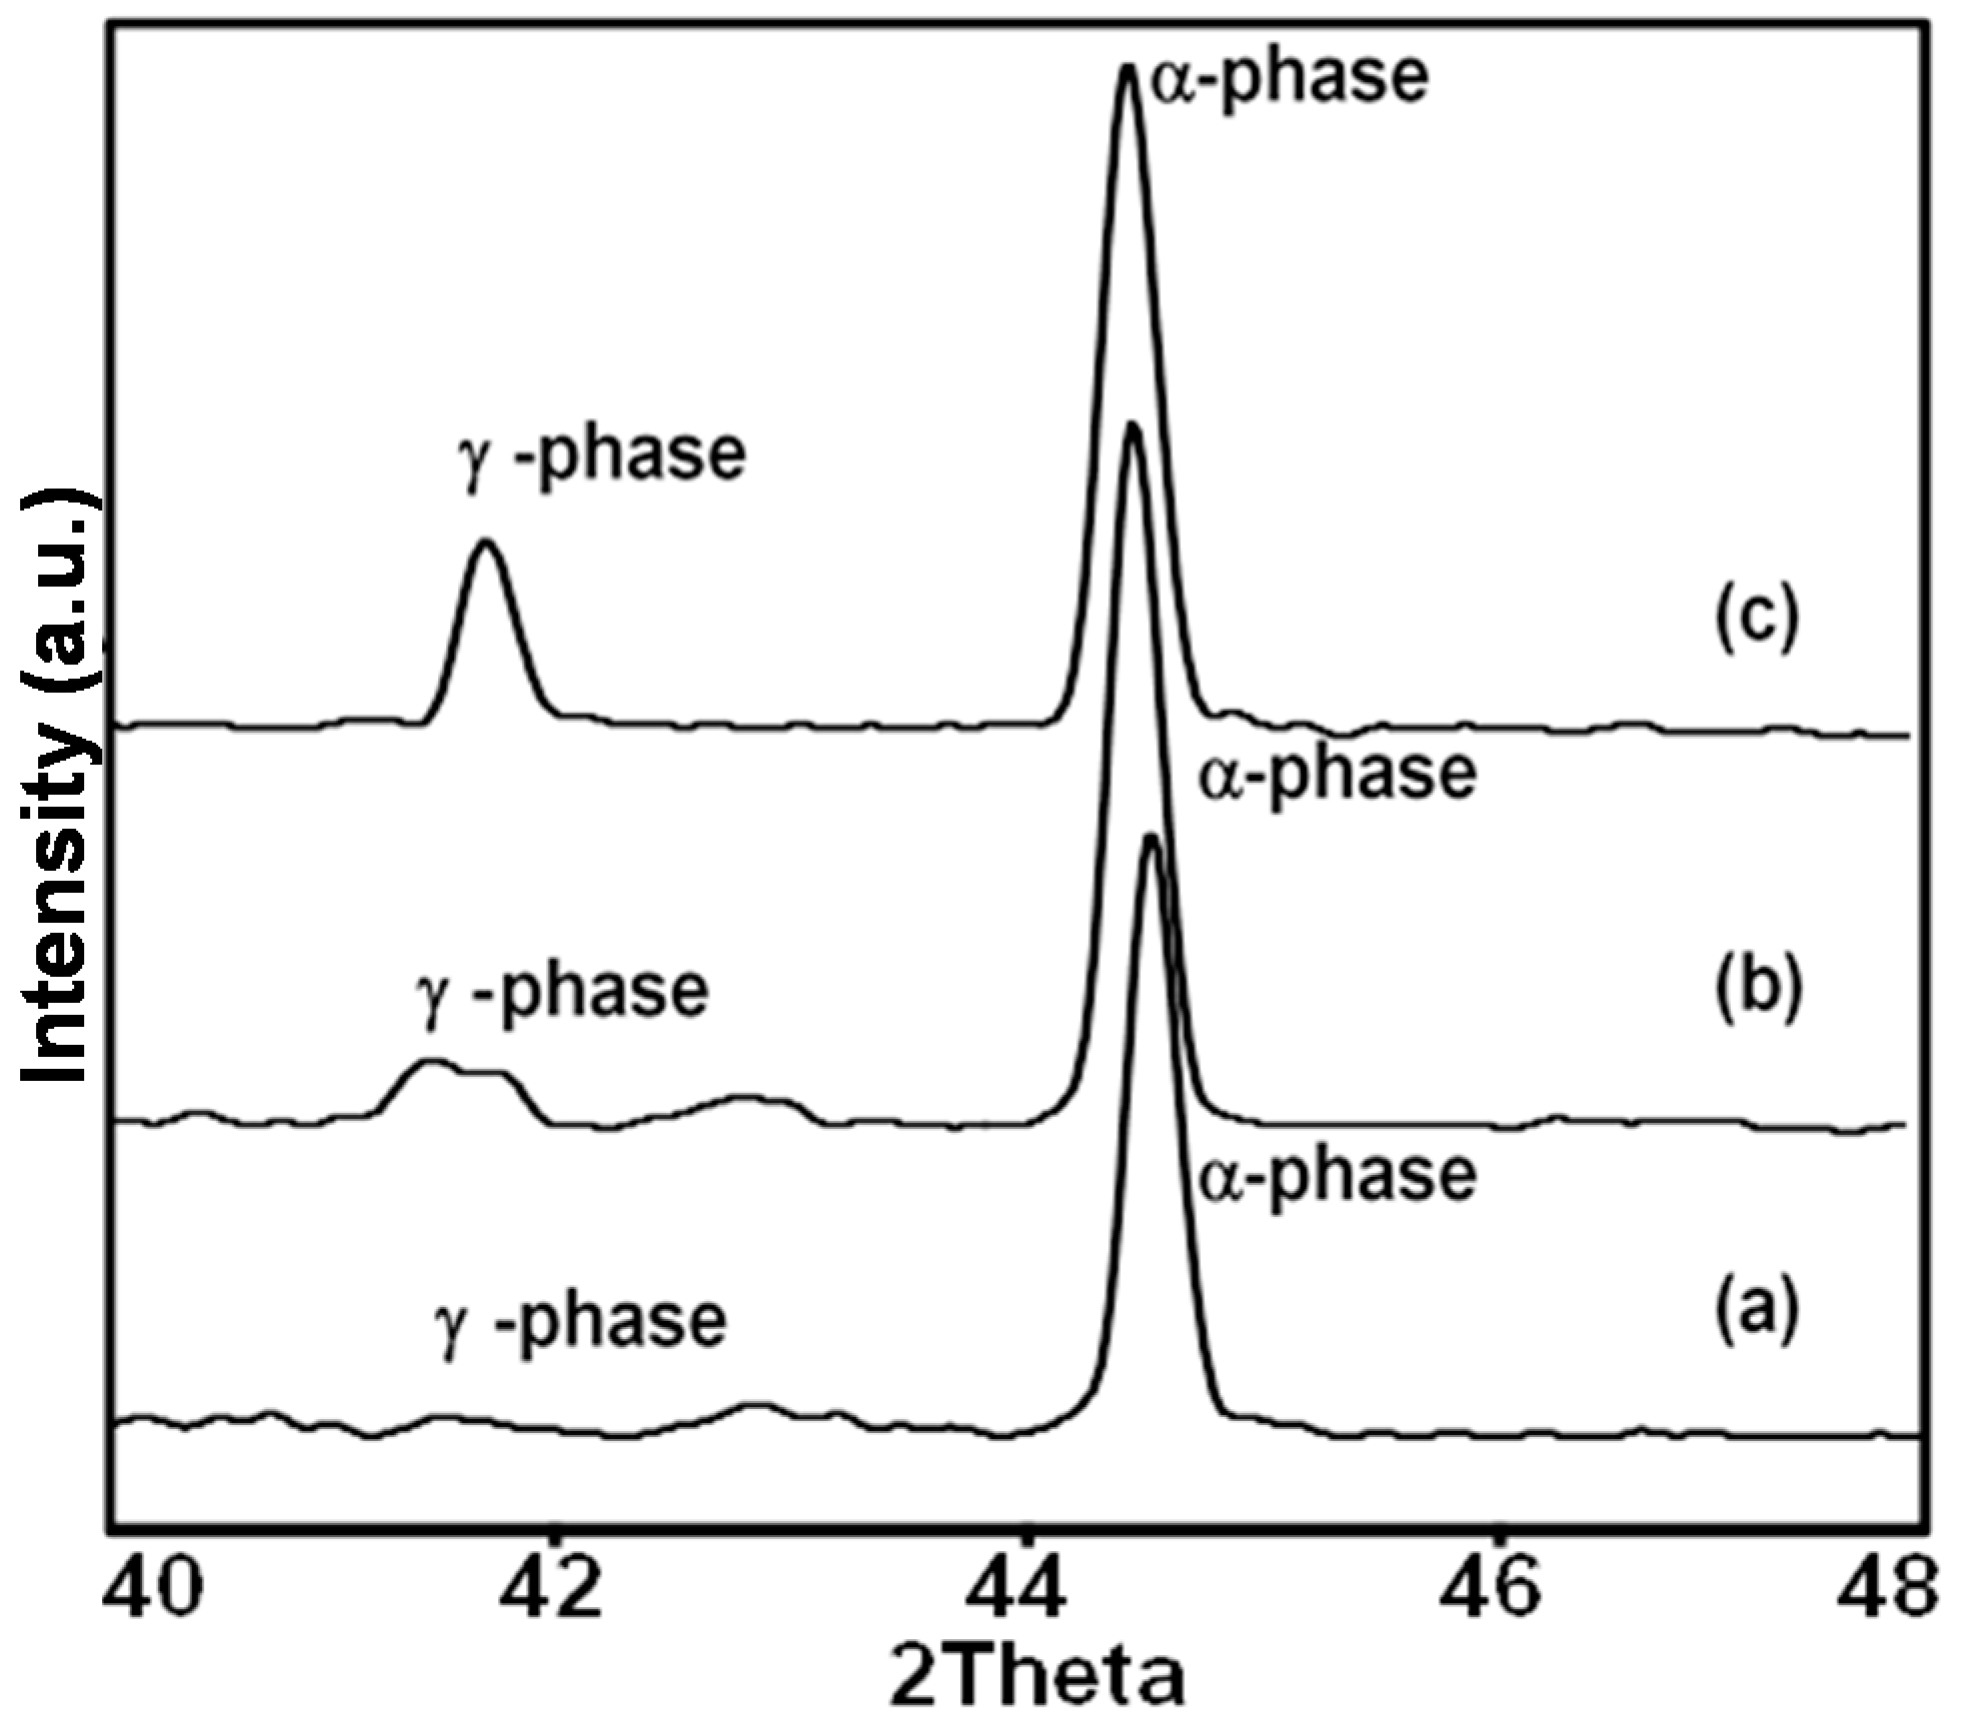
3.3. Phase Transformation Information Using XRD

The XRD pattern was used to characterize the phase transformation (α ferrite-BCC to γ austenite-FCC) that occurred in the welded pipes [23]. Figure 5 represents the XRD patterns of the welded piping specimens obtained from various welding currents (60, 70 and 80 A). The welded piping specimen from welding current 60 A (Figure 5a) displayed a major diffraction peak of the ferrite. On the other hand, the welded piping specimens obtained from welding currents 70 and 80 A clearly exhibited the mixed phases of ferrite and austenite as shown in Figure 5b,c.
The crystallite size estimated from Scherrer’s equation (Table 3) showed that the increasing heat input had no significant effects on the size of the α-phase. On the other hand, the size of the γ-phase increased when the welding current was raised. The XRD results indicated that the heating from the welding current could change the metallurgical and crystallite properties of the γ-phase which have an effect on the mechanical and corrosive properties [24]. A possible explanation was that the austenite specimens exhibited properties different than those with ferrite phase. So, the properties of the specimens at 70 and 80 A could be better than the specimens of 60 A. However, the high current makes the strong heating transfer which caused the defects from thermal shock in the structure. For these reasons, the mechanical and corrosive properties of specimens subjected to a current of 80 A became lower than that of 70 A. Accordingly, the results showed the correlation of the mechanical and corrosive properties, and, therefore, it could be concluded that the welding current at 70 A was suitable for preparing A106 welded pipe.

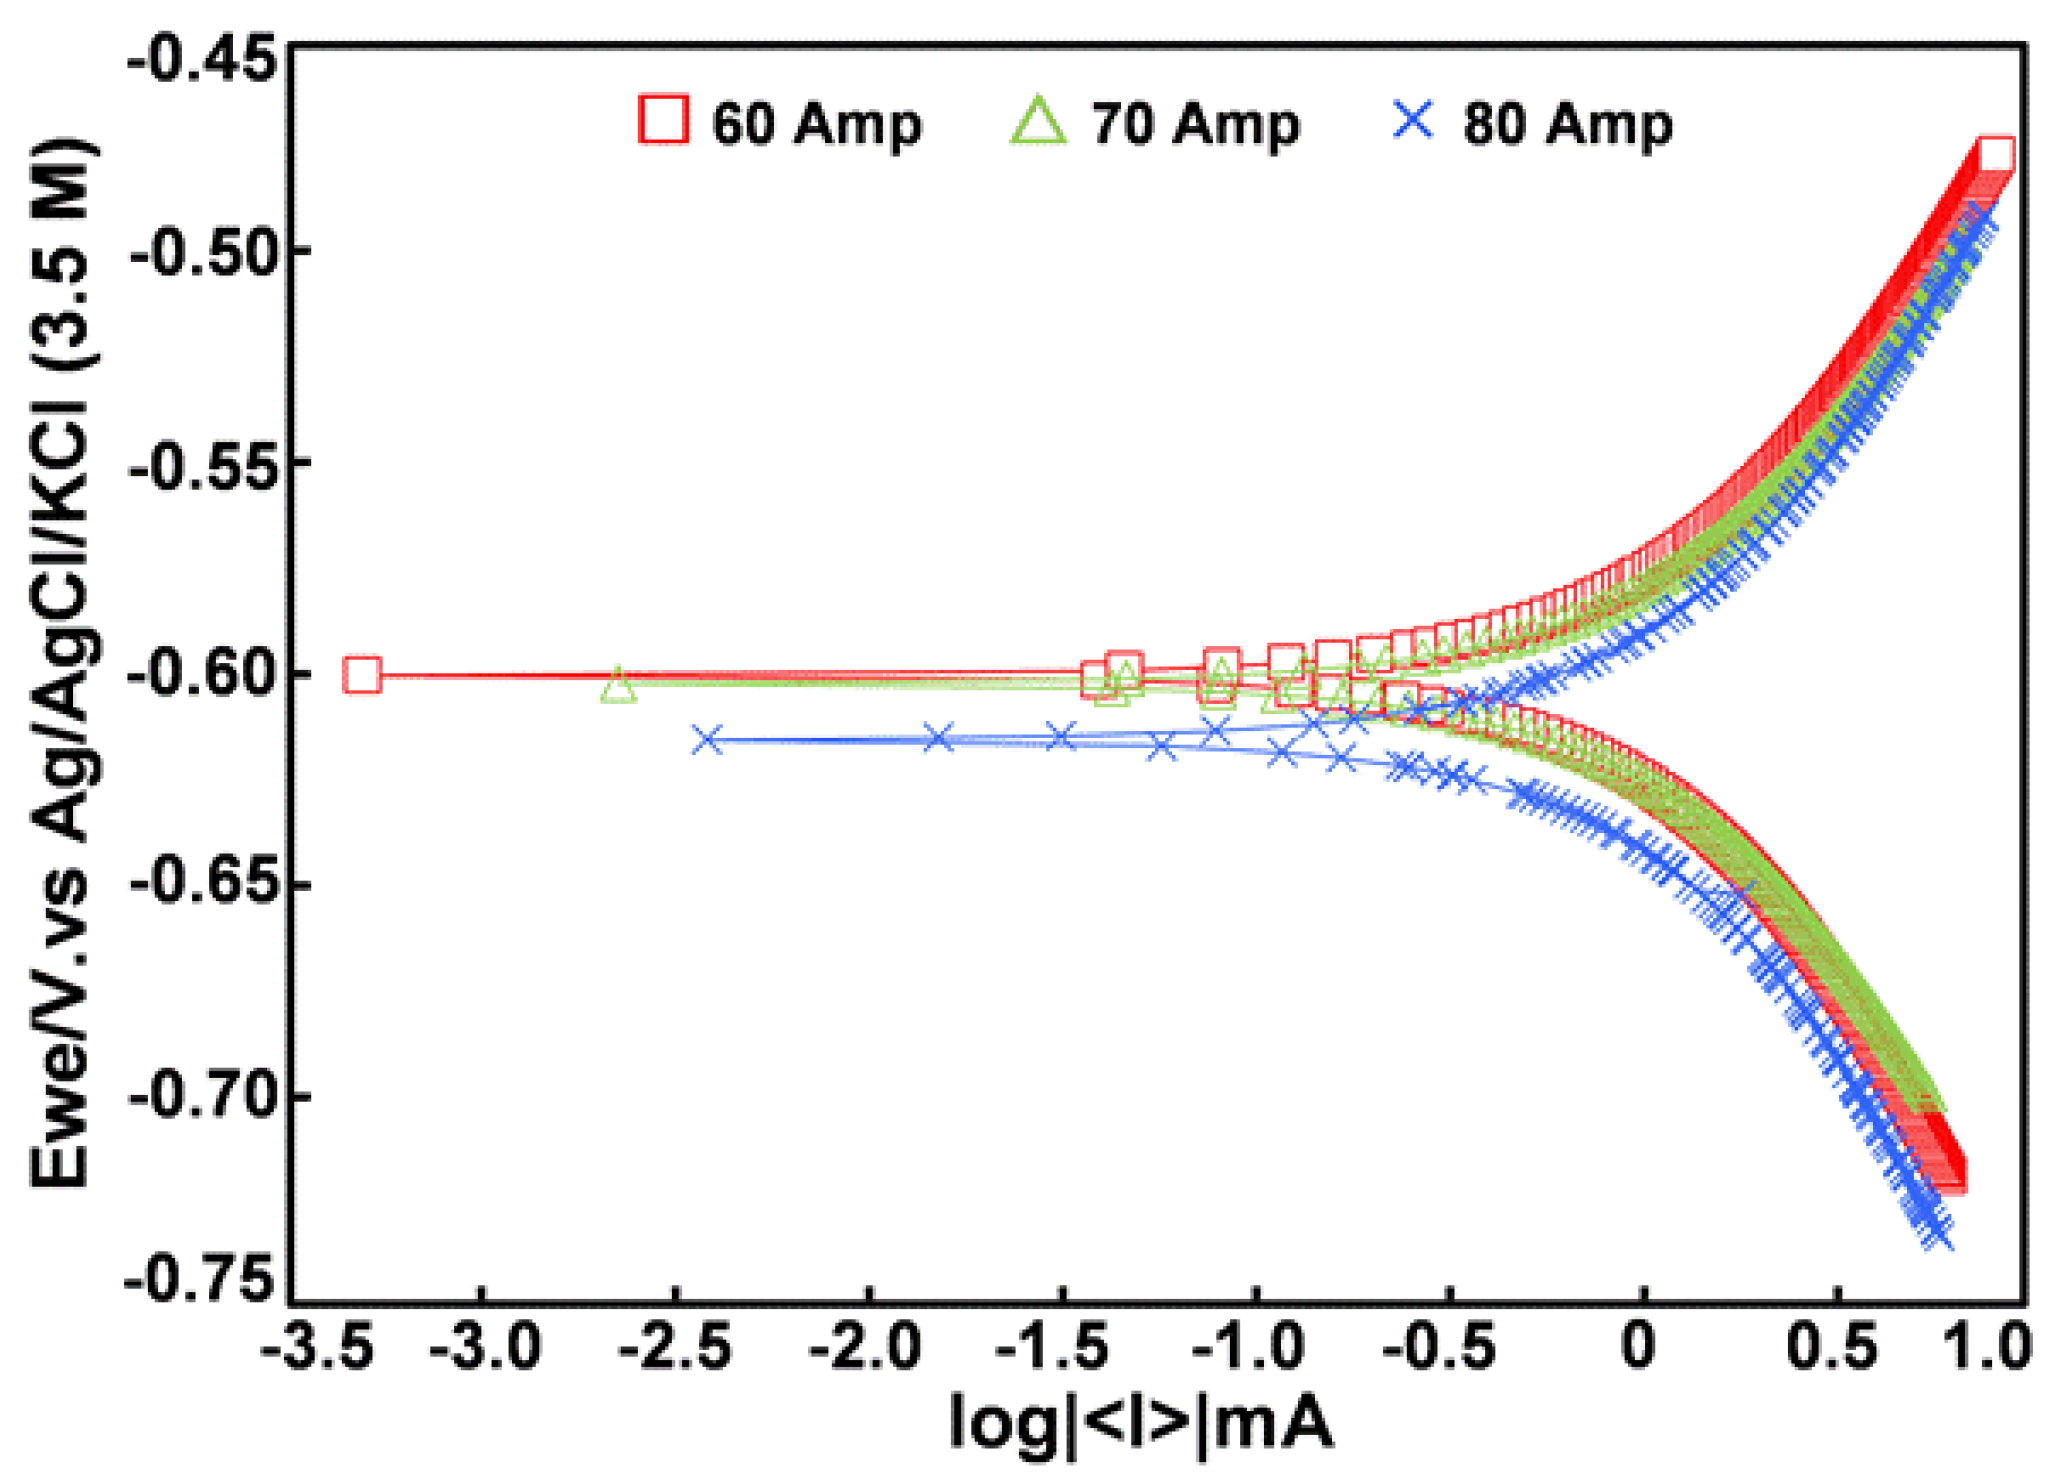
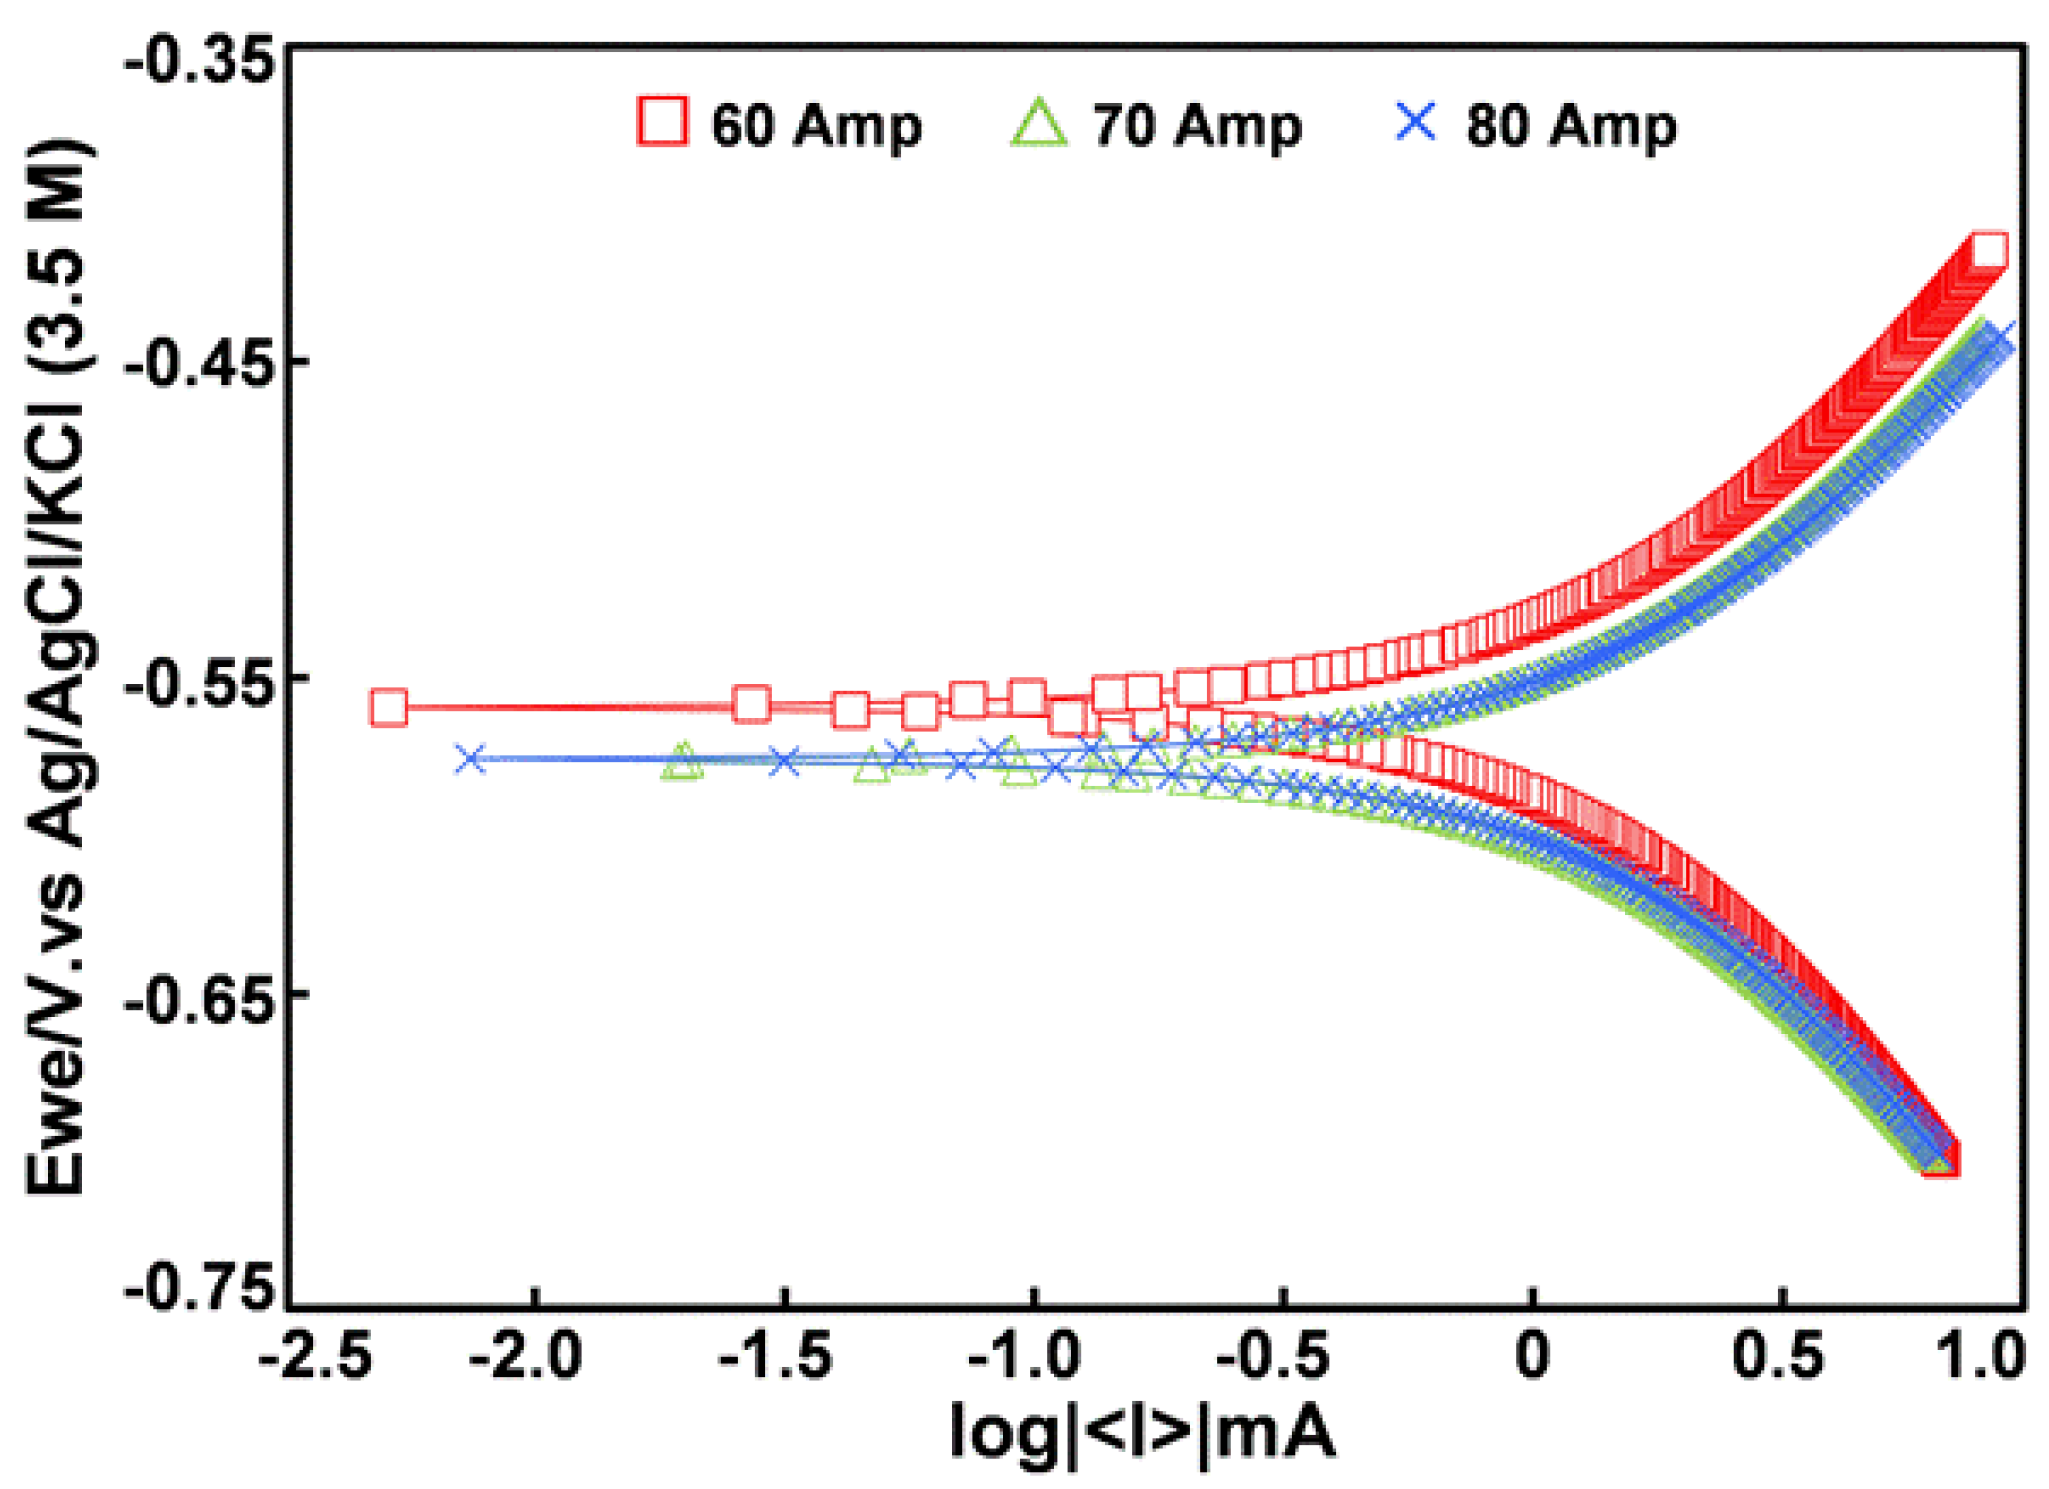
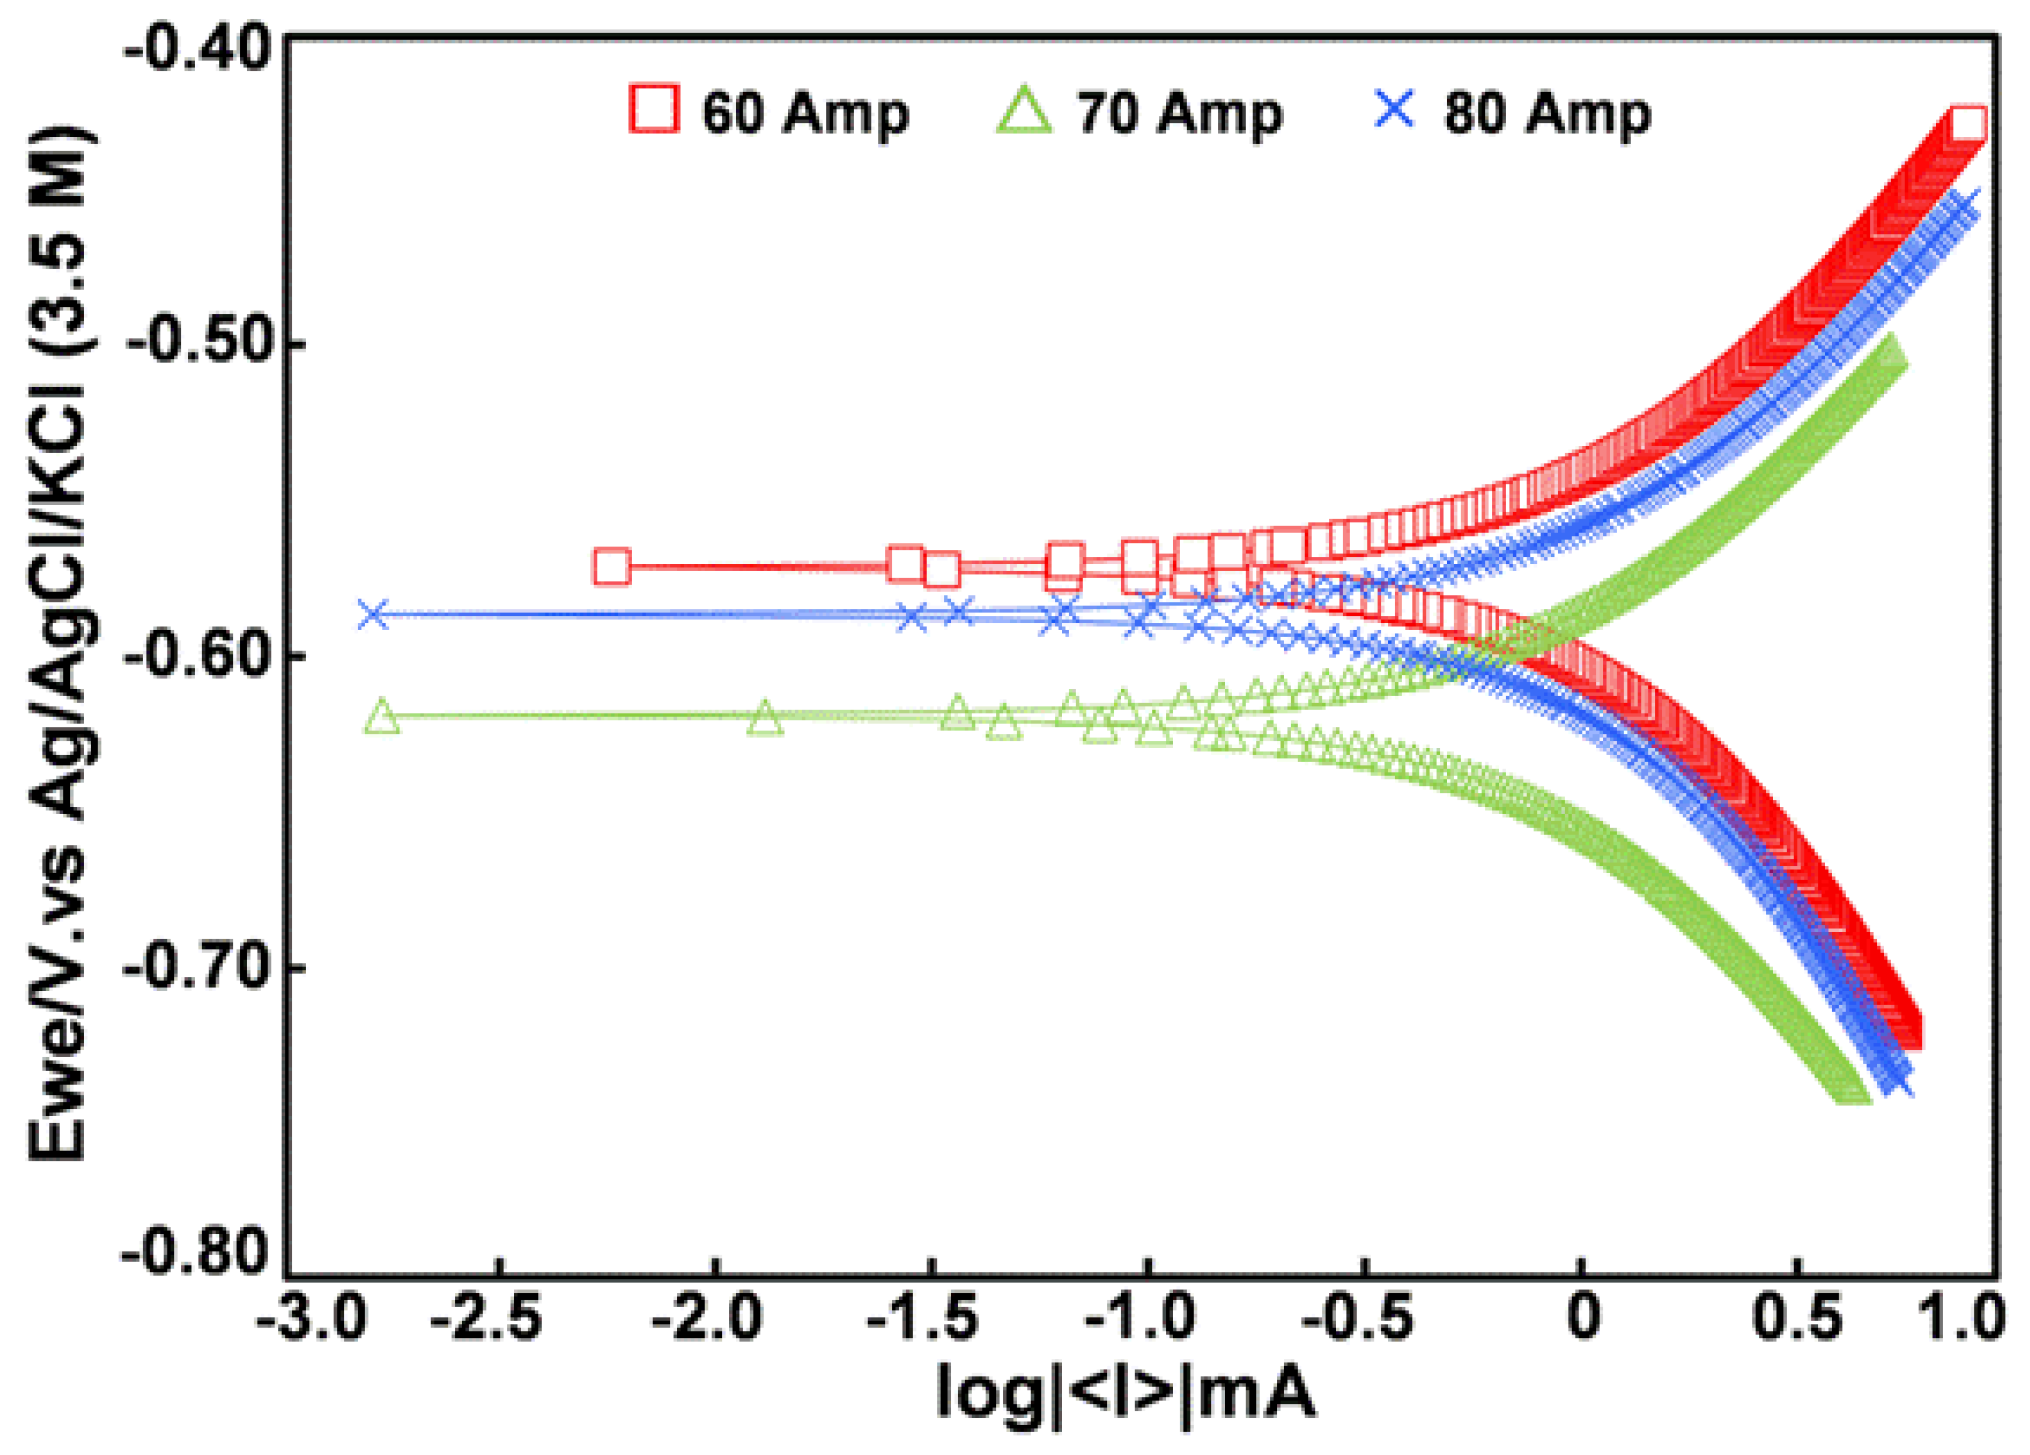
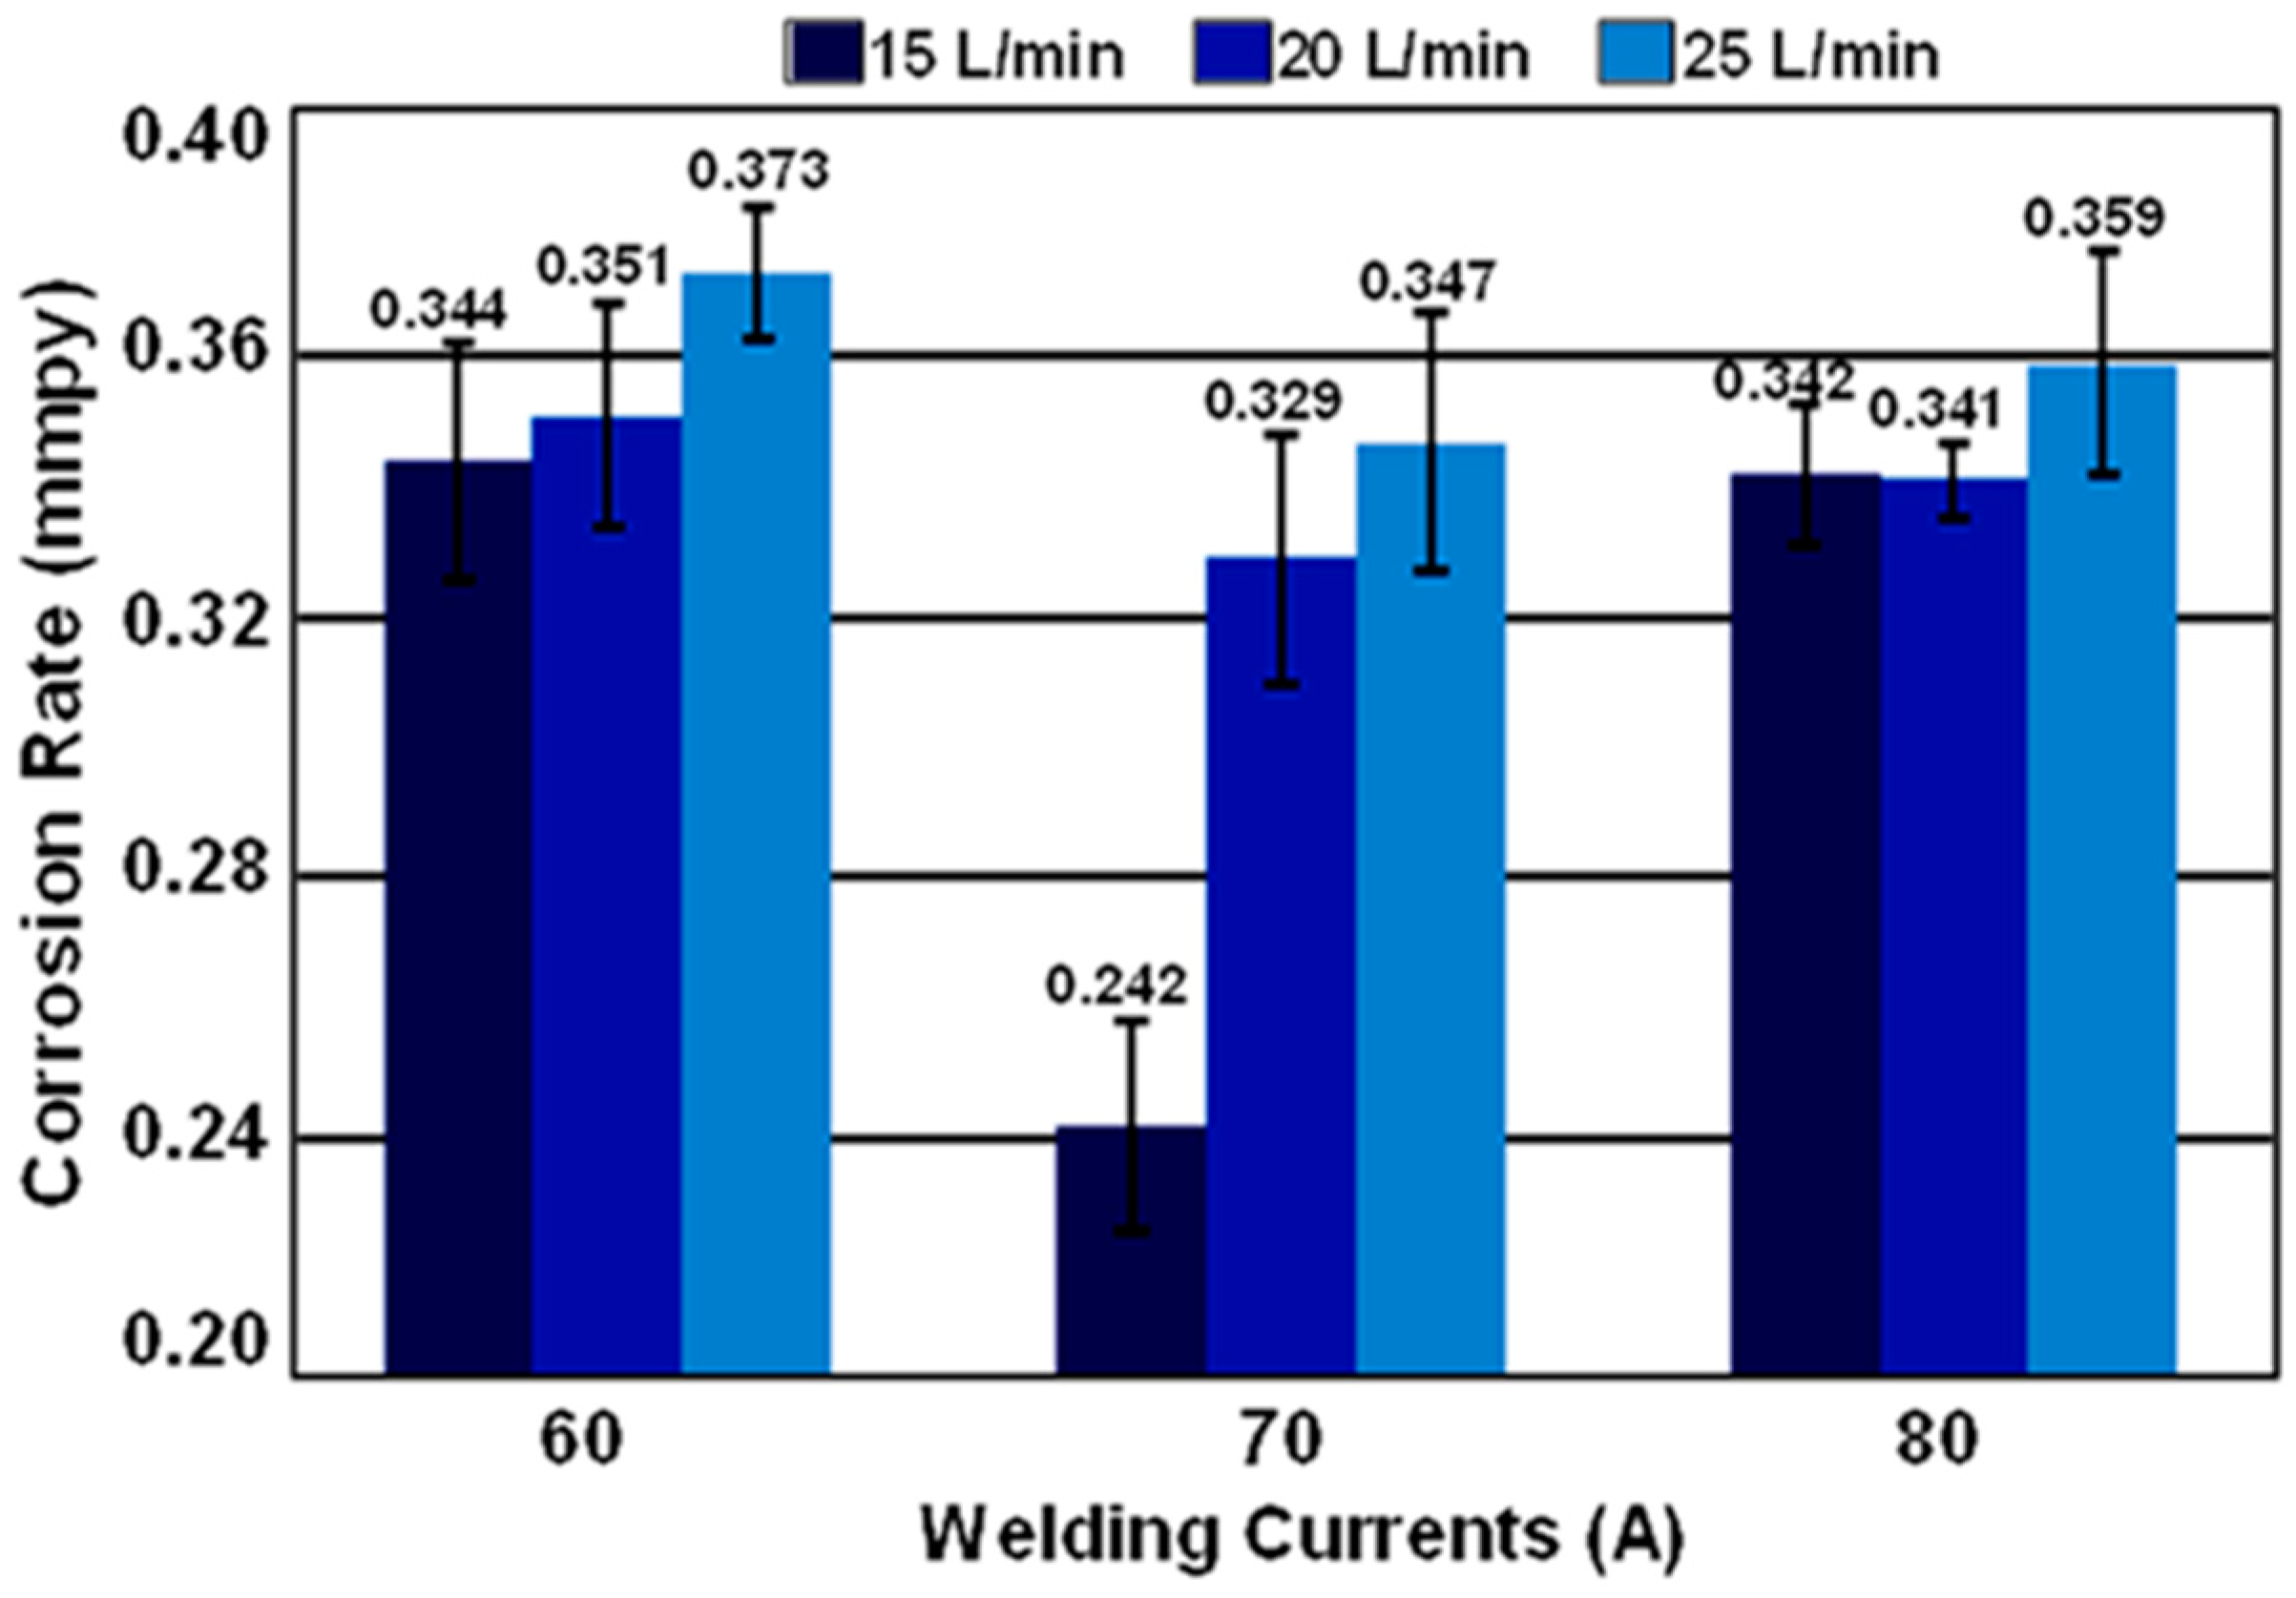
3.4. Corrosion Rate Determination by Tafel Slope Polarization

The polarization curve was obtained from the electrochemical test conducted in 3.5 wt % NaCl. The results of corrosion of the welded specimens with welding heat inputs of 0.90, 0.95, and 1.02 kJ/mm and flow rates of 15, 20 and 25 L/min were shown in Figure 6, Figure 7 and Figure 8, respectively. The corrosion rate was determined by Tafel’s plot and calculated by using the relationship dictated in Faraday’s Law in Equation (1).
Corrosion rate = (K × Icorr. × E.W.)/(A × ρ)
where
  • Icorr = the density electricity/metal surface area samples (A/cm2)
  • E.W. = the mass of metal inherent (27.9)
  • A = metal surface area sample (150 cm2)
  • ρ = the density metal samples (7.87/cm3)
  • K = constants of the calculated mmpy unit, 3.27 × 10⁻³
From the corrosion rate analysis (Figure 9), the welded specimen with a flow rate of 15 L/min exhibited a lower corrosion rate than those of 20 and 25 L/min. On the other hand, the welded specimen with a welding heat input of 0.95 kJ/mm showed a lower corrosion than those of 1.04 and 0.91 kJ/mm. Based on these results, three hypotheses could be considered concerning the cause of the discrepancies between the corrosion rates of the welded specimens: (1) the defective welding of convexity (root reinforcement) was too high; (2) the influence of the water flow crash caused the unembossment of welding (root reinforcement); and (3) heat input caused the structural changes of the welding metallurgy. Therefore, researchers had taken microstructure images of the welding piece as shown in Figure 10.
Figure 11a shows the schematic representation of the welded pipe specimens. The specimens with a welding current of 60 A revealed the incomplete joint because the welding current was relatively low. It might be noted that the Cl from NaCl contacting the internal pipe caused the corrosive conditions. If some Cl remained and eventually accumulated where the specimens were not fully joined, pitting mode corrosion could occur. Moreover, the potential in the pipe was then increased. As a consequence, this corrosive environment will enhance the reactions as shown in the Equations (2)–(6), which led to the severe corrosion.
Fe → Fe2+ + 2e
NaCl → Na+ + Cl
Fe + Cl → Fe(Cl)ads
Fe(s) + 2Cl(aq) → FeCl2(s) + 2e
FeCl2(s) + Cl(aq) → FeCl3(s) + e
For the welding with a power of 80 A (1.04 kJ/mm heat input), the specimen exhibited over-penetration from a high-power welding or a root reinforcement of welding which resulted in extensive corrosion of the pipeline. When NaCl was applied with a high flow rate, the chloride ions were allowed more time and volume to achieve more penetration, resulting in a higher corrosion rate. The lesser corrosion at the current of 70 A (0.95 kJ/mm heat input) came from the complete penetration by using an appropriate power at which NaCl could not achieve deep penetration. The chloride ion residue was decreased and resulted in a lower corrosion rate.
In the case of using the flow rate of 15 L/min, the flow rate might influence the corrosion rate in two ways. The first way was determined by the flow of water in the pipes. The Reynold’s number (Re) showed that the flow rate used in all tests was higher than 4000. It was found that the flow of water in the pipe had turbulence which resulted in the pipe line wall eroding more readily than that of laminar flow [21]. The influences of flow velocity in several cases could be explained by erosion mechanisms that could affect the development of pipe scales [12]. The second instance was the turbulent flow of NaCl that passed through the area along the weld defects or root reinforcement in the welding. This result was indicative of an increasing rate of reaction between iron corrosion, water, and chloride ions because of the turbulent flow on a rust-covered surface. In addition, we simulated the flow of NaCl passing through the welded specimen. The corrosion rates of the welded specimen at flow rates of 20 L/min and 25 L/min had insignificant differences and could not be used as a basis for comparison. However, the corrosion rate of welded specimens at a flow rate of 15 L/min showed more significant results. Therefore, this condition was used as an explanation for the effect of welding currents on the corrosion rate.
The welding areas of specimens with currents of 60 and 80 A were a sharp nook (Figure 11a) and a high root weld (Figure 11c), causing a high turbulent flow and higher susceptibility to corrosion. Conversely, the welding line of 70 A specimens was smooth at completion and exhibited lower turbulence and corrosion as shown in Figure 11b. The result suggested that the suitable current for welding to A106 pipe was 70 A.

4. Conclusions

The study of corrosion on carbon steel ASTM S/A106 grade B pipe welded by the gas tungsten arc welding (GTAW) at different of welding currents (heat input) of 60, 70 and 80 A was investigated with various flow rates of 3.5 wt % NaCl electrolytes (15, 20 and 25 L/min). The results of this could be summarized as follows: (a) the minimum corrosion rate of the piping specimen was 0.242 mmpy, when the welding current was maintained at 70 A (heat input of 0.95 kJ/mm) and a flow rate of 3.5 wt % NaCl controlled at 15 L/min; (b) the maximum corrosion rate of welded pipe specimens was found to be 0.373 mmpy, when the welding current was maintained at 60 A and the flow rate of 3.5 wt % NaCl was maintained at 25 L/min; (c) imperfect shape of the root face and weld decay on the pipe specimen might occur when low heat input is applied during gas tungsten arc welding (GTAW). The erosion-corrosion results on weld decay with turbulent flows were more corrosive and comparable in all piping specimens at high flow rates (25 L/min). The low flow rates (15 L/min) exhibited less corrosion because the heat input of the welding procedure transformed the metallurgical structure in the welding zone which resulted in an increased corrosion resistance of the metal. Therefore, the chloride ion (Cl) was able to affect the HAZ disproportionately to other areas as a result of the lower corrosion resistance indicative of the area. It exhibited an imperfect shape of the root face when the 3.5 wt % NaCl flowed through the welded pipe, and the internal roughness of the wall increased corrosion. In addition, the results of SEM images and XRD patterns confirmed the phase transformations which concluded that the welding current of 70 A was suitable for producing the welded pipe from A106.

Supplementary Materials

The following are available online at https://www.mdpi.com/2075-4701/6/9/207/s1.

Acknowledgments

The authors would like to acknowledge the Kasetsart University and Development Institute (KURDI). In addition, we are very grateful to the Thai-French Innovation Institute, the Science and Technology Research Institute, King Mongkut’s University of Technology, North Bangkok, for supporting the corrosion rate measurement. Additionally, thanks to Mr. Attaphon Kaewvilai from the College of Industrial Technology, King Mongkut’s University of Technology, North Bangkok, for support of the material analysis.

Author Contributions

T. Yingsamphanchareon and A. Rodchanarowan performed this reseach and wrote the article. N. Srisuwan helped with the corrosion analysis.

Conflicts of Interest

The authors declare no conflict of interest.

References

  1. McKetta, J.J. Piping Design Handbook; Marcel Dekker Inc: New York, NY, USA, 1992. [Google Scholar]
  2. Bae, D.; Kim, C.H. Characteristics in the weld of multi-pass welded A106 Gr B steel pipe. KSME Int. J. 2004, 18, 114–121. [Google Scholar]
  3. Bakour, S.; Guenbour, A.; Bellaouchou, A.; Escrivà-Cerdán, C.; Sánchez-Tovar, R.; Leiva-García, R.; García-Antón, J. Effect of welding on the corrosion behaviour of a highly alloyed austenitic stainless steel UNS N06027 in polluted phosphoric acid media. Int. J. Electrochem. Sci. 2012, 7, 10530–10543. [Google Scholar]
  4. Guo, H.X.; Lu, B.T.; Luo, J.L. Interaction of mechanical and electrochemical factors in erosion-corrosion of carbon steel. Electrochim. Acta 2005, 51, 315–323. [Google Scholar] [CrossRef]
  5. Shrestha, S.; Hodgkiess, T.; Neville, A. Erosion-corrosion behaviour of high-velocity oxy-fuel Ni-Cr-Mo-Si-B coatings under high-velocity seawater jet impingement. Wear 2005, 259, 208–218. [Google Scholar] [CrossRef]
  6. Zheng, Y.G.; Yao, Z.M.; Wei, X.Y.; Ke, W. The synergistic effect between erosion and corrosion in acidic slurry medium. Wear 1995, 186–187, 555–561. [Google Scholar] [CrossRef]
  7. Flow-Associated Corrosion in Power Plants. Available online: http://www.epri.com/abstracts/Pages/ProductAbstract.aspx?ProductId=TR-106611-R1 (accessed on 15 August 2016).
  8. Bermudez, M.D.; Jimenez, A.Z.; Martinez, N.G. Study of surface interactions of ionic liquids with aluminium alloys in corrosion and erosion-corrosion processes. Appl. Surf. Sci. 2007, 253, 7295–7302. [Google Scholar] [CrossRef]
  9. Shrestha, S.; Hodgkiess, T.; Neville, A. The effect of post-treatment of a high-velocity oxy-fuel Ni–Cr–Mo–Si–B coating part 2: Erosion-corrosion behavior. J. Therm. Spray Technol. 2001, 10, 656–665. [Google Scholar] [CrossRef]
  10. Zhang, J.S.; Li, N. Analysis on liquid metal corrosion-oxidation interactions. Corros. Sci. 2007, 49, 4154–4184. [Google Scholar] [CrossRef]
  11. Scuratia, A.; Fekeb, D.L.; Manas, Z.I. Analysis of the kinetics of agglomerate erosion in simple shear flows. Chem. Eng. Sci. 2005, 60, 6564–6573. [Google Scholar] [CrossRef]
  12. Stack, M.M.; Abd El Badia, T.M. On the construction of erosion-corrosion maps for WC/Co–Cr-based coatings in aqueous conditions. Wear 2006, 261, 1181–1190. [Google Scholar] [CrossRef]
  13. Meng, H.; Hu, X.; Neville, A. A systematic erosion-corrosion study of two stainless. Wear 2007, 263, 355–362. [Google Scholar] [CrossRef]
  14. Liu, G.J.; Zhu, S. Shaft corrosion problem for the circulating water pum pand treatment. Electr. Power 2006, 39, 52–55. [Google Scholar]
  15. ASTM G5-14: Standard Reference Test Method for Making Potentiodynamic Anodic Polarization Measurements. Available online: http://www.astm.org/Standards/G5 (accessed on 15 August 2016).
  16. Stack, M.M.; Abd El Badia, T.M. Mapping erosion-corrosion of WC/Co-Cr based composite coatings: Particle velocity and applied potential effects. Surf. Coat. Technol. 2006, 201, 1335–1347. [Google Scholar] [CrossRef]
  17. Houle, M.J.; McGuire, R.D. CASTI Guidebook to ASME Section IX—Welding Qualifications; CASTI Publishing Inc.: Edmonton, AB, Canada, 2011. [Google Scholar]
  18. Essentials–Section V: Nondestructive Examination. Available online: https://www.asme.org/products/courses/essentials-bpv-code-section-v-nondestructive (accessed on 15 August 2016).
  19. Specification for Carbon Steel Electrodes and Rods for Gas Shielded Arc Welding. Available online: https://pubs.aws.org/p/21/a518a518m2005-specification-for-carbon-steel-electrodes-and-rods-for-gas-sheilded-arc-welding (accessed on 15 August 2016).
  20. Specification for Tungsten and Oxide Dispersed Tungsten Electrodes for Arc Welding and Cutting. Available online: http://sif.library.illinois.edu/bibframe/html/7654275.html (accessed on 15 August 2016).
  21. Douglas, J.F.; Gasiorek, J.M.; Swaffield, J.A. Fluid Mechanics, 3rd ed.; Longman Scientific & Technical: London, UK, 1995; p. 300. [Google Scholar]
  22. Kaewvilai, A.; Wattanathana, W.; Jongrungruangchok, S.; Veranitisagul, C.; Koonsaeng, N.; Laobuthee, A. 3,4-Dihydro-1,3-2H-benzoxazines: Novel reducing agents through one electron donation mechanism and their application as the formation of nano-metallic silver coating. Mater. Chem. Phys. 2015, 167, 9–13. [Google Scholar] [CrossRef]
  23. Zhang, J.; Guyot, F. Experimental study of the bcc-fcc phase transformations in the Fe-Si at high pressures. Phys. Chem. Miner. 1999, 26, 419–424. [Google Scholar] [CrossRef]
  24. Srisuwan, N.; Eidhed, K.; Kreatsereekul, N.; Yingsamphanchareon, T.; Kaewvilai, A. The study of heat treatment effects on chromium carbide precipitation of 35Cr-45Ni-Nb alloy for repairing furnace tubes. Metals 2016, 6, 26. [Google Scholar] [CrossRef]
Figure 1. Corrosion testing circulator: (a) schematic model with flow directions (dashed lines) and (b) pipe specimens with connected electrodes: (1) counter electrode; (2) working electrode; (3) reference electrode.
Metals 06 00207 g001
Figure 2. Test pieces (a) before and (b) after penetrant testing (PT).
Metals 06 00207 g002
Figure 3. The ultimate tensile strength of ASTM A106 grade B pipe, certified A106 grade B pipe, and welded pipes from various currents at 60, 70 and 80 A.
Metals 06 00207 g003
Figure 4. Microstructure of specimens obtained from welding current at 60, 70 and 80 A.
Metals 06 00207 g004
Figure 5. XRD patterns of the welded piping specimens obtained from welding currents of (a) 60; (b) 70; and (c) 80 A.
Metals 06 00207 g005
Figure 6. Polarization curve of work-piece welded heat input in welding, and the 0.91 0.95 1.04 kJ/mm with test flow rate at 15 L/min.
Metals 06 00207 g006
Figure 7. Polarization curve of work-piece welded heat input in welding, and the 0.91, 0.95, 1.04 kJ/mm with test flow rate at 20 L/min.
Metals 06 00207 g007
Figure 8. Polarization curve of work-piece welded heat input in welding, and the 0.91, 0.95, 1.04 kJ/mm with test flow rate at 25 L/min.
Metals 06 00207 g008
Figure 9. Corrosion rate of the pieces that connect with the heat input of welding at 0.91, 0.95, and 1.04 kJ/mm, at test flow rates of 15, 20 and 25 L/min.
Metals 06 00207 g009
Figure 10. Characteristic shapes of welds.
Metals 06 00207 g010
Figure 11. The simulated corrosion with a flow rate of 15 L/min of welded specimens at various welding currents: (a) 60; (b) 70; and (c) 80 A.
Metals 06 00207 g011
Table 1. Chemical compositions of the ASTM A106 grade B carbon steel pipe using a spectrometer.
Atomic Percentage (%)
CMnPSSiCrCuMoNiVa
0.30 max0.29–1.060.035 max0.035 max0.10 min0.40 max0.40 max0.15 max0.40 max0.08 max
Table 2. Chemical compositions of the solid electrode using a spectrometer.
AWS Classification A5.18Atomic Percentage (%)
CMnSiPSNiCrMoVCu
ER70S-60.06–0.151.40–1.850.80–1.150.0250.0350.150.150.150.030.50
Table 3. The crystallite sizes of metallurgical phase in welded pipes.
Welding Currents for Welded Pipe PreparationCrystallite Sizes (nm)
α-phaseγ-phase
60 A60.54-
70 A60.1923.75
80 A59.3448.31

