Article

Effects of Surface Structure and Chemical Composition of Binary Ti Alloys on Cell Differentiation

Department of Dental Materials and Medical Research Center for Biomineralization Disorders, School of Dentistry, Chonnam National University, Gwangju 61186, Korea
*
Author to whom correspondence should be addressed.
Metals 2016, 6(7), 150; https://doi.org/10.3390/met6070150
Submission received: 1 March 2016 / Revised: 21 May 2016 / Accepted: 30 June 2016 / Published: 4 July 2016
(This article belongs to the Special Issue Refractory Metals and Alloys)

Abstract

:
Binary Ti alloys containing Fe, Mo, V and Zr were micro-arc oxidized and hydrothermally treated to obtain micro- and nano-porous layers. This study aimed to investigate cell differentiation on micro and micro/nanoporous oxide layers of Ti alloys. The properties of the porous layer formed on Ti alloys were characterized by X-ray diffraction pattern, microstructural and elemental analyses and inductively coupled plasma mass spectrometry (ICP-MS) method. The MTT assay, total protein production and alkaline phosphatase (ALPase) activity were evaluated using human osteoblast-like cells (MG-63). Microporous structures of micro-arc oxidized Ti alloys were changed to micro/nanoporous surfaces after hydrothermal treatment. Micro/nanoporous surfaces consisted of acicular TiO2 nanoparticles and micron-sized hydroxyapatite particles. From ICP and MTT tests, the Mo and V ions released from porous oxide layers were positive for cell viability, while the released Fe ions were negative for cell viability. Although the micro/nanoporous surfaces led to a lower total protein content than the polished and microporous Ti surfaces after cell incubation for 7 days, they caused higher ALPase activities after 7 days and 14 days of incubation except for V-containing microporous surfaces. The micro/nanoporous surfaces of Ti alloys were more efficient in inducing MG-63 cell differentiation.

Graphical Abstract

1. Introduction

Titanium (Ti) has been used as a dental prosthetic material due to its biocompatibility and good corrosion resistance. However, Ti is bioinert in terms of its ability to bond with bone tissue. In order to improve osseointegration between Ti implant surface and bone tissue, various surface treatment techniques have been developed, such as SLA (sand blasted with large grit, and acid-etched), RBM (resorbable blasting media), laser ablation [1] and hydroxyapatite coating [2,3]. Among the surface treatment techniques, micro-arc oxidation has advantages in terms of promising surface modification and good bond strength between the oxide layer and the substrate, and it offers a wide range of coating materials [2]. Bioactive hydroxyapatite (HAp) was formed on the oxide layer through micro-arc oxidation and hydrothermal treatment of pure Ti and Ti-6Al-4V alloys using an electrolyte containing Ca and P ions [4,5].
Sul et al. and Vandrovcová et al. have reported that the microporous Ti implant surface enhanced the differentiation of osteoblast cells due to increased surface area contacting the bone [1,6]. Chun et al. have reported that the nanoporous Ti implant surface had a positive effect on adsorption of proteins, adhesion of osteoblast cells and osseointegration rate compared to the microporous Ti implant surface [7]. We prepared micro/nanoporous Ti surfaces using micro-arc oxidation and hydrothermal treatment and these surfaces showed increased osteoconductivity compared to microporous Ti surfaces [8]. Even though there are many articles related to micro-arc oxidation and hydrothermal treatment of pure Ti and Ti-6Al-4V, articles on binary Ti alloys are rare. The micro/nanoporous Ti alloys should be studied in detail to investigate the effects on cell differentiation.
In this study, Fe, Mo, V and Zr were chosen as β-stabilizing elements for binary Ti alloys. The β stabilizing effect of selected metals increase in the order of Zr < V < Mo < Fe [9]. In the state of pure metal, V and Fe induce high cytotoxicity and moderate cytotoxicity, respectively, while Mo and Zr have low cytotoxicity [10]. A trace amount of Mo is an essential nutrient for organisms, but excess amount of Mo cause toxic sympotoms such as genotoxicity, mutagenicity and allergenicity [10,11]. V has been reported to be harmful to human health. It was reported that V (IV) and V (V) derivatives stimulate cell proliferation and protein content, while they inhibit cell differentiation [12]. The cytotoxicity of V is reduced by alloying Ti with V [13]. Osteoblast cell adhesion is improved by alloying Ti with Zr [14,15,16], which is a nontoxic and nonallergic metal.
In order to investigate the effects of surface structure and chemical composition of Ti alloys, binary Ti alloys were prepared by vacuum arc melting method using 5 wt. % Fe, Mo, V and Zr. Ti alloys were micro-arc oxidized and hydrothermally treated to obtain micro/nanoporous surfaces. The micro/nanoporous surfaces of Ti alloys were investigated with respect to surface characteristics and cell differentiation.

2. Materials and Methods

2.1. Preparation of Ti Alloys

Titanium sponge (99.95%), and iron granules (99.98%) were supplied by Alfa Aesar (Ward Hill, MA, USA), and molybdenum foil (99.95%) and zirconium foil (99.8%) were supplied by LS-Nikko (Seoul, Korea). Binary Ti alloys were prepared using a vacuum arc furnace under high purity argon gas. As-prepared Ti alloy ingots were heat treated using vertical tube furnace at a temperature that was 150 °C lower than their respective solidus temperature for 4 h. Afterwards, as-prepared Ti alloys were furnace cooled to 600 °C and then cooled to room temperature in air. The heat treated ingots were embedded in epoxy resin and cut into 10 mm diameter × 1.2 mm thick disks using a diamond cutter. The polished (POL) samples were prepared as follows: The disks were polished with 100 to 2000 grit SiC paper and washed using acetone, ethanol and distilled water. The commercially pure Ti disks (cp-Ti) were used as control.

2.2. Surface Modification

The micro-arc oxidized (MAO) and hydrothermally treated (MAO/HT) samples were prepared as follows: The disks were micro-arc oxidized in an aqueous electrolyte containing 0.2 M calcium acetate monohydrate (99%, Daejung Chemicals and Metals Co. Ltd., Siheung, Korea) and 0.02 M β-glycerophosphoric acid disodium salt pentahydrate (98% β-GP, ACROS Organics™, NJ, USA) using a DC-type power supply. Ti alloy disks and Pt wire were used as working electrode and counter electrode, respectively. For Ti alloy disks the applied current and time (Table 1) were changed to obtain a similar microporous surface. During MAO process, the potential vs. time curves of cp-Ti and Ti alloys were shown in Figure 1. The MAO treated Ti disks were sonicated in distilled water and dried. Hydrothermal treatment was carried out in alkaline aqueous solution of pH 11 containing 0.002 M β-GP at 190 °C for 8 h.

2.3. Surface Characterization

2.3.1. Phase Analysis

The crystalline structures of the specimens were investigated using an X’Pert PRO Multi-Purpose X-ray Diffractometer (PANalytical B.V., Almelo, The Netherlands) at 40 kV and 30 mA with Cu Kα radiation (λ = 1.54056 Å).

2.3.2. Surface Structure Measurements

The specimen surface was coated with Au-Pd using ion sputter (E-1010, Hitachi, Tokyo, Japan). The surface microstructures were observed using scanning electron microscopy (SEM, S-3000N, Hitachi, Tokyo, Japan) and field-emission scanning electron microscopy (FE-SEM, JSM-7500F, JEOL, Tokyo, Japan) at 15 keV. ImageJ software (version 1.48, National Institutes of Health, Bethesda, MD, USA) was used to conduct quantitative analysis of the acquired microstructural images. The chemical composition of surfaces was measured using energy dispersive X-ray spectroscopy (EDS, 7021-H, Horiba, Kyoto, Japan) without ion sputter coating. The formation of a crystalline phase was confirmed by high-resolution transmission electron microscope (HR-TEM, Technai-F20, Philips, Amsterdam, The Netherlands) and selected area electron diffraction (SAED) pattern analyses.

2.3.3. Contact Angle Measurements

The hydrophilic properties of POL-, MAO-, and MAO/HT-treated samples were evaluated by contact angle measurements using the sessile drop technique. At 30 s after dropping 15 μL of deionized water on the sample surface, the static contact angle images were captured by a video microscope (Image analyzing microscope, Camscope, Sometech Inc., Seoul, Korea) at ×80 magnification. The contact angles were measured using image analysis software (Surftens 4.5 version, OEG GmbH, Frankfurt, Germany).

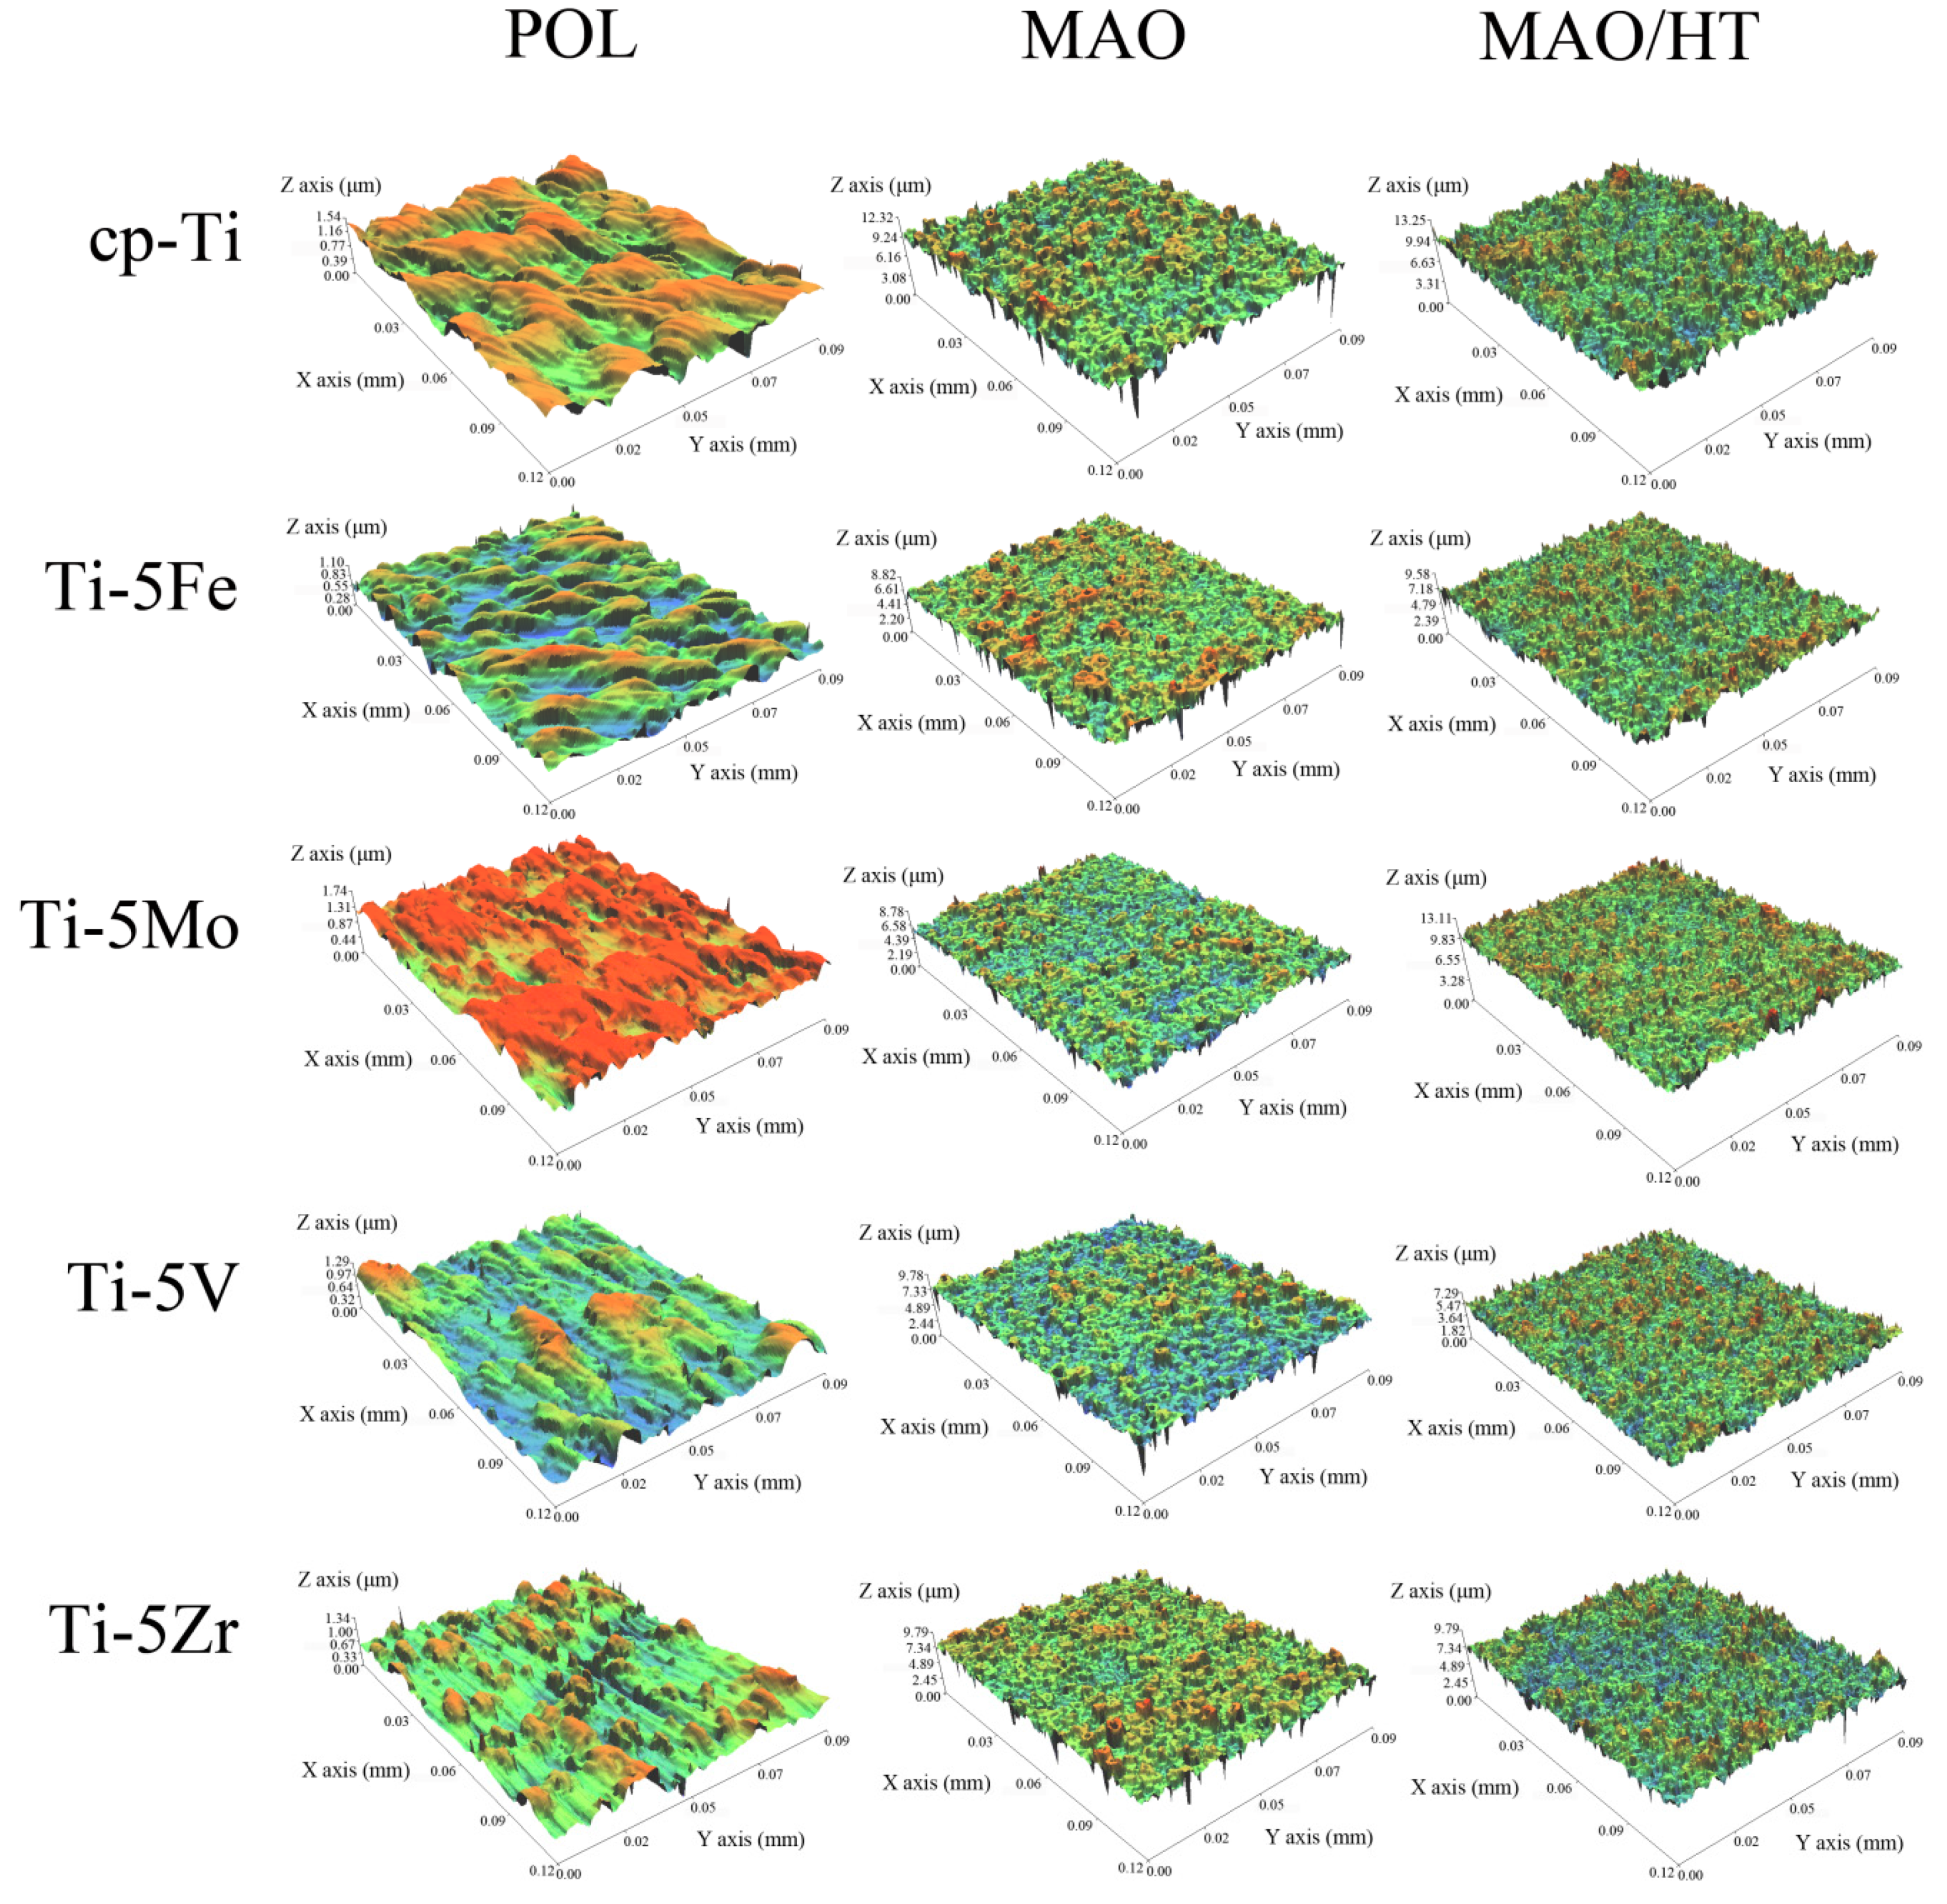
2.3.4. Surface Roughness Measurements

The surface topography was quantified by the surface roughness, which was measured using non-contact optical profiler (3D optical profiler, NV-E1000, Nanosystem, Daejeon, Korea) with 50× objective. The surface roughness was presented by the arithmetic mean surface roughness (Ra), the root-mean-square roughness (Rq), the total height of the roughness profile (Rt), and the surface roughness depth (Rz).

2.3.5. ICP-MS Measurements

The samples were immersed in 15 mL of phosphate-buffered saline (PBS) solution at 37 °C for 3 days. After the removal of samples, the residual solutions were used to measure the concentration of metal ions using inductively coupled plasma mass spectrometry (ICP-MS, Nexion 300X, PerkinElmer Inc., Waltham, MA, USA) analysis.

2.4. Cell Differentiation Evaluation

MG-63 osteoblast-like cells were used for osteoconductivity evaluation. MG-63 cells were cultured in Dulbecco’s modified Eagle’s medium (DMEM; Gibco, Carlsbad, CA, USA) containing 10% fetal bovine serum (FBS; Gibco, Carlsbad, CA, USA) and 1% penicillin/streptomycin (Sigma, St. Louis, MO, USA) in an incubator at 37 °C and 5% CO2. The culture media was replaced with fresh media every 48 h. The front and back sides of the specimen were irradiated with UV light for 20 min prior to the test. The following tests were repeated three times.

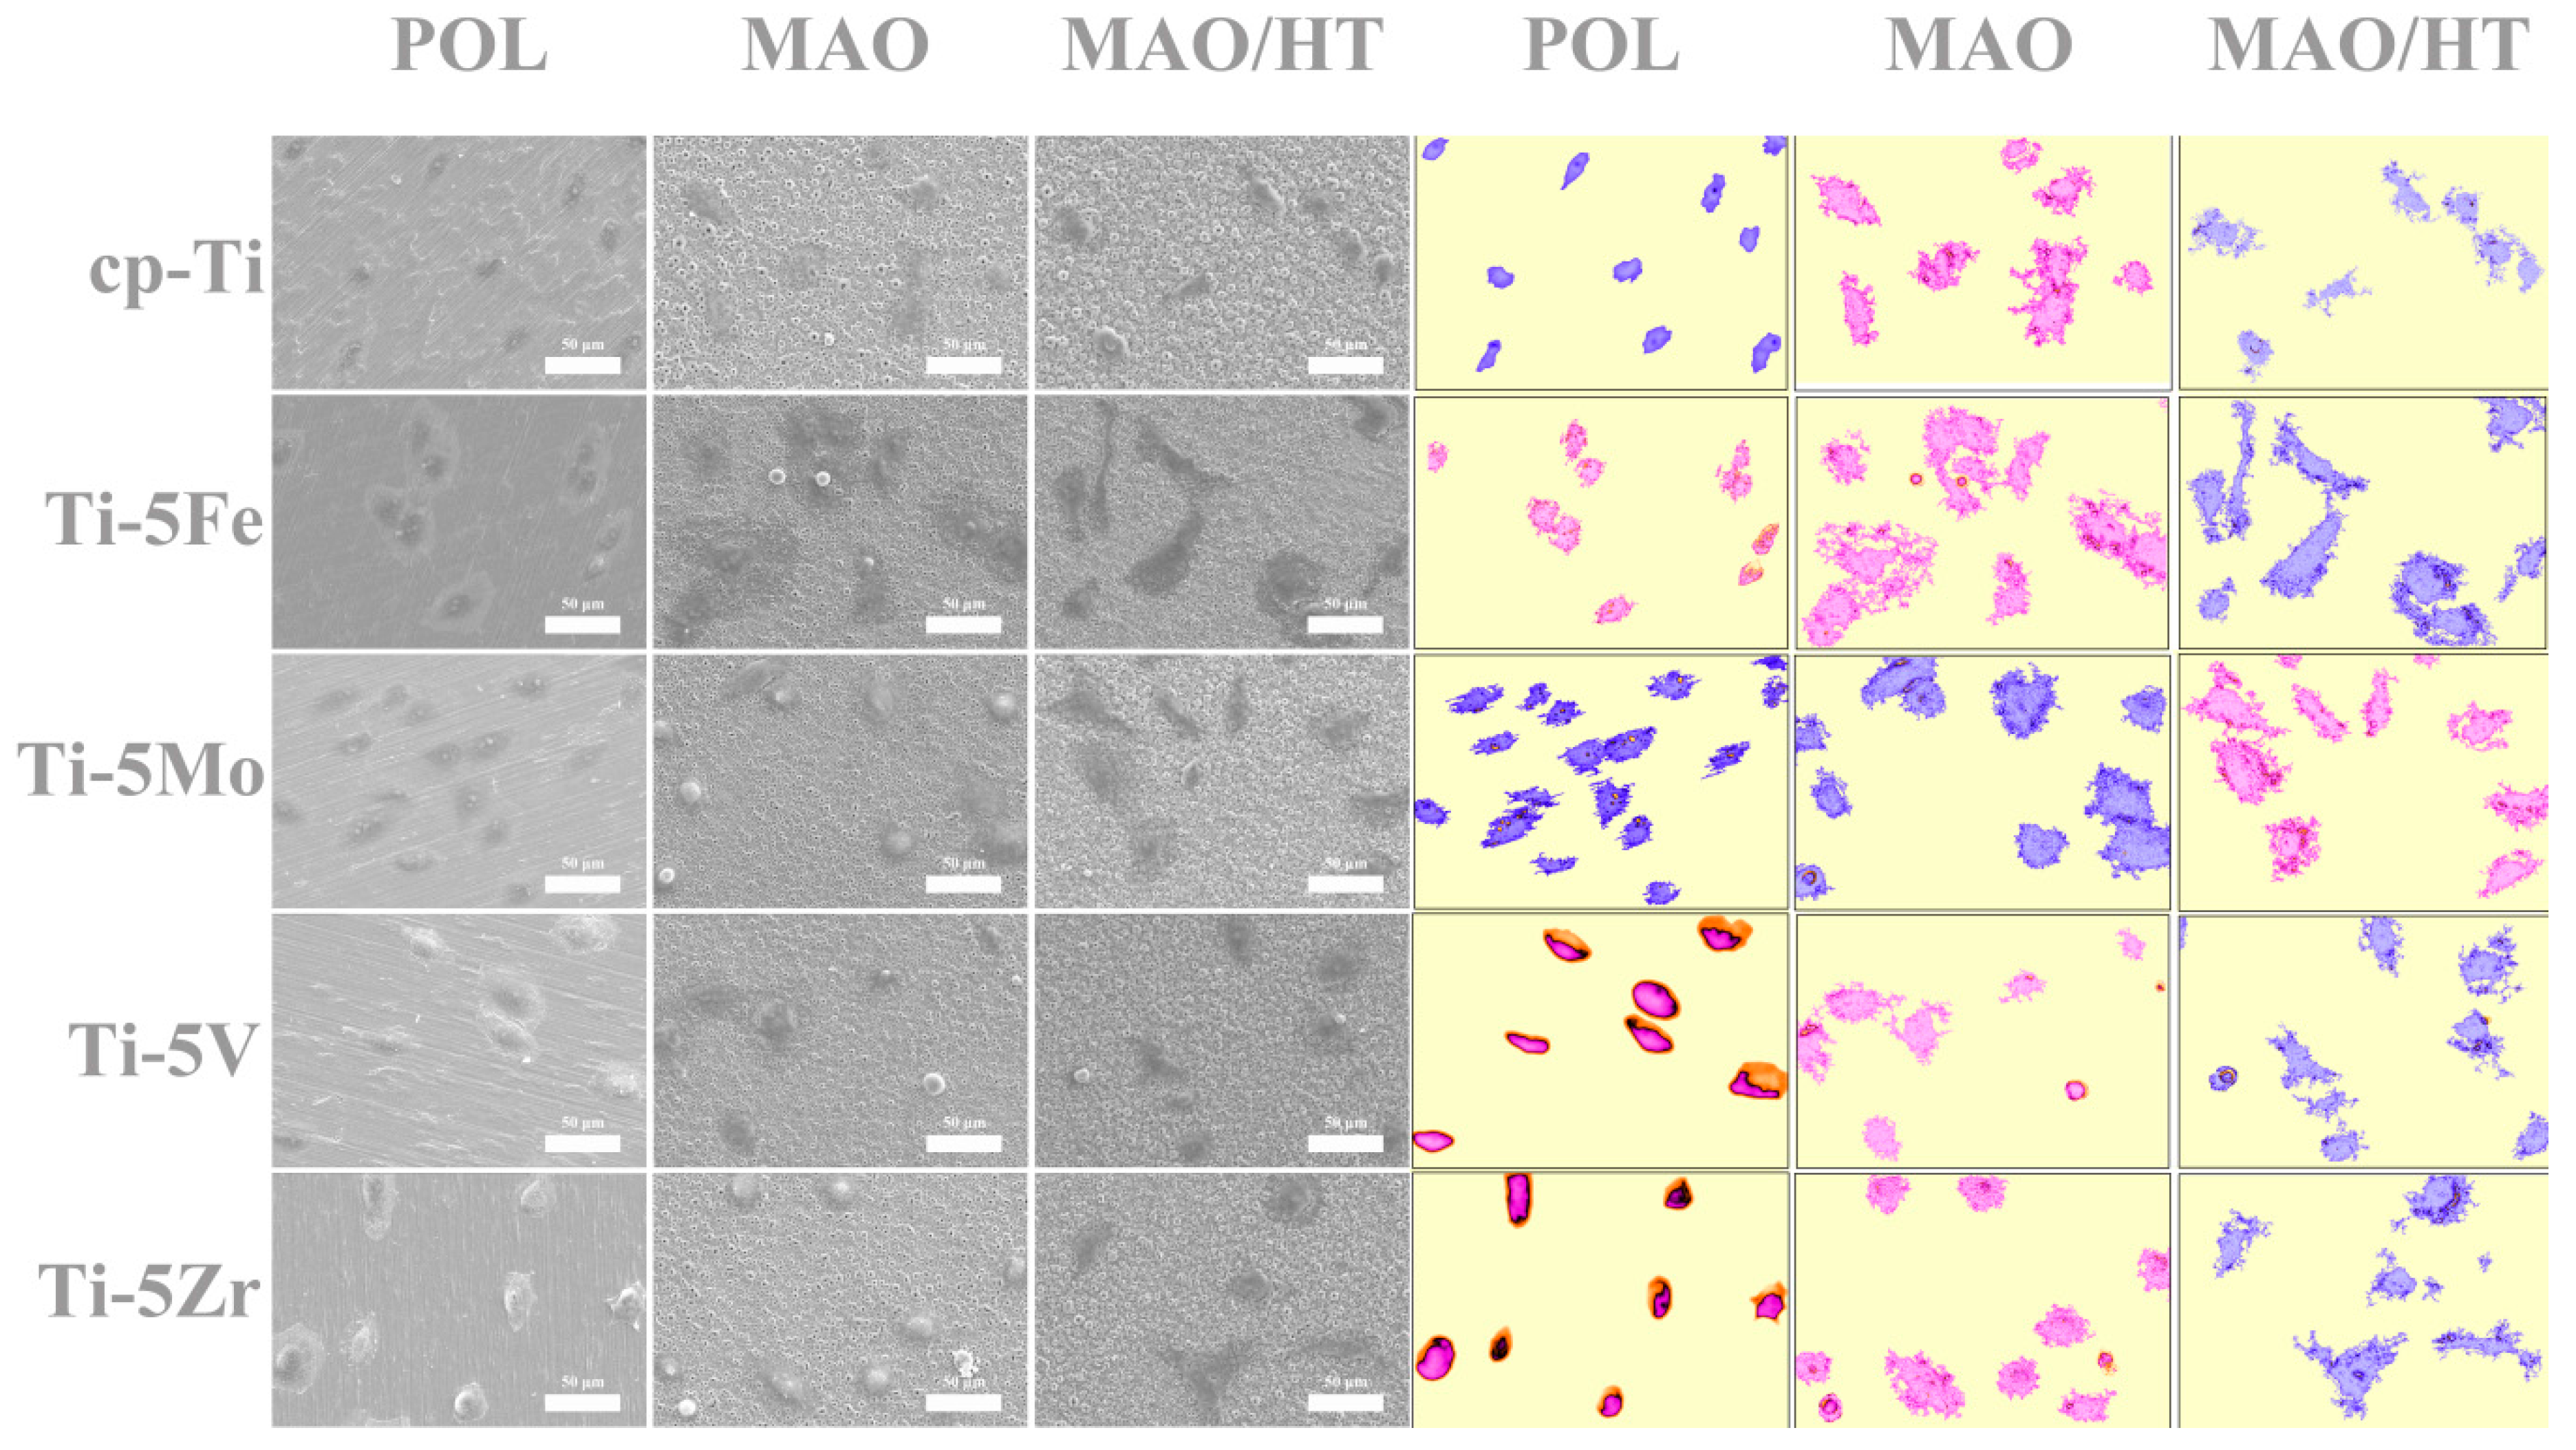
2.4.1. Cell Adhesion

MG-63 cells with 3 × 10⁵ cell/mL were added to the wells containing the specimens and cultured in an incubator at 37 °C and 5% CO2 for 3 h. After the removal of media from wells, pre-fixation of cells on the specimen surface was carried out by adding 1 mL of 3% glutaraldehyde to each well and kept for 2 h. Afterwards, the specimen surface was washed twice with PBS. Then, 1 mL of PBS was added to the wells and kept at 4 °C for 12 h. After the removal of PBS from the wells, post-fixation of cells was performed by adding 1 mL OsO4 to the wells and kept for 2 h. The specimen surfaces were washed twice with PBS and successively treated with 30%, 50%, 60%, 70%, 80%, 90%, and 100% ethanol. The dehydrated specimen surfaces were dried using a critical point dryer and coated with Au-Pd using ion sputter coater. The images of cell adhesion on the specimens were observed using scanning electron microscopy.

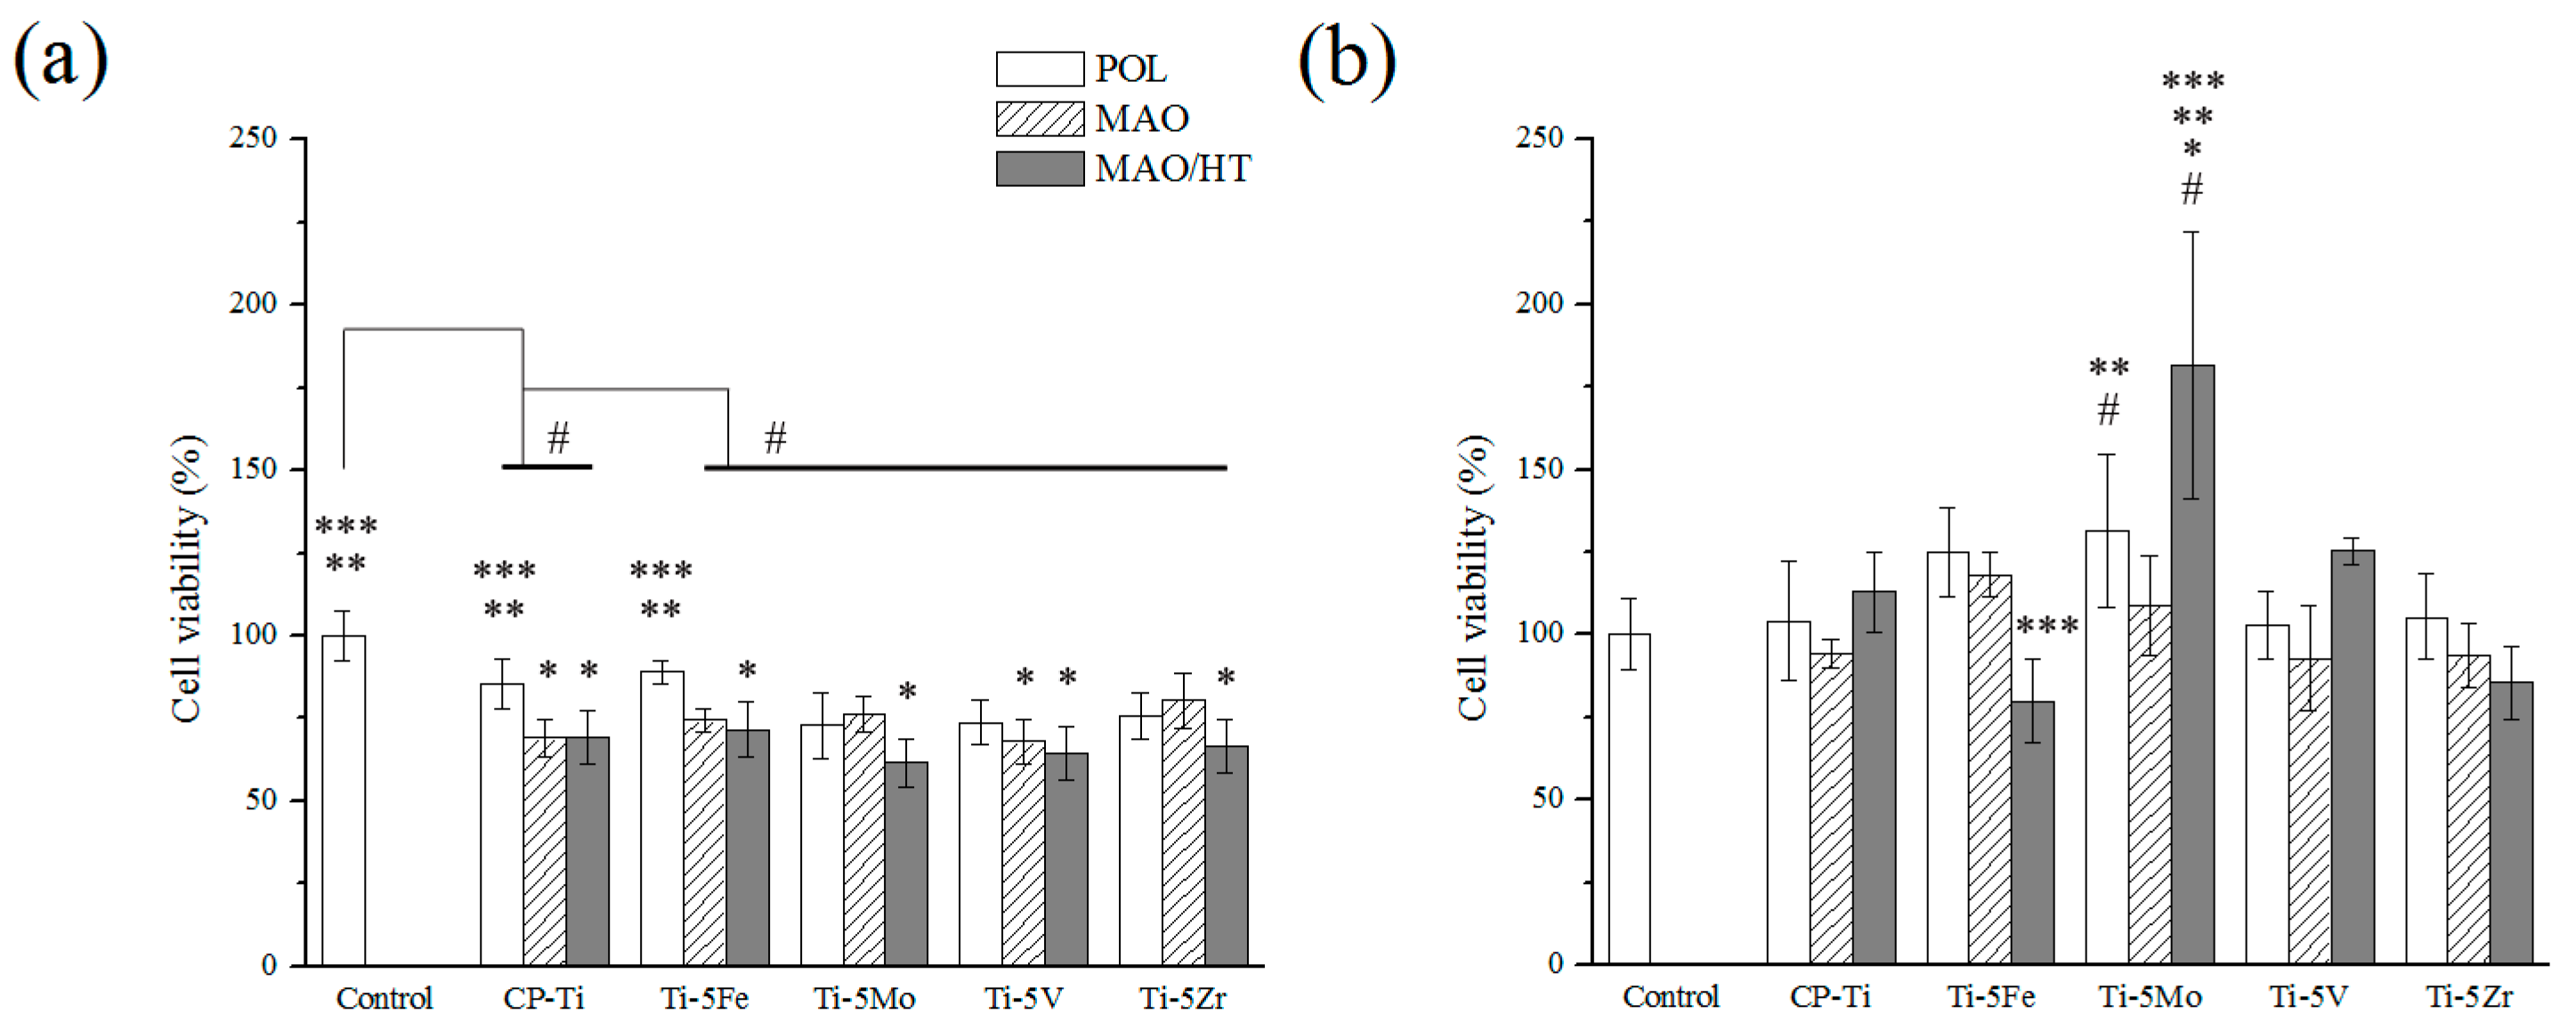
2.4.2. MTT Assay Test

MTT assay tests were performed on the surfaces. MG-63 cells were incubated in DMEM culture media at 37 °C and 5% CO2 for 72 h. The empty wells (without the sample) were used as the control group. After loading the sample in a 48 well plate, 100 μL of MG-63 (5 × 10⁴ cell/mL) and 400 μL of culture media were added to each well and kept at 37 °C and 5% CO2 for 24 h. After the removal of culture media from the wells, 100 μL of mixed solution of MTT reagent and culture media at a ratio of 1:9 was added to each well plate and reacted at 37 °C and 5% CO2 for 4 h. MTT reagent and culture media were removed from the well plates and washed with PBS. Then, 100 μL of dimethyl sulfoxide (DMSO) was added to each well plate and it was gently rotated. The cell viability was evaluated by measuring absorption at 570 nm using a microplate reader (Sunrise, Tecan Austria GmbH, Salzburg, Austria).
MTT assay tests were carried out using the extraction lysate. The extraction lysate was obtained through the immersion of specimens into the wells containing 2 mL of culture media at 37 °C for 72 h. Meanwhile, 100 μL of 3 × 10³ MG-63 cells were transferred into a 96 well plate after 48 h from the start of extraction, and the cells were cultured at 37 °C and 5% CO2 for 24 h. Then, the culture media was removed and 100 μL of the obtained extraction lysate was added to the prepared 96 well plates and the cells were cultured again at 37 °C and 5% CO2 for 24 h. After the removal of extrusion lysate from 96 well plates, the mixed solution of MTT reagent and culture media was added using the same method described in MTT assay tests performed on the surfaces.

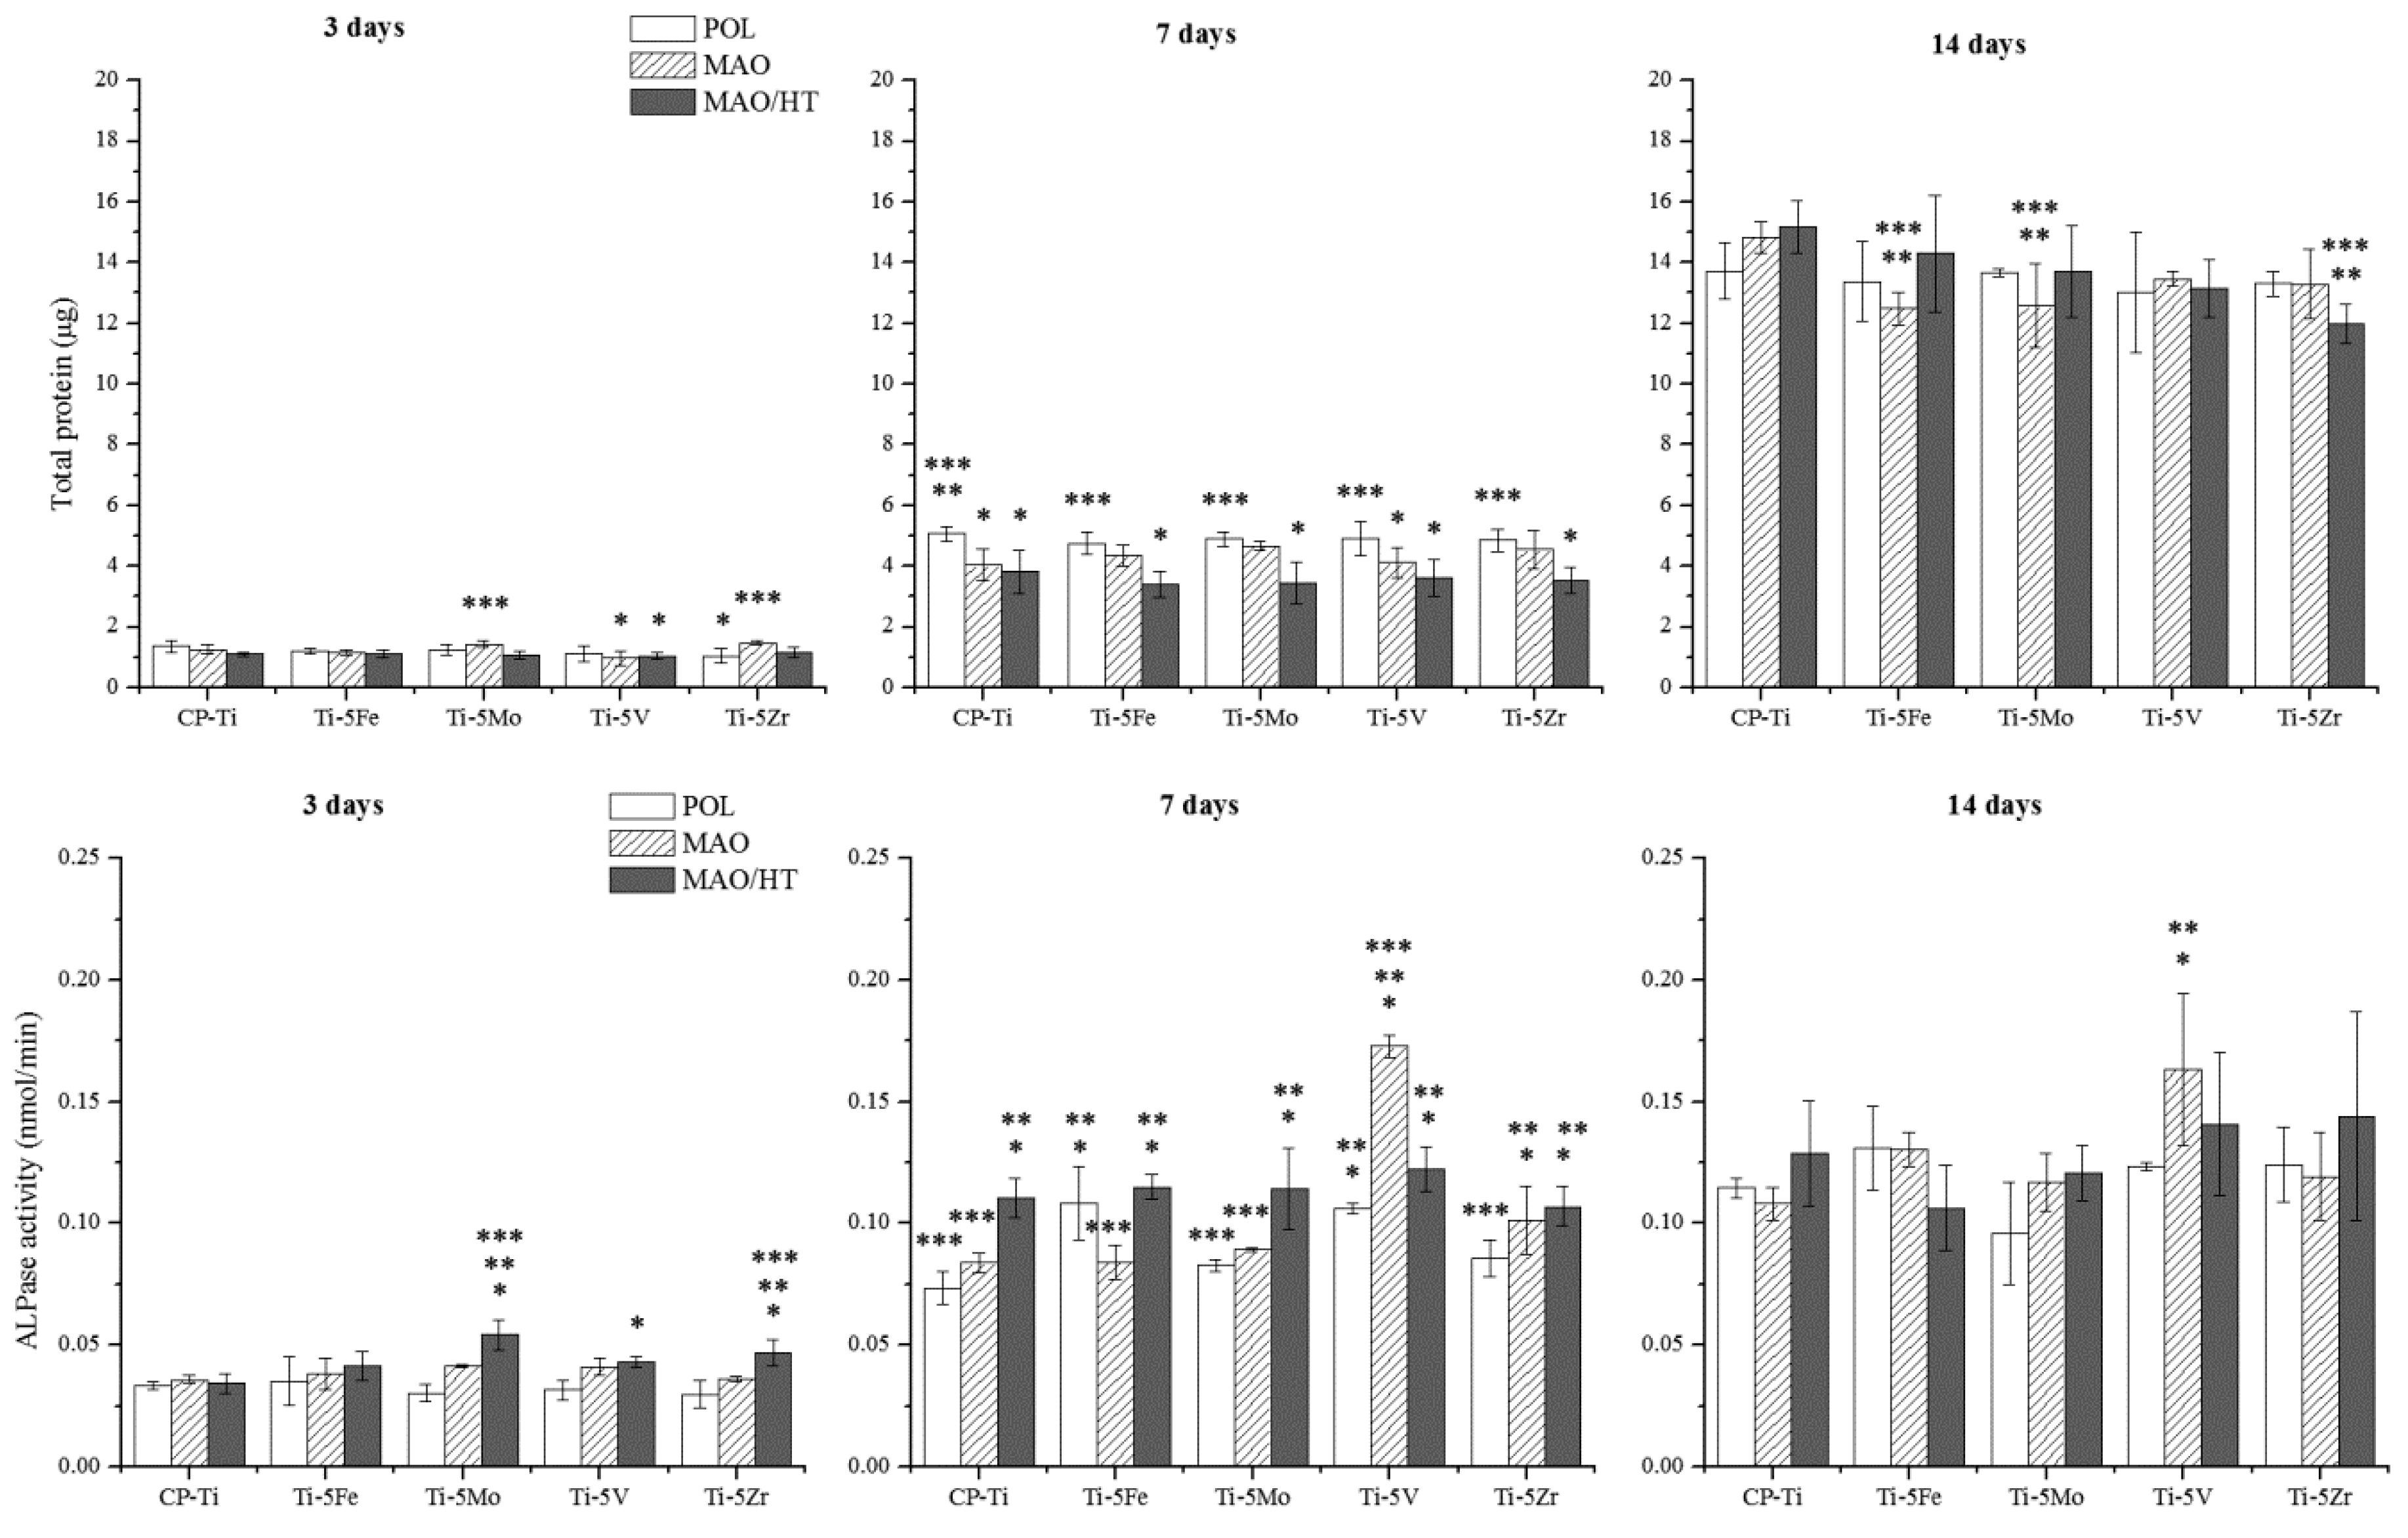
2.4.3. Total Protein Content

Total protein content was measured using bicinchoninic acid (BCA) protein assay kit (Pierce Co., Rockford, IL, USA). Then, 100 μL containing MG-63 cells with 1 × 10⁵ cell/mL were added to each specimen and cultured at 37 °C and 5% CO2 for 3, 7, and 14 days. After incubation, the culture media was removed and washed twice with PBS. The cells were dissolved by adding 1 mL of 0.2% triton X-100 on the specimen. The cell dissolved solution (25 μL) and bovine serum albumin (BSA, 25 μL) were added alternately to 96 well plates. The BCA working solution (BCA reagent A:BCA reagent B = 50:1) was added to each well. After gentle shaking for 30 s the solution was cultured at 37 °C and 5% CO2 for 30 min. Total protein content was calculated using absorption values of the solution at 570 nm and the previously obtained calibration curve for BSA standard solution.

2.4.4. ALPase Activity

Fifty micro liters of ALPase working reagent (1.5 M 2-amino-2-methyl-1-propanol buffer:20 mM р-nitrophenyl phosphate substrate:1 mM magnesium chloride = 1:1:1) was added to 50 μL of the cell dissolved solution and kept in the incubator at 37 °C for 1 h. Then, 100 μL of 1 N NaOH was added to stop the reaction. ALPase activity was calculated using the absorption value measured at 410 nm with a microplate reader and calibration curve obtained for p-nitrophenol stock.

2.5. Statistical Analysis

SPSS 21.0 version (SPSS Inc., Chicago, IL, USA) was used to analyze the data. Statistical significance of variance was evaluated by one-way ANOVA with post hoc Duncan’s multiple range tests (p < 0.05).

3. Results and Discussion

3.1. XRD Patterns

The β-Ti (110) peaks were observed at around 39° in Ti alloys(POL) having β stabilizing Fe, Mo and V elements, as shown in Figure 2a. The α-Ti peaks of Ti-5Zr(POL) were shifted toward lower 2θ values than those of cp-Ti(POL) due to higher atomic radius of Zr (0.206 nm) compared to that of Ti (0.176 nm). MAO-treated samples showed TiO2 characteristic peaks corresponding to anatase (I41/amd space group, a = 3.785, c = 9.514), rutile (P42/mnm space group, a = 4.594, c = 2.959) and brookite (Pbca space group, a = 5.456, b = 9.182, c = 5.143) as shown in Figure 2b. No peaks were observed except for TiO2 and substrate peaks. As observed in Figure 2c, after MAO/HT treatment, hydroxyapatite peaks at 31.8°–32.9° were observed in all of the MAO/HT-treated samples. Anatase and rutile peak intensities were increased by MAO/HT treatment. The higher peak intensities were observed in Ti-5Mo(POL), Ti-5Mo(MAO), Ti-5V(MAO), Ti-5Mo(MAO/HT), and Ti-5Fe(MAO/HT). In the homogenization procedure of Ti alloy ingots, the used slow furnace cooling and air cooling might result in highly ordered structures with specific surface planes α of and β phases.

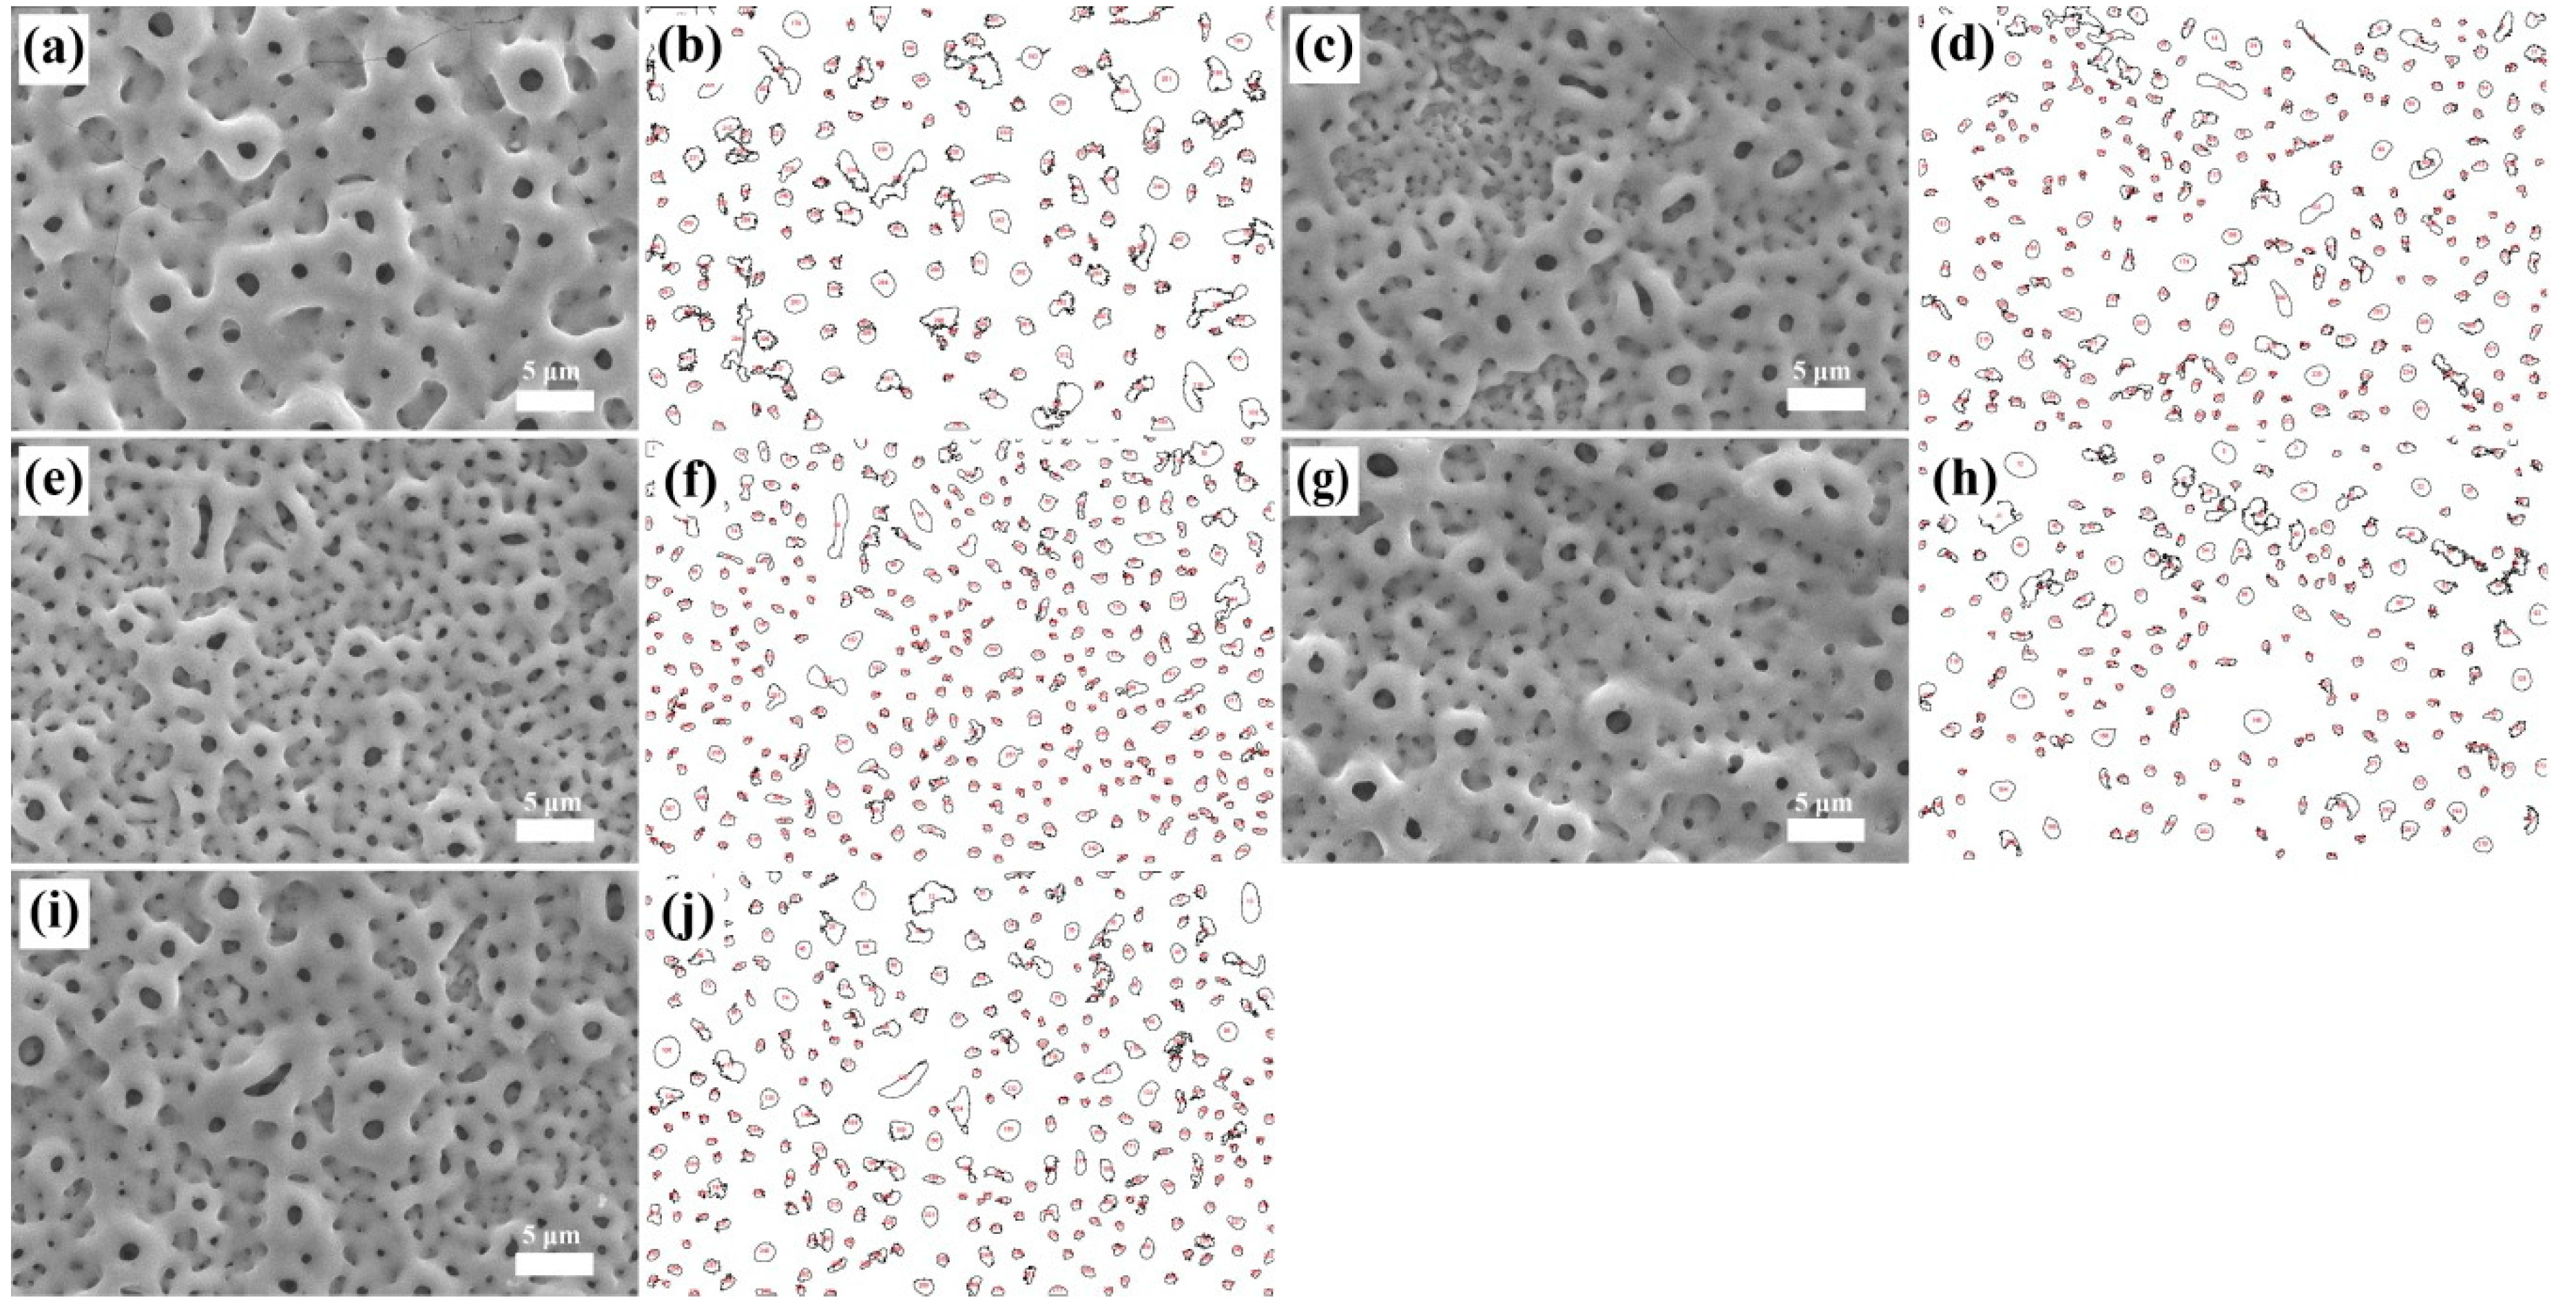
3.2. Microstructure Observation

Many craters were formed in the oxide layers by micro-arc oxidation of cp-Ti(POL) and Ti alloys(POL), as shown in Figure 3. Porous surface morphologies of MAO-treated Ti alloys were similar to that of cp-Ti(MAO). The number of pores, average pore area and total pore area were calculated by ImageJ analyses for the segmentation images of MAO-treated samples and the analysis results are presented in Table 2. The number of pores in MAO-treated Ti alloys was increased compared to that in cp-Ti(MAO), while the average pore area in MAO-treated Ti alloys was decreased compared to that in cp-Ti(MAO). Ti-5Mo(MAO) and Ti-5Zr(MAO) had a similar total pore area to cp-Ti(MAO). Ti-5Fe(MAO) and Ti-5V(MAO) had a lower total pore area than cp-Ti(MAO). The presence of alloying element affected on the final potential under the applied current and time during anodization (Table 1) as shown in Figure 1. The final potentials were 306 V for cp-Ti, 273 V for Ti-5Fe, 270 V for Ti-5Mo, 282 V for Ti-5V, and 294 V for Ti-5Zr. The higher final potentials of cp-Ti and Ti-5Zr could contribute to their relatively higher total pore areas, while the lower final potentials of Ti-5Fe and Ti-5V resulted in lower total pore areas. Though Ti-5Mo displayed lower final potential, it had the high total pore area due to the large number of pores.
The microporous surfaces of MAO-treated samples were changed to the micro/nanoporous surfaces after MAO/HT treatment, as shown in Figure 3 and Figure 4. MAO/HT-treated sample surfaces consisted of acicular TiO2 nanoparticles and micron-sized HAp particles, as shown in the inset image of Figure 4e. Nano-sized acicular TiO2 particles were observed within the pores and on the surface. Micron-sized HAp particles were mainly observed around the pores. Ca and P ions within oxide layer are diffused to the surface during hydrothermal treatment. It can be understood that many OH groups existed around the pores and the OH groups induced the nucleation of HAp on the porous oxide layer during hydrothermal treatment. HAp particles are formed by following reaction: 10Ca2+ + 6PO43− + 2OH → Ca10(PO4)6(OH)2 [17,18]. We assume that β-GP solution containing P ions facilitated the formation of micron-sized HAp particles during hydrothermal process. MAO/HT-treated samples showed different surface shapes. The increase in nano-sized acicular TiO2 particles was observed in MAO/HT-treated alloy samples than MAO/HT-treated cp-Ti. Also, HAp particles covering the pores were more observed in MAO/HT-treated alloy samples.

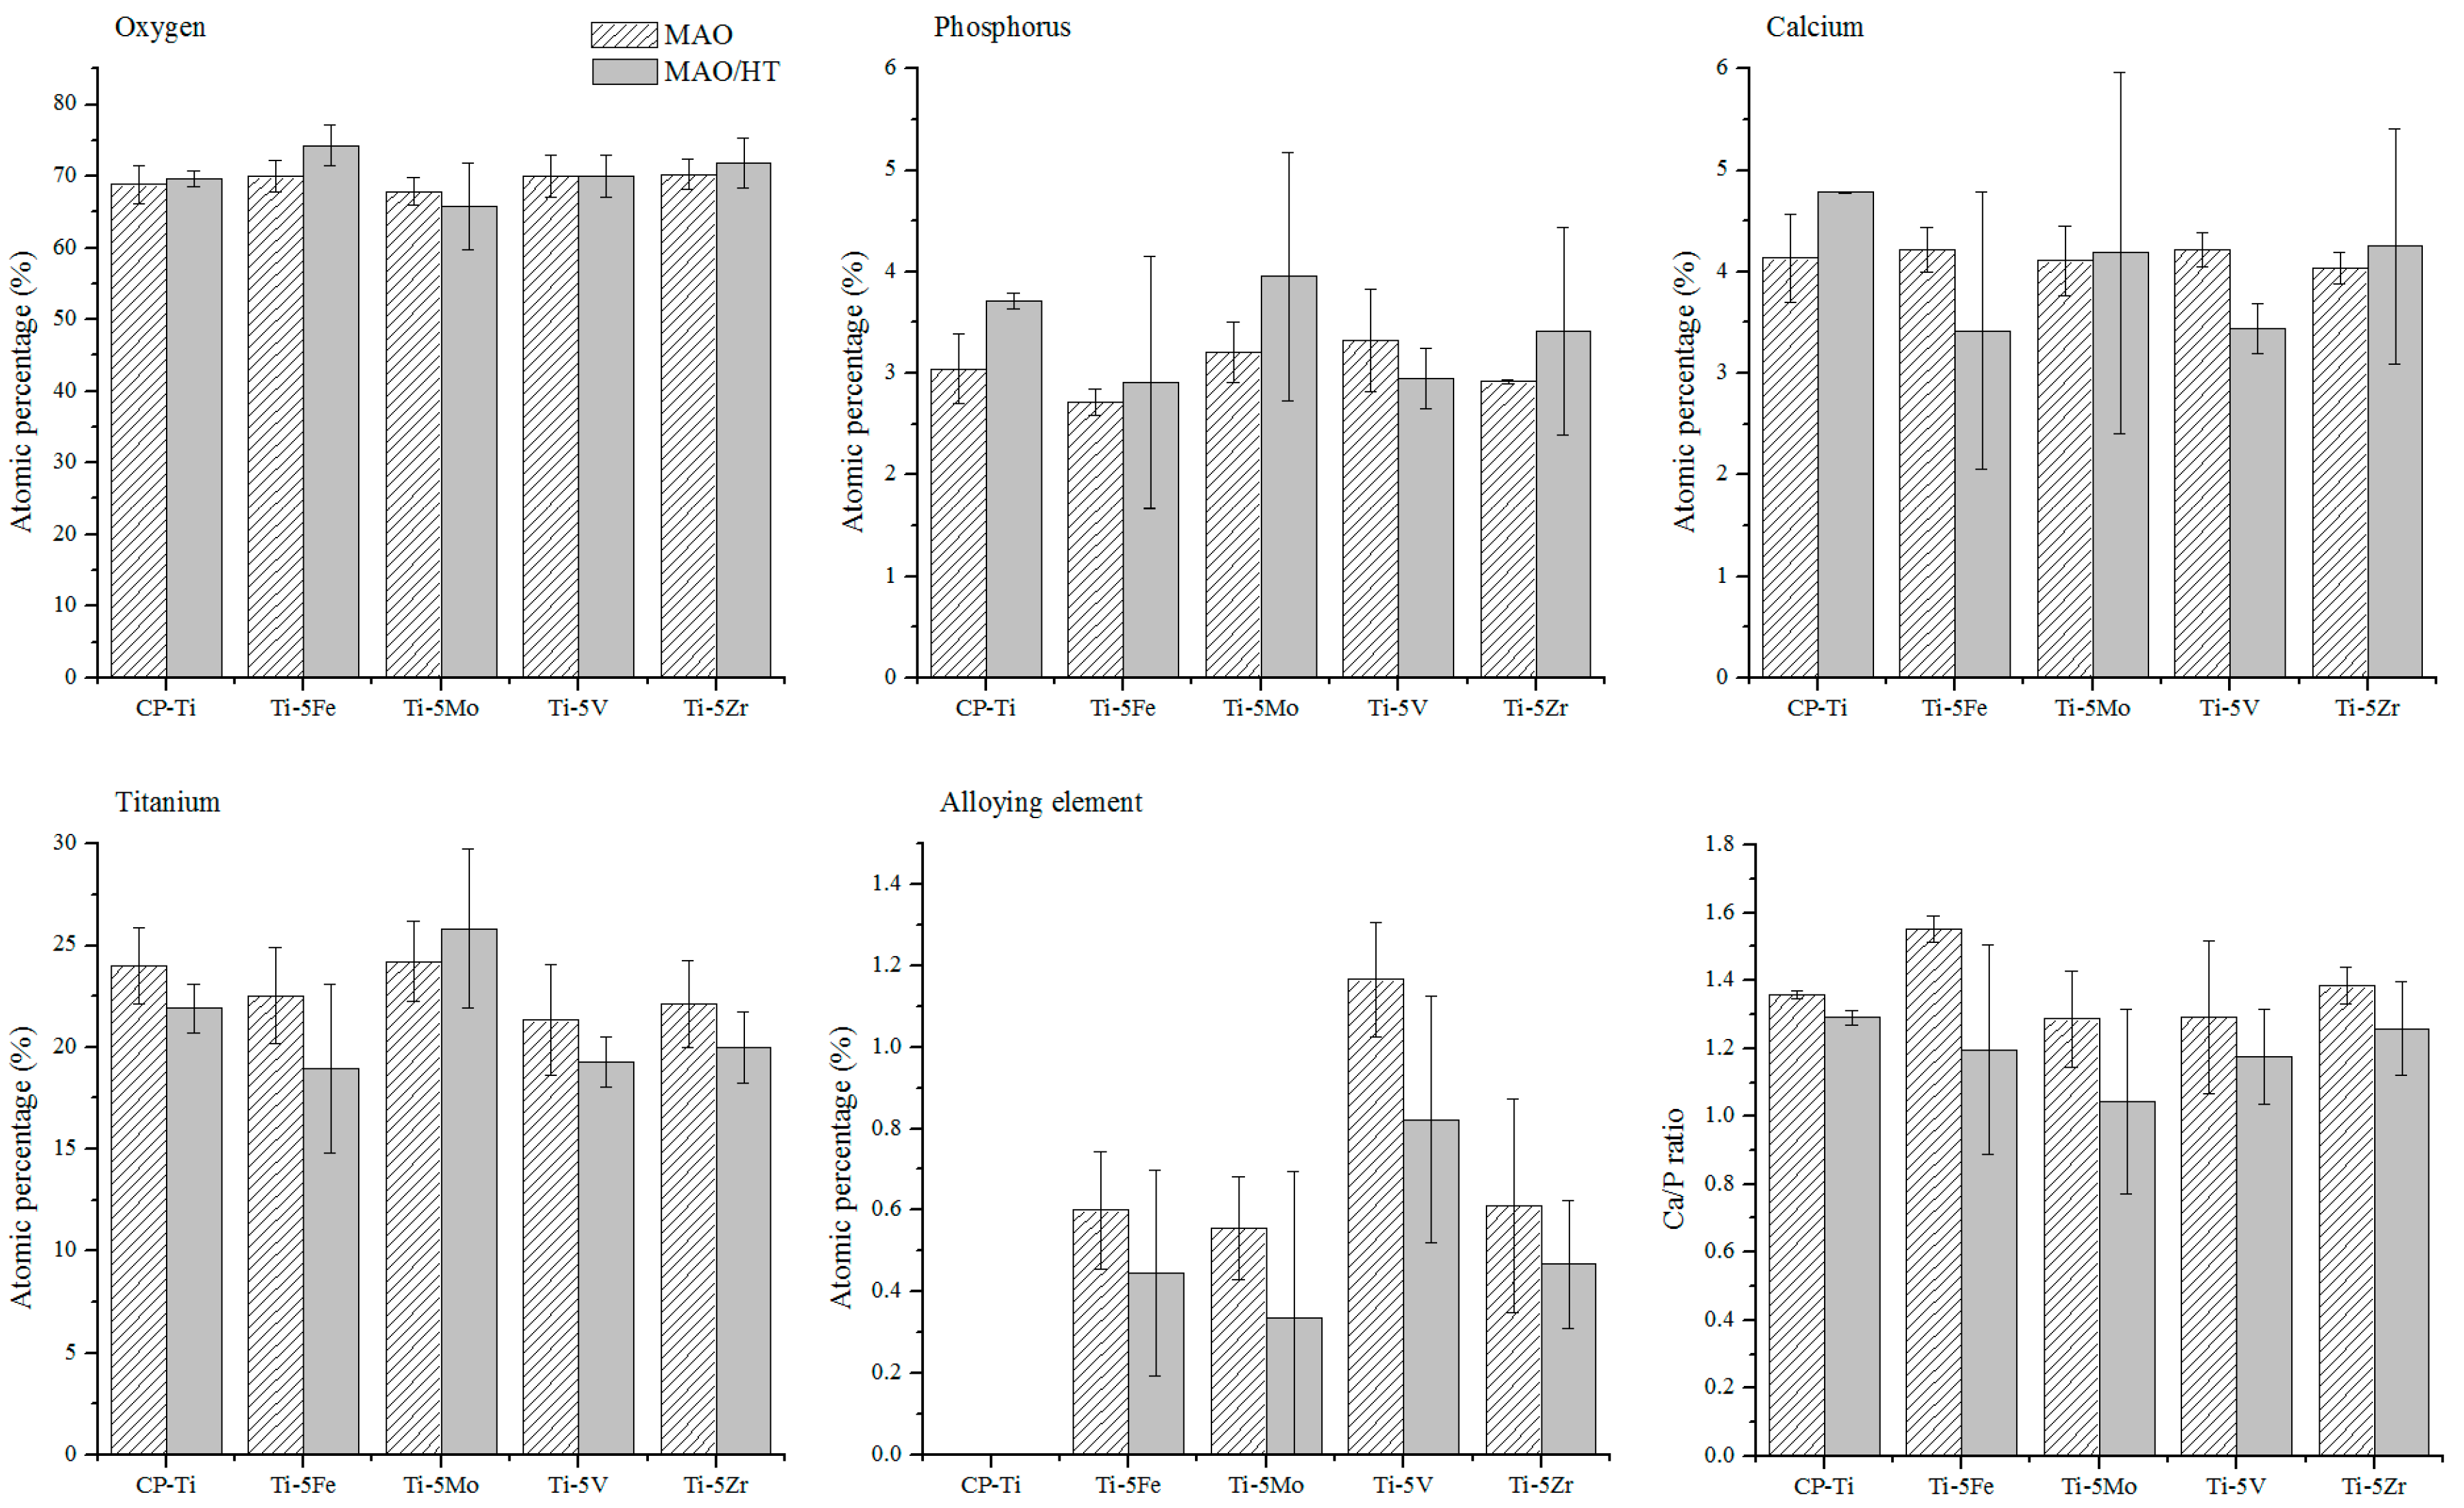
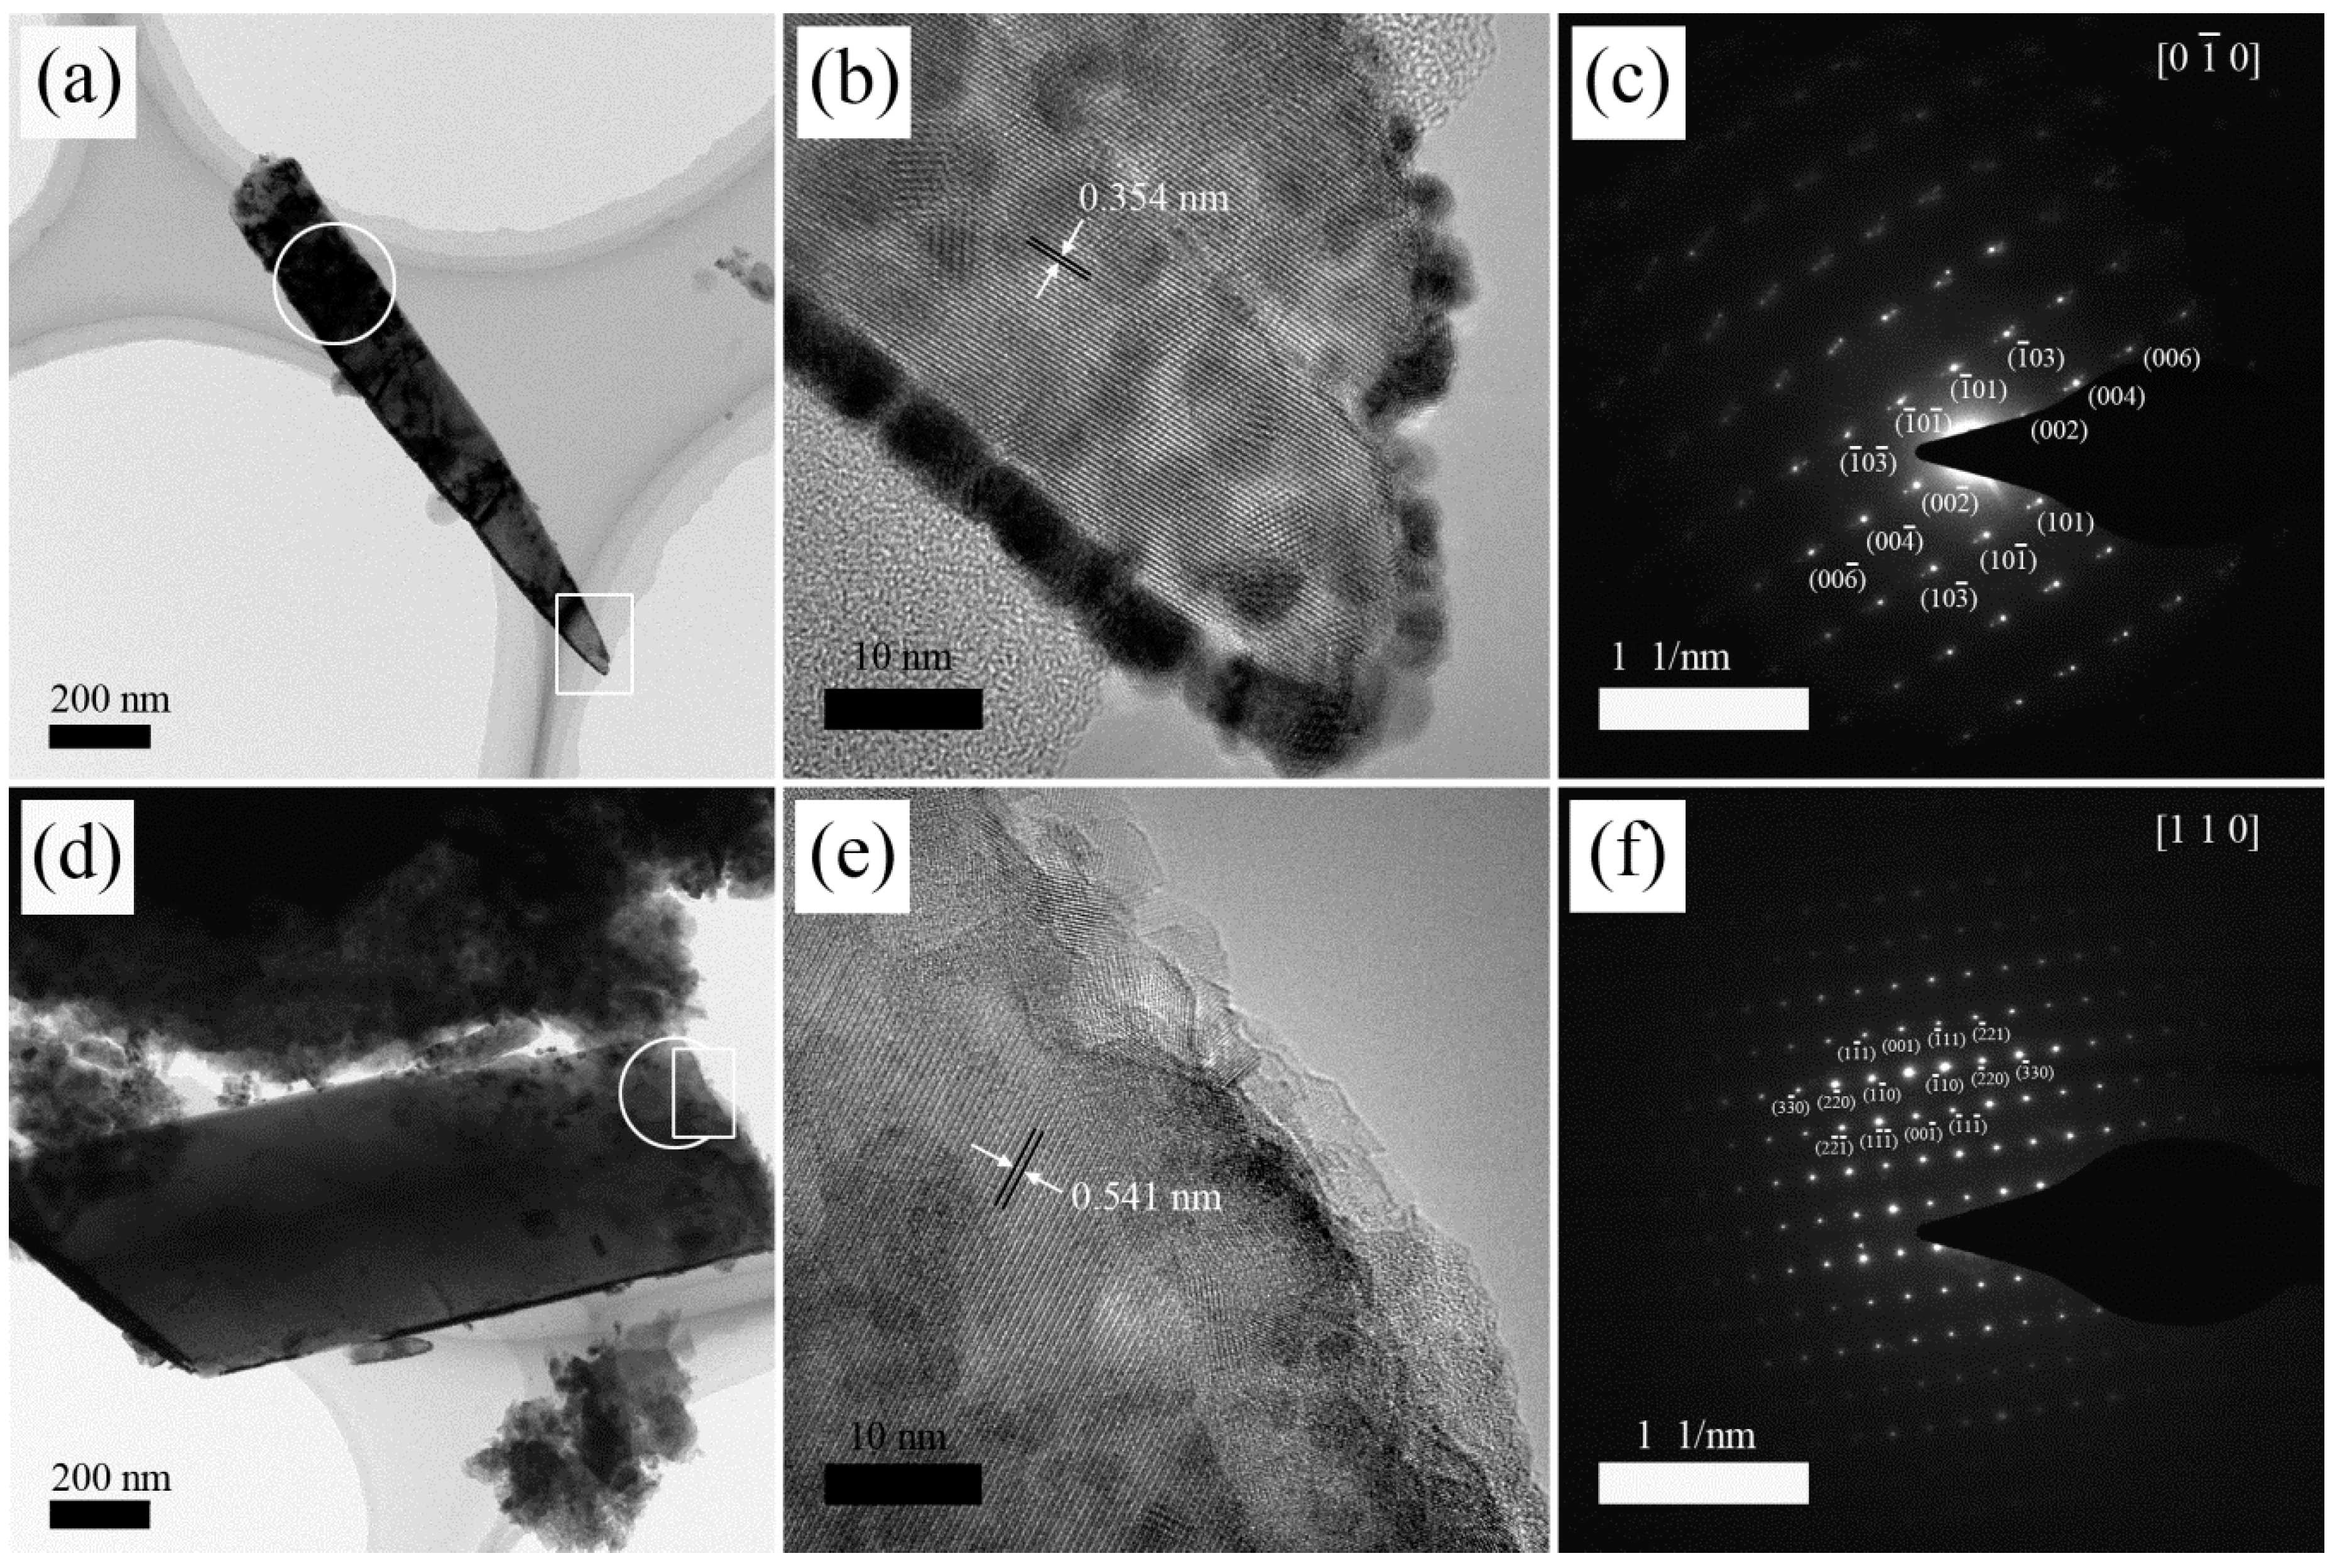
3.3. Chemical Composition and Crystalline Structure
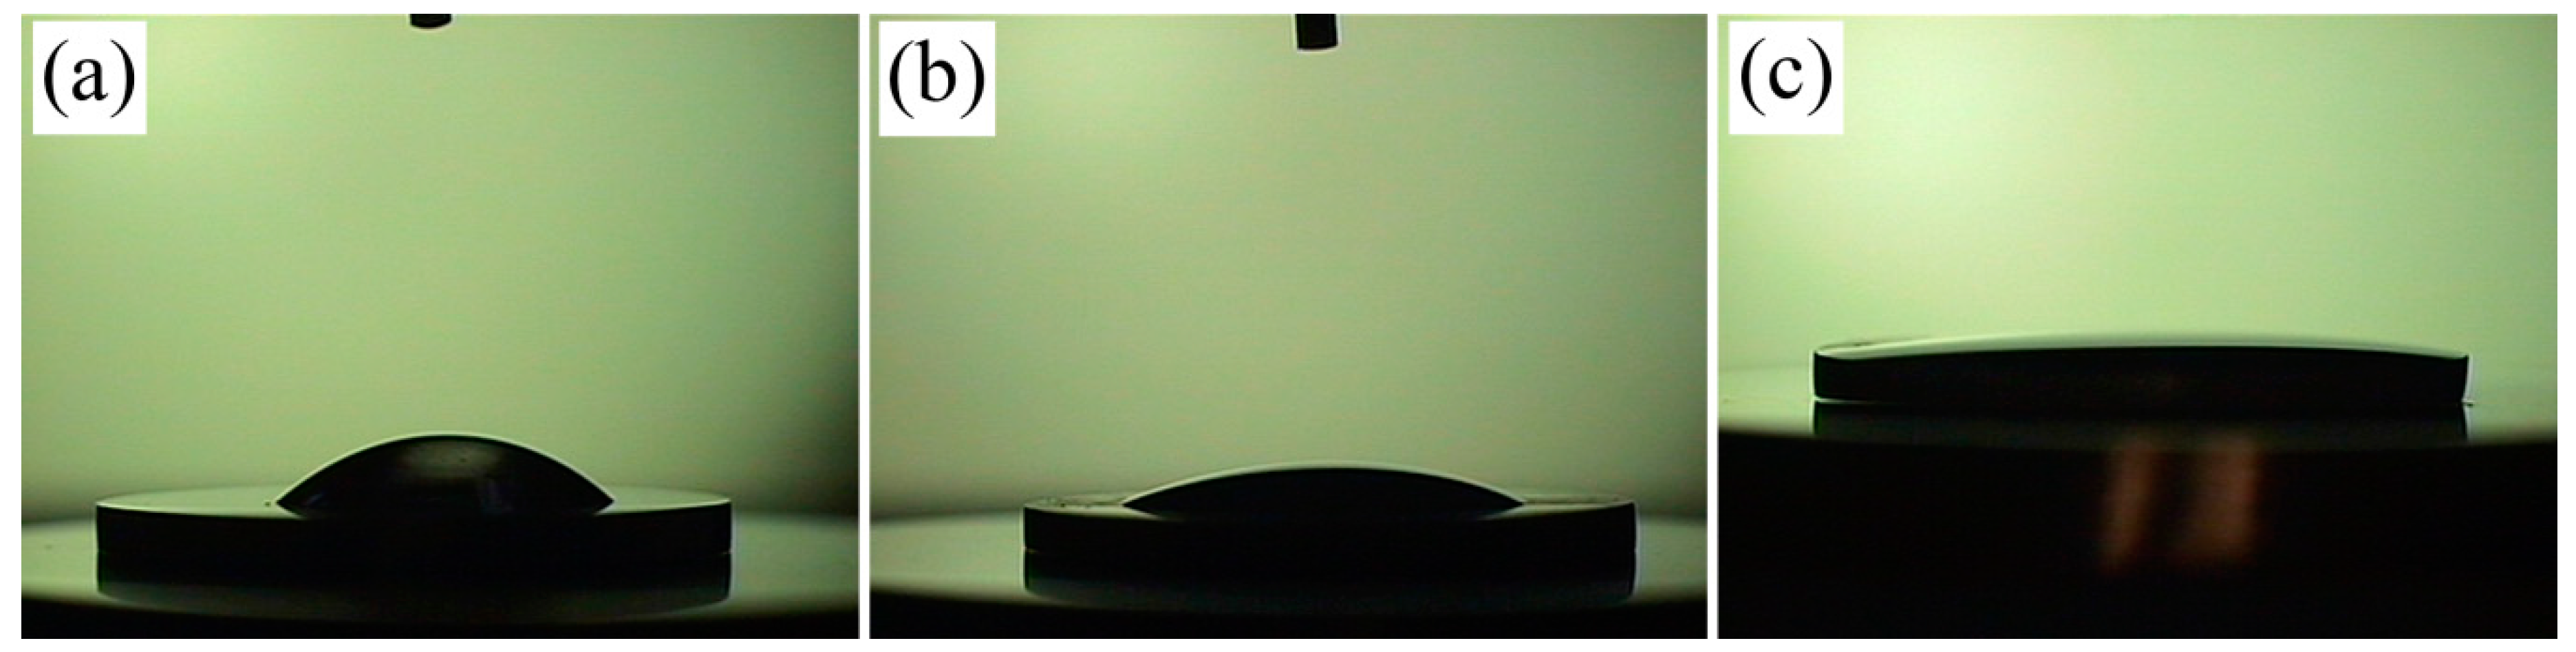
Figure 5 shows the changes in elemental content of MAO-treated samples after hydrothermal treatment. After hydrothermal treatment, the average Ti content of MAO-treated samples, except for Ti-5Mo(MAO), was generally decreased due to the increase in O, P, and Ca contents. The increase in average O and P contents of MAO/HT-treated samples was responsible for hydrothermal oxidation of MAO-treated samples in electrolyte containing P ions. The increase in average Ca content of Ti alloys(MAO/HT) was attributed to the decrease in contents of Ti and alloying elements. Among Ti alloys(MAO/HT), Ti-5Mo(MAO/HT) had the lowest content of alloying element, indicating a higher degree of alloying element release. The average Ca/P ratios in MAO-treated samples were between 1.25 and 1.55. After HT treatment, the average Ca/P ratios were decreased to 1.04–1.29 and these values were much lower than the Ca/P value (1.67) of hydroxyapatite. The lower Ca/P ratio is attributed to the extra P content, which did not participate in the reaction of hydroxyapatite formation on the surfaces of MAO/HT-treated samples.
Confirmation of acicular nano-sized and micron-sized particles (see Figure 4) was obtained by TEM observation and SAED pattern analyses of MAO/HT-treated Ti-5Zr. In Figure 6, for the observation of each particle, the high-resolution TEM (middle images) and SAED pattern (right images) were obtained from the rectangular area and the circled area of the left image, respectively. The lattice spacing values were measured 10 times by ImageJ software and averaged. From the high-resolution TEM (Figure 6b) of acicular particle with approximately 170 nm diameter and 1270 nm length, the lattice spacing was found to be 0.354 nm, which is corresponding to the lattice spacing of anatase TiO2 (101) plane. The bright spots of Figure 6c were indexed to tetragonal anatase TiO2 structure for [ 0 1 ¯ 0 ] beam direction. The lattice spacing of Figure 6e was 0.541 nm, which is corresponding to the lattice spacing of (011) plane for hexagonal HAp. The spots of Figure 6f were indexed to HAp for [110] beam direction.

3.4. Contact Angles

Figure 7 shows the representative contact angle images of surface-treated cp-Ti samples. The contact angle of MAO/HT-treated cp-Ti (Figure 7c) was decreased than POL- and MAO-treated cp-Ti (Figure 7a,b). Table 3 lists the contact angles of water on POL-, MAO-, and MAO/HT-treated sample surfaces. POL-treated Ti-5Mo, Ti-5V, and Ti-5Zr had higher contact angles than POL-treated cp-Ti and Ti-5Fe. After MAO treatment, the contact angles of POL-treated samples were decreased from 40°–62° to 21°–30°. The contact angles of MAO/HT-treated samples were decreased considerably to values approaching zero, indicating super-hydrophilic property. However, a statistically significant difference was not observed in the contact angle between alloy types within MAO- or MAO/HT-treated sample groups.

3.5. Surface Roughness Data

The Ra and Rt values of Ti-5Fe(POL) and Ti-5Mo(POL) were relatively lower than those of cp-Ti(POL), as can be seen in Table 4. Ti-5V(POL) and Ti-5Zr(POL) had similar surface profile values. All MAO- and MAO/HT-treated samples exhibited increased surface roughness (Figure 8) and parameters (Table 4) compared to POL-treated samples. Especially, the Rt values of MAO-treated samples were increased notably than POL-treated samples. Among the MAO-treated samples, cp-Ti(MAO) and Ti-5Zr(MAO) showed higher Ra and Rt values, and Ti-5Mo(MAO) showed the lowest Ra and Rt values. Significant changes in the Ra values were not clearly observed before and after HT treatment between same samples. Relatively lower Ra values were observed in MAO/HT-treated Ti-5Fe, Ti-5Mo, and Ti-5V compared to those of MAO/HT-treated cp-Ti and Ti-5Zr. The Rt values of MAO/HT-treated samples were decreased than those of MAO-treated samples due to the formation of nano-sized rods on microporous surface. MAO/HT-treated cp-Ti and Ti-5Zr showed statistically non-significant increase in Rt value.

3.6. ICP-MS Analyses

ICP analyses were performed to measure the released Ti and alloying elements and the results are presented in Table 5. Ti content in the extraction lysate for cp-Ti was increased after MAO treatment. Ti contents in the extraction lysate for Ti alloys(MAO) were lower than that in cp-Ti(MAO). It was observed that the release of Ti content from the oxide layer containing alloying element to the solution is more protected than that from the oxide layer without alloying element. The alloying element contents released from Ti-5Fe and Ti-5Mo samples were increased in the order of POL < MAO < MAO/HT. Especially, the Mo content released from Ti-5Mo(MAO/HT) was notably increased by approximately 300 times than that released from Ti-5Mo(POL). The concentration of released alloying element was much lower than that of Ti element, and the micro/nanoporous surfaces resulted in a facile release of Ti and alloying elements compared to polished- and microporous surfaces (Table 5). However, the V content released from Ti-5V was decreased after MAO and MAO/HT treatments. There was no significant difference in the released Zr content between Ti-5Zr sample groups. Among the tested samples, the smallest content of released alloying element was found in Ti-5Zr samples and it was 0.02 ppb.
Figure 9 shows the effect of surface roughness on initial cell adhesion. The surfaces of MAO- and MAO/HT-treated samples showed higher cell spreading than that of cp-Ti(POL). However, significant differences were not observed in cell spreading between MAO- and MAO/HT-treated sample groups. As the surface became micro/nanoporous, the hydrophilicity of the surface was increased, as we have reported in the previous paper [8]. Although the hydrophilic surface was expected to improve cell spreading, cell adhesion and spreading on the micro/nanoporous surfaces were not increased compared to those on the microporous surfaces, as shown in Figure 9 and Table 6. Although the microporous surfaces of Ti alloys had higher cell spreading areas and number of attached cells, weaker cell adhesion was observed, as can be seen in Figure 9. However, cell adhesion was increased on the micro/nanoporous surfaces with higher hydrophilicity. Ti alloy(POL) surfaces showed improved cell spreading and adhesion than the cp-Ti(POL) surface. Among Ti alloys(MAO), increased cell spreading and adhesion were observed in Ti-5Fe and Ti-5Mo samples having greater number of pores, while lower cell spreading and adhesion were observed in Ti-5V having lesser number of pores (Table 2).

3.7. MTT Assay Tests

MTT assay tests were carried out to measure the cytotoxic effect of the surface itself and the ions released from the surface. In the case of MTT assay tests on the surfaces, except for Ti-5Fe(POL), the sample surfaces showed significantly lower cell viability (62%–86%) than that (100%) of the control, as shown in Figure 10a. As the surface was changed from microstructure to micro/nano structure, the average cell viability was correspondingly decreased for cp-Ti, Ti-5Fe and Ti-5V samples as shown in Figure 10a, with the exception of Ti-5Mo(MAO) and Ti-5Zr(MAO). MAO/HT-treated samples showed cell viability of 62%–73%. We think that the lower cell viability (62%) of Ti-5Mo(MAO/HT) was responsible for the lowest Ca/P ratio, as shown in EDS data presented in Figure 5. In Figure 10b, MTT test results for extraction lysate showed a higher cell viability than that measured on the surfaces. Ti-5Mo(MAO/HT) and Ti-5Fe(MAO/HT) showed the highest cell viability and the lowest cell viability, respectively, which were related to their ICP results shown in Table 5. From the results, we could identify that a trace amount of molybdate positively affected the organism, while Fe ions were lethal for cells [19,20].

3.8. Total Protein and ALPase Activity

Figure 11 shows the total protein and ALPase activity in POL-, MAO-, and MAO/HT-treated samples at 3, 7, and 14 days. The tendency of total protein content in the samples at 3 days was similar to the MTT assay results obtained for the surfaces. After incubation of cells for 7 days, the total protein contents in the samples were in the order of POL > MAO > MAO/HT, and there was no statistical significance between the total protein contents obtained from the different alloy samples prepared by same surface treatment. Meanwhile, the total protein contents in cp-Ti samples were in the order of POL < MAO < MAO/HT at 14 days. The total protein contents in Ti-5Fe(MAO), Ti-5Mo(MAO), and Ti-5Zr(MAO/HT) were decreased significantly compared to those of MAO- and MAO/HT-treated cp-Ti. The ALPase activity in the samples at 3 days, a progressive increase in ALPase activity (POL < MAO < MAO/HT) was found in cp-Ti and Ti alloy samples. Among MAO/HT-treated Ti alloy samples, only MAO/HT-treated Ti-5Mo and Ti-5Zr showed statistically significant increase in ALPase activity compared to that of MAO/HT-treated cp-Ti. After 7 and 14 days, Ti-5V(MAO) exhibited notably higher ALPase activity. In the EDS results shown in Figure 5, Ti-5V(MAO) samples showed highest alloying element content among the Ti alloy samples and these V components could be responsible for the higher level of initial osteoblast-like cell differentiation. At 7 days, except for Ti-5V(MAO/HT), ALPase activities of MAO/HT-treated samples were higher than those of POL- and MAO-treated samples except for Ti-5V samples, and this tendency was opposite to the tendency found in the total protein contents for the samples at 7 days. These results suggest that micro/nanoporous surfaces have a positive influence on differentiation of MG-63 cells. After 14 days, when compared to ALPase activities of MAO- and MAO/HT-treated cp-Ti, statistically non-significant increase in ALPase activity was observed in MAO/HT-treated cp-Ti, Ti-5Mo, Ti-5V, and Ti-5Zr samples. MAO/HT-treated Ti-5Fe showed statistically non-significant lower ALPase activity compared to those of POL-, MAO-, and MAO/HT-treated cp-Ti. ALPase activity of Ti-5Fe(MAO/HT) was possibly reduced due to the influence of released Fe ions (Table 5).

4. Conclusions

In order to increase bioactivity, the Ca and P ions were incorporated in the microporous oxide layers of binary Ti alloys containing Fe, Mo, V or Zr element using MAO process. By hydrothermal treatment of the microporous layer, the bioactivity of hydroxyapatite and hydrophilicity of the micro/nanoporous surface were achieved in order to increase cell differentiation. Microporous and micro/nanoporous surfaces resulted in increased initial cell adhesion. Although the micro/nanoporous surfaces had a lower total protein content than the smooth surfaces and the microporous surfaces after incubation of MG-63 osteoblast-like cells for 7 days, the micro/nanoporous surfaces had a tendency of higher ALPase activities. Meanwhile, Mo and V ions released from the microporous or micro/nanoporous oxide layers acted positively to achieve higher cell viability and differentiation, but the released Fe ions resulted in decreased cell viability and differentiation. It is concluded that cell differentiation depends on the microstructure and alloying element type of Ti alloy.

Acknowledgments

This work was supported by Chonnam National University (2015), and by the National Research Foundation of Korea (NRF) grant funded by the Korea government (MSIP) (No. 2011-0030121).

Author Contributions

Ok-Sung Han analyzed the cell differentiation properties of Ti alloys. Moon-Jin Hwang conducted the microstructural characterization. The technical knowledge for cell differentiation on the surface treated Ti alloys was provided by Yo-Han Song and Ho-Jun Song. The research work outlined in this paper was designed and supervised by Yeong-Joon Park.

Conflicts of Interest

The authors declare no conflict of interest.

References

  1. Sul, Y.J.; Johansson, C.B.; Petronis, S.; Krozer, A.; Jeong, Y.; Wennerberg, A.; Albrektsson, T. Characteristics of the surface oxides on turned and electrochemically oxidized pure titanium implants up to dielectric breakdown: The oxide thickness, micropore configurations, surface roughness, crystal structure and chemical composition. Biomaterials 2002, 23, 491–501. [Google Scholar] [CrossRef]
  2. Ishizawa, H.; Fujino, M.; Ogino, M. Histomorphometric evaluation of the thin hydroxyapatite layer formed through anodization followed by hydrothermal treatment. J. Biomed. Mater. Res. 1997, 35, 199–206. [Google Scholar] [CrossRef]
  3. Liu, F.; Wang, F.; Shimizu, T.; Igarashi, K.; Zhao, L. Formation of hydroxyapatite on Ti-6Al-4V alloy by microarc oxidation and hydrothermal treatment. Surf. Coat. Technol. 2005, 199, 220–224. [Google Scholar] [CrossRef]
  4. Deligianni, D.D.; Katsala, N.; Ladas, S.; Sotiropoulou, D.; Amedee, J.; Missirlis, Y. Effect of surface roughness of the titanium alloy Ti-6Al-4V on human bone marrow cell response and on protein adsorption. Biomaterials 2001, 22, 1241–1251. [Google Scholar] [CrossRef]
  5. D’Lima, D.D.; Lemperle, S.M.; Chen, P.C.; Holmes, R.E.; Colwell, C.W. Bone response to implant surface morphology. J. Arthroplast. 1998, 13, 928–934. [Google Scholar] [CrossRef]
  6. Vandrovcová, M.; Bacakova, L. Adhesion, growth and differentiation of osteoblasts on surface-modified materials developed for bone implants. Physiol. Res. 2011, 60, 403–417. [Google Scholar] [PubMed]
  7. Chun, A.L.; Moralez, J.G.; Fenniri, H.; Webster, T.J. Helical rosette nanotubes: A more effective orthopaedic implant material. Nanotechnology 2004, 15, S234–S239. [Google Scholar] [CrossRef]
  8. Song, Y.H.; An, J.H.; Seo, Y.W.; Moon, W.J.; Park, Y.J.; Song, H.J. Osteoblast cell adhesion and viability on nanostructured surfaces of porous titanium oxide layer. J. Nanosci. Nanotechnol. 2014, 14, 5682–5687. [Google Scholar] [CrossRef] [PubMed]
  9. Bania, P.J. Beta titanium alloys and their role in the titanium industry. JOM 1994, 46, 16–19. [Google Scholar] [CrossRef]
  10. Biesiekierski, A.; Wang, J.; Gepreel, M.A.H.; Wen, C. A new look at biomedical Ti-based shape memory alloys. Acta Biomater. 2012, 8, 1661–1669. [Google Scholar] [CrossRef] [PubMed]
  11. Mendel, R.R. Cell biology of molybdenum in plants. Plant Cell Rep. 2011, 30, 1787–1797. [Google Scholar] [CrossRef] [PubMed]
  12. Collery, P.; Corbella, J.; Domingo, J.L.; Etienne, J.C.; Llobet, J.M. Metal ions in Biology and Medicine; John Libbery Eurotext: Montrouge, France, 1996; Volume 4, pp. 294–297. [Google Scholar]
  13. Park, Y.J.; Song, Y.H.; An, J.H.; Song, H.J.; Anusavice, K.J. Cytocompatibility of pure metals and experimental binary titanium alloys for implant materials. J. Dent. 2013, 41, 1251–1258. [Google Scholar] [CrossRef] [PubMed]
  14. Wen, C.E.; Xu, W.; Hu, W.Y.; Hodgson, P.D. Hydroxyapatite/titania sol-gel coatings on titanium-zirconium alloy for biomedical applications. Acta Biomater. 2007, 3, 403–410. [Google Scholar] [CrossRef] [PubMed]
  15. Sista, S.; Wen, C.; Hodgson, P.D.; Pande, G. The influence of surface energy of titanium-zirconium alloy on osteoblast cell functions in vitro. J. Biomed. Mater. Res. A 2011, 97, 27–36. [Google Scholar] [CrossRef] [PubMed]
  16. Saulacic, N.; Bosshardt, D.D.; Bornstein, M.M.; Berner, S.; Buser, D. Bone apposition to a titanium-zirconium alloy implant, as compared to two other titanium-containing implants. Eur. Cell. Mater. 2012, 23, 273–288. [Google Scholar] [PubMed]
  17. Liu, F.; Song, Y.; Wang, F.P.; Shimizu, T.; Igarashi, K.; Zhao, L.C. Formation characterization of hydroxyapatite on titanium by microarc oxidation and hydrothermal treatment. J. Biosci. Bioeng. 2005, 100, 100–104. [Google Scholar] [CrossRef] [PubMed]
  18. Kim, H.M.; Miyaji, F.; Kokubo, T.; Nishiguchi, S.; Nakamura, T. Graded surface structure of bioactive titanium prepared by chemical treatment. J. Biomed. Mater. Res. 1999, 45, 100–107. [Google Scholar] [CrossRef]
  19. Vardanyan, Z.; Trchounian, A. Fe(III) and Fe(II) ions different effects on Enterococcus hirae cell growth and membrane-associated ATPase activity. Biochem. Biophs. Res. Commun. 2012, 417, 541–545. [Google Scholar] [CrossRef] [PubMed]
  20. Laham, N.; Ehrlich, R. Manipulation if iron to determine survival: Competition between host and pathogen. Immunol. Res. 2004, 30, 15–28. [Google Scholar] [CrossRef]
Figure 1. Potential vs. time curves of cp-Ti and Ti alloys during a micro-arc oxidized (MAO) process.
Metals 06 00150 g001
Figure 2. XRD patterns of (a) polished (POL), (b) MAO and (c) MAO/hydrothermally treated (HT) samples.
Metals 06 00150 g002
Figure 3. SEM images of MAO-treated samples and their segmentation images obtained using ImageJ software. (a,b): cp-Ti; (c,d): Ti-5Fe; (e,f): Ti-5Mo; (g,h): Ti-5V; (i,j): Ti-5Zr.
Metals 06 00150 g003
Figure 4. SEM images of MAO/HT-treated samples. (a): cp-Ti; (b): Ti-5Fe; (c): Ti-5Mo; (d): Ti-5V; (e): Ti-5Zr.
Metals 06 00150 g004
Figure 5. Energy dispersive X-ray spectroscopy (EDS) elemental content of MAO- and MAO/HT-treated samples.
Metals 06 00150 g005
Figure 6. Transmission electron microscope (TEM) images and selected area electron diffraction (SAED) patterns of acicular TiO2 (ac) and hydroxyapatite (HAp) (df) particles formed on MAO/HT-treated Ti-5Zr. (The 1/nm unit means that the distance is in reciprocal lattice.).
Metals 06 00150 g006
Figure 7. Representative contact angle images of (a) POL-; (b) MAO-; (c) MAO/HT-treated cp-Ti.
Metals 06 00150 g007
Figure 8. The 3D surface roughness images of POL-, MAO-, and MAO/HT-treated samples.
Metals 06 00150 g008
Figure 9. Representative cell adhesion images: (left) SEM images after the incubation of MG-63 cells for 3 h on POL-, MAO-, and MAO/HT-treated sample surfaces and (right) their cell spreading images obtained using ImageJ software analysis.
Metals 06 00150 g009
Figure 10. Cell viability measured by MTT assay on (a) the surfaces and in (b) the extraction lysate for POL-, MAO-, and MAO/HT-treated samples. The experiment was repeated three times and the results are presented as mean ± SD (# p < 0.05 when compared with the control, * p < 0.05 when compared with cp-Ti(POL), ** p < 0.05 when compared with cp-Ti(MAO), *** p < 0.05 when compared with cp-Ti(MAO/HT)).
Metals 06 00150 g010
Figure 11. Total protein and ALPase activity in POL-, MAO-, and MAO/HT-treated samples. The experiment was repeated three times and the results are presented as mean ± SD (* p < 0.05 when compared with cp-Ti(POL), ** p < 0.05 when compared with cp-Ti(MAO), *** p < 0.05 when compared with cp-Ti(MAO/HT)).
Metals 06 00150 g011
Table 1. The applied current and time for anodization of commercially pure (cp)-Ti and Ti alloys.
SamplesCurrent (mA)Time (s)
cp-Ti30210
Ti-5Fe30300
Ti-5Mo30210
Ti-5V40210
Ti-5Zr30210
Table 2. The pore parameters obtained using image analysis software.
SamplesMeasuring Area (40 μm × 27 μm)
Number of PoresAverage Pore Area (μm2)Total Pore Area (μm2)
cp-Ti1700.93157.29
Ti-5Fe2810.47130.66
Ti-5Mo3530.43150.91
Ti-5V2130.57121.54
Ti-5Zr2790.56154.88
Table 3. Contact angles of POL-, MAO-, and MAO/HT-treated sample surfaces (n = 3).
SamplesContact Angle (degree)
POL (SD)MAO (SD)MAO/HT (SD)
cp-Ti40.15 (6.01) b,*28.57 (2.83) a2.13 (2.32) a
Ti-5Fe45.63 (3.06) b27.05 (8.79) a3.00 (2.61) a
Ti-5Mo62.42 (1.76) a21.37 (5.99) a1.80 (3.12) a
Ti-5V61.53 (6.03) a25.70 (7.50) a2.77 (2.48) a
Ti-5Zr55.43 (4.63) a29.85 (7.54) a0.80 (1.39) a
* Within the same column, mean values with the same superscript alphabet are not statistically different (p > 0.05). SD means standard deviation.
Table 4. Surface roughness parameters obtained from POL-, MAO-, and MAO/HT-treated sample surfaces (n = 3).
SamplesSurface Treatment (unit: μm)
POLMAOMAO/HT
Ra (1)Rq (2)Rt (3)Rz (4)RaRqRtRzRaRqRtRz
cp-Ti0.20 a,*
(0.03)
0.24 a
(0.04)
1.45 a
(0.19)
0.43 b
(0.07)
0.66 a
(0.06)
0.84 a
(0.07)
10.20 a
(0.37)
2.81 a
(0.23)
0.62 a
(0.01)
0.77 a
(0.01)
8.17 a
(1.56)
3.29 a
(0.39)
Ti-5Fe0.15 b
(0.01)
0.18 b
(0.01)
1.03 b
(0.26)
0.45 b
(0.05)
0.46 c
(0.02)
0.61 c
(0.01)
8.16 b,c
(0.74)
2.17 b,c
(0.39)
0.50 b
(0.02)
0.64 c
(0.02)
6.64 a
(0.03)
2.72 a,b
(0.40)
Ti-5Mo0.13 b
(0.00)
0.15 b
(0.01)
1.01 b
(0.03)
0.37 b
(0.07)
0.40 d
(0.01)
0.52 d
(0.01)
7.03 c
(0.25)
1.69 c
(0.10)
0.44 c
(0.02)
0.56 d
(0.03)
6.77 a
(1.96)
2.45 b
(0.32)
Ti-5V0.16 a,b
(0.00)
0.19 a,b
(0.01)
1.26 a,b
(0.06)
0.62 a
(0.01)
0.46 c
(0.03)
0.59 c,d
(0.04)
8.50 a,b,c
(1.12)
2.20 b
(0.36)
0.45 c
(0.01)
0.56 d
(0.02)
6.01 a
(0.68)
2.62 a,b
(0.37)
Ti-5Zr0.16 a,b
(0.04)
0.19 a,b
(0.05)
1.26 a,b
(0.29)
0.61 a
(0.12)
0.53 b
(0.03)
0.73 b
(0.04)
9.58 a,b
(1.62)
2.32 b
(0.09)
0.54 b
(0.04)
0.68 b
(0.03)
6.91 a
(0.33)
2.68 a,b
(0.40)
(1) Ra: the arithmetical mean of the sums of all profile values. (2) Rq: the arithmetic average of the absolute values of the roughness profile ordinates. (3) Rt: the sum from the height of the highest profile peak and the depth of the lowest profile valley within the measured length. (4) Rz: the mean value of the five Rzi values from the the five sampling lengths over the total measured length. (Rzi: the sum from the height of the highest profile peak and the depth of the lowest profile valley within a sampling length.) * Within the same column, mean values with the same superscript alphabet are not statistically different (p > 0.05). Standard deviations are in the parentheses.
Table 5. Inductively coupled plasma mass spectrometry (ICP-MS) analysis results for lysate of POL-, MAO-, and MAO/HT-treated samples extracted in phosphate-buffered saline (PBS) solution at 37 °C for 3 days.
SamplesTarget ElementConcentration (ppb)
POLMAOMAO/HT
cp-TiTi583970447068
Ti-5FeFe4.768.9315.18
Ti583158086176
Ti-5MoMo0.994.02342
Ti566957207610
Ti-5VV2151977
Ti814459066600
Ti-5ZrZr0.020.020.02
Ti624366338368
Table 6. Cell spreading areas in Figure 9 and the average number of attached cells measured at 170 μm × 250 μm (n = 7) after incubation of MG-63 cells for 3 h on POL-, MAO-, and MAO/HT-treated sample surfaces.
SamplesCell Spreading Area (μm2)
Average Number of Attached Cells (SD *)
POLMAOMAO/HT
cp-Ti2127
7.4 (0.8)
5736
7.4 (0.8)
3417
7.0 (1.3)
Ti-5Fe2586
8.1 (0.7)
9803
8.9 (1.7)
8305
9.4 (1.5)
Ti-5Mo5688
10.7 (2.3)
8341
9.3 (1.9)
7125
8.7 (2.1)
Ti-5V4135
9.0 (1.6)
3664
8.1 (1.8)
4707
7.7 (1.7)
Ti-5Zr3351
9.1 (1.9)
5750
8.7 (1.1)
5025
8.3 (2.0)
* SD: standard deviation.

