
The Influence of Specimen Thickness on the Lüders Effect of a 5456 Al-Based Alloy: Experimental Observations

Abstract
:
1. Introduction
2. Materials and Methods
3. Results
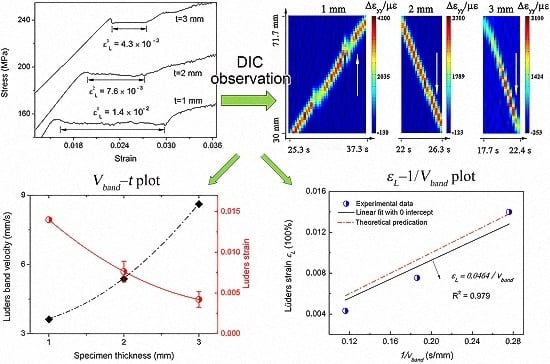
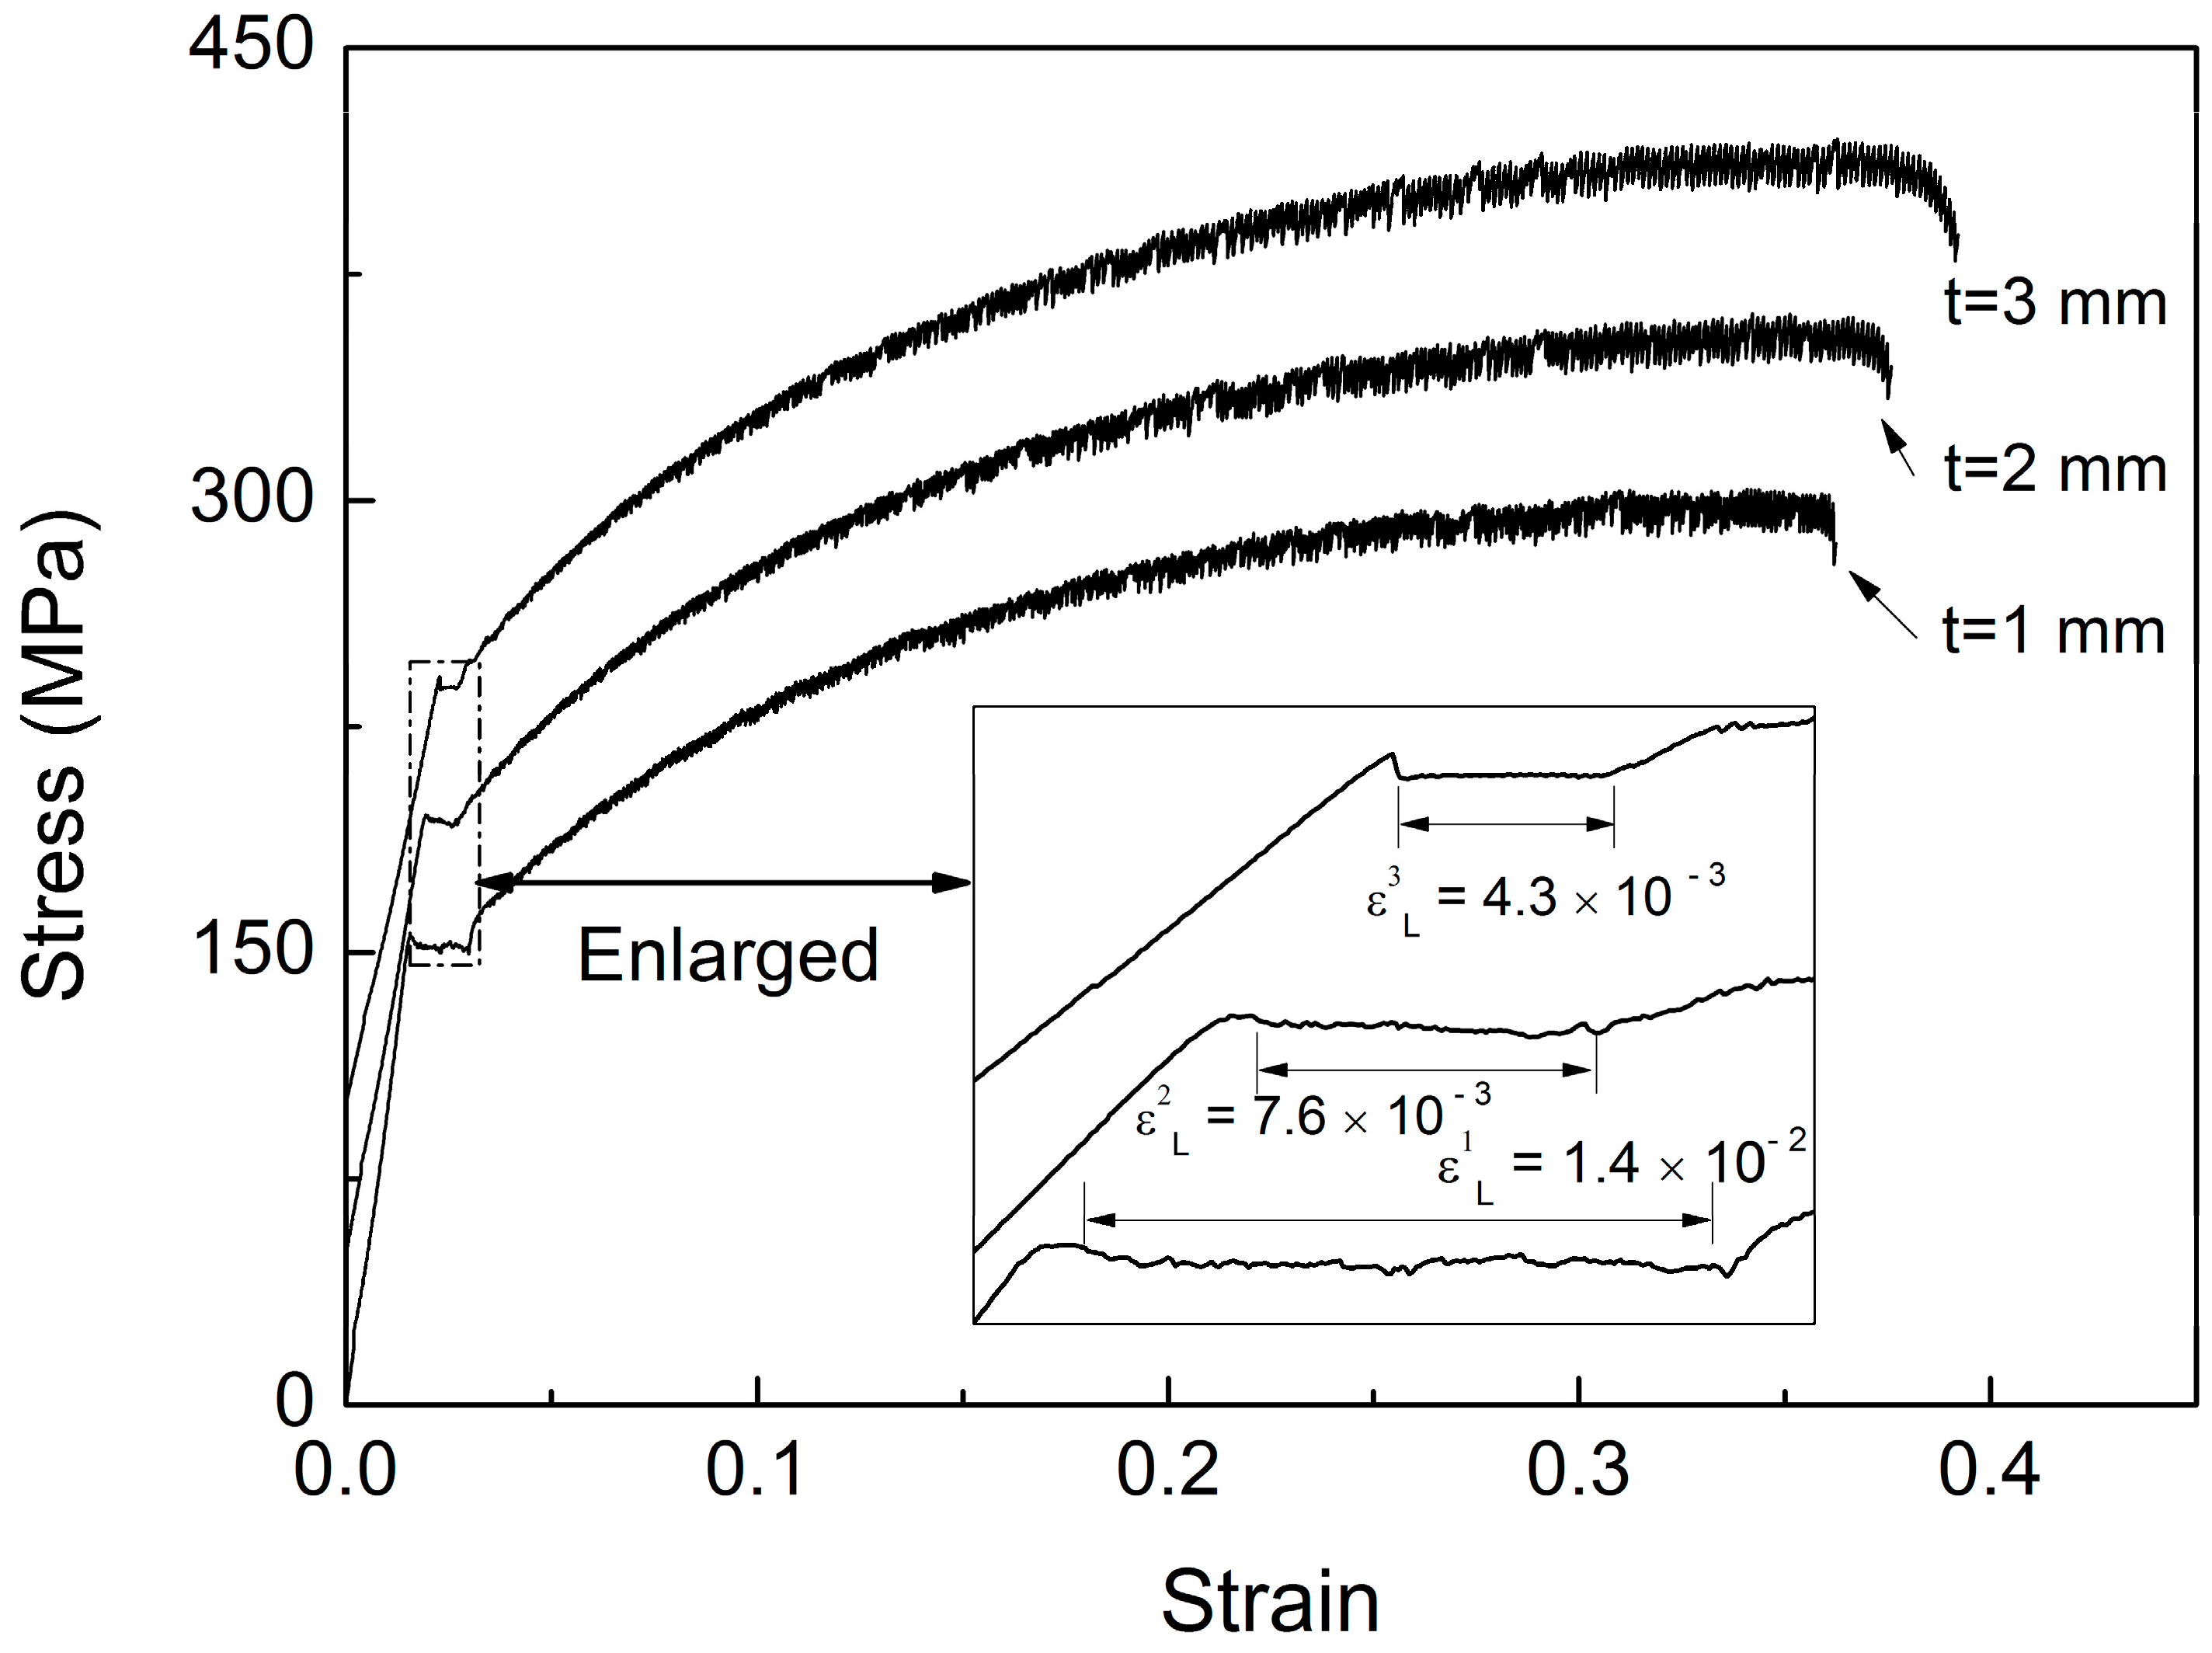
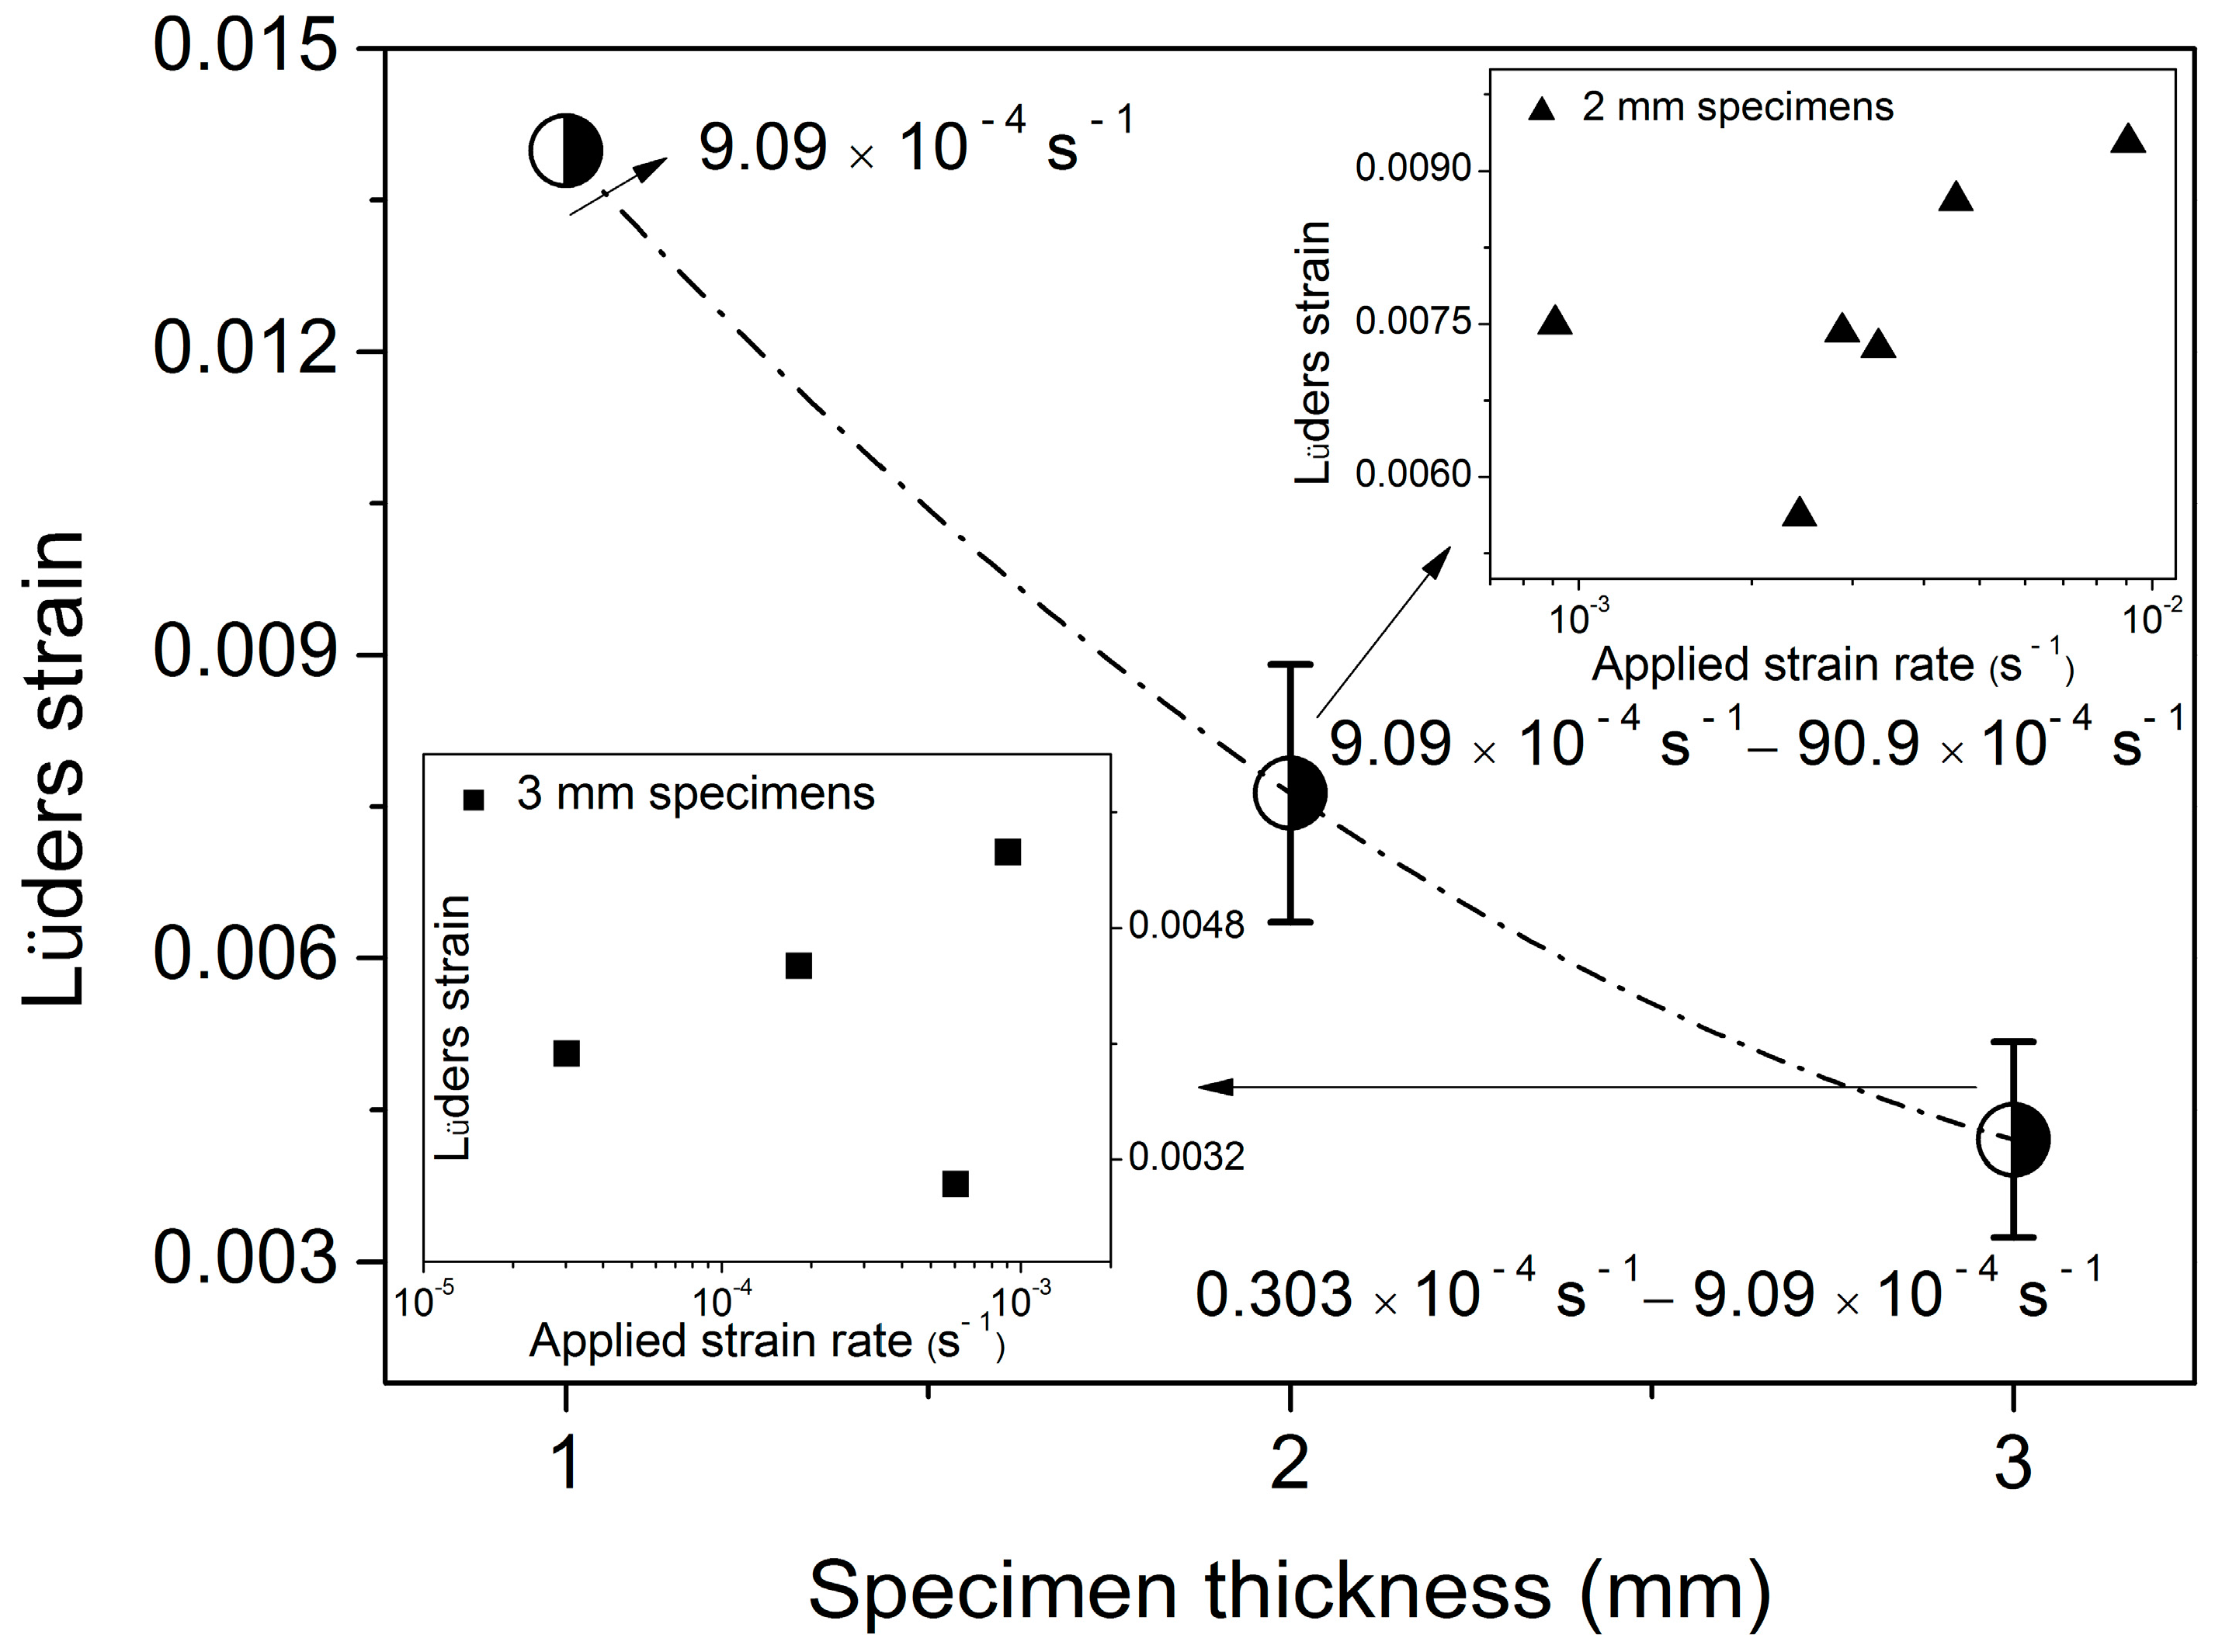
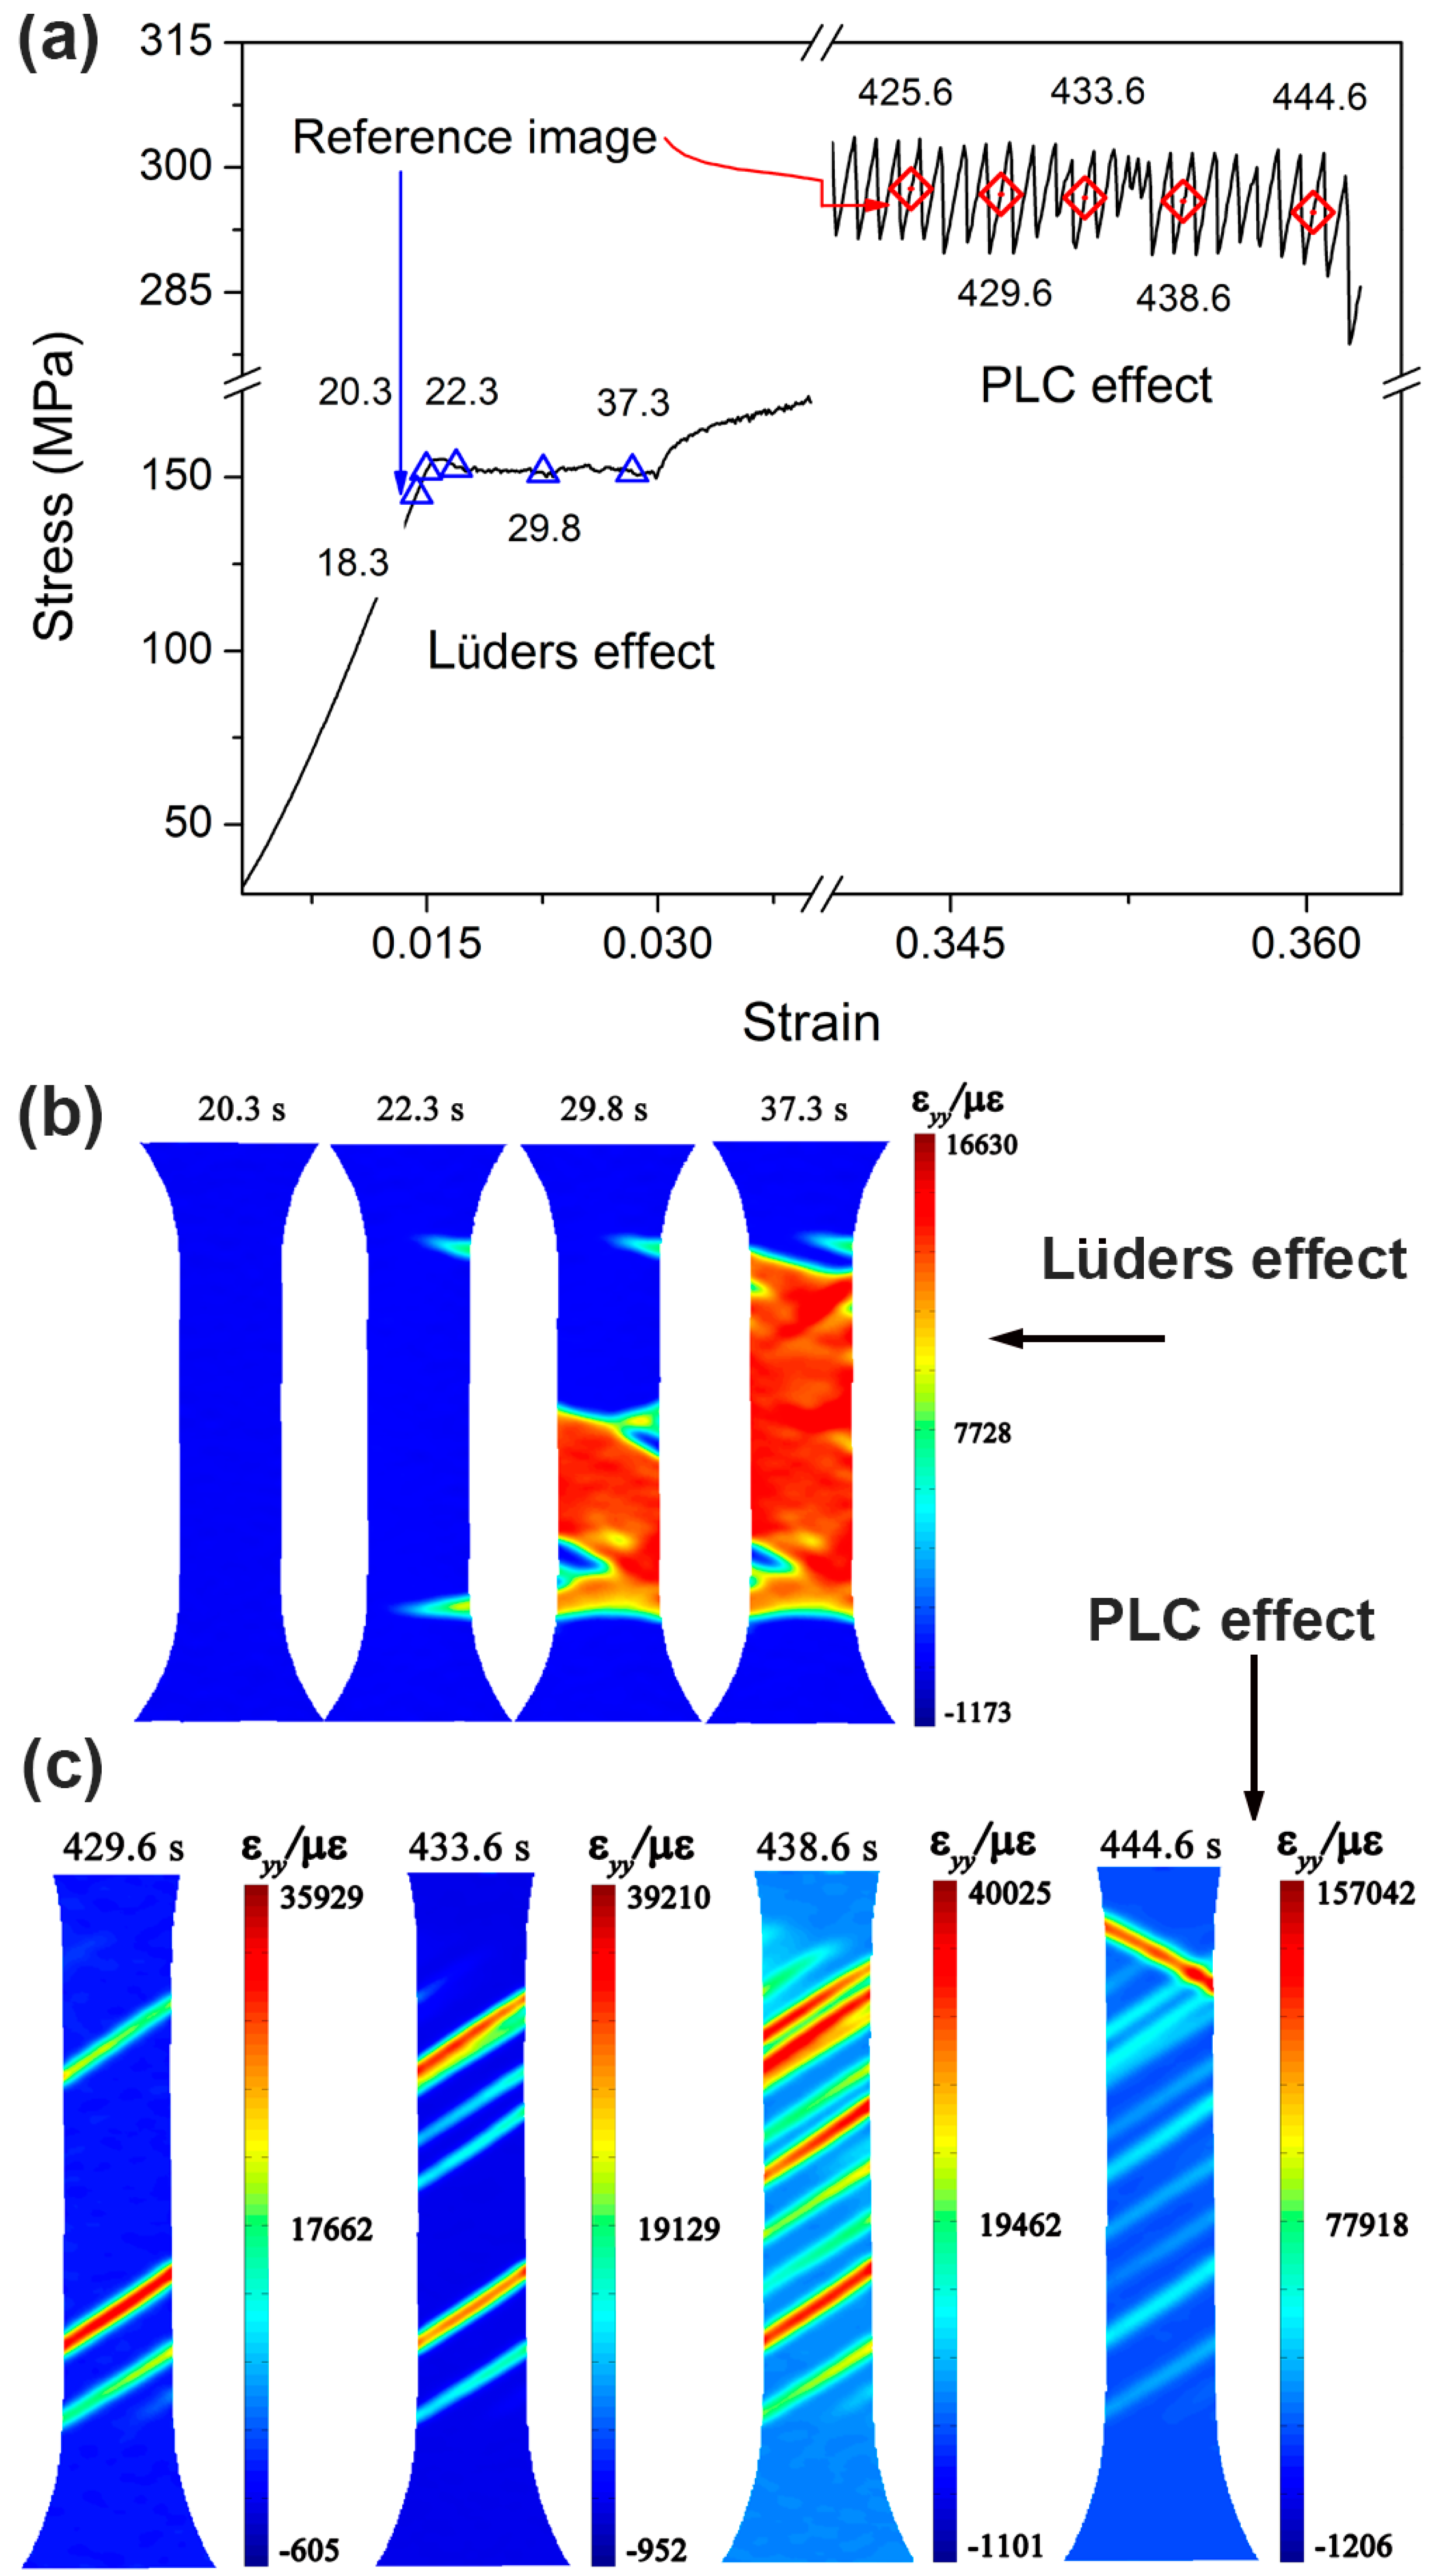
3.1. Lüders Strain
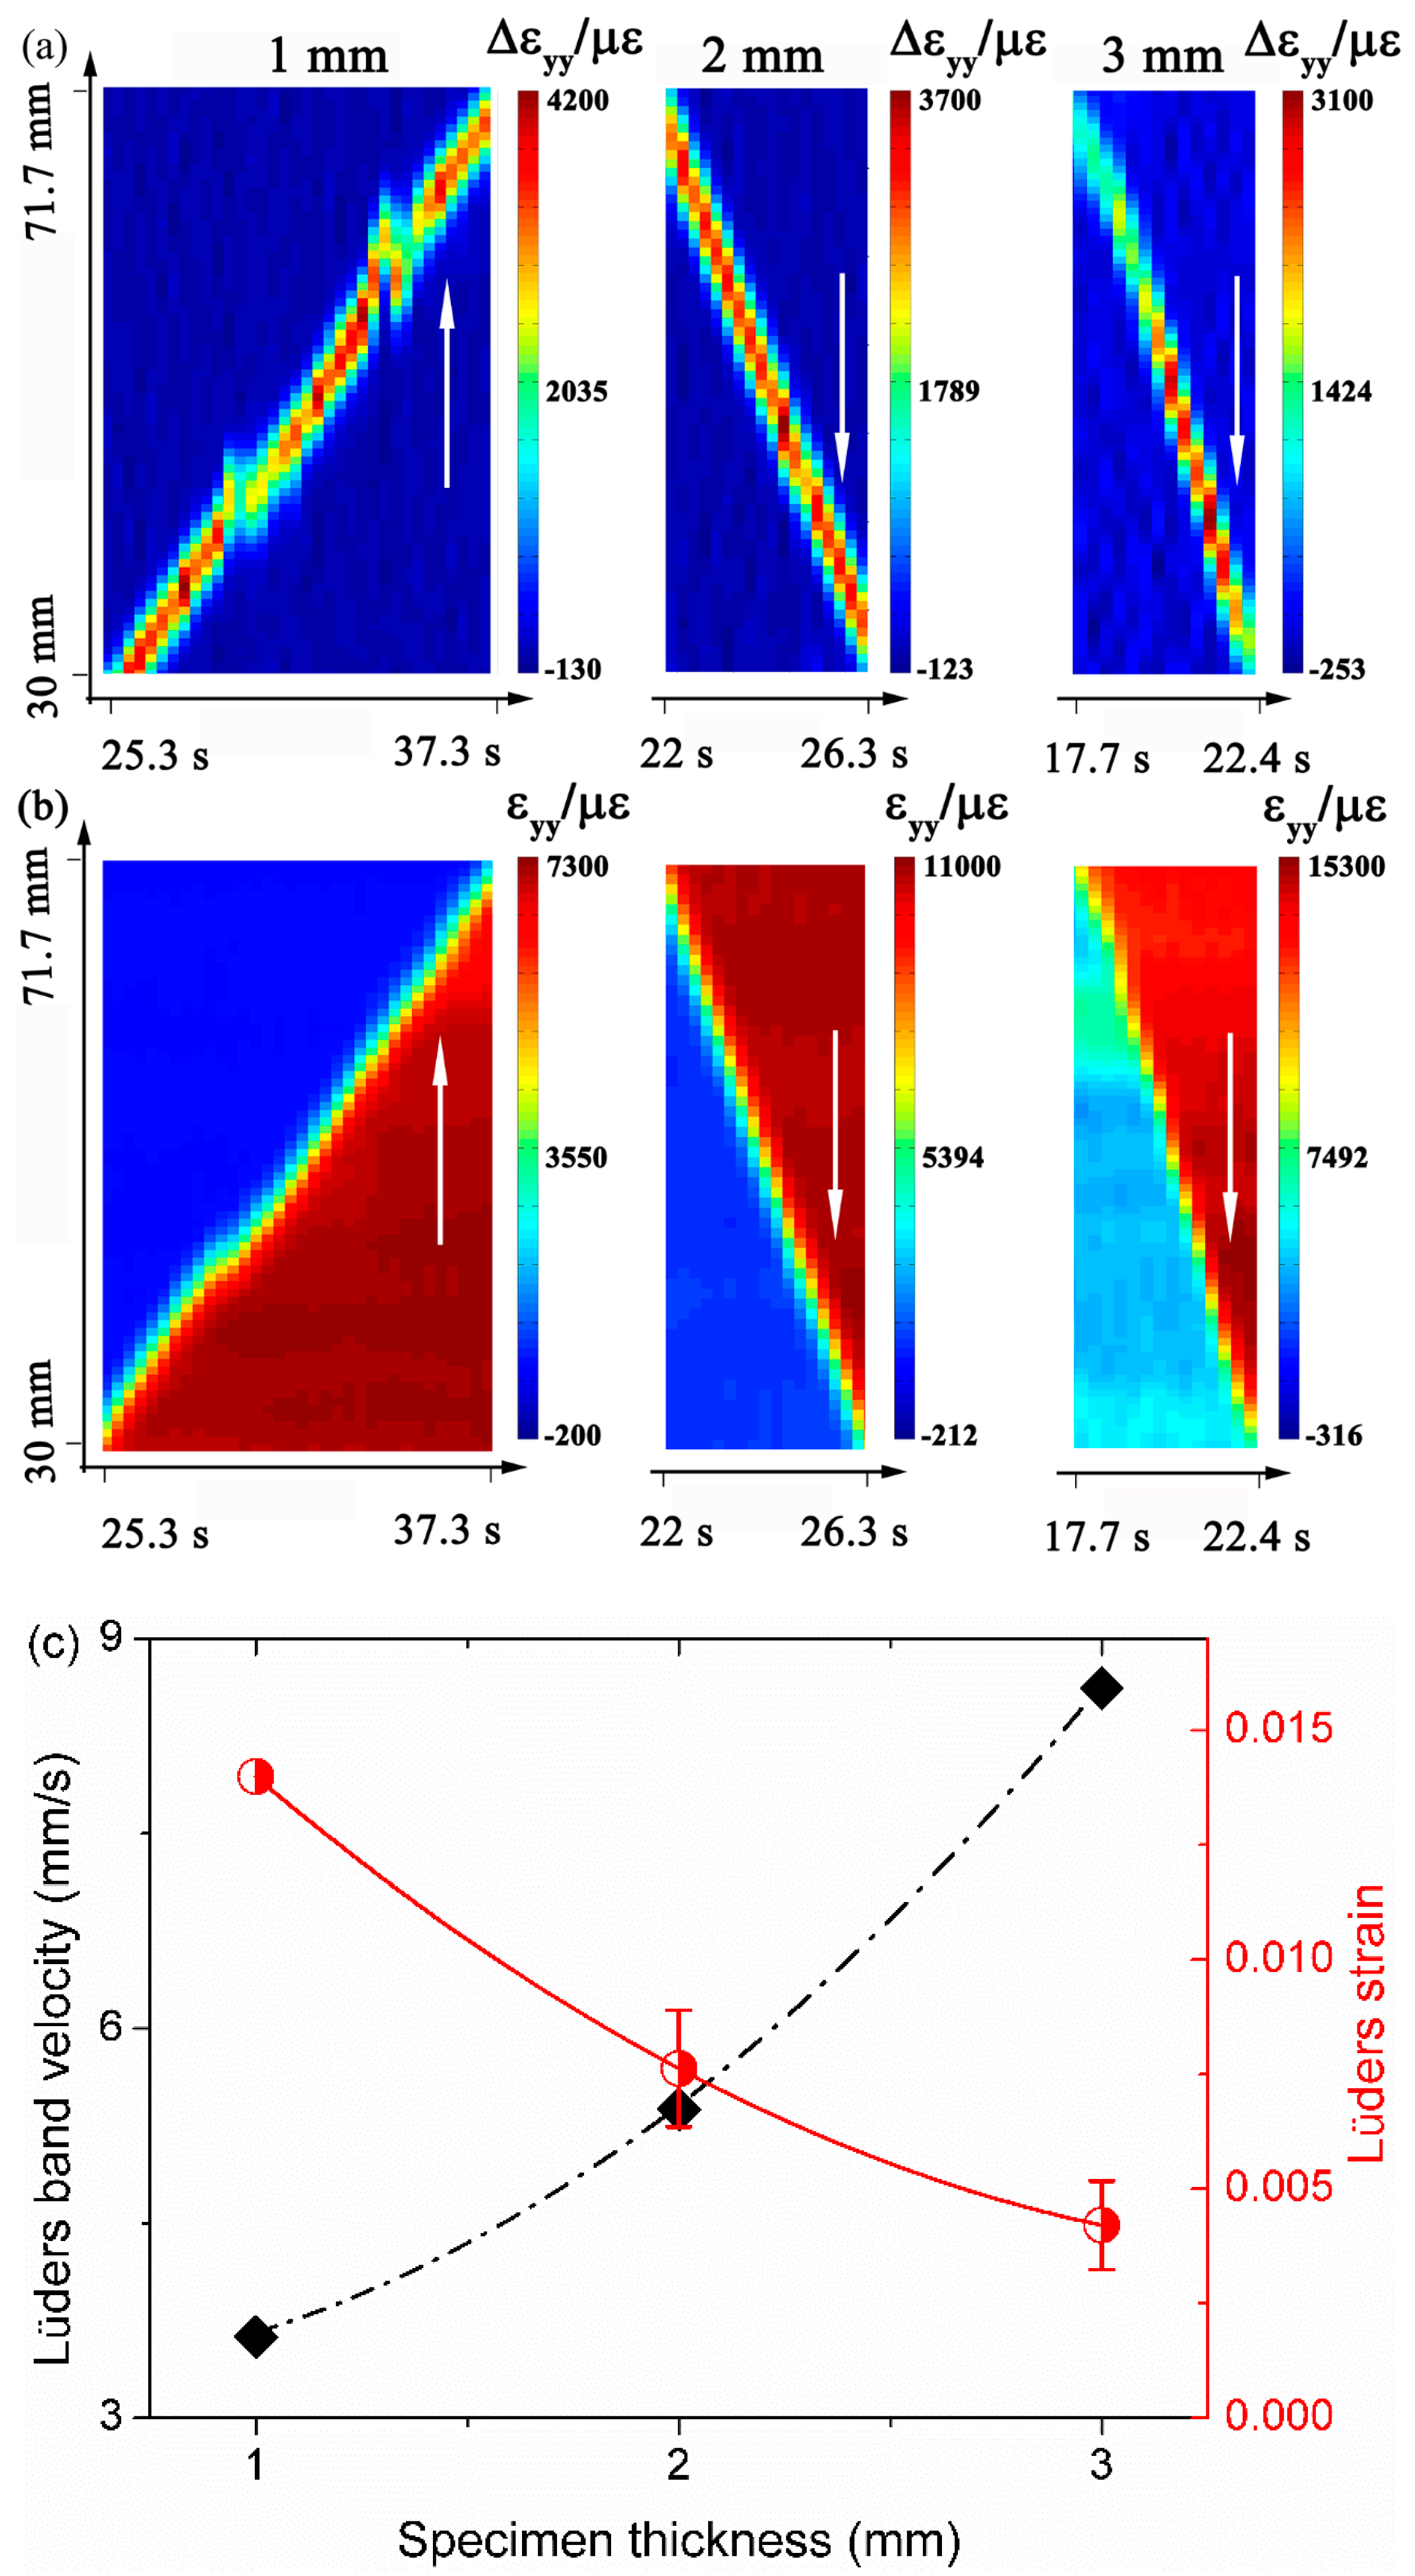
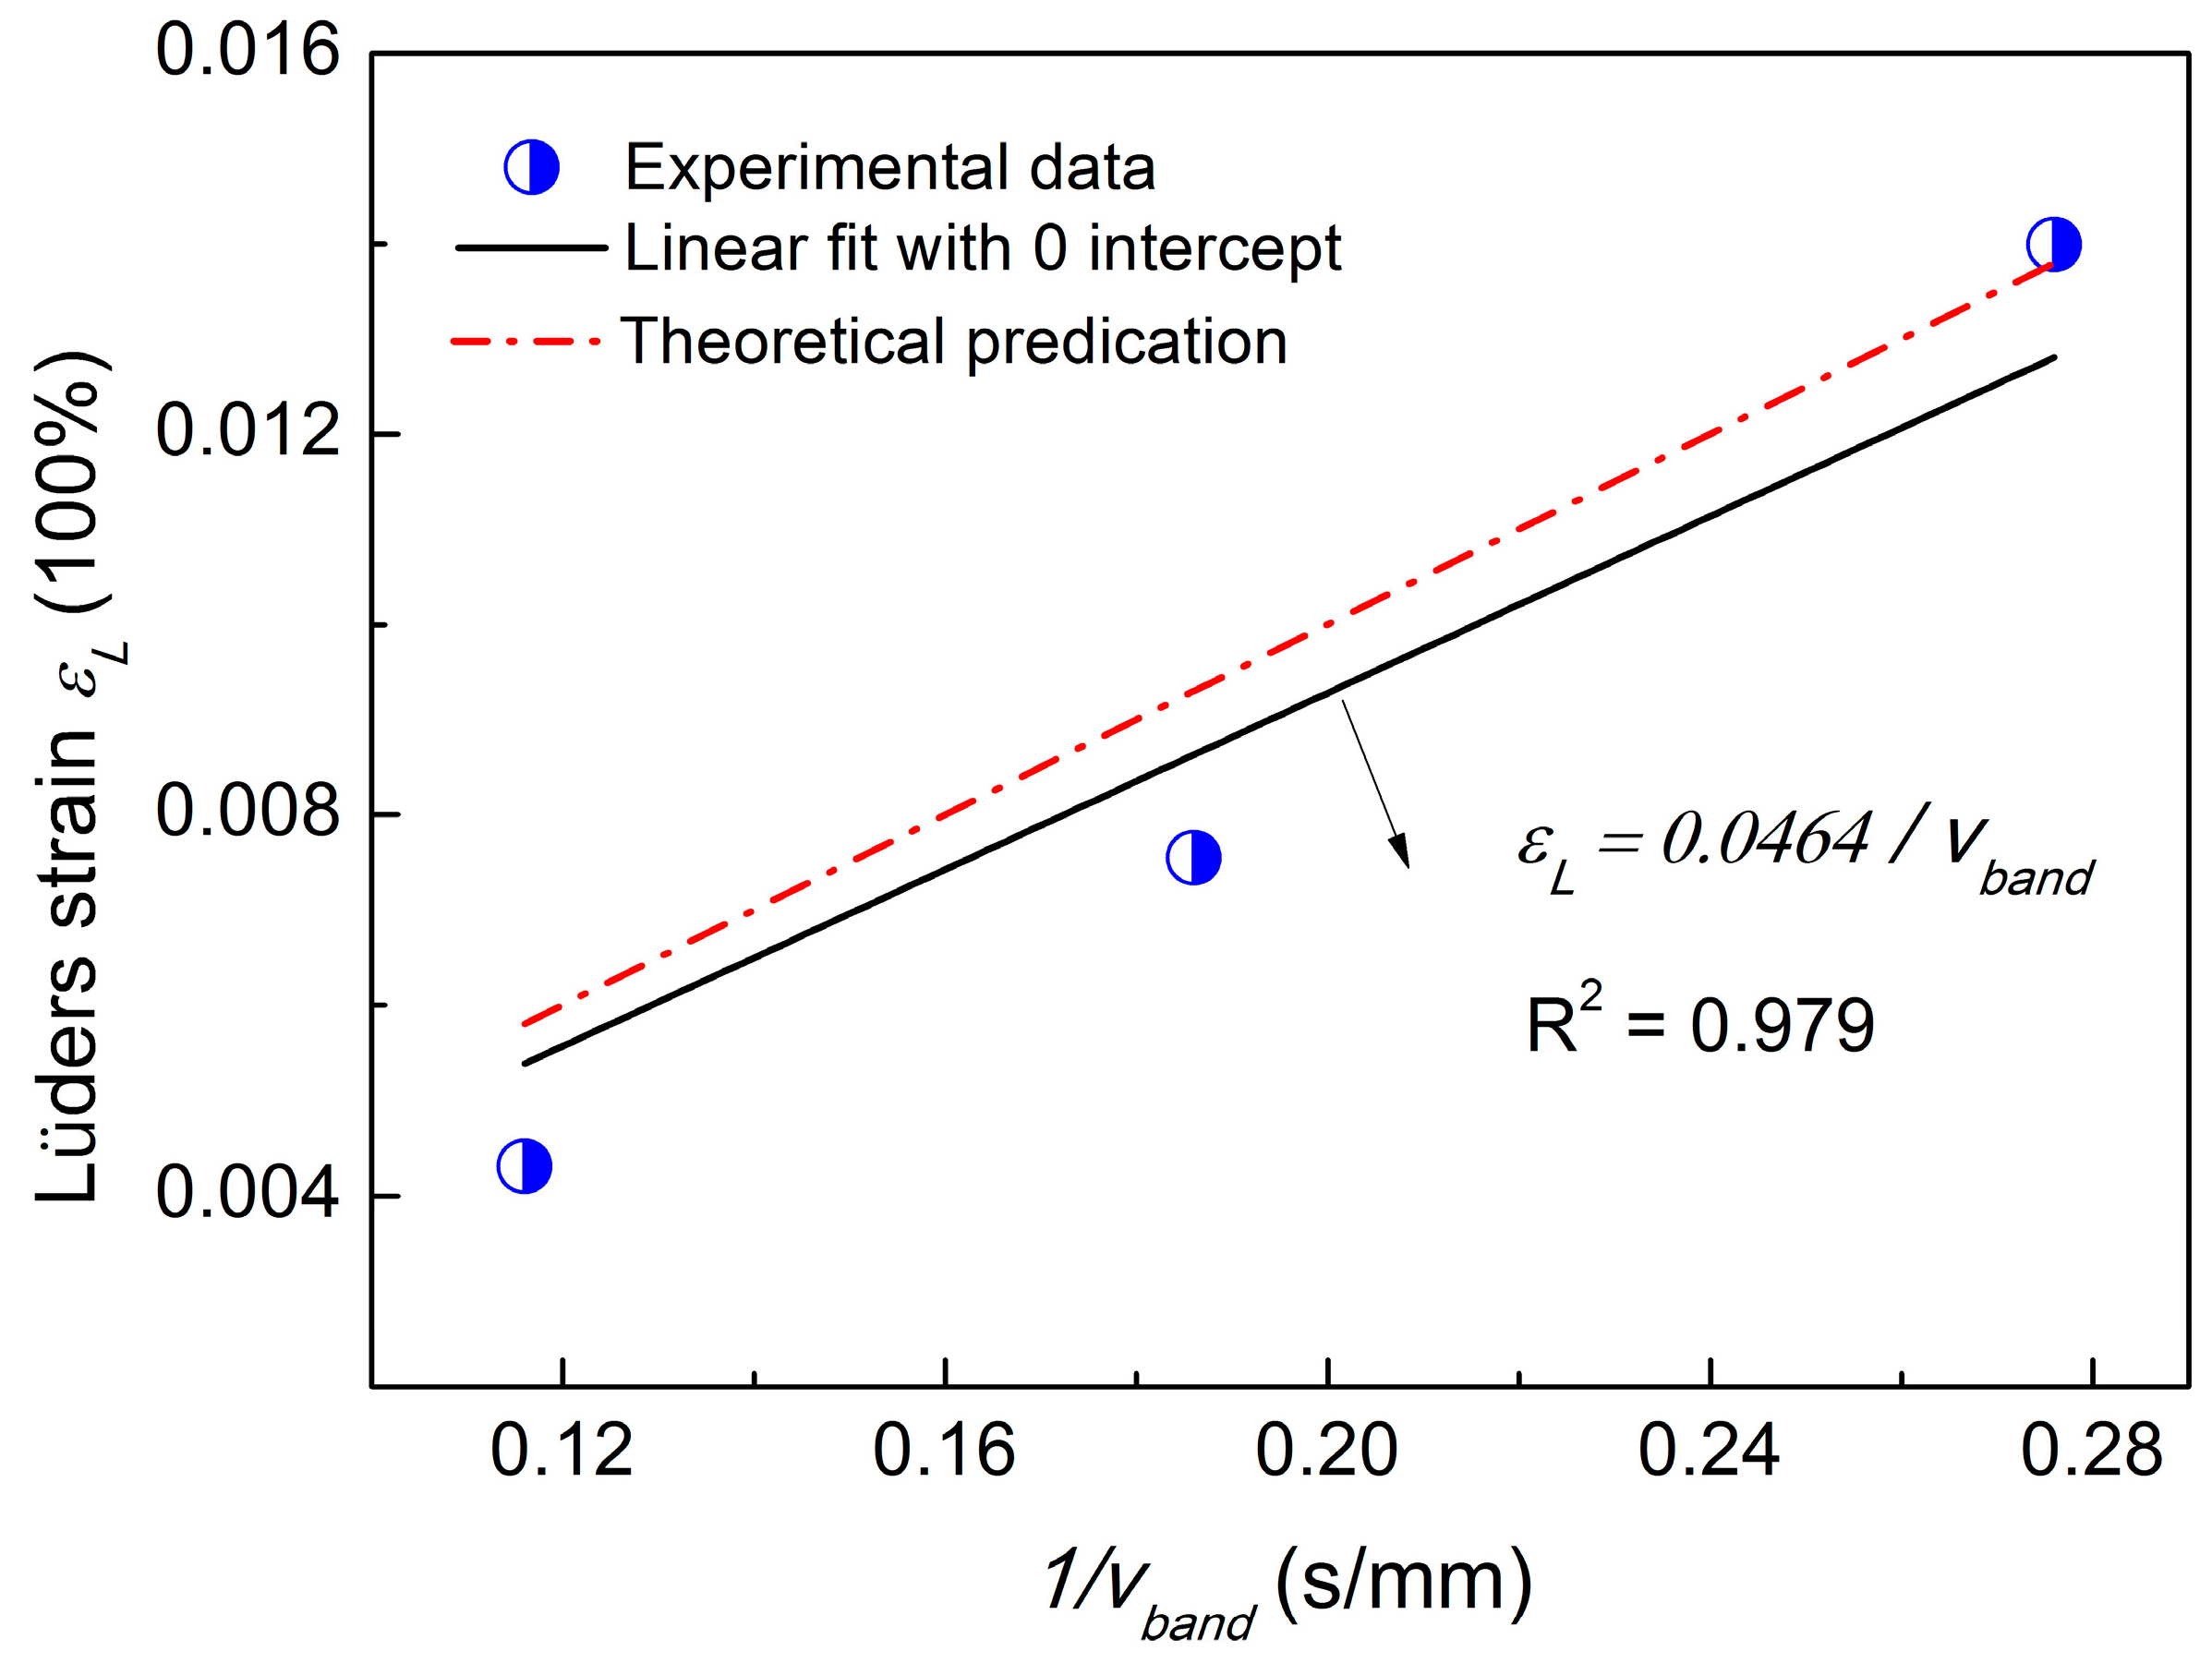
3.2. Lüders Band Velocity
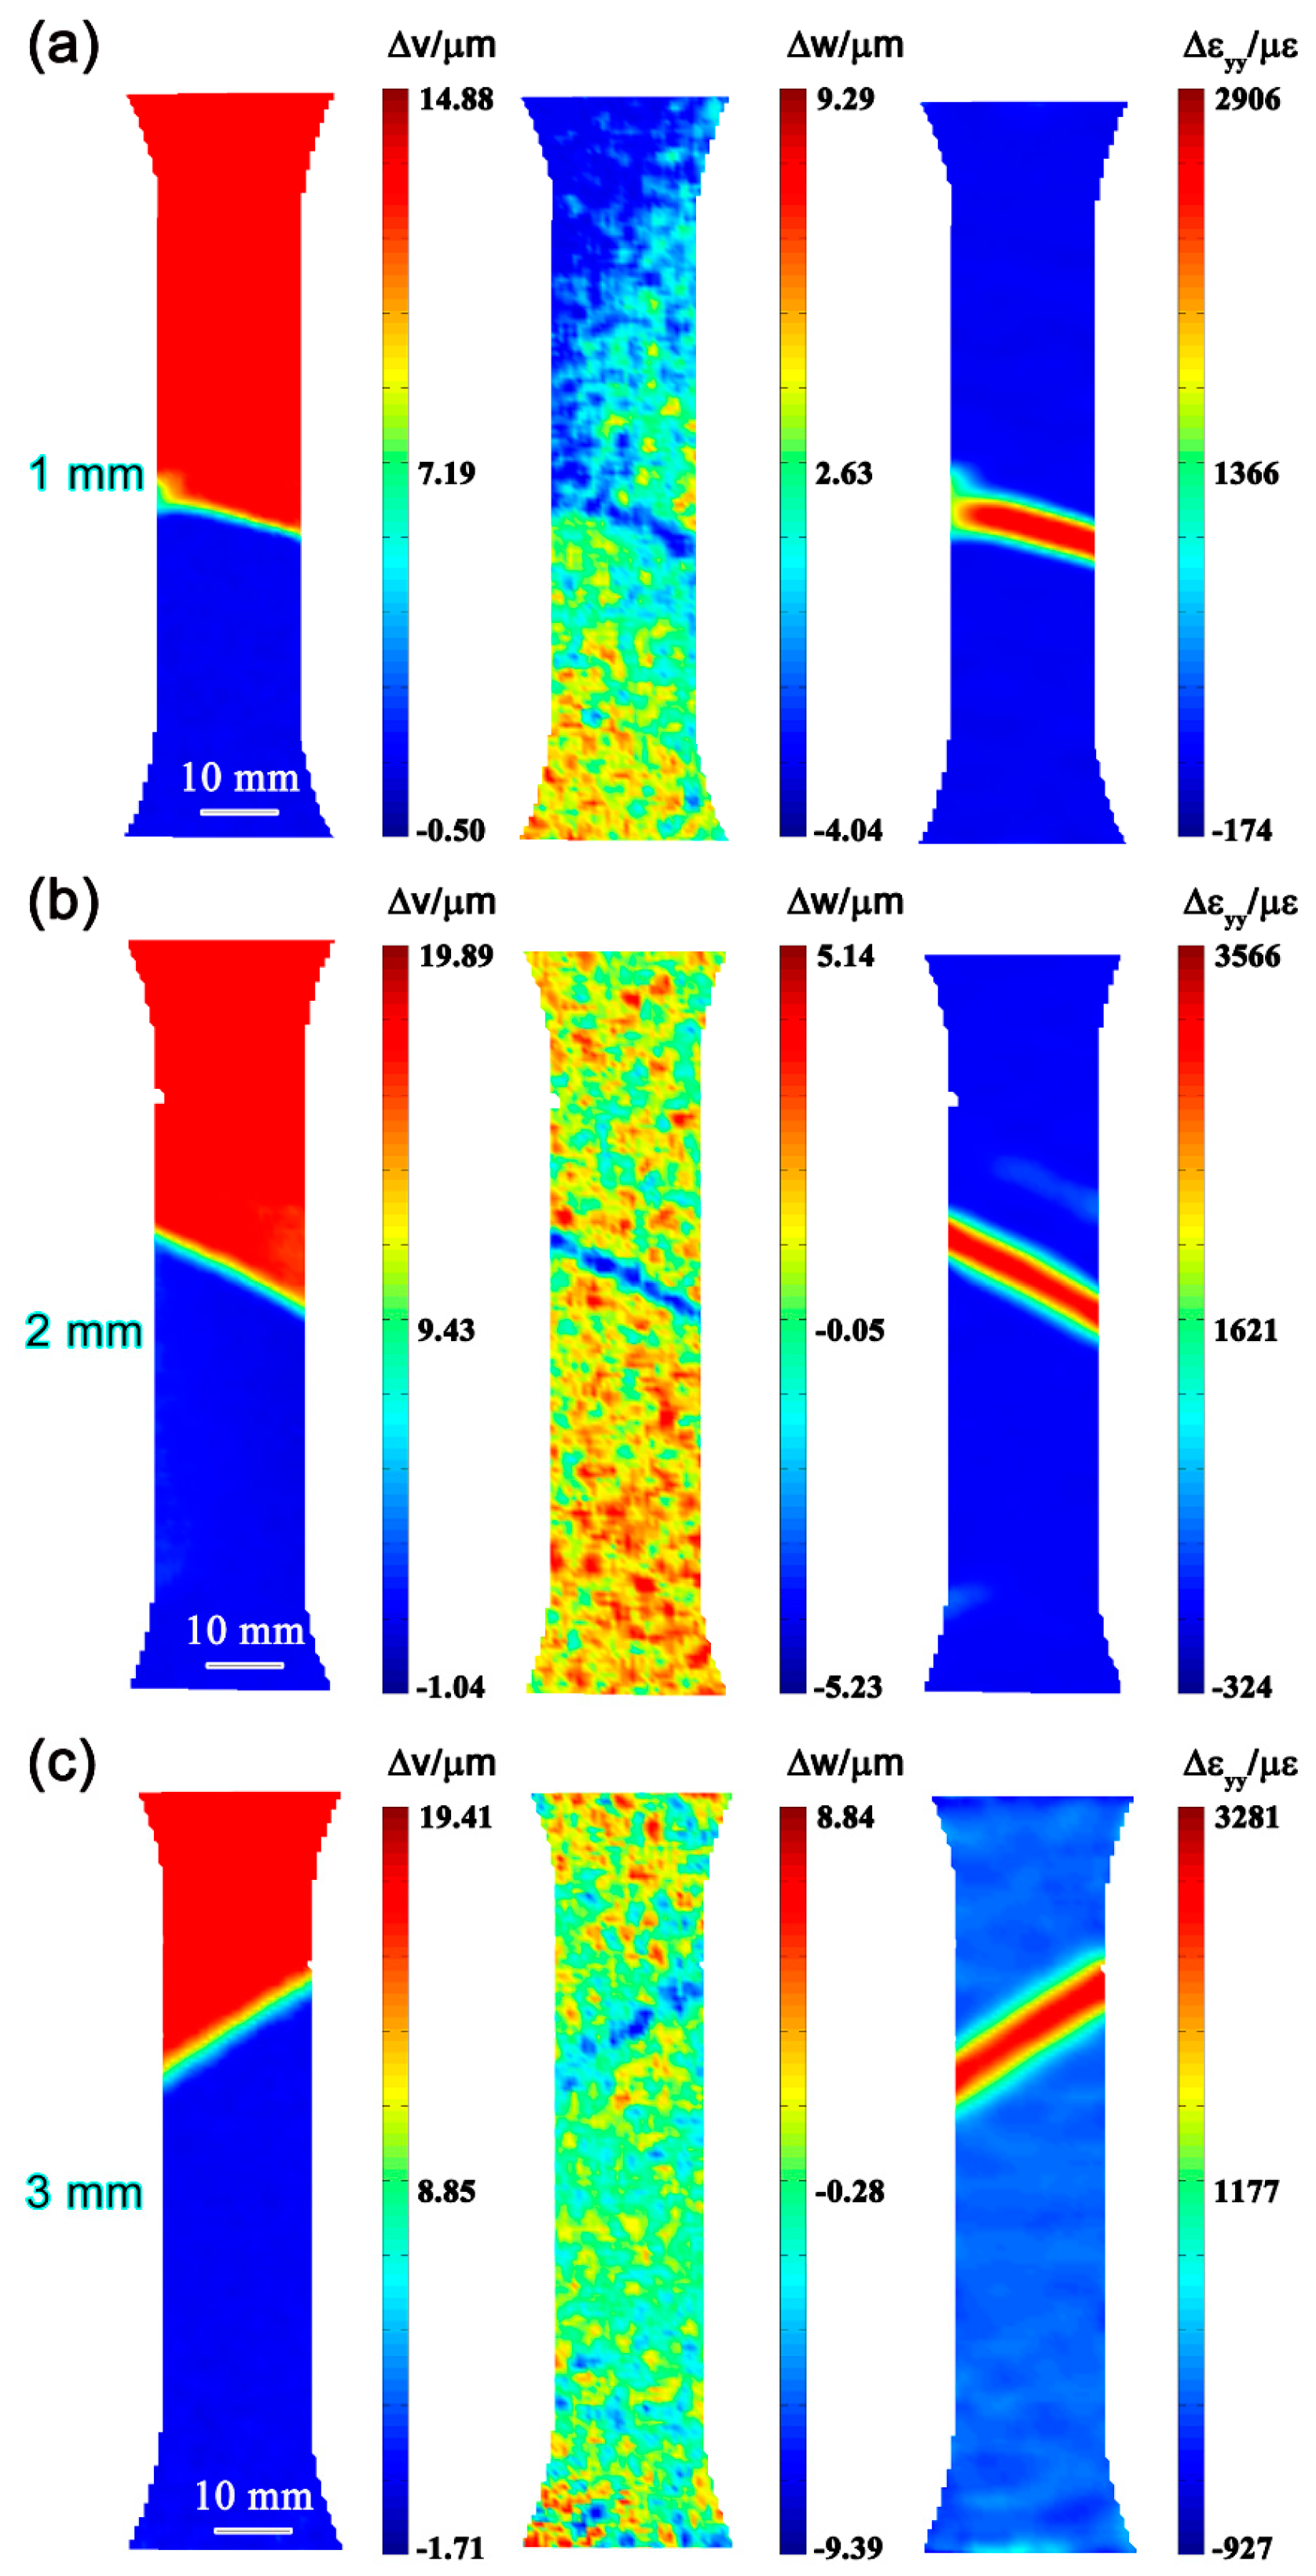
3.3. Global Deformation Compatibility
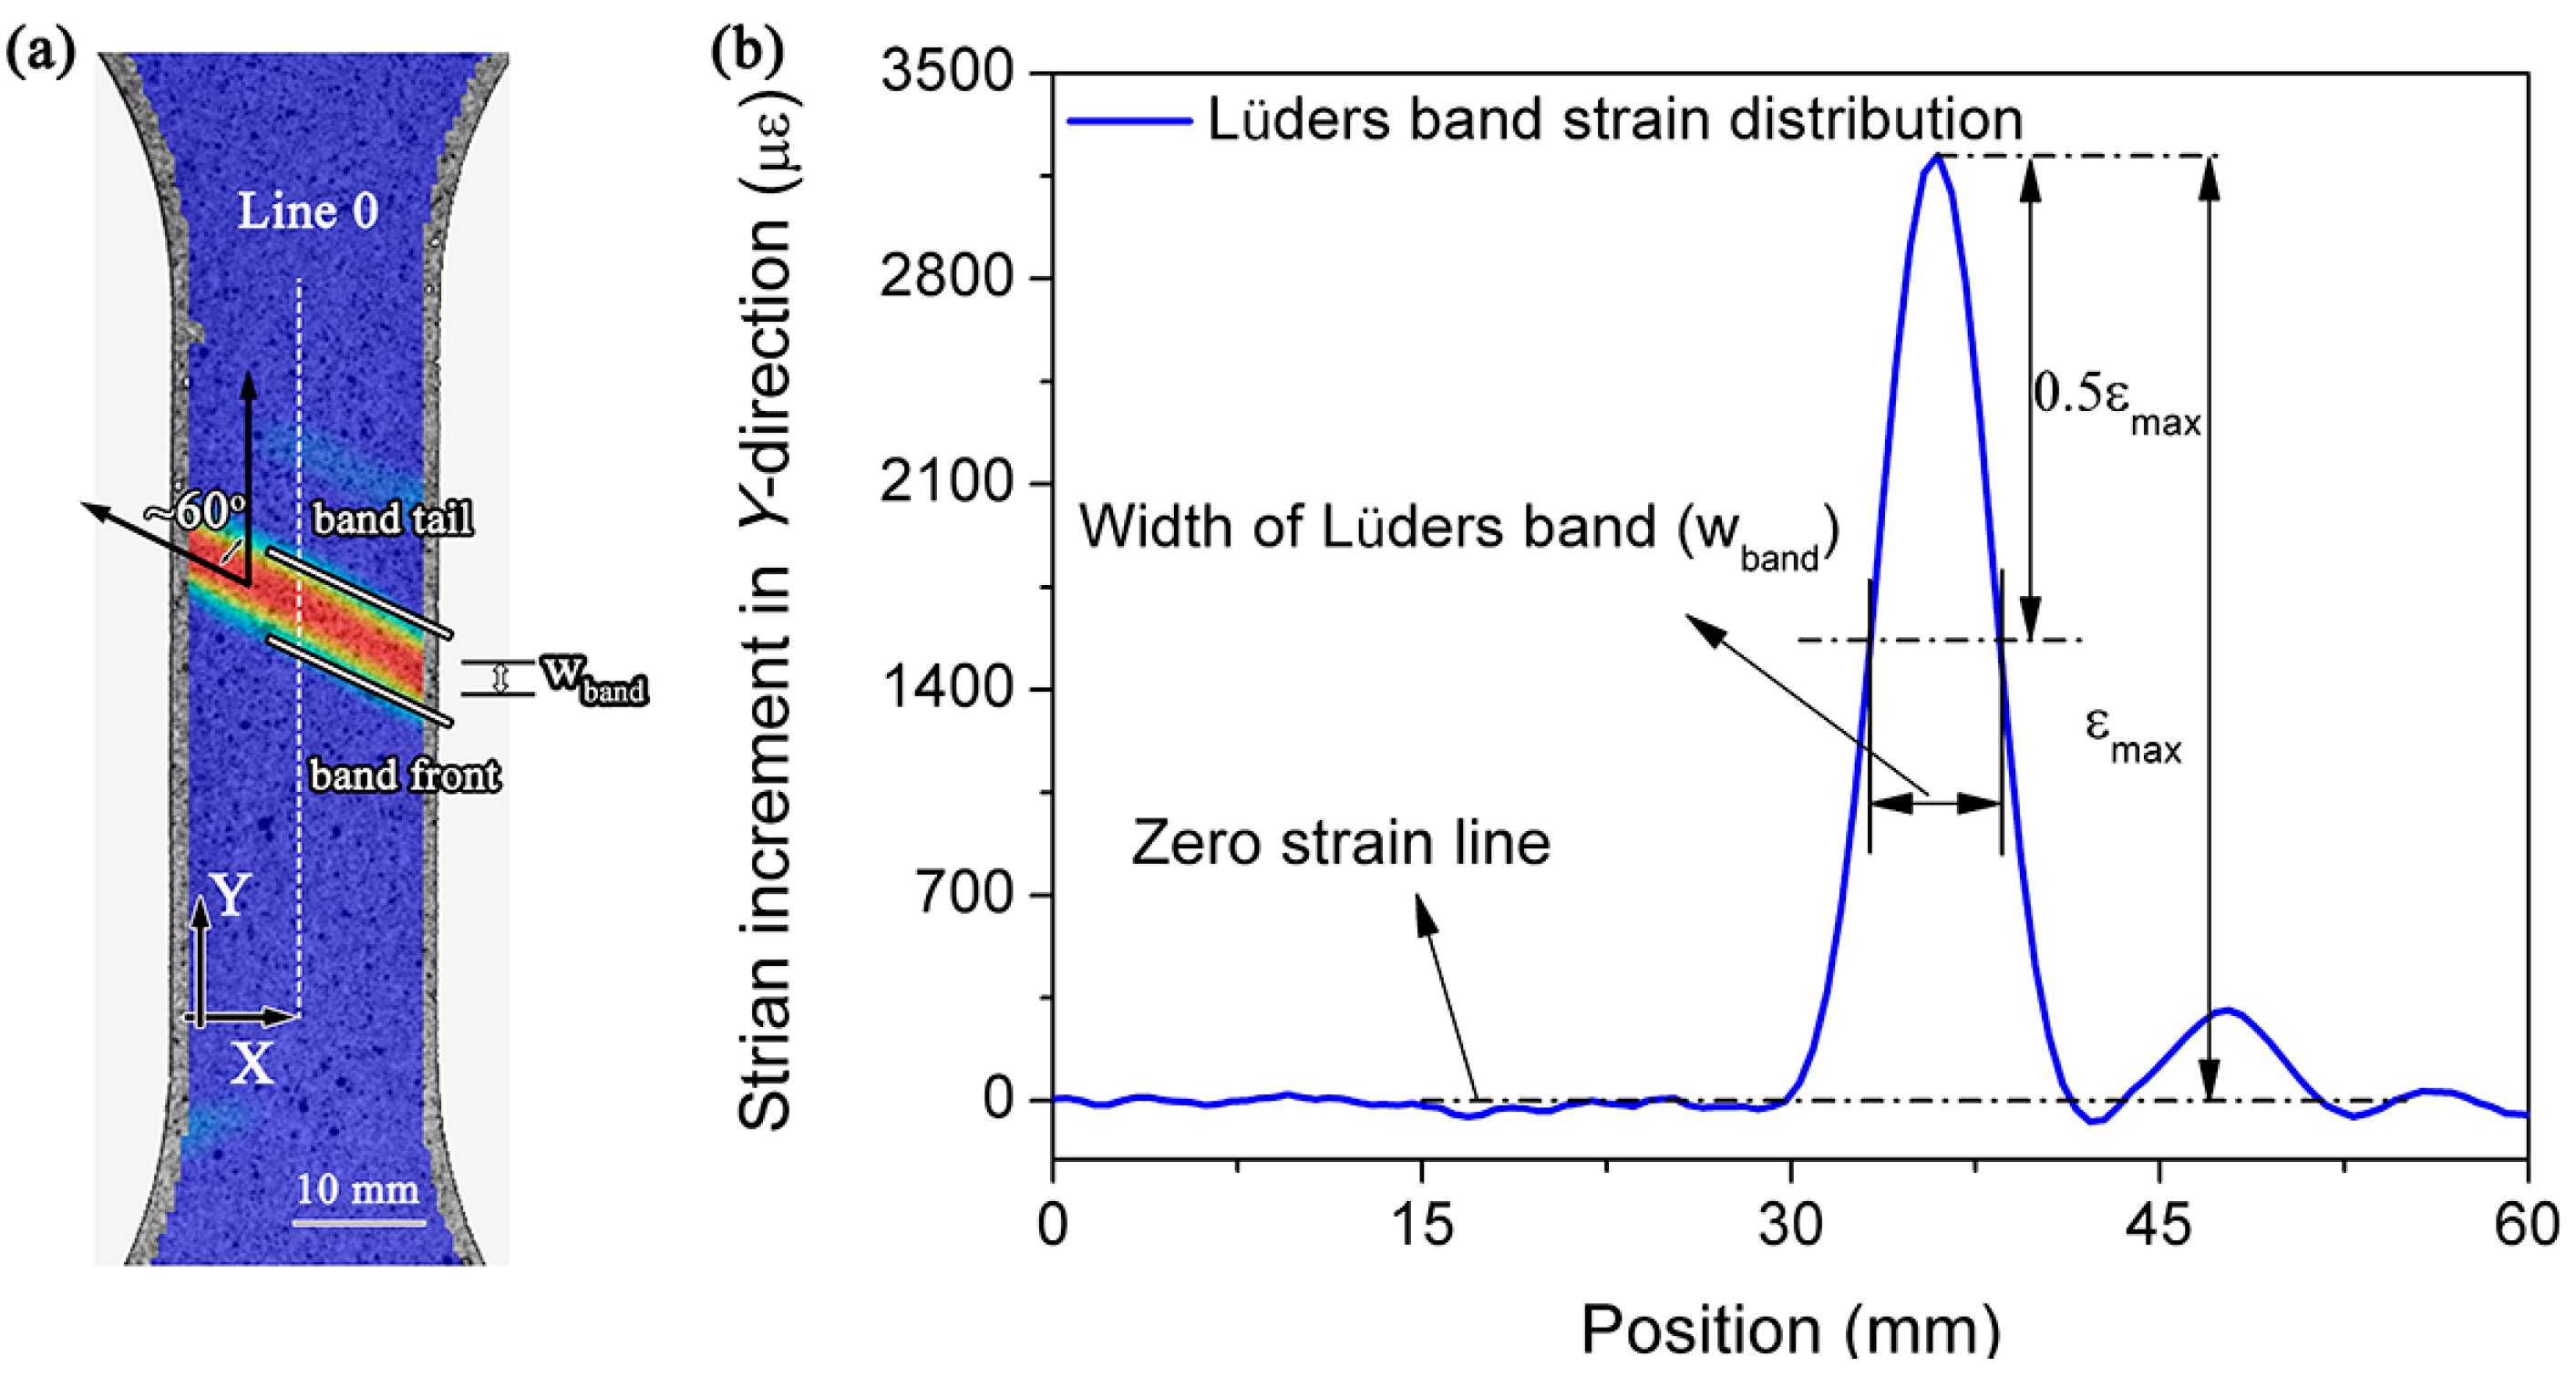
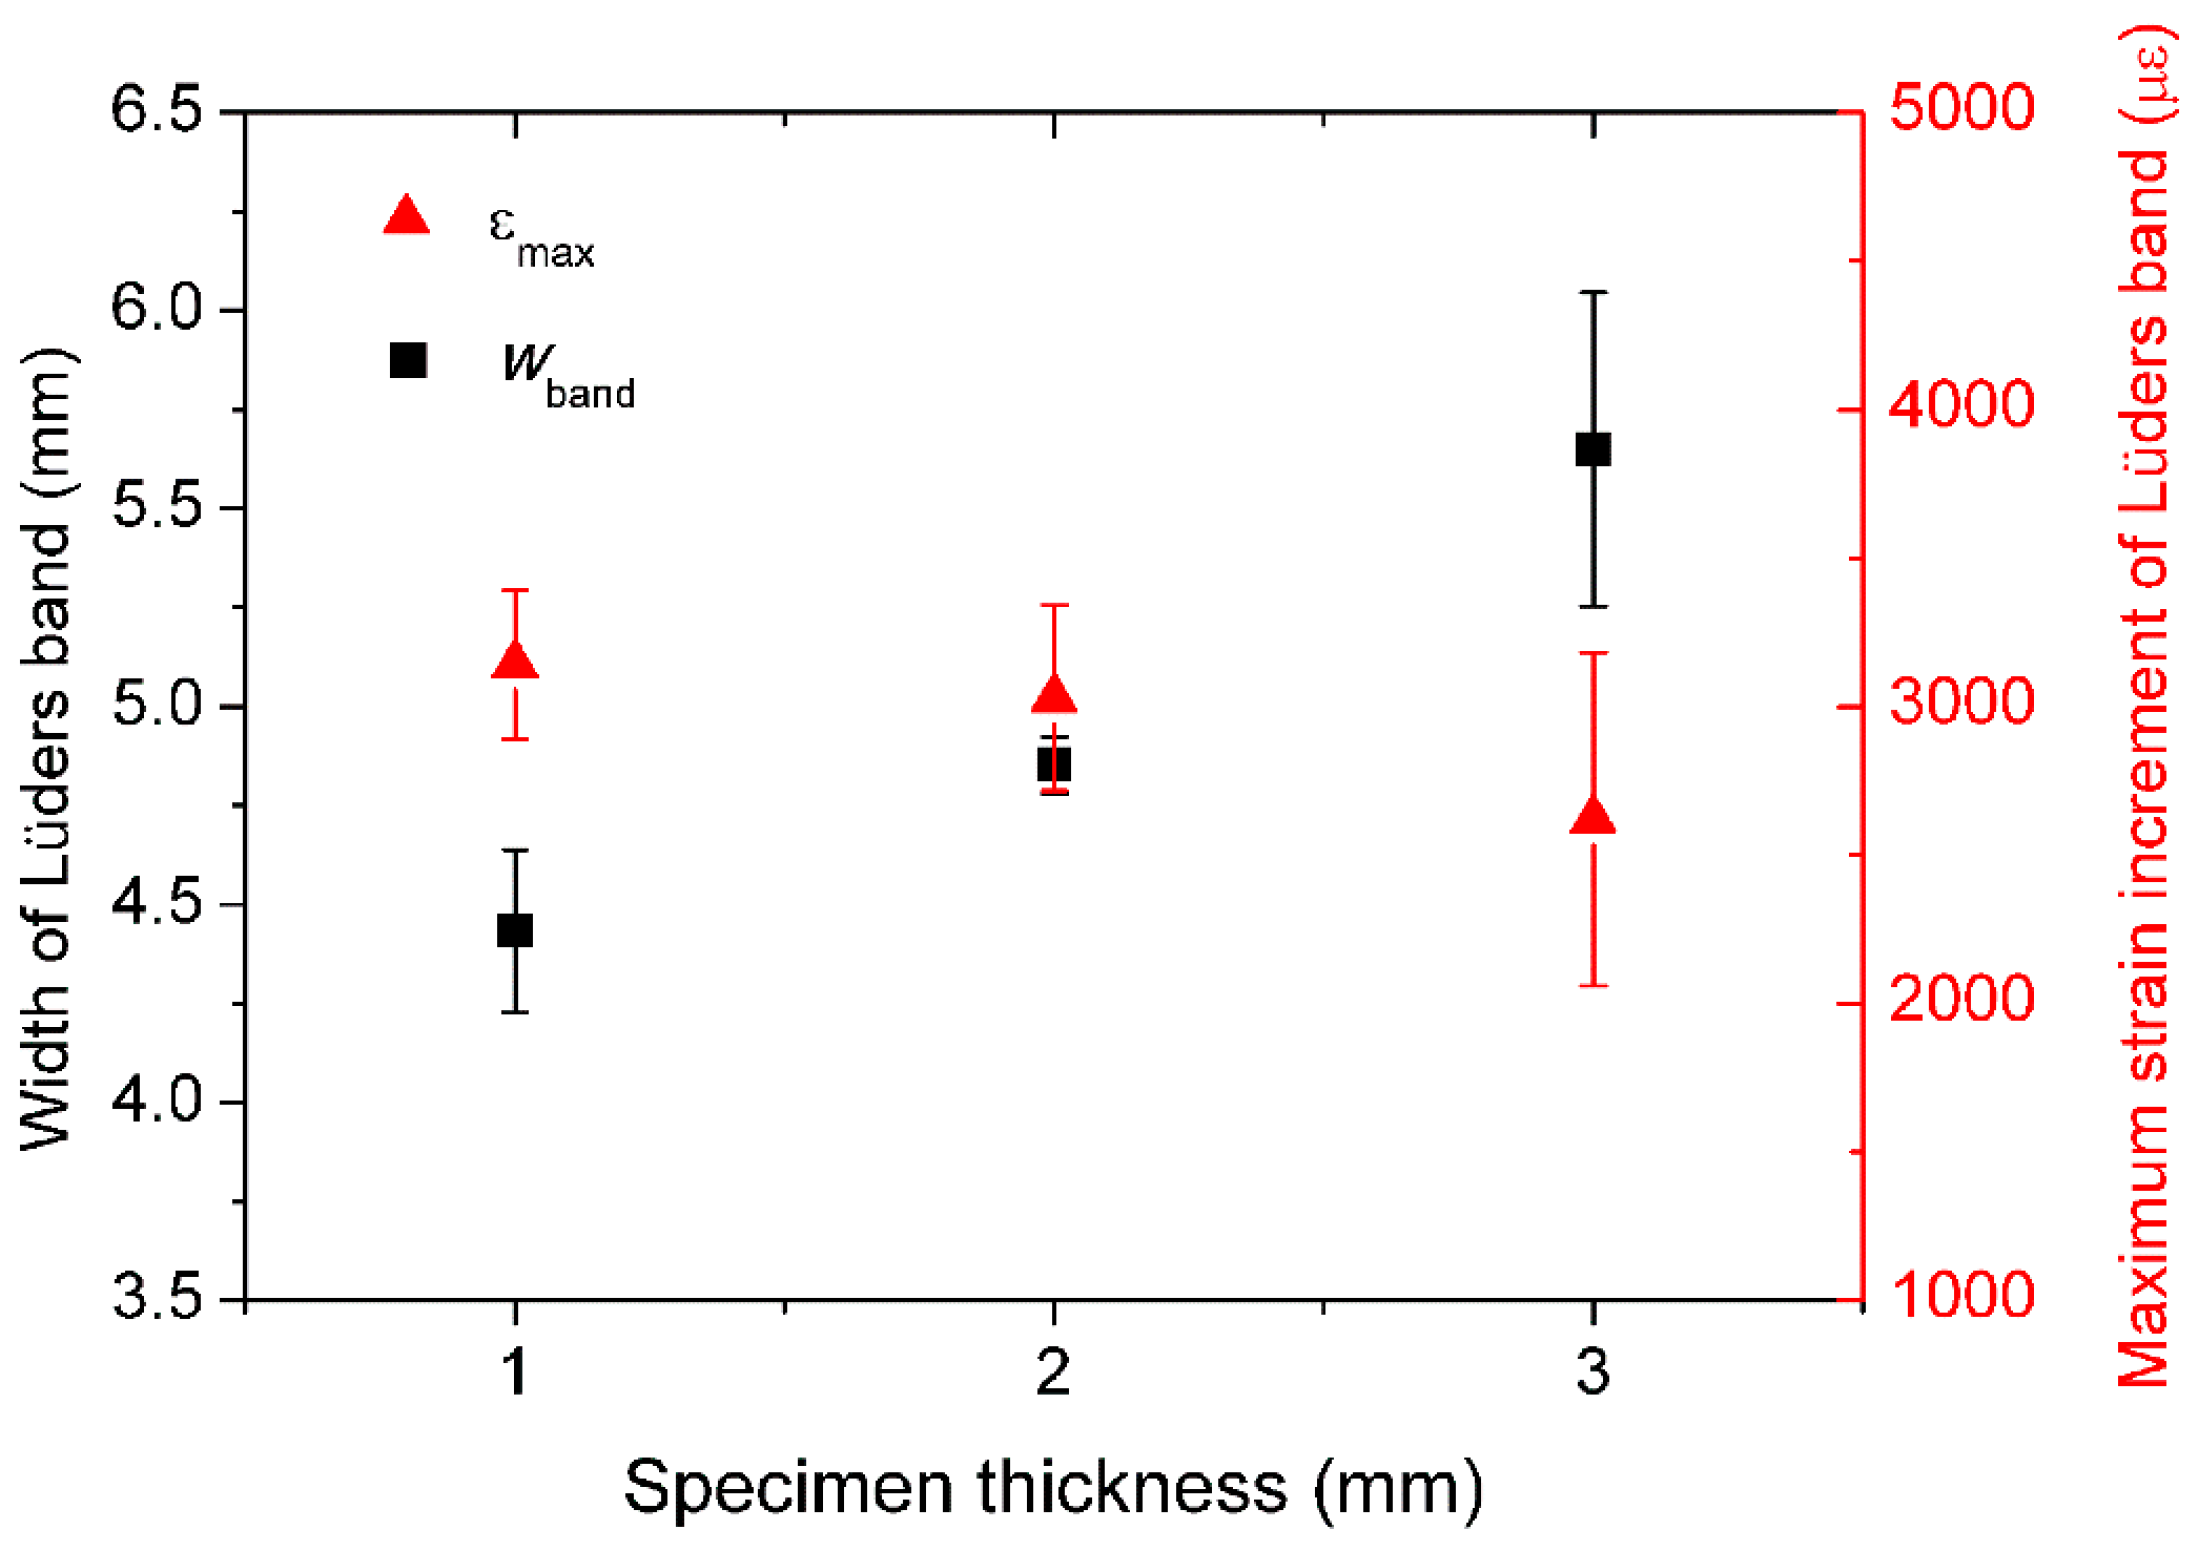
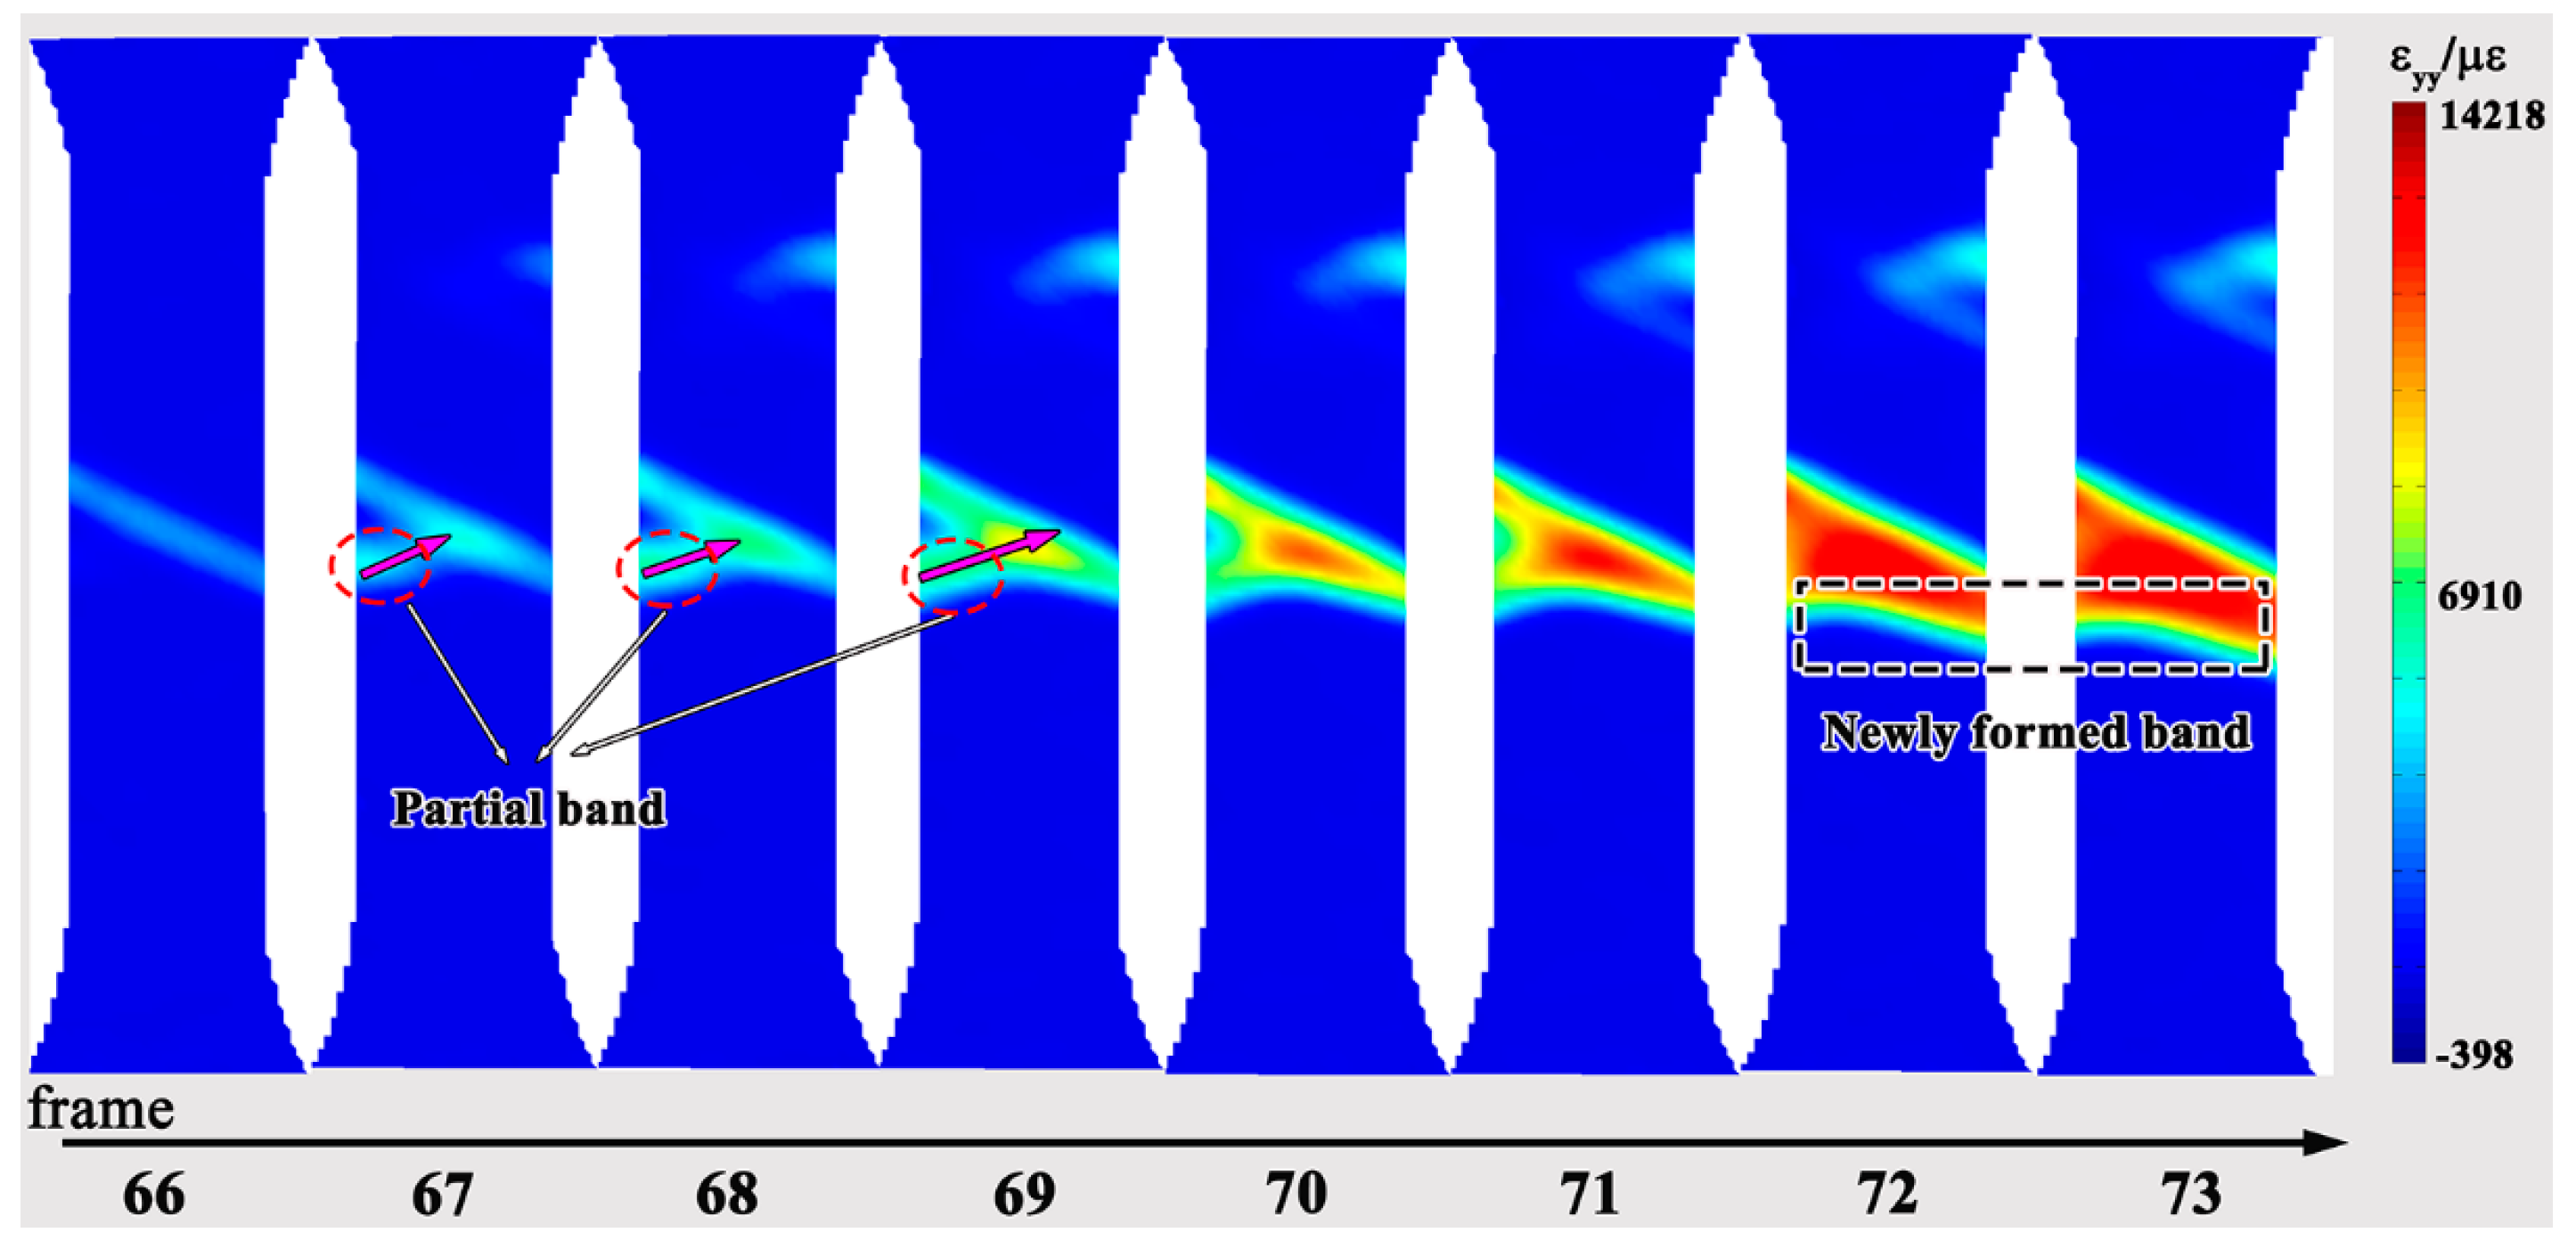
3.4. Spatial Characteristics
4. Conclusions
- (1)
- This is the first report demonstrating the dependence of the Lüders strain on the specimen thickness of a 5456 Al-based alloy.
- (2)
- The Lüders strain increases, but the Lüders band velocity decreases, with decreasing specimen thickness.
- (3)
- Uniquely, the plot of the Lüders strain vs. the Lüders velocity was obtained via direct observation.
Acknowledgments
Author Contributions
Conflicts of Interest
References
- Fridlyander, I.N.; Sister, V.G.; Grushko, O.E.; Berstenev, V.V.; Sheveleva, L.M.; Ivanova, L.A. Aluminum alloys: Promising materials in the automotive industry. Met. Sci. Heat Treat. 2002, 44, 365–370. [Google Scholar] [CrossRef]
- Zhang, Q.; Jiang, Z.; Jiang, H.; Chen, Z.; Wu, X. On the propagation and pulsation of Portevin-Le Chatelier deformation bands: An experimental study with digital speckle pattern metrology. Int. J. Plast. 2005, 21, 2150–2173. [Google Scholar] [CrossRef]
- Jiang, H.; Zhang, Q.; Jiang, Z.; Wu, X. Experimental investigations on kinetics of Portevin-Le Chatelier effect in Al-4wt. %Cu alloys. J. Alloys Compd. 2007, 428, 151–156. [Google Scholar] [CrossRef]
- Benallal, A.; Berstad, T.; Børvik, T.; Hopperstad, O.S.; Koutiri, I.; Nogueira de Codes, R. An experimental and numerical investigation of the behaviour of AA5083 aluminium alloy in presence of the Portevin-Le Chatelier effect. Int. J. Plast. 2008, 24, 1916–1945. [Google Scholar] [CrossRef]
- Fu, S.; Cheng, T.; Zhang, Q.; Hu, Q.; Cao, P. Two mechanisms for the normal and inverse behaviors of the critical strain for the Portevin-Le Chatelier effect. Acta Mater. 2012, 60, 6650–6656. [Google Scholar] [CrossRef]
- Cai, Y.; Tian, C.; Fu, S.; Han, G.; Cui, C.; Zhang, Q. Influence of γ’ precipitates on Portevin-Le Chatelier effect of Ni-based superalloys. Mater. Sci. Eng. A 2015, 638, 314–321. [Google Scholar] [CrossRef]
- Yoshida, K.; Gotoh, Y.; Yamamoto, M. The thickness dependence of plastic behaviors of copper whiskers. J. Phys. Soc. Jpn. 1968, 24, 1099–1107. [Google Scholar] [CrossRef]
- Sun, H.B.; Yoshida, F.; Ohmori, M.; Ma, X. Effect of strain rate on Lüders band propagating velocity and Lüders strain for annealed mild steel under uniaxial tension. Mater. Lett. 2003, 57, 4535–4539. [Google Scholar] [CrossRef]
- Nagarajan, S.; Narayanaswamy, R.; Balasubramaniam, V. Advanced imaging for early prediction and characterization of zone of Lüders band nucleation associated with pre-yield microstrain. Mater. Sci. Eng. A 2013, 561, 203–211. [Google Scholar] [CrossRef]
- Nagarajan, S.; Narayanaswamy, R.; Balasubramaniam, V. Study on local zones constituting to band growth associated with inhomogeneous plastic deformation. Mater. Lett. 2013, 105, 209–212. [Google Scholar] [CrossRef]
- Van Rooyen, G.T. The stress and strain distribution in a propagating Lüders front accompanying the yield-point phenomenon in iron. Mater. Sci. Eng. 1968, 3, 105–117. [Google Scholar] [CrossRef]
- Johnston, W.G.; Gilman, J.J. Dislocation velocities, dislocation densities, and plastic flow in lithium fluoride crystals. J. Appl. Phys. 1959, 30, 129–144. [Google Scholar] [CrossRef]
- Hahn, G.T. A model for yielding with special reference to the yield-point phenomena of iron and related bcc metals. Acta Metall. 1962, 10, 727–738. [Google Scholar] [CrossRef]
- Cottrell, A.H.; Bilby, B.A. Dislocation theory of yielding and strain ageing of iron. Proc. Phys. Soc. 1949, 62. [Google Scholar] [CrossRef]
- Johnson, D.H.; Edwards, M.R.; Chard-Tuckey, P. Microstructural effects on the magnitude of Lüders strains in a low alloy steel. Mater. Sci. Eng. A 2015, 625, 36–45. [Google Scholar] [CrossRef]
- Winlock, J. The influence of the rate of deformation on the tensile properties of some plain carbon sheet steels. J. Metall. 1953, 5, 797–803. [Google Scholar]
- Song, R.; Ponge, D.; Raabe, D. Improvement of the work hardening rate of ultrafine grained steels through second phase particles. Scr. Mater. 2005, 52, 1075–1080. [Google Scholar] [CrossRef]
- Tsuchida, N.; Tomota, Y.; Nagai, K.; Fukaura, K. A simple relationship between Lüders elongation and work-hardening rate at lower yield stress. Scr. Mater. 2006, 54, 57–60. [Google Scholar] [CrossRef]
- Fisher, J.C.; Rogers, H.C. Propagation of Lüder's bands in steel wires. Acta Metall. 1956, 4, 180–185. [Google Scholar] [CrossRef]
- Jin, H.; Lloyd, D.J. Effect of a duplex grain size on the tensile ductility of an ultra-fine grained Al-Mg alloy, AA5754, produced by asymmetric rolling and annealing. Scr. Mater. 2004, 50, 1319–1323. [Google Scholar] [CrossRef]
- Lloyd, D.; Court, S.A.; Gatenby, K.M. Lüders elongation in Al-Mg alloy AA5182. Mater. Sci. Technol. 1997, 13, 660–666. [Google Scholar] [CrossRef]
- Louche, H.; Chrysochoos, A. Thermal and dissipative effects accompanying Lüders band propagation. Mater. Sci. Eng. A 2001, 307, 15–22. [Google Scholar]
- Delpueyo, D.; Balandraud, X.; Grediac, M. Calorimetric signature of the Portevin-Le Chatelier effect in an aluminum alloy from infrared thermography measurements and heat source reconstruction. Mater. Sci. Eng. A 2016, 651, 135–145. [Google Scholar] [CrossRef]
- Mazière, M.; Forest, S. Strain gradient plasticity modeling and finite element simulation of Lüders band formation and propagation. Continuum Mech. Thermodyn. 2015, 27, 83–104. [Google Scholar] [CrossRef]
- Wenman, M.R.; Chard-Tuckey, P.R. Modelling and experimental characterisation of the Lüders strain in complex loaded ferritic steel compact tension specimens. Int. J. Plast. 2010, 26, 1013–1028. [Google Scholar] [CrossRef]
- Wang, H.D.; Berdin, C.; Mazière, M.; Forest, S.; Prioul, C.; Parrot, A.; Le-Delliou, P. Experimental and numerical study of dynamic strain ageing and its relation to ductile fracture of a C-Mn steel. Mater. Sci. Eng. A 2012, 547, 19–31. [Google Scholar] [CrossRef]
- Nadai, A. Theory of Flow and Fracture of Solids; McGraw Hill: New York, NY, USA, 1950; Volume 1. [Google Scholar]
- Gao, Y.; Cheng, T.; Su, Y.; Xu, X.; Zhang, Y.; Zhang, Q. High-efficiency and high-accuracy digital image correlation for three-dimensional measurement. Opt. Laser Eng. 2015, 65, 73–80. [Google Scholar] [CrossRef]
- Xu, X.; Su, Y.; Cai, Y.; Cheng, T.; Zhang, Q. Effects of various shape functions and subset size in local deformation measurements using DIC. Exp. Mech. 2015, 55, 1575–1590. [Google Scholar] [CrossRef]
- Chihab, K.; Estrin, Y.; Kubin, L.P.; Vergnol, J. The kinetics of the Portevin-Le Chatelier bands in an Al-5 at. % Mg alloy. Scr. Metall. 1987, 21, 203–208. [Google Scholar] [CrossRef]
- Ziegenbein, A.; Hhner, P.; Neuhuser, H. Correlation of temporal instabilities and spatial localization during Portevin-Le Chatelier deformation of Cu-10 at. % Al and Cu-15 at. % Al. Comput. Mater. Sci. 2000, 19, 27–34. [Google Scholar] [CrossRef]
- Su, Y.; Zhang, Q.; Gao, Z.; Xu, X.; Wu, X. Fourier-based interpolation bias prediction in digital image correlation. Opt. Express 2015, 23, 19242–19260. [Google Scholar] [CrossRef] [PubMed]
- Sutton, M.A.; Turner, J.L.; Bruck, H.A.; Chae, T.A. Full-field representation of discretely sampled surface deformation for displacement and strain analysis. Exp. Mech. 1991, 31, 168–177. [Google Scholar] [CrossRef]
- Hall, E.O. Yield Point Phenomena in Metals and Alloys, 1st ed.; Plenum Press (a Division of Plenum Publishing Corporation): New York, NY, USA, 1970; pp. 34–35. [Google Scholar]
- Estrin, Y.; Kubin, L.P. Continuum Models for Materials with Microstructures; Wiley: New York, NY, USA, 1995; p. 395. [Google Scholar]
- Hill, R. A theory of the yielding and plastic flow of anisotropic metals. Proc. R. Soc. A Math. Phys. Eng. Sci. 1948, 193, 281–297. [Google Scholar] [CrossRef]
- Cai, Y.L.; Zhang, Q.C.; Yang, S.L.; Fu, S.H.; Wang, Y.H. Characterization of the deformation behaviors associated with the serrated flow of a 5456 Al-based alloy using two orthogonal digital image correlation systems. Mater. Sci. Eng. A 2016, 664, 155–164. [Google Scholar] [CrossRef]
- Coer, J.; Manach, P.Y.; Laurent, H.; Oliveira, M.C.; Menezes, L.F. Piobert-Lüders plateau and Portevin-Le Chatelier effect in an Al-Mg alloy in simple shear. Mech. Res. Commun. 2013, 48, 1–7. [Google Scholar] [CrossRef]
- Cai, Y.L.; Zhang, Q.C.; Yang, S.L.; Fu, S.H.; Wang, Y.H. Experimental study on three-dimensional deformation field of Portevin-Le Chatelier effect using digital image correlation. Exp. Mech. 2016, 1–13. [Google Scholar] [CrossRef]


| Elements | Mg | Mn | Fe | Si | Zn | Ti | Cu | Cr | Al |
|---|---|---|---|---|---|---|---|---|---|
| Content | 4.7–5.5 | 0.5–1.0 | 0.4 | 0.25 | 0.25 | 0.2 | 0.1 | 0.05–0.2 | Balance |
© 2016 by the authors; licensee MDPI, Basel, Switzerland. This article is an open access article distributed under the terms and conditions of the Creative Commons Attribution (CC-BY) license (http://creativecommons.org/licenses/by/4.0/).
Share and Cite
Cai, Y.-L.; Yang, S.-L.; Fu, S.-H.; Zhang, Q.-C. The Influence of Specimen Thickness on the Lüders Effect of a 5456 Al-Based Alloy: Experimental Observations. Metals 2016, 6, 120. https://doi.org/10.3390/met6050120
Cai Y-L, Yang S-L, Fu S-H, Zhang Q-C. The Influence of Specimen Thickness on the Lüders Effect of a 5456 Al-Based Alloy: Experimental Observations. Metals. 2016; 6(5):120. https://doi.org/10.3390/met6050120
Chicago/Turabian StyleCai, Yu-Long, Su-Li Yang, Shi-Hua Fu, and Qing-Chuan Zhang. 2016. "The Influence of Specimen Thickness on the Lüders Effect of a 5456 Al-Based Alloy: Experimental Observations" Metals 6, no. 5: 120. https://doi.org/10.3390/met6050120
APA StyleCai, Y.-L., Yang, S.-L., Fu, S.-H., & Zhang, Q.-C. (2016). The Influence of Specimen Thickness on the Lüders Effect of a 5456 Al-Based Alloy: Experimental Observations. Metals, 6(5), 120. https://doi.org/10.3390/met6050120