
Microgalvanic Corrosion Behavior of Cu-Ag Active Braze Alloys Investigated with SKPFM


 ,
,
Abstract
:
1. Introduction
Background
2. Materials and Methods
2.1. Materials and Joining Procedure
2.2. Scanning Kelvin Probe Force Microscopy (SKPFM) of Brazed Regions
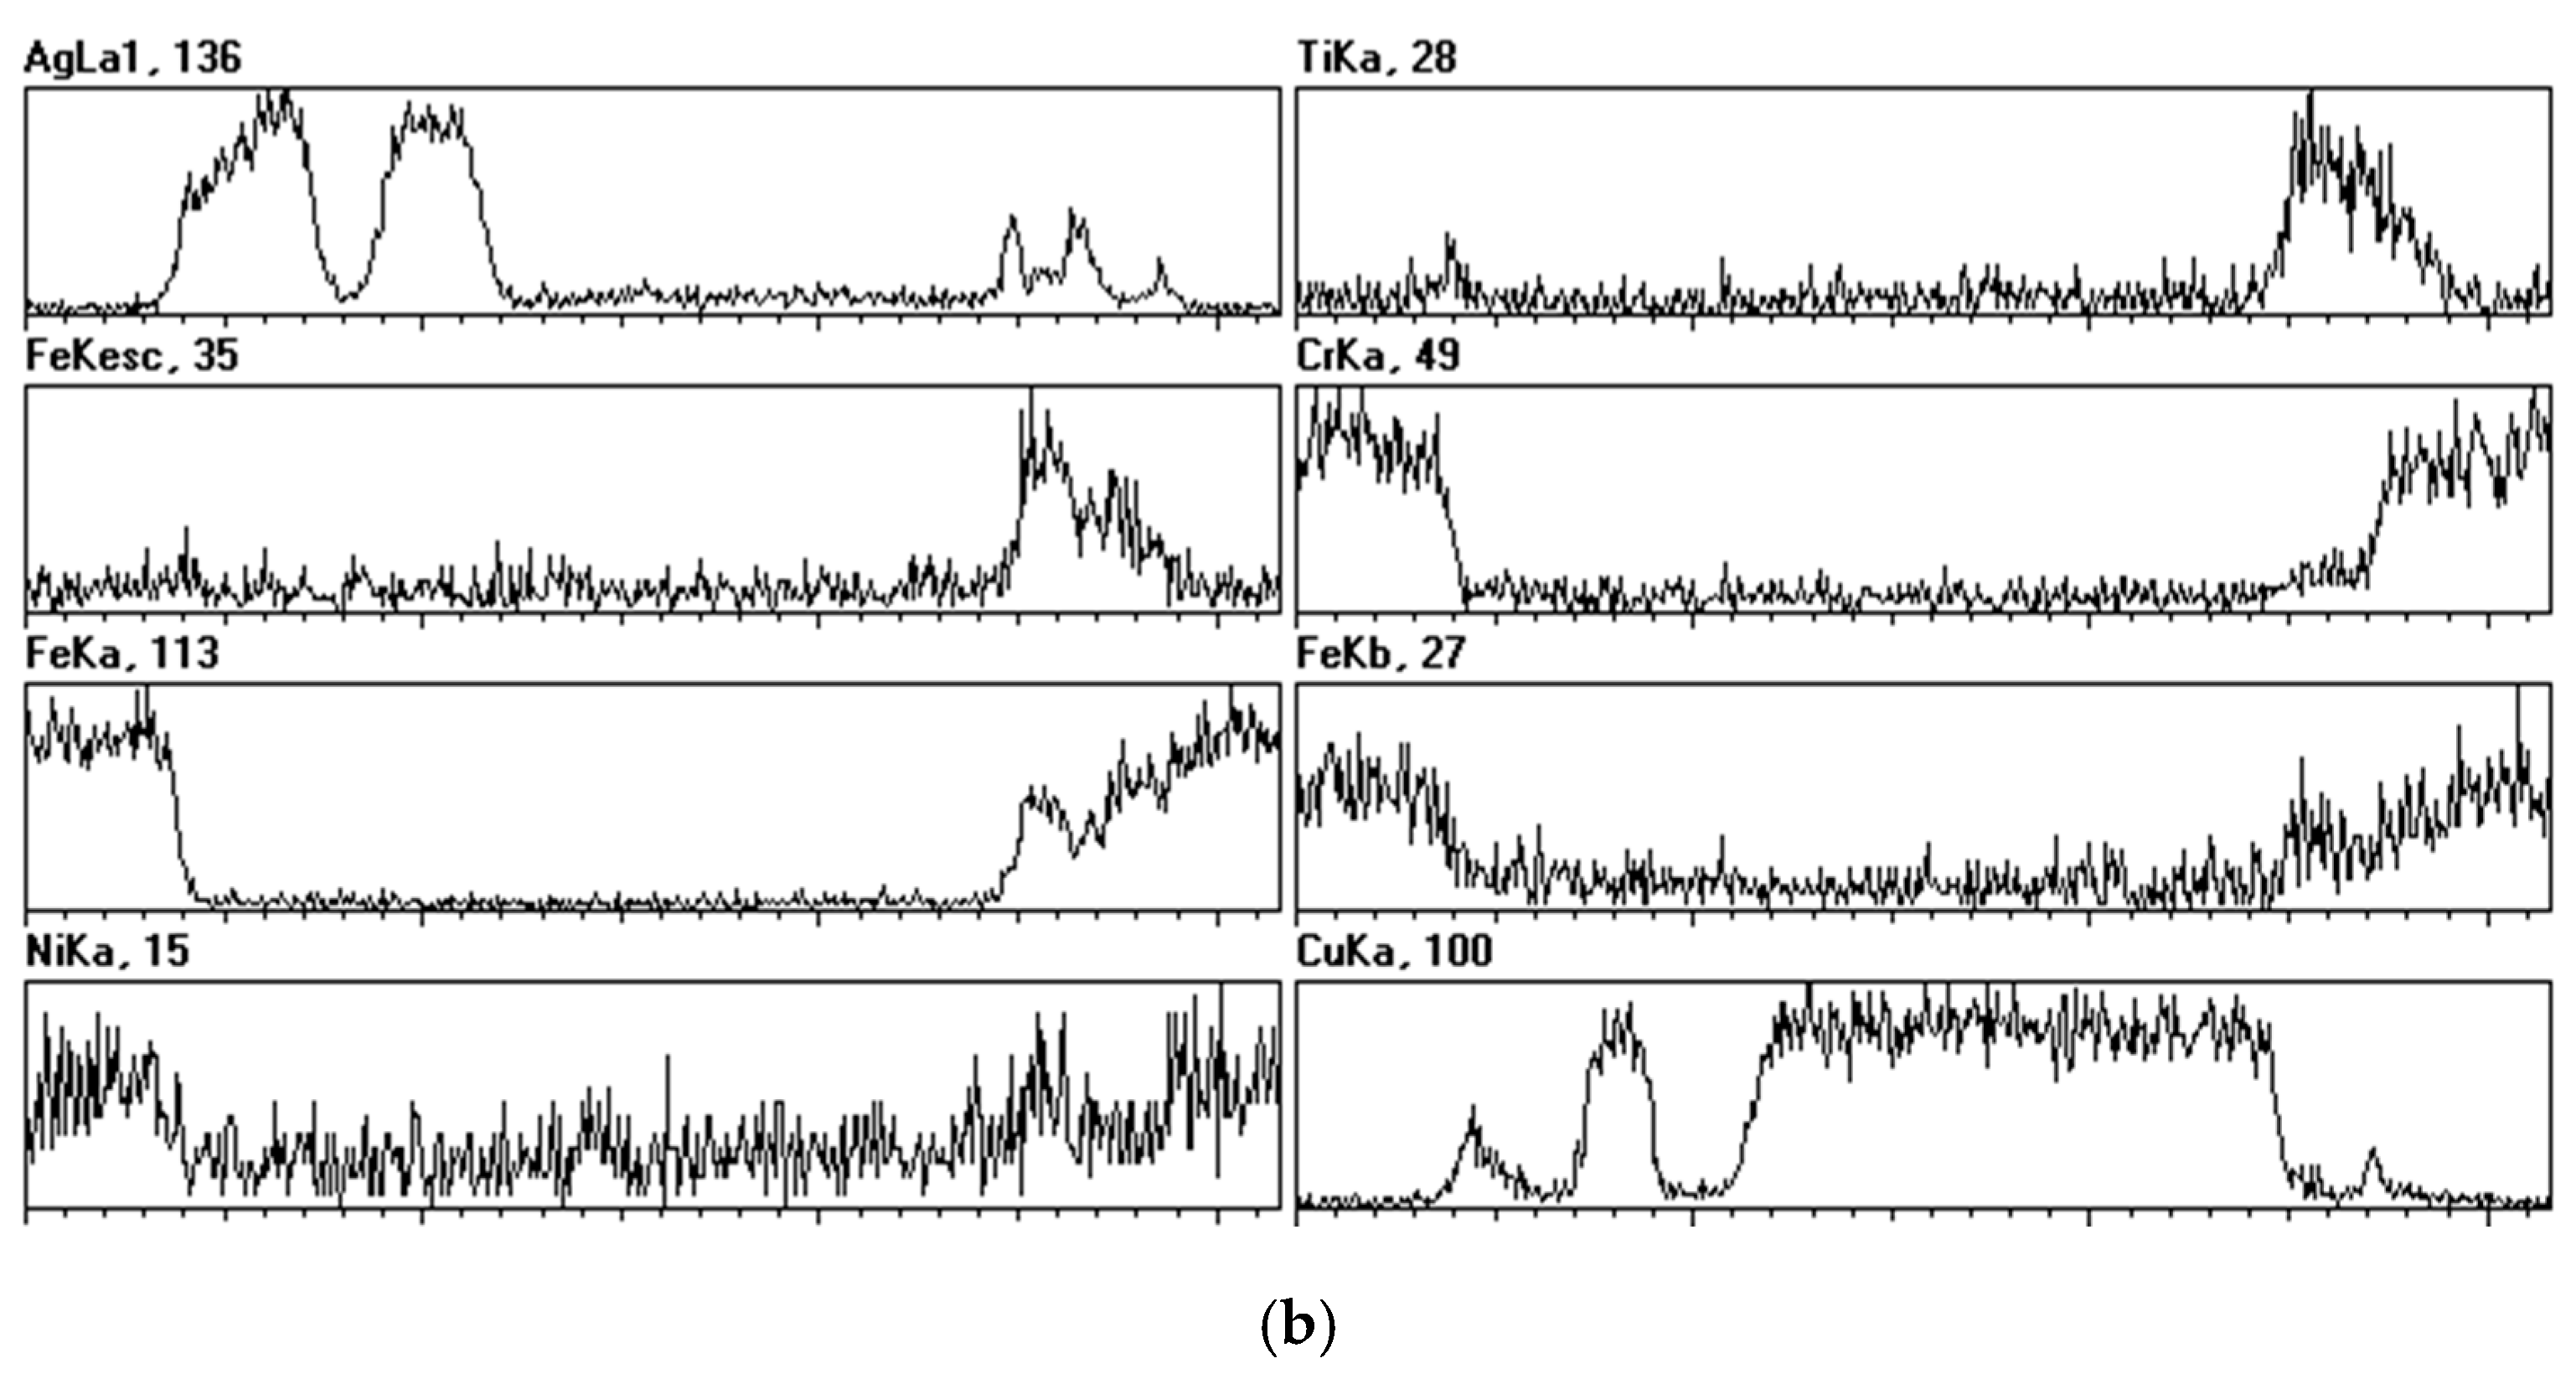
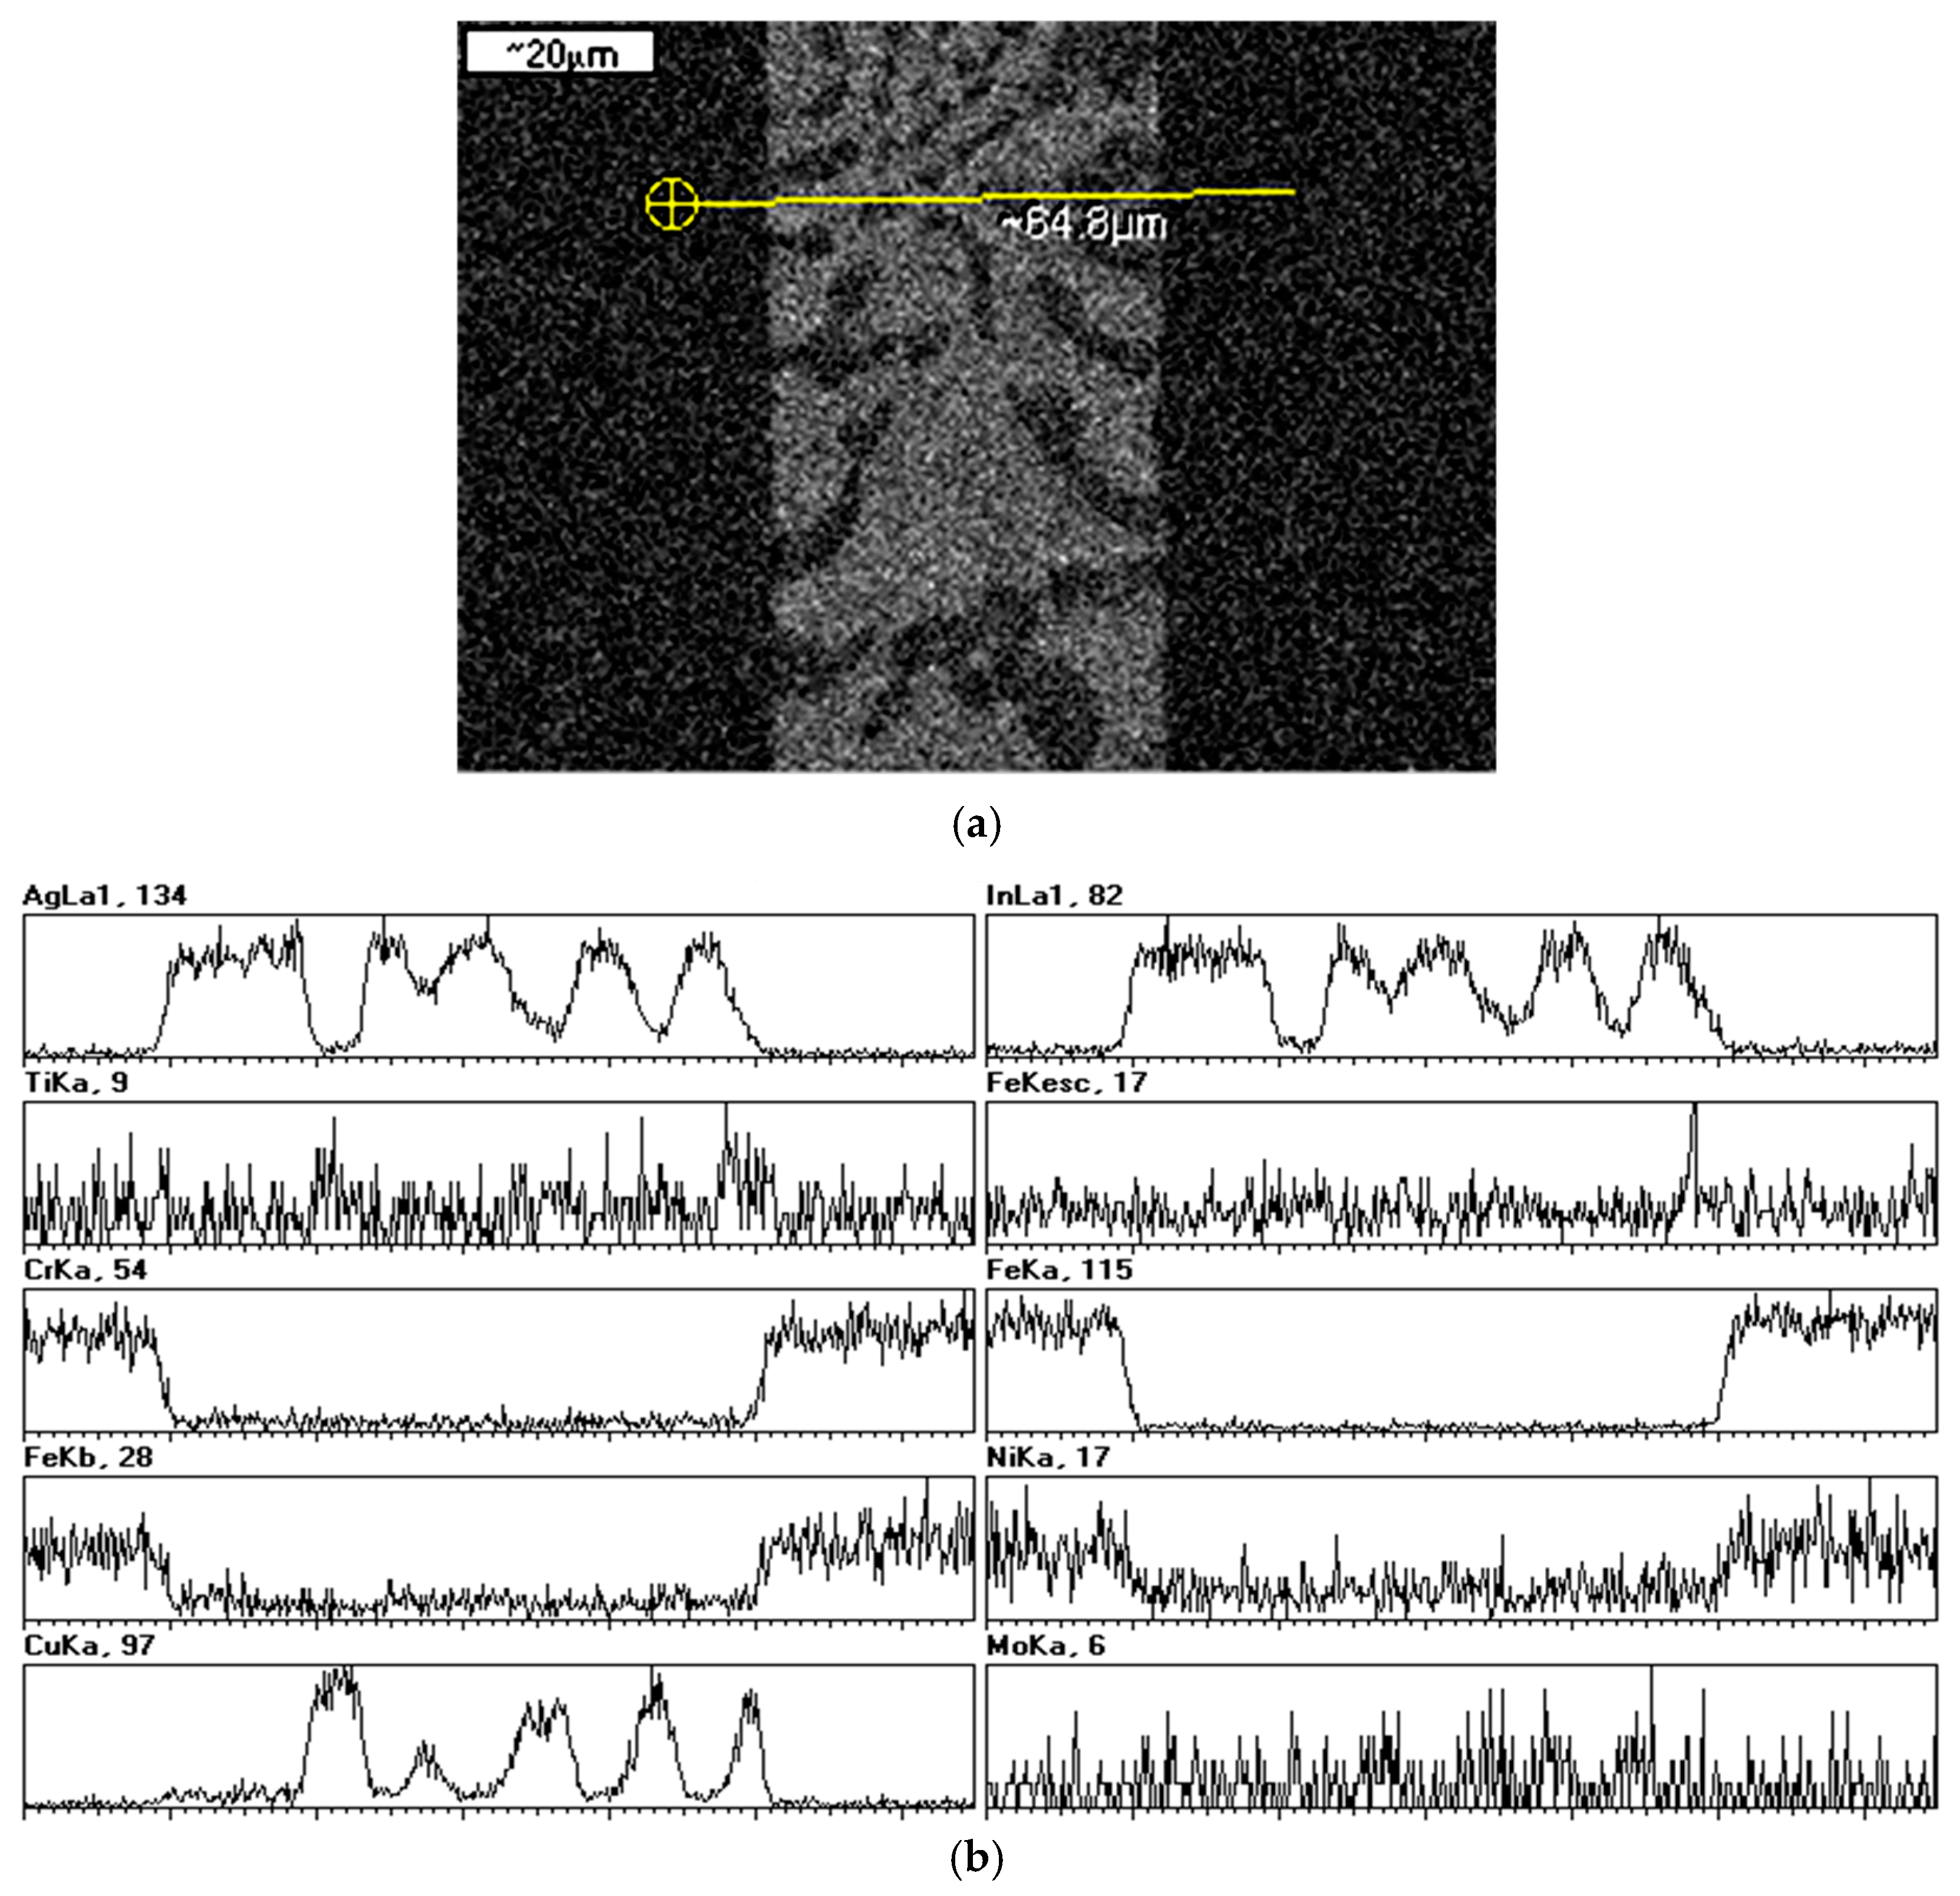
2.3. Braze Phase Composition
2.4. Corrosion Testing
3. Results
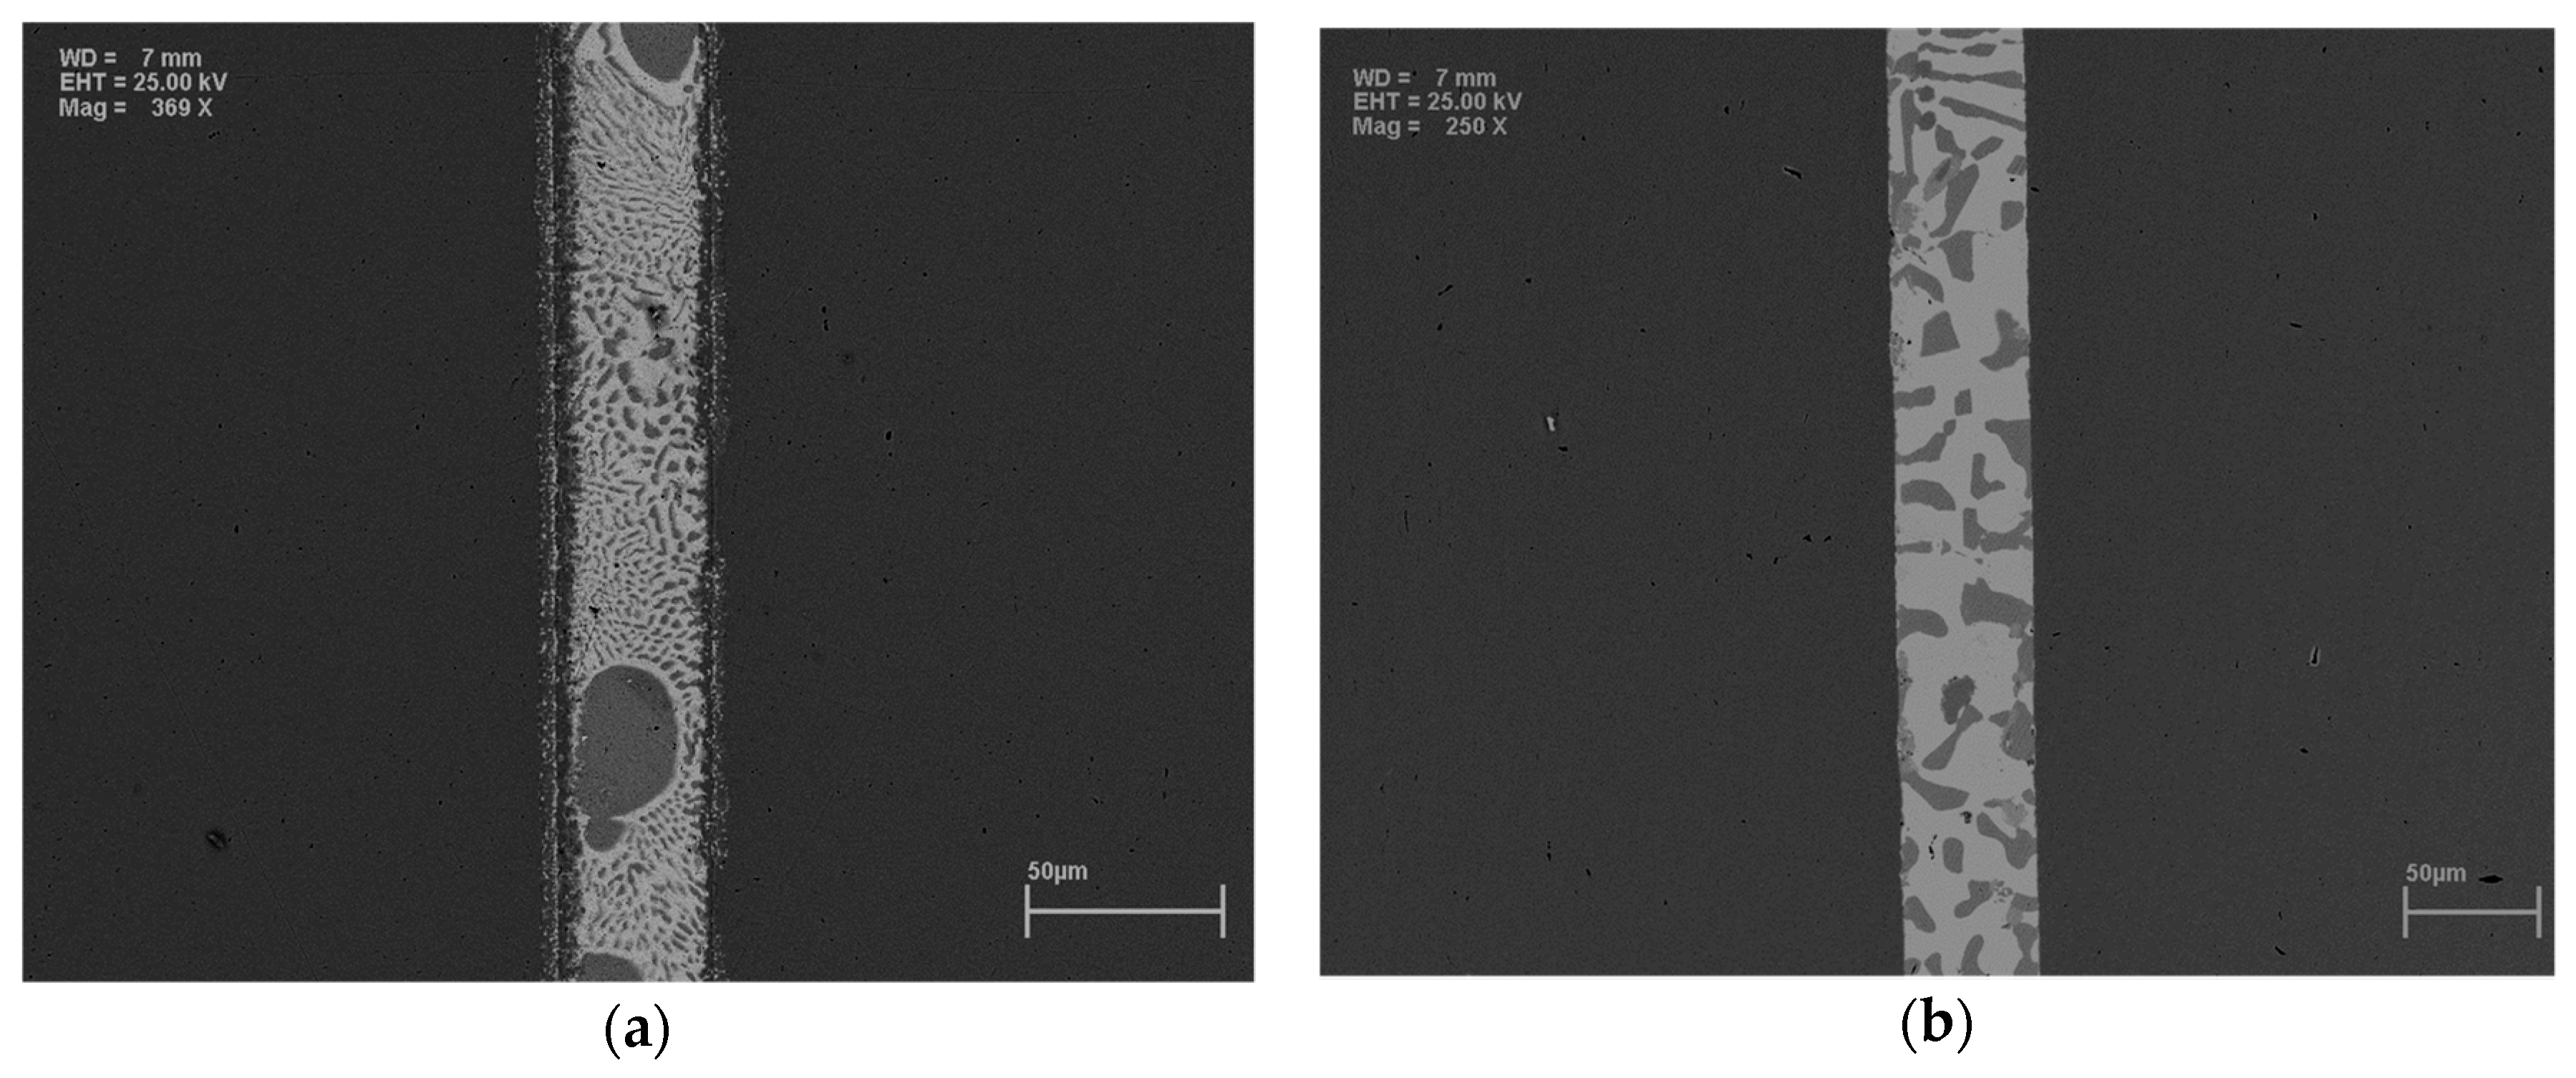
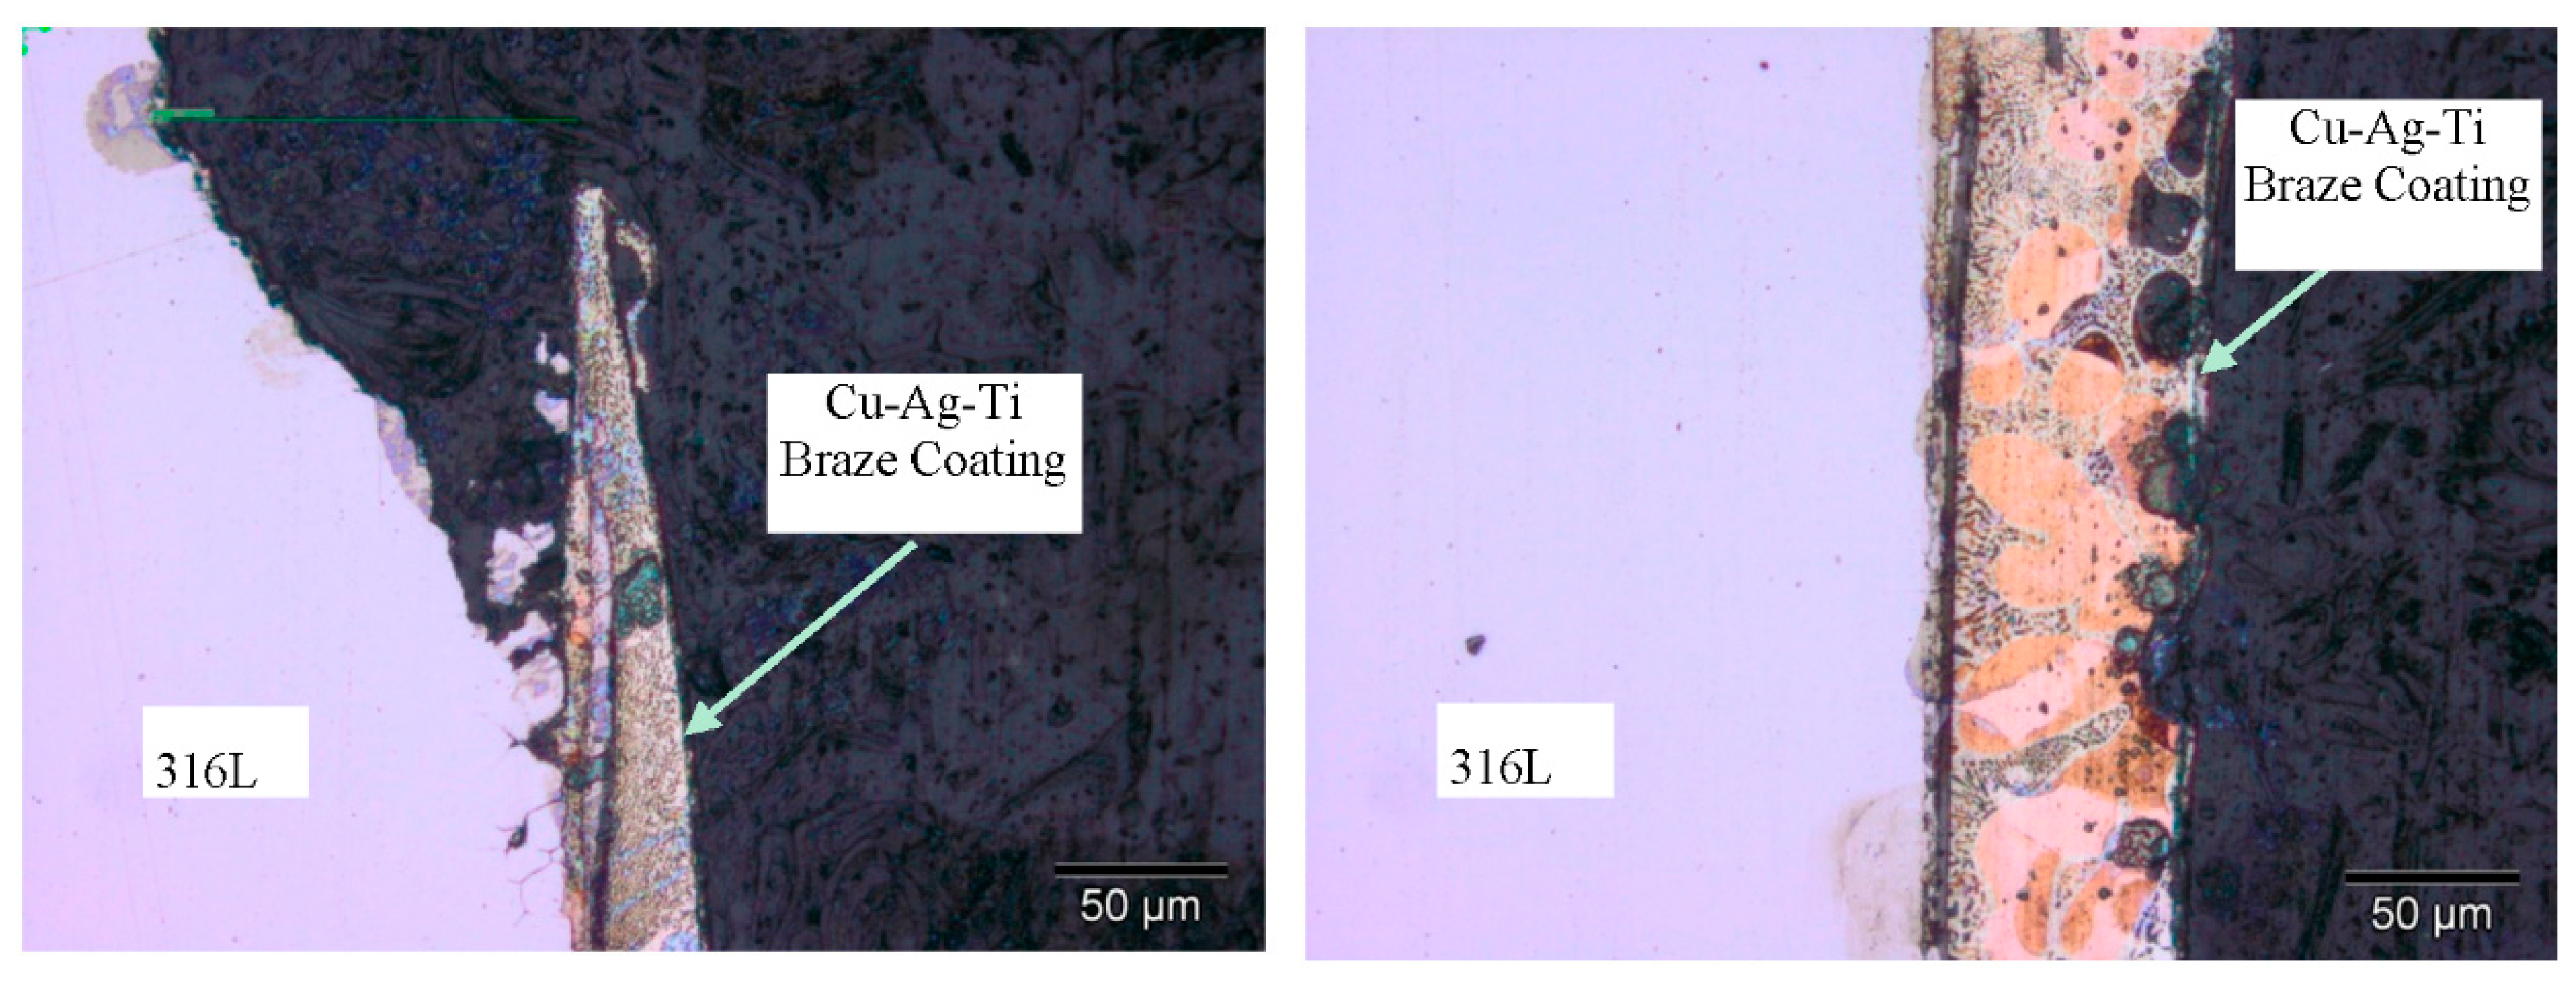
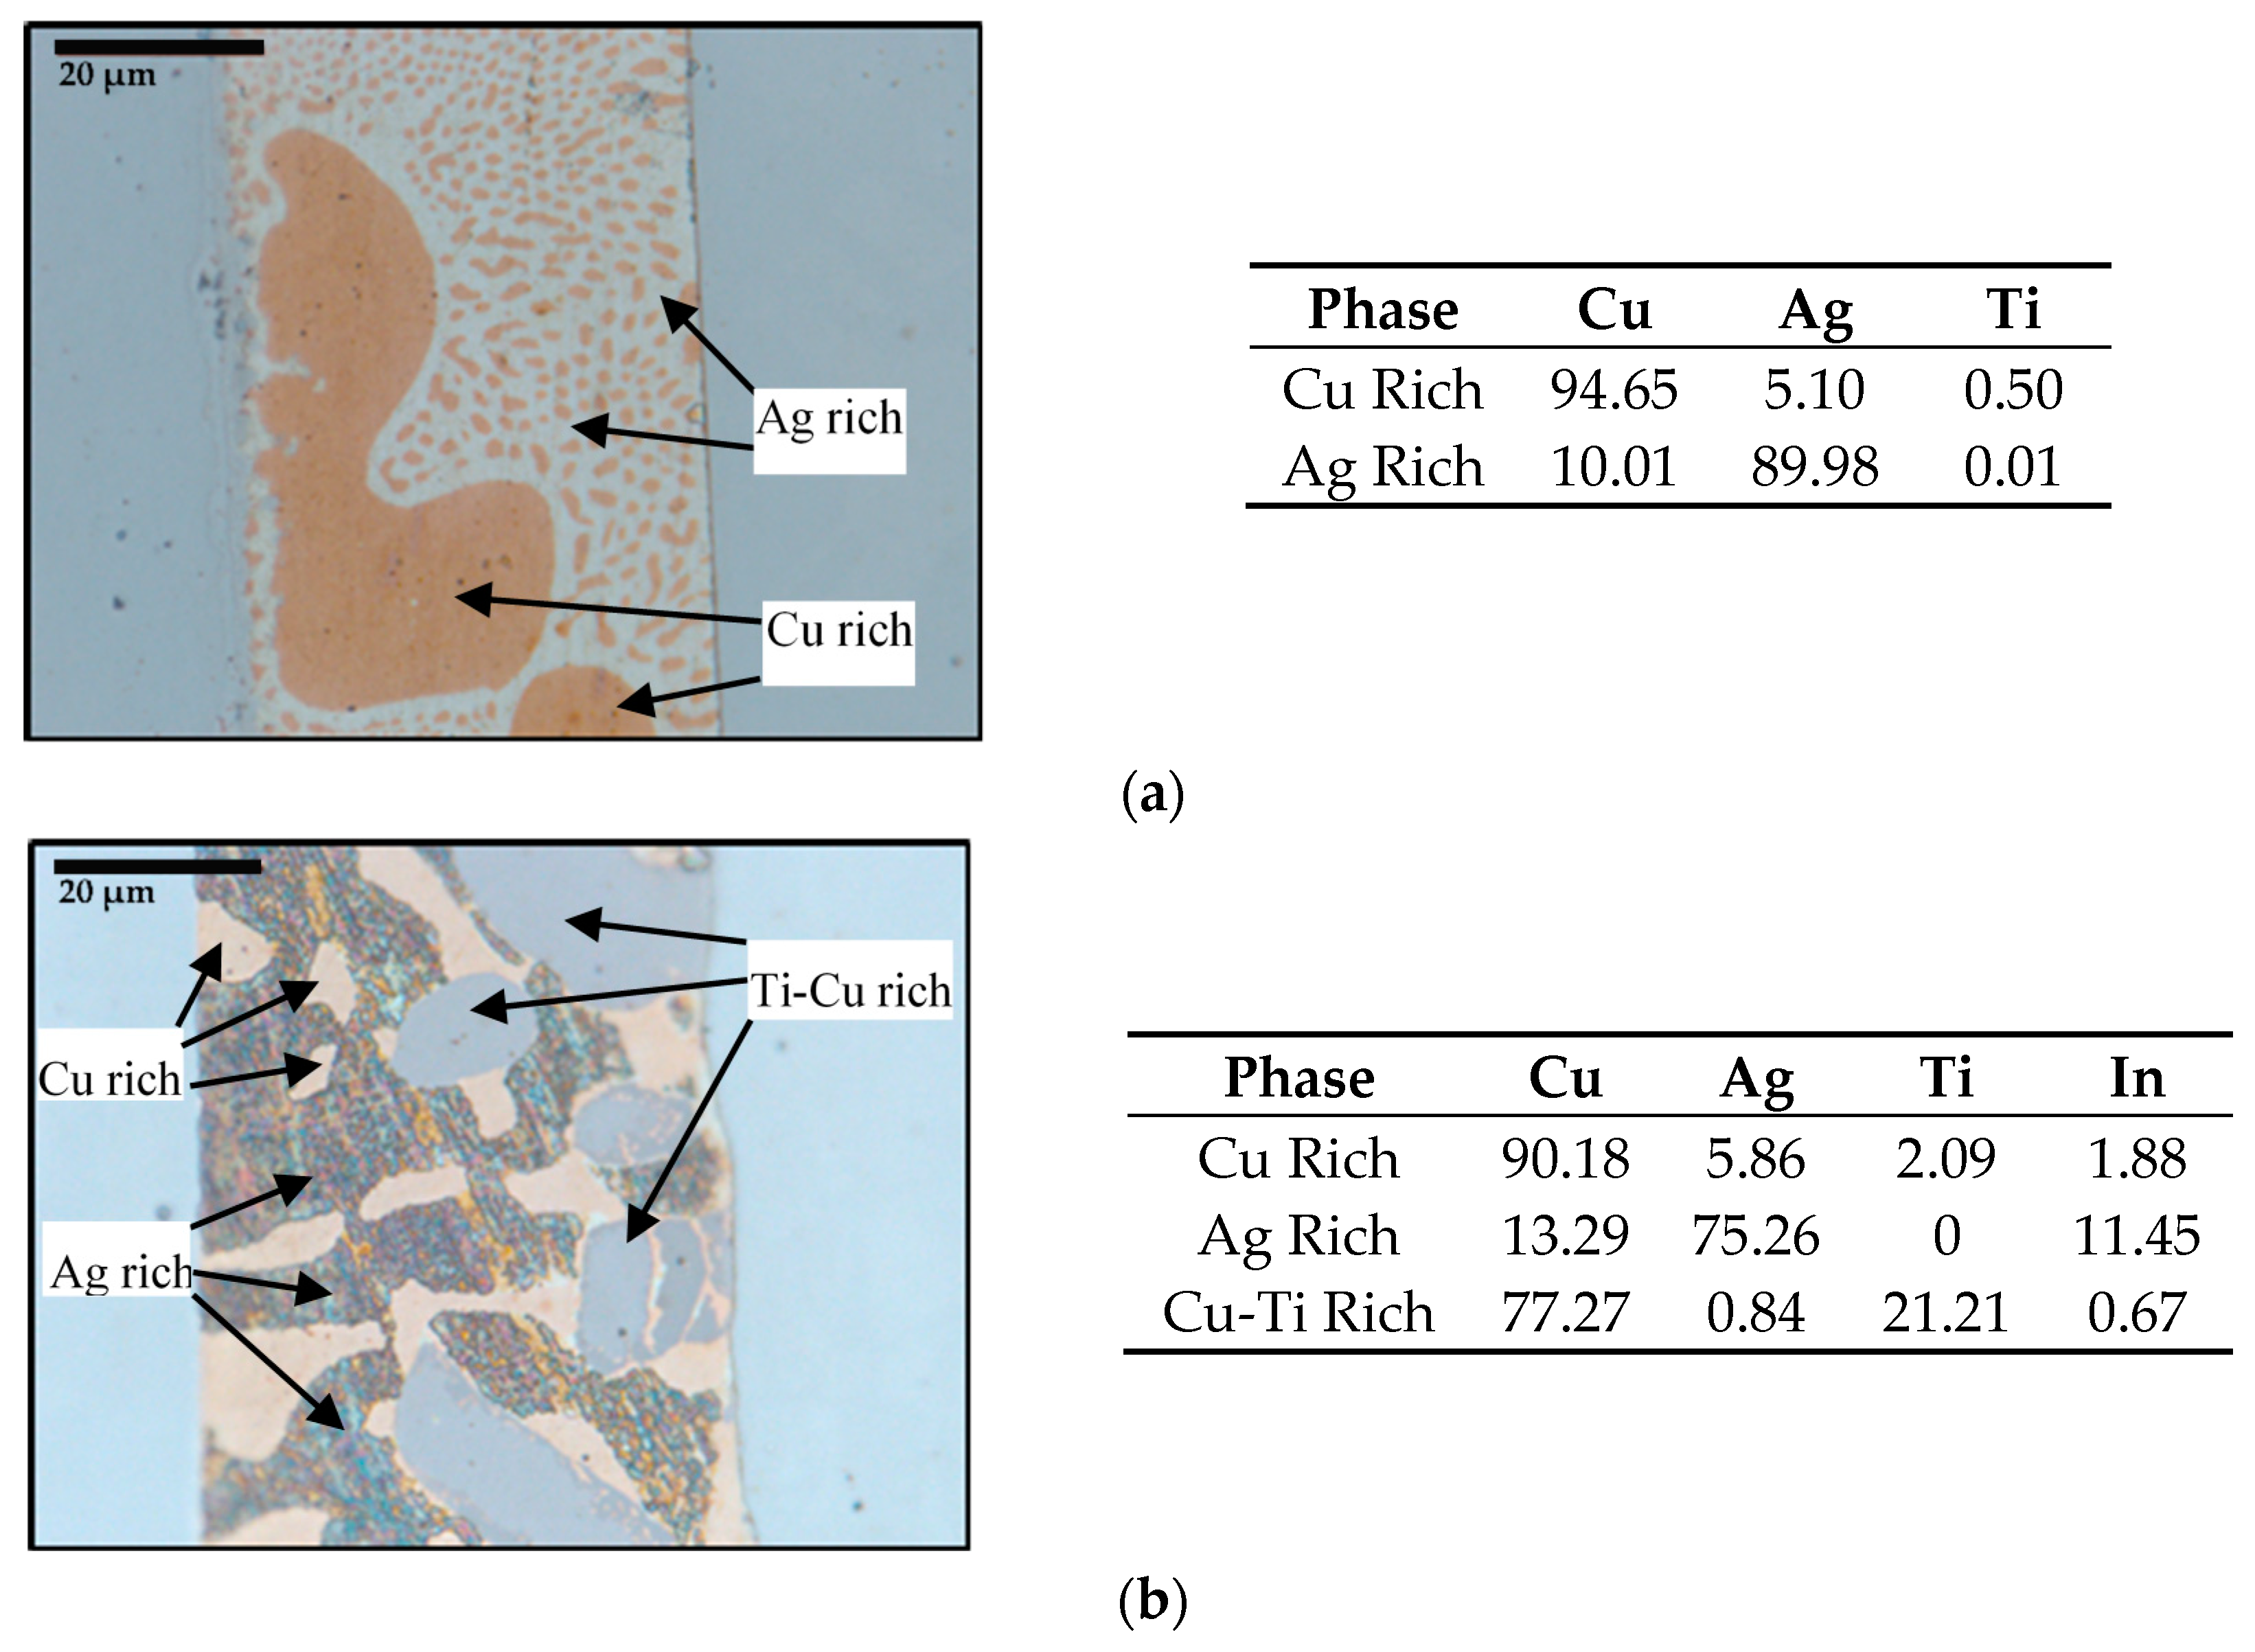
3.1. Brazed Stainless Steel Joint Characterization
3.2. Corrosion Behavior of Brazed Joints
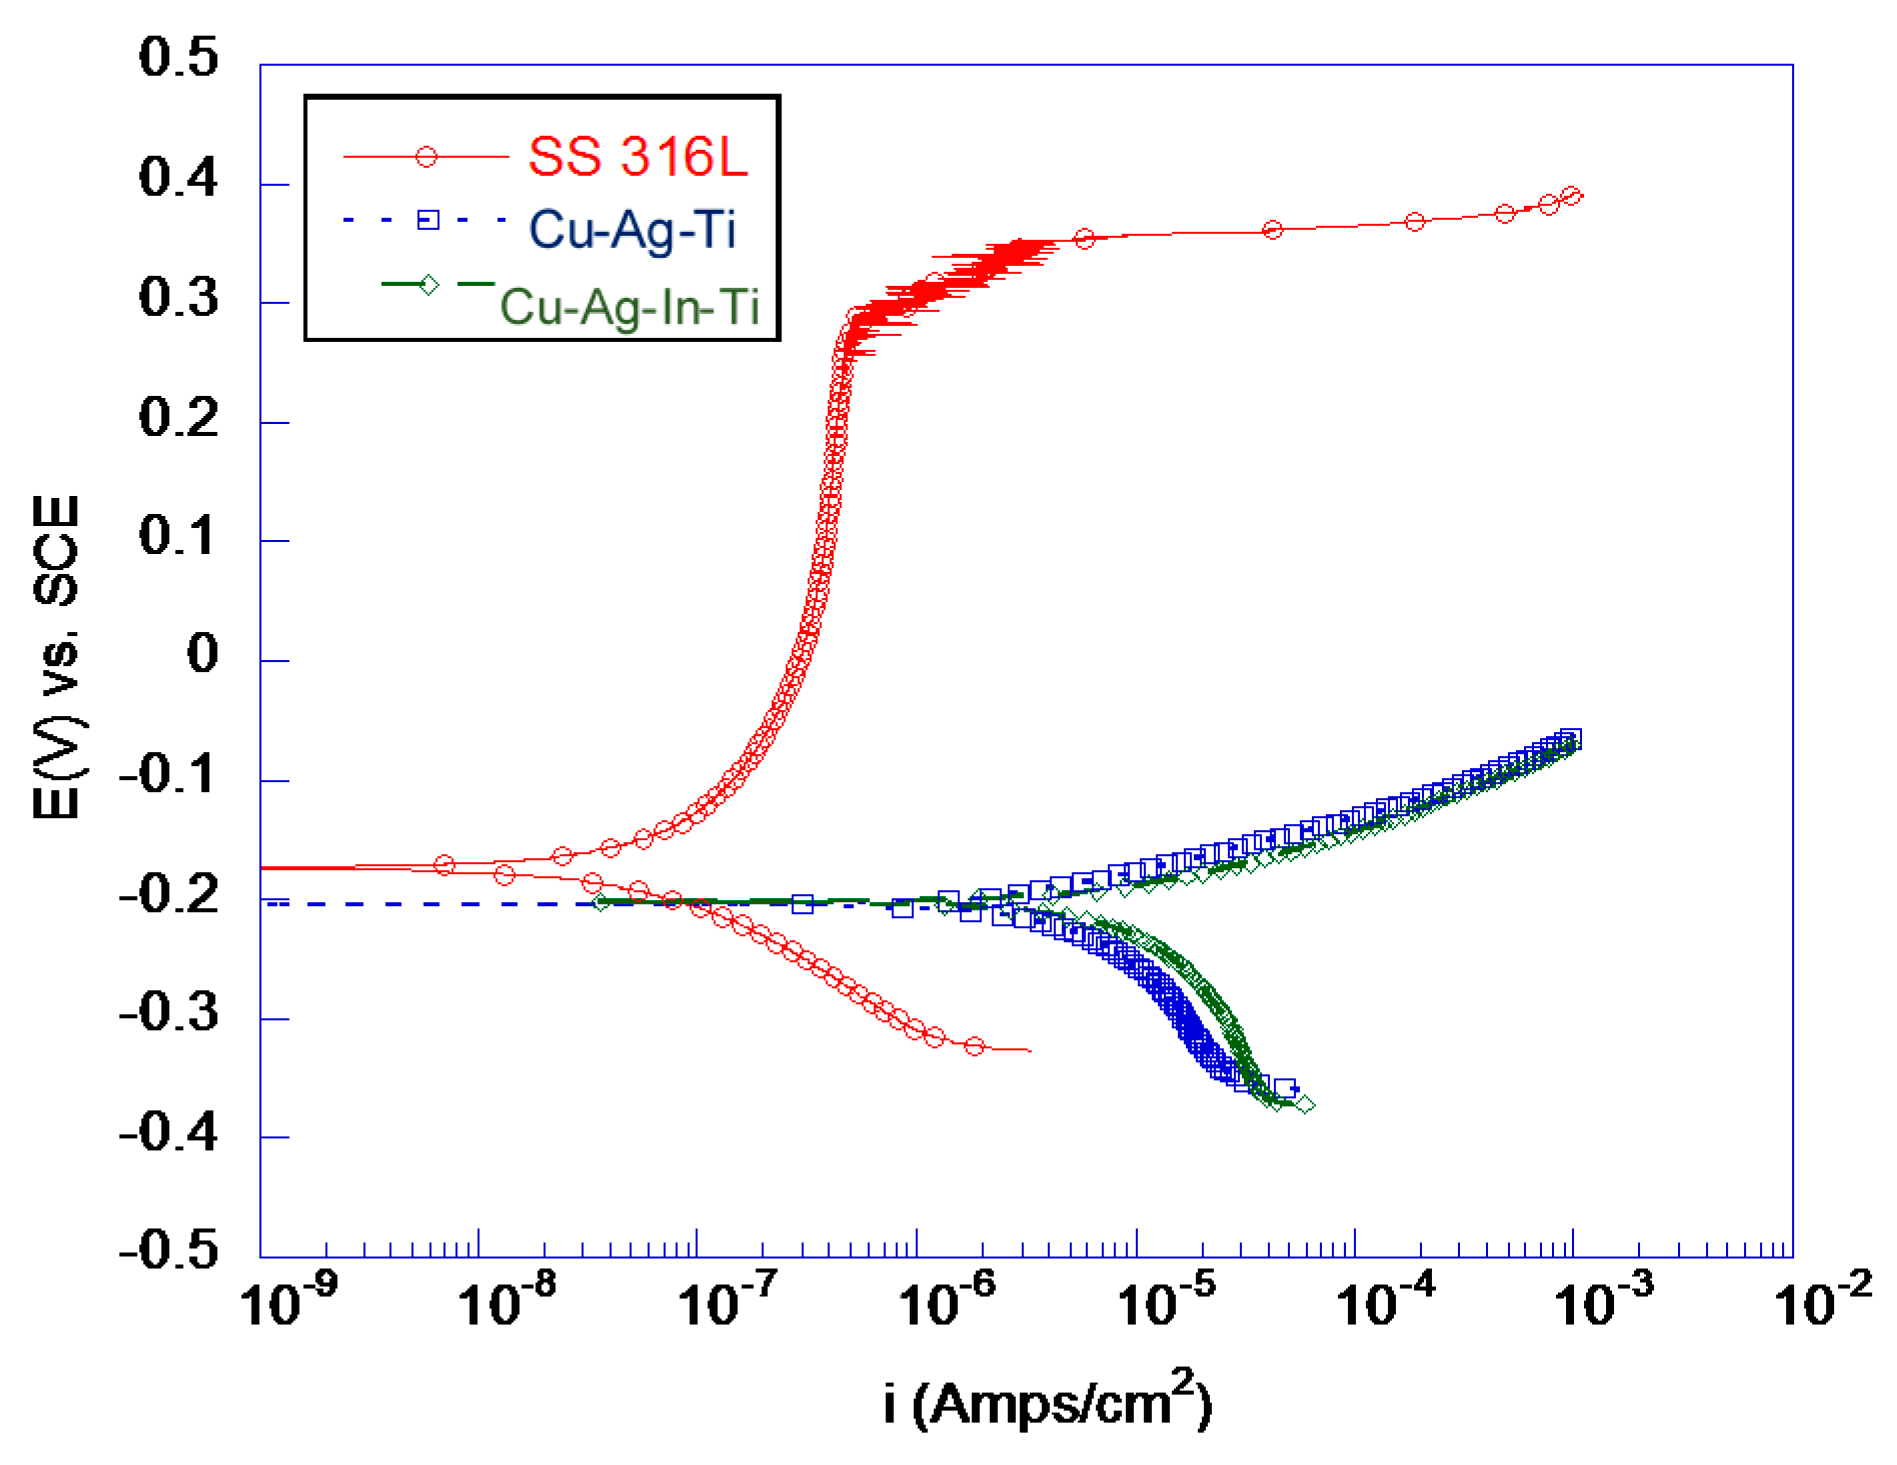
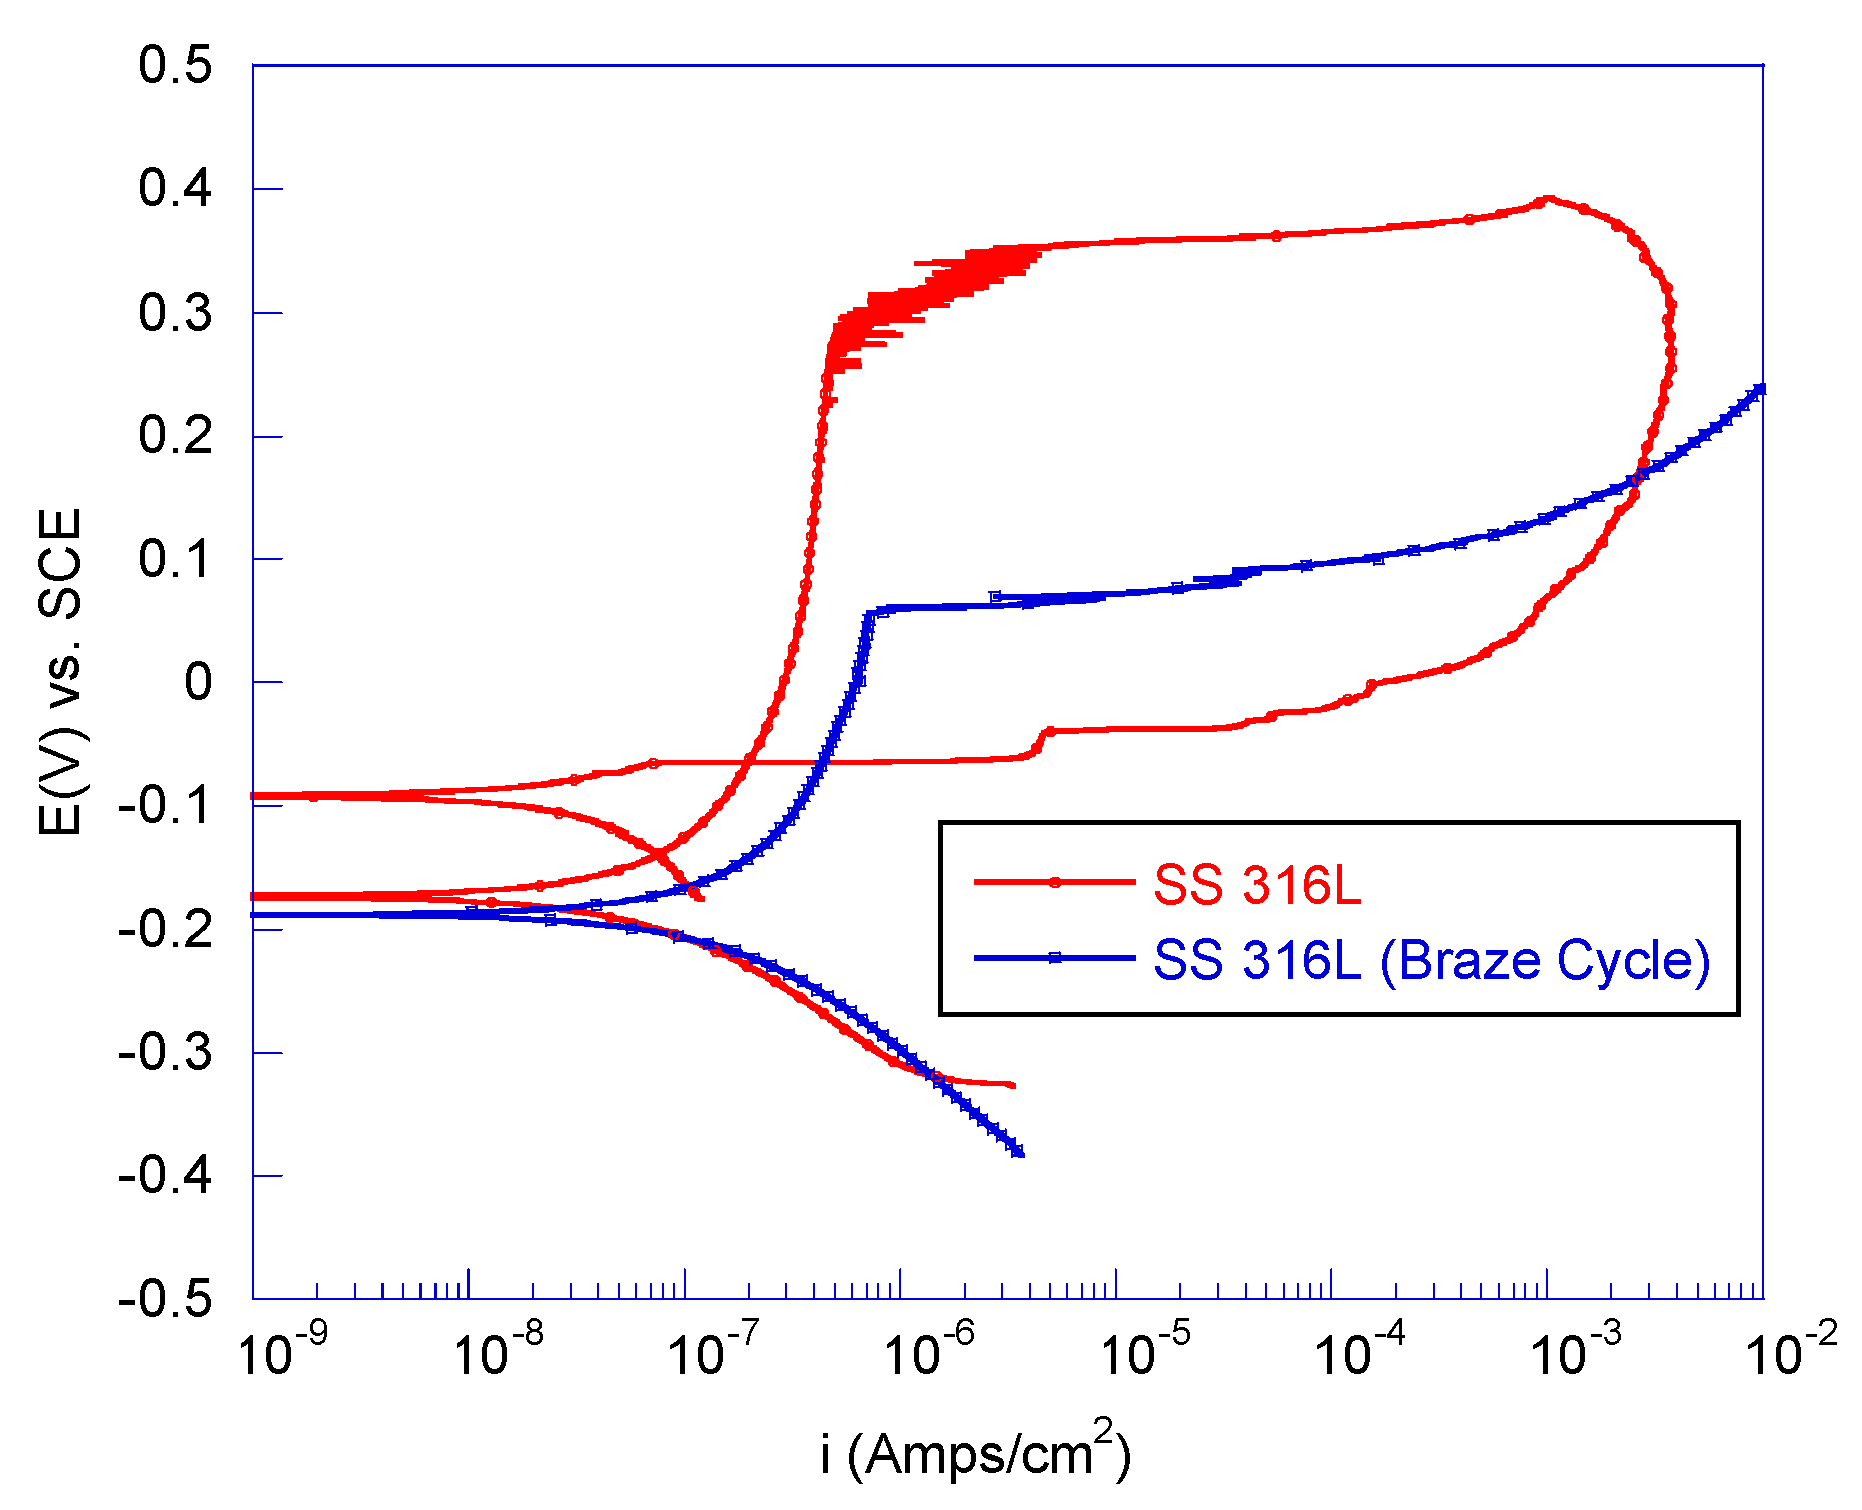
3.2.1. Electrochemical Testing of Braze Materials
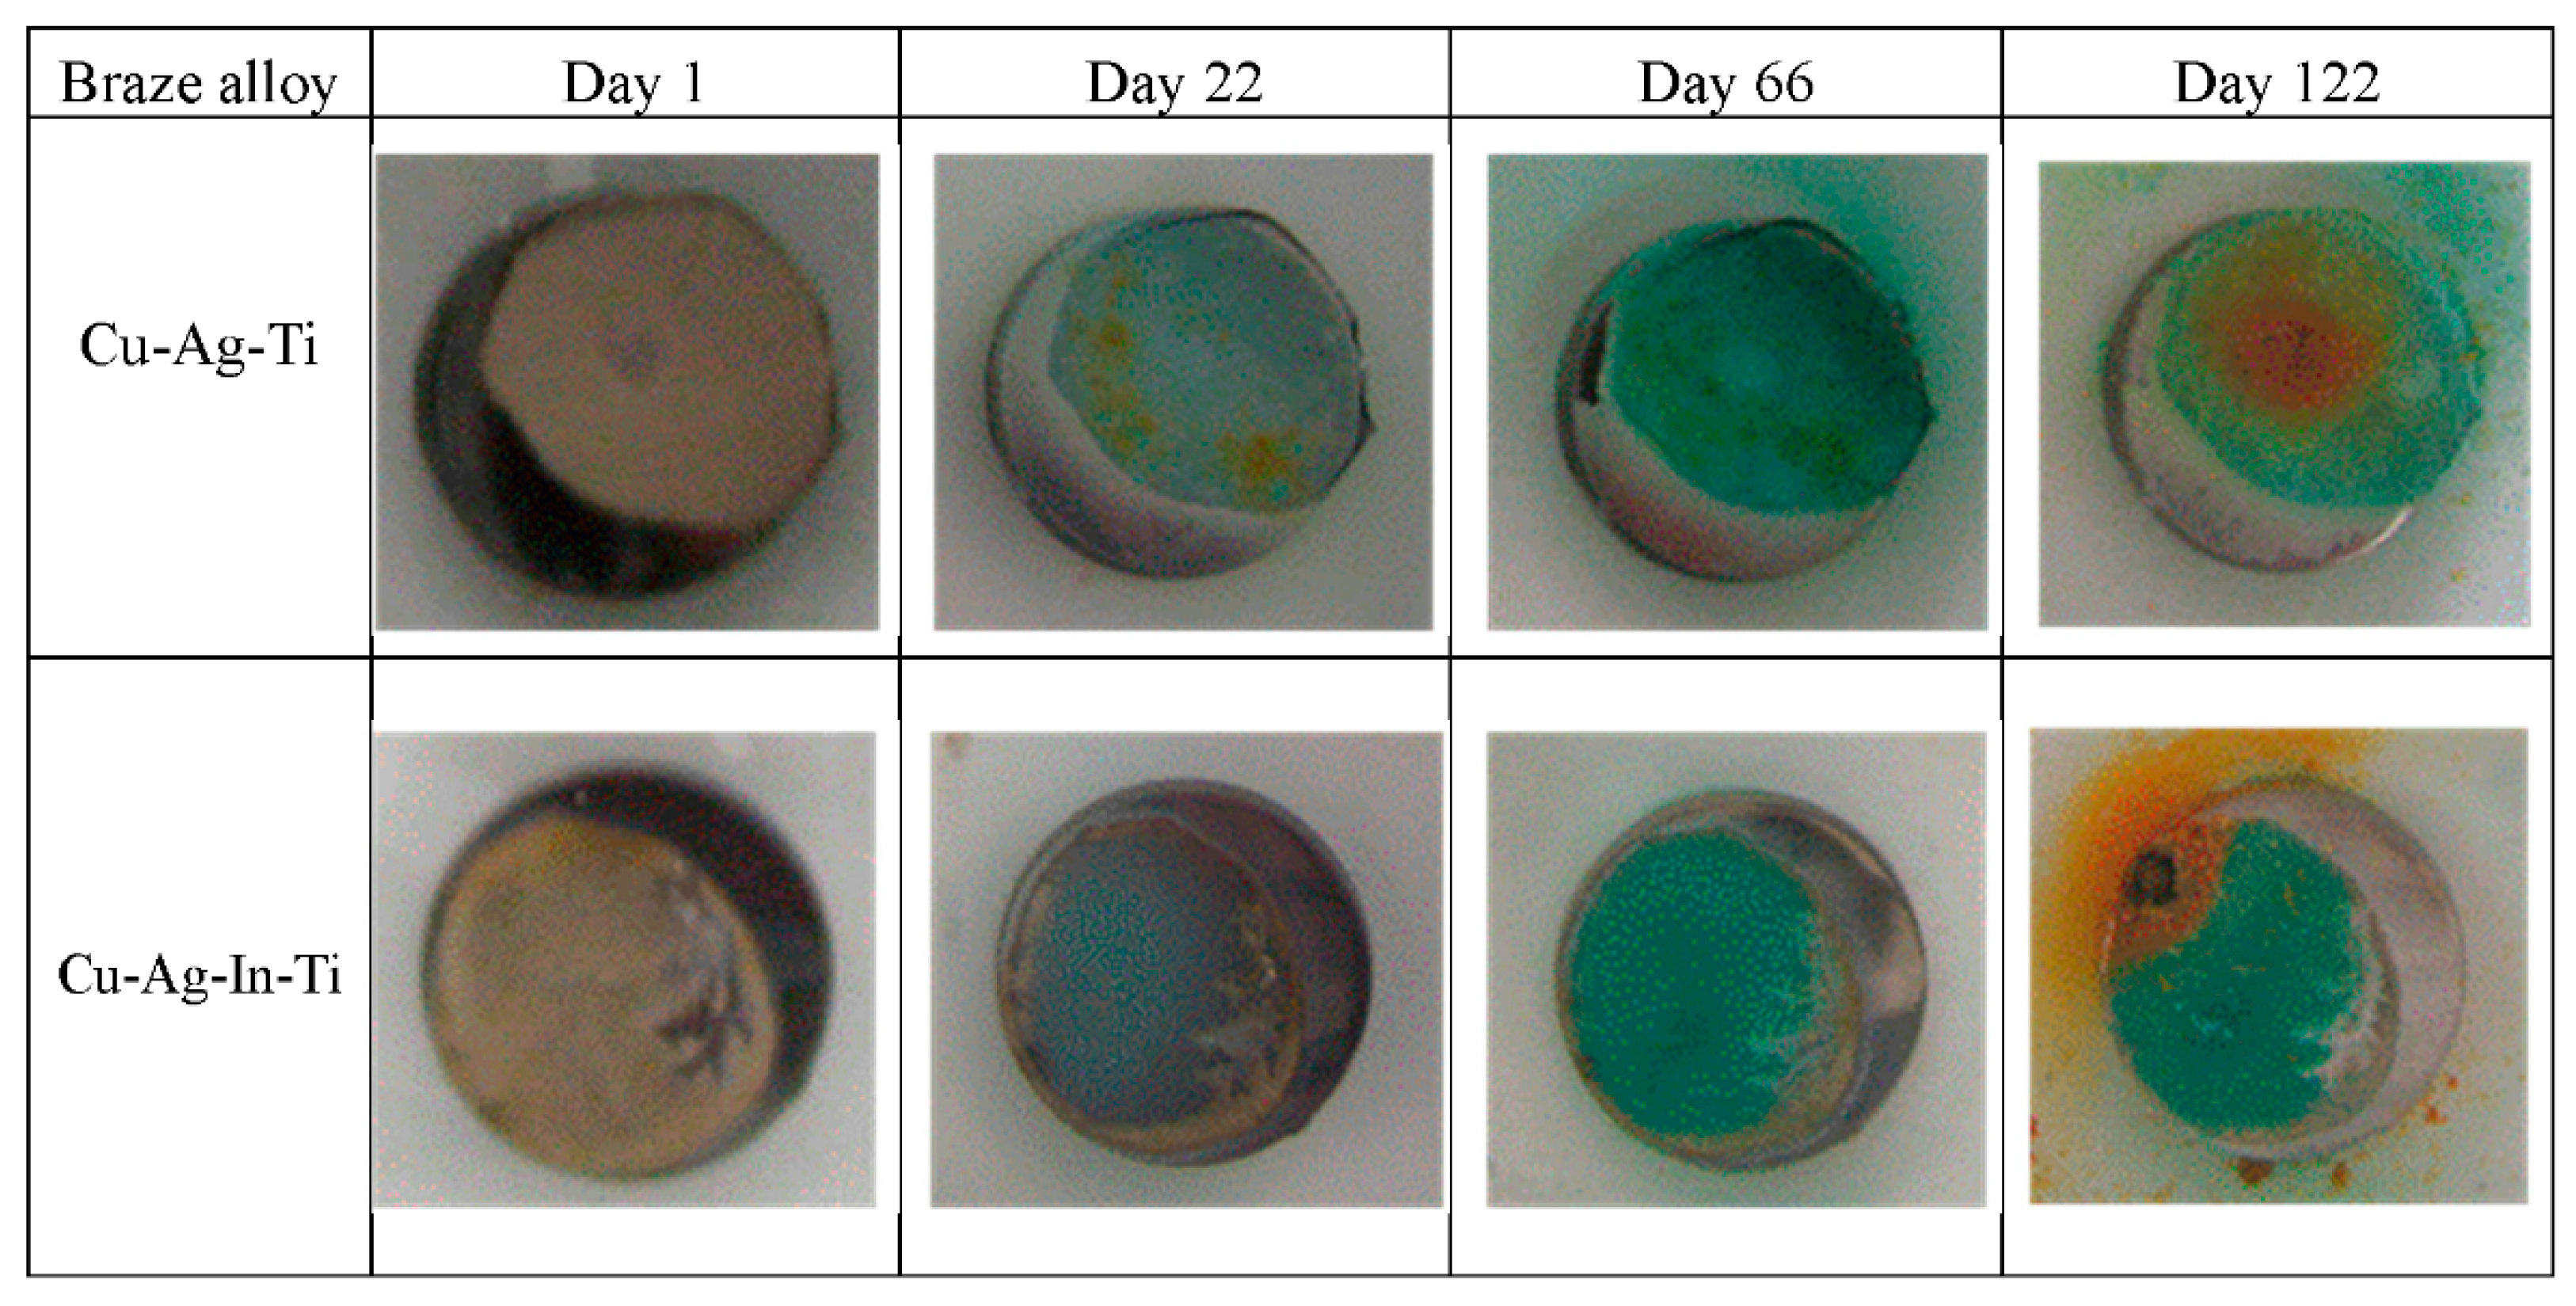
3.2.2. Exposure Testing at Open Circuit Potential
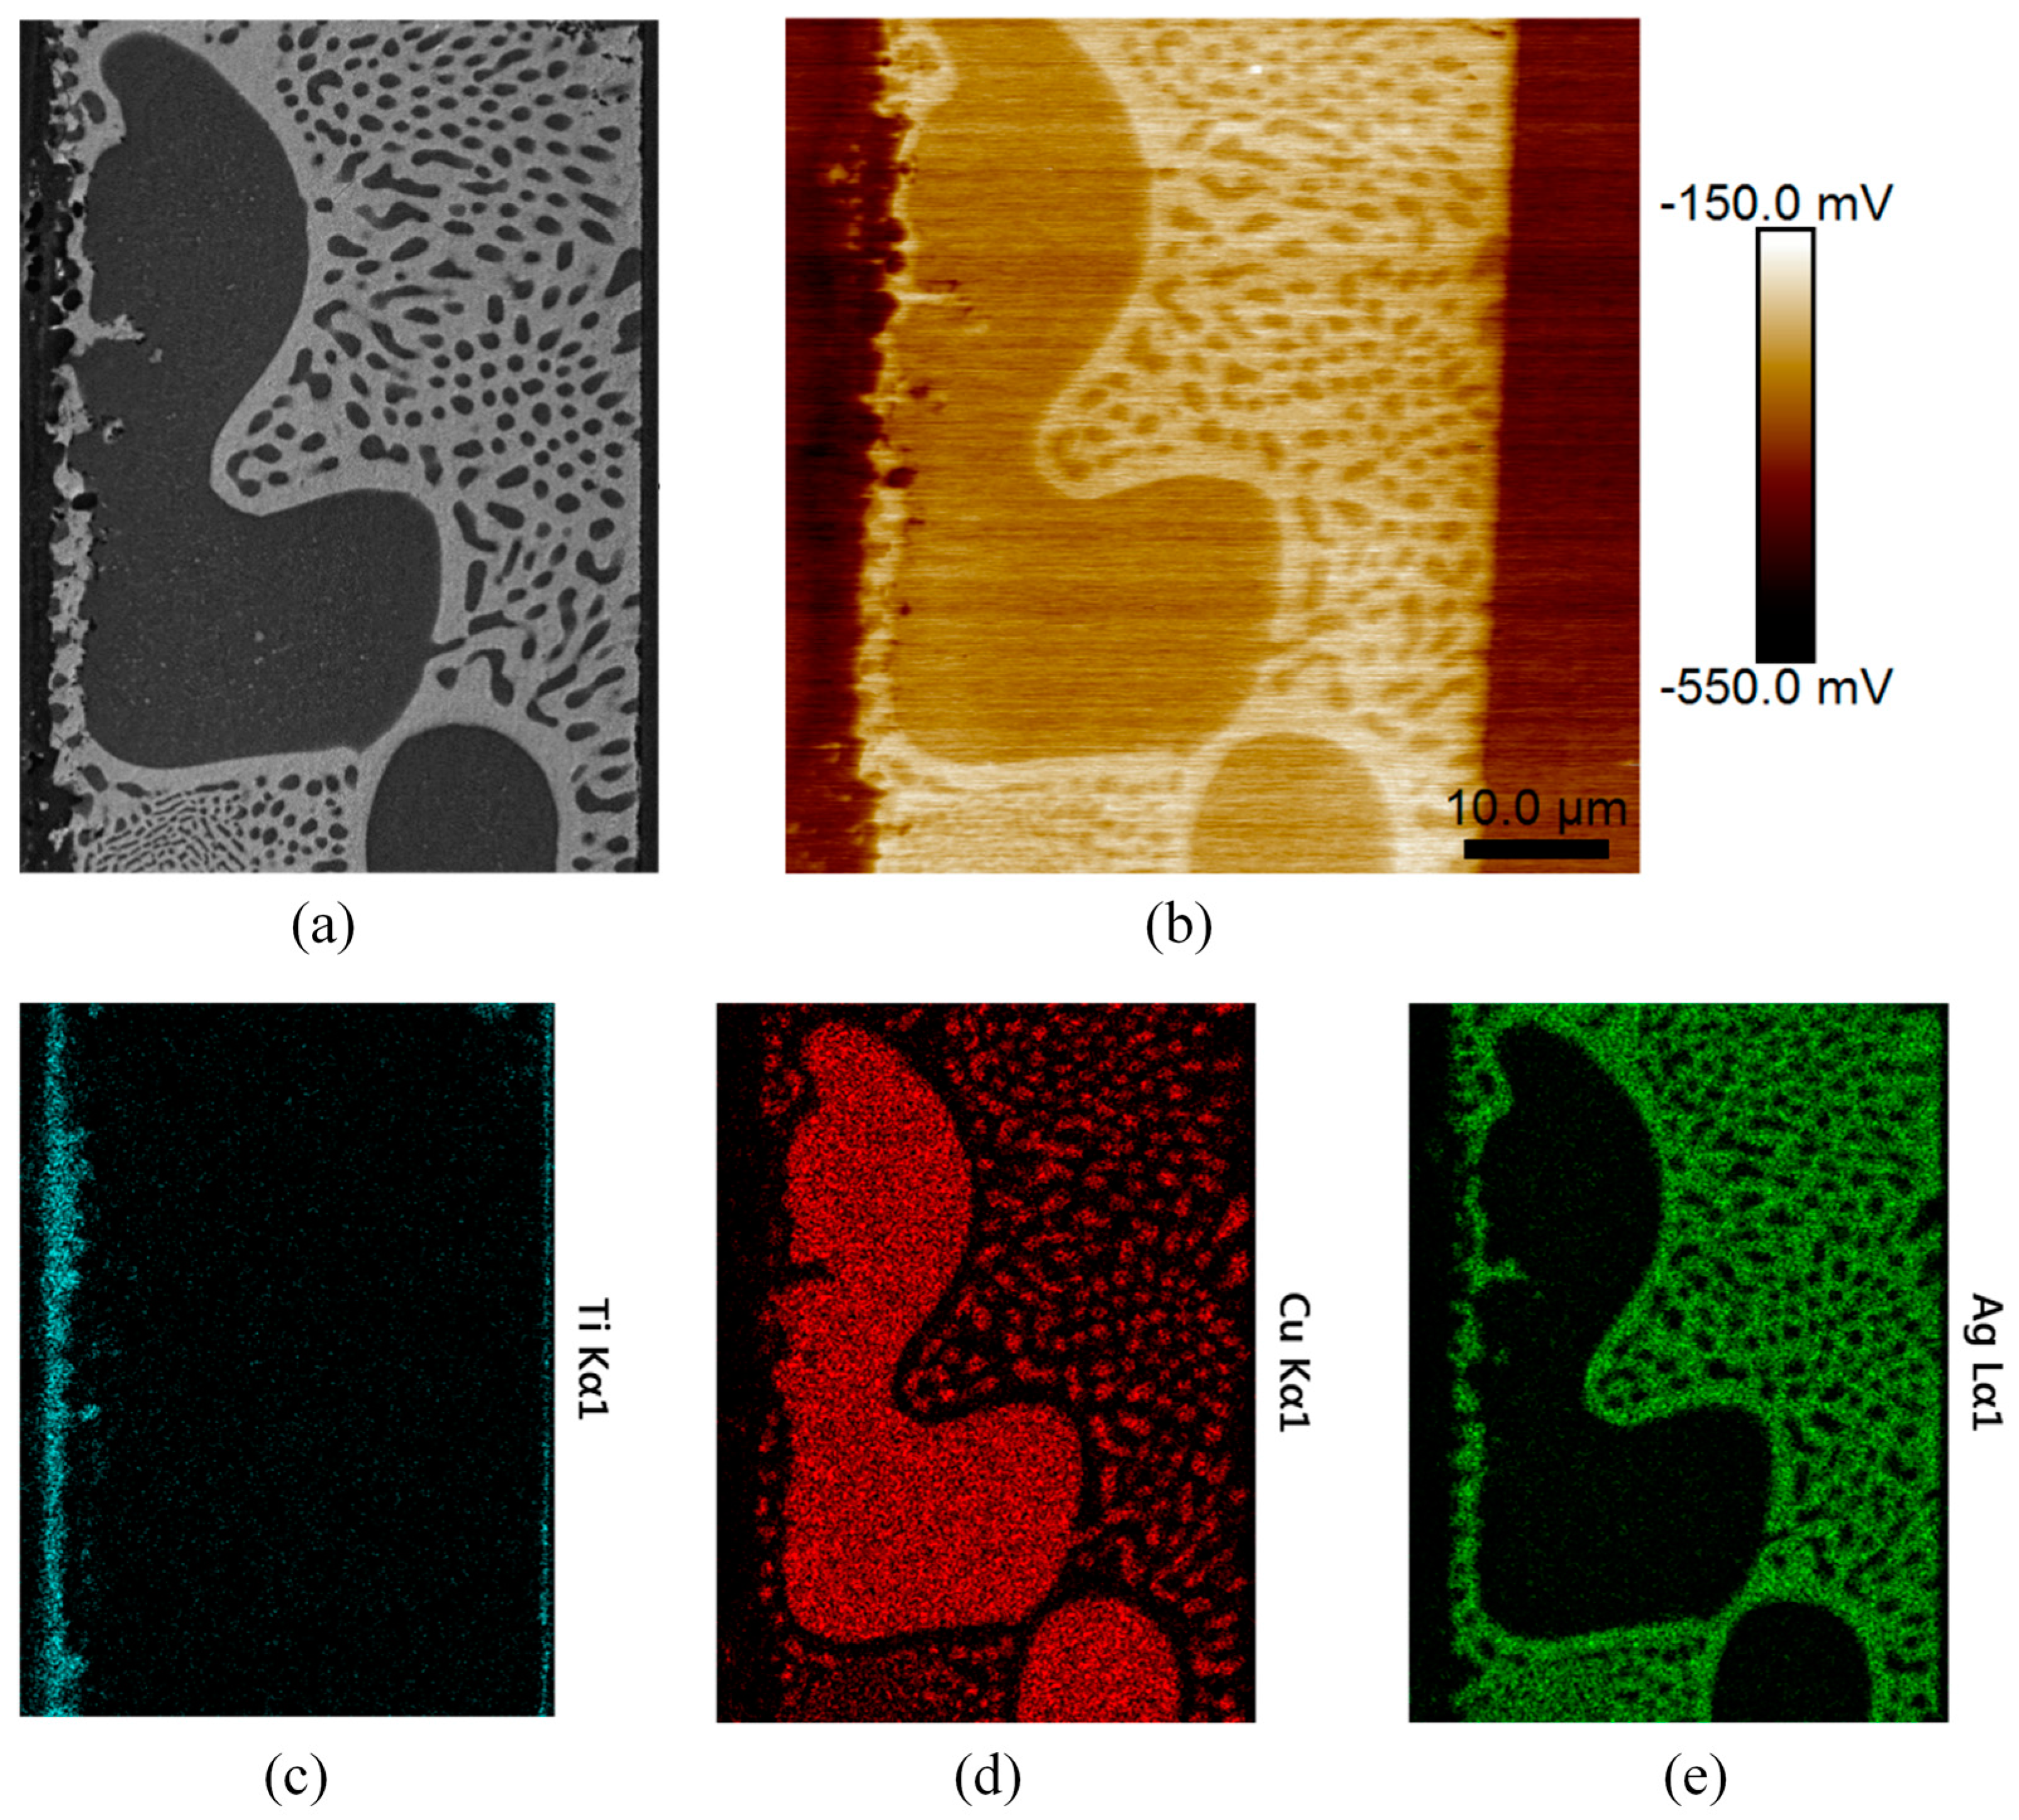
3.3. SKPFM Measurements
4. Discussion
5. Conclusions
Acknowledgments
Author Contributions
Conflicts of Interest
References
- Jacobson, D.M.; Humpston, G. Principles of Brazing; ASM International: Materials Park, NY, USA, 2005. [Google Scholar]
- Dev, S.C.; Singh, I.; Basu, D.K.; Bhattamishra, A.K.; Sivaramakrishnan, C.S. Corrosion behaviour of silver brazing alloys in different environments. Anti-Corros. Methods Mater. 1997, 44, 260–264. [Google Scholar] [CrossRef]
- Dimatteo, A.; Lovicu, G.F.; Desanctis, M.; Valentini, R.; Santarelli, S.; Cognetta, F. Compatibility of nickel and silver-based brazing alloys with E85 fuel blends. Mater. Corros. 2015, 66, 158–168. [Google Scholar] [CrossRef]
- Shafrin, E.G.; Zisman, W.A. Constitutive relations in the wetting of low energy surfaces and the theory of the retraction method of preparing monolayers. J. Phys. Chem. 1960, 64, 519–524. [Google Scholar] [CrossRef]
- Dezellus, O.; Eustathopoulos, N. Fundamental issues of reactive wetting by liquid metals. J. Mater. Sci. 2010, 45, 4256–4264. [Google Scholar] [CrossRef]
- Paiva, O.C.; Barbosa, M.A. Microstructure, mechanical properties and chemical degradation of brazed AISI 316 stainless steel/alumina systems. Mater. Sci. Eng. 2008, 480, 306–315. [Google Scholar] [CrossRef]
- Kozlova, O.; Voytovych, R.; Devismes, M.F.; Eustathopoulos, N. Wetting and brazing of stainless steels by copper-silver eutectic. Mater. Sci. Eng. 2008, 495, 96–101. [Google Scholar] [CrossRef]
- Abed, A.; Jalham, I.S.; Hendry, A. Wetting and reaction between β′-sialon, stainless steel and Cu-Ag brazing alloys containing Ti. J. Eur. Ceram. Soc. 2001, 21, 283–290. [Google Scholar] [CrossRef]
- Nicholas, M.G.; Valentine, T.M.; Waite, M.J. The wetting of alumina by copper alloyed with titanium and other elements. J. Mater. Sci. 1980, 15, 2197–2206. [Google Scholar] [CrossRef]
- Takemoto, T.; Okamoto, I. Effect of composition on the corrosion behavior of stainless-steels brazed with silver-base filler metals. Weld. J. 1984, 63, S300–S307. [Google Scholar]
- Lee, J.G.; Hong, S.J.; Lee, M.K.; Rhee, C.K. High strength bonding of titanium to stainless steel using an Ag interlayer. J. Nucl. Mater. 2009, 395, 145–149. [Google Scholar] [CrossRef]
- Liu, C.C.; Ou, C.L.; Shiue, R.K. The microstructural observation and wettability study of brazing Ti-6Al-4V and 304 stainless steel using three braze alloys. J. Mater. Sci. 2002, 37, 2225–2235. [Google Scholar] [CrossRef]
- Singh, M.; Shpargel, T.P.; Asthana, R. Brazing of stainless steel to yttria-stabilized zirconia using gold-based brazes for solid oxide fuel cell applications. Int. J. Appl. Ceram. Technol. 2007, 4, 119–133. [Google Scholar] [CrossRef]
- Singh, M.; Shpargel, T.P.; Asthana, R. Brazing of yttria-stabilized zirconia (YSZ) to stainless steel using Cu, Ag, and Ti-based brazes. J. Mater. Sci. 2008, 43, 23–32. [Google Scholar] [CrossRef]
- Anastasio, S.; James, J.; Fitz-Gerald, J.; Scullly, J.R. Corrosion of superaustenitic stainless steel N08367 brazed with a nickel-chromium-silicon-phosphorous alloy: Electrochemical corrosion behavior of isolated and combined materials. Corrosion 2009, 65, 388–403. [Google Scholar] [CrossRef]
- James, J.P.; Bocher, F.; Scully, J.R. Effect of braze clearance on localized corrosion of a superaustenitic stainless steel brazed with a Ni-based alloy (Ni-22Cr-6.3Si-3.8P). Corrosion 2009, 65, 511–526. [Google Scholar] [CrossRef]
- Sorensen, N.R. The environmentally assisted failure of cusil in mattssons solution. Corrosion 1986, 42, 299–306. [Google Scholar] [CrossRef]
- Lee, M.K.; Park, J.J.; Lee, J.G.; Rhee, C.K. Phase-dependent corrosion of titanium-to-stainless steel joints brazed by Ag-Cu eutectic alloy filler and Ag interlayer. J. Nucl. Mater. 2013, 439, 168–173. [Google Scholar] [CrossRef]
- Chiu, L.H.; Wu, C.H.; Chang, H. Galvanic corrosion on vacuum-brazed UNS S31803 duplex stainless steel using Ni-Cr-Fe-P alloy filler metals. Corrosion 2007, 63, 127–134. [Google Scholar] [CrossRef]
- Guillaumin, V.; Schmutz, P.; Frankel, G.S. Characterization of corrosion interfaces by the scanning kelvin probe force microscopy technique. Electrochem. Soc. 2001, 148, 163–173. [Google Scholar] [CrossRef]
- Schmutz, P.; Frankel, G.S. Corrosion study of AA2024-T3 by scanning kelvin probe force microscopy and in situ atomic force microscopy scratching. J. Electrochem. Soc. 1998, 145, 2295–2306. [Google Scholar] [CrossRef]
- Hurley, M.F.; Efaw, C.M.; Davis, P.H.; Croteau, J.R.; Graugnard, E.; Birbilis, N. Volta potentials measured by scanning kelvin probe force microscopy as relevant to corrosion of magnesium alloys. Corrosion 2015, 71, 160–170. [Google Scholar] [CrossRef]
- Yue, X.; He, P.; Feng, J.C.; Zhang, J.H.; Zhu, F.Q. Microstructure and interfacial reactions of vacuum brazing titanium alloy to stainless steel using an agcuti filler metal. MTL Mater. Charact. 2008, 59, 1721–1727. [Google Scholar] [CrossRef]
- Elrefaey, A.; Tillmann, W. Effect of brazing parameters on microstructure and mechanical properties of titanium joints. J. Mater. Process. Technol. 2009, 209, 4842–4849. [Google Scholar] [CrossRef]
- Jones, D. Principles and Prevention of Corrosion, 2nd ed.; Prentice Hall: Upper Saddle River, NJ, USA, 1996. [Google Scholar]
- Schmutz, P.; Frankel, G.S. Characterization of AA2024-T3 by scanning kelvin probe force microscopy. J. Electrochem. Soc. 1998, 145, 2285–2295. [Google Scholar] [CrossRef]
- Schmutz, P.; Frankel, G.S. Influence of dichromate ions on corrosion of pure aluminum and AA2024-T3 in NaCl solution studied by AFM scratching. J. Electrochem. Soc. 1999, 146, 4461–4472. [Google Scholar] [CrossRef]
- Chiu, L.H.; Hsieh, W.C.; Ling, Y.C. Effect of vacuum brazing on corrosion resistance of UNS S31803 and UNS S31200 duplex stainless steels. Corrosion 2002, 58, 797–803. [Google Scholar] [CrossRef]
- Forman, C.M.; Verchot, E.A. Practical Galvanic Series; Report No. RS-TR-67-11; Army Missile Command: Redstone Arsenal, AL, USA, 1967. [Google Scholar]
- Leblanc, P.; Frankel, G.S. A study of corrosion and pitting initiation of AA2024-T3 using atomic force microscopy. J. Electrochem. Soc. 2002, 149, B239–B247. [Google Scholar] [CrossRef]
- Jia, J.X.; Atrens, A.; Song, G.; Muster, T.H. Simulation of galvanic corrosion of magnesium coupled to a steel fastener in NaCl solution. Mater. Corros. 2005, 56, 468–474. [Google Scholar] [CrossRef]
- De Wit, J.H.W. Local potential measurements with the SKPFM on aluminium alloys. Electrochim. Acta 2004, 49, 2841–2850. [Google Scholar] [CrossRef]
- Campestrini, P.; van Westing, E.P.M.; van Rooijen, H.W.; de Wit, J.H.W. Relation between microstructural aspects of AA2024 and its corrosion behaviour investigated using AFM scanning potential technique. Corros. Sci. 2000, 42, 1853–1861. [Google Scholar] [CrossRef]
- Lacroix, L.; Ressier, L.; Blanc, C.; Mankowski, G. Combination of AFM, SKPFM, and SIMS to study the corrosion behavior of S-phase particles in AA2024-T351. J. Electrochem. Soc. 2008, 155, C131–C137. [Google Scholar] [CrossRef]
- Femenia, M.; Canalias, C.; Pan, J.; Leygraf, C. Scanning kelvin probe force microscopy and magnetic force microscopy for characterization of duplex stainless steels. J. Electrochem. Soc. 2003, 150, B274–B281. [Google Scholar] [CrossRef]
- Sathirachinda, N.; Pettersson, R.; Pan, J.S. Depletion effects at phase boundaries in 2205 duplex stainless steel characterized with SKPFM and TEM/EDS. Corros. Sci. 2009, 51, 1850–1860. [Google Scholar] [CrossRef]
- Sathirachinda, N.; Pettersson, R.; Wessman, S.; Kivisakk, U.; Pan, J.S. Scanning kelvin probe force microscopy study of chromium nitrides in 2507 super duplex stainless steel-implications and limitations. Electrochim. Acta 2011, 56, 1792–1798. [Google Scholar] [CrossRef]
- Mato, S.; Alcala, G.; Woodcock, T.G.; Gebert, A.; Eckert, J.; Schultz, L. Corrosion behaviour of a Ti-base nanostructure-dendrite composite. Electrochim. Acta 2005, 50, 2461–2467. [Google Scholar] [CrossRef]
- Afshar, F.N.; de Wit, J.H.W.; Terryn, H.; Mol, J.M.C. Scanning kelvin probe force microscopy as a means of predicting the electrochemical characteristics of the surface of a modified AA4XXX/AA3XXX (Al alloys) brazing sheet. Electrochim. Acta 2013, 88, 330–339. [Google Scholar] [CrossRef]


| Material | Ag | Cu | Ti | In |
|---|---|---|---|---|
| Cu-Ag-Ti | 63.1 | 35.1 | 1.8 | – |
| Cu-Ag-In-Ti | 59.00 | 27.25 | 1.25 | 12.5 |
| Material | C | P | Ni | Cr | Mn | Mo | N | Si | S | Fe |
|---|---|---|---|---|---|---|---|---|---|---|
| 316L | 0.0002 | 0.00036 | 0.101 | 0.1663 | 0.0168 | 0.0203 | 0.00066 | 0.00485 | 0.00026 | Balance |
| Microgalvanic Couple (Cathode–Anode) | ΔVPD (±30 mV) |
|---|---|
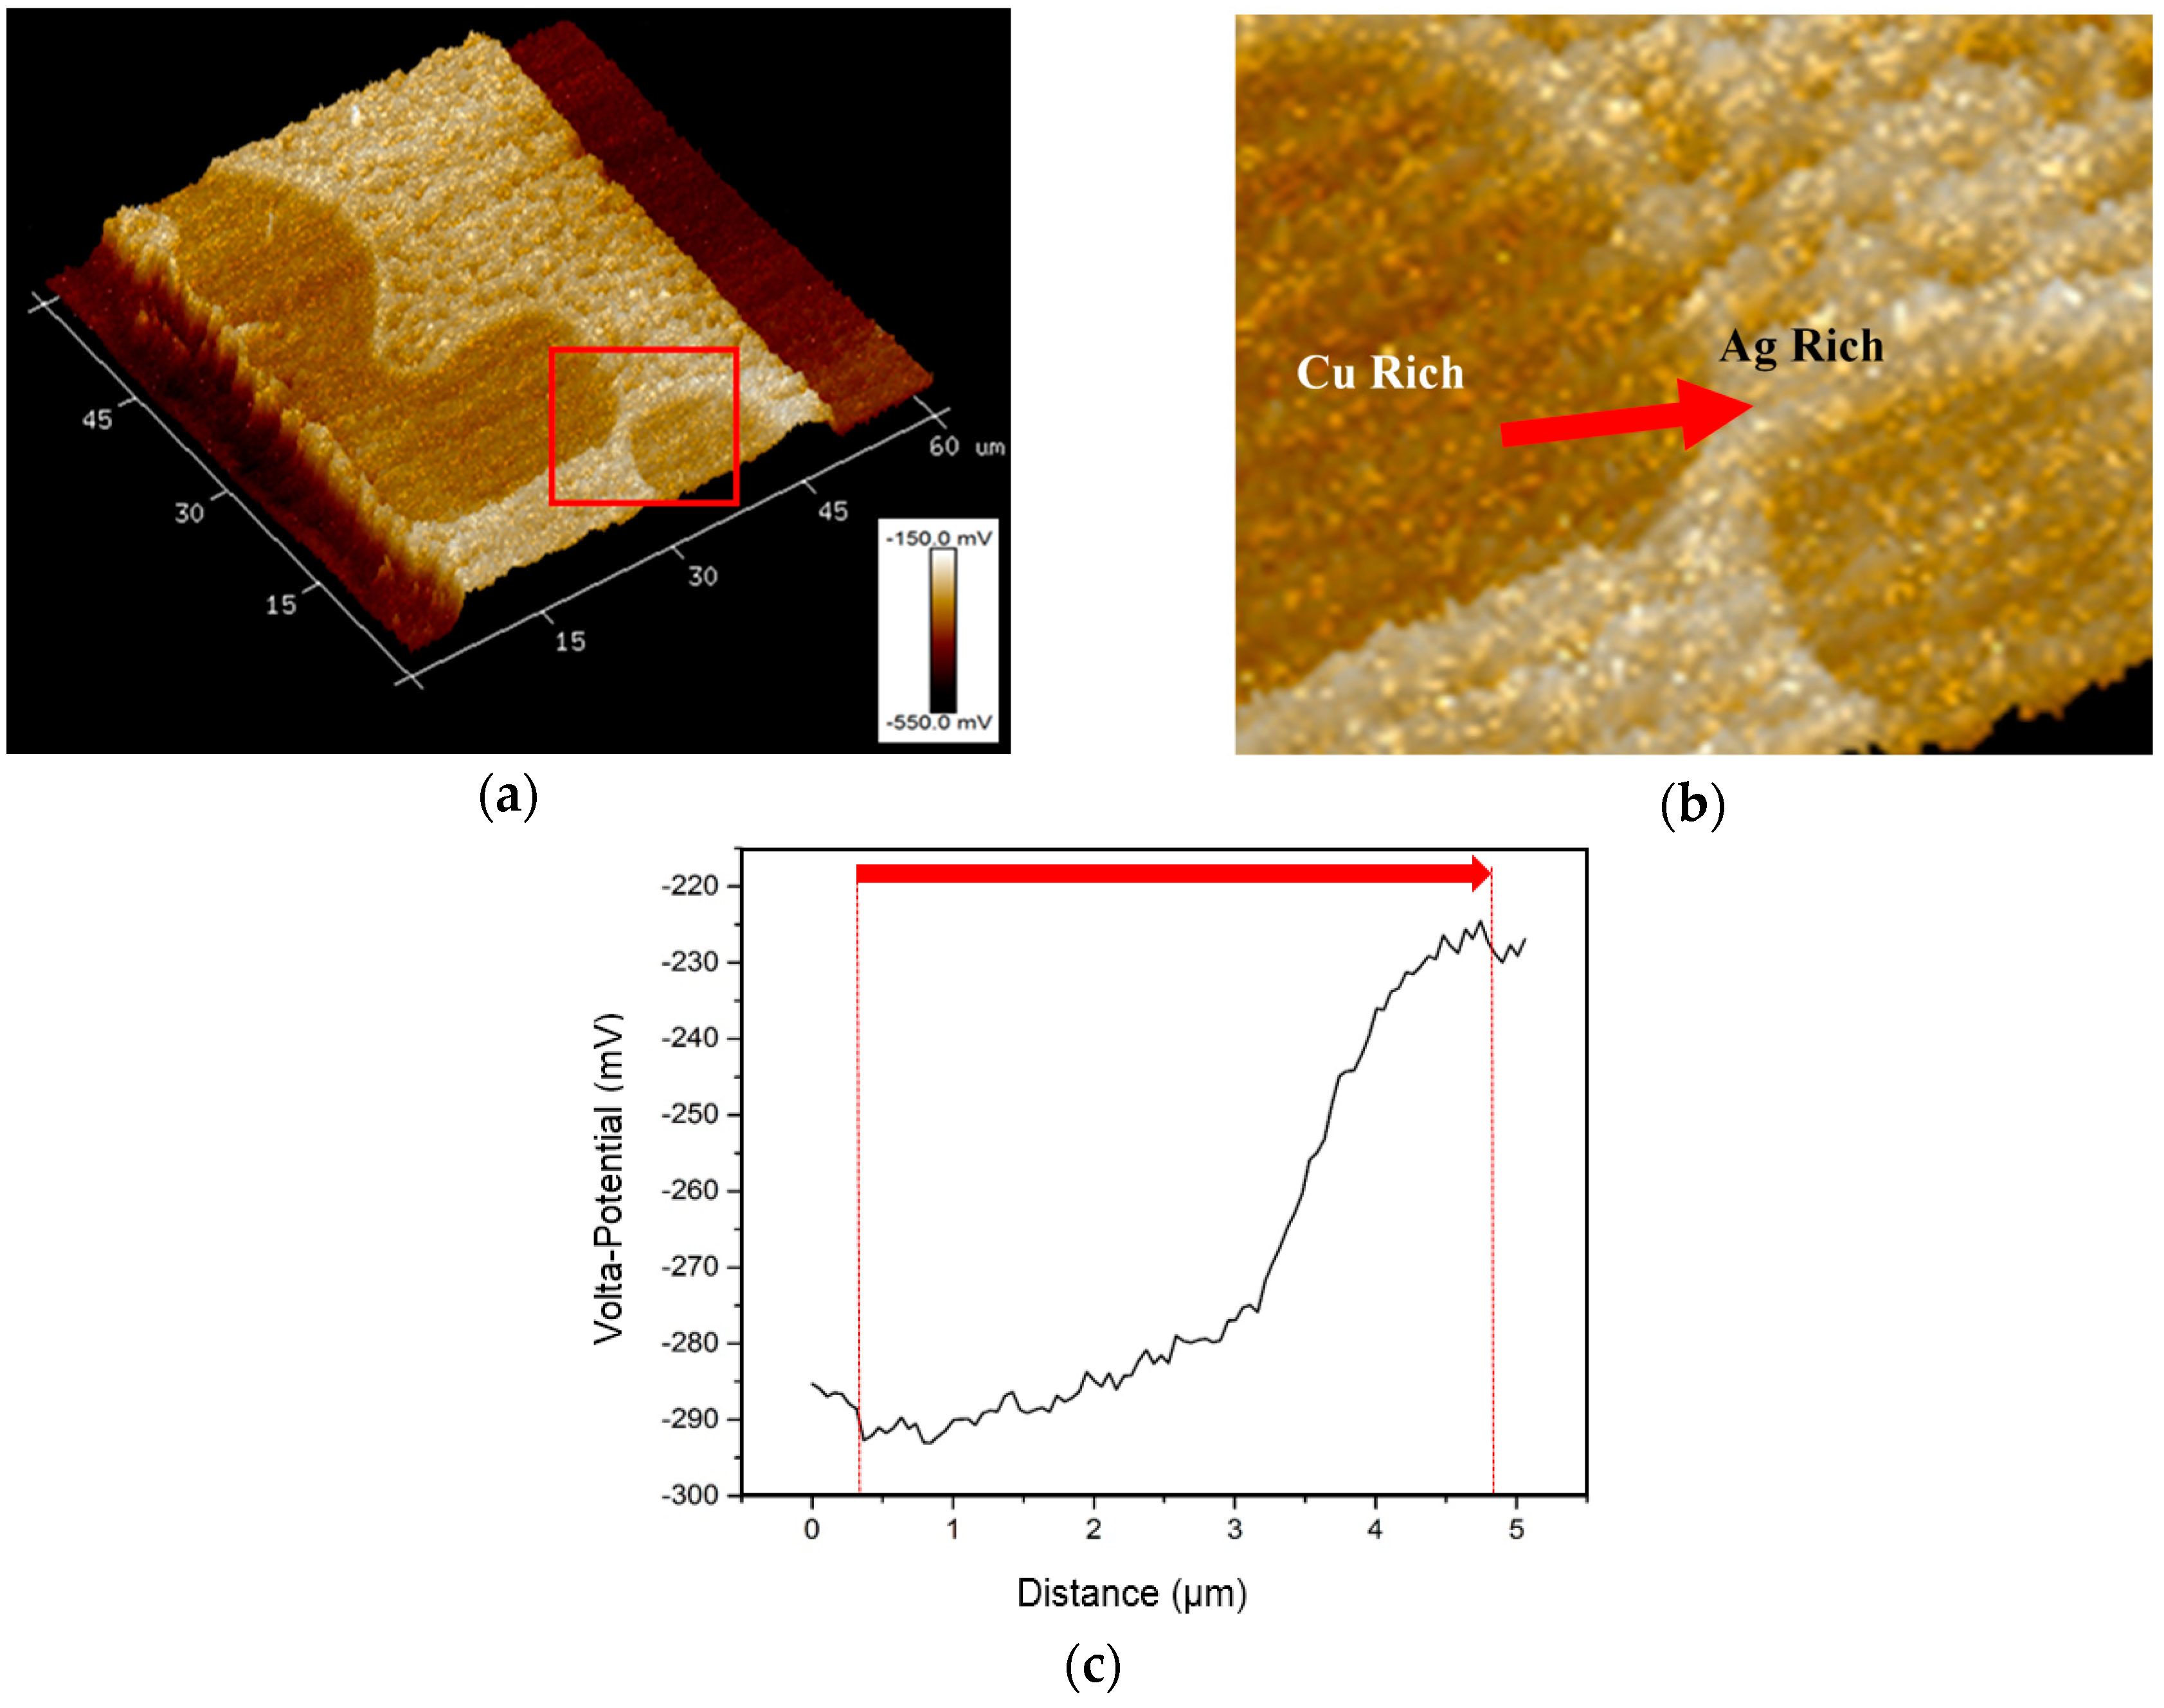
| Ag Rich–Cu Rich | 59 |
| Cu Rich–Stainless steel | 94 |
| Microgalvanic Couple (Cathode–Anode) | ΔVPD (±30 mV) |
|---|---|
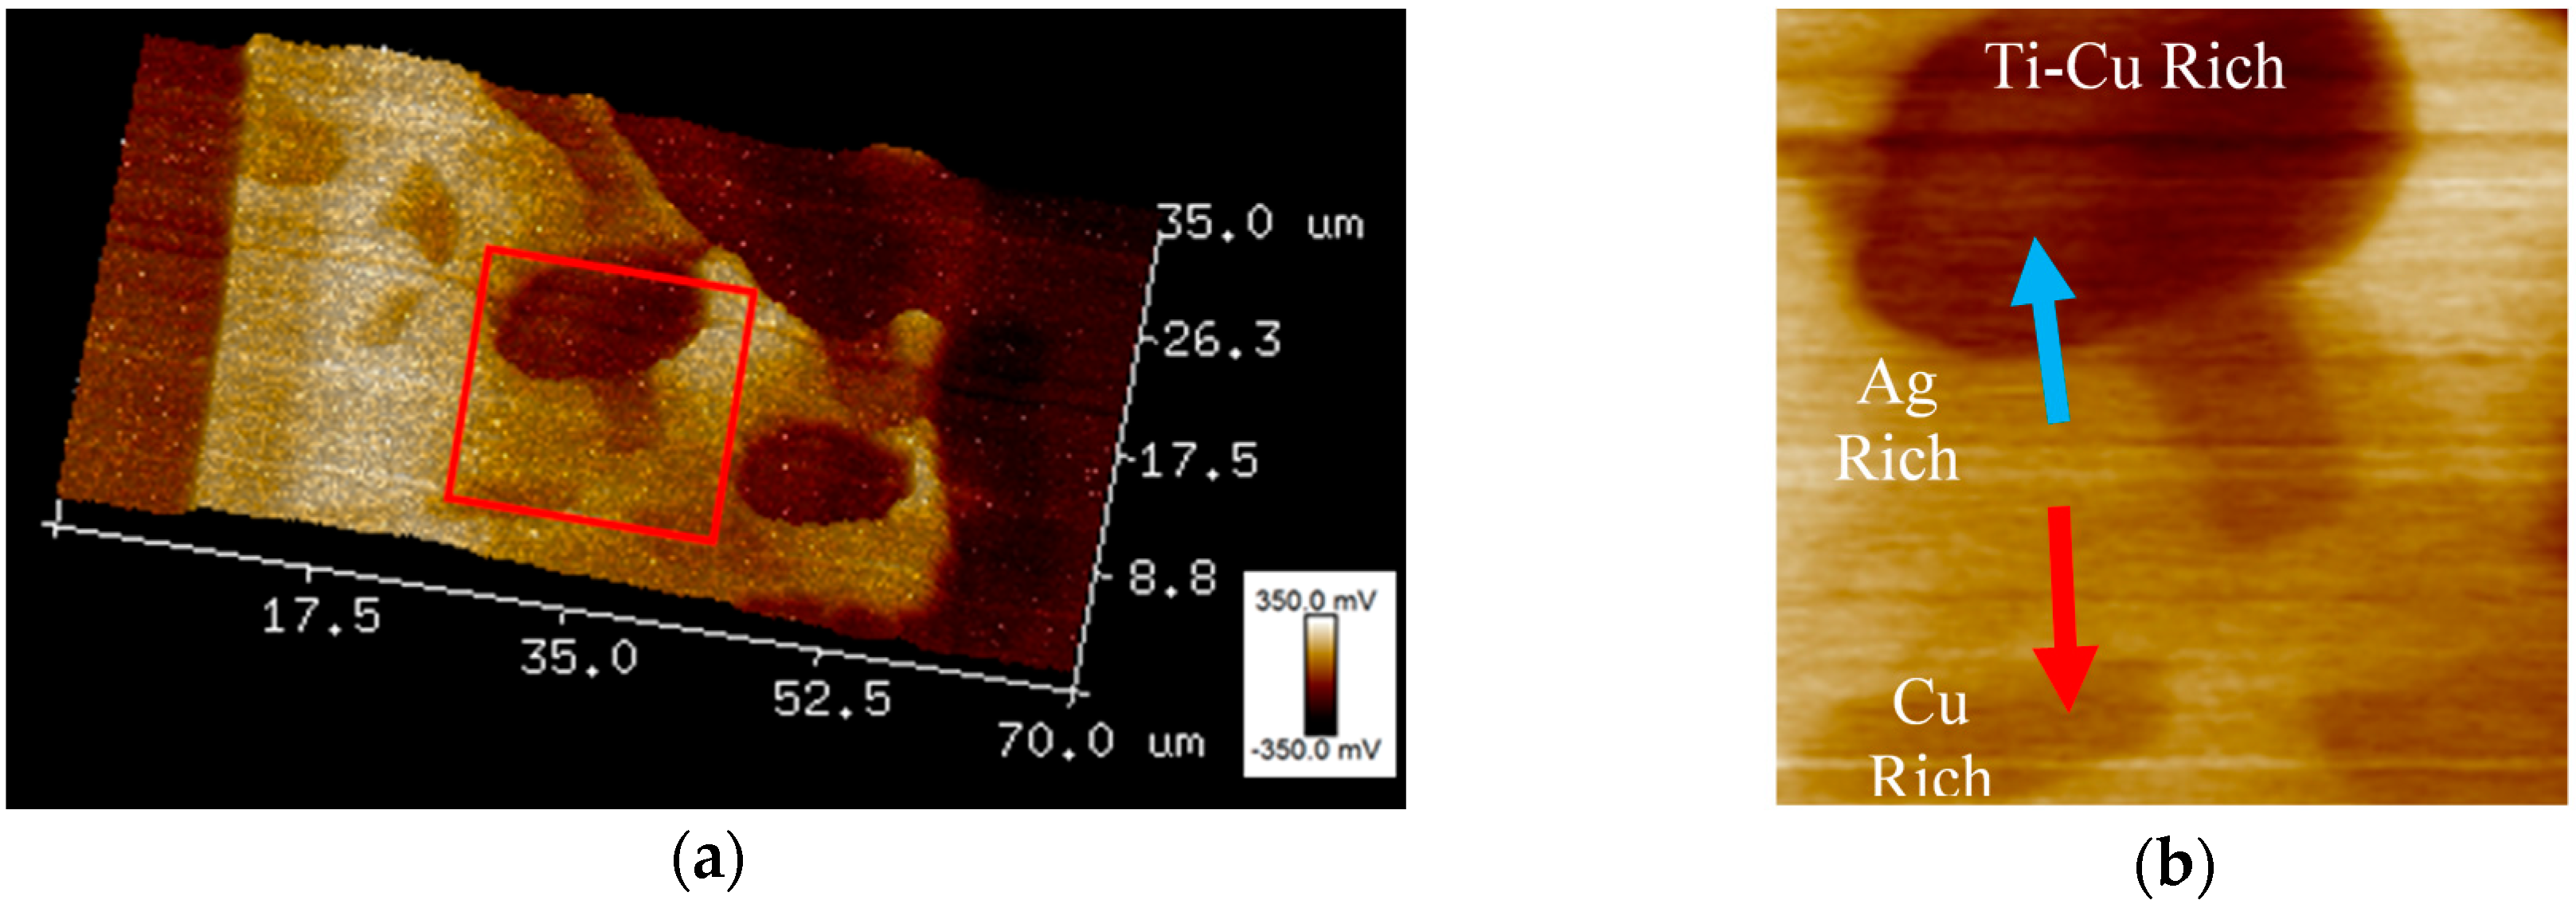
| Ag Rich–Cu Rich | 52 |
| Cu Rich–(Ti-Cu) Rich | 97 |
| (Ti-Cu) Rich–Stainless Steel | 53 |
© 2016 by the authors; licensee MDPI, Basel, Switzerland. This article is an open access article distributed under the terms and conditions of the Creative Commons Attribution (CC-BY) license (http://creativecommons.org/licenses/by/4.0/).
Share and Cite
Kvryan, A.; Livingston, K.; Efaw, C.M.; Knori, K.; Jaques, B.J.; Davis, P.H.; Butt, D.P.; Hurley, M.F. Microgalvanic Corrosion Behavior of Cu-Ag Active Braze Alloys Investigated with SKPFM. Metals 2016, 6, 91. https://doi.org/10.3390/met6040091
Kvryan A, Livingston K, Efaw CM, Knori K, Jaques BJ, Davis PH, Butt DP, Hurley MF. Microgalvanic Corrosion Behavior of Cu-Ag Active Braze Alloys Investigated with SKPFM. Metals. 2016; 6(4):91. https://doi.org/10.3390/met6040091
Chicago/Turabian StyleKvryan, Armen, Kari Livingston, Corey M. Efaw, Kyle Knori, Brian J. Jaques, Paul H. Davis, Darryl P. Butt, and Michael F. Hurley. 2016. "Microgalvanic Corrosion Behavior of Cu-Ag Active Braze Alloys Investigated with SKPFM" Metals 6, no. 4: 91. https://doi.org/10.3390/met6040091
APA StyleKvryan, A., Livingston, K., Efaw, C. M., Knori, K., Jaques, B. J., Davis, P. H., Butt, D. P., & Hurley, M. F. (2016). Microgalvanic Corrosion Behavior of Cu-Ag Active Braze Alloys Investigated with SKPFM. Metals, 6(4), 91. https://doi.org/10.3390/met6040091