
Mechanical and Structural Investigation of Porous Bulk Metallic Glasses

Abstract
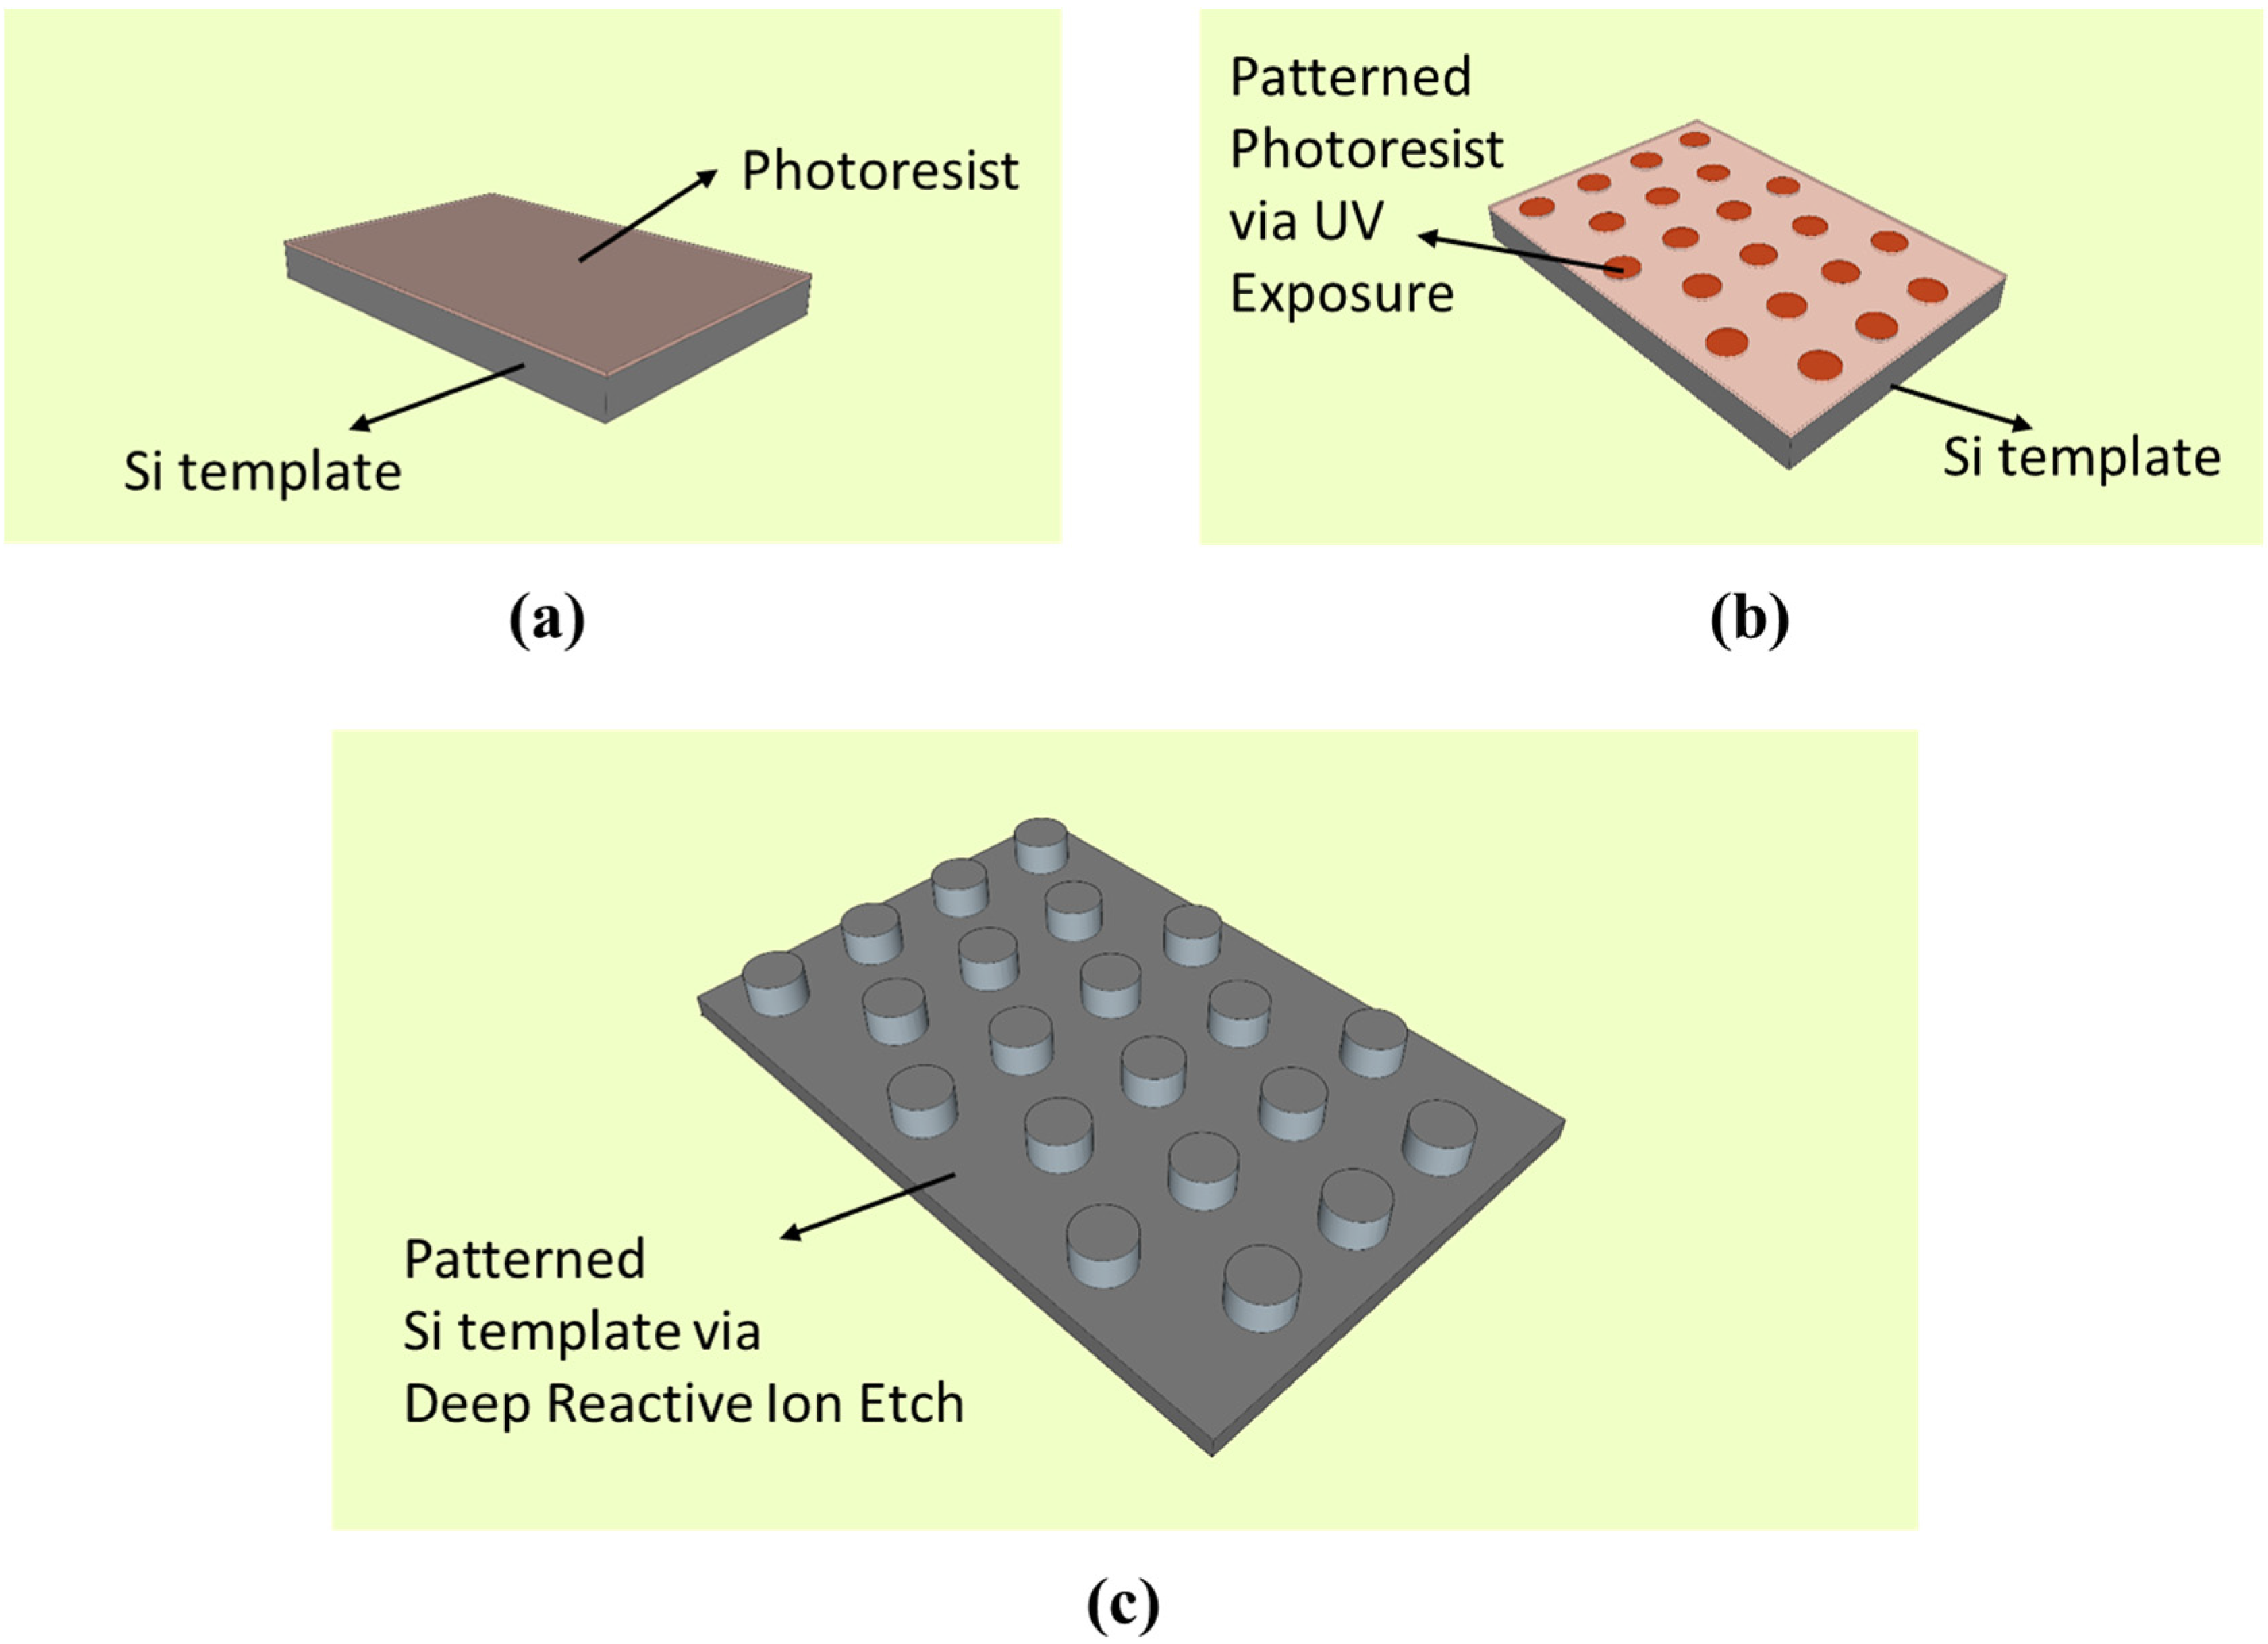
:1. Introduction
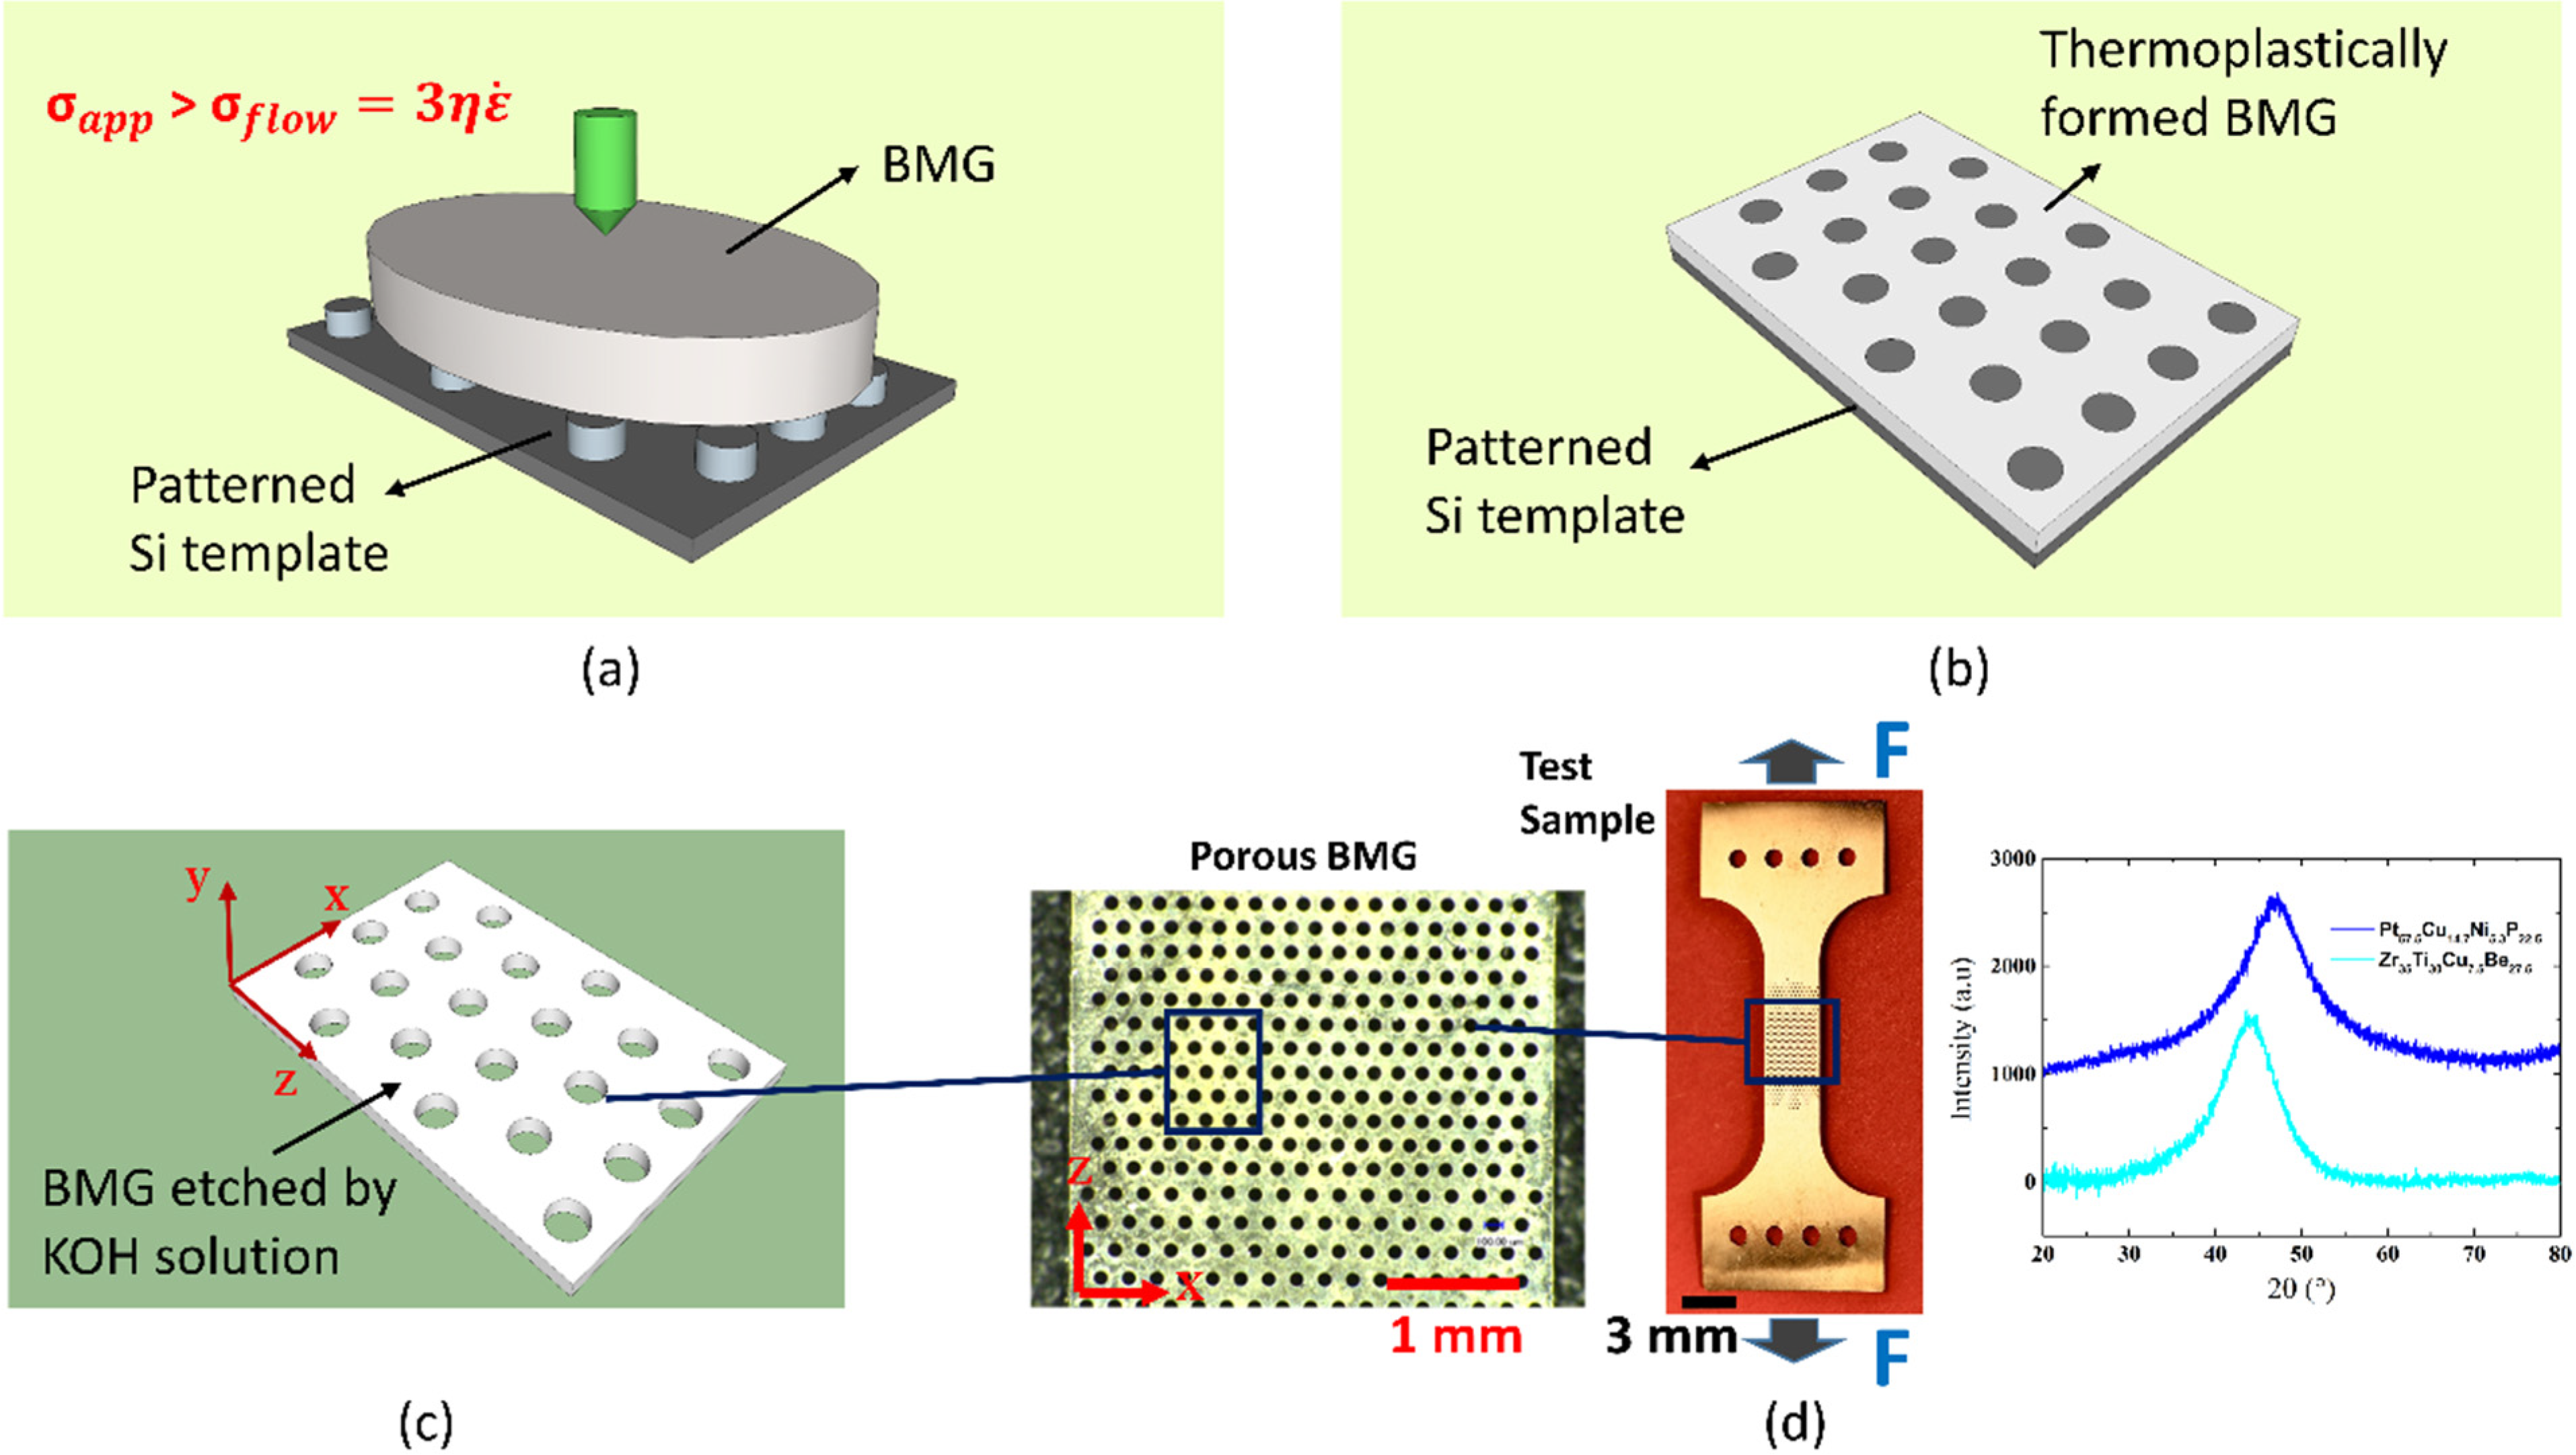
2. Materials and Methods
3. Results and Discussion
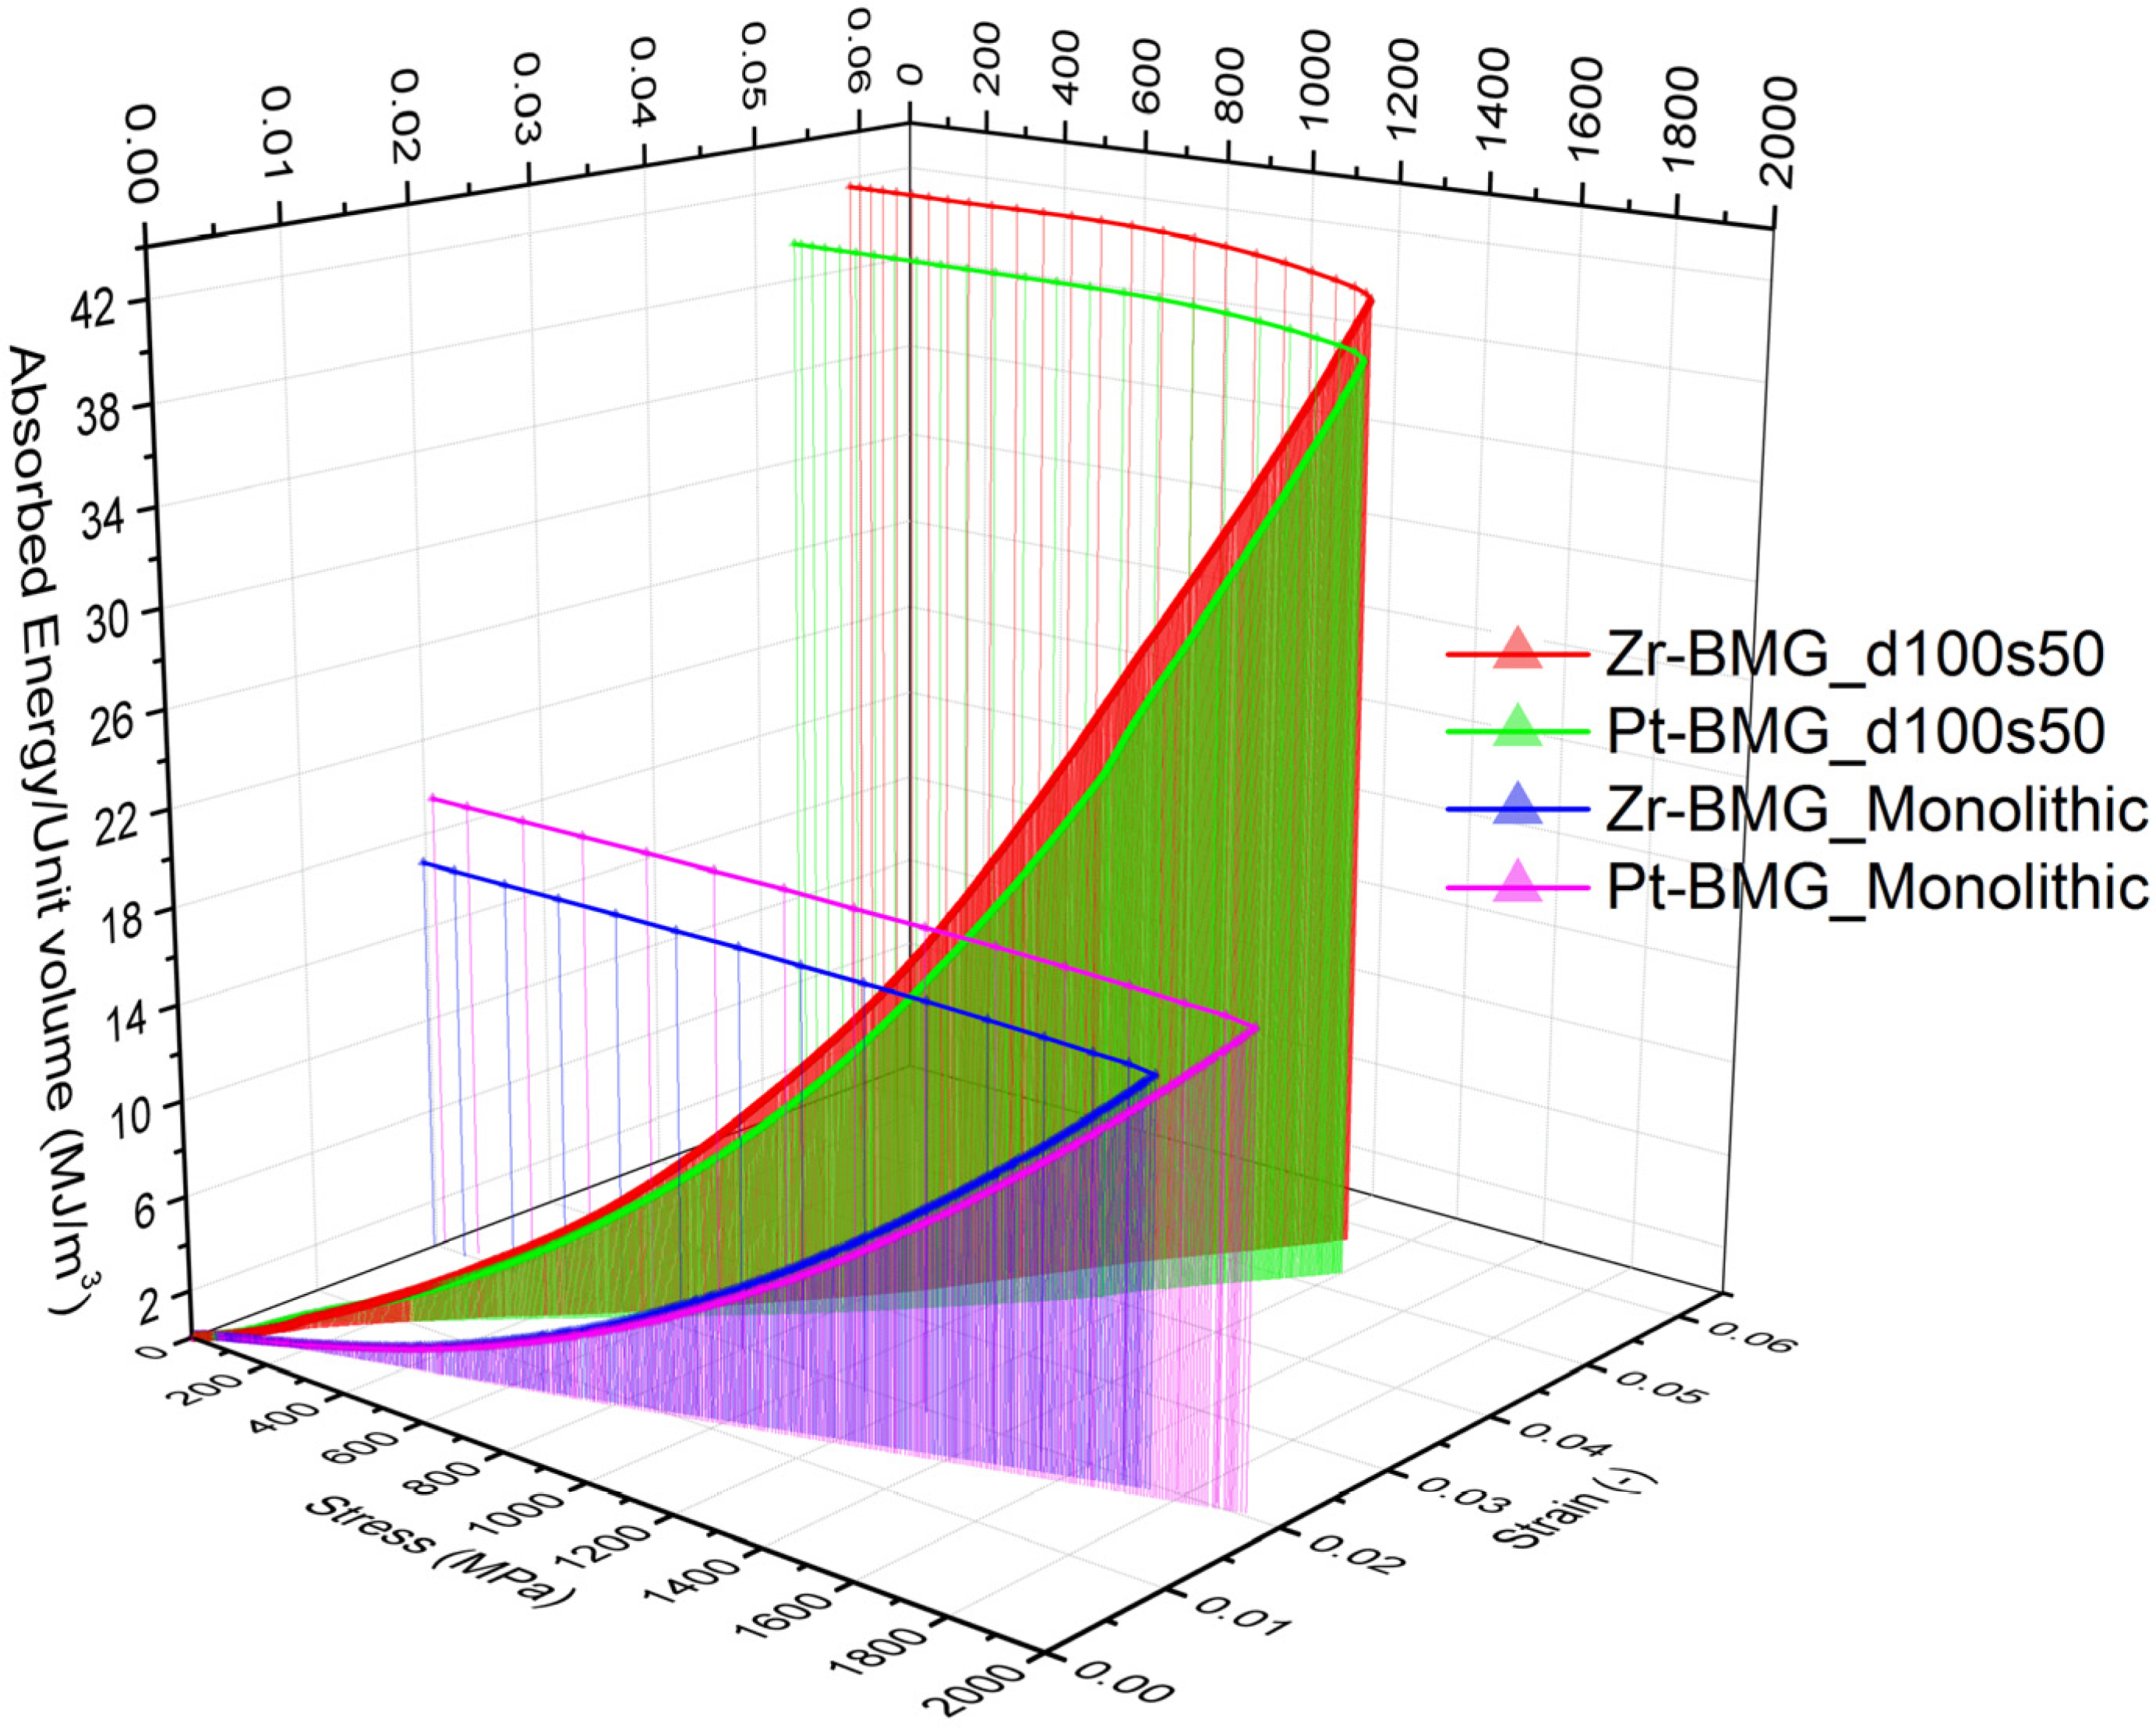
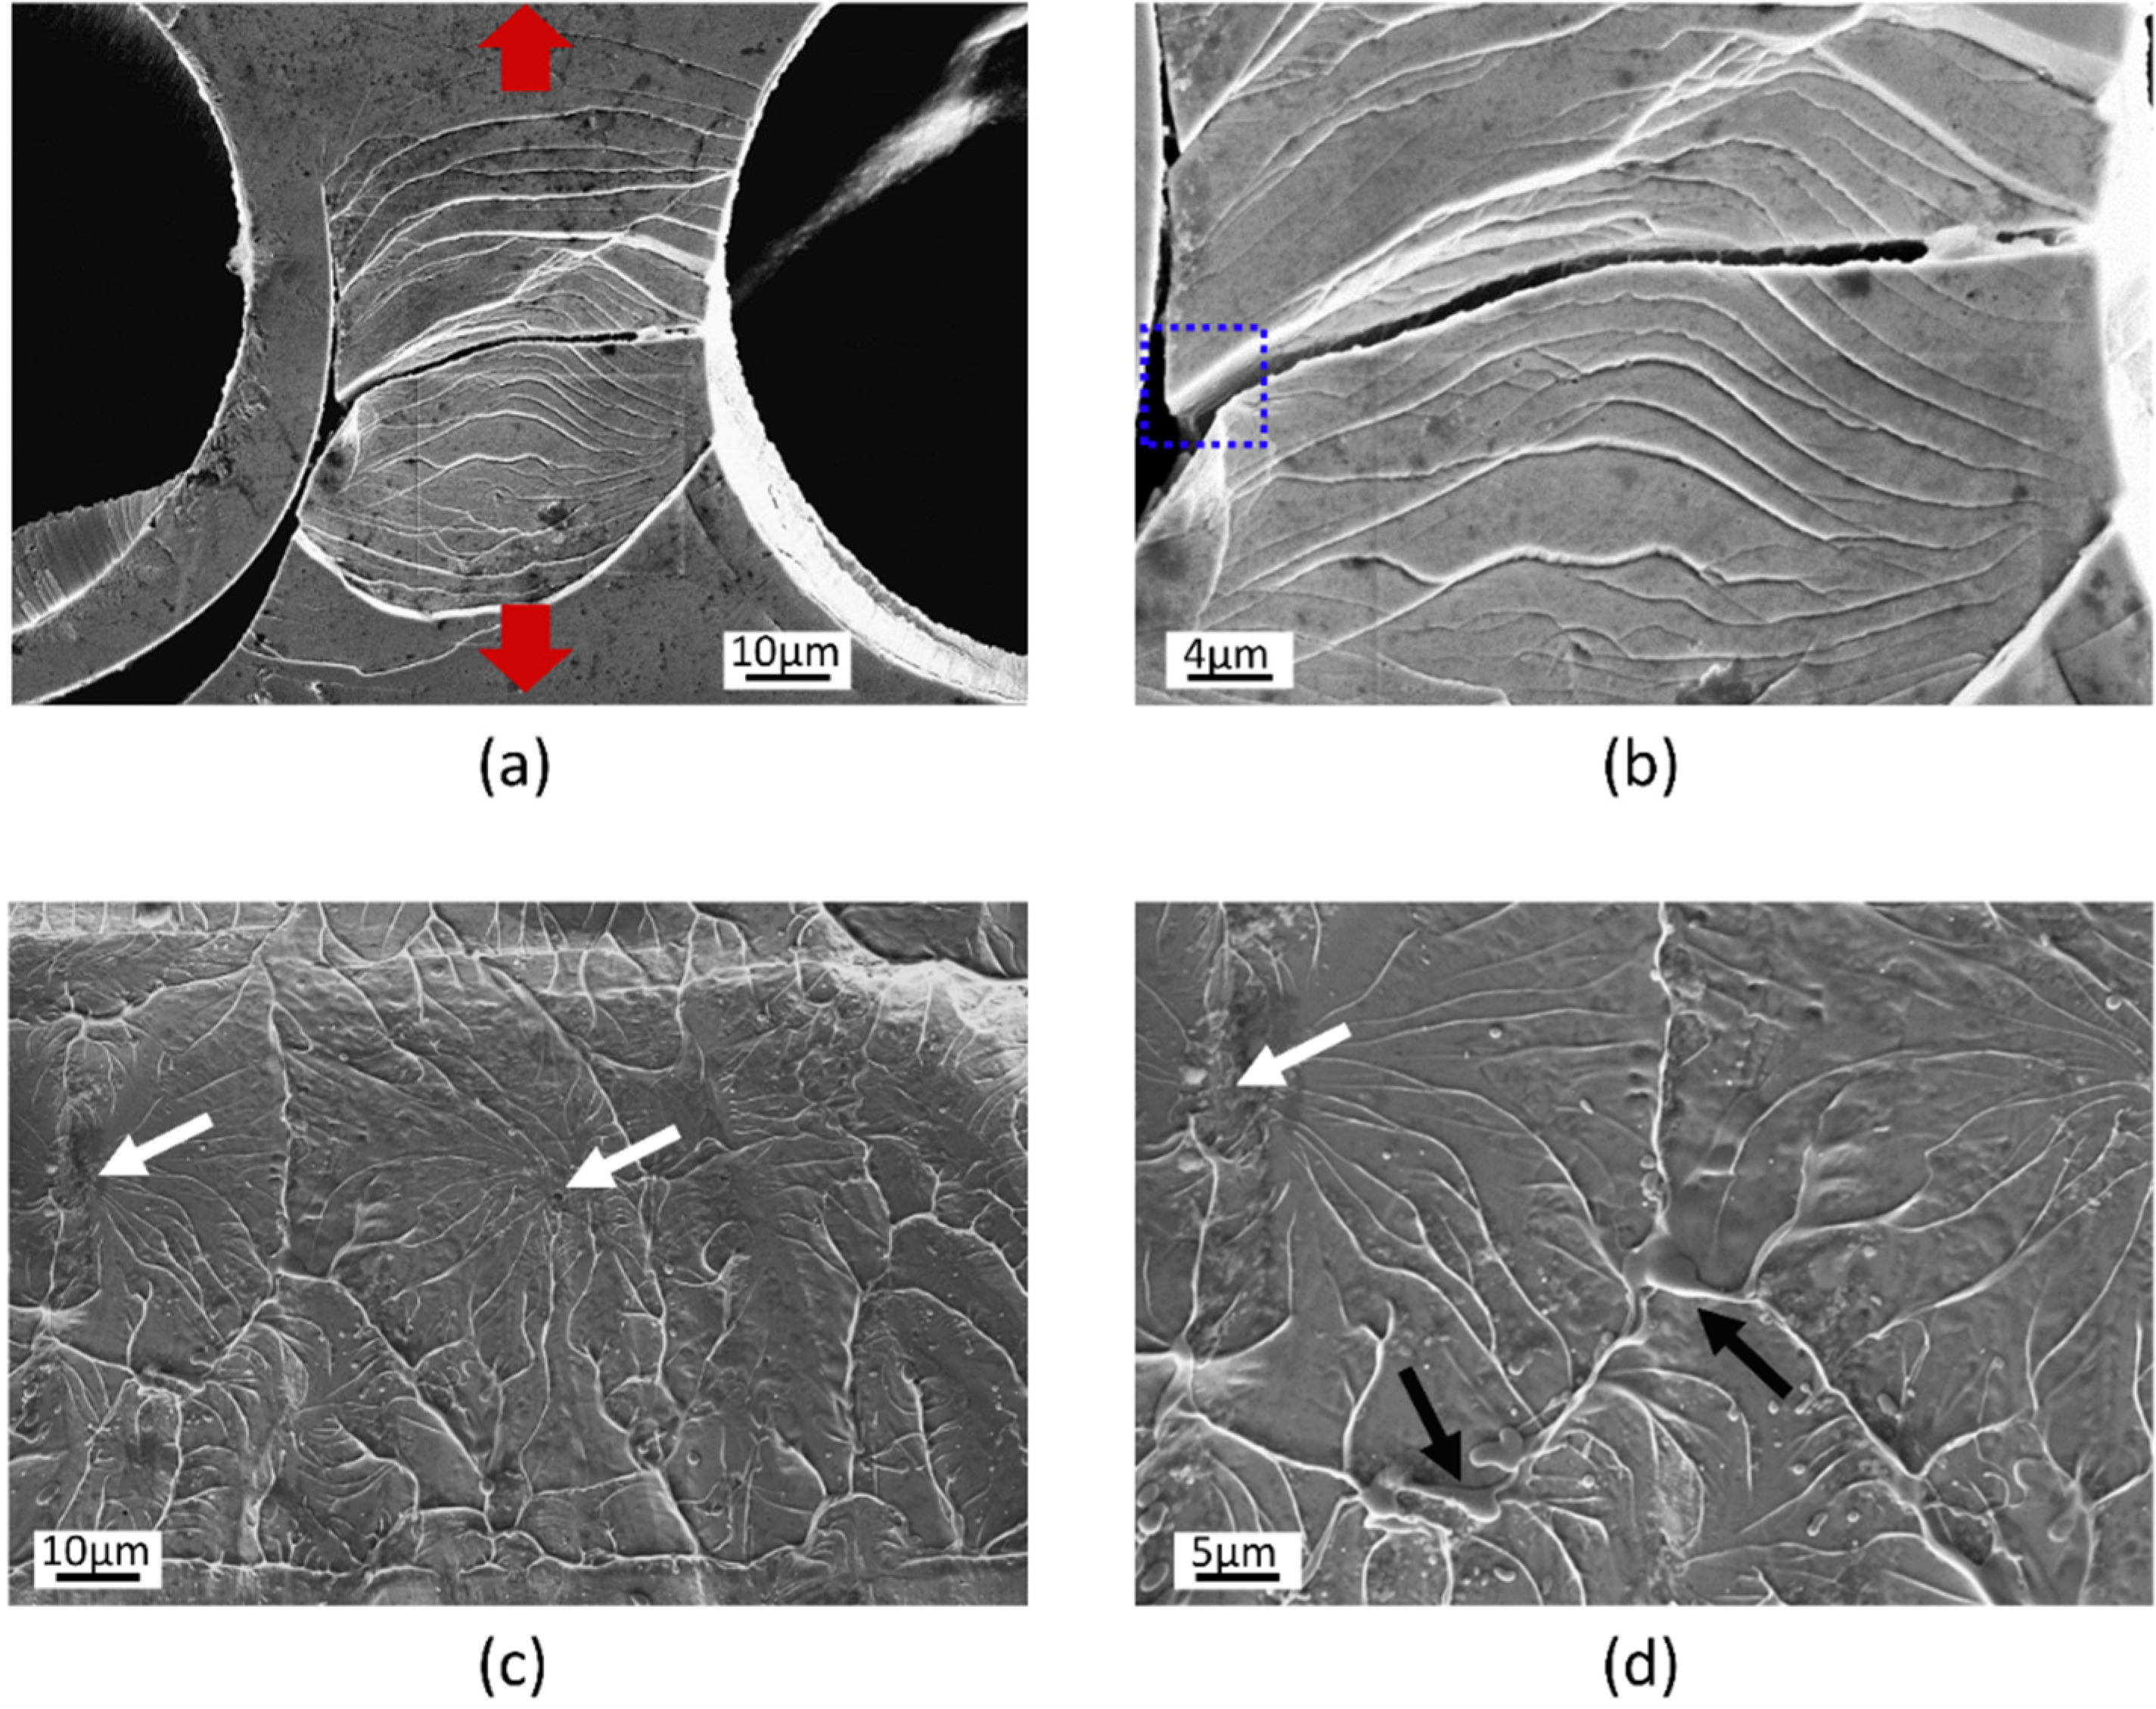
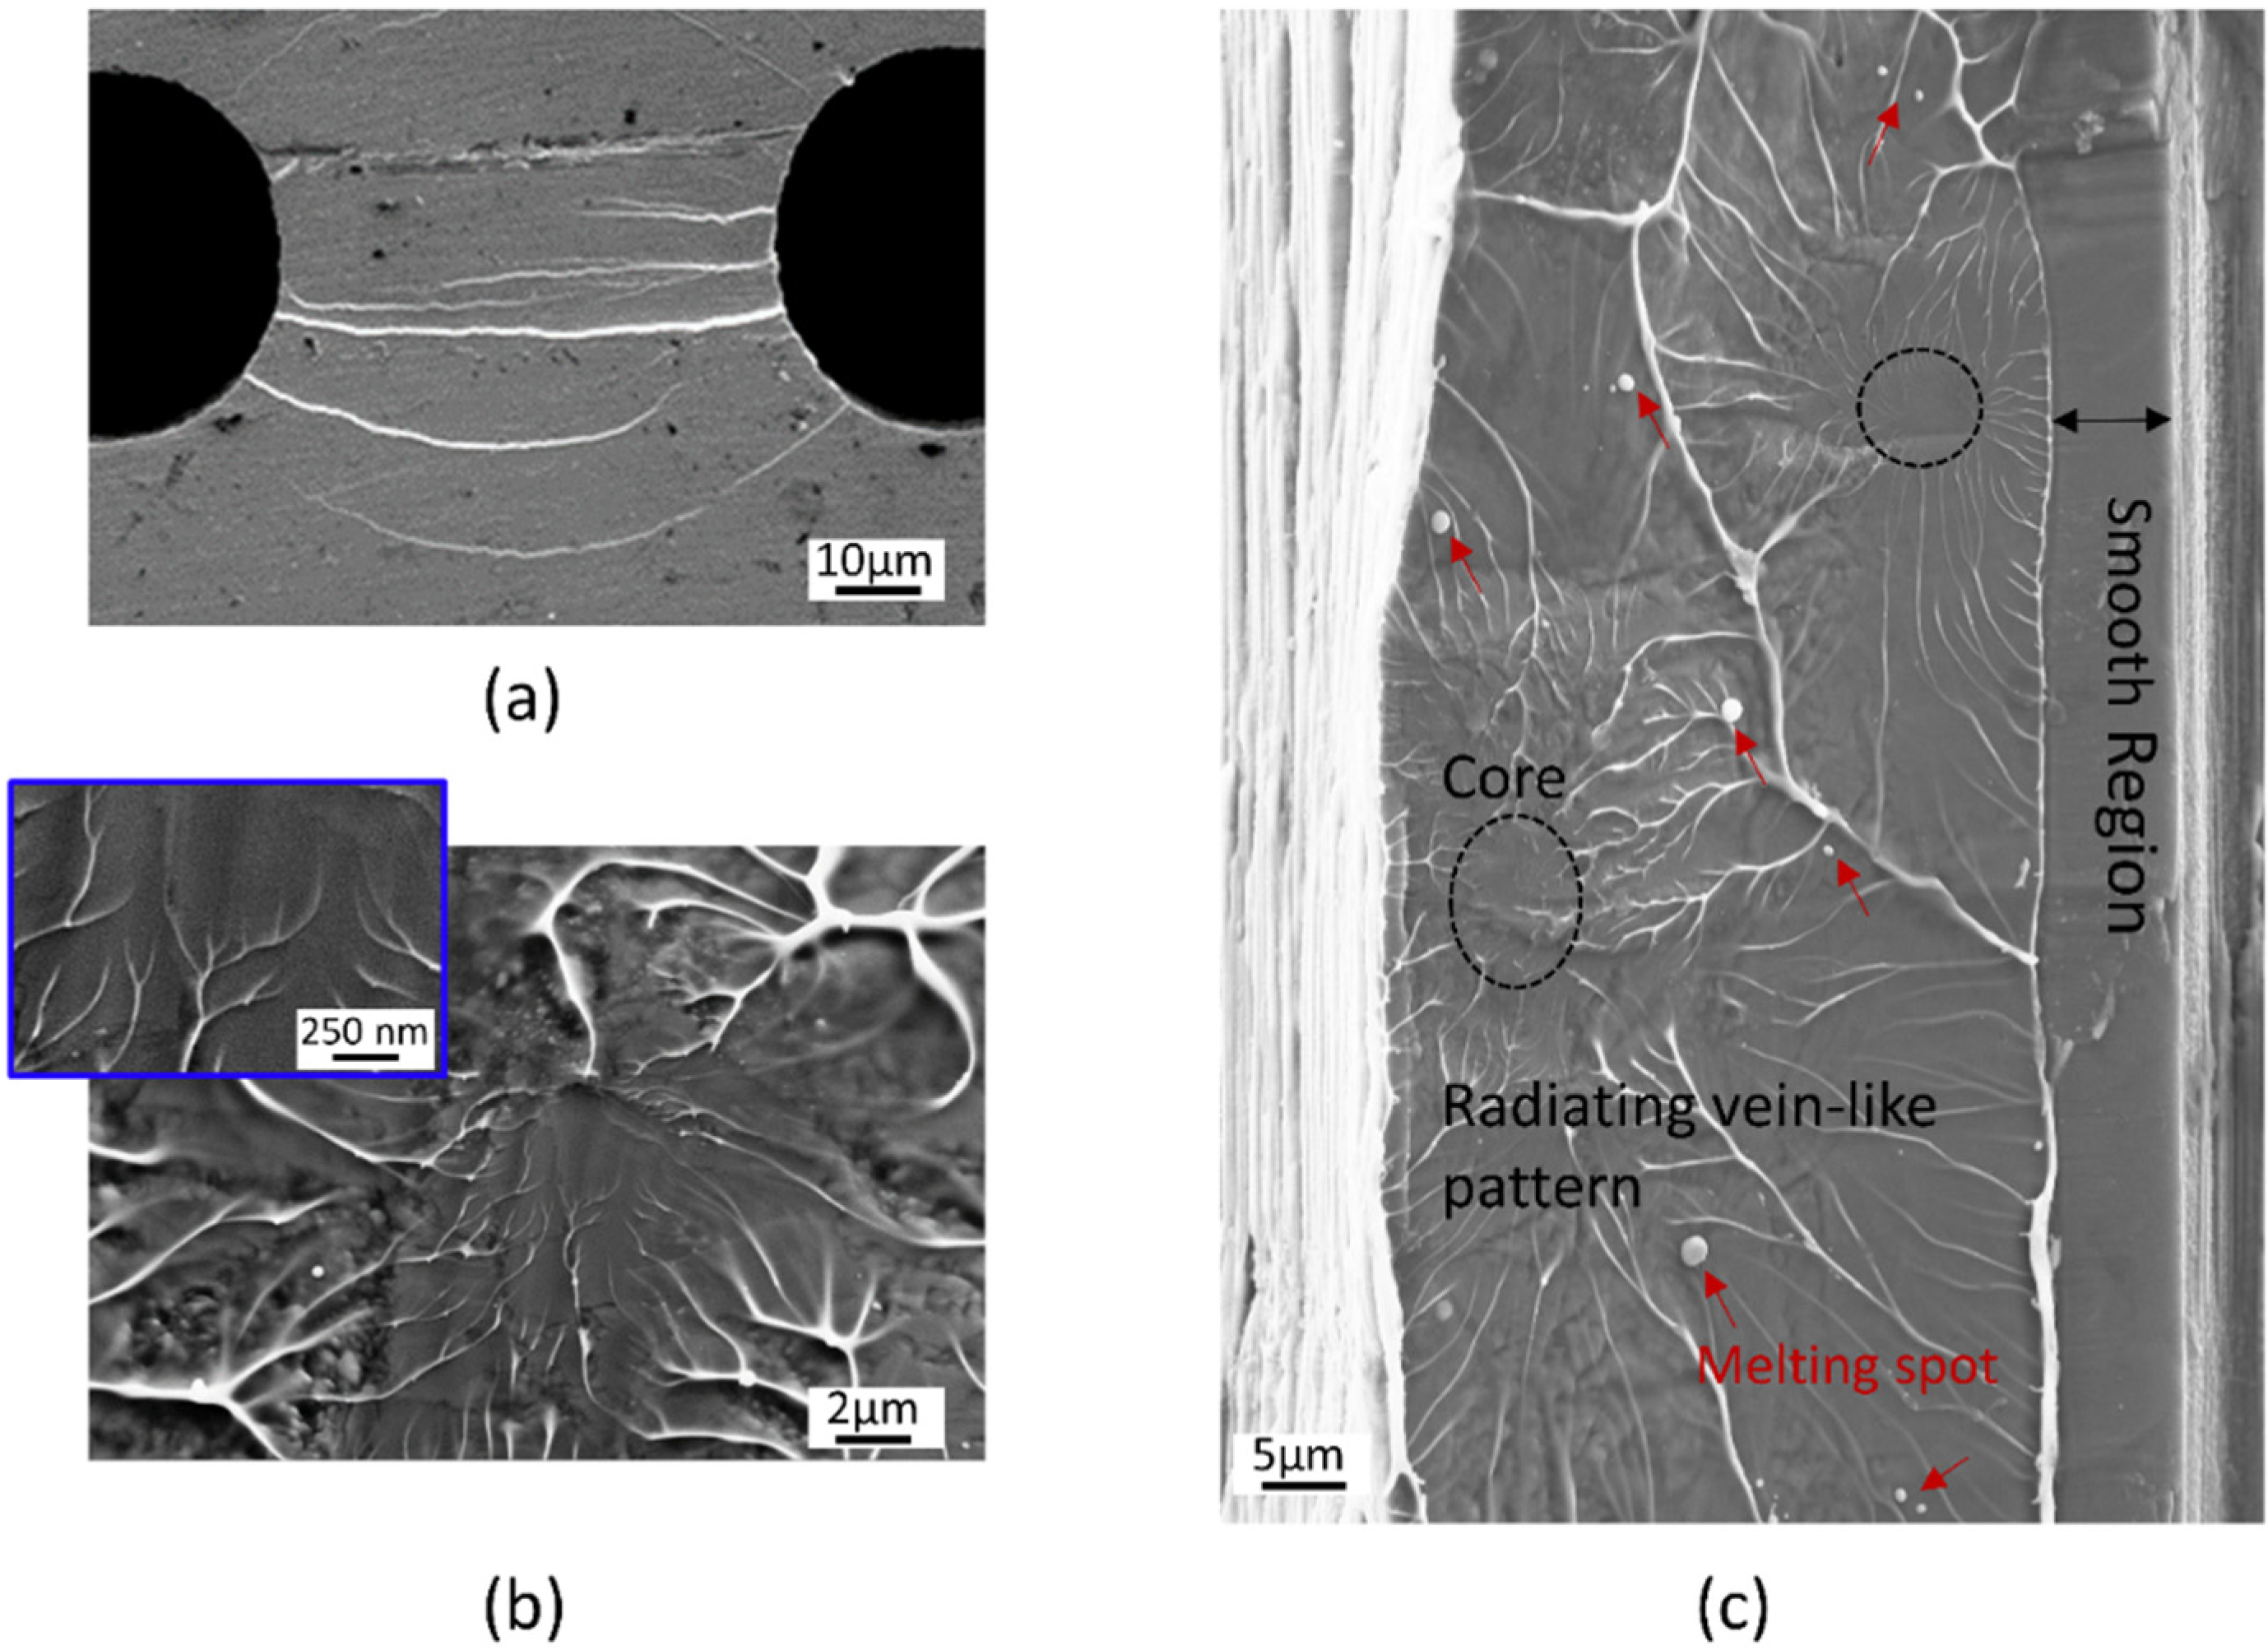
3.1. Influence of Pore Design

| Sample Name | σy (MPa) | εy (-) | E (GPa) | W (MJ/m3) |
|---|---|---|---|---|
| Zr-BMG bulk | 1741 | 0.019 | 87 | 16.8 |
| Pt-BMG bulk | 1924 | 0.020 | 95 | 19.4 |
| Zr-BMG d100s50 | 1305 | 0.058 | 23 | 41.6 |
| Pt-BMG d100s50 | 1399 | 0.053 | 28 | 39.6 |

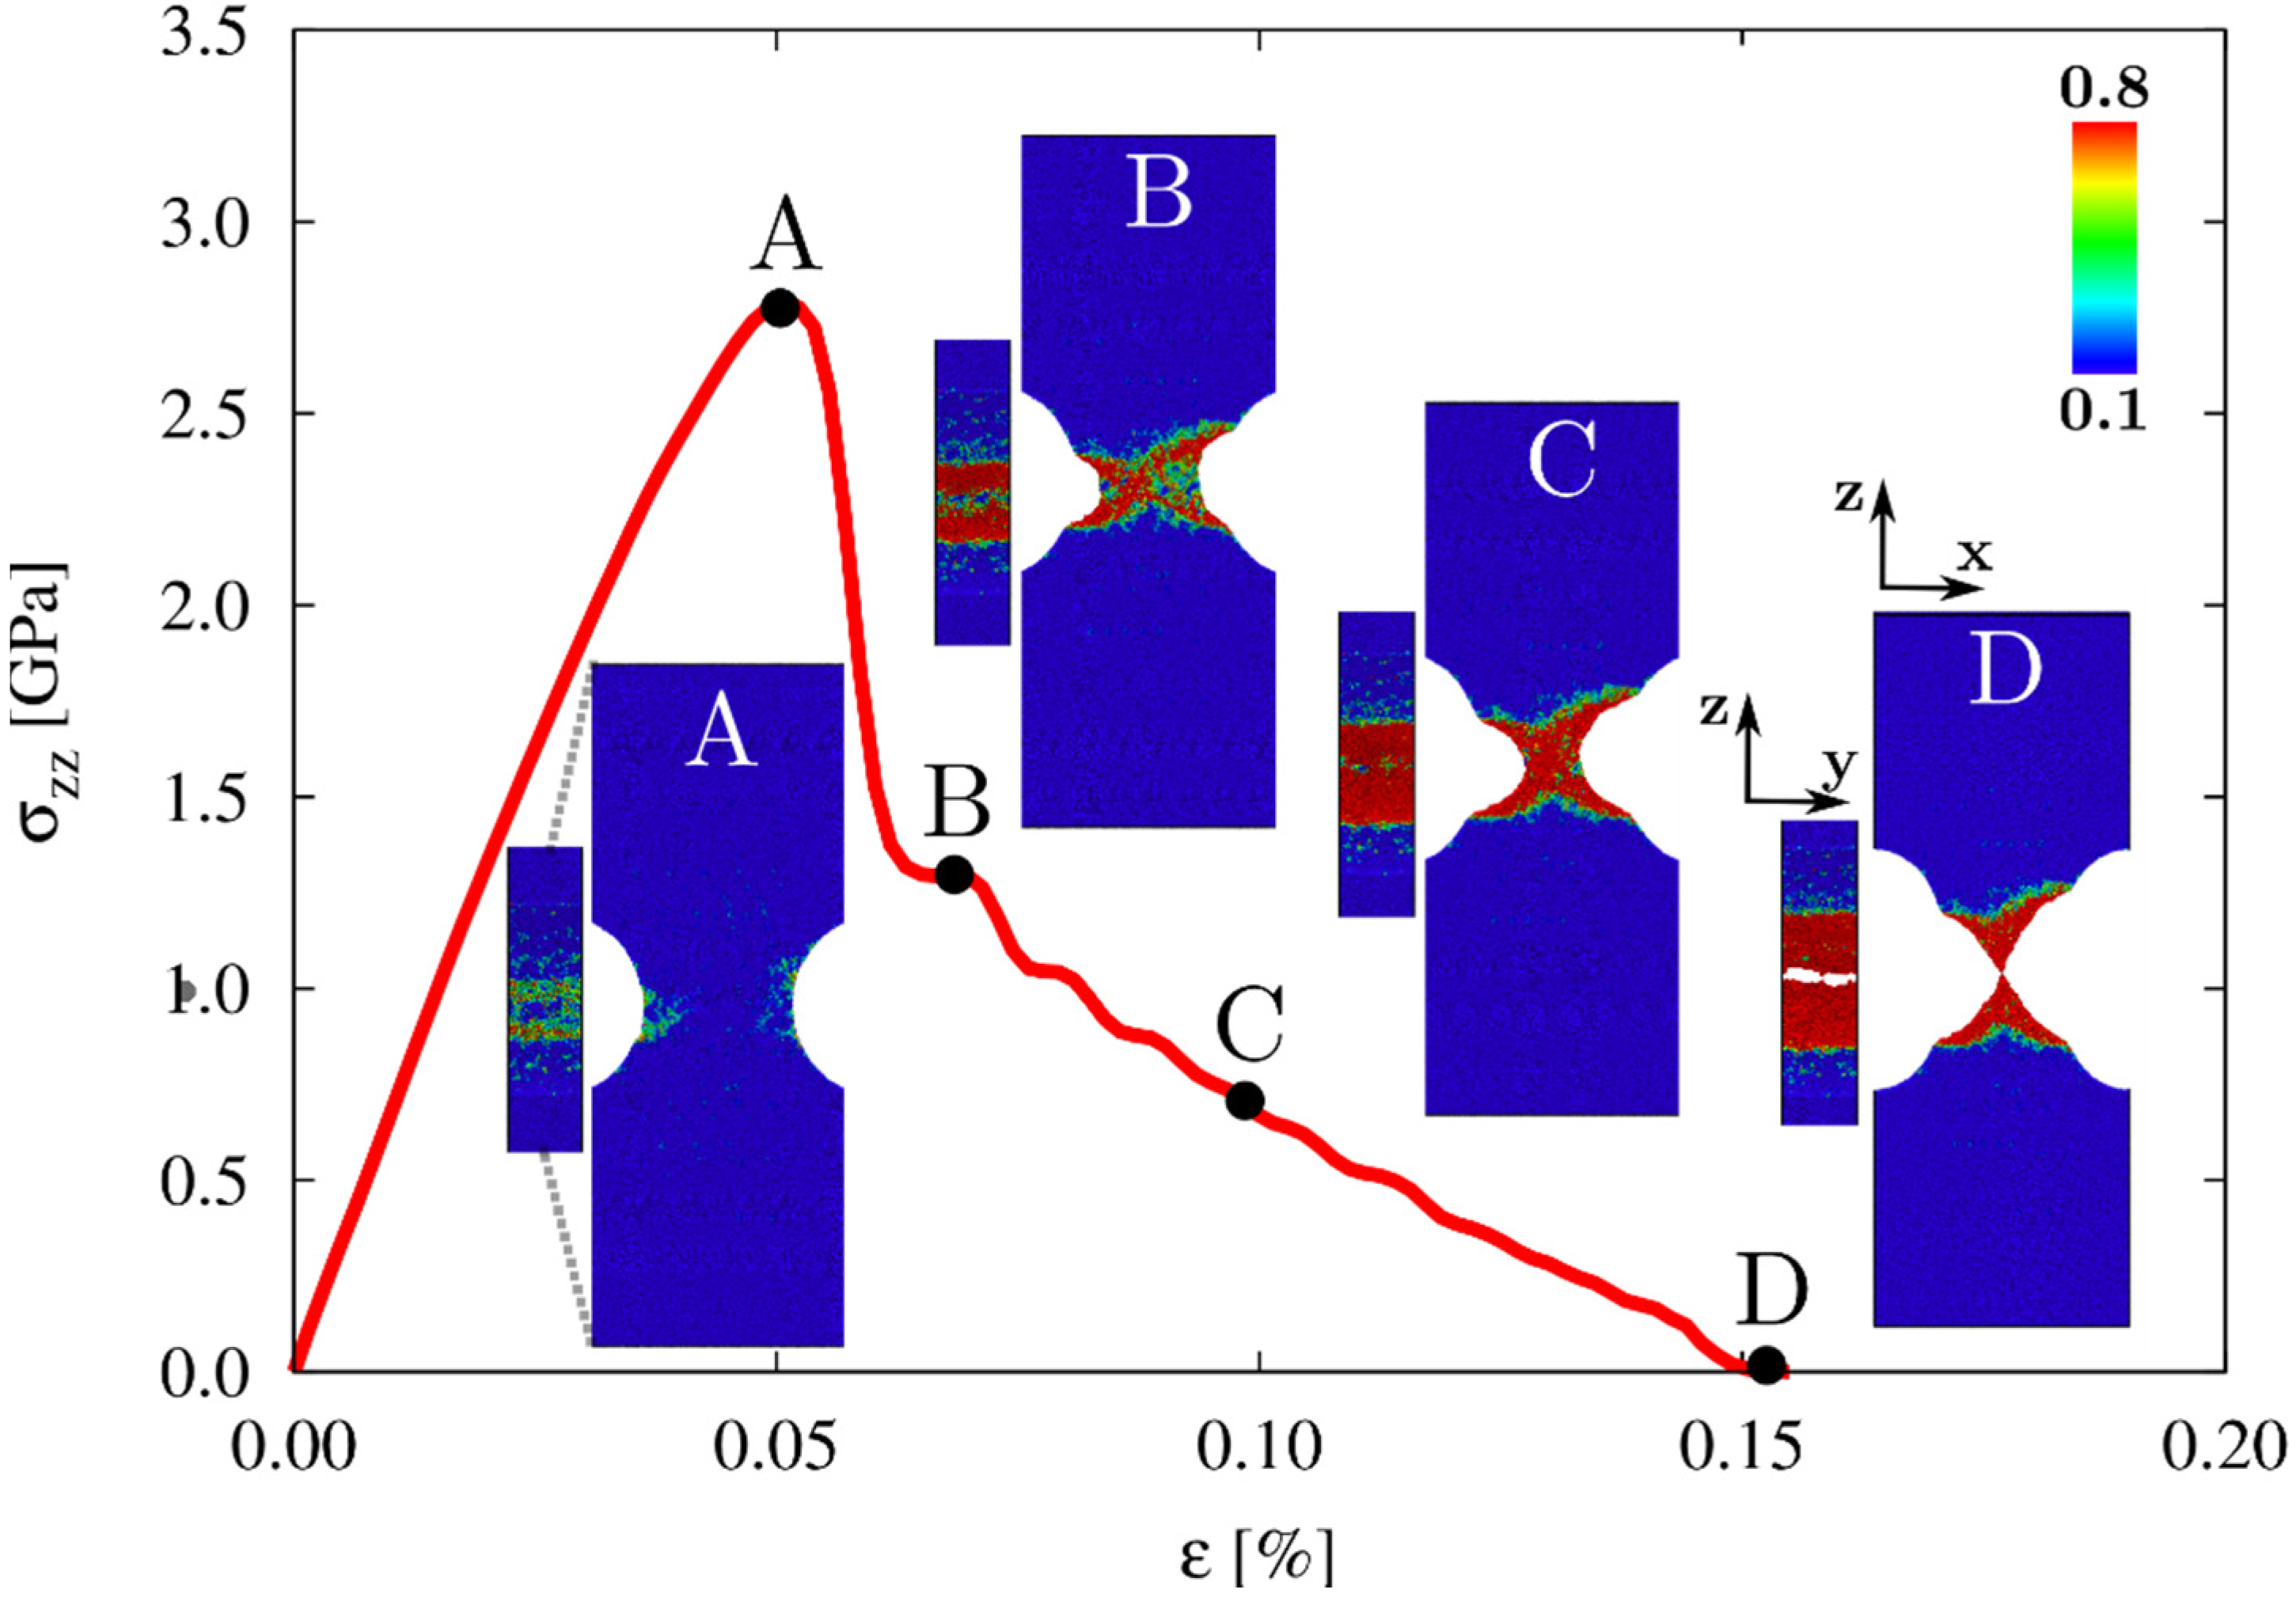
3.2. Size Effects in Metallic Glasses

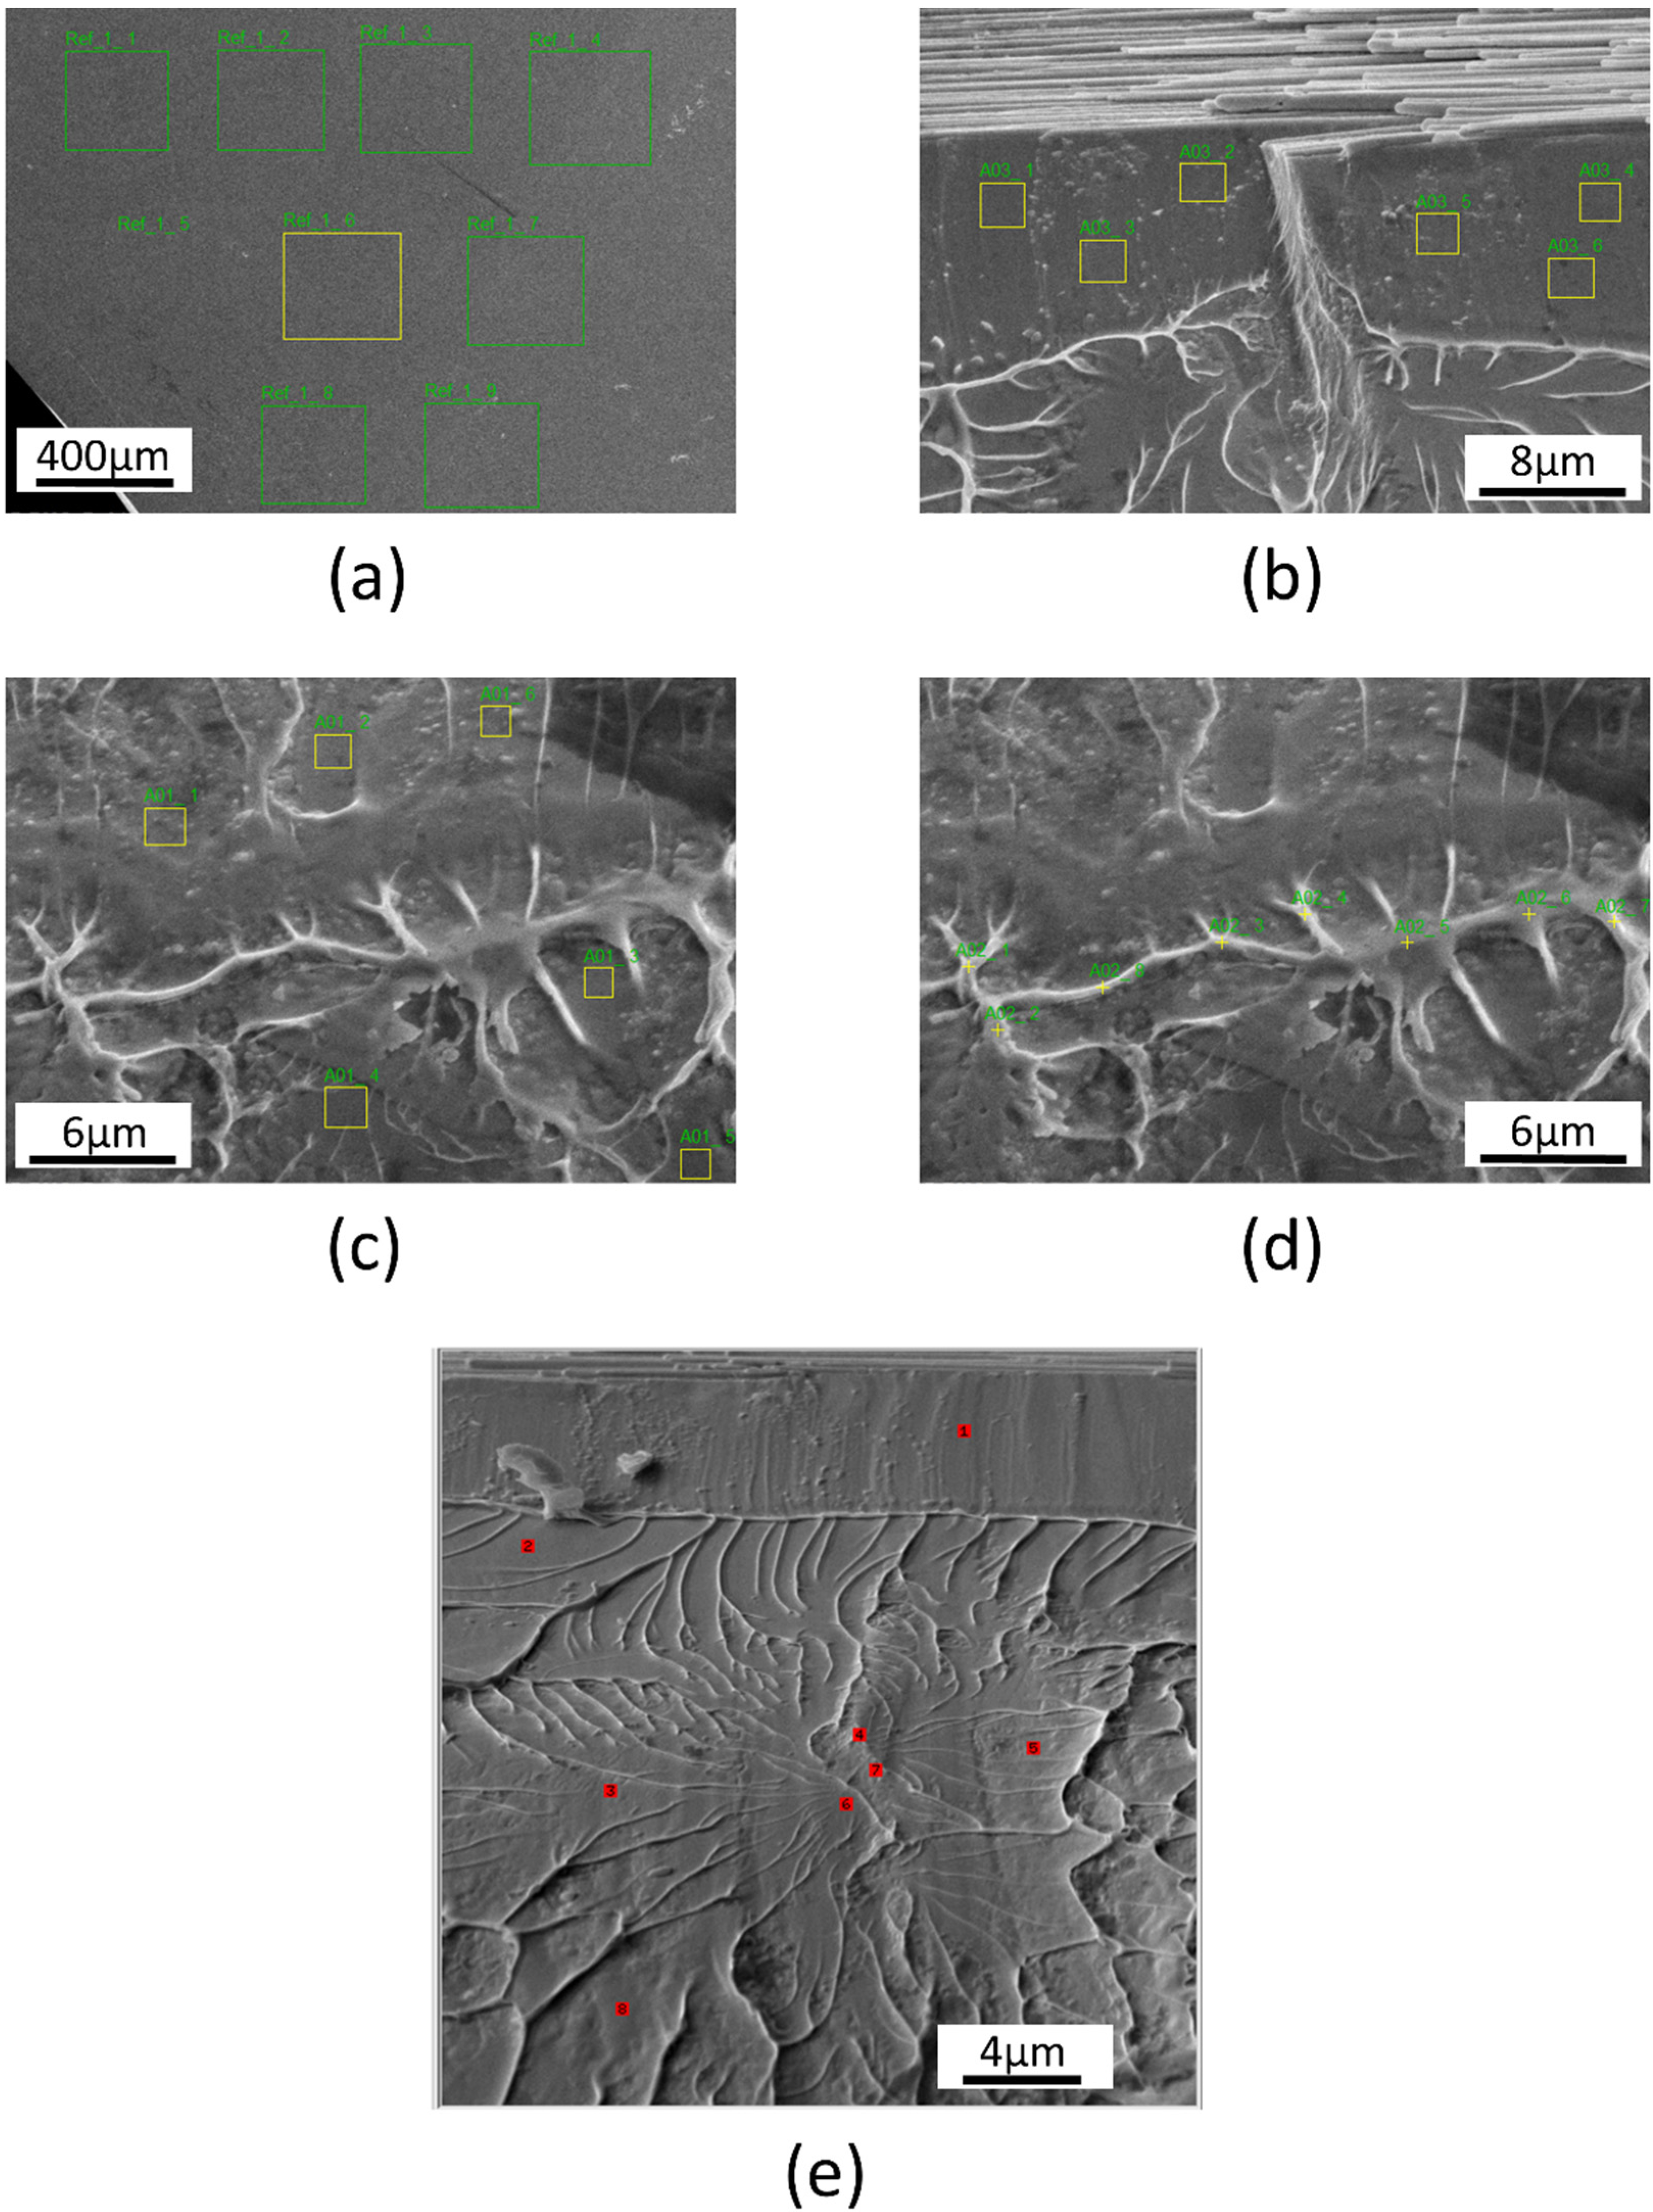
3.3. Compositional Investigation of Pt-BMG

| Element | Pt | Cu | Ni | P | nP/nPt |
|---|---|---|---|---|---|
| Chemical analysis (at.%) | 57.0 ± 0.4 | 14.4 ± 0.1 | 5.2 ± 0.1 | 23.4 ± 0.1 | 0.41 |
| EDX Spectra (at.%) (Figure 7a–d) | |||||
| mean of undeformed region (Figure 7a) | 56.0 | 14.6 | 5.5 | 23.9 | 0.43 |
| mean of smooth region (Figure 7b) | 55.5 | 15.4 | 6.8 | 22.3 | 0.40 |
| mean of vein-like region (Figure 7c) | 57.3 | 16.2 | 6.3 | 20.2 | 0.35 |
| mean of ridges + molten regions(Figure 7d) | 58.4 | 16.4 | 6.4 | 18.8 | 0.32 |
| Auger spectra (at.%) (Figure 7e) | |||||
| mean of undeformed region | 73.3 | 6.4 | 5.4 | 14.9 | 0.20 |
| mean of smooth region | 75.6 | 6.0 | 5.6 | 12.8 | 0.17 |
| mean of vein-like region | 76.9 | 6.1 | 5.3 | 11.7 | 0.15 |
| mean of core + molten regions | 76.4 | 6.4 | 5.2 | 12.0 | 0.16 |
4. Conclusions
Acknowledgments
Author Contributions
Conflicts of Interest
References
- Schwarz, M.; Karma, A.; Eckler, K.; Herlach, D.M. Physical-mechanism of grain-refinement in solidification of undercooled melts. Phys. Rev. Lett. 1994, 73, 1380–1383. [Google Scholar] [CrossRef] [PubMed]
- Schroers, J.; HollandMoritz, D.; Herlach, D.M.; Grushko, B.; Urban, K. Undercooling and solidification behaviour of a metastable decagonal quasicrystalline phase and crystalline phases in Al-Co. Mat. Sci. Eng. A 1997, 226, 990–994. [Google Scholar] [CrossRef]
- Hofmann, D.C.; Suh, J.Y.; Wiest, A.; Duan, G.; Lind, M.L.; Demetriou, M.D.; Johnson, W.L. Designing metallic glass matrix composites with high toughness and tensile ductility. Nature 2008, 451, 1085–1089. [Google Scholar] [CrossRef] [PubMed]
- Hays, C.C.; Kim, C.P.; Johnson, W.L. Microstructure controlled shear band pattern formation and enhanced plasticity of bulk metallic glasses containing in situ formed ductile phase dendrite dispersions. Phys. Rev. Lett. 2000, 84, 2901–2904. [Google Scholar] [CrossRef] [PubMed]
- Sarac, B.; Schroers, J. Designing tensile ductility in metallic glasses. Nat. Commun. 2013, 4, 1–7. [Google Scholar] [CrossRef] [PubMed]
- Sarac, B.; Ketkaew, J.; Popnoe, D.O.; Schroers, J. Honeycomb structures of bulk metallic glasses. Adv. Funct. Mater. 2012, 22, 3161–3169. [Google Scholar] [CrossRef]
- Sarac, B.; Schroers, J. From brittle to ductile: Density optimization for Zr-BMG cellular structures. Scr. Mater. 2013, 68, 921–924. [Google Scholar] [CrossRef]
- Sarac, B. Microstructure-Property Optimization in Metallic Glasses; Springer Theses; Springer International Publishing: Cham, Switzerland, 2015; Volume XIII, p. 87. [Google Scholar]
- Schroers, J. Bulk metallic glasses. Phys. Today 2013, 66, 32–37. [Google Scholar] [CrossRef]
- Lewandowski, J.J.; Wang, W.H.; Greer, A.L. Intrinsic plasticity or brittleness of metallic glasses. Philos. Mag. Lett. 2005, 85, 77–87. [Google Scholar] [CrossRef]
- Svendsen, B.; Bargmann, S. On the continuum thermodynamic rate variational formulation of models for extended crystal plasticity at large deformation. J. Mech. Phys. Solids 2010, 58, 1253–1271. [Google Scholar] [CrossRef]
- Bargmann, S.; Ekh, M.; Runesson, K.; Svendsen, B. Modeling of polycrystals with gradient crystal plasticity: A comparison of strategies. Philos. Mag. 2010, 90, 1263–1288. [Google Scholar] [CrossRef]
- Sarac, B.; Klusemann, B.; Xiao, T.; Bargmann, S. Materials by design: An experimental and computational investigation on the microanatomy arrangement of porous metallic glasses. Acta Mater. 2014, 77, 411–422. [Google Scholar] [CrossRef]
- Sarac, B.; Wilmers, J.; Bargmann, S. Property optimization of porous metallic glasses via structural design. Mater. Lett. 2014, 134, 306–310. [Google Scholar] [CrossRef]
- Dubach, A.; Raghavan, R.; Loffler, J.F.; Michler, J.; Ramamurty, U. Micropillar compression studies on a bulk metallic glass in different structural states. Scr. Mater. 2009, 60, 567–570. [Google Scholar] [CrossRef]
- Kumar, G.; Desai, A.; Schroers, J. Bulk metallic glass: The smaller the better. Adv. Mater. 2011, 23, 461–476. [Google Scholar] [CrossRef] [PubMed]
- Hasan, M.; Schroers, J.; Kumar, G. Functionalization of metallic glasses through hierarchical patterning. Nano Lett. 2015, 15, 963–968. [Google Scholar] [CrossRef] [PubMed]
- Schroers, J. Processing of bulk metallic glass. Adv. Mater. 2010, 22, 1566–1597. [Google Scholar] [CrossRef] [PubMed]
- Schroers, J. Ductile Bulk Metallic Glass. Phys. Rev. Lett 2004, 93, 255506. [Google Scholar] [CrossRef] [PubMed]
- Schroers, J. On the formability of bulk metallic glass in its supercooled liquid state. Acta Mater. 2008, 56, 471–478. [Google Scholar] [CrossRef]
- Legg, B.A.; Schroers, J.; Busch, R. Thermodynamics, kinetics, and crystallization of Pt57.3Cu14.6Ni5.3P22.8 bulk metallic glass. Acta Mater. 2007, 55, 1109–1116. [Google Scholar] [CrossRef]
- Sarac, B.; Kumar, G.; Hodges, T.; Ding, S.Y.; Desai, A.; Schroers, J. Three-dimensional shell fabrication using blow molding of bulk metallic glass. J. Microelectromech. S 2011, 20, 28–36. [Google Scholar] [CrossRef]
- Duan, G.; Wiest, A.; Lind, M.L.; Li, J.; Rhim, W.K.; Johnson, W.L. Bulk metallic glass with benchmark thermoplastic processability. Adv. Mater. 2007, 19, 4272–4275. [Google Scholar] [CrossRef]
- Qu, R.T.; Stoica, M.; Eckert, J.; Zhang, Z.F. Tensile fracture morphologies of bulk metallic glass. J. Appl. Phys. 2010, 108, 063509. [Google Scholar] [CrossRef]
- Zhang, Z.F.; Eckert, J.; Schultz, L. Difference in compressive and tensile fracture mechanisms of Zr59Cu20Al10Ni8Ti3 bulk metallic glass. Acta Mater. 2003, 51, 1167–1179. [Google Scholar] [CrossRef]
- Wright, W.J.; Saha, R.; Nix, W.D. Deformation mechanisms of the Zr40Ti14Ni10Cu12Be24 bulk metallic glass. Mater. Trans. 2001, 42, 642–649. [Google Scholar] [CrossRef]
- Liu, C.T.; Heatherly, L.; Easton, D.S.; Carmichael, C.A.; Schneibel, J.H.; Chen, C.H.; Wright, J.L.; Yoo, M.H.; Horton, J.A.; Inoue, A. Test environments and mechanical properties of Zr-base bulk amorphous alloys. Metall. Mater. Trans. A 1998, 29, 1811–1820. [Google Scholar] [CrossRef]
- Mendelev, M.I.; Rehbein, D.K.; Ott, R.T.; Kramer, M.J.; Sordelet, D.J. Computer simulation and experimental study of elastic properties of amorphous Cu-Zr alloys. J. Appl Phys. 2007, 102, 093518. [Google Scholar] [CrossRef]
- Sopu, D.; Karsten, A. Influence of grain size and composition, topology and excess free volume on the deformation behavior of Cu–Zr nanoglasses. Beilstein J. Nanotechnol. 2015, 6, 537–545. [Google Scholar] [CrossRef]
- Stukowski, A. Visualization and analysis of atomistic simulation data with OVITO—The open visualization tool. Model. Simul. Mater. Sci. 2010, 18, 015012. [Google Scholar] [CrossRef]
- Shi, Y.F. Size-independent shear band formation in amorphous nanowires made from simulated casting. Appl. Phys. Lett. 2010, 96, 121909. [Google Scholar] [CrossRef]
© 2015 by the authors; licensee MDPI, Basel, Switzerland. This article is an open access article distributed under the terms and conditions of the Creative Commons Attribution license (http://creativecommons.org/licenses/by/4.0/).
Share and Cite
Sarac, B.; Sopu, D.; Park, E.; Hufenbach, J.K.; Oswald, S.; Stoica, M.; Eckert, J. Mechanical and Structural Investigation of Porous Bulk Metallic Glasses. Metals 2015, 5, 920-933. https://doi.org/10.3390/met5020920
Sarac B, Sopu D, Park E, Hufenbach JK, Oswald S, Stoica M, Eckert J. Mechanical and Structural Investigation of Porous Bulk Metallic Glasses. Metals. 2015; 5(2):920-933. https://doi.org/10.3390/met5020920
Chicago/Turabian StyleSarac, Baran, Daniel Sopu, Eunmi Park, Julia Kristin Hufenbach, Steffen Oswald, Mihai Stoica, and Jürgen Eckert. 2015. "Mechanical and Structural Investigation of Porous Bulk Metallic Glasses" Metals 5, no. 2: 920-933. https://doi.org/10.3390/met5020920
APA StyleSarac, B., Sopu, D., Park, E., Hufenbach, J. K., Oswald, S., Stoica, M., & Eckert, J. (2015). Mechanical and Structural Investigation of Porous Bulk Metallic Glasses. Metals, 5(2), 920-933. https://doi.org/10.3390/met5020920