To compare the results in this work with a well-known alloy system, the alloy Ni-22%Cr-10%Al was chosen as a reference, based on the work of Schloesser in previous studies [
6], where the alloy Ni-22%Cr-10%Al-1%Y has been used as a bond-coat material on copper substrates. The alloy there contains yttrium, which improves the adhesion of the aluminum oxide layers and leads to an improved cyclic oxidation behavior. This effect is not of crucial importance in rocket engines due to the short time of hot-gas exposure compared to gas-turbine application [
14], and consequently, Yttrium is not considered here. The microstructure of a similar alloy Ni-20%Cr-12%Al has been studied by Achar
et al. [
20].
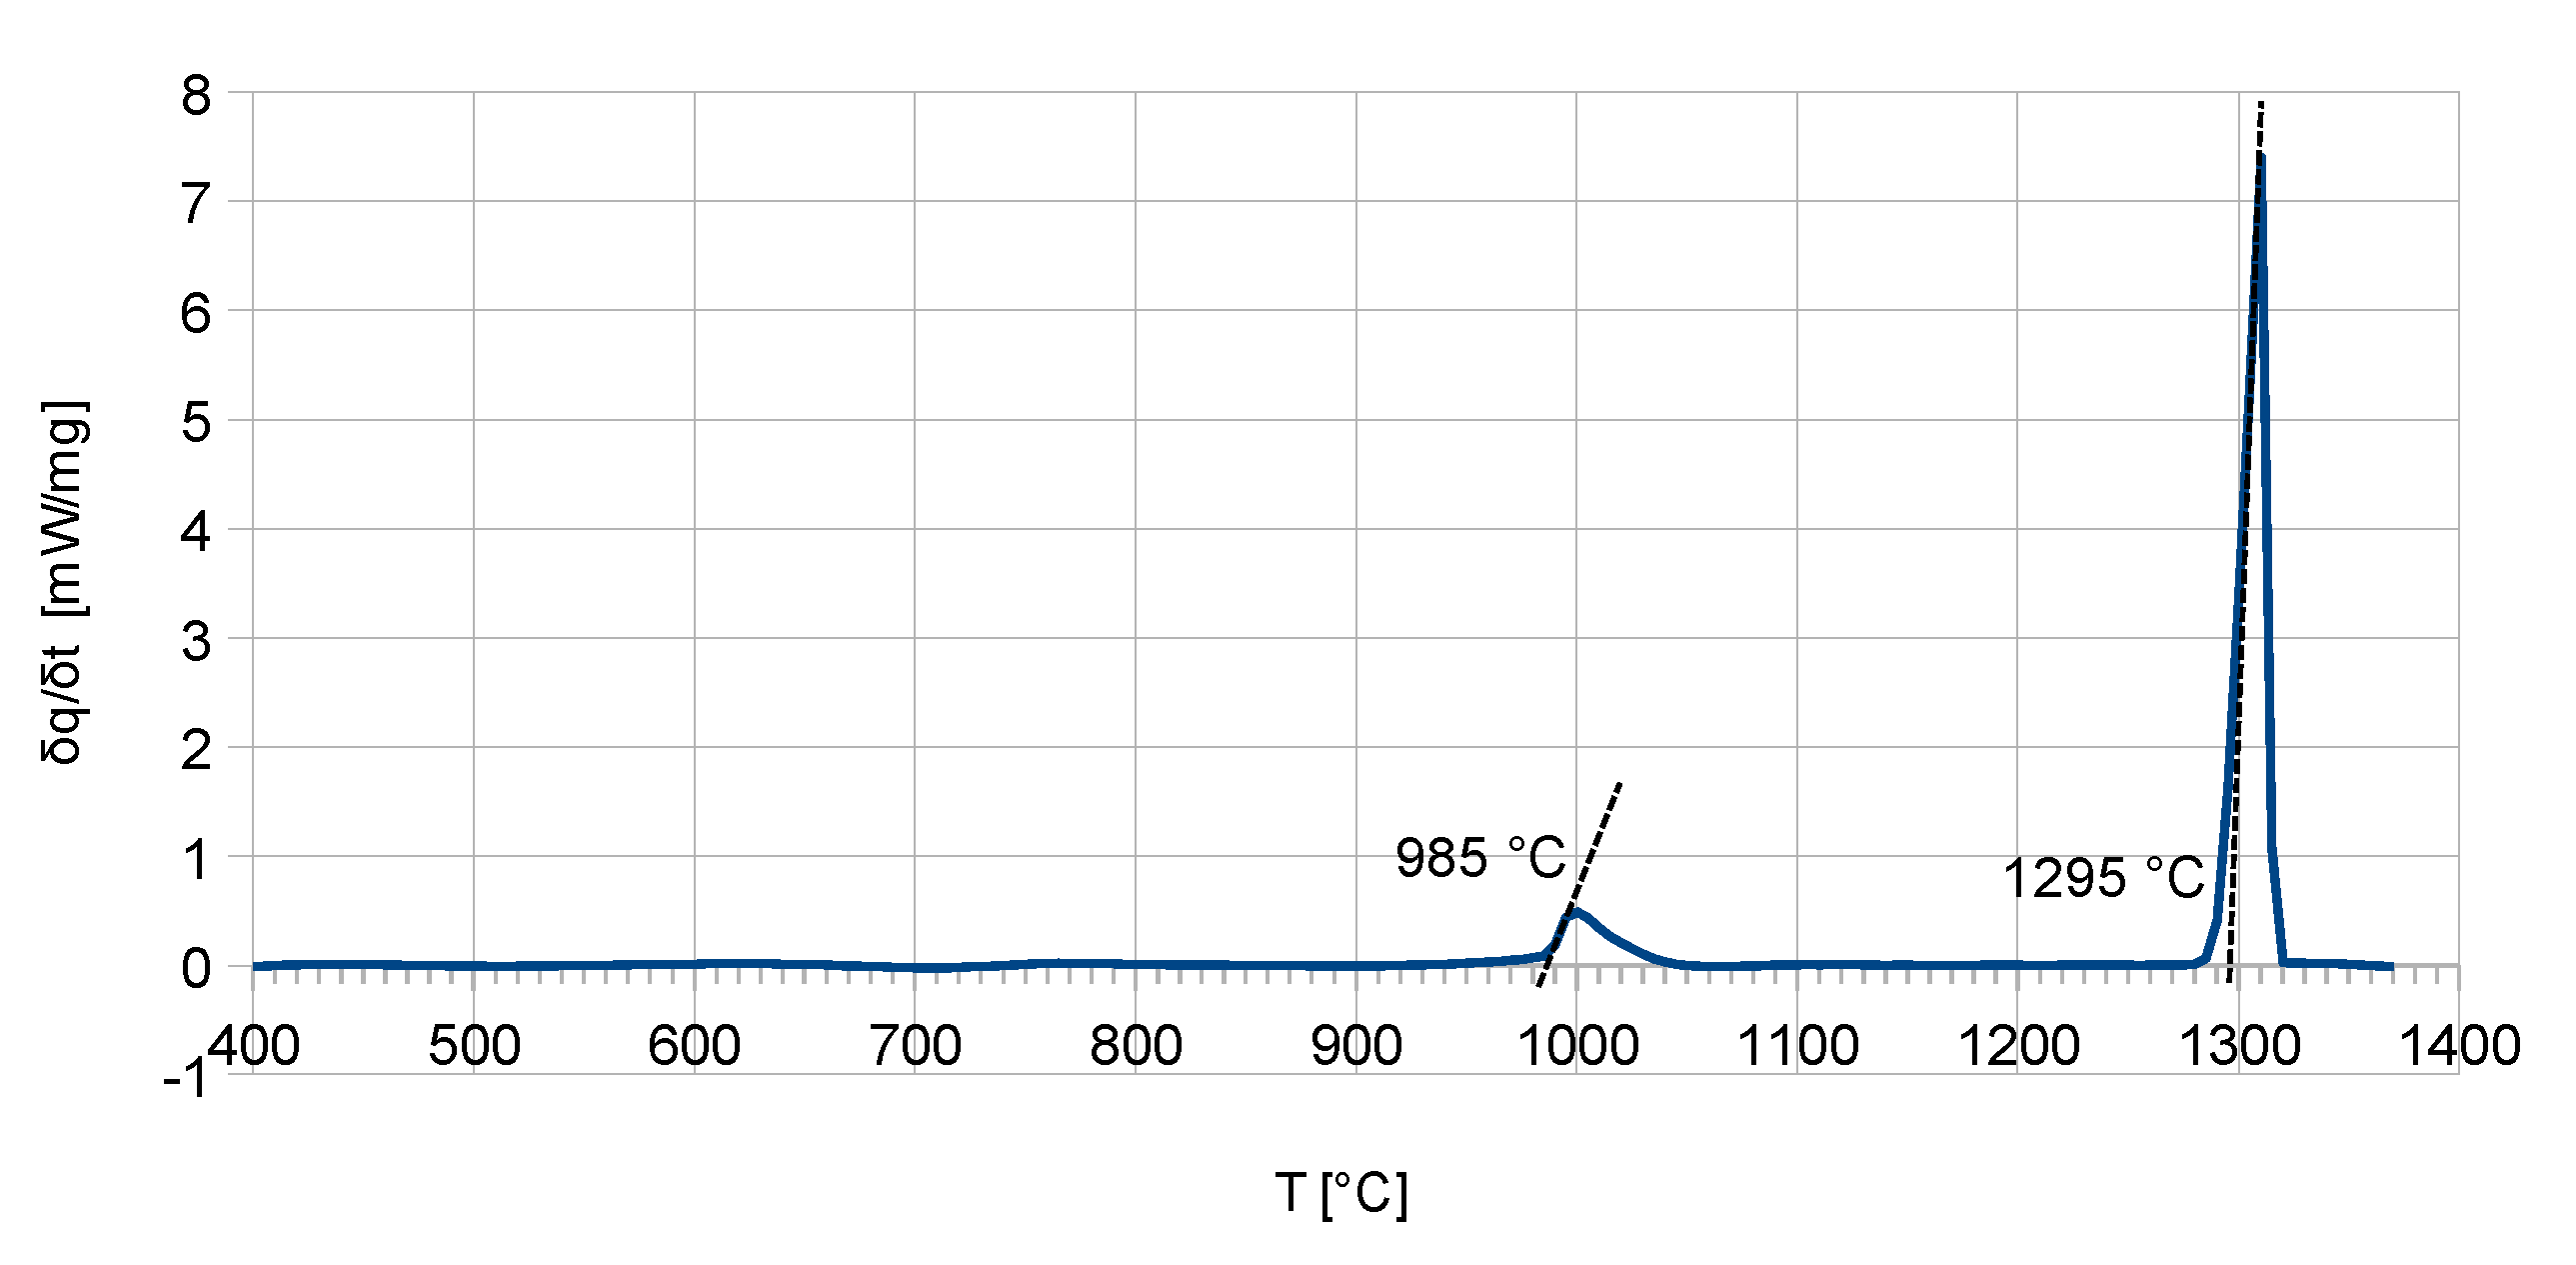
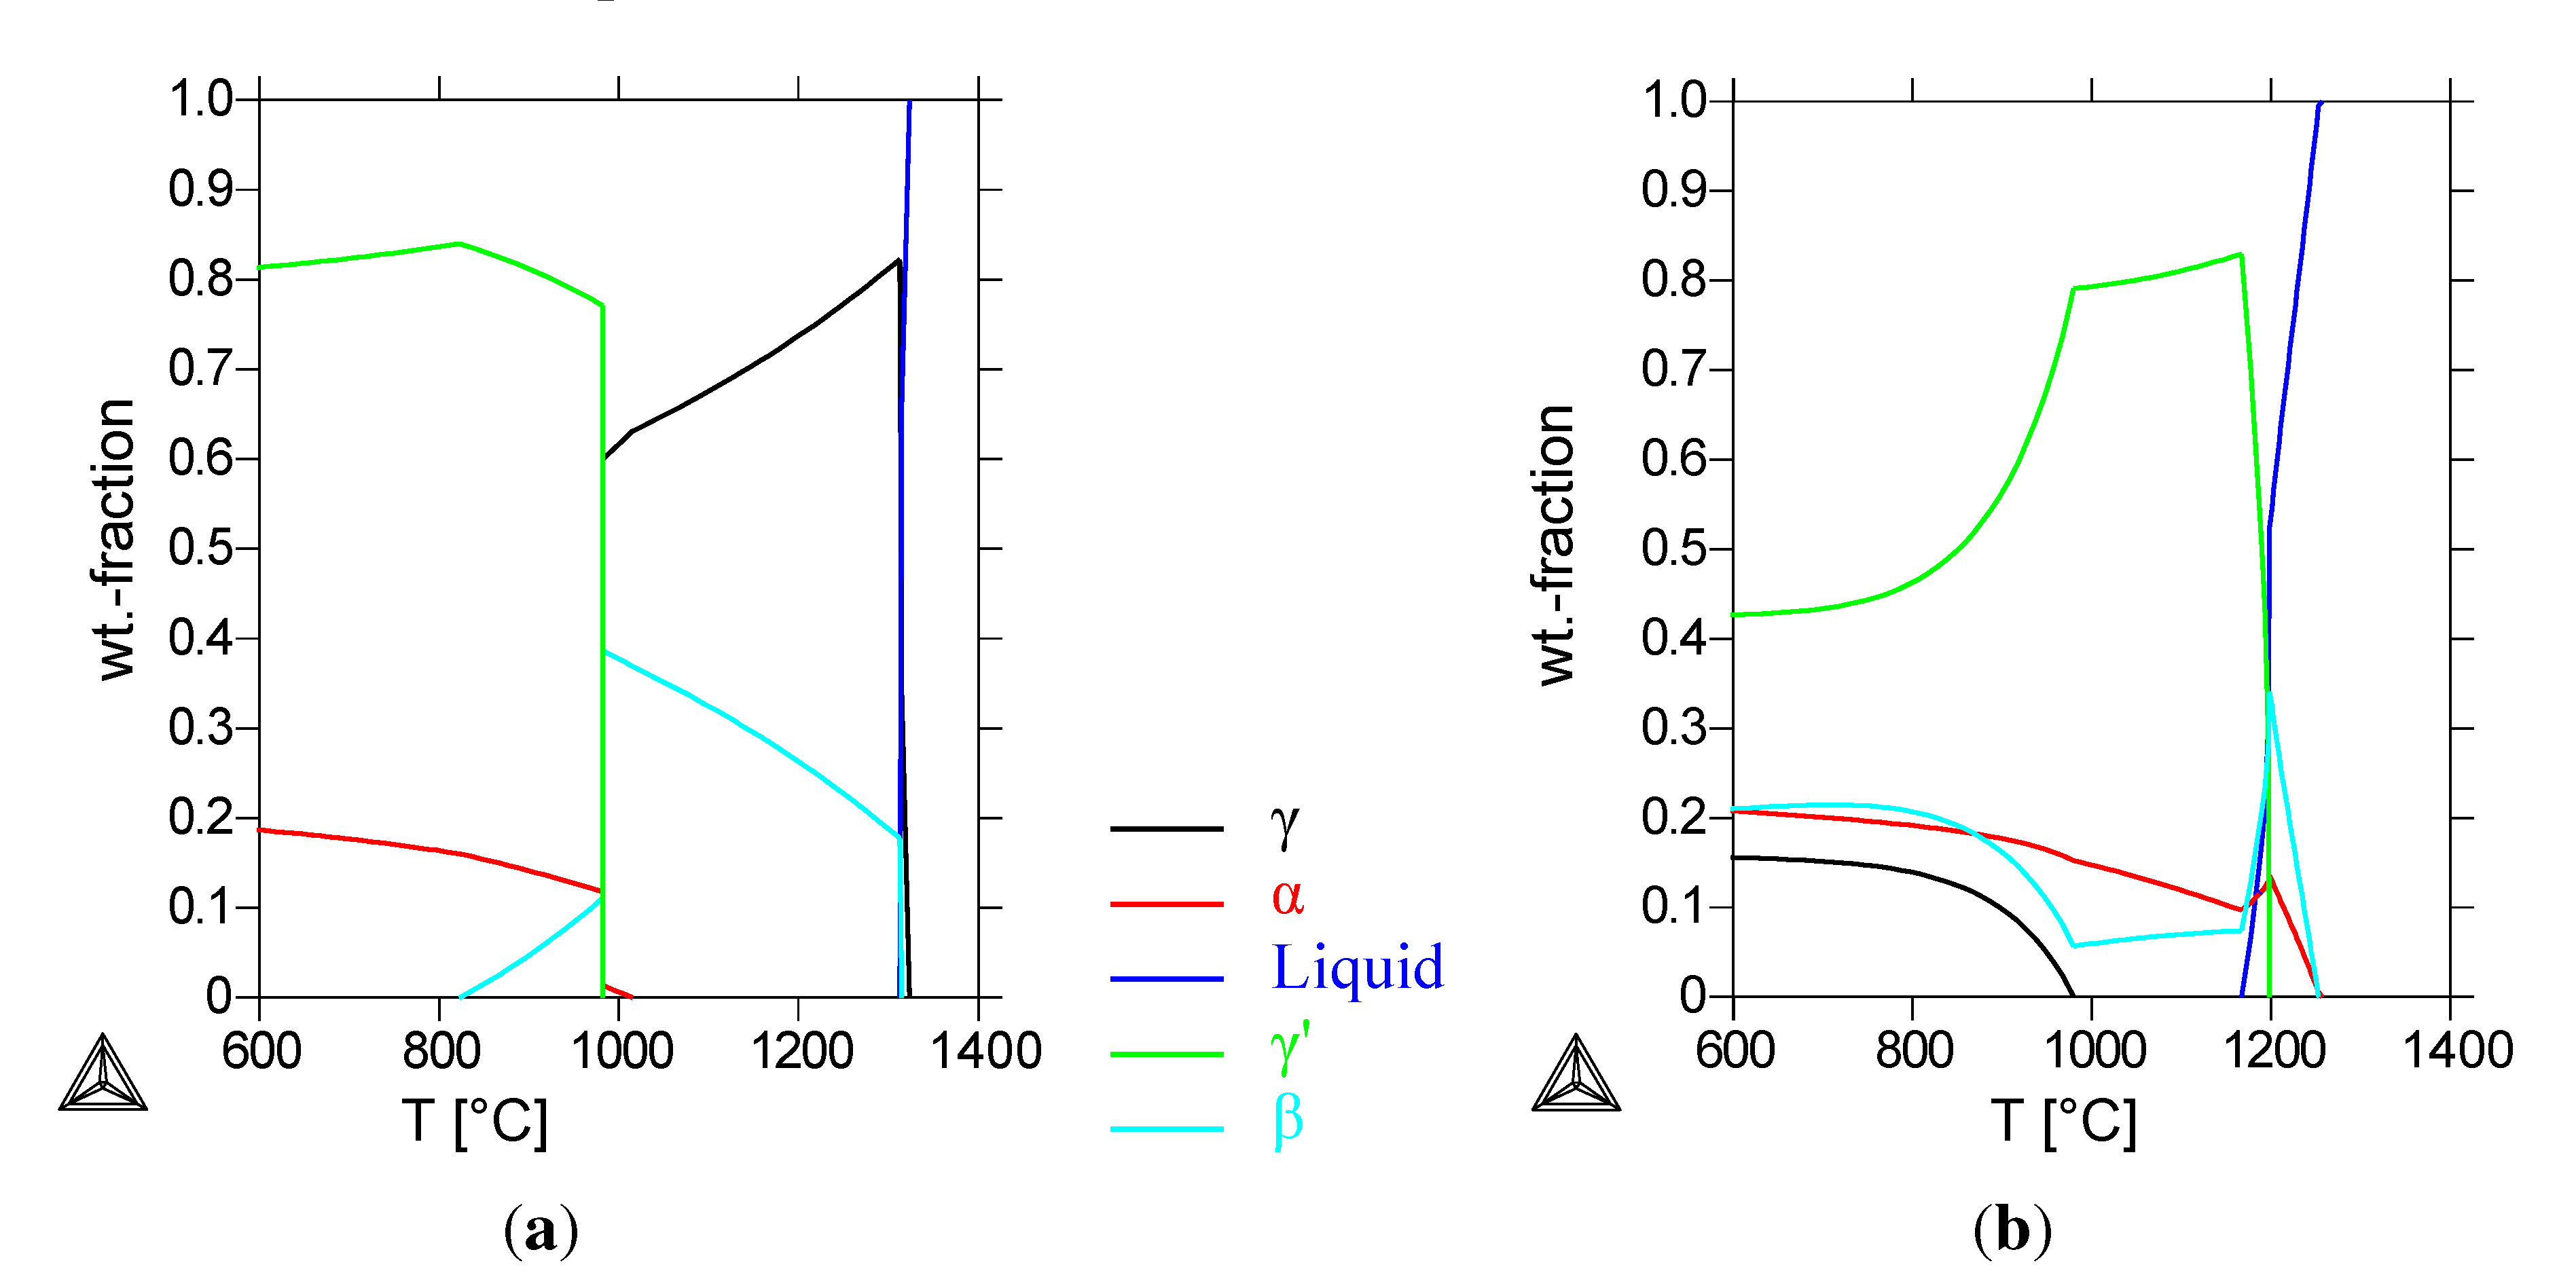
Figure 1(a) shows the calculated phase-composition of the reference alloy. At the homogenization temperature of 1000 °C, a composition of 35% cubic
β-NiAl and 65% fcc
γ-Ni is calculated. Below 980 °C, the formation of a bcc
α-Cr- and an fcc
γ’-phase is calculated; the
β phase is still present with a fraction of 11 wt%. The calculated
β mass-fraction decreases at temperatures lower than 980 °C. At the heat-treatment temperature of 800 °C, the calculated composition of the alloy is only
γ’ and
α-Cr. The calorimetric measurements (
Figure 2) showed good agreement with the calculations. Here, the phase-reaction temperature was measured at 985 °C and differs only by 5 K from the calculated temperature. The measured solidus temperature is 1295 °C and differs only by 10 K from the calculated solidus temperature of 1305 °C.
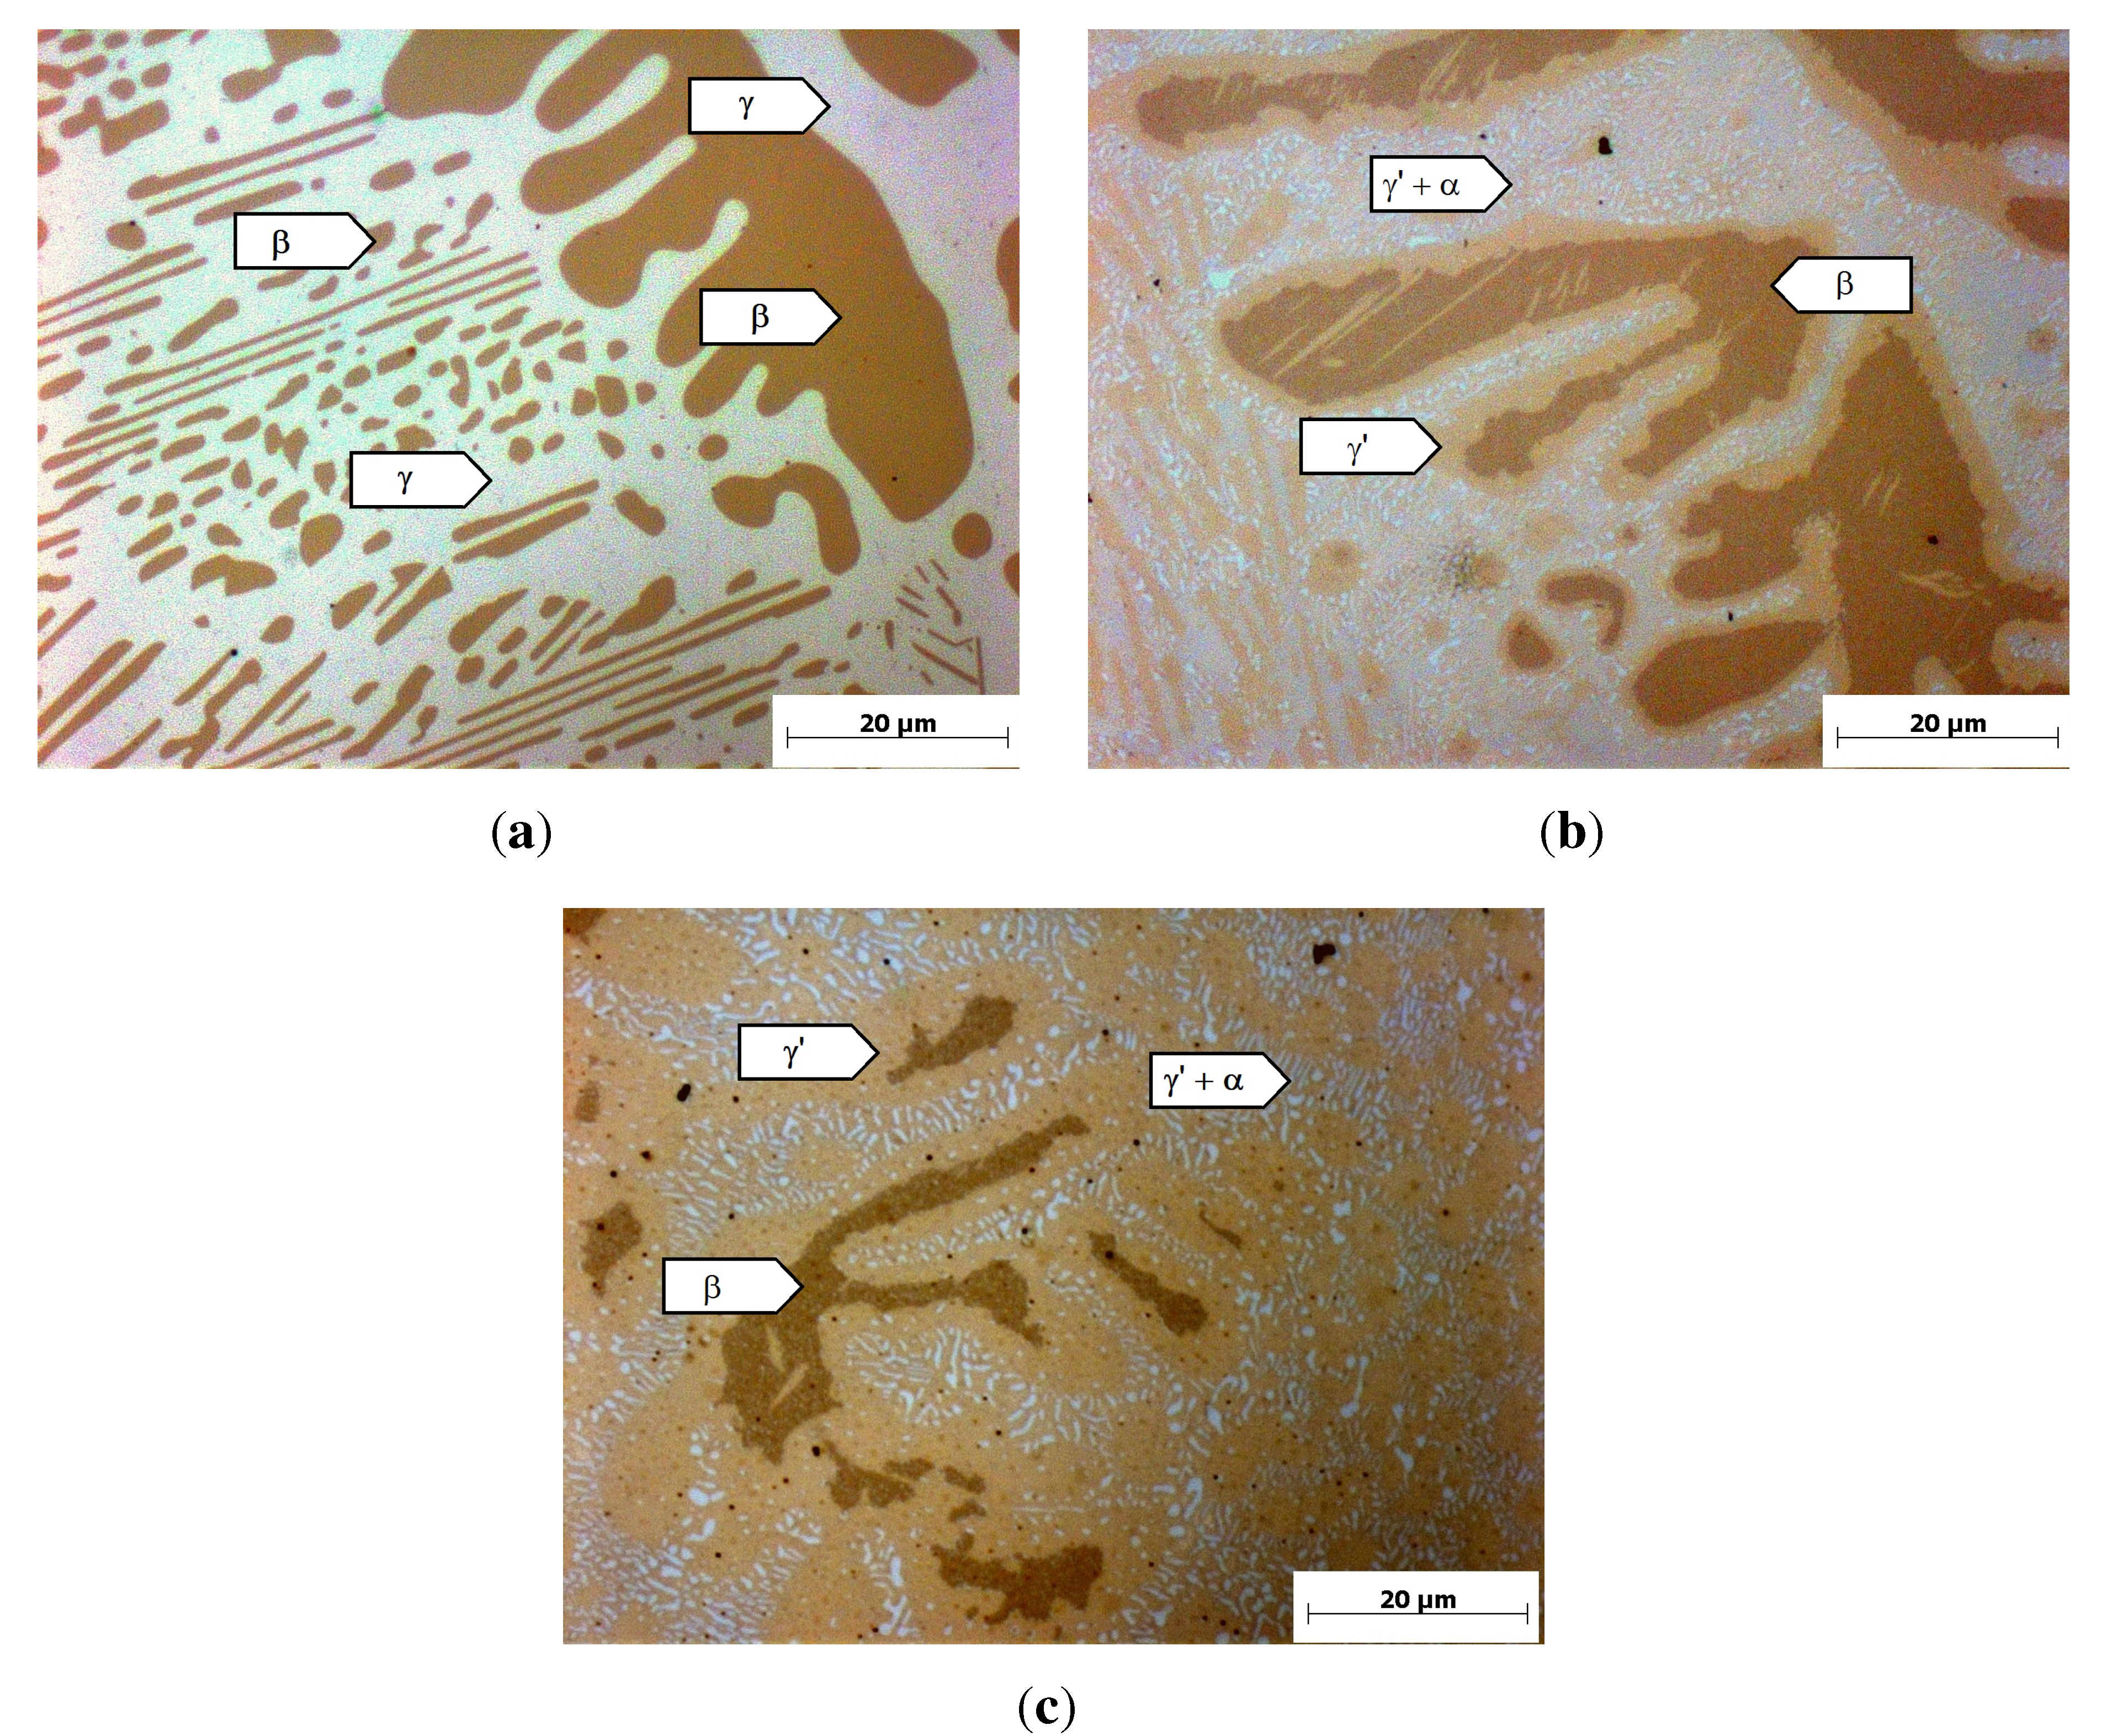
Figure 3(a) shows the micrograph of the reference alloy after casting and homogenization. It consists of a dark brown dendritic phase with a content of 35%, measured with optical image analysis, and a bright interdendritic phase. A similar microstructure has been found by Achar [
20] and was there identified as the cubic
β-NiAl (dark brown) and the fcc
γ-Ni (bright). Considering the Thermo-Calc calculations and the work of Achar, the dark brown dendritic phase in
Figure 3(a) can be identified as
β-NiAl and the interdendritic phase as the
γ-phase.
After heat treatment at 800 °C, a two-phase
γ’/
α-Cr microstructure was predicted by the calculations. The metallographic examination (
Figure 3(b),(c)) shows that the
β-phase is still existent in the microstructure. Furthermore, a light brown phase forms at the interface between the
β-phase and the interdendritic area. The interdendritic area consists of a light brown phase with the same contrast as the margin-phase around the
β-particles and small, bright precipitates. After 4 h of heat treatment (
Figure 3(b)), small
β-particles are completely converted to the light brown phase. At bigger
β-particles, only a small margin of approximately 2
µm thickness of the light brown phase has formed. Further heat treatment for 100 h showed that the light brown phase grows with longer heat-treatment time, while the
β-particle size is reduced (
Figure 3(c)). The white particles in the interdendritic areas can be identified as
α-Cr, since an EDX-analysis of the white particles shows a Cr-content of
>60%. Considering the poor resolution of EDX and the influence of the surrounding material, the Cr-content is even higher than measured. An EDX-analysis of the light brown phase shows an Al-content of 11.1%
± 0.9%, in agreement with the calculated Al-content of the
γ’-phase of 12%. Hence, the light brown phase can be identified as
γ’, agreeing with the work of Achar [
20]. The
β-phase is still existent in the microstructure in contrast to the calculation, but the heat treatment for 100 h suggests that further heat treatment will lead to a complete conversion of the
β-particles into
γ’ and
α-Cr.
2.1. Increasing Cu-Content
For a rocket-engine application, the bond-coat alloy has to be modified by adding copper, as mentioned above. A copper-content of 30% was set as a starting point for further alloy development, because the coefficient of thermal expansion (CTE) was expected to be in the range of the copper substrate’s CTE (see the Introduction). To investigate the influence of copper on the microstructure of NiCrAl alloys, the reference alloy examined above was modified by adding 30% copper.
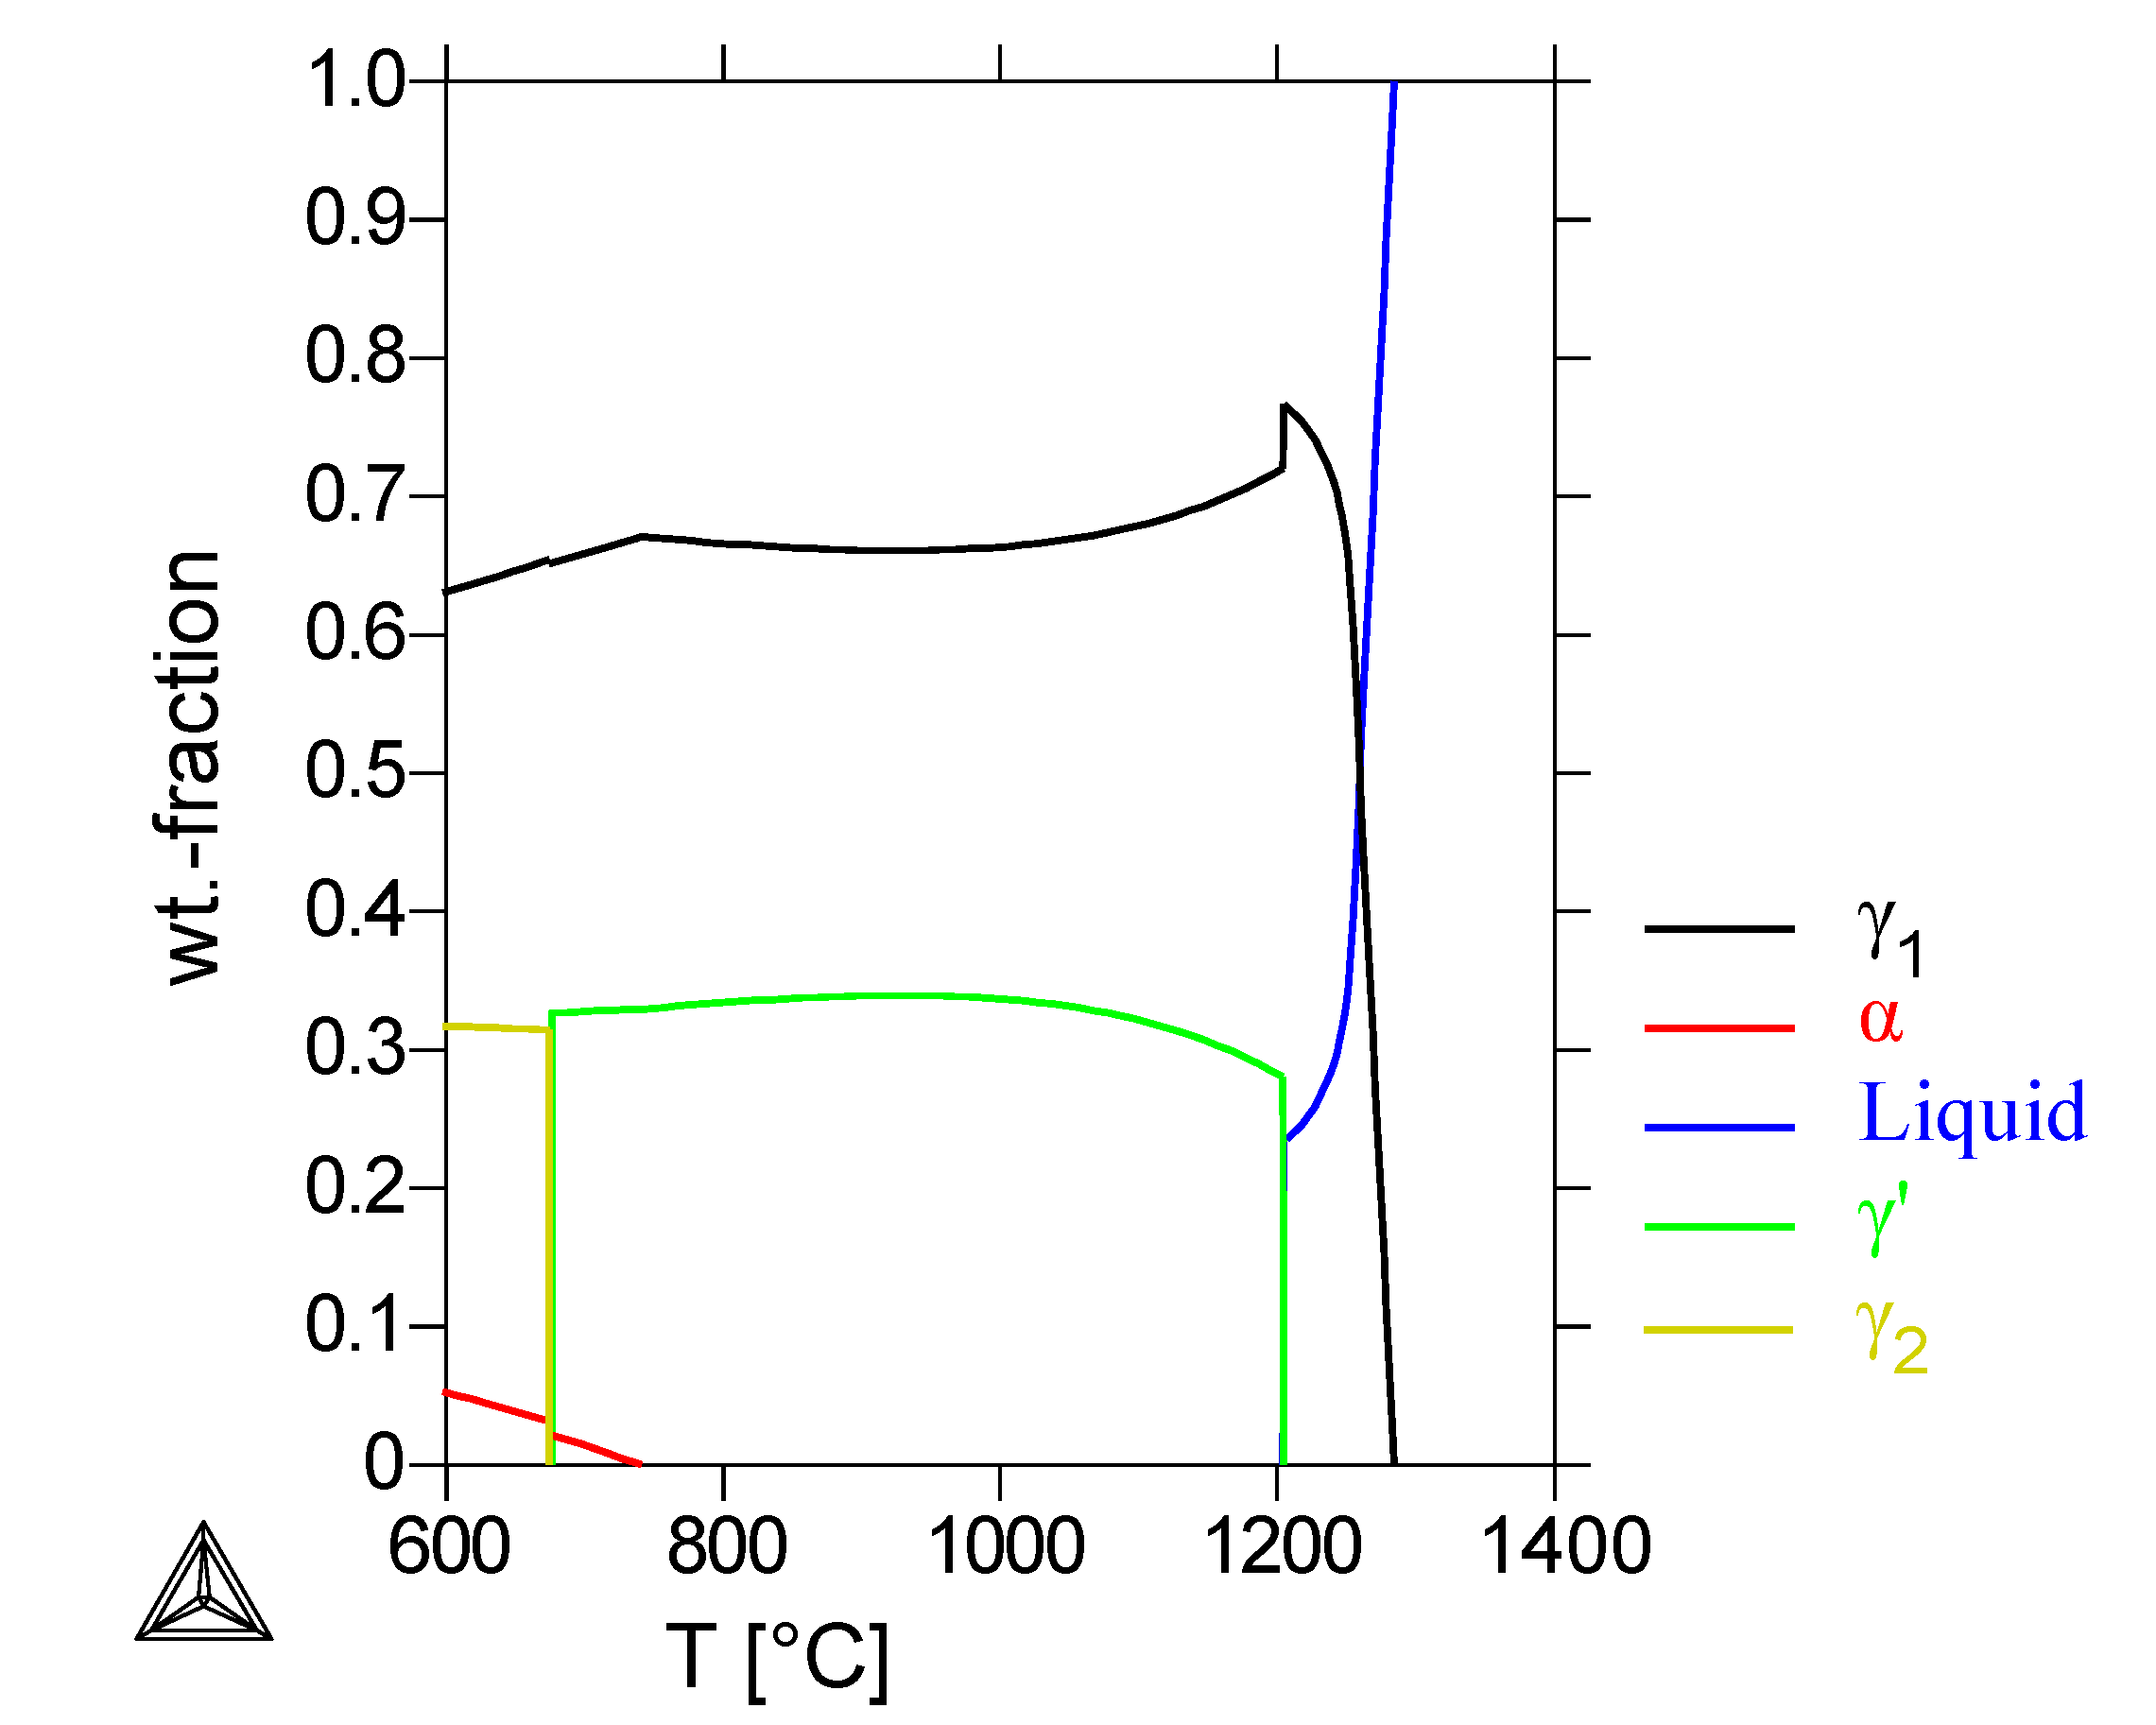
The Thermo-Calc calculations for this alloy (
Figure 1(b)) show a first solidifying
α-chromium and
β-NiAl phase and a
γ’-phase solidifying at 1200 °C. Below 980 °C, a
γ-phase forms at the expense of the
γ’-phase. Compared to the calculations for the Cu-free alloy, the
β-phase is still the NiAl-phase, with a calculated chromium and copper content below 5 wt%. The
γ’-phase contains now 30% to 40% copper, depending on the temperature, while the
γ-phase consists of more than 90% copper (see
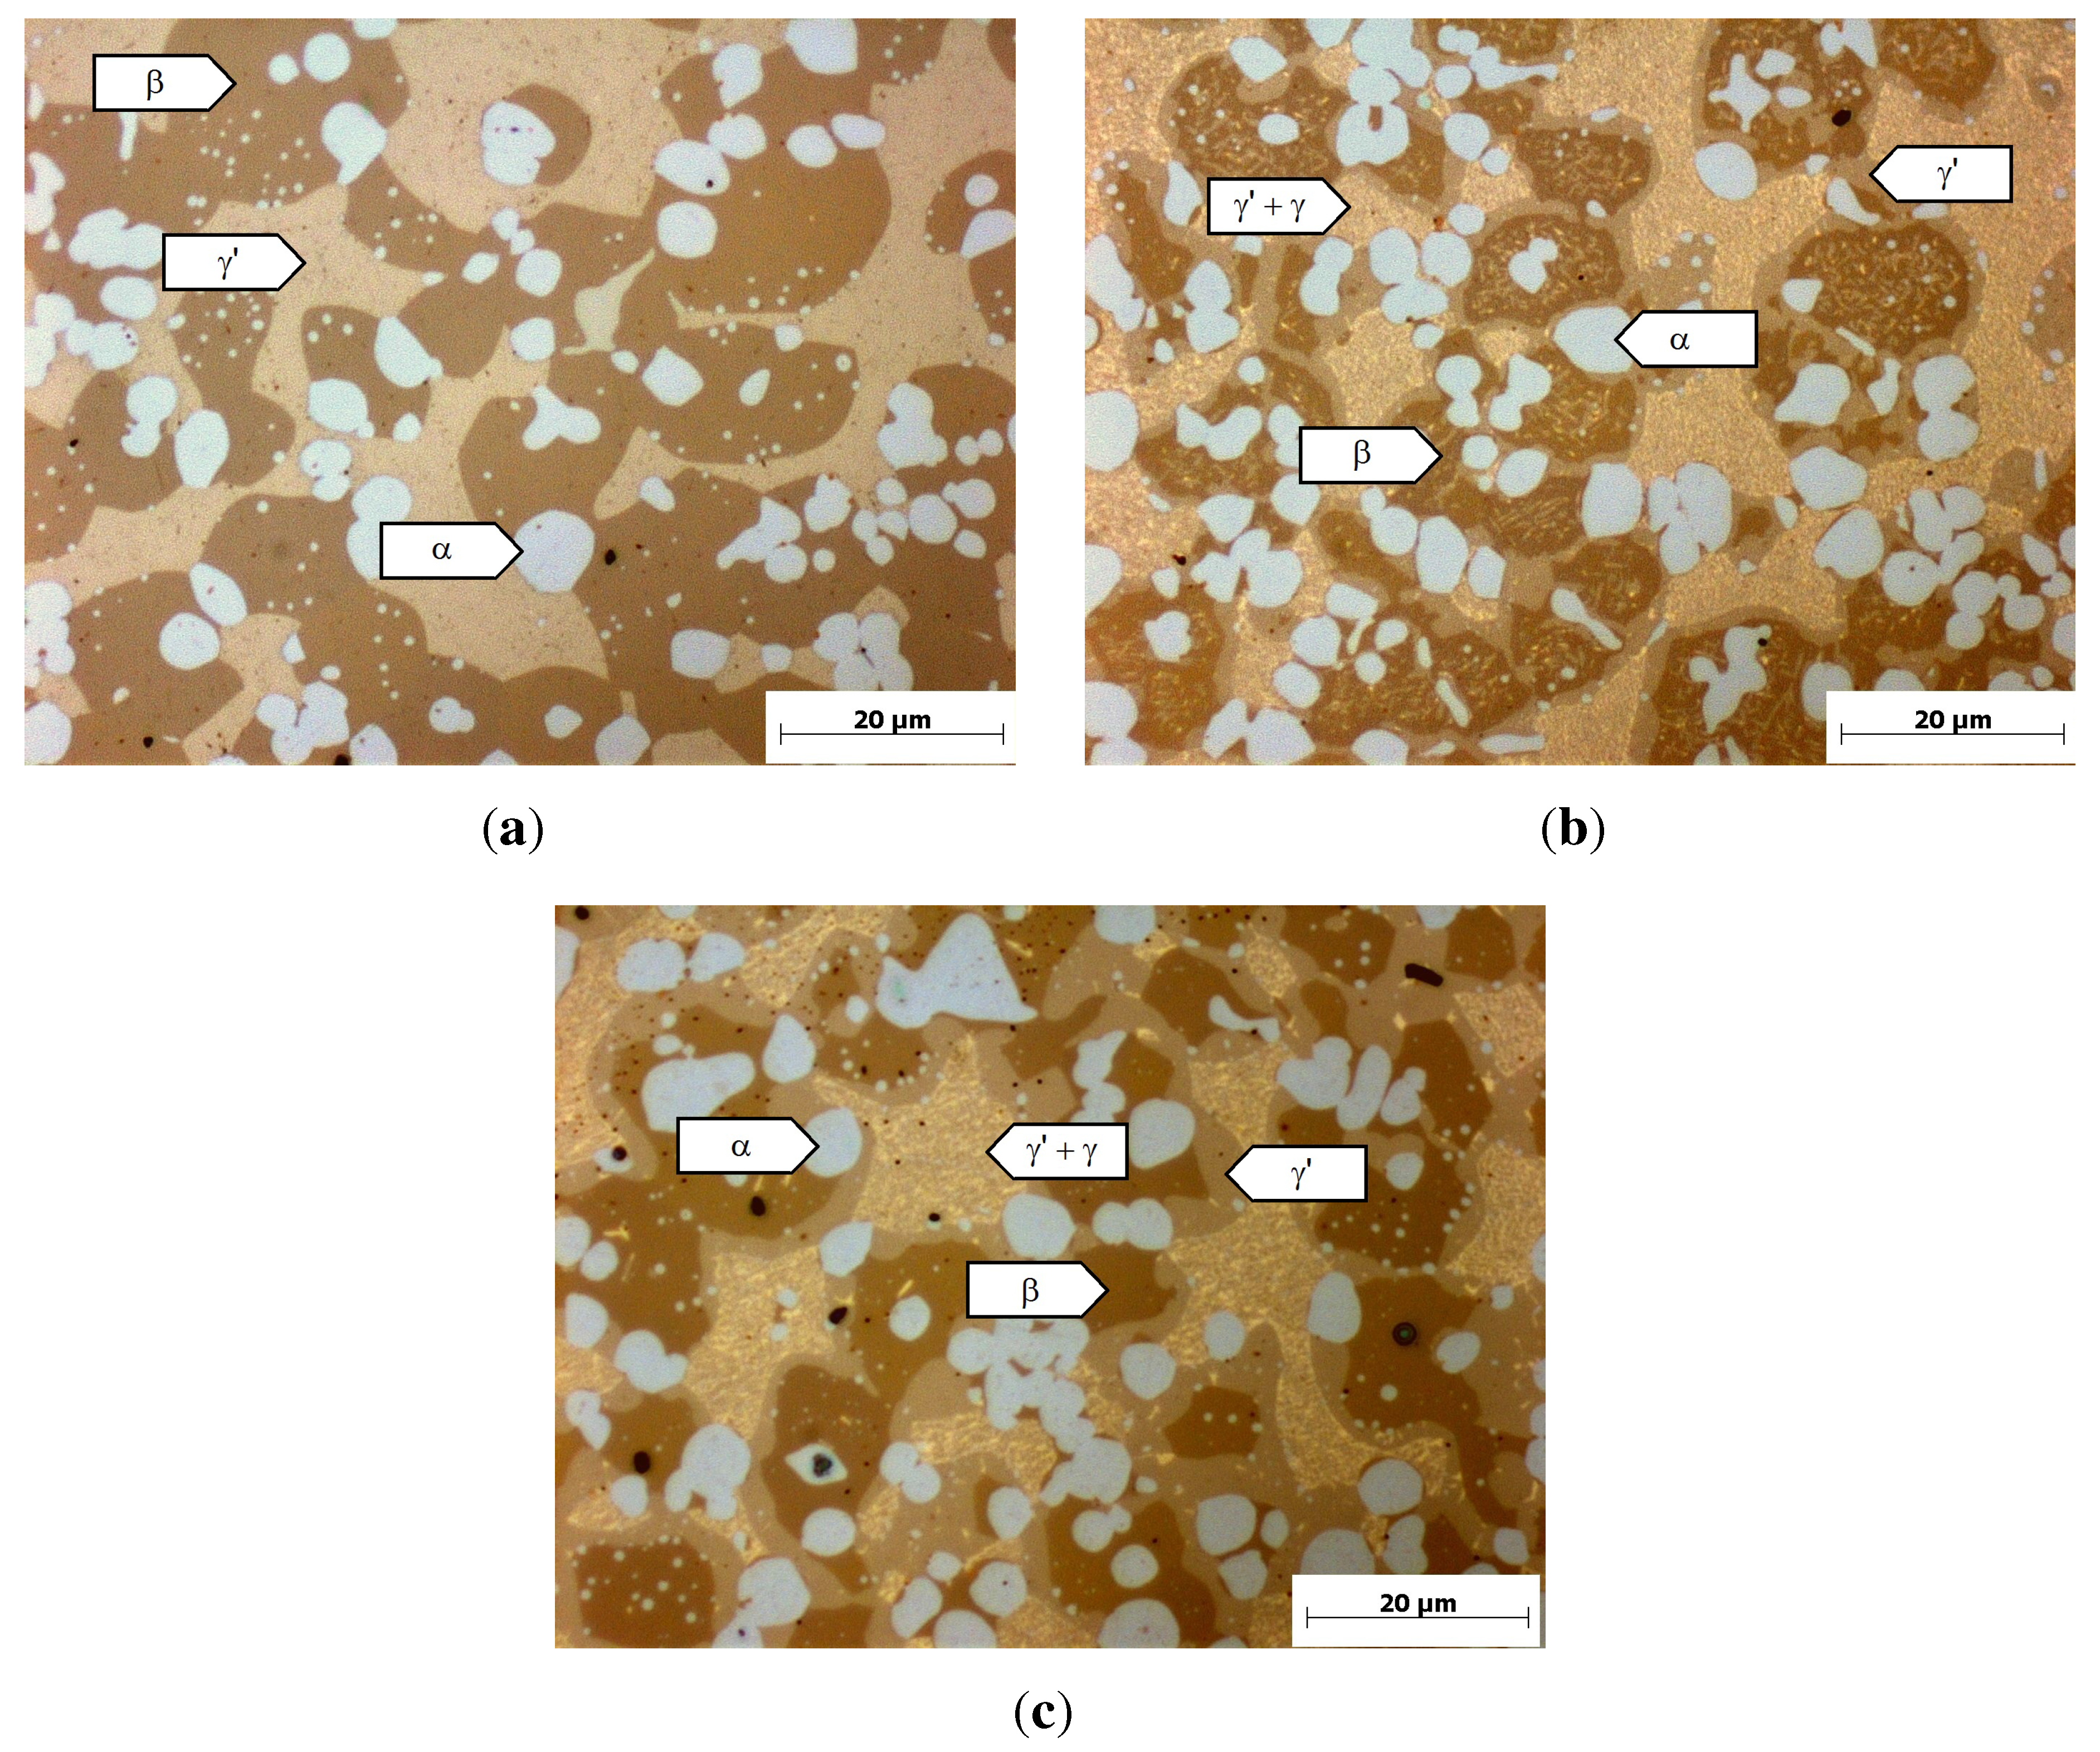
Figure 4). The microstructure of this alloy after homogenization is shown in
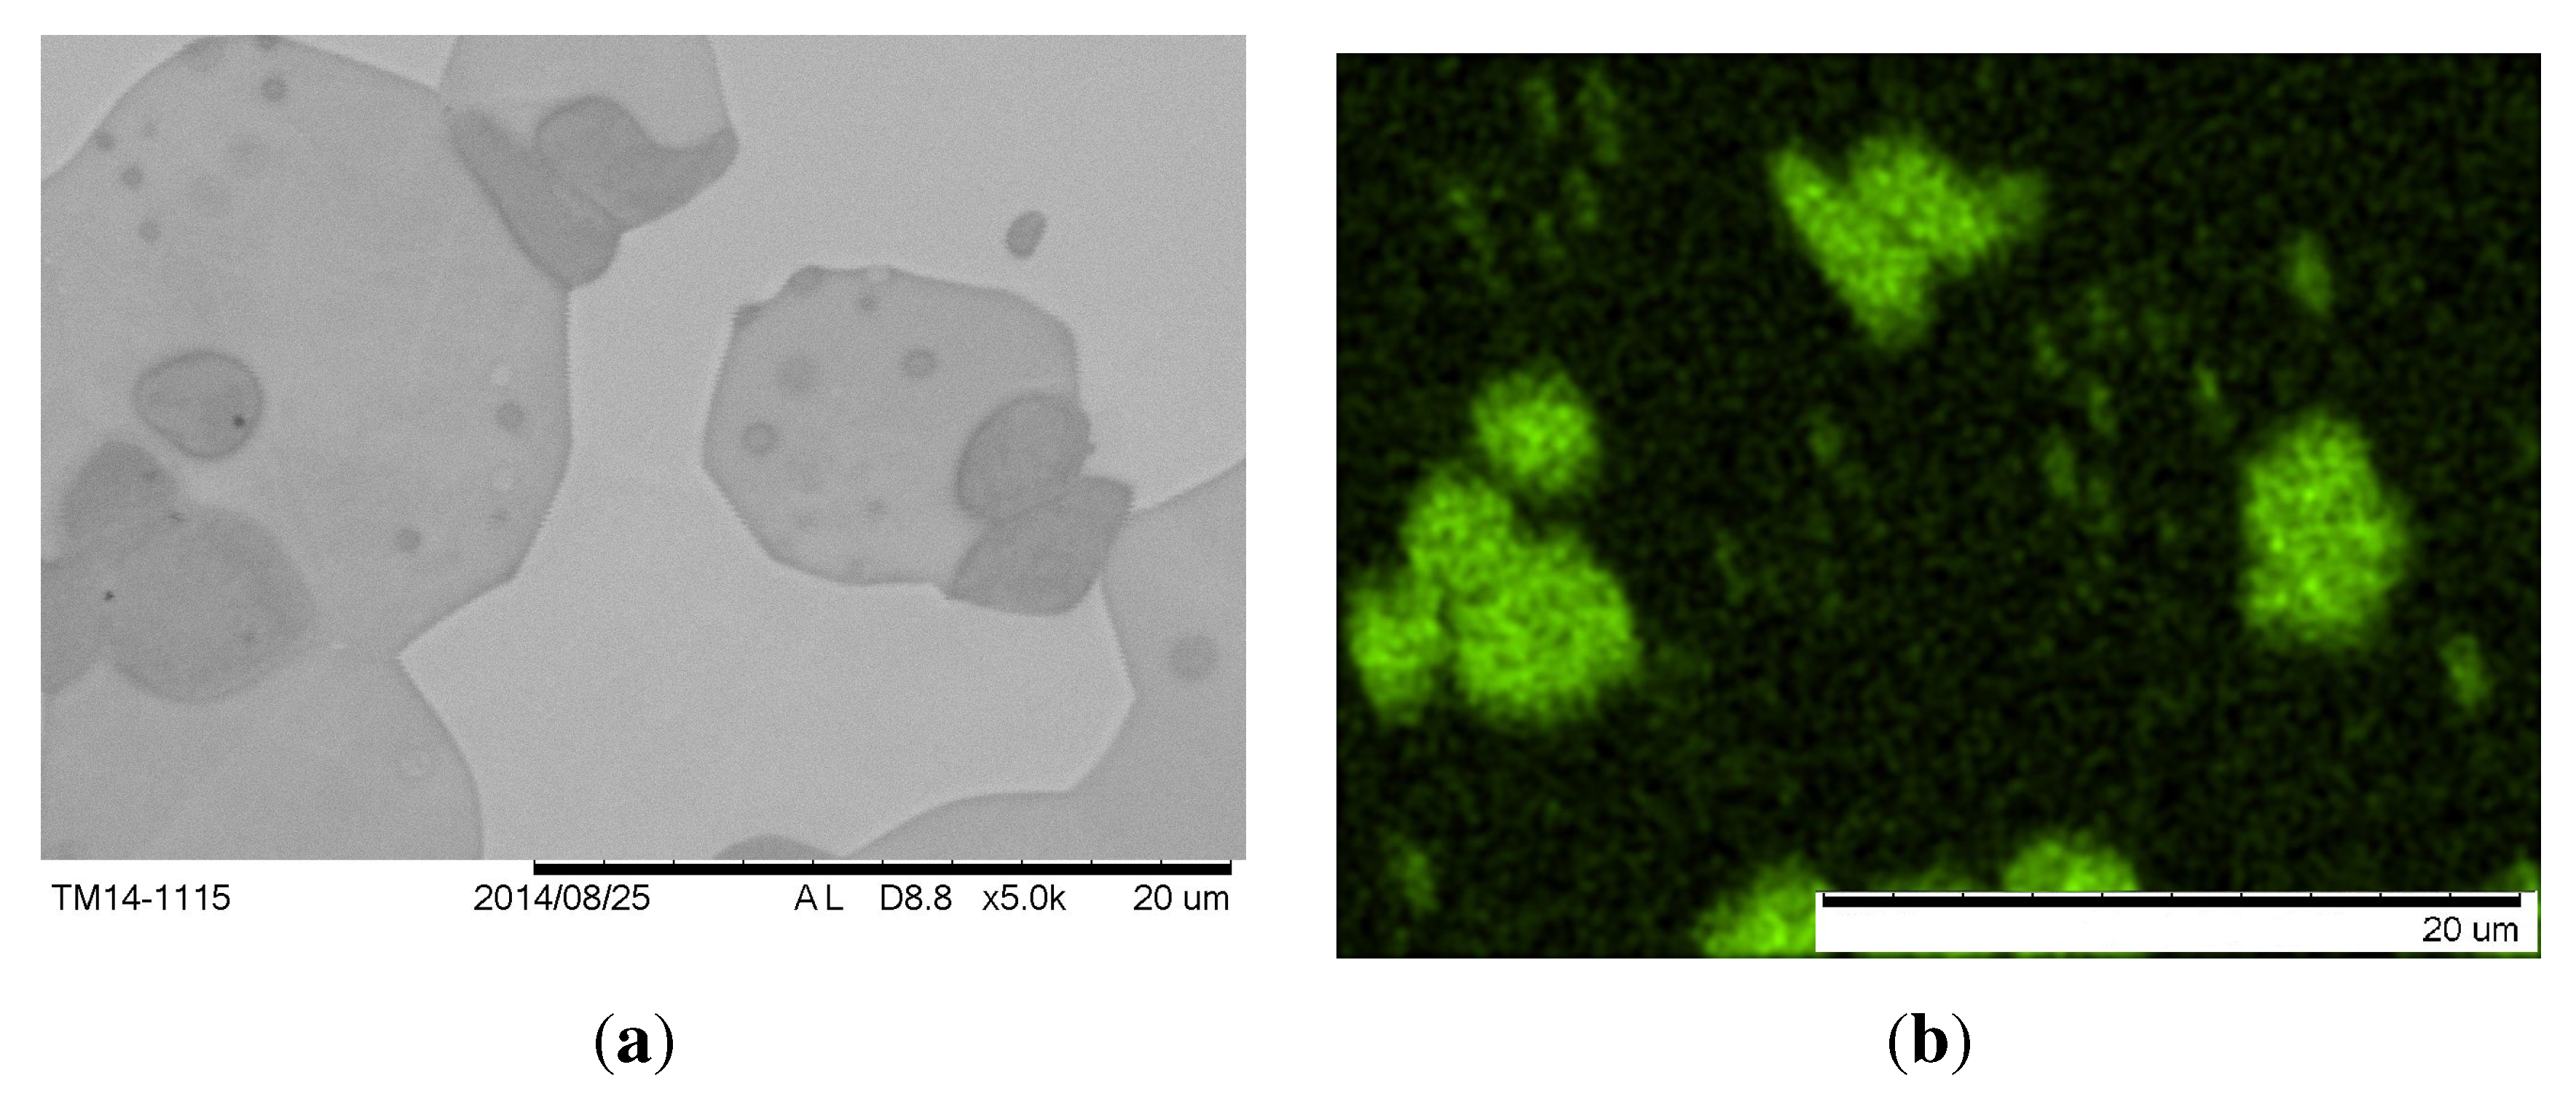
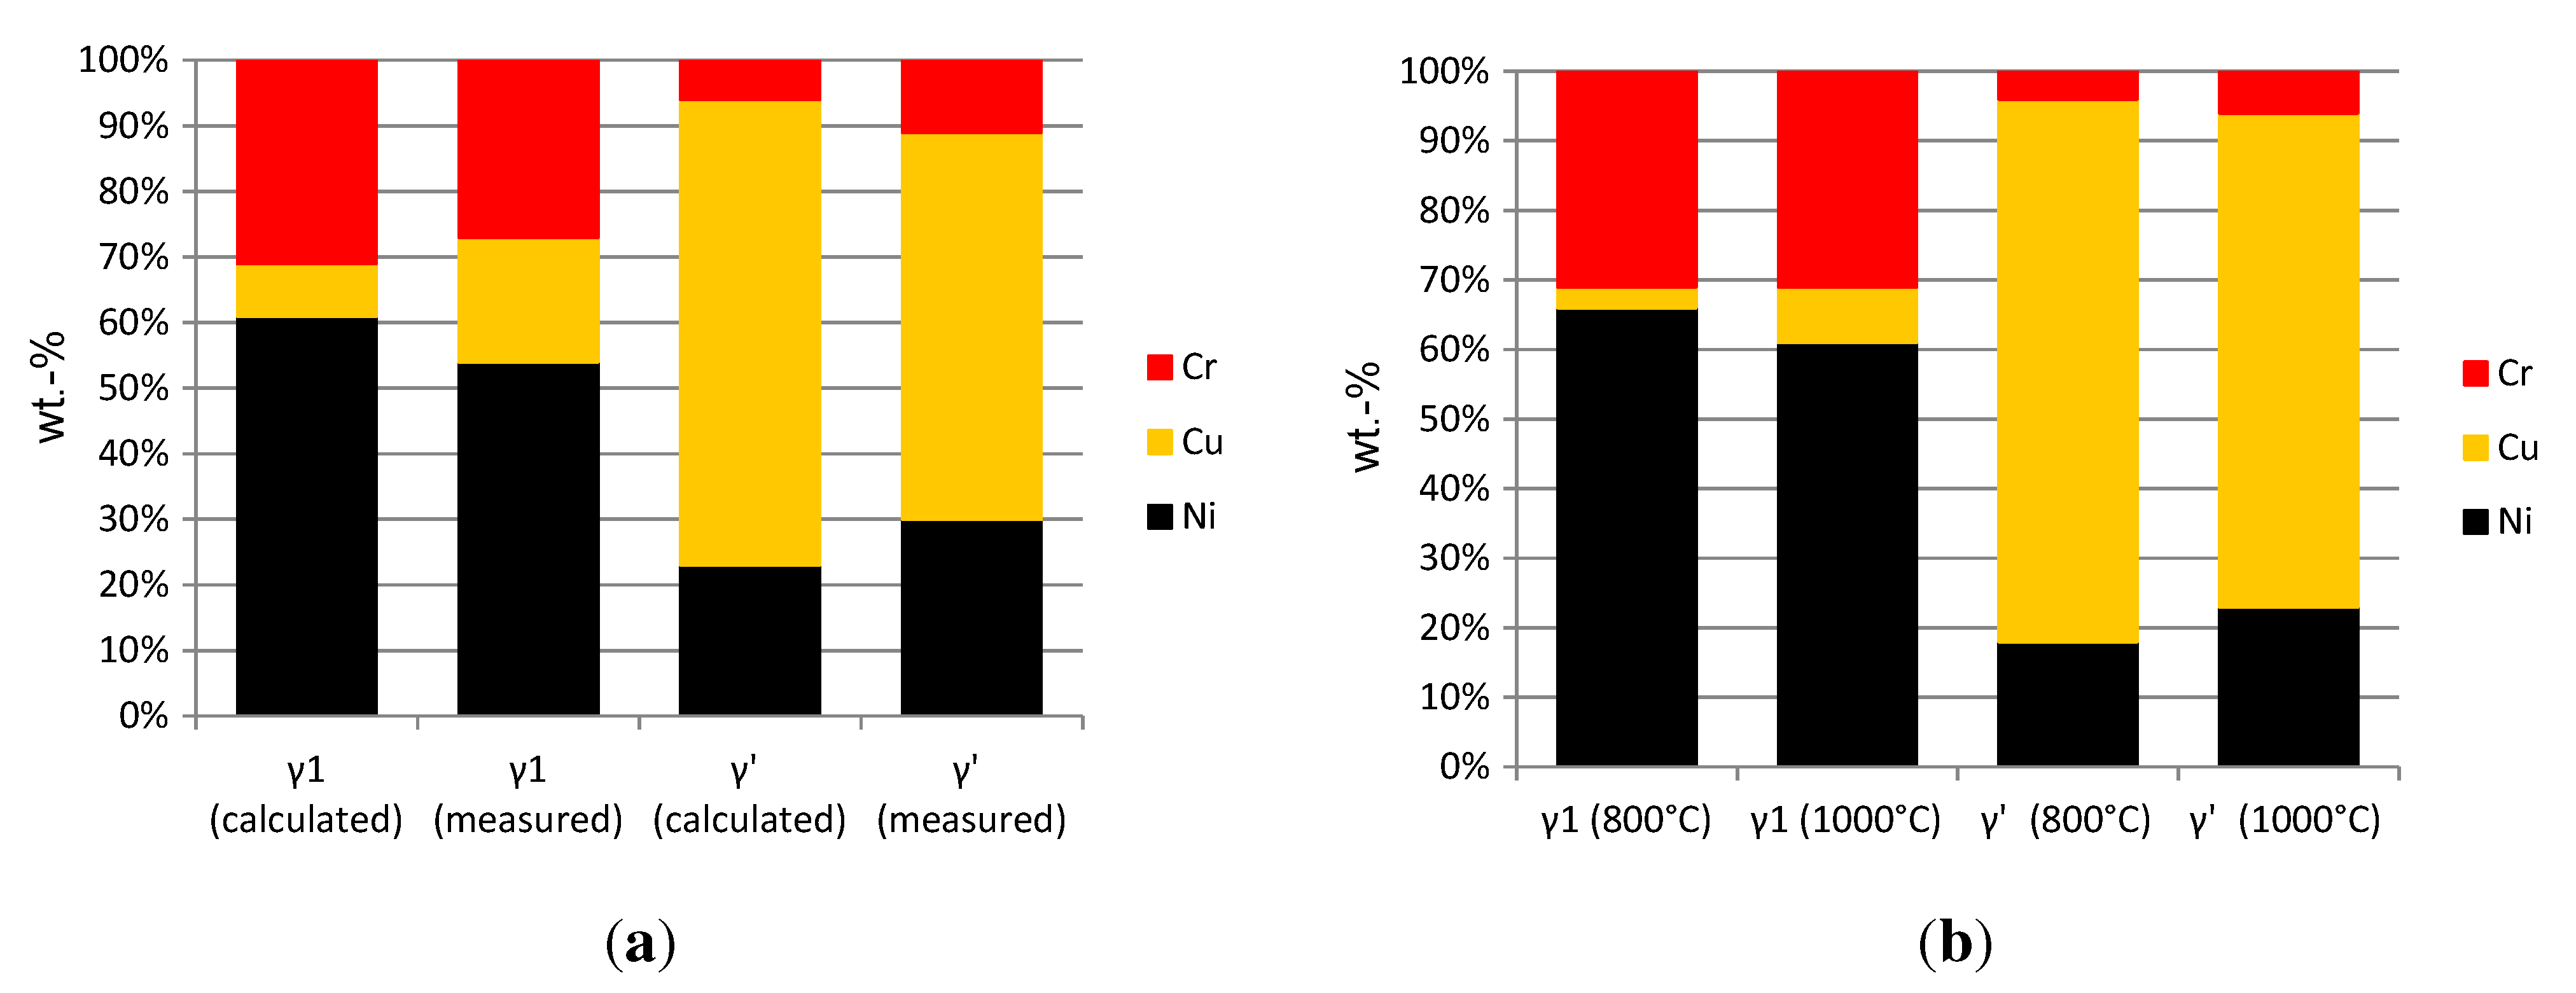
Figure 5(a). It consists of a dark brown dendritic phase with bright particles in a light-brown matrix. Due to the morphology of the phases, it can be expected that the dark brown phase and the white particles solidify at higher temperatures than the light brown phase. The white particles were identified with EDX as chromium precipitates (see
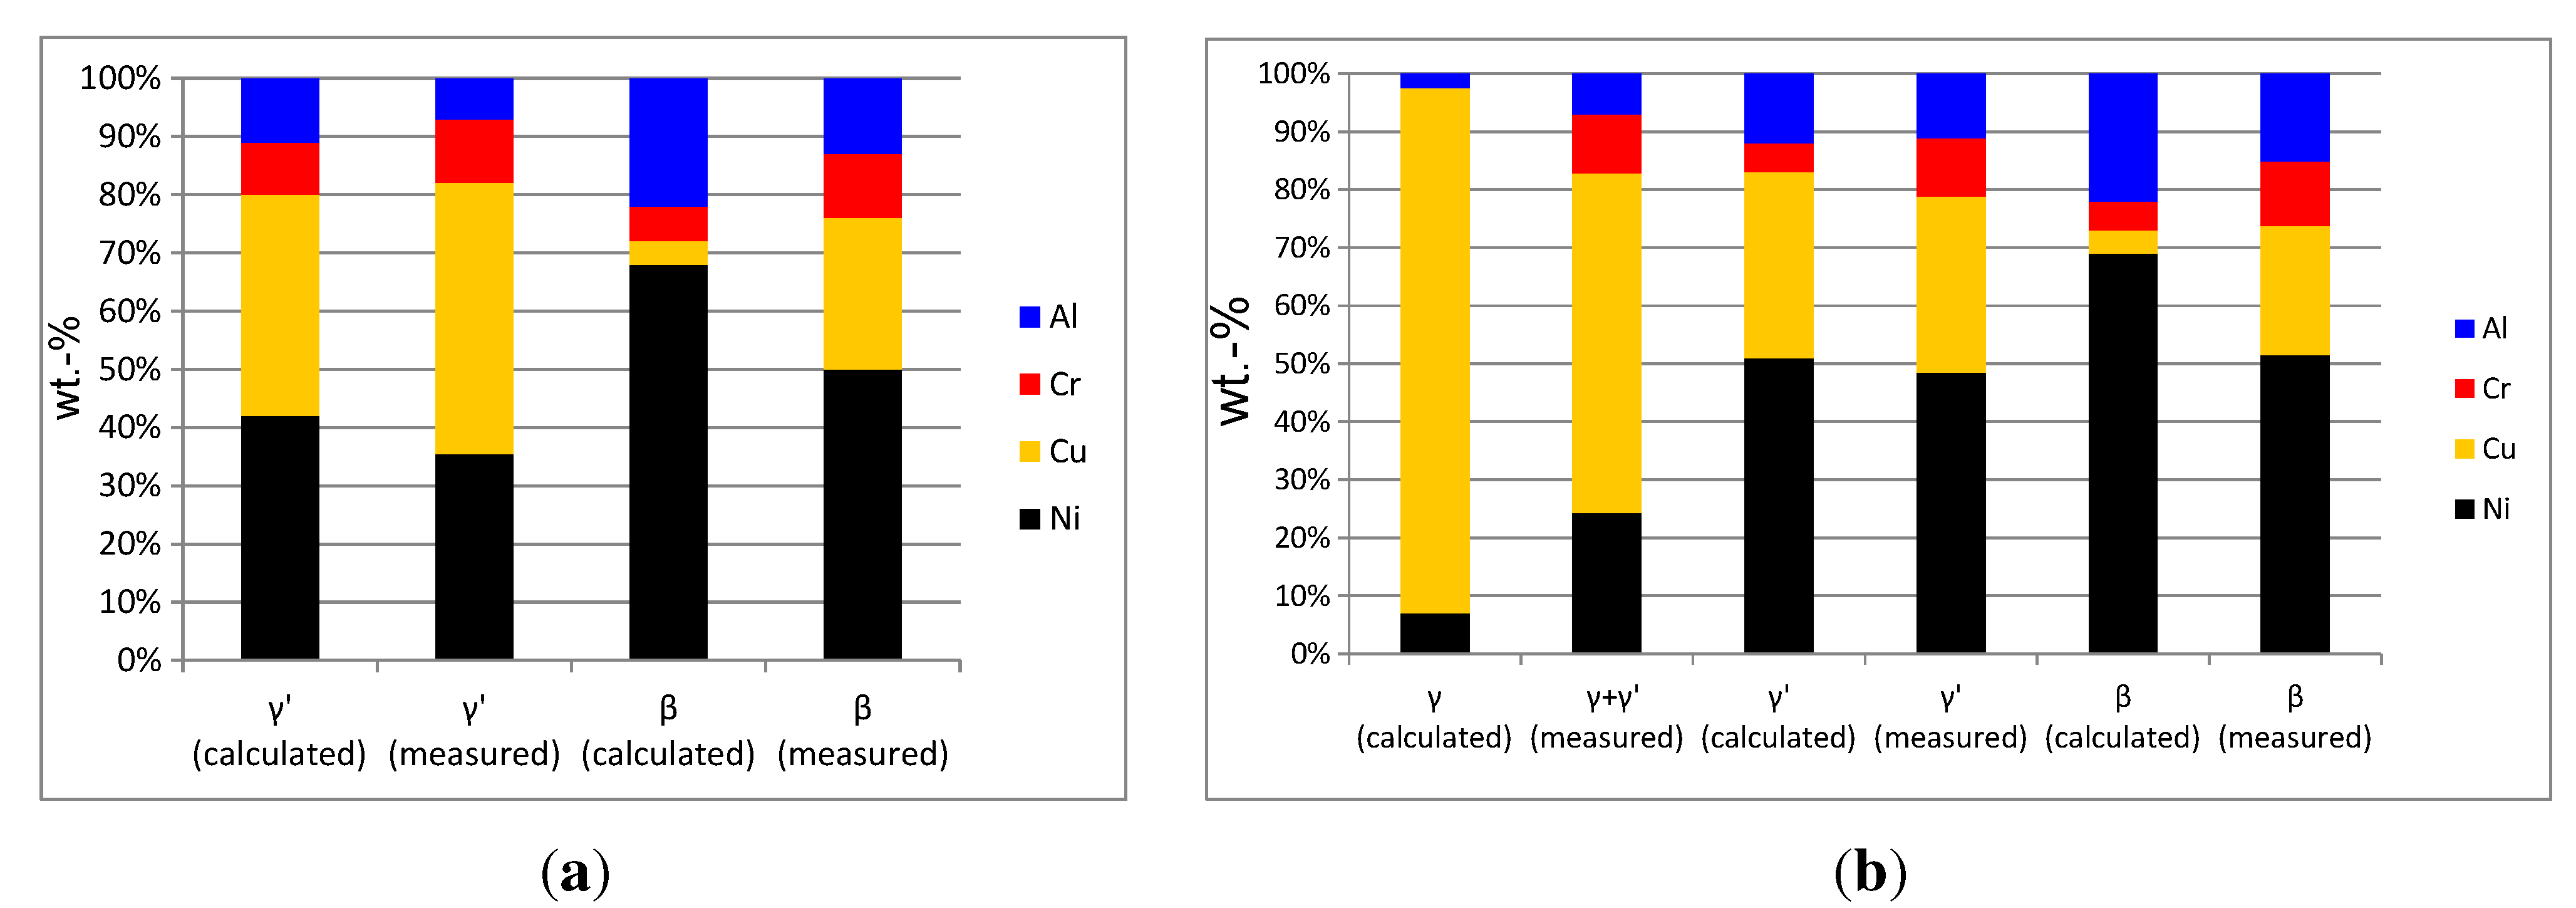
Figure 6). The light brown interdendritic phase has a measured composition similar to the calculated composition of the
γ’-phase at 1000 °C (
Figure 4(a)). The dark brown phase has a measured composition very different from the calculated composition of the
β-phase, but solidifies dendritically like the
β-phase in the calculation. Furthermore, a
β-phase has been observed elsewhere in the Ni-Cu-Al ternary system at 900 °C, even at aluminum contents below 10% [
21]. Hence, it can be assumed that the dark brown phase is actually
β.
Figure 4.
Phase compositions of the alloy Ni-30%Cu-22%Cr-10%Al: measured with EDX and calculated with Thermo-Calc. (a) Calculated phase-compositions and measured compositions at 1000 °C; (b) calculated phase-compositions and measured compositions at 800 °C. γ and γ’ in the interdendritic area could not be analyzed separately due to the poor resolution of EDX.
After heat treatment at 800 °C (
Figure 5), a light brown phase forms within the interdendritic
γ’-phase. Due to the poor resolution of the EDX-measurements, this phase could not be analyzed without the influence of the surrounding
γ’-phase. The measured composition of these two phases (
γ +
γ’ in
Figure 4(b)) seems to be a mixture between the calculated composition of the
γ and
γ’-phase. Hence, it can be assumed that at 800 °C, a
γ-phase precipitates within the interdendritic
γ’-phase, agreeing with the Thermo-Calc calculations in
Figure 1(b). Furthermore, a margin around the dark particles was observed at 800 °C, which grows bigger with increasing heat-treatment time. Comparing the location of the small white chromium-particles after homogenization (
Figure 5(a)) and after heat treatment at 800 °C (
Figure 5), the margin seems to form only out of the
β-phase. EDX-measurements at the margin phase show good agreement with the calculated composition of the
γ’-phase (
Figure 4(b)).
Summing up, the Thermo-Calc calculations show a qualitative agreement with the observed microstructure. Only the quantitative values of phase-composition and fractions differ from the observed values. The reference-alloy with 30% copper consists of a large amount of
β-,
α- and
γ’-phase in the homogenized state. At 800 °C, the
γ’-phase forms out of the
β-phase. This phase transition will lead to a volumetric change due to the different crystallographic structure [
14]. This volumetric change might cause internal stresses. In standard NiCrAlY-alloys, like Ni-22%Cr-10%Al, this has not to be considered, because the phase reaction takes place at 985 ° (see Section 3.1). Furthermore, the CTE of
α (9 × 10
−6 K
−1 at 600 °C and 10 × 10
−6 K
−1 at 800 °C) [
8] is very low compared to the surrounding
γ-,
β- and
γ’-phase (>15 × 10
−6 K
−1 at 600 °C and 800 °C) [
8,
22] and will cause additional internal stresses and lower the resulting CTE of the alloy due to mixture rules. For further alloy development, it might be therefore necessary to reduce the amount of
β and
α-phase.
Figure 5.
Optical micrograph of the alloy Ni-30%Cu-22%Cr-10%Al after different heat treatments, not etched. (a) Homogenization (1000 °C, 4 h); (b) 800 °C,4 h; (c) 800 °C, 100 h.
Figure 6.
SEM-image of the same sample as in
Figure 5(a). (
a) Back scattered electrons; (
b) X-ray signals of Cr-K
α.
2.2. Ni-30%Cu-22%Cr
The reference alloy has been modified by adding 30%Cu in the previous section, where an inappropriate amount of α- and β-phase was found, which has to be reduced in further alloy development. The easiest way to eliminate the β-phase in the microstructure is to reduce the aluminum content of the alloy.
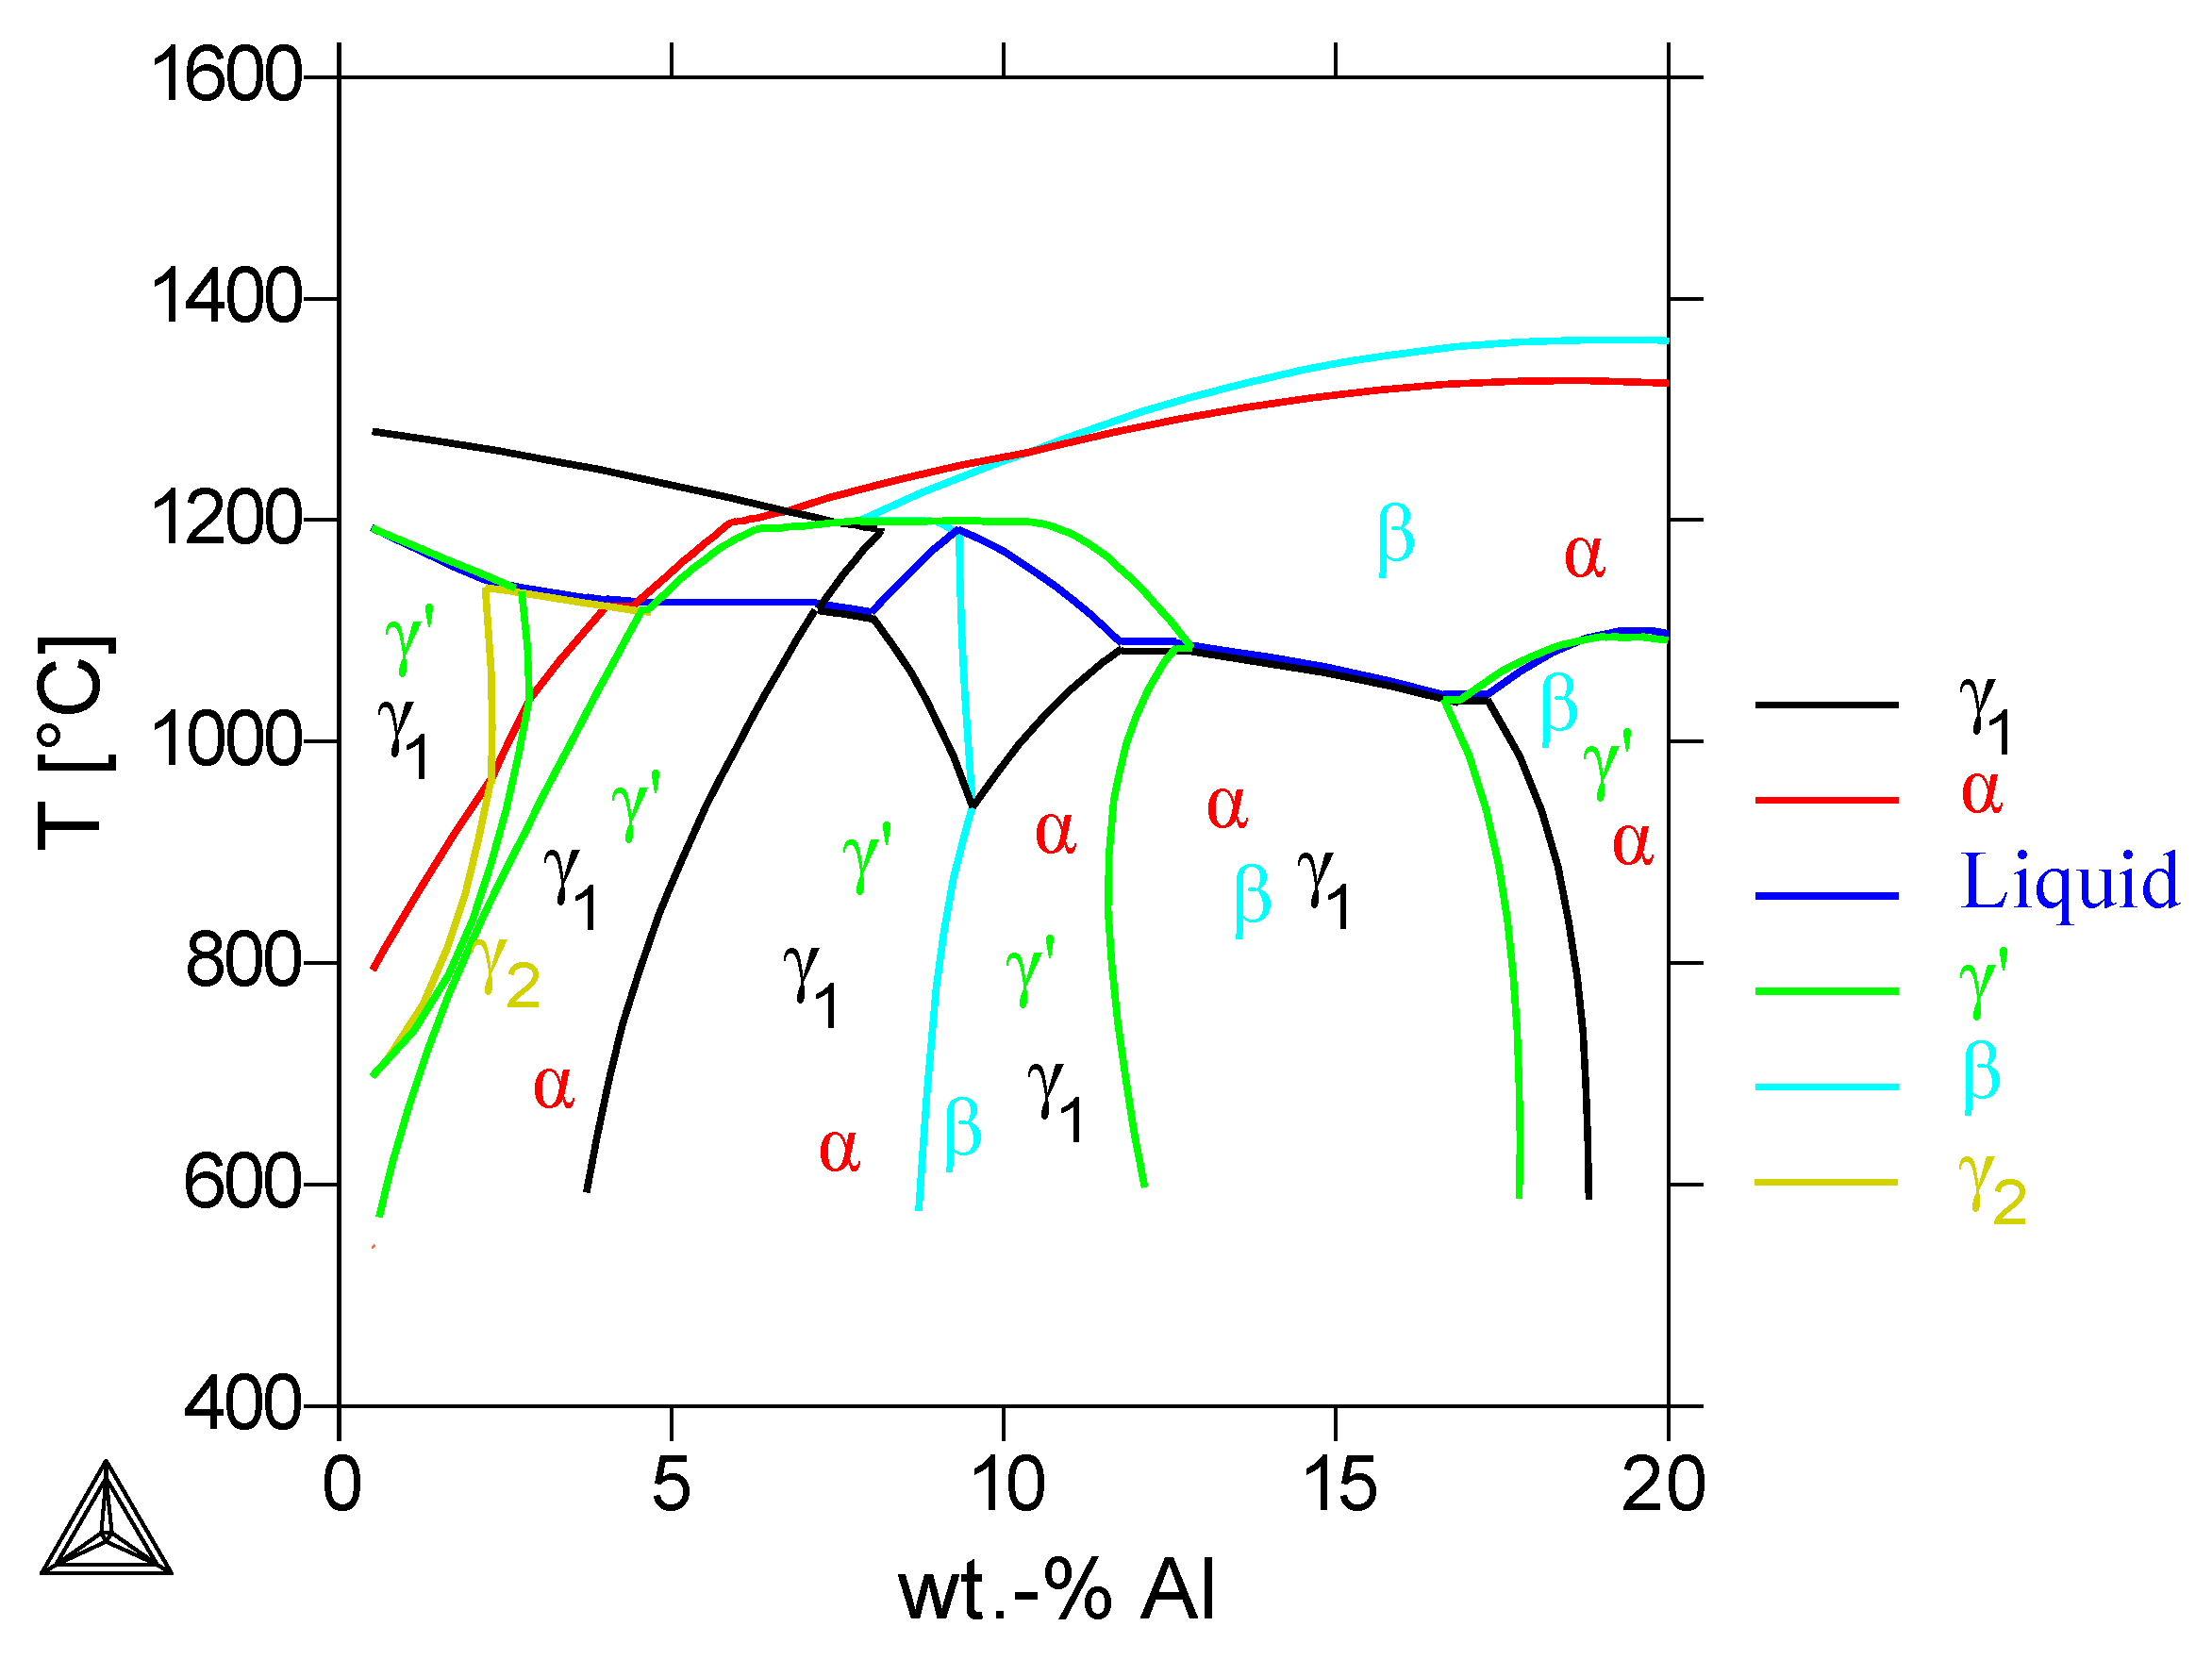
The Thermo-Calc calculations in
Figure 7 with the Alloy Ni-30%Cu-22%Cr and variable Al-content showed that an Al-content below 8% prevents the formation of the
β-phase. According to the calculations, a further reduction of the Al-content below 4% leads to the formation of a second, Cu-rich
γ2-phase. Since most of the copper is dissolved in this
γ2-phase, the Ni-rich
γ1-phase is able to dissolve the chromium. Furthermore, the loss of aluminum increases the total amount of the
γ1-phase, so that the
α-Cr-phase destabilizes with the lower Al-content of the alloy. Therefore, one approach for the coating development was to investigate a coating alloy without aluminum, in this case the alloy Ni-30%Cu-22%Cr. Although NiCrAlY bond-coats originally protect the substrate against oxidation by forming a dense Al-oxide layer, it is assumed that the Al-free alloy will form a Cr-oxide layer, which will be sufficient for the short-time hot-gas exposure in rocket engines [
12].
Figure 7.
Pseudobinary phase diagram calculated by Thermo-Calc of the alloy Ni-30%Cu-22%Cr with variable Al-content. The stable phases are marked with their symbol, phase boundaries with the corresponding color.
The DSC measurements of the Al-free alloy showed no detectable phase reaction below 1140 °C. The solidus temperature is 1255 °C.
The microstructure after annealing at 1000 °C and etching with molybdic acid is shown in
Figure 9(a). It consists of a dendritic phase and an interdendritic phase, which is etched by molybdic acid. The fraction of the phases was measured via optical image analysis; the dendritic phase has a fraction of approximately 70%, agreeing with the calculated value for the first solidifying Ni-rich
γ1-phase. The chemical composition of the dendritic phase measured with EDX is similar to the calculated composition of
γ1, and the measured composition of the interdendritic phase agrees with the calculation of the
γ’-phase, respectively (see
Figure 10(a)).
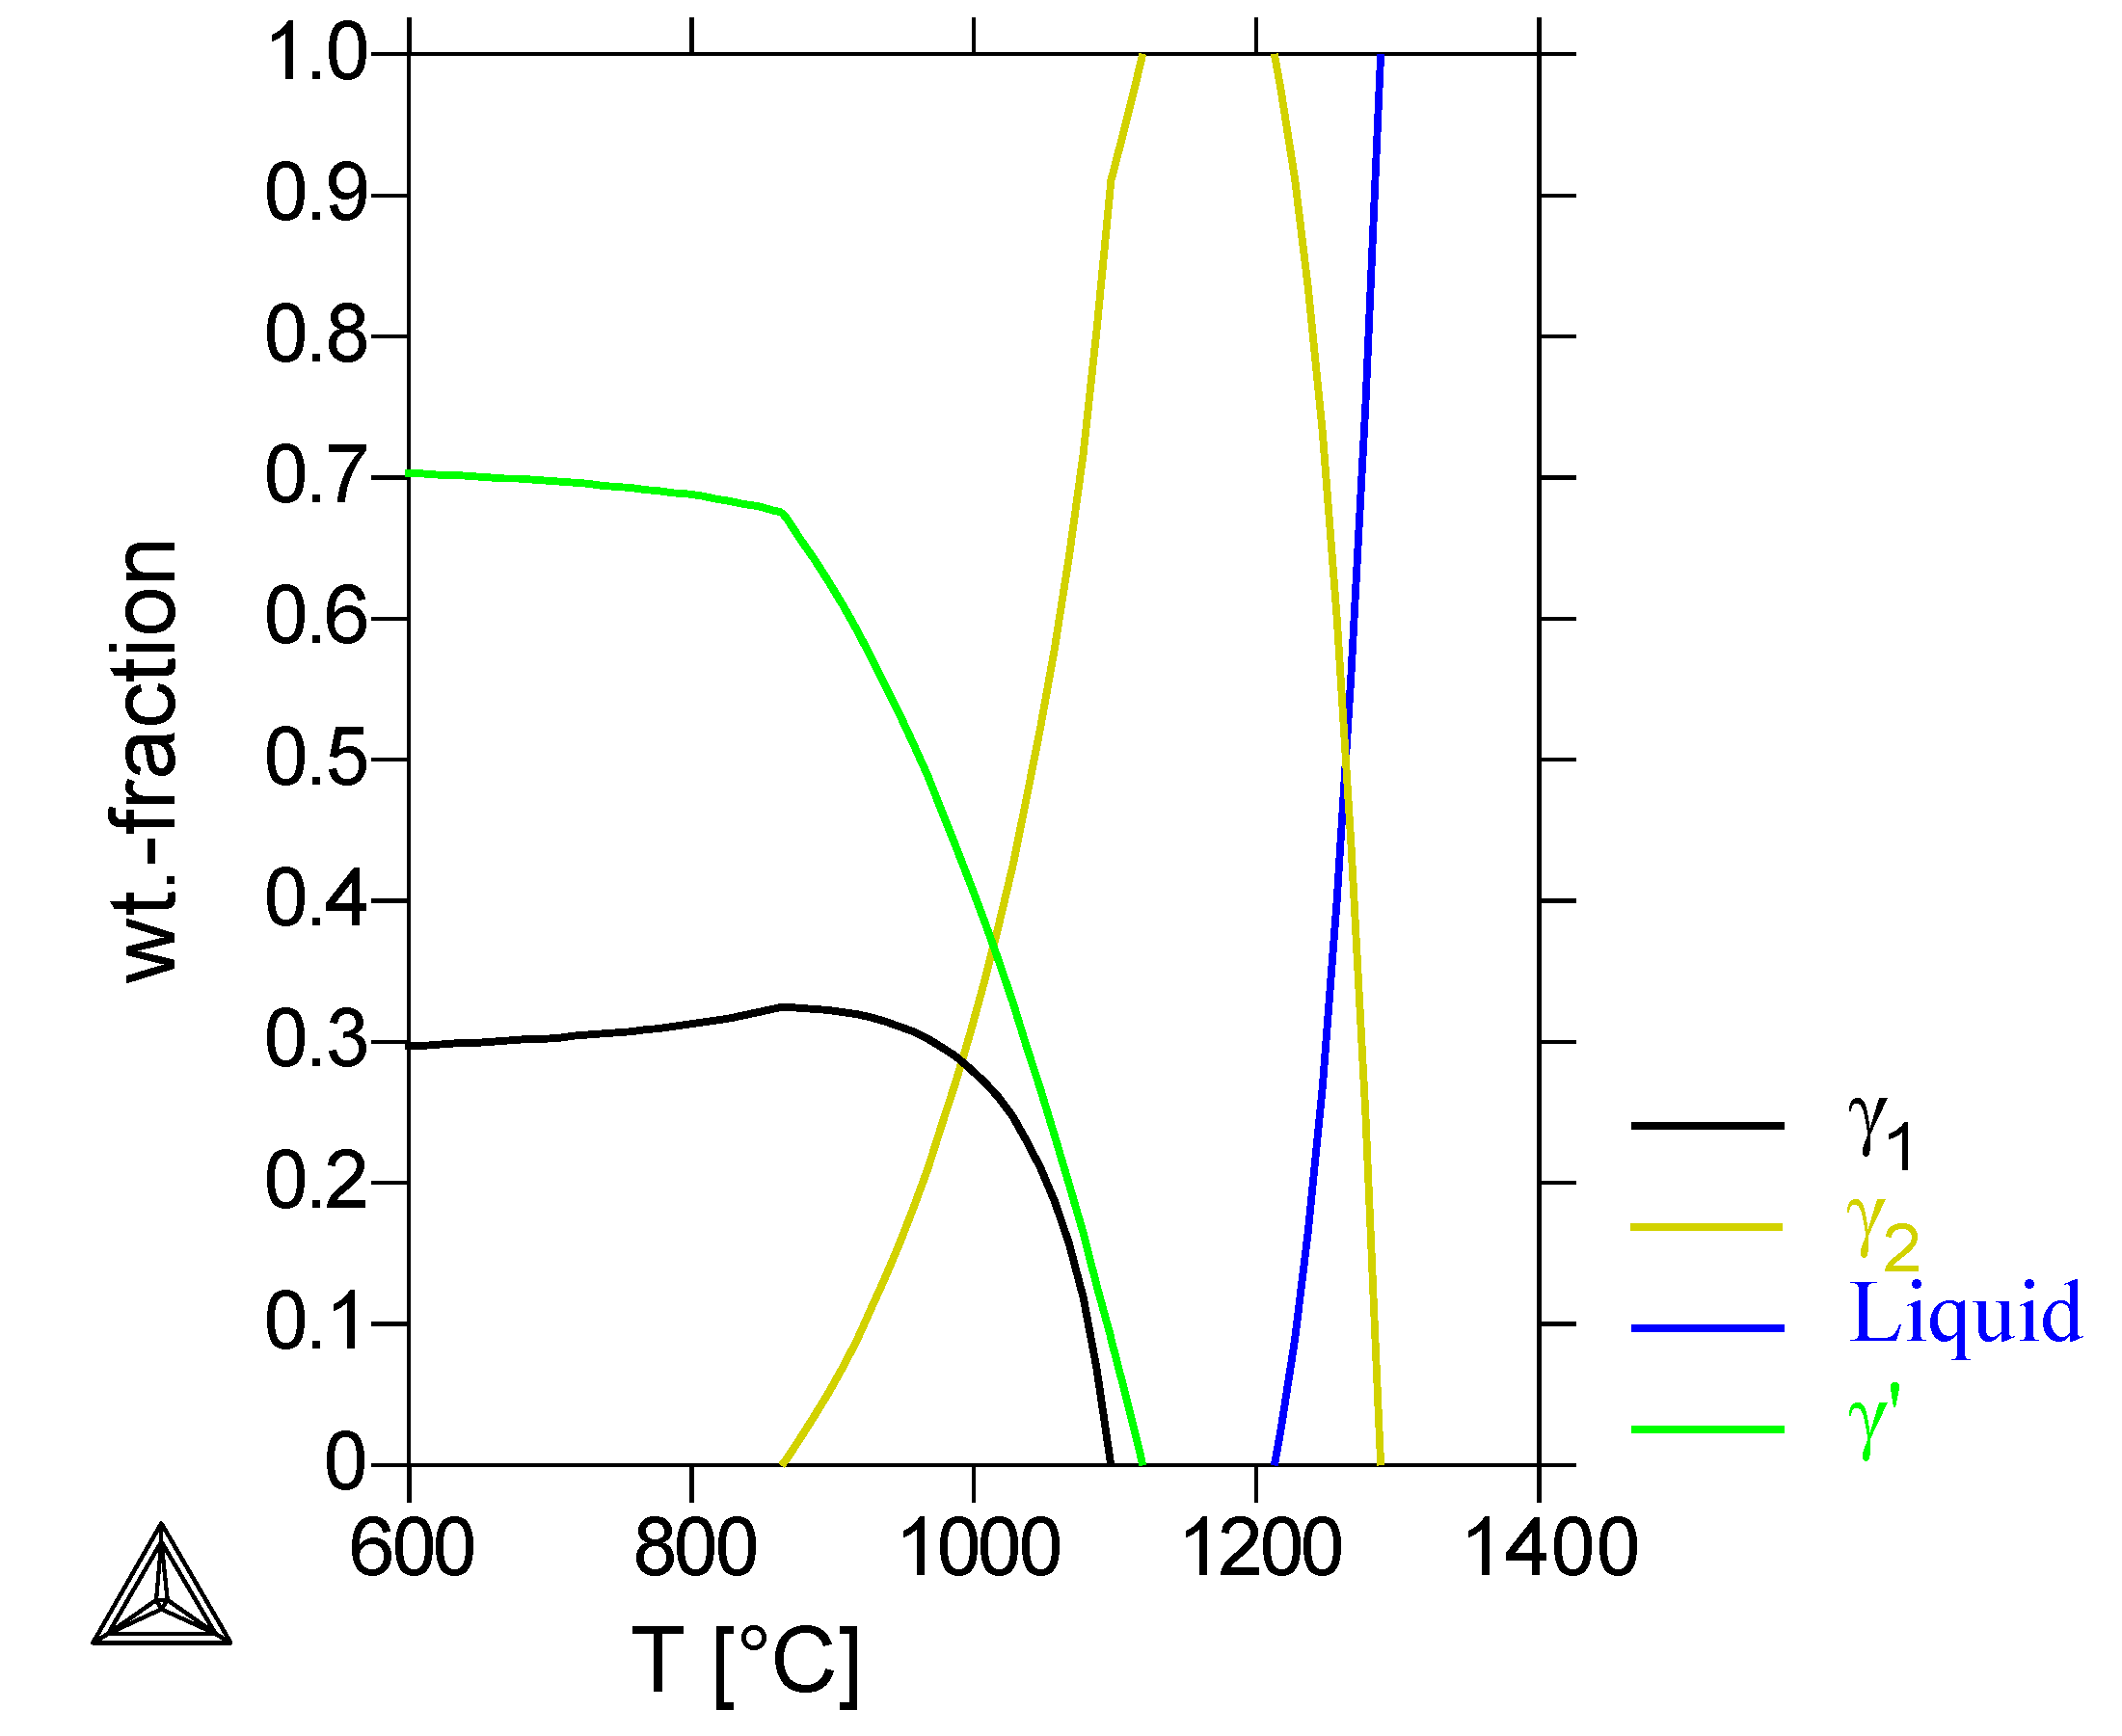
The Thermo-Calc calculation of the alloy Ni-30%Cu-22%Cr (
Figure 8) showed a two-phase system at temperatures of 800 °C and 1000 °C: a first solidifying Ni-rich
γ1-phase and a second Cu-rich
γ’-phase, solidifying at lower temperatures. The
γ’-phase converts into a
γ2-phase below 700 °C. The formation of the
α-Cr phase is calculated only at temperatures below 750 °C, while in the ternary phase diagram [
23], the Cr-phase is even present at temperatures above 900 °C.
Figure 8.
Thermo-Calc calculations for the alloy Ni-30%Cu-22%Cr.
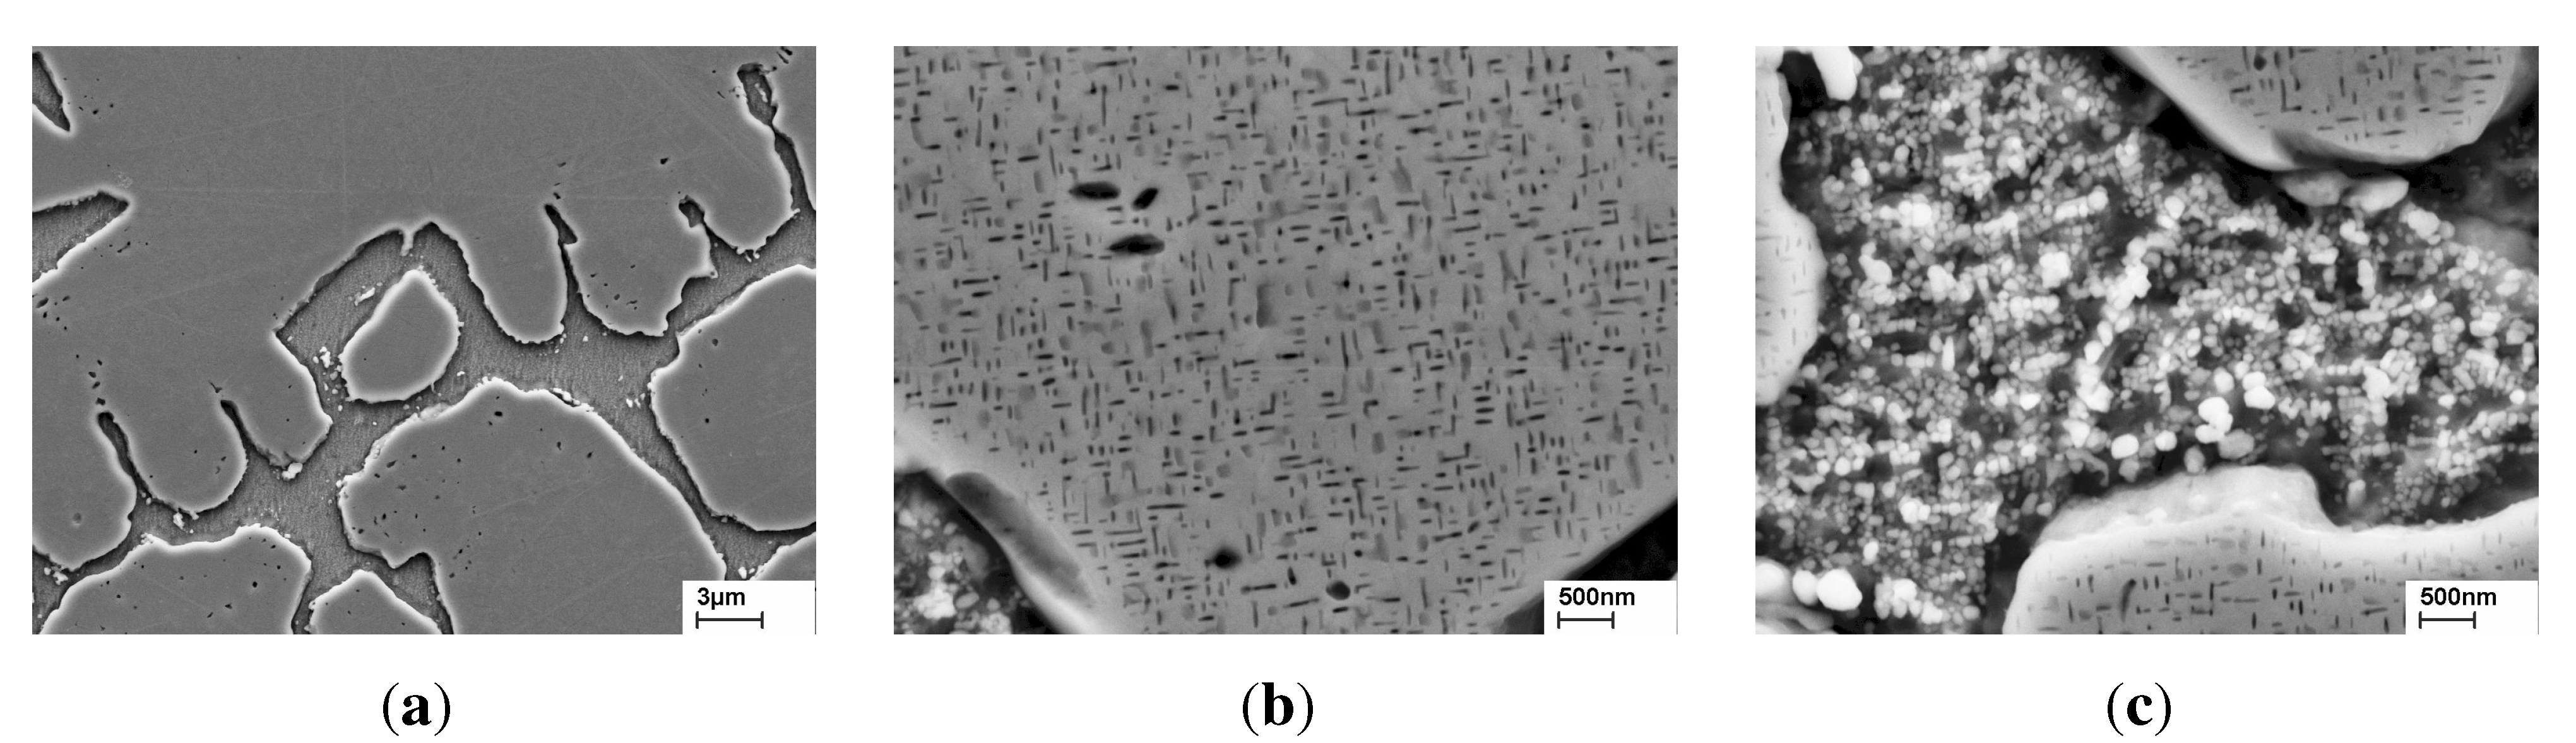
Figure 9.
SEM-images (secondary electrons) of the alloy Ni-30%Cu-22%Cr after different heat treatments. Etched with molybdic acid. (a) Homogenization (1000 °C, 4 h); (b) 800 °C, 4 h, plate-shaped precipitates in the dendritic area; (c) 800 °C, 4 h, spherical precipitates in the interdendritic area.
After heat treatment at 800 °C (
Figure 9(b)), plate-shaped precipitates in the
γ1-phase were observed, which are etched by molybdic acid. In the interdendritic area, spherical precipitates are formed, which are not etched by molybdic acid. Due to the small particle-size, no EDX analysis was possible, since the resolution of EDX is limited to the micrometer scale. The Thermo-Calc calculations showed a decrease of Cu- and an increase of Ni-content in the
γ1-phase with lower temperatures (
Figure 10(b)). Therefore, a Cu-rich phase may form out of the
γ1-phase by heat treatment at 800 °C. Since the precipitates in
Figure 9(b) are coherent and no phase transition is predicted, it can be assumed that this is the Cu-rich
γ’-phase, like in the interdendritic area at 1000 °C. For the interdendritic area, the precipitation of a Ni-rich
γ1-phase could be assumed analogical.
Finally, the hardness of the alloy was measured. After annealing at 1000 °C, the alloy has nearly the same hardness (154 HV 1) as after heat treatment at 800 °C (158 HV 1). Hence, the nanoscale precipitates in the heat treated sample do not harden the material, so they must be coherent with a crystallographic structure and lattice parameter very similar to the matrix material. However, this is in conflict with the shape of the precipitates in the
γ1-phase, as one would expect a spherical or cubic shape of the precipitates in the absence of a lattice parameter misfit [
14]. Thus, further work has to take place to elucidate the precipitation reaction taking place at 800 °C.
Figure 10.
Phase compositions of the alloy Ni-30 Cu-22%Cr: measured with EDX and calculated with Thermo-Calc. (a) Calculated phase-compositions vs. measured compositions at 1000 °C; (b) calculated phase-compositions at 800 °C and 1000 °C.
2.3. Ni-30%Cu-6%Al-5%Cr
In the previous section, an alloy without Al was investigated, where no α- and β-phase was observed. Although the Al might not be necessary in TBC-applications in rocket engines, this has not been demonstrated experimentally, so another possibility has to be considered, where an appropriate amount of Al is left to form an Al-oxide layer. In standard TBC-applications, the BC has to bring a large amount of Al and Cr to ensure a dense oxide layer over a long time, while the short heat exposure time in rocket engines does not make a large reservoir of Al and Cr necessary. To prove this experimentally, the Ni-30%Cu-alloy with Cr and Al content alike superalloys, in this case 6% Al and 5% Cr, was investigated.
The Thermo-Calc calculations shown in
Figure 11 predict a two-phase
γ1/
γ2-microstructure with the formation of
γ’ below 1100 °C. Below 900 °C, a
γ/
γ’-microstructure is formed.
Figure 11.
Thermo-Calc calculations for the alloy Ni-30%Cu-6%Al-5%Cr.
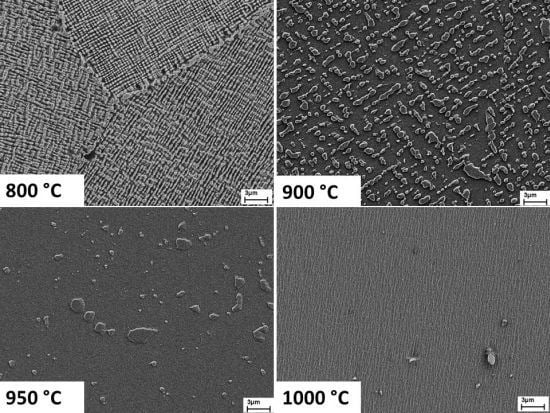
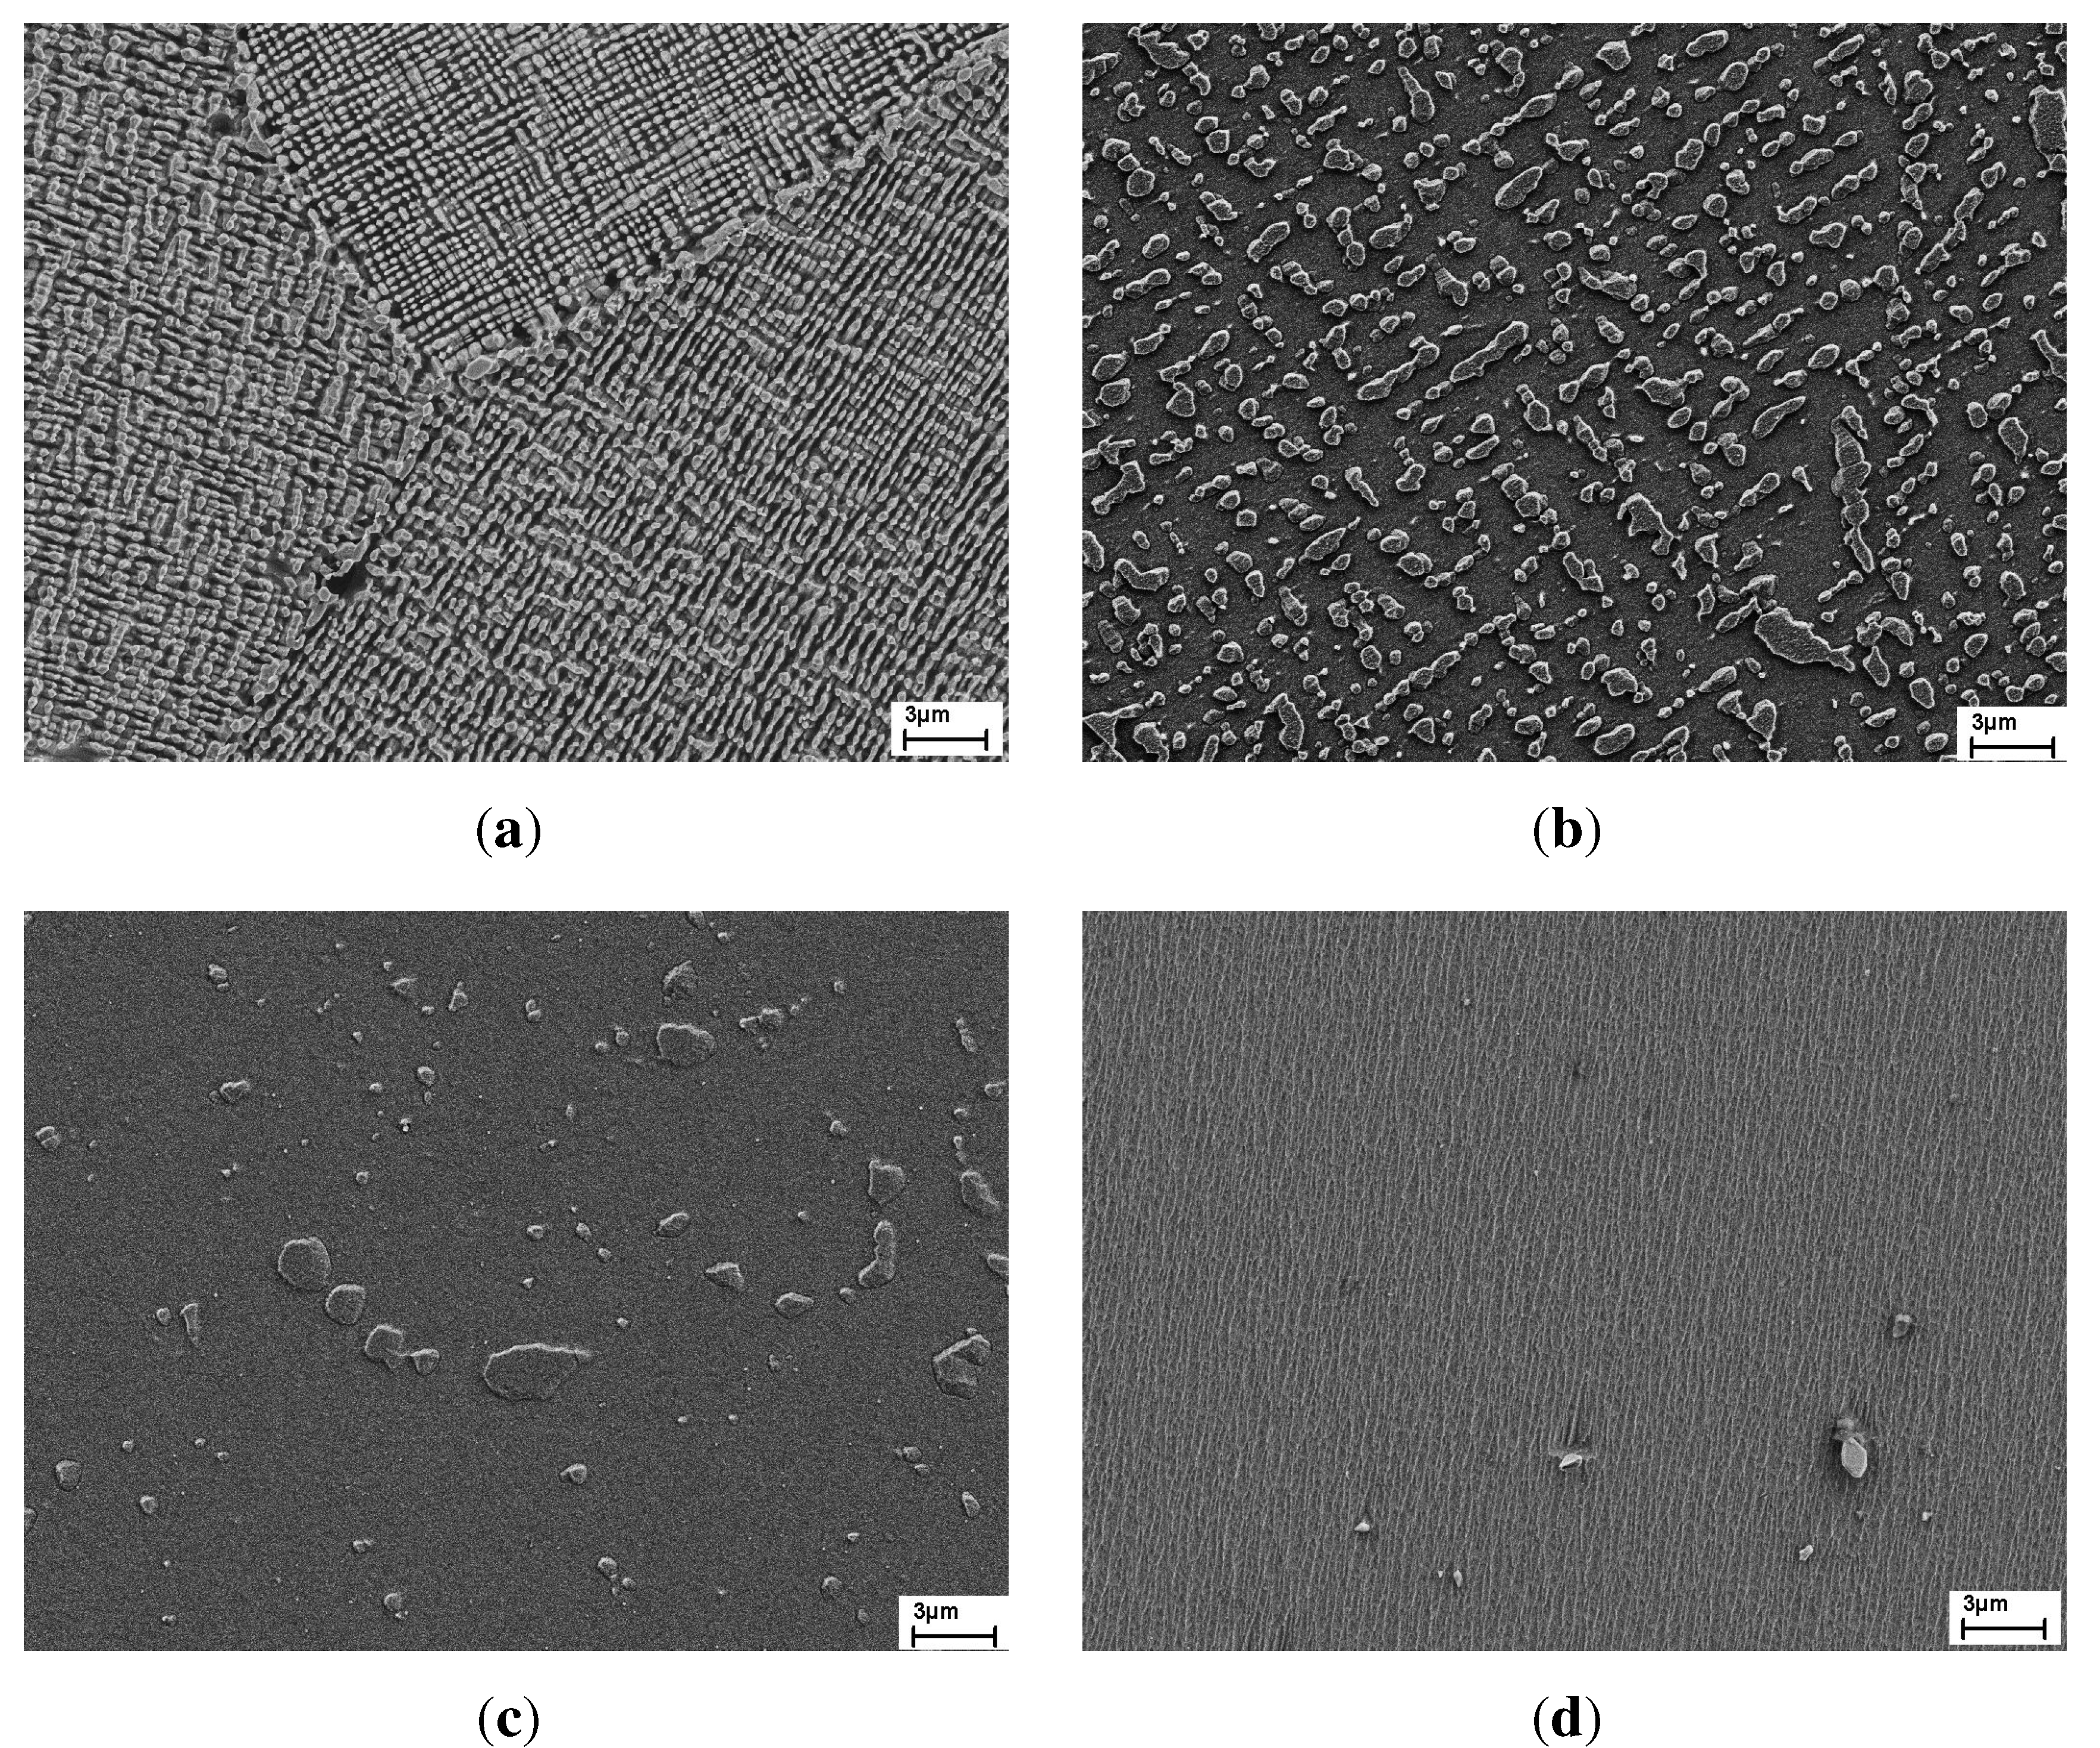
Figure 12.
SEM-images (secondary electrons) of the alloy Ni-30%Cu-6%Al-5%Cr after different heat treatments. Etched with Adler-reagent. (a) 800 °C, 100 h; (b) 900 °C, 100 h; (c) 950 °C, 100 h; (d) 1000 °C, 100 h.
Figure 12 shows the microstructure after different heat treatments. At 1000 °C, the material is nearly homogeneous with only a few precipitates with a size of approximately 1
µm. At lower temperatures, more of the second phase precipitates up to a volume fraction of approximately 50% at 800 °C. At 900 °C and below, the particles align themselves in a continuous pattern over the entire grain, so the precipitates must be coherent to the matrix phase. Though the resolution of EDX is in the range of the particle size at 950 °C, the measurements showed a higher Al-content and lower Cu-content in the precipitates compared to the matrix. Considering the Thermo-Calc calculations and the fact that the second phase has a higher Al-content than the matrix and precipitates coherently, the microstructure below 1000 °C can be identified as
γ/
γ’.
Calorimetric measurements show a reaction with small latent heat between 700 °C and 1000 °C, related to the precipitation of the γ’-phase. The solidus temperature of the alloy is 1260 °C.
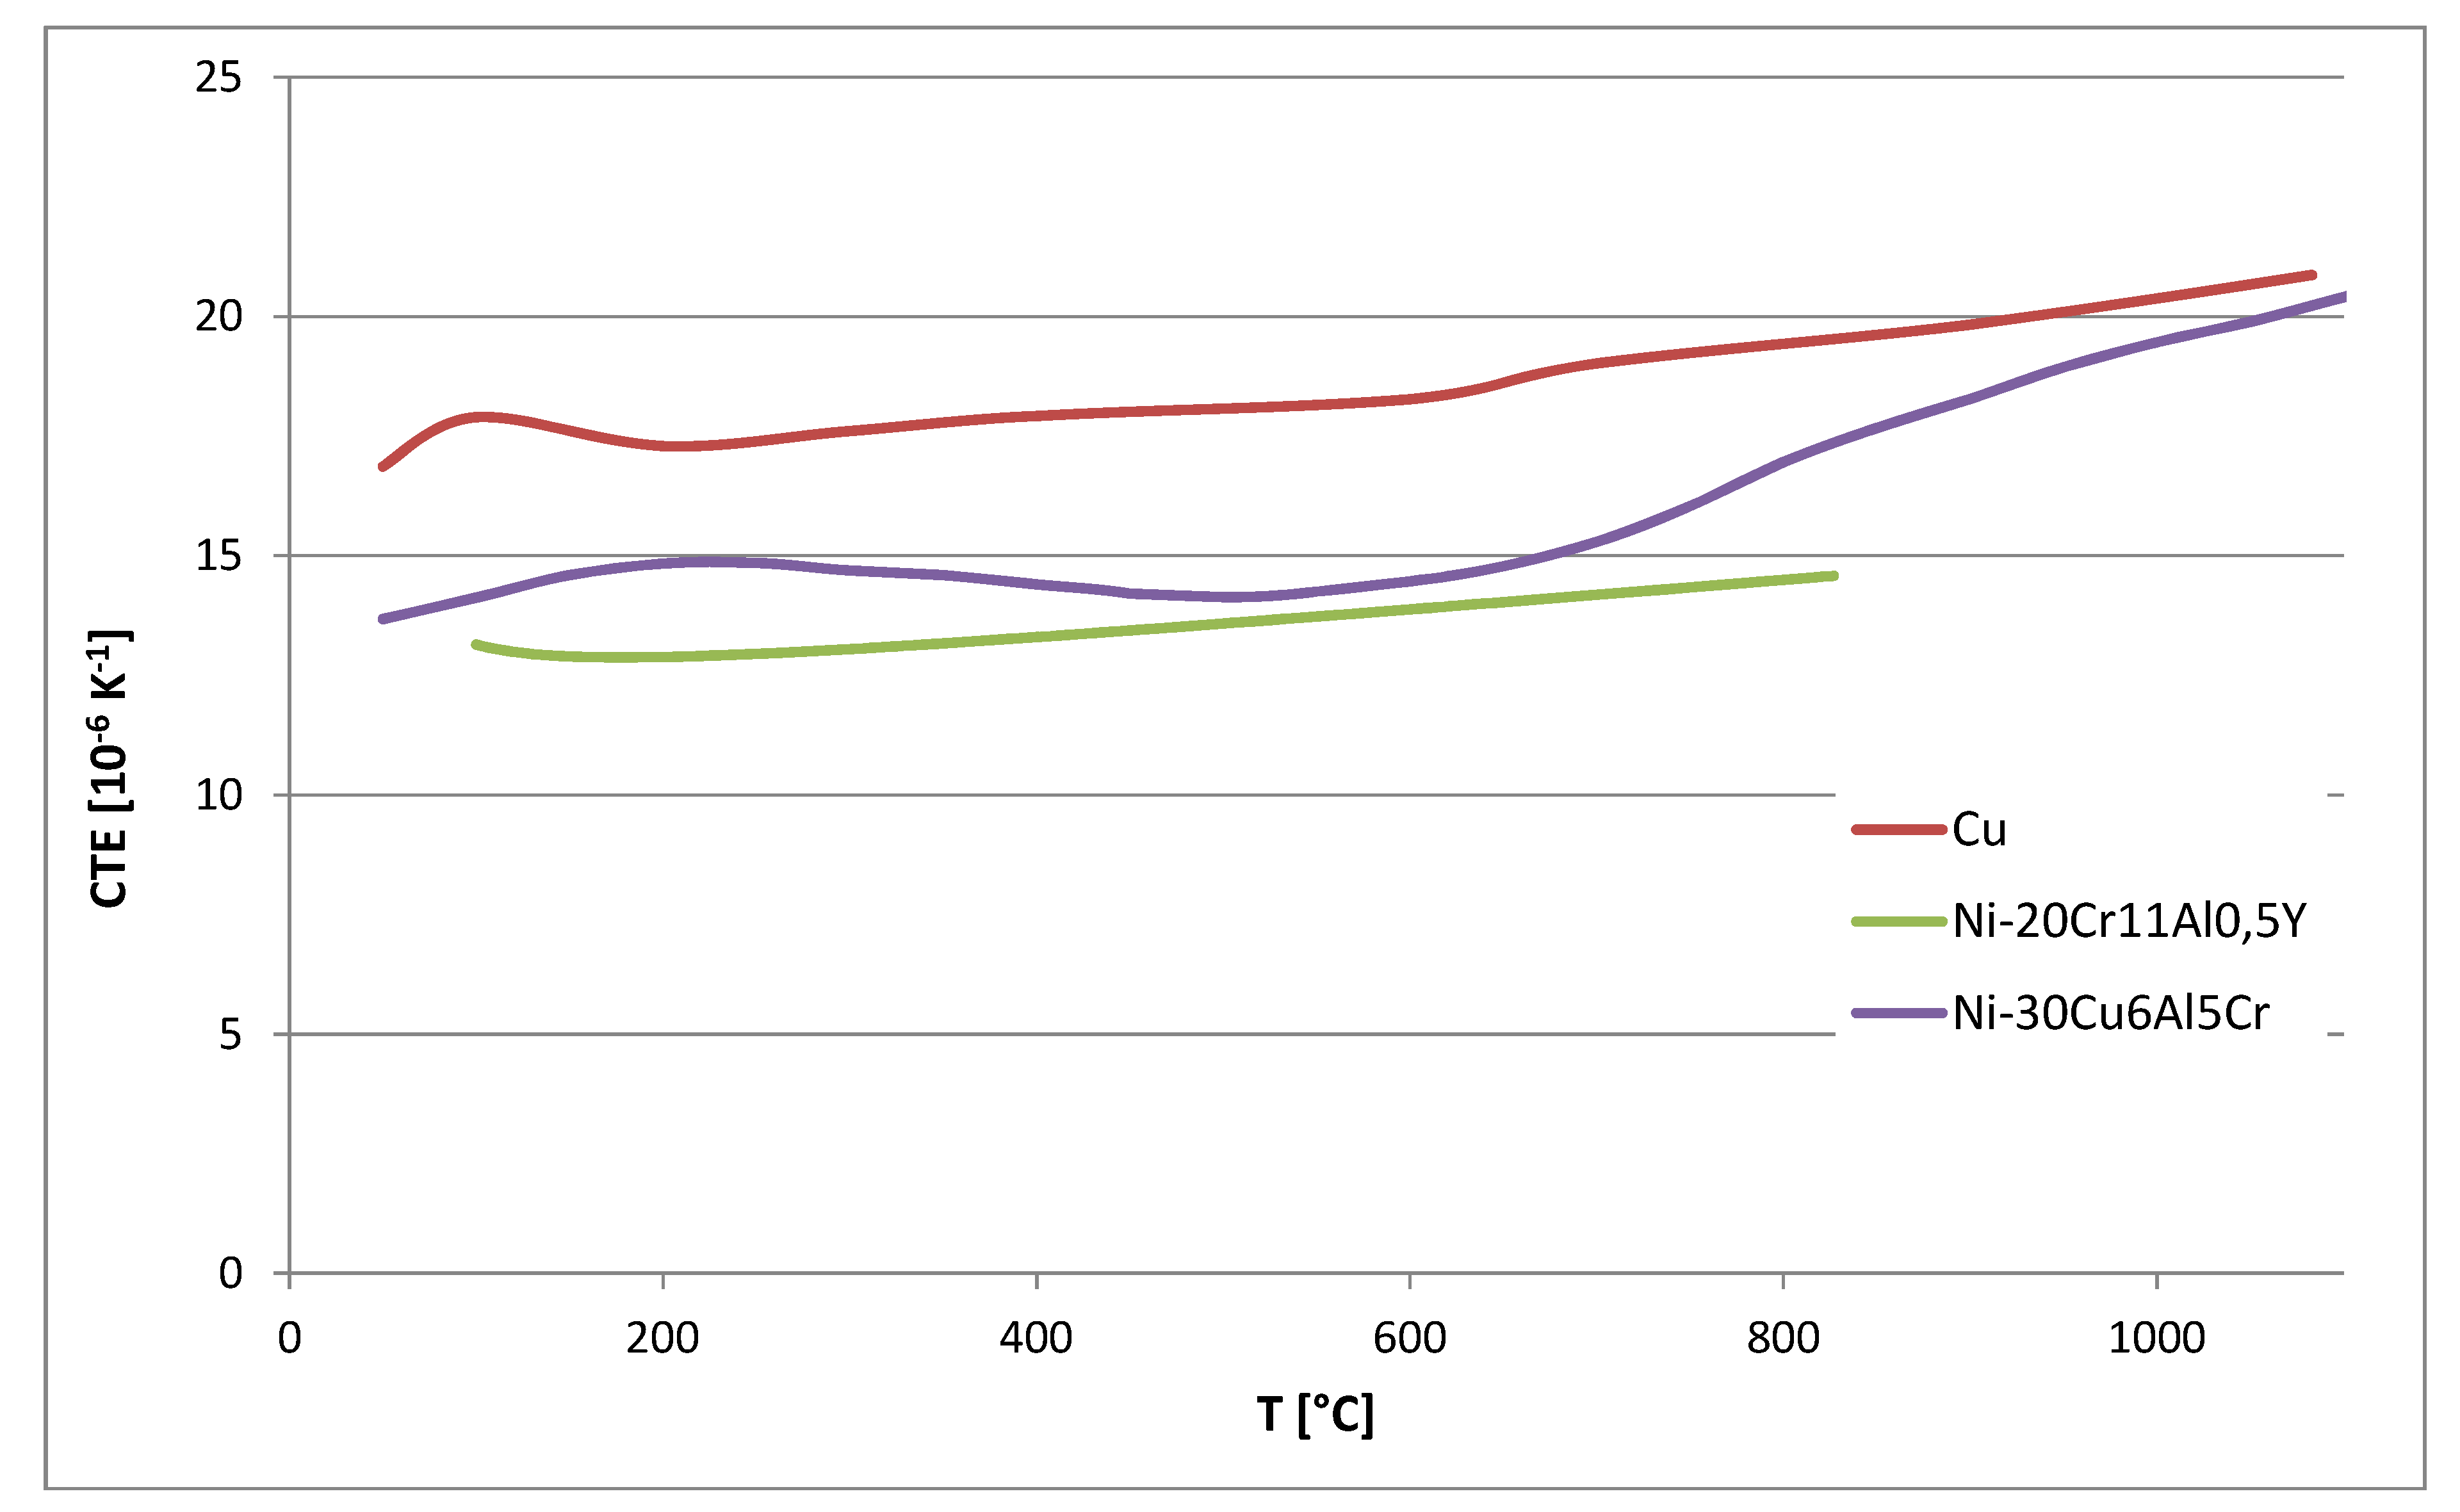
Furthermore, the coefficient of thermal expansion was measured.
Figure 13 shows the CTE related to room temperature of the alloy Ni-30%Cu-6%Al-5%Cr compared to the CTE of NiCrAlY-alloys used in previous studies and copper as the substrate. The CTE of the NiCuCrAl-alloy is about 2
× 10
−6 K
−1 below the CTE of copper at room temperature and at 800 °C. In the range of 300 °C to 800 °C, the CTE is up to 5 × 10
−6 K
−1 below the CTE of the Cu-alloy. At higher temperatures, the CTE-difference is even lower than 2
× 10
−6 K
−1. However, the CTE-difference between CuNiCrAl and the copper substrate will be lower compared to the NiCrAlY-alloy used in previous studies. The lower value of the CTE below 800 °C is probably caused by the forming/dissolution of the
γ’-phase.
Figure 13.
Coefficient of thermal expansion related to room temperature of Ni-30%Cu-6%Al-5%Cr, Cu [
24] and plasma-sprayed NiCrAlY [
7].


