1. Introduction
In recent years, Heusler alloys have become a subject of intensive experimental and theoretical investigations. Ferromagnetic shape memory alloys (FSMAs) with the Heusler-type structure (
L2
1-type structure), which exhibit both the ferromagnetic and structural transitions, have attracted much attention due to their potential application as smart materials [
1,
2]. A large magnetic field-induced strain by the rearrangement of twin variants in the martensite phase was observed in the Ni-Mn-Ga FSMAs [
3,
4]. Moreover, a large magnetocaloric effect (MCE) accompanied by a magnetostructural transition, where both the ferromagnetic and structural transitions occur together, has been expected to be useful for devices [
5,
6]. Among FSMAs, the stoichiometric Heusler alloy Ni
2MnGa has been the most studied. Ni
2MnGa orders ferromagnetically with a Curie temperature of
TC ≈ 365 K. On cooling below the martensitic transition temperature
TM ≈ 200 K, a superstructure forms, and the ferromagnetic state remains below
TM [
7,
8]. The spontaneous magnetization
Ms just below
TM is larger than the
Ms just above
TM for Ni
2MnGa.
Recently, Kataoka
et al. [
9] and Endo
et al. [
10] carried out magnetization, permeability and differential scanning calorimetric (DSC) measurements on the FMSAs Ni
2Mn
1 − xCu
xGa (0 ≤
x ≤ 0.40) and Ni
2MnGa
1 − yCu
y (0 ≤
y ≤ 0.25) alloys, respectively. It was found that for Ni
2Mn
1 − xCu
xGa (0 ≤
x ≤ 0.40) alloys the magnetostructural transitions between the paramagnetic austenite phase (Para-A) and the ferromagnetic martensite phase (Ferro-M) occur in the concentration range of 0.23 ≤
x ≤ 0.30 [
9]. Similarly, the magnetostructural transitions between the Para-A and Ferro-M were observed in the concentration range of 0.12 ≤
y ≤ 0.14 for Ni
2MnGa
1 − yCu
y (0 ≤
y ≤ 0.25) alloys [
10]. Furthermore, the characteristics of the phase diagrams of Ni
2Mn
1 − xCu
xGa (0 ≤
x ≤ 0.40) and Ni
2MnGa
1 − yCu
y (0 ≤
y ≤ 0.25) alloys were found to be very similar to those of Ni
2 +xMn
1 − xGa (0 ≤
x ≤ 0.36) alloys [
11]. Kataoka
et al. explained the phase diagram of Ni
2Mn
1 − xCu
xGa (0 ≤
x ≤ 0.40) alloys using the Landau-type phenomenological free energy as a function of the martensitic distortion and the magnetization [
9]. Their analysis showed that the biquadratic coupling term, together with a higher order term, of the martensitic distortion and the magnetization plays an important role in the interplay between the martensite phase and the ferromagnetic phase. As the result, Kataoka
et al. could obtain the satisfactory agreement between the calculated and observed phase diagrams for Ni
2Mn
1 − xCu
xGa (0 ≤
x ≤ 0.40) alloys. Also the phase diagram of Ni
2 − zCu
zMnGa (0 ≤
z ≤ 0.8) alloys was determined from the results of the temperature dependence of the initial permeability [
12]. The
TC of Ni
2 − zCu
zMnGa (0 ≤
z ≤ 0.8) alloys increased with the Cu concentration
z. While, the
TM decreased abruptly with
z.
In this paper, the concentration dependence of the magnetic moment for Ni2Mn1 − xCuxGa (0 ≤ x ≤ 0.40) and Ni2MnGa1 − yCuy (0 ≤ y ≤ 0.25) alloys is examined to gain deeper insight for the magnetic properties of these FSMAs. On the basis of the experimental results, the site occupancy and the magnetic structure of Ni2Mn1 − xCuxGa (0 ≤ x ≤ 0.40) and Ni2MnGa1 − yCuy (0 ≤ y ≤ 0.25) alloys are presented. Furthermore, the site occupancy of Ni2 − zCuzMnGa (0 ≤ z ≤ 0.4) alloys is also presented.
3. Results and Discussion
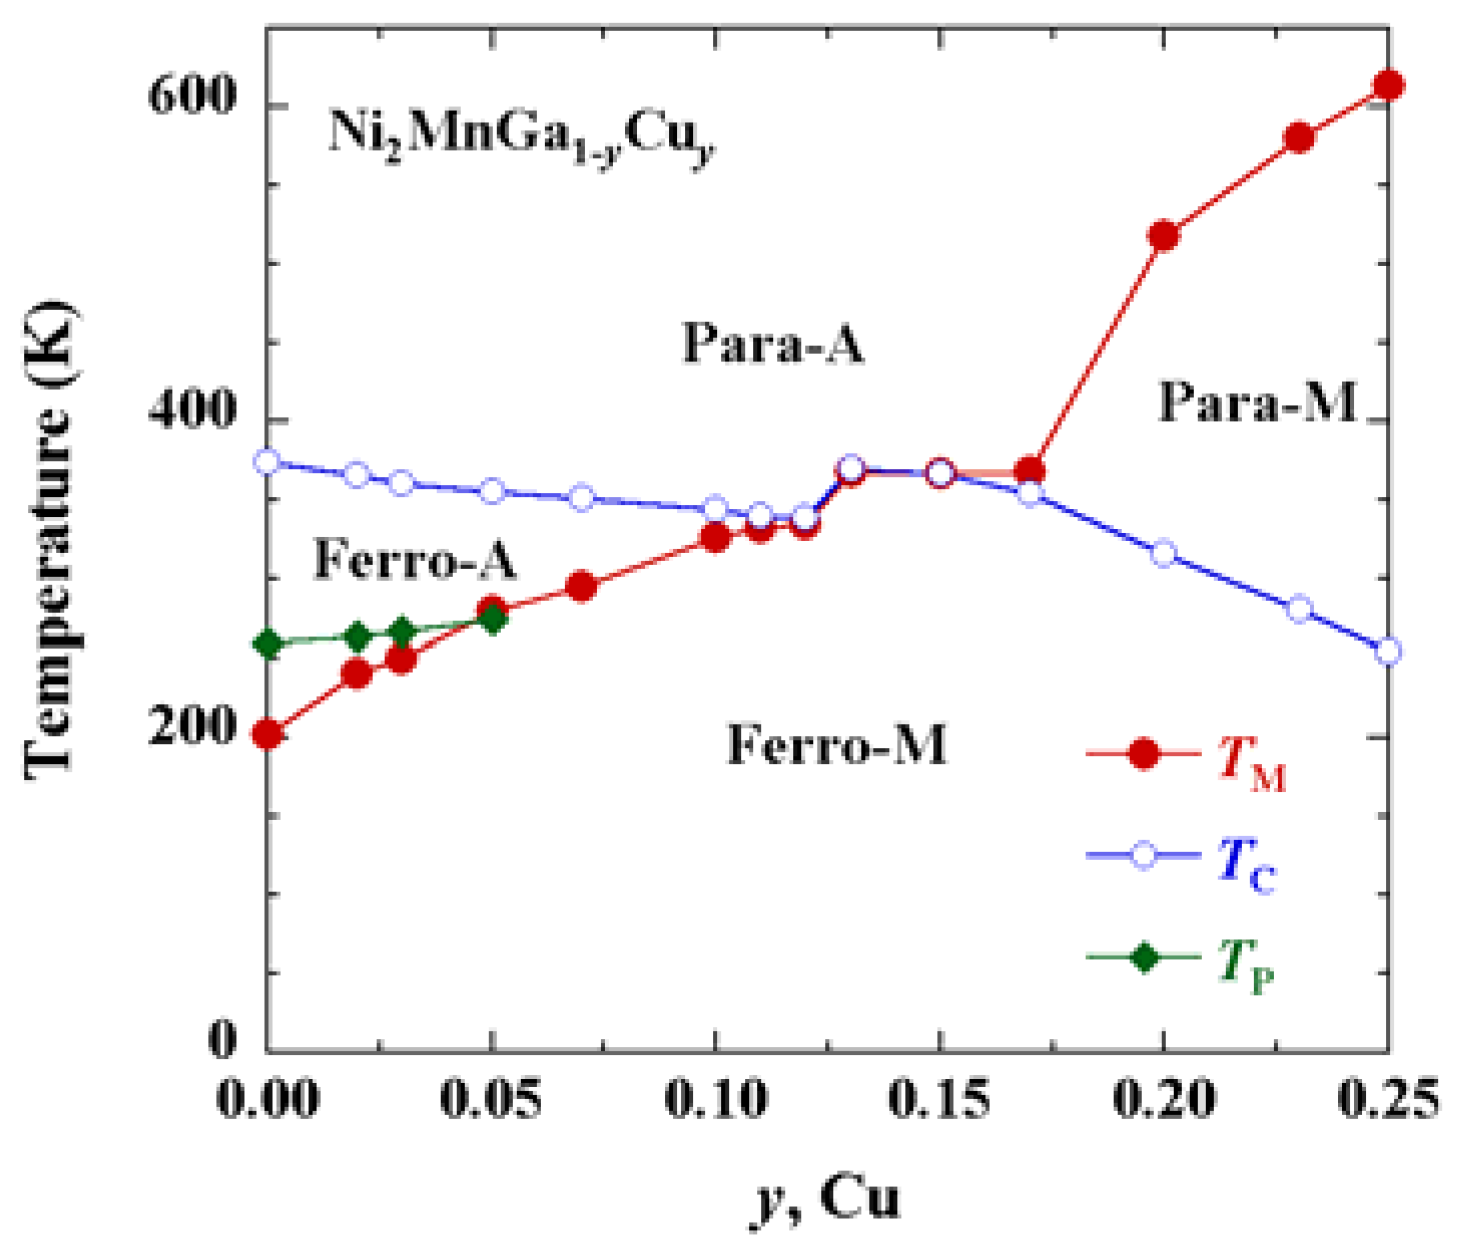
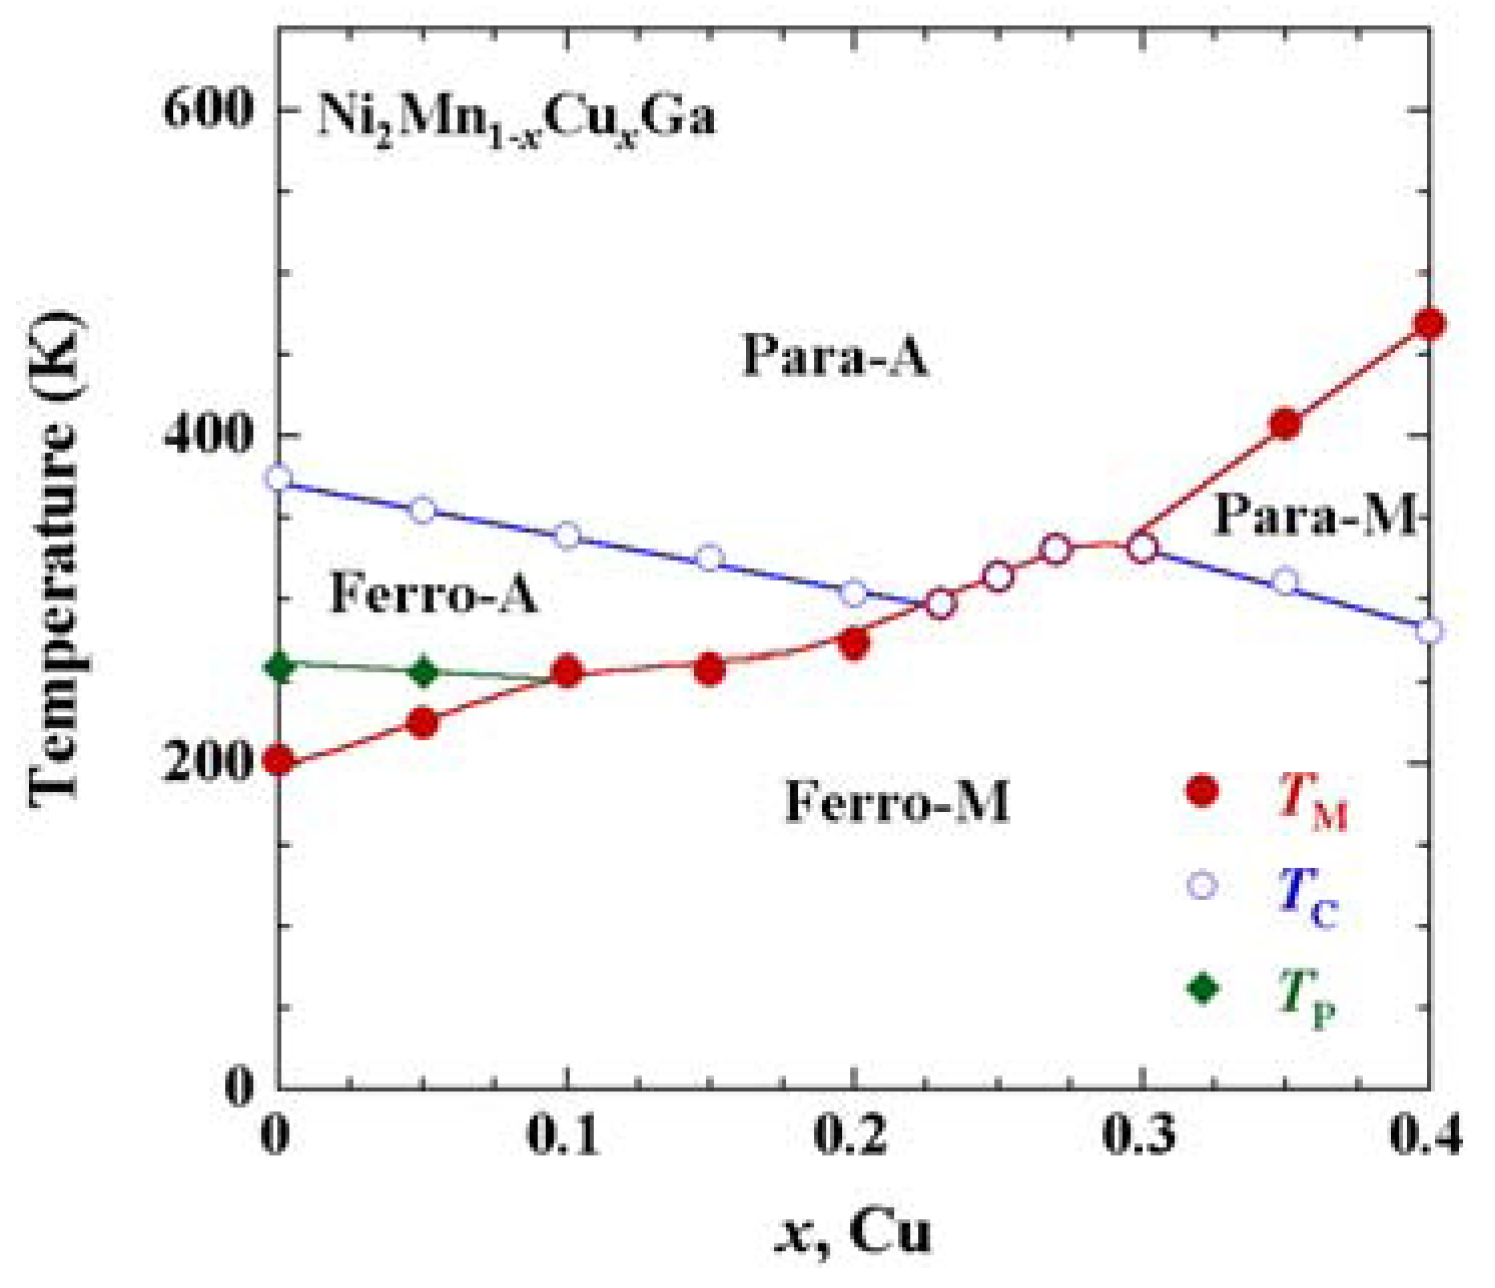
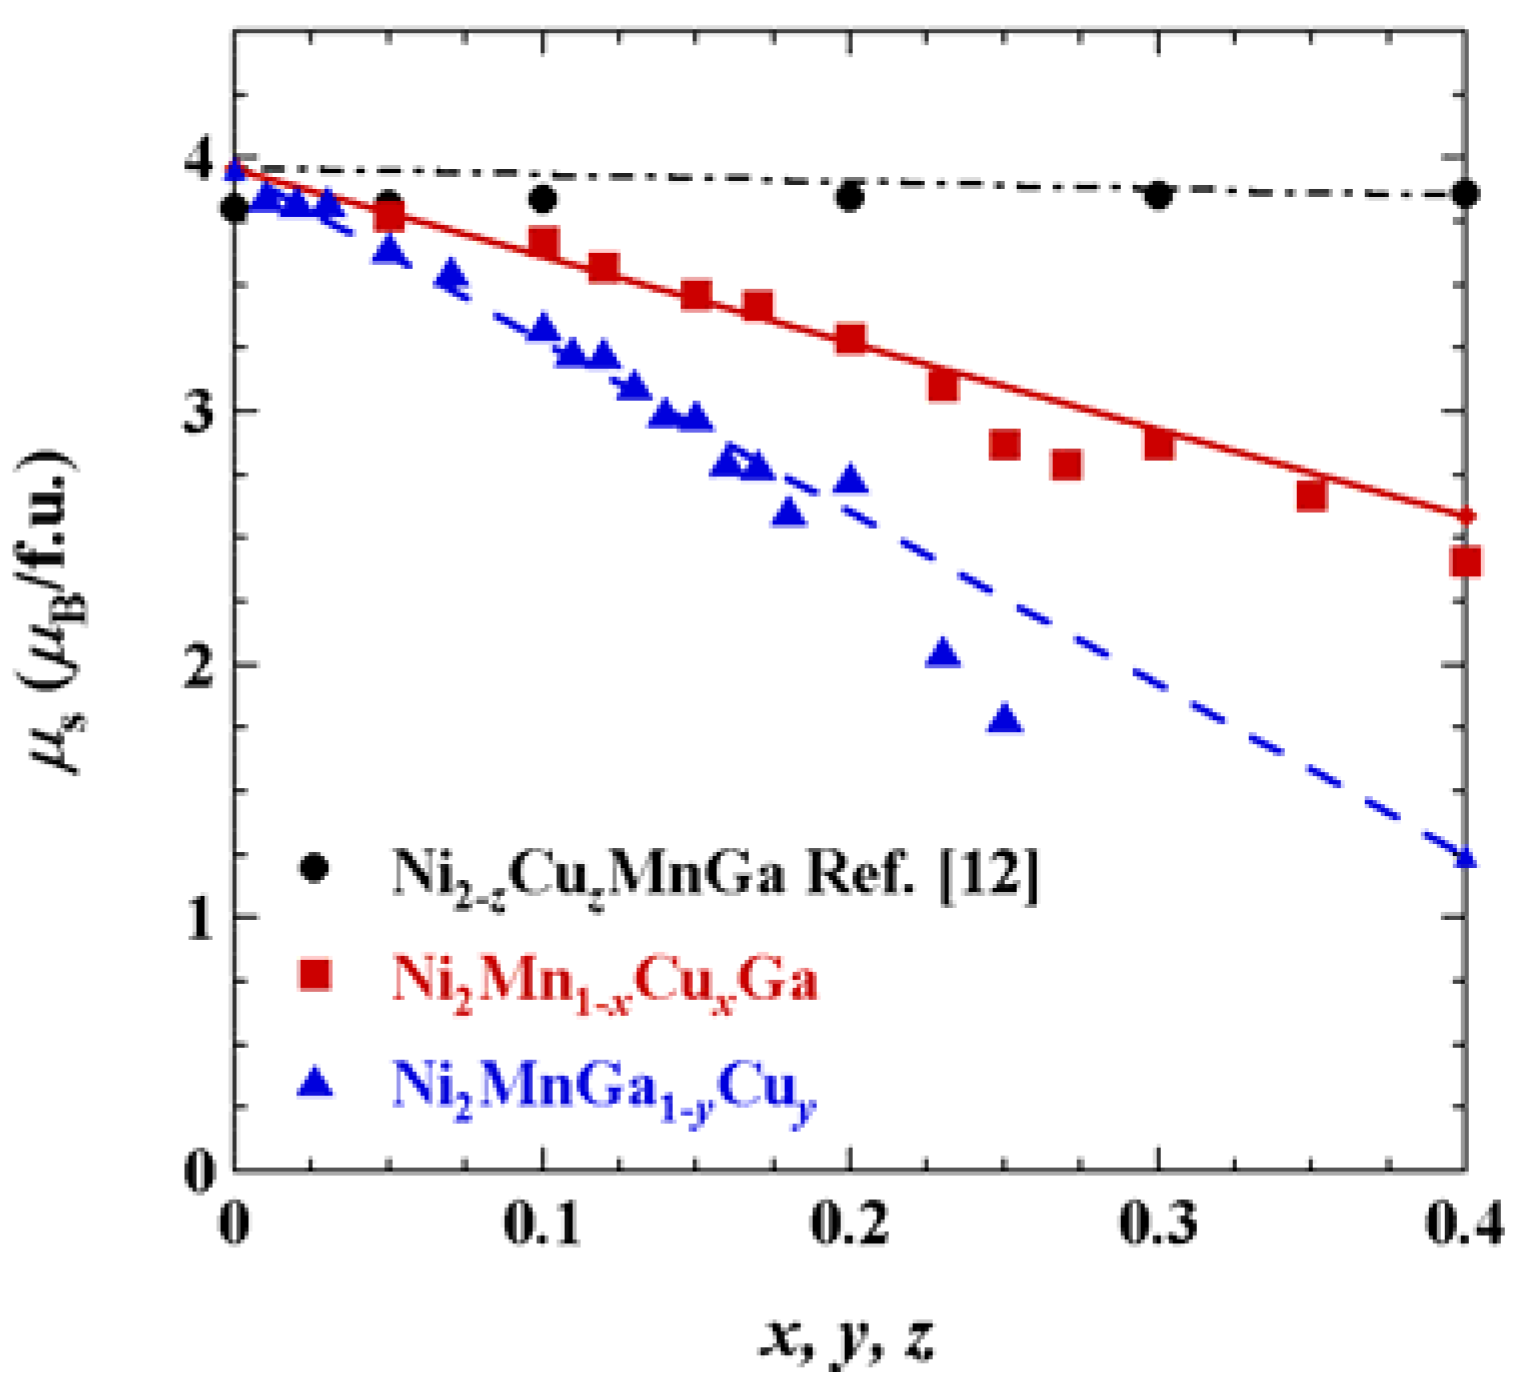
Figure 1,
Figure 2 show the phase diagrams of Ni
2Mn
1 − xCu
xGa (0 ≤
x ≤ 0.40) and Ni
2MnGa
1 − yCu
y (0 ≤
y ≤ 0.25) alloys reported by Kataoka
et al. [
9] and Endo
et al. [
10], respectively. The phase diagrams shown in
Figure 1,
Figure 2 have characteristics very similar to that [
11] of Ni
2 +xMn
1 − xGa (0 ≤
x ≤ 0.36) alloys. As shown in
Figure 1, the samples with
x ≤ 0.20 of Ni
2Mn
1 − xCu
xGa (0 ≤
x ≤ 0.40) alloys crystallize in the
L2
1-type structure at room temperature. However, the details of the crystal structure in the martensite phase for the samples with
x ≤ 0.20 are not clear. It was confirmed by the low temperature X-ray powder diffraction measurements that the sample with
x = 0.23 for Ni
2Mn
1-xCu
xGa alloy crystallizes in a 14-layered monoclinic (14
M) structure (space group:
C2/
m) well below the martensitic transition temperature [
9]. The X-ray powder diffraction pattern of the sample with
x = 0.23 at room temperature shows that the cubic phase with the
L2
1-type structure and the monoclinic phase with the 14
M structure coexist. Similarly, the X-ray powder diffraction patterns at room temperature of the samples with
x = 0.25 and 0.27 indicated that the
L2
1 phase and the 14
M phase coexist although the fraction of the 14
M phase increases with increasing the concentration
x. The sample with
x = 0.35 crystallizes in a tetragonal
D0
22-like crystal structure with no lattice modulation at room temperature. The crystal structures of the 14
M and the
D0
22-like also appear in the martensite phase of Ni
2MnGa
1 − yCu
y (0 ≤
y ≤ 0.25) alloys depending on the Cu concentration, being similar to that of Ni
2Mn
1 − xCu
xGa (0 ≤
x ≤ 0.40) alloys [
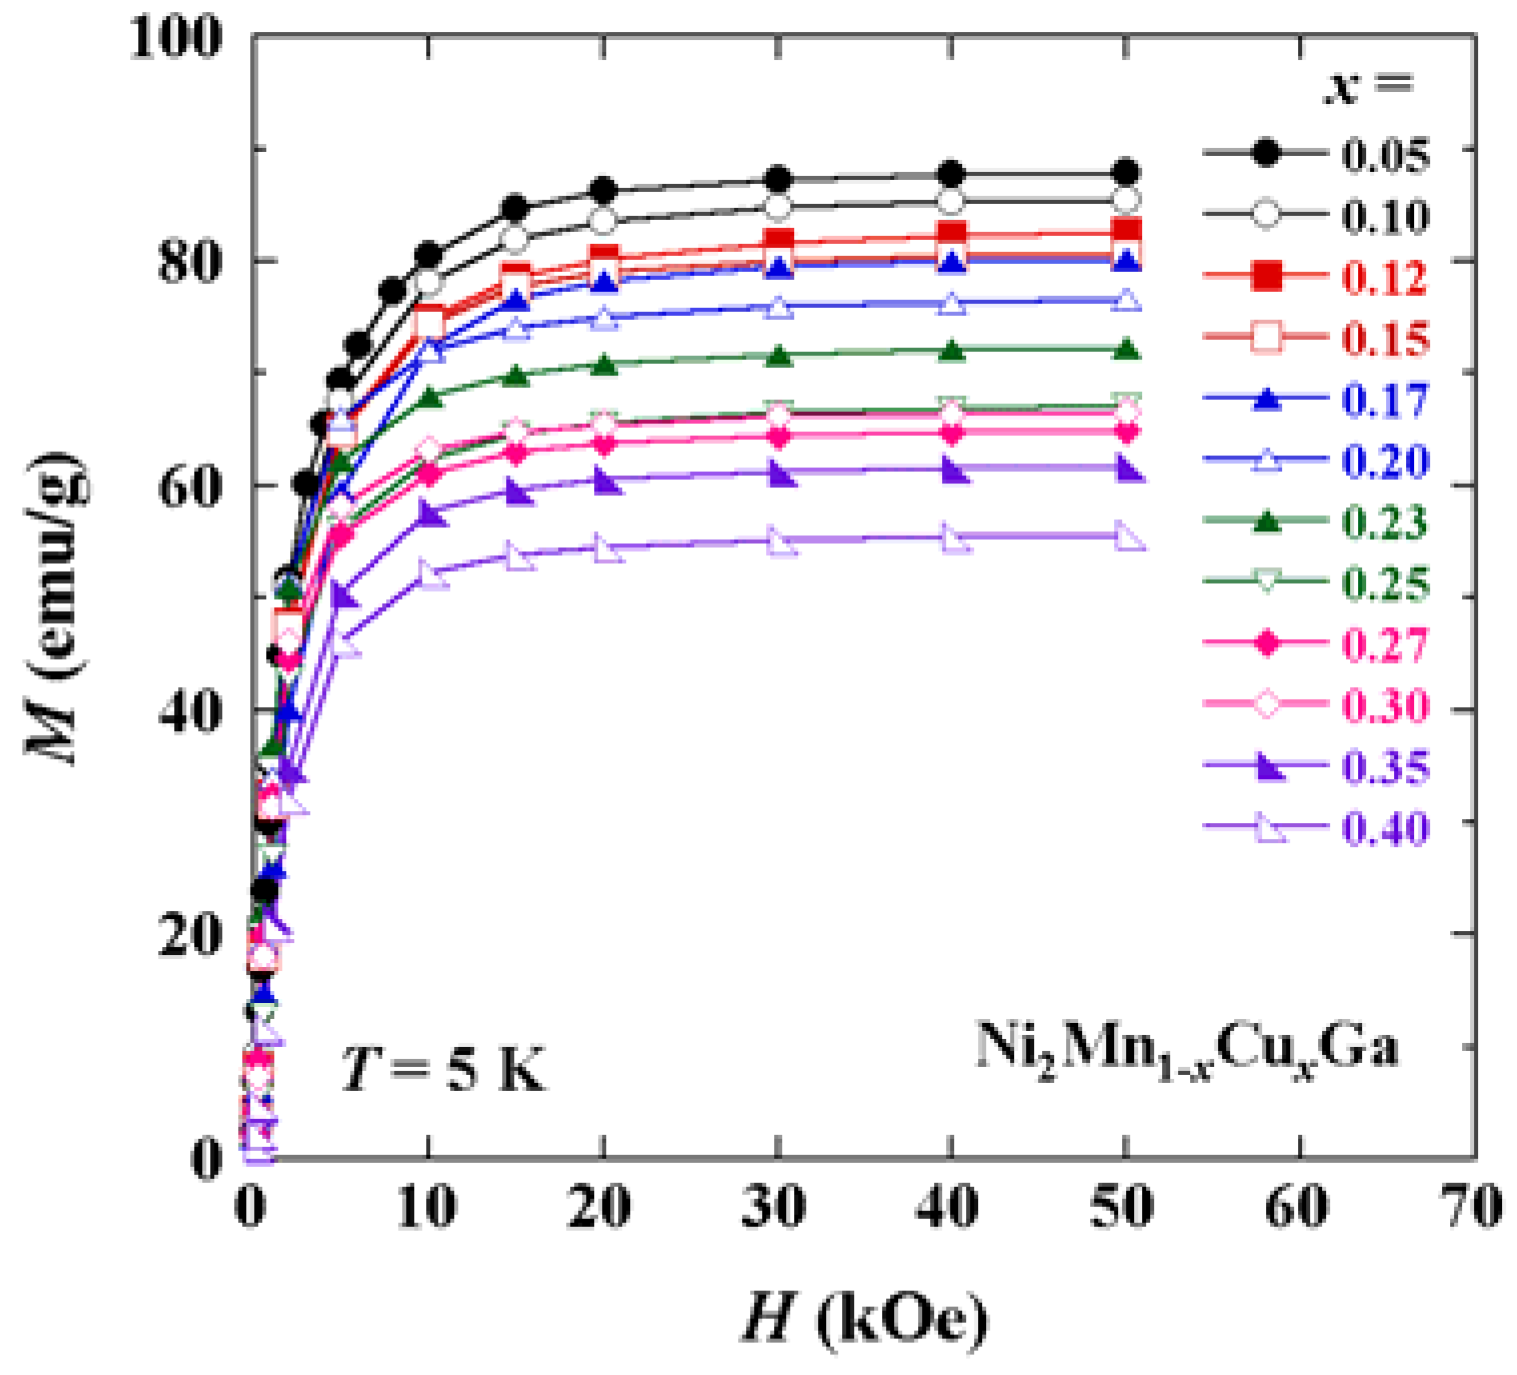
10]. The magnetization curves at 5 K for Ni
2Mn
1 − xCu
xGa (0 ≤
x ≤ 0.40) alloys with various concentrations
x are shown in
Figure 3. All of the magnetization curves are characteristic of ferromagnetism or ferrimagnetism. The magnetization
M at 5 K for all samples is saturated in a field of about 20 kOe. The magnetization curves at 5 K for Ni
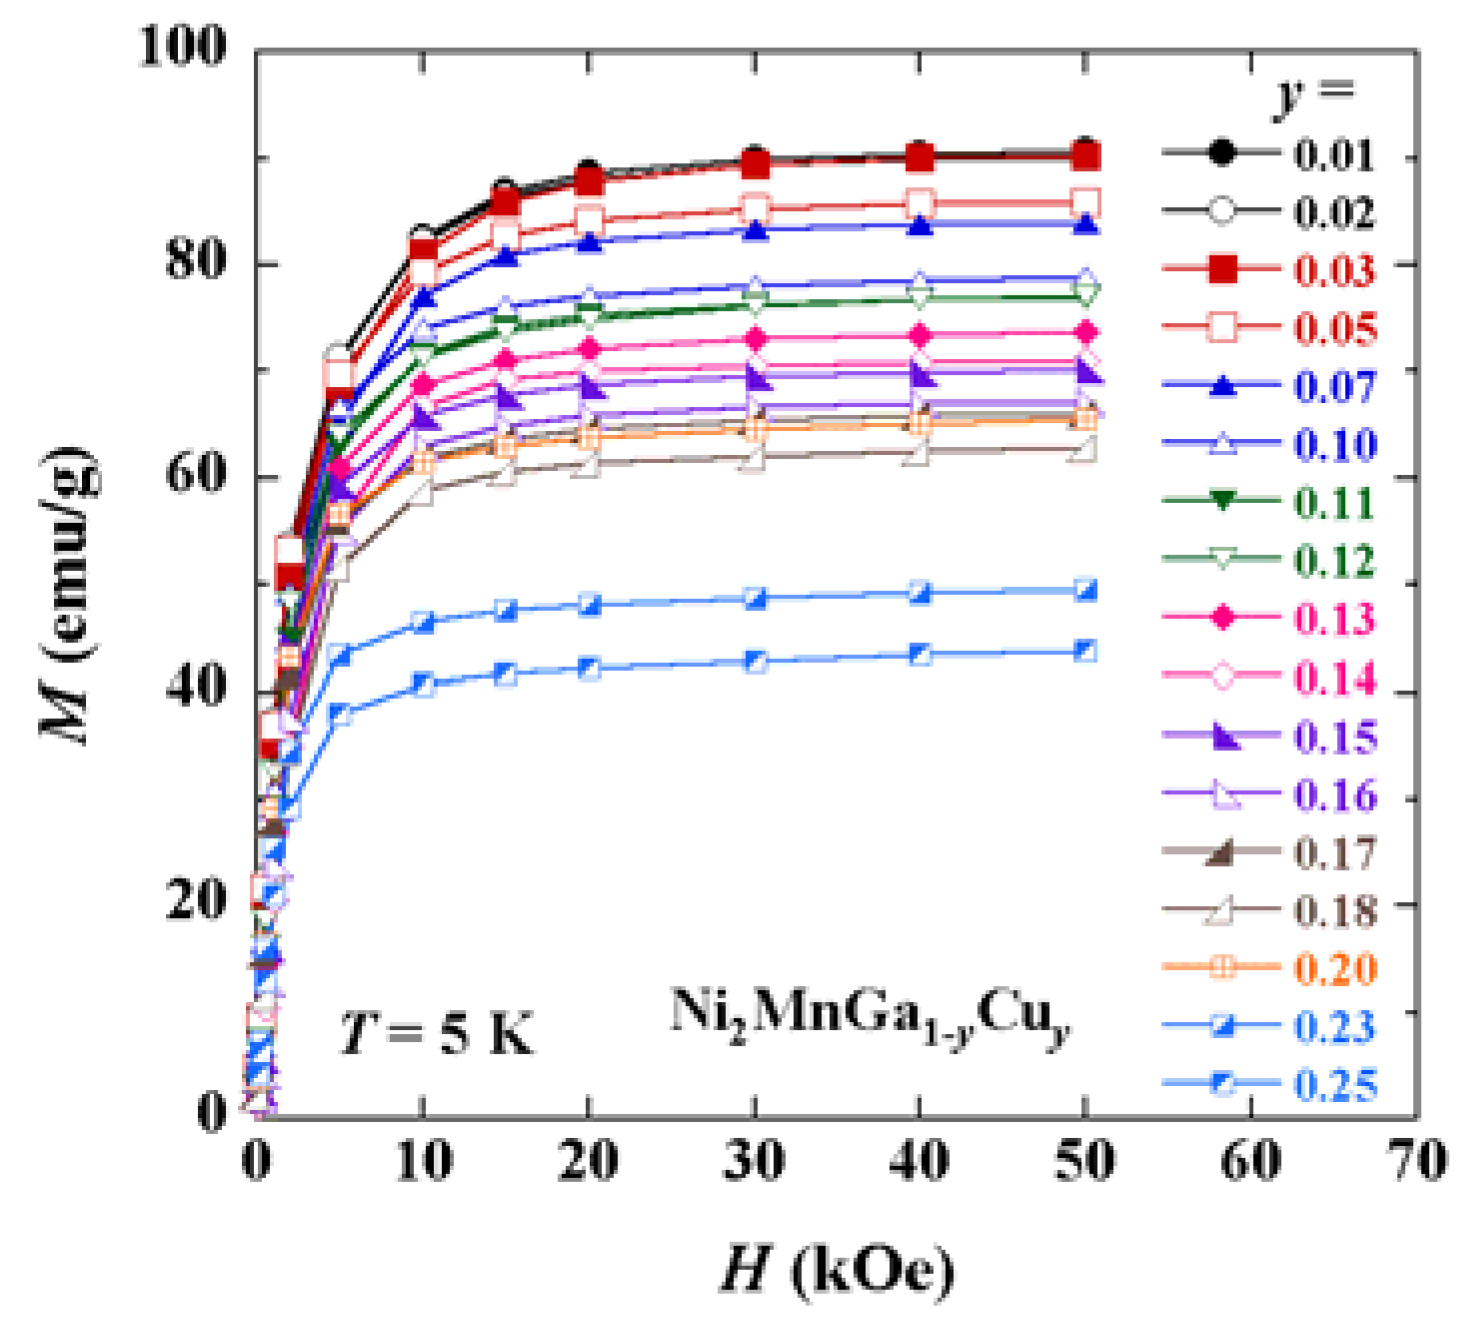
2MnGa
1 − yCu
y (0 ≤
y ≤ 0.25) alloys with various concentrations
y are shown in
Figure 4. The spontaneous magnetization at 5 K for Ni
2Mn
1 − xCu
xGa (0 ≤
x ≤ 0.40) and Ni
2MnGa
1 − yCu
y (0 ≤
y ≤ 0.25) alloys was determined by the linear extrapolation to
H/
M = 0 of the
M2 versus
H/
M curves (Arrott plot). The magnetic moments per formula unit, μ
s, at 5 K for Ni
2Mn
1 − xCu
xGa (0 ≤
x ≤ 0.40) and Ni
2MnGa
1 − yCu
y (0 ≤
y ≤ 0.25) alloys were estimated from the values of the spontaneous magnetization and are plotted against concentrations
x and
y as shown in
Figure 5. The concentration dependence of μ
s at 5 K for Ni
2 − zCu
zMnGa (0 ≤
z ≤ 0.40) alloys is also shown in
Figure 5 [
12], where the values of μ
s for Ni
2 − zCu
zMnGa (0 ≤
z ≤ 0.40) alloys were determined at 4.2 K. The μ
s at 5 K of the stoichiometric Ni
2MnGa is estimated to be about 4 μ
B/f.u. by extrapolations of the μ
s versusx curve for Ni
2Mn
1 − xCu
xGa (0 ≤
x ≤ 0.40) alloys to
x = 0 and of the μ
sversusy curve for Ni
2MnGa
1 − yCu
y (0 ≤
y ≤ 0.25) alloys to
y = 0. Recently, Ahuja
et al. carried out a magnetic Compton scattering study of the near-stoichiometric Heusler alloy Ni
2.03Mn
0.97Ga [
13]. For Ni
2.03Mn
0.97Ga, they found the value of μ
s to be 4.01 μ
B/f.u. at 110 K in a field of 2 T. The value of μ
s at 5 K for Ni
2MnGa in the present study is in good agreement with the value reported by Ahuja
et al. [
13].
Figure 1.
Phase diagram of Ni
2Mn
1 − xCu
xGa (0 ≤
x ≤ 0.4) alloys [
9]. Para and Ferro mean the paramagnetic and ferromagnetic state, respectively. A and M represent the austenite and martensite phases, respectively.
Tp is the premartensitic transition temperature.
TC and
TM are the Curie temperature and the martensitic transition temperature, respectively.
Figure 2.
Phase diagram of Ni
2MnGa
1 − yCu
y (0 ≤
y ≤ 0.25) alloys [
10]. Para and Ferro mean the paramagnetic state and ferromagnetic one, respectively. A and M represent the austenitic and martensitic phases, respectively.
TC,
TM and
Tp are the Curie temperature, the martensitic transition temperature, and premartensitic transition temperature, respectively.
Figure 3.
Magnetization curves at 5 K for Ni2Mn1 − xCuxGa (0 ≤ x ≤ 0.40) alloys with various concentration x.
Figure 4.
Magnetization curves at 5 K for Ni2MnGa1 − yCuy (0 ≤ y ≤ 0.25) alloys with various concentration y.
Recently, Li
et al. investigated theoretically the site preference and elastic properties of Fe-, Co- and Cu-doped Ni
2MnGa alloys by using the first-principles exact muffin-tin orbital method in combination with the coherent-potential approximation [
14]. According to the results of the calculation by Li
et al. [
14], Cu atoms for Ni
2Mn
0.95Cu
0.05Ga occupy the vacant Mn sublattice and the magnetic moments of the Ni, Mn, Cu and Ga atoms, μ
Ni, μ
Mn, μ
Cu and μ
Ga, in Ni
2Mn
0.95Cu
0.05Ga are 0.32 μ
B, 3.37 μ
B, −0.03 μ
B and −0.05 μ
B, respectively. The values of μ
Ni, μ
Mn and μ
Ga calculated by Li
et al. [
14] are in good agreement with those reported earlier for the stoichiometric Heusler alloy Ni
2MnGa [
15,
16,
17,
18,
19,
20,
21,
22]. In order to explain the observed concentration dependence of the magnetic moment for Ni
2Mn
1 − xCu
xGa (0 ≤
x ≤ 0.40) alloys we present a simple model in which the following assumptions are made. Cu atoms for Ni
2Mn
1 − xCu
xGa (0 ≤
x ≤ 0.40) alloys always occupy the vacant Mn sublattice. The magnetic moments of the Ni, Mn, Cu and Ga atoms in Ni
2Mn
1 − xCu
xGa (0 ≤
x ≤ 0.40) alloys are collinear and have Li
et al.’s values independent of
x. The magnetic moments of the Mn atoms are ferromagnetically coupled to the magnetic moments of the Ni atoms. Then, the total magnetic moment per formula unit, μ
s (cal), of Ni
2Mn
1 − xCu
xGa (0 ≤
x ≤ 0.40) alloys is given by μ
s(cal) = 2μ
Ni + (1 −
x)μ
Mn +
xμ
Cu + μ
Ga. The solid line in
Figure 5 is the one calculated by using this equation. As seen in
Figure 5, the experimental values are in good agreement with those calculated.
Figure 5.
Concentration dependence of the magnetic moment per formula unit, μ
s, for Ni
2Mn
1 − xCu
xGa (0 ≤
x ≤ 0.40), Ni
2MnGa
1 − yCu
y (0 ≤
y ≤ 0.25) and Ni
2 − zCu
zMnGa (0 ≤
z ≤ 0.40). All values of μ
s were determined at 5 K except for the values of μ
s of Ni
2 − zCu
zMnGa (0 ≤
z ≤ 0.40) alloys. They were estimated at 4.2 K [
12].
Next, we consider the concentration dependence of μ
s for Ni
2MnGa
1 − yCu
y (0 ≤
y ≤ 0.25) alloys. According to the results of the calculation for the site occupation of Ni
2MnGa
0.95Cu
0.05 by Li
et al. [
14], Cu atoms always occupy the sublattice of the deficient component; the configuration Ni
2Mn(Ga
0.95Cu
0.05) is the most stable in where the components A and B in (A,B) occupy the same sublattice. In this case, the μ
s at 5 K for Ni
2MnGa
1 − yCu
y (0 ≤
y ≤ 0.25) alloys is almost independent of
y under the assumption that Ni
2MnGa
1 − yCu
y (0 ≤
y ≤ 0.25) alloys are collinear ferromagnets and the values of μ
Ni and μ
Mn are independent of
x. However, as shown in
Figure 5, the experimental μ
s at 5 K for Ni
2MnGa
1 − yCu
y (0 ≤
y ≤ 0.25) alloys decreases steeply with increasing
y. We, therefore, suggest a different site-occupation configuration
i.e., Ni
2(Mn
1 − yCu
y)(Ga
1 − yMn
y) with the Cu atoms occupying the Mn sublattice, for Ni
2MnGa
1 − yCu
y (0 ≤
y ≤ 0.25) alloys, where some of the Mn atoms move on to the Ga sublattice. Here, we assume that the magnetic moment of the Mn atoms substituted on to the Ga sites in Ni
2(Mn
1 − yCu
y)(Ga
1 − yMn
y) alloys is antiferomagnetically coupled to the magnetic moment of the Mn atoms on the Mn sublattice. The values of the magnetic moments of the Mn atoms on the Mn and Ga sublattices, respectively, are assumed to be 3.37 μ
B and −3.43 μ
B, which remain constant with increasing
y from
y = 0. The other magnetic moments μ
Ni, μ
Cu and μ
Ga in the Ni
2(Mn
1 − yCu
y)(Ga
1 − yMn
y) alloys are the constant values 0.32 μ
B, −0.03 μ
B and −0.05 μ
B, respectively, as in Ni
2Mn
1 − xCu
xGa (0 ≤
x ≤ 0.40) alloys. A value of −3.43 μ
B was calculated by Li
et al. [
14] for the magnetic moment of the Mn atoms on the Ga sublattice. The antiferromagnetic coupling between nearest-neighbor Mn atoms in Ni
2(Mn
1 − yCu
y)(Ga
1 − yMn
y) alloys is due to the variation of the exchange interaction that becomes antiferromagnetic for small Mn-Mn interatomic distances. This antiferromagnetic coupling was already proved experimentally and theoretically in many Mn-rich Ni-Mn-Ga Heusler alloys [
14,
23,
24,
25,
26,
27]. Then, the μ
s of Ni
2(Mn
1 − yCu
y)(Ga
1 − yMn
y) alloys is given by μ
s(cal) = 2μ
Ni + (1 −
y)μ
MnI +
yμ
Cu + (1 −
y)μ
Ga +
yμ
MnII, where μ
MnI and μ
MnII mean the values of the magnetic moment of the Mn atoms on the Mn sublattice and the Ga sublattice, respectively. The broken line in
Figure 5 is the one calculated by using the above equation. As seen in
Figure 5, the experimental values are in agreement with those calculated for low
y concentrations. For samples with high
y concentrations, however, the experimental values of μ
s deviate from the broken line in
Figure 5. This may be attributed to any concentration dependence of the μ
MnI, μ
MnII and μ
Ni values or occurrence of disorder of the constituent elements associated with the increase of
y.
In the above considerations on Ni
2MnGa
1 − yCu
y (0 ≤
y ≤ 0.25) alloys, we excluded the site-occupation configurations of (Ni
2 − yCu
y)(Mn
1 − yNi
y)(Ga
1 − yMn
y) and (Ni
2 − yMn
y)(Mn
1 − yCu
y)(Ga
1 − yNi
y) by taking into account the theoretical result that the formation energies of the site-occupations in Ni
2Mn(Ga
0.95Cu
0.05) and Ni
2(Mn
0.95Cu
0.05)(Ga
0.95Mn
0.05) are much smaller than those of (Ni
1.95Cu
0.05)(Mn
0.95Ni
0.05)(Ga
0.95Mn
0.05) and (Ni
1.95Mn
0.05)(Mn
0.95Cu
0.05)(Ga
0.95Ni
0.05) [
14]. Unfortunately, the calculations in [
14] were made for the site occupation of Cu-doped Ni
2MnGa with the
L2
1-type structure, instead of the one with the observed martensitic structure at 5 K. Nevertheless, the above satisfactory agreements between the experimental and calculated concentration dependence of the magnetic moment μ
s may rather confirm that the site-occupation configurations in the present analyses exist also in the martensite phase. Lastly, we consider the concentration dependence of μ
s for Ni
2 − zCu
zMnGa (0 ≤
z ≤ 0.40) alloys. As shown in
Figure 5, the experimental values of μ
s for Ni
2 − zCu
zMnGa (0 ≤
z ≤ 0.40) alloys are almost independent of concentration
z [
12]. We assume that Cu atoms for Ni
2 − zCu
zMnGa (0 ≤
z ≤ 0.40) alloys occupy the vacant Ni sublattice according to the results of the calculation by Li
et al. [
14]. Furthermore, we assume that μ
Ni, μ
Cu, μ
Mn and μ
Ga in Ni
2 − zCu
zMnGa (0 ≤
z ≤ 0.40) alloys, respectively, are the constant values 0.32 μ
B, 0.04 μ
B, 3.37 μ
B and −0.05 μ
B, which are the magnetic moments calculated by Li
et al. [
14] for Ni
1.95Cu
0.05MnGa. Then, the concentration dependence of μ
s(cal) for FSMAs Ni
2 − zCu
zMnGa (0 ≤
z ≤ 0.40) alloys is given by μ
s(cal) = (2 −
z)μ
Ni +
zμ
Cu + μ
Mn + μ
Ga, which is shown by the dot dash line in
Figure 5. As seen in
Figure 5, the experimental values are in good agreement with those calculated.
