Abstract
The contribution presents a modified method of stochastic reconstruction of two porous stainless-steel filters. The description of their microstructures was based on a combination of the two-point probability function for the void phase and the lineal-path functions for the void and solid phases. The method of stochastic reconstruction based on simulated annealing was capable of reproducing good connectivity of both phases, which was confirmed by calculating descriptors of the local porosity theory. Theoretical values of permeability were compared with their experimental counterparts measured by means of quasi-stationary permeation of four inert gases.
1. Introduction
Porous metal filters are fabricated by sintering of compacted metal powder particles. Their primary applications are as permeable barriers in purifiers, heat exchangers, catalyst reactors or oil burners. To optimize processes taking place in these devices, knowledge of transport and mechanical properties of the filters is necessary. A quantitative description of their microstructure, particularly geometry and topology of pore space, is required for reliable prediction of fluid transport in pore space. There are well-established ways to reproduce 3D microstructures of macroporous media such as serial tomography [1] and X-ray computed microtomography [2]. Unfortunately, these methods are often limited by their spatial resolution, availability and cost.
Another way to do this involves 3D stochastic reconstruction [3,4]. In these references, simulated annealing is shown to be a very efficient and flexible tool for reproducing the porous media microstructure. Limited statistical information in the form of microstructural descriptors is accessed by the image processing and analysis of microphotographs of cross-sections (2D cuts) randomly oriented through a porous material. Selected microstructural descriptors constrain the reconstruction procedure. Resulting replicas are then subjected to the computational study of some transport and/or mechanical properties (permeability, conductivity, elasticity, etc.). Calculated values are compared with their experimentally measured counterparts.
This contribution presents an application of stochastic reconstruction of stainless-steel filter microstructures. Two samples were reconstructed and their percolation properties were analyzed. Theoretical values of permeability of both porous replicas were compared with their experimental counterparts measured by means of quasi-steady state permeation of four inert gases.
2. Results and Discussion
2.1. Reconstructed Microstructure (3D Replicas) of Porous Metal Filters
The replicas of porous metal filters were obtained by means of stochastic reconstruction based on simulated annealing method. Three reference microstructural descriptors used in the objective function E made a positive contribution to the replicas formation. The created 3D models had solid compacted grains close to the real porous filter, see Figure 1, and replicas were distinguished by a good connectivity. A substantial reduction of initial values of E indicated the successful course of optimization giving the evidence on very close fitting of the reference and evaluated microstructural descriptors.

Figure 1.
3D reconstructed microstructure (replica) of filter F1 as a subregion of 200 × 200 × 200 voxels (0.5 micron/voxel). Pore orifices are yellow, pore-metal interface is blue, and metal phase is transparent.
Figure 1.
3D reconstructed microstructure (replica) of filter F1 as a subregion of 200 × 200 × 200 voxels (0.5 micron/voxel). Pore orifices are yellow, pore-metal interface is blue, and metal phase is transparent.
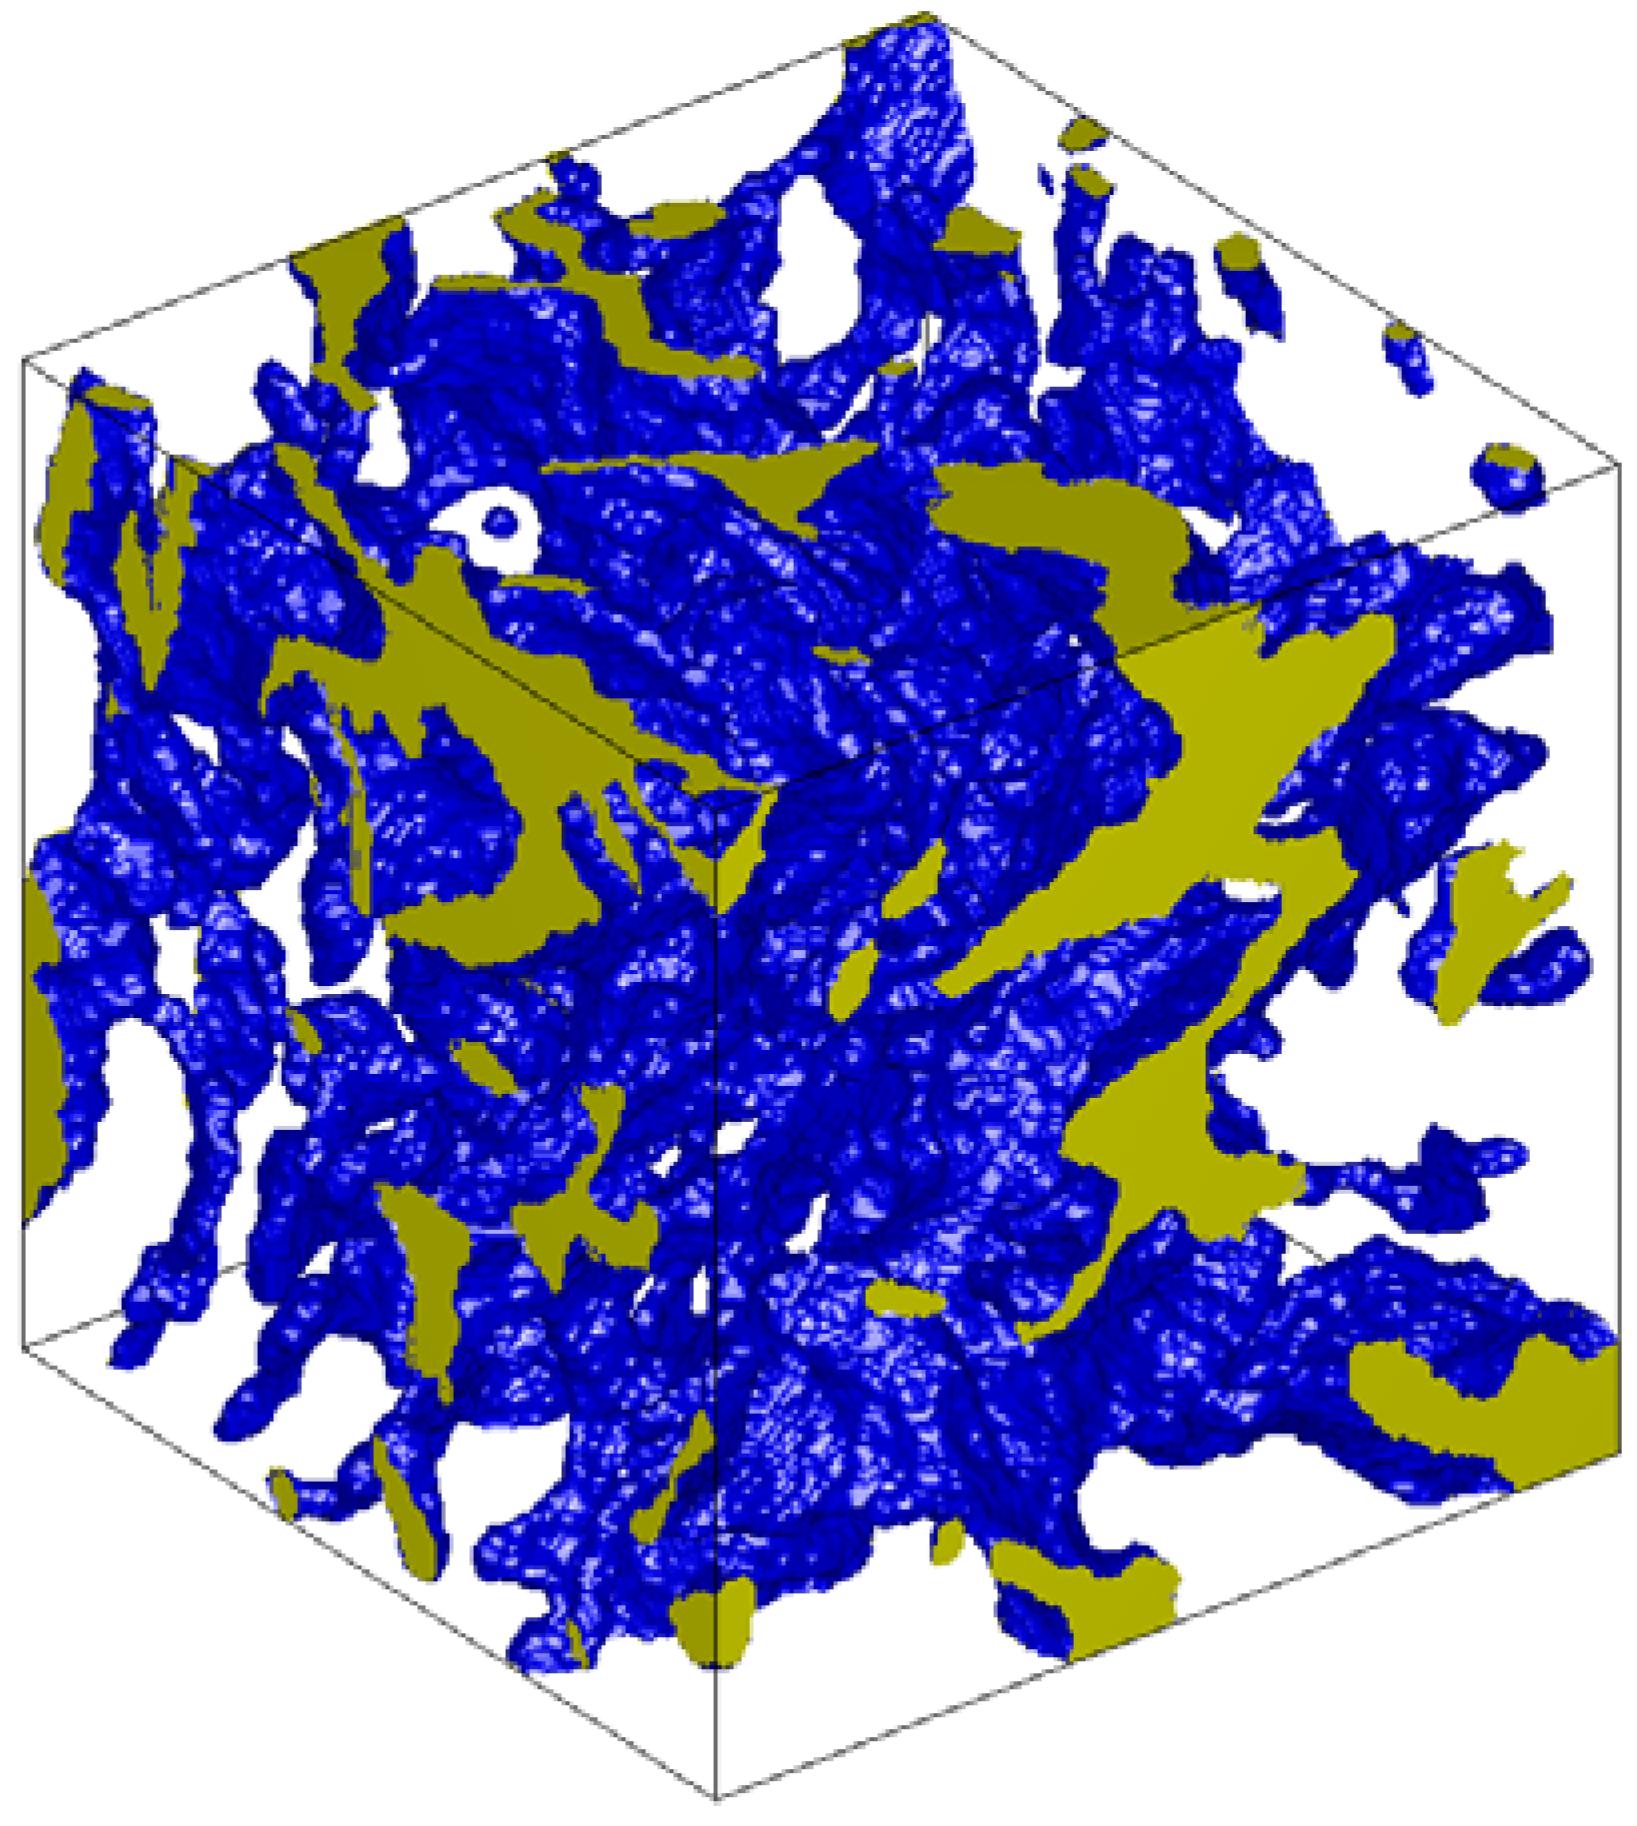
Here, the presented method delivered the replicas almost free of isolated clusters. Isolated porosity only formed a small fraction of total porosity, indicating good percolation properties. The quantitative analysis using the local porosity theory [5,6] confirmed that replicas percolated in all three principal directions. The void phase consisted of cavities and throats that did not differ too much in their hydraulic diameters, cf.Figure 1. On the contrary, replicas obtained using the common method based on simulated annealing did not percolate at all [4].
2.2. Transport Properties of Porous Metal Filters
Permeability in the Knudsen region expressed as the effective pore size, κcal, was determined using random-walk simulation whilst permeation in the region of continuum, βcal, was deduced from solutions of the Stokes equations in the reconstructed pore space [4]. The experimental and calculated effective transport parameters of both filters are compared in Table 1. It could be concluded that the theoretical results well corresponded to experimental values. This fact confirmed that our stochastic reconstruction method performed well. It should also be stressed that both computing procedures did not involve any adjustable parameter, i.e., κcal and βcal were estimated from first principles.

Table 1.
Experimental and calculated effective transport properties of porous metal filters.
| Sample | κexp (nm) | βexp (µm2) | κcal (nm) | βcal (µm2) |
|---|---|---|---|---|
| F1 media grade 0.5 | 67 ± 8 | 0.0527 ± 0.0008 | 67.1 | 0.0533 |
| F2 media grade 0.2 | 51 ± 2 | 0.0241 ± 0.0004 | 55.1 | 0.0324 |
3. Experimental Section
3.1. Materials
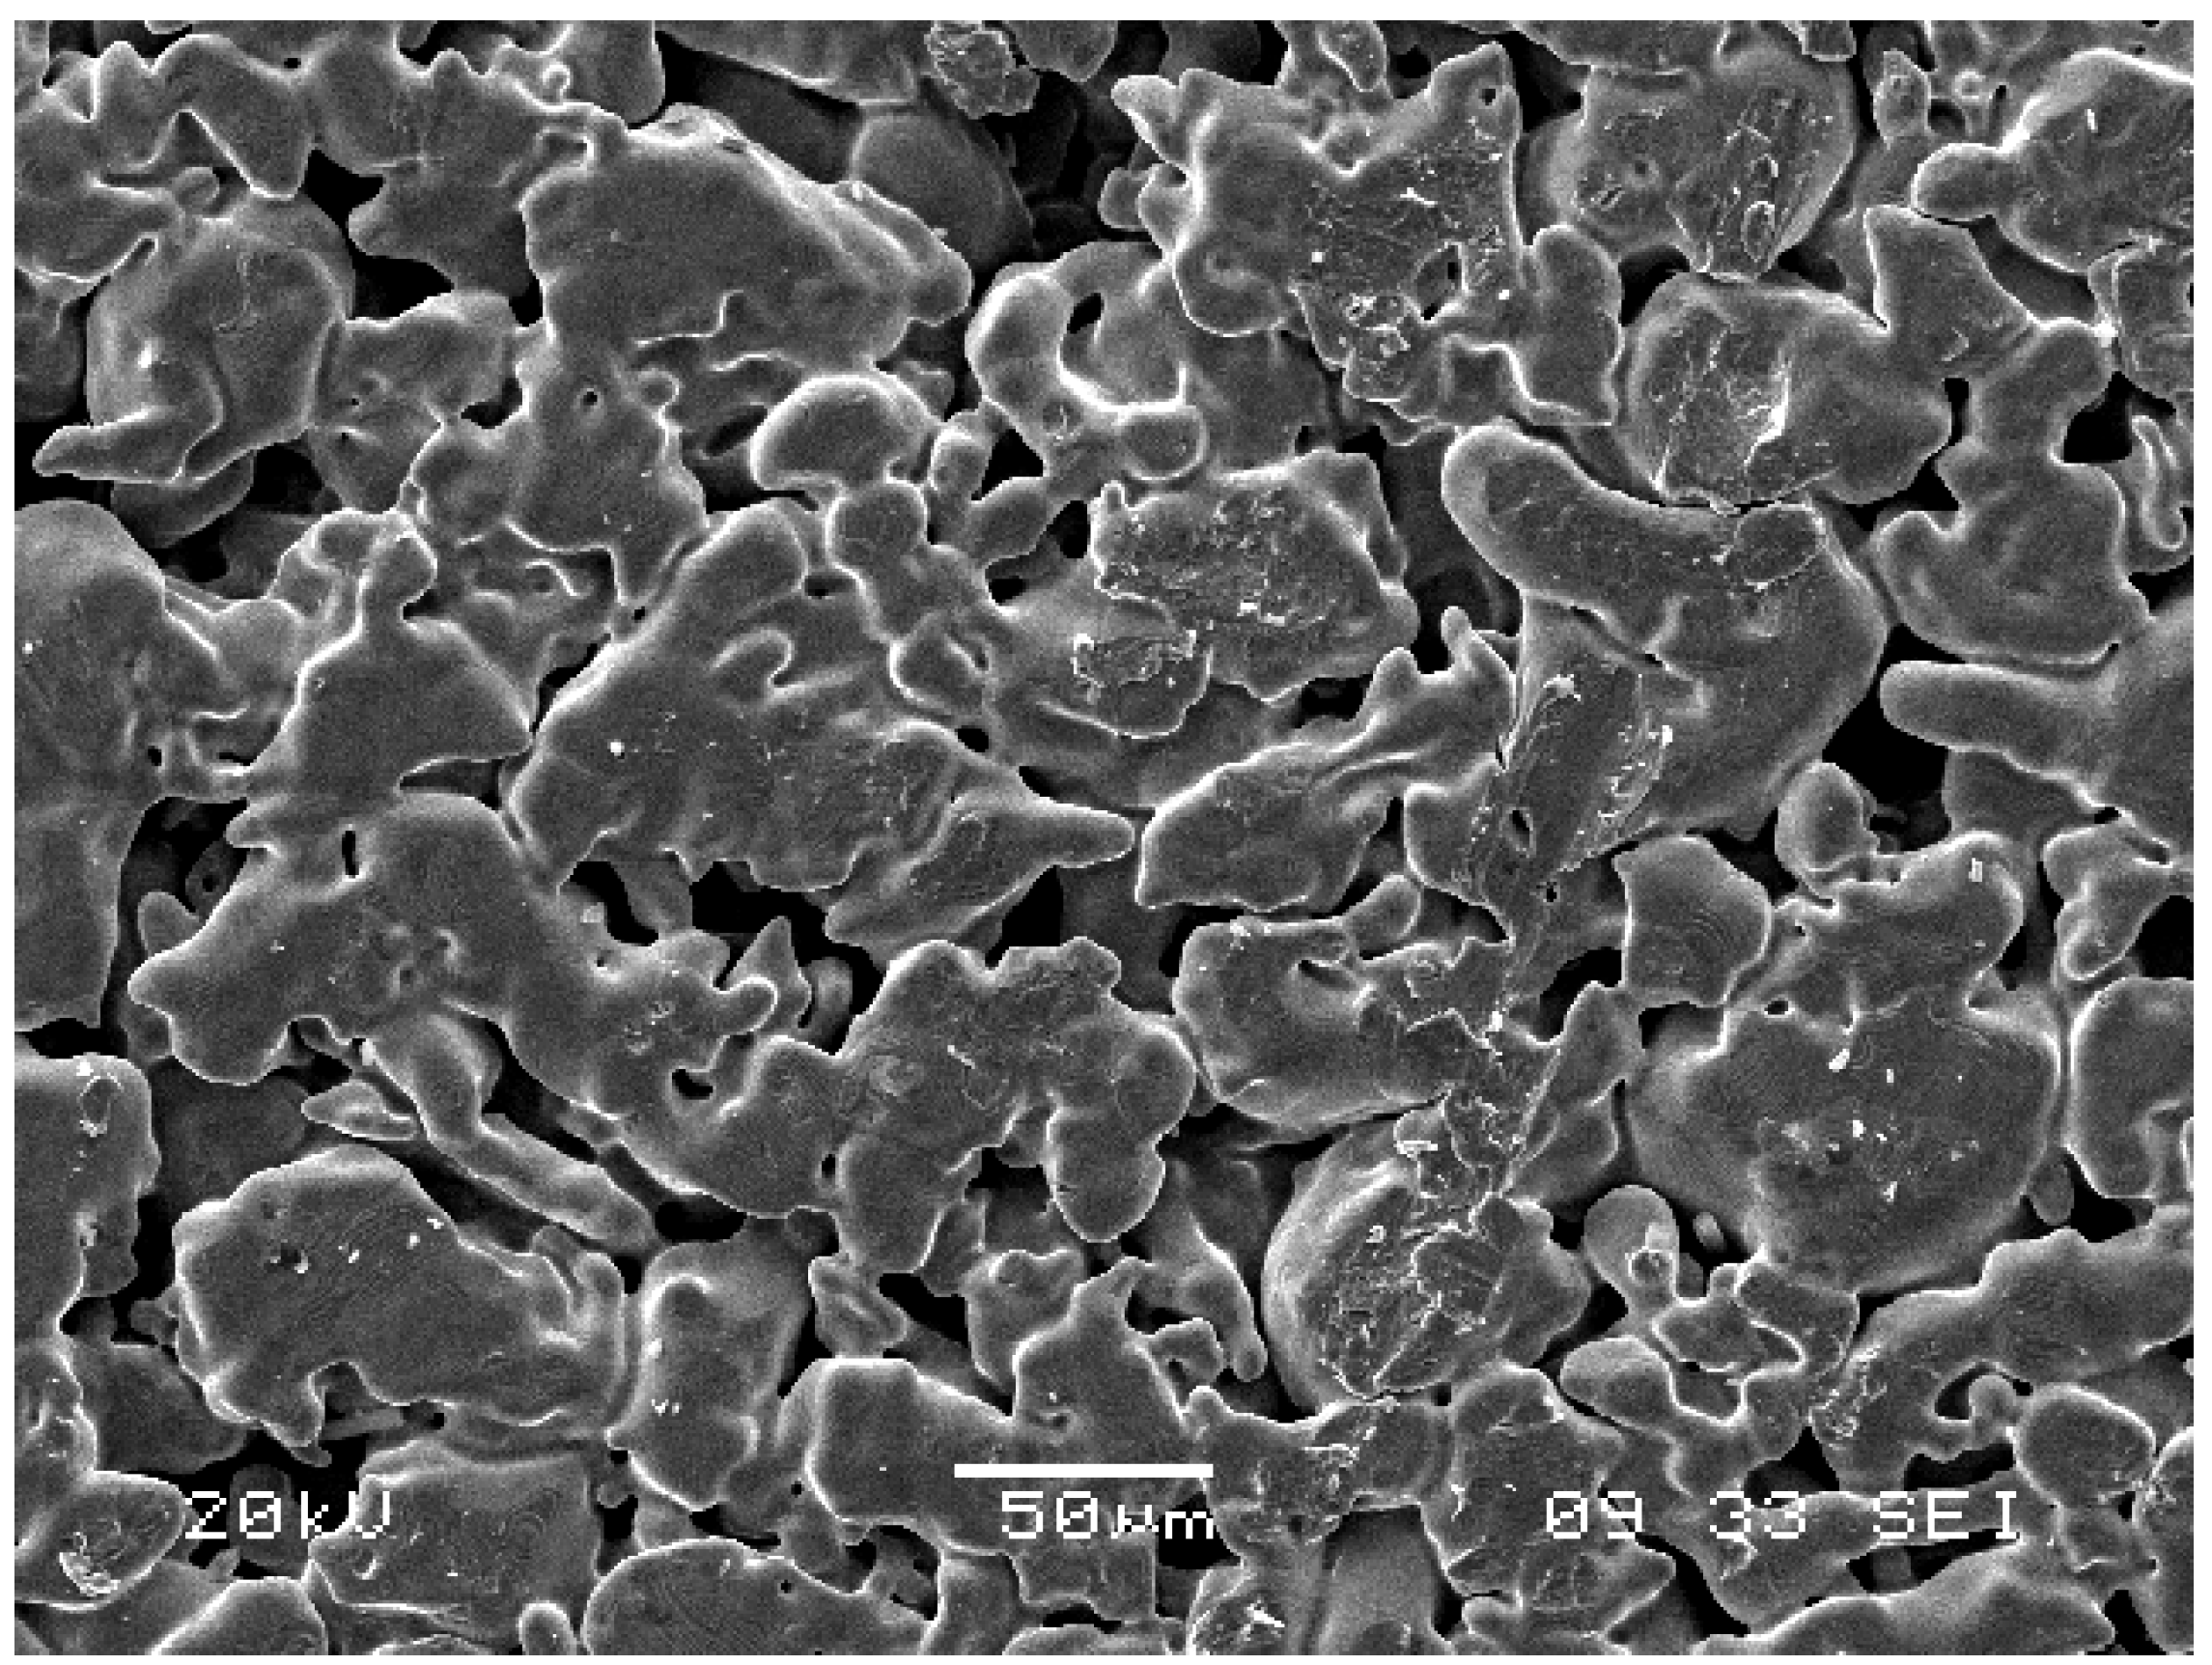
Porous metal filters were purchased from Mott Corporation (Farmington, CT, USA). The flat thin discs had diameter of 19 mm and thickness of 1.5 mm. They were made of stainless-steel 316L SS by process of axial compaction and sintering. Two samples of porous metal filter, differing in porosity and specific surface area, were studied. Their basic properties were obtained using standard methods—helium pycnometry (AccuPyc1330), mercury porosimetry (AutoPore III), and physical adsorption of krypton (ASAP 2010M), all instruments from Micromeritics (Norcross, GA, USA), (see Table 2). Typical image of porous metal filter F1 is depicted in Figure 2.
Table 2.
Physical properties of porous metal filters.
| Sample | Porosity | Bulk density (g·mL−1) | Specific surface area (μm−1) | Median pore diameter (μm) |
|---|---|---|---|---|
| F1 media grade 0.5 | 0.178 | 6.377 | 0.089 | 3.55 |
| F2 media grade 0.2 | 0.201 | 6.255 | 0.110 | 2.70 |

Figure 2.
SEM image of porous metal filter.
Figure 2.
SEM image of porous metal filter.
For preparation of cross-sections of porous metal filters, the samples were impregnated with epoxy resin under low pressure. Epoxy resin (Araldite, Struers, GmbH, Germany) was found to be suitable for filling of pores because of its low viscosity, good adhesion to the material, and little shrinking after hardening. The impregnated porous samples (casts) were exposed to the pressurized nitrogen (~10 MPa, laboratory temperature) in an autoclave, to fill all pores perfectly before hardening. Then, the casts were treated at mild temperature (~40 °C) five hours. The hardened blocks were cut using a diamond saw in arbitrary direction, lapped, and polished. The procedure of cutting, lapping and polishing was repeated several times to collect images from different polished sections.
3.2. Imaging and Image Processing
The polished sections were observed in a scanning electron microscope (SEM JSM−5500LV, JEOL, Tokyo, Japan). The polished cross-sections were sputtered with a slight layer of platinum, to take away the electrical charge from their surface. The spatial resolution enhancement and microscope response were also maximized. Series of back-scatter electron (BSE) images of uniform size of 1280 × 960 pixels were obtained from statistically representative parts of the porous media. The raw intensity images (256 grey levels) revealed the excellent contrast and resolution (Figure 3a). All microphotographs were smoothed using series of order statistics filters (adaptive median, percentile) [7]. The images were then segmented by Otsu’s segmentation method [8], see Figure 3.
3.3. Microstructural Descriptors
The selected microstructural descriptors, particularly total porosity, ϕ, two-point probability function, S2(u) , lineal path functions, Lp(u) and Lm(u), and two-point cluster functions, Cp(u) and Cm(u), for void and solid phases [9], were evaluated for each digitized 2D image. The total porosity means the probability that randomly thrown point falls into the void (porous) phase. The S2(u) function is the probability that both ends of a line segment of distinct length u fall in the porous phase when this segment is randomly thrown into the digitized porous medium. The Lp(u) or Lm(u) functions are defined in a similar way to S2(u). The difference is, the thrown line segment lies entirely in the void or in the solid phase, respectively. The descriptors S2(u), Lp(u) and Lm(u) have common courses for both 2D and 3D spaces, and therefore they are suitable for reconstruction of 3D microstructures from their 2D images. All descriptors were averaged in the two principal and two diagonal directions, assuming no periodic boundary conditions. It can be seen from Figure 4 that the microstructural descriptors were quite independent on the direction of sampling. Both porous metal filters exhibit properties of a statistically isotropic porous material.
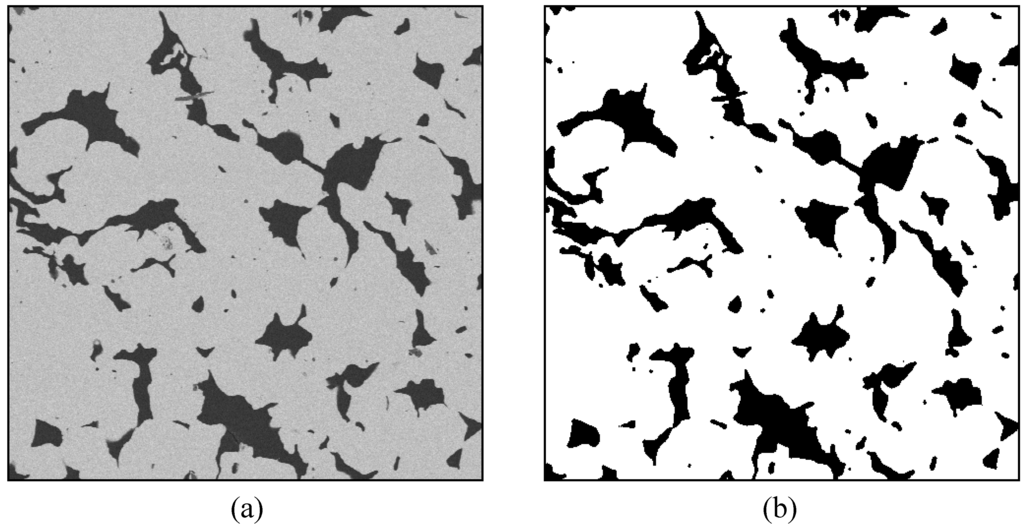
Figure 3.
Part of back-scatter electron (BSE) image of the porous filter F1 (magnification 200×, cut size 480 × 480 pixel, 0.5 micron/pixel). (a) Original intensity image, in which pores are dark grey and metal is light grey; (b) The same image after filtration and segmentation, pores are black and metal is white.
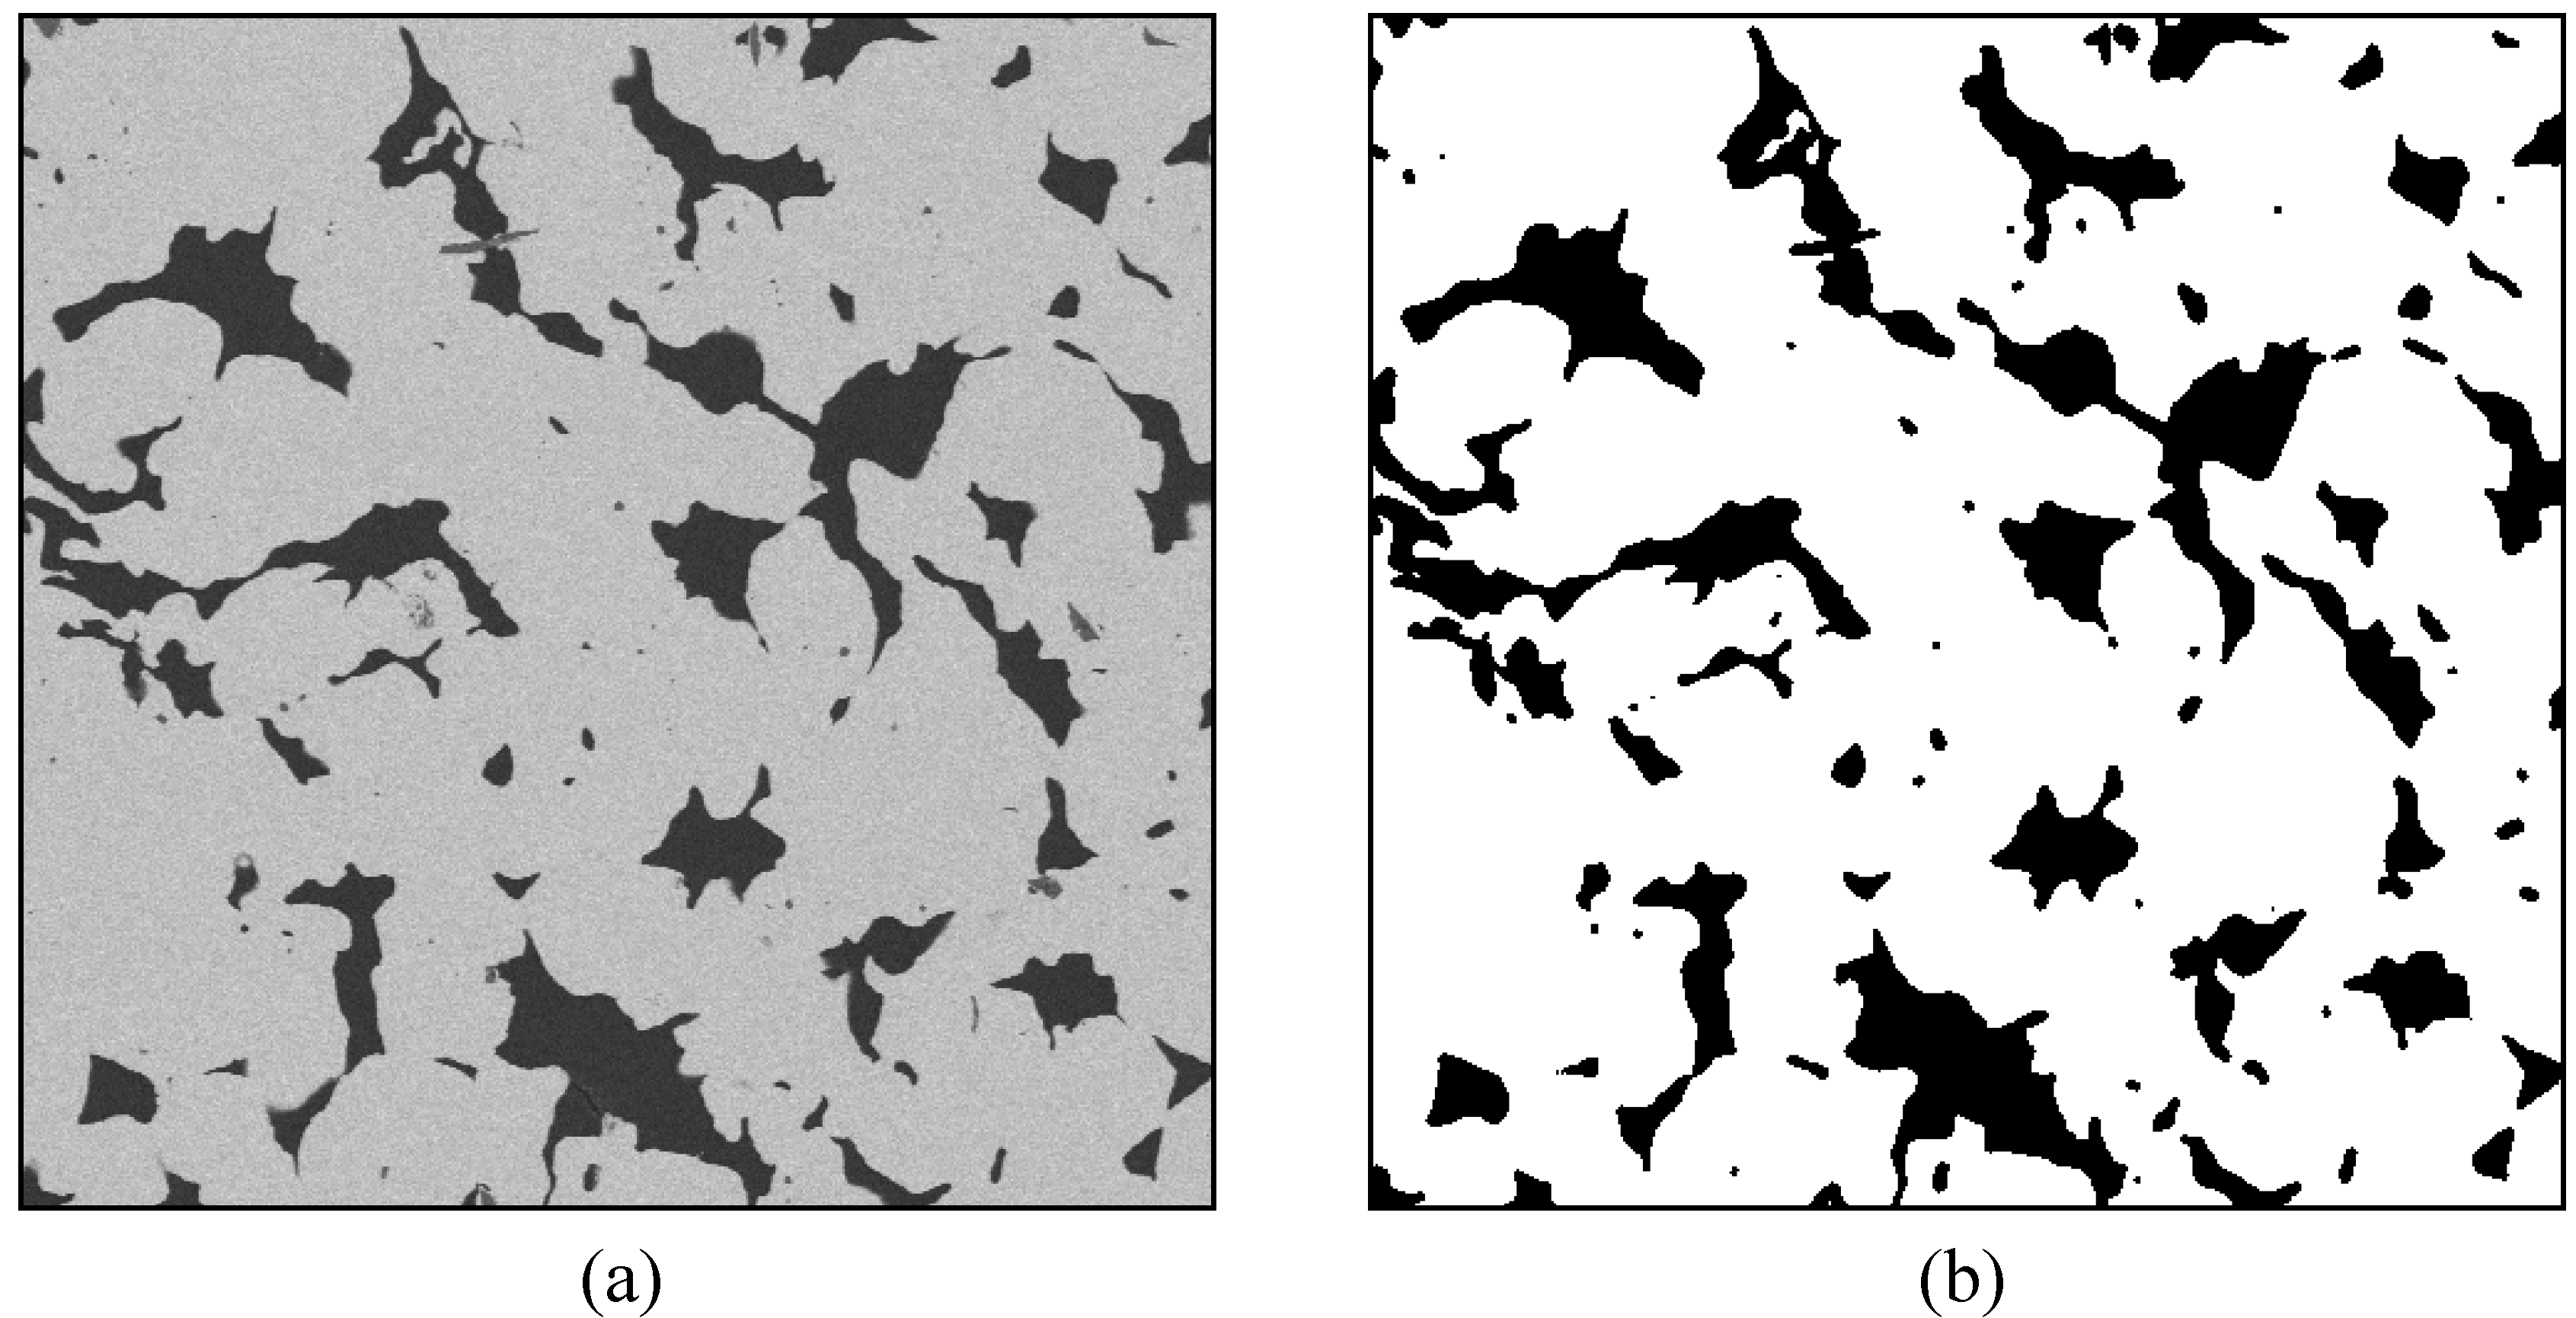
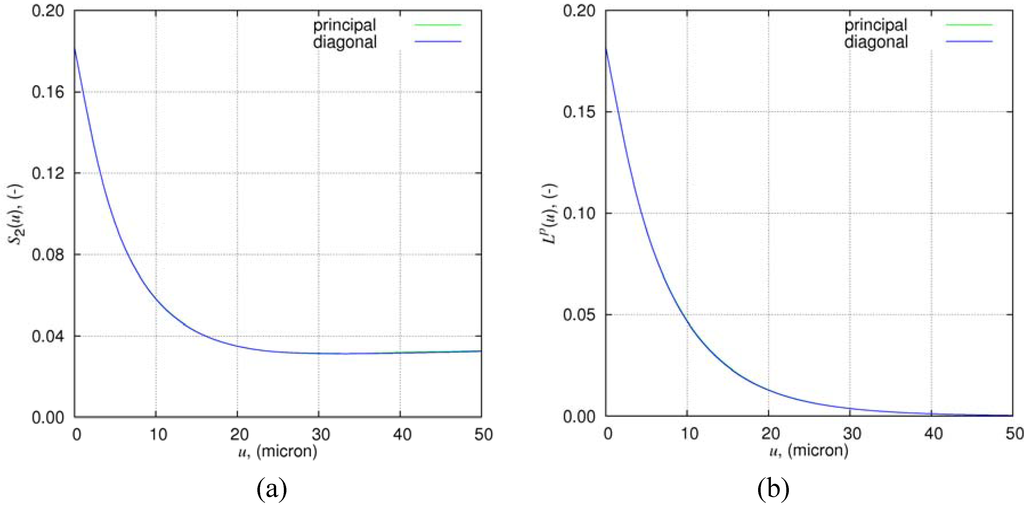
Figure 4.
(a) Two-point probability function for void phase; (b) Lineal-path function for void phase of the porous filter F1. The microstructural descriptors are calculated in both principal and diagonal directions; their course in both directions is almost the same.
Figure 4.
(a) Two-point probability function for void phase; (b) Lineal-path function for void phase of the porous filter F1. The microstructural descriptors are calculated in both principal and diagonal directions; their course in both directions is almost the same.

3.4. Stochastic Reconstruction of Porous Metallic Filters
Stochastic reconstruction of porous metal filters was carried out by means simulated annealing method [9,10,11,12], modified by Čapek et al. [3,4]. This technique is based on minimization of the objective function E, i.e., “energy” of the digitized system, defined as the sum of squared deviations between arbitrary number of reference microstructural descriptors, experimentally determined, and these ones calculated for considered replica. In principle, the initial random configuration of solid/void voxels (volume elements) with high energy content was transformed into a more correlated, low-energy configuration. Three microstructural descriptors, two-point probability function, S2(u) , lineal path functions for void/solid phases, Lp(u) and Lm(u) were used as constraints during time of reconstruction. The two-point cluster function, Cp(u), was used only indirectly for adjustment of two special parameters controlling of our reconstruction procedure. Preliminary reconstruction of the two-dimensional images served for estimation of those parameters [3,4].
3.5. Calculation of Effective Permeability
Permeability of porous metal filter was simulated in the Knudsen region, in which the frequency of gas molecule-pore walls collisions is much higher then number of intermolecular collisions. In the calculations, random walk of gas molecules in the 3D reconstructed microstructure using Monte Carlo algorithm was applied. The relationship between the mean squared displacement,  of a walker and time t was used
of a walker and time t was used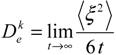
where  is the effective diffusivity of the walker in an isotropic porous medium. To eliminate the dependence on temperature and gas and to get the quantity directly compared with experimental results, was multiplied by ratio of the total porosity and the mean arithmetic velocity w. Thus, the effective pore size, κcal, represents the permeability of the porous metal filter.
is the effective diffusivity of the walker in an isotropic porous medium. To eliminate the dependence on temperature and gas and to get the quantity directly compared with experimental results, was multiplied by ratio of the total porosity and the mean arithmetic velocity w. Thus, the effective pore size, κcal, represents the permeability of the porous metal filter.The effective gas permeability βcal, when intermolecular collisions prevail over molecule-pore walls collisions (viscous flow regime), was derived by solving of the Stokes equation and equation of continuity under boundary conditions and the prescribed pressure difference across the opposite walls of reconstructed microstructure. The public domain “permsolver” from [13] was utilized. The pressure difference was adjusted along three principal axis and resulting “directional” permeabilities were taken as arithmetic mean of them to give the effective permeability βcal.
3.6. Measurement of Effective Permeability
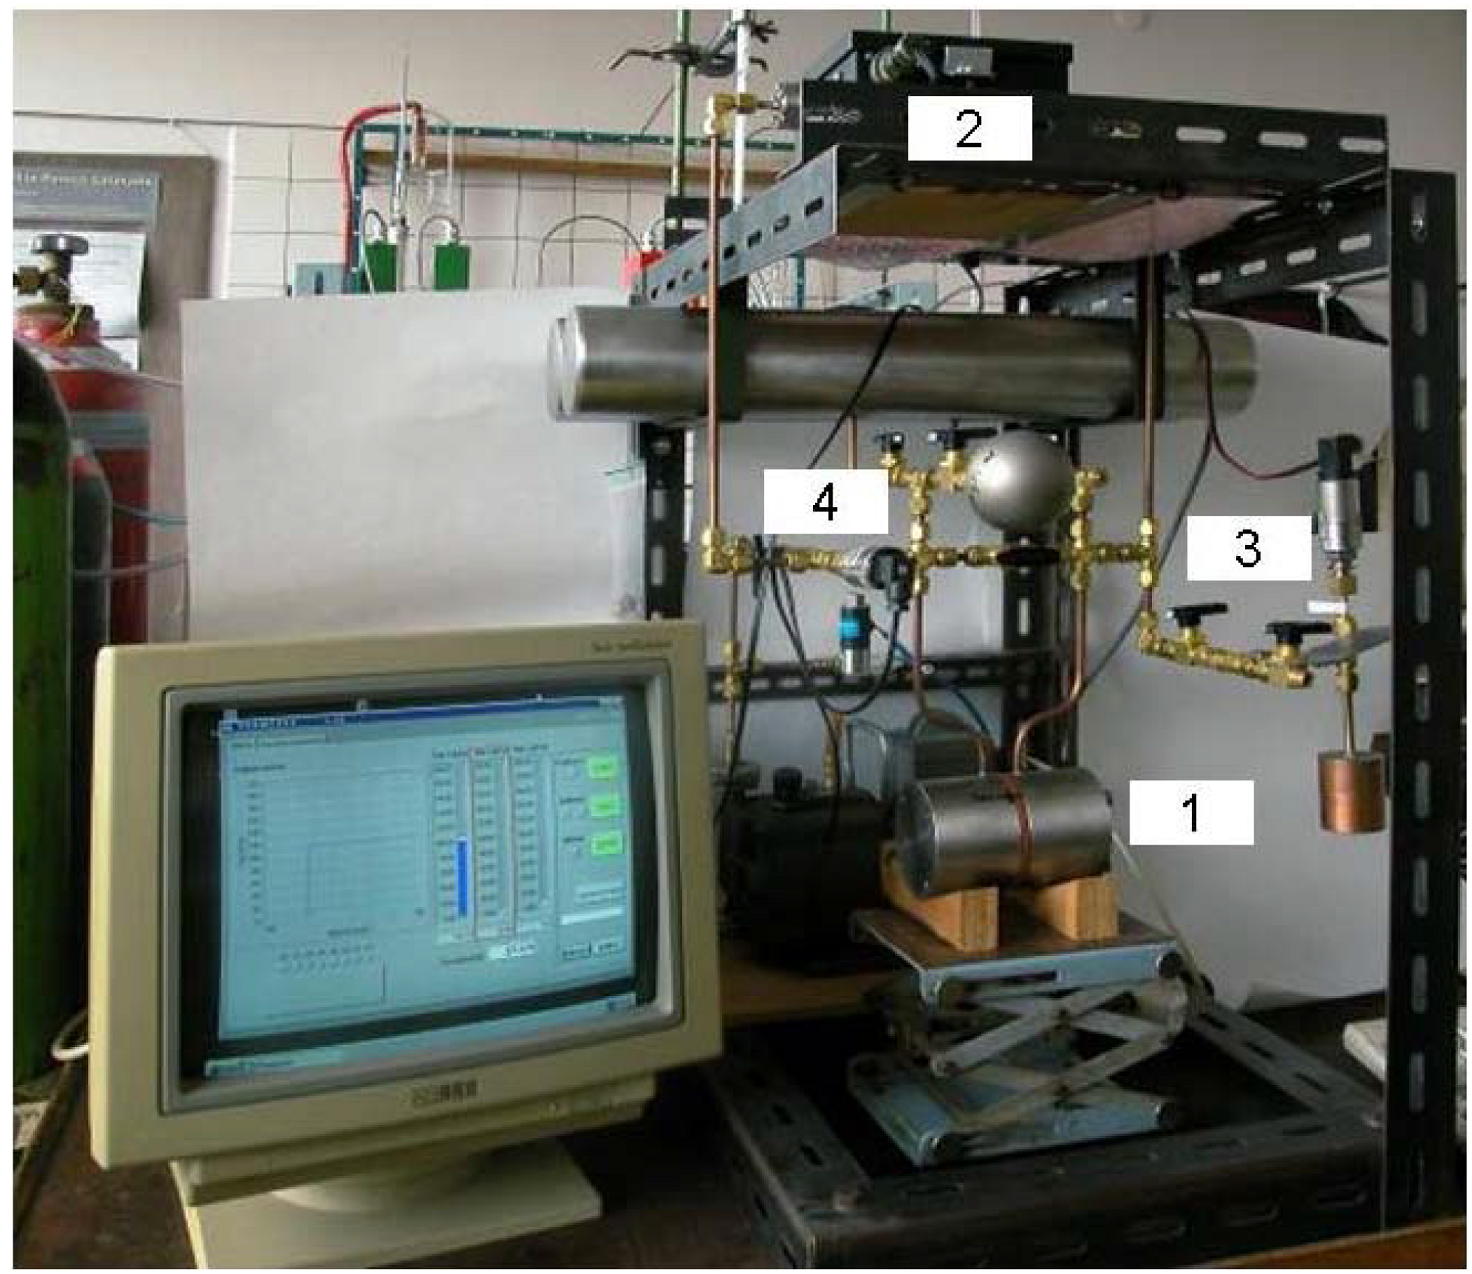
Effective permeability of both metal filters was measured in quasi-stationary permeation cell within the total pressure range from 1 to 25 kPa [14]. The experimental apparatus can be shown on Figure 5.
Macroscopically one-dimensional transport of a pure inert gas (hydrogen, nitrogen, helium, and argon) through the filters under laboratory conditions was considered. The transport parameters, κexp and βexp, were evaluated from repeated pressure responses using the constitutive equation:
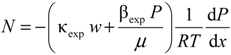
where N is the molar flux, w = (8RT/(πM))0.5 denotes the mean arithmetic velocity of a gas, R is the gas constant, M is the molecular weight, and x is the spatial coordinate identically oriented with macroscopic gas flow. The transport parameters respectively characterize permeability of a porous solid under Knudsen flow (κexp) and viscous flow (βexp).

Figure 5.
Quasi-stationary permeation cell. (1) The cell; between left and right chambers there is holder made of porous material; (2) Pressure difference transducer; (3) Gas manifold; (4) Pressure gauge.
Figure 5.
Quasi-stationary permeation cell. (1) The cell; between left and right chambers there is holder made of porous material; (2) Pressure difference transducer; (3) Gas manifold; (4) Pressure gauge.
4. Conclusions
This contribution presents a specific method developed for the reconstruction of a microstructure, based on the limited statistical information from 2D BSE images, of two real porous metal samples. The 3D reconstruction of porous materials was provided by applying a simulated annealing technique, utilizing low-order pore-space information (microstructural descriptors): total porosity, two-point probability function, lineal path functions for porous and metal phases derived from processed image sets.
The porous and metal phases formed large clusters in the 3D reconstructed porous metal replicas, whereas non-percolating clusters took only negligible fractions of both phases. The method used in this study was capable of reproducing good connectivity of both phases. The microstructure of replicas here described was characterized by using 3D microstructural descriptors capturing long-range pore connectivity, particularly total fraction of percolating cells. Theoretical values of permeability of both porous replicas were compared with their experimental counterparts measured by means of quasi-steady state permeation of four inert gases through the real filters. A good correspondence between both values was found.
The reconstruction method proposed in [3,4] offers an opportunity to obtain 3D replicas that well model percolation properties of real low-porosity media. Such replicas are useful for study of relationships between effective transport/mechanical properties and the microstructure.
Acknowledgments
The authors are greatly appreciated for financial support from the Czech Science Foundation, grant projects No. 203/09/1353, and P204/11/1206. We also thank L. Brabec for imaging the polished sections.
Conflict of Interest
The authors declare no conflict of interest.
References
- Lymberopoulos, D.P.; Payatakes, A.C. Derivation of topological geometrical and correlation properties of porous media from pore-chart analysis of serial tomography data. J. Colloid Interface Sci. 1992, 150, 61–80. [Google Scholar] [CrossRef]
- Spanne, P.; Thovert, J.F.; Jacquin, C.J.; Lindquist, W.B.; Jones, K.W.; Adler, P.M. Synchrotron computed microtomography of porous media: Topology and transports. Phys. Rev. Lett. 1994, 73, 2001–2004. [Google Scholar] [CrossRef]
- Čapek, P.; Hejtmánek, V.; Brabec, L.; Zikánová, A.; Kočiřík, M. Stochastic reconstruction of particulate media using simulated annealing. Transp. Porous Med. 2009, 76, 179–198. [Google Scholar] [CrossRef]
- Čapek, P.; Hejtmánek, V.; Kolafa, J.; Brabec, L. Transport properties of stochastically reconstructed porous media with improved pore connectivity. Transp. Porous Med. 2011, 88, 87–106. [Google Scholar] [CrossRef]
- Biswal, B.; Manwart, C.; Hilfer, R. Three-dimensional local porosity analysis of porous media. Physica A 1998, 255, 221–241. [Google Scholar] [CrossRef]
- Hilfer, R. Local porosity theory and stochastic reconstruction for porous media. In Statistical Physics and Spatial Statistics, Lecture Notes in Physics; Mecke, K., Stoyan, D., Eds.; Springer-Verlag: Heidelberg, Germany, 2000; Volume 254, pp. 203–241. [Google Scholar]
- Gonzales, R.C.; Woods, R.E. Digital Image Processing, 2nd ed; Prentice Hall: New Jersey, NJ, USA, 2002. [Google Scholar]
- Otsu, N. A threshold selection method from gray-level histograms. IEEE Trans. Syst. Man Cybern. 1979, SMC−9, 62–66. [Google Scholar]
- Torquato, S. Random Heterogeneous Materials: Microstructure and Macroscopic Properties; Springer Verlag: New York, NY, USA, 2002. [Google Scholar]
- Rintoul, M.D.; Torquato, S. Reconstruction of the structure of dispersions. J. Colloid Interface Sci. 1997, 186, 467–476. [Google Scholar] [CrossRef]
- Yeong, C.L.Y.; Torquato, S. Reconstructing random media. Phys. Rev. E 1998, 58, 495–506. [Google Scholar]
- Yeong, C.L.Y.; Torquato, S. Reconstructing random media II. Three-dimensional media from two-dimensional cuts. Phys. Rev. E 1998, 58, 224–233. [Google Scholar] [CrossRef]
- Bentz, D.P.; Martys, N.S. A Stokes Permeability Solver for Three-Dimensional Porous Media; U.S. Department of Commerce, Technology Administration, National Institute of Standards and Technology: Gaithersburg, MD, USA, 2007. [Google Scholar]
- Fott, P.; Petrini, G. Determination of transport parameters of porous catalysts from permeation measurements. Appl. Catal. 1982, 2, 367–378. [Google Scholar] [CrossRef]
© 2012 by the authors; licensee MDPI, Basel, Switzerland. This article is an open-access article distributed under the terms and conditions of the Creative Commons Attribution license (http://creativecommons.org/licenses/by/3.0/).