Article

The Effect of Electrolytic Temperature on the Purity of Electrolytic Pure Iron

1
School of Materials Science and Engineering, Shanghai University, Shanghai 200444, China
2
Zhejiang Institute of Advanced Materials, Shanghai University, Jiaxing 314100, China
3
Hebei Province Longfengshan Casting Industry Co., Ltd., Handan 056000, China
*
Authors to whom correspondence should be addressed.
Metals 2025, 15(9), 1055; https://doi.org/10.3390/met15091055
Submission received: 23 July 2025 / Revised: 10 September 2025 / Accepted: 17 September 2025 / Published: 21 September 2025

Abstract

The influence of electrolytic temperature on the purity grade of electrolytic pure iron, variations in elemental content, macroscopic morphology, and microstructural characteristics was studied using electrodeposition experiments alongside glow discharge mass spectrometry and scanning electron microscopy. As electrolyte temperature increased, the total impurity content in electrolytic pure iron decreased; the iron reached a purity level of 4N1 (99.991%) when electrolyzed at 75 °C. The content of gaseous elements also decreased with increasing temperature, with a total content of only 46.07 ppm during electrolysis at 75 °C. Among the major metallic elements, the Ni content was minimally affected by temperature, while the concentrations of other metallic elements were at their lowest during electrolysis at 75 °C, remaining below 0.5 ppm, except for elements such as Co, Cu, Ni, and Zn. With an increase in the electrolyte temperature, the macroscopic morphology evolved into a smooth, silver-white surface. The microstructure on the surface evolved into an irregular polygonal nucleus structure, and the microstructure on the cross-section exhibited a striped characteristic. Therefore, electrolytic pure iron with a purity exceeding 4N, exhibiting both excellent macroscopic and compact structures, can be prepared at an electrolytic temperature of 75 °C.

Graphical Abstract

1. Introduction

Iron is not only an indispensable material for human civilization but also an essential element for biological evolution and sustained existence on Earth. Currently, steel is primarily produced by smelting iron ore, which consumes significant amounts of coke and results in substantial CO2 emissions. In 2023, over 1 billion tons of crude steel was produced in China, resulting in nearly 1.8 billion tons of CO2 emissions and accounting for approximately 15% of the country’s total carbon emissions [1]. Ironmaking constitutes approximately 70% of total emissions throughout the production process [2].
To reduce CO2 emissions in the steel industry, the carbon input can be decreased or even eliminated. Among these, electrochemical ironmaking is a promising method. It is characterized by its relatively simple reaction principle, and the equipment operation involved is convenient for producing ultrapure iron. This method is distinguished by its low cost, short processing time, and high operational efficiency. The produced high-purity electrolytic pure iron not only possesses excellent ductility but also exhibits good soft magnetic properties, physical properties, and corrosion resistance [3]. Therefore, the production of high-purity iron via low-cost electrochemical methods is attracting significant research [4,5,6,7,8,9,10,11,12,13].
The purity of iron is usually represented by “N” (the first letter of the English word “nine”) followed by a number. The purity of industrial-grade pure iron is generally between 2N5 and 3N, while iron with a purity range of 3N–4N is referred to as high-purity, and that with a purity greater than 4N is classified as ultrapure. As early as the 1930s, Japan’s Showa Denko K.K. had already utilized solutions of ferrous sulfate and ferrous chloride to electrolyze and produce electrolytic pure iron with a purity level of 4N to 5N. Particularly, Toyo Lead Co., Ltd., was able to independently produce electrolytic pure iron with a purity close to 5N and achieve commercial production. To prepare electrolytic pure iron with good macroscopic morphology and ultra-high purity, researchers have analyzed the factors influencing the purity, surface quality, and deposition efficiency of electrolytic pure iron. They concluded that these are primarily affected by parameters [14,15,16,17,18,19,20,21,22,23] such as the electrolyte temperature [24,25,26,27], current density [28,29,30], and pH [31,32,33,34,35,36] of the electrolyte.
Cao Dawei from Fuzhou University [37] selected FeCl2 as the electrolyte. The current density was set to 400–600 A/m2, and the electrolyte temperature was 90 °C, while the pH value range was 2–3. Electrolytic pure iron was successfully produced in this study. Qin Yan [38] used an ion exchange membrane to extract Fe from FeCl2 electrolyte while regenerating FeCl3 solution. The study showed that at pH = 1.3, the electrolyte temperature was 35 °C, the current density was 15 A/dm2, and the distance between the anode and cathode plates was 30 mm, with the latter capable of reaching 96% current efficiency. Chen Daiming [39] and Dong Hongbo [40] achieved the conversion of solar energy into electrical energy. FeCl2 was used as the electrolyte, and NaCl and ascorbic acid were used as additives. They produced electrolytic pure iron with a smooth surface and silver-white metallic shine. Cao Weimin et al. [41] employed FeCl2 as an electrolyte. The concentration of NaCl was 2 mol/L, the current density was 1–2 A/dm2, the electrolyte temperature was 95 °C, the pH was 3–4, and the anode and cathode plates were made of pure iron and titanium, respectively. Under these electrolytic conditions, electrolytic pure iron with a maximum purity of 99.983% was obtained. Lu Weichang et al. [42] used FeCl2 as the electrolyte, and the current density ranged from 0.1 to 0.2 A/cm2, the electrolytic temperature was 75–100 °C, and the pH was 2.5. The anode materials were pure iron, low-carbon steel, or waste iron scrap, while the cathode was made of titanium or titanium alloys. Using these electrolytic parameters, pure iron foils with a thickness of 20–100 μm and purity of 99.8% were produced.
Therefore, the process parameters and combinations in electrolytic pure iron production are crucial factors in determining the macroscopic morphology, microstructure, and purity grade of electrolytic pure iron. Targeted research on these parameters is necessary to achieve the industrial production of ultrapure electrolytic pure iron.
This study was based on a ferrous chloride solution, maintaining the same ferrous ion concentration, electrolyte pH, and current density. Different electrolysis temperatures were selected to investigate their effects on the macroscopic morphology, microstructure, and purity grade of electrolytic pure iron to determine the optimal electrolyte temperature. The aim of this study is to obtain electrolytic pure iron with good macroscopic morphology and high purity.

2. Materials and Methods

2.1. Materials and Electrode

FeCl2 is the primary component of the electrolyte. It is prepared by fully dissolving ferrous chloride tetrahydrate (FeCl2·4H2O, ≥99.7%) in pure water. A high-purity titanium plate with dimensions of 700 mm × 700 mm × 2 mm was used as the cathode. The anode was made of DT4 industrial pure iron, with the following dimensions: 760 × 820 × 2 mm. A 50 mm gap was maintained between the anode and cathode plates during the electrolysis process. Before electrolysis began, the anode and cathode plates were cleaned by soaking them in dilute hydrochloric acid, followed by washing them with water, grinding them, and polishing them before the electrolysis process. The process parameters of the electrolytic experiment are listed in Table 1, and the composition of FeCl2·4H2O is presented in Table 2. Since a certain amount of impurity elements is contained in the electrolyte, high-purity micron-sized iron powder was added to the electrolyte before electrolysis. Metal ions such as Cu2+ and Pb2+, which are less reactive than iron, were replaced from the electrolyte. These metallic elements were eliminated, leading to the further purification of the electrolyte.
PVC material was used for the electrolysis cell in this experiment. It can hold 4 m3 of solution. A PP filtration barrel was employed to circulate and filter the electrolyte, effectively removing impurities. The current and pH of the electrolyte were measured every hour, with the latter measured using a handheld pH meter. Hydrochloric acid was added to adjust the pH of the solution. The materials and experimental apparatus used in this study are listed in Table 3. As a result of the elevated electrolysis temperature, the electrolyte experienced evaporation losses. Further, as the experiment was carried out in an industrial environment, professional staff members were scheduled for 24 h shift operations. The liquid level difference between the electrolysis tank and the overflow tank was observed every hour, and that between the electrolytic cell and the overflow tank was constantly observed. When the difference exceeded 20 cm, pure water was added promptly, and the electrolyte was replenished.
The anode plate was removed after electrolysis was completed and immersed in dilute hydrochloric acid for future use. The electrolytic pure iron deposited on the cathode was then detached. Electrolytic pure iron was washed, and after the drying treatment, its weight was measured. The sample was sent for analysis and testing.

2.2. Electrolytic Refining Process

A schematic diagram of the principle of electrolytic pure ironmaking is shown in Figure 1a. The actual onsite production process is shown in Figure 1b. As the anode plate used is soluble industrial pure iron, the anode plate is gradually completely dissolved during the electrolysis process. Fe2+ ions are continuously replenished in the electrolyte, and intermittent additions of electrolyte raw materials to the electrolyte are unnecessary. Further, the concentration of Fe2+ ions in the electrolyte is not influenced. Common materials used in this type of process primarily include iron products, such as scrap iron, low-carbon steel, and regenerated cast iron [17,27,28]. However, the soluble anodes used contain significant impurities, which may result in contamination of the purity of the electrolyzed products. Thus, most researchers employ raw materials with lower impurity element content, such as industrial pure iron, to better adjust the balance of Fe2+ ions during the electrolysis process by reducing impurities in the raw material. This helps to increase purity.
In Figure 1b, the anode, cathode, electrolytic cell, and power distribution cabinet are indicated by red arrows. In industrial production, the electrolysis pure iron production line employs an electric heating boiler, with the outlet water temperature restricted to 85 °C. With a limited heating capacity, heat is lost during transport through the heating pipes. As a result, the electrolyte temperature cannot be raised any further. Therefore, the highest temperature in the experimental design was set at 75 °C to align with actual industrial production conditions.

2.3. Material Characterization

Five electrolysis experiments were carried out at different electrolyte temperatures. Samples of electrolyzed pure iron were collected from each experiment, and the electrolyzed pure iron was subjected to a drying process. The elemental composition was also tested. The average and standard deviation of the test results were calculated.
The gas elements, carbon content, and sulfur content in electrolytic pure iron at different temperatures were analyzed using a carbon–sulfur analyzer (CS844) and an oxygen–nitrogen–hydrogen analyzer (ONH836) from LECO (St. Joseph, MI, USA). All measurable impurity elements, except for the aforementioned ones, were tested using a Glow Discharge Mass Spectrometer (GDMS) (Thermo Fisher Scientific, Waltham, MA, USA). Metallographic samples were cut from the center of the electrolytic pure iron plates using a wire-cutting machine, and cross-sections of the electrolytic pure iron samples at different temperatures were sequentially ground, polished, and etched using a 4% nitric acid alcohol solution as the corrosion agent. The surface and cross-sectional microstructures of the electrolytic pure iron samples at different temperatures were observed using a scanning electron microscope (SEM) from FEI Company (Hillsboro, OR, USA).

3. Experimental Results

3.1. Purity Grade of Electrolytic Pure Iron

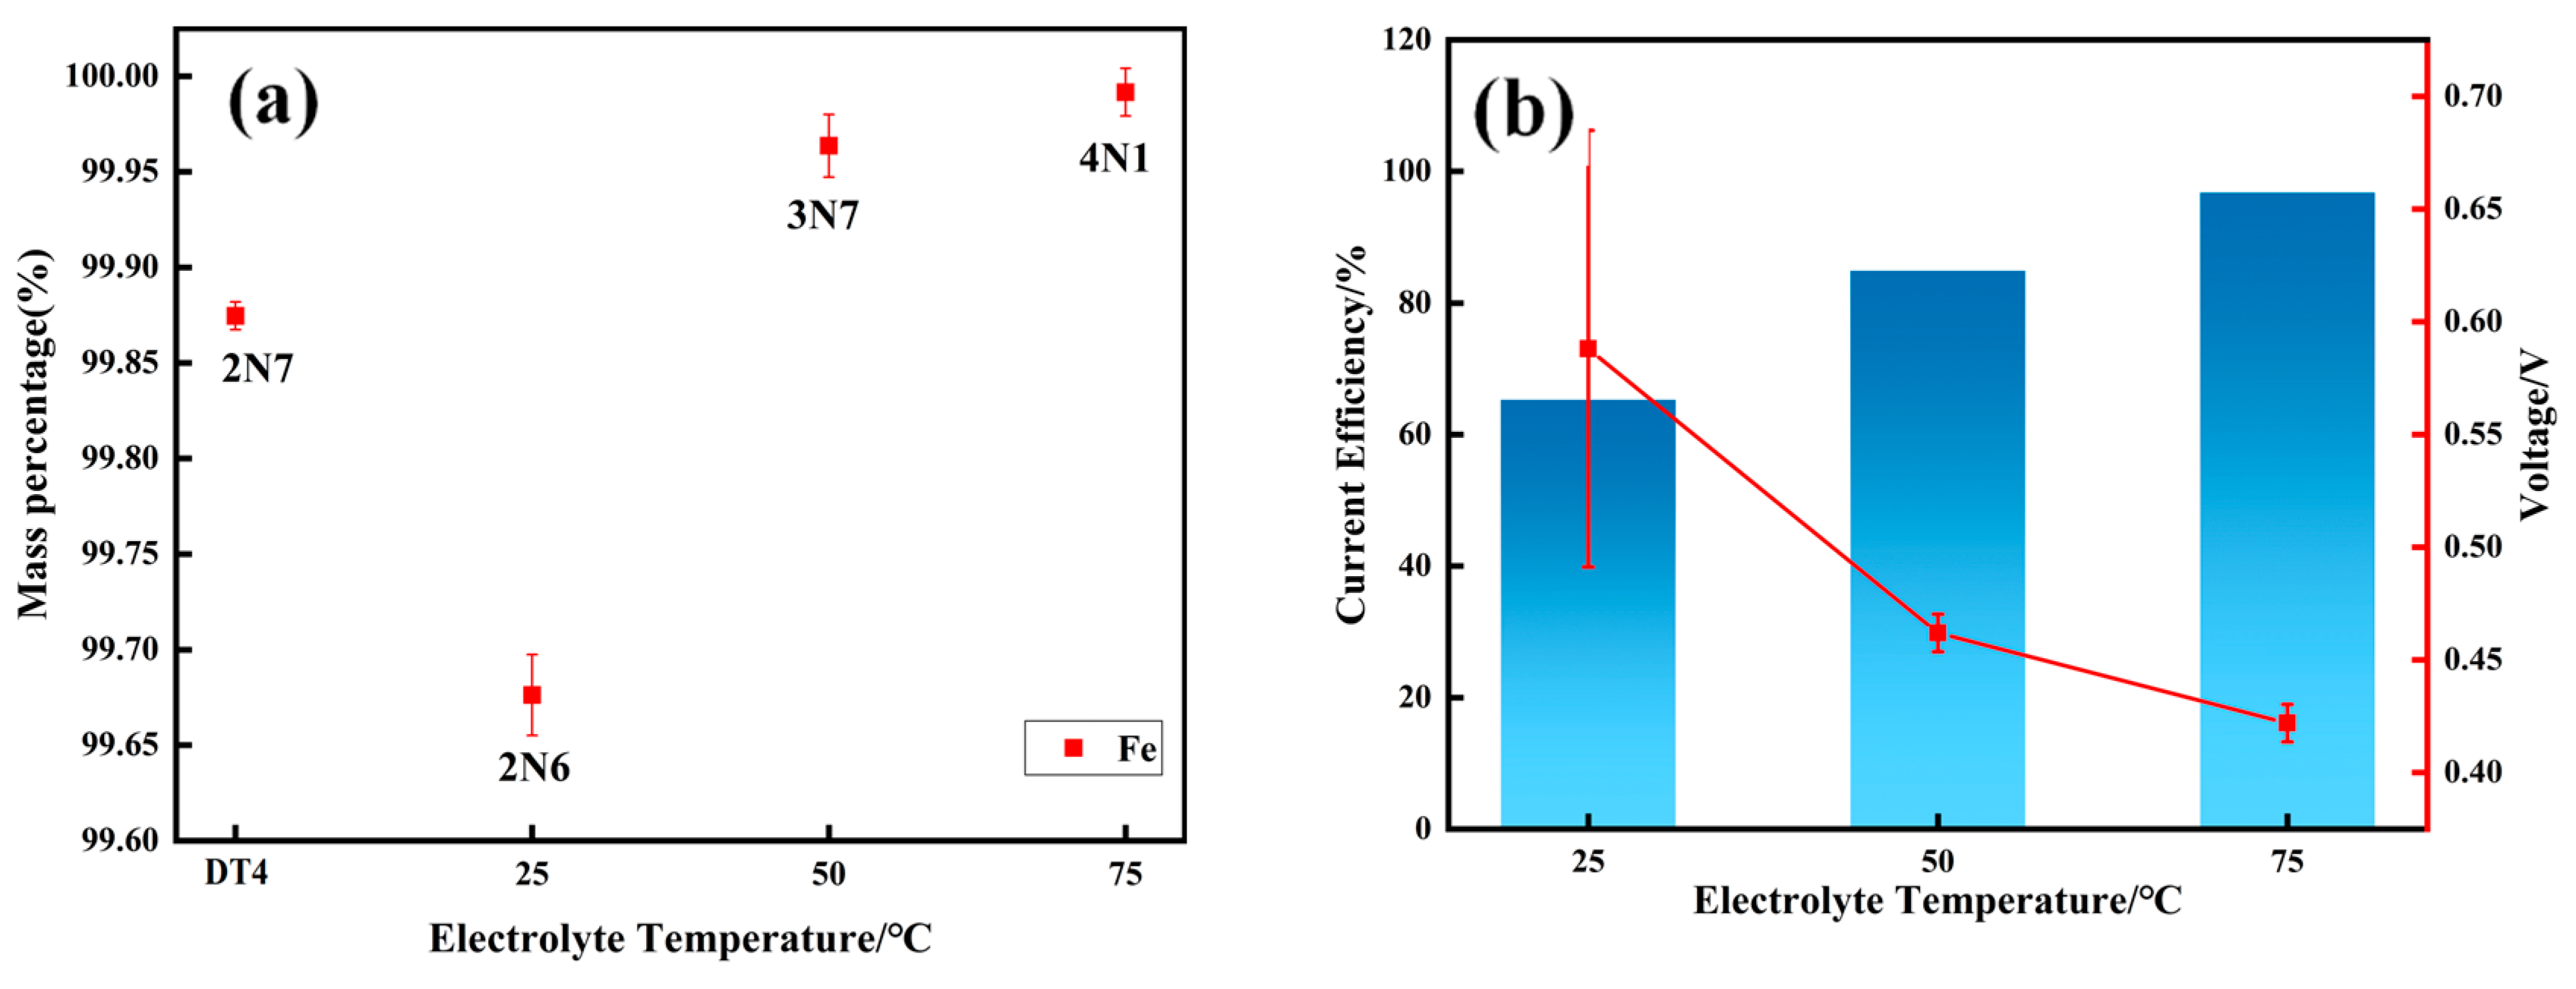
As the electrolyzed pure iron was purified from the anode plate, the purity of the electrolyzed iron at various electrolysis temperatures was compared with that of the anode plate DT4. In Figure 2a, the variation in the purity of electrolytic pure iron at different electrolyte temperatures is shown. When electrolyzing at 25 °C, the purity of the electrolytic pure iron was lower than that of the raw material (DT4). However, as the electrolytic temperature increased, the purity of the electrolytic pure iron improved. The higher the temperature, the higher the purity of the electrolytic pure iron is. In Figure 2b, the effect of electrolyte temperature on current efficiency and voltage variation is displayed. As the electrolysis temperature increased, the current efficiency gradually increased. Meanwhile, the voltage decreased steadily. As the temperature increased, the electrochemical polarization and concentration polarization of Fe(II) during discharge at both the anode and cathode were reduced. Furthermore, the electrolyte conductivity increased, resulting in a reduction in the voltage drop of the solution.
The experimental results of previous studies were compared with those of the present study. On one hand, this confirms that temperature can improve the macrostructure of electrolytic pure iron and enhance current efficiency. On the other hand, the experimental parameters in this study improved the purity of the electrolytic pure iron, successfully obtaining 4N high-purity iron while maintaining the macroscopic morphology and current efficiency. The comparison results are presented in Table 4.
The gas content in the electrolytic pure iron varied significantly with the electrolysis temperature. At an electrolytic temperature of 25 °C, the content of all elements, except nitrogen, was higher than that in the raw material (DT4). The oxygen content reached as high as 2850 ppm. With an increase in the electrolysis temperature, the gas elements, except for oxygen, were reduced to below 10 ppm. The residual oxygen content was reduced by a factor of 18. This indicates that an increase in temperature can effectively remove gas elements from electrolytic pure iron. When the electrolytic temperature was further increased to 75 °C, the total residual gas element content reached its lowest point of 46.07 ppm. The test results for the gas element content in electrolytic pure iron at different electrolysis temperatures are presented in Table 5.
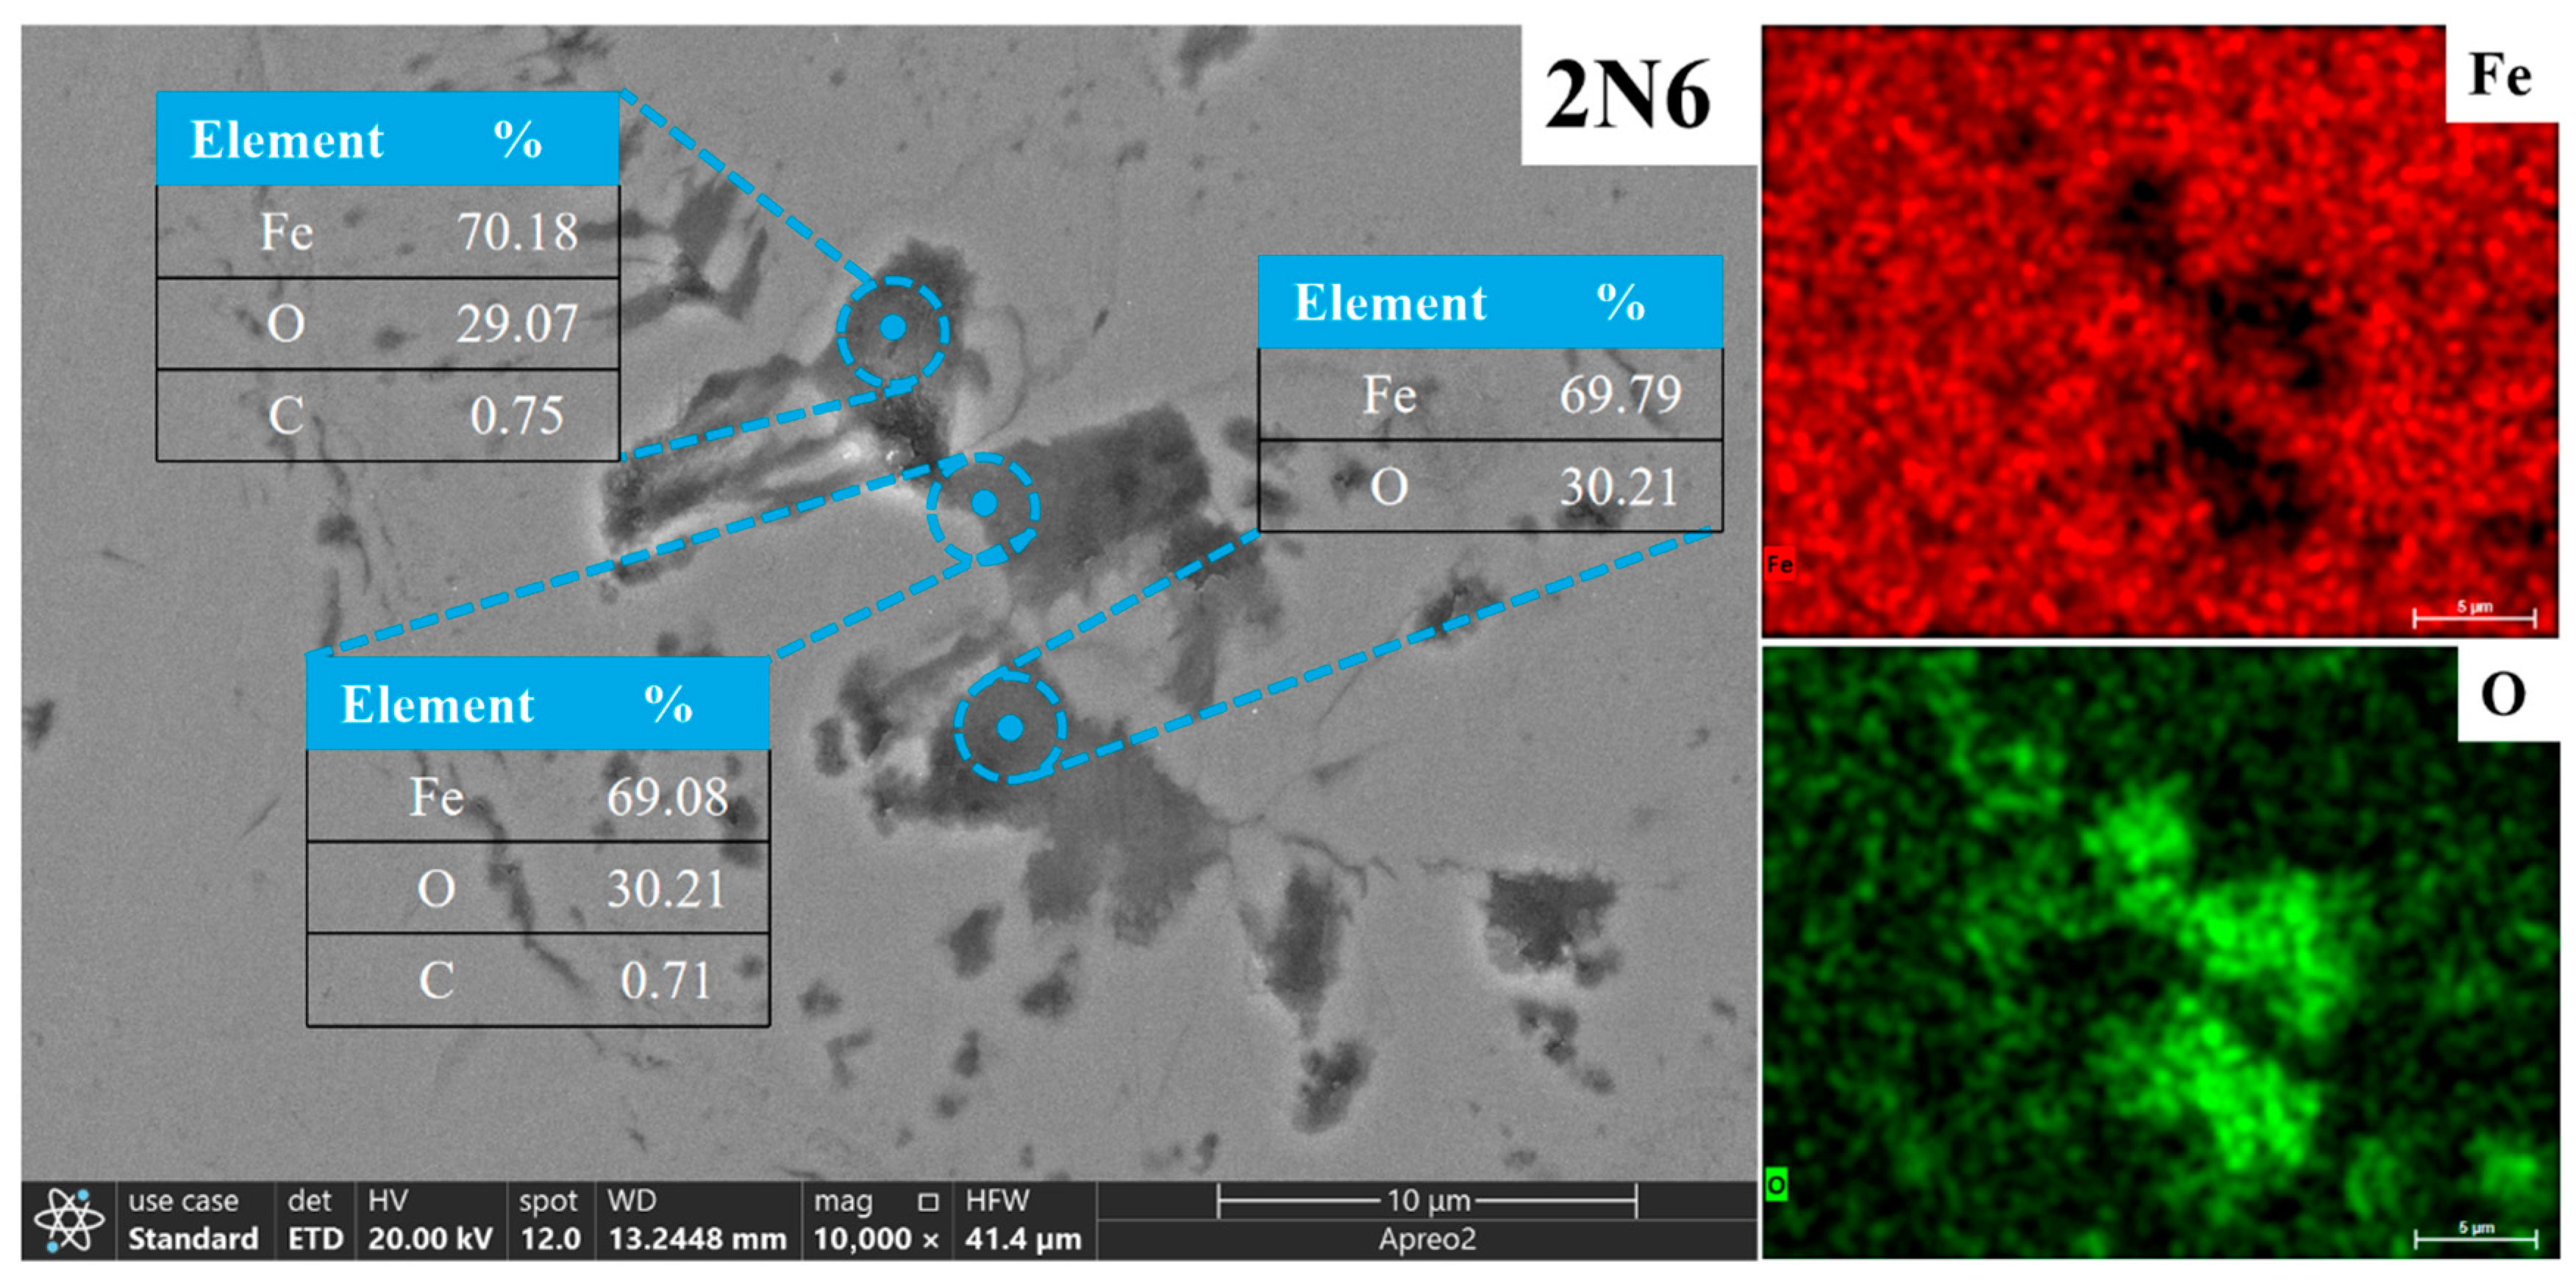
At 25 °C, the oxygen element was found to increase anomalously to 2850 ppm. To study the form of oxygen in electrolytic pure iron, energy spectrum analysis was performed on the 2N6 electrolytic pure iron. As shown in Figure 3, three inclusions were selected for point scanning. It was observed that O and Fe were the primary elements. Among them, oxygen accounted for nearly 30%.
Following the vacuum annealing reduction in the 2N6 electrolytic pure iron, a significant reduction in the oxygen content was observed. As shown in Table 6, based on the energy spectrum analysis in Figure 3, it can be concluded that the oxygen in the electrolytic pure iron exists as iron oxide [44].
The residual amounts of other impurity elements after electrolysis were relatively low, all below 0.05 ppm. Therefore, these elements are not discussed here. The test results for the contents of the major metallic elements in electrolytic pure iron at different electrolysis temperatures are listed in Table 7. Except for Ni, the contents of the major metallic elements decreased as the electrolyte temperature increased. The lowest content was observed during electrolysis at 75 °C, with all elements, except for Co, Cu, and Zn, below 0.5 ppm. The residual amounts of Co and Zn after electrolysis at 75 °C were higher than those in the raw material (DT4). The pollution is presumed to primarily stem from two factors in the industrial electrolysis process. (1) To reduce costs, electrolytes are reused in industrial applications. Impurity elements such as Co and Zn from the anode plate continuously dissolve and accumulate in the electrolyte during each electrolysis. This causes the concentration to increase with each electrolysis cycle. Consequently, the residual impurity content in the cathodic product increases. To address this issue, the common industrial solution is to periodically replace the electrolyte (with newly prepared electrolyte). (2) The iron-containing electrolytic sludge produced during electrolysis tends to firmly attach to the walls of the electrolytic tank, pipes, and filter surfaces. Hydrochloric acid is used for cleaning after each experiment. However, it has been demonstrated that completely removing these residues is very challenging. These contaminated surfaces of the equipment become a continuous source of impurity release during subsequent electrolysis processes.
As the electrolysis temperature was raised from 25 °C to 50 °C, a reduction in Ni content was observed. However, when the temperature was further increased from 50 °C to 75 °C, the Ni content increased. This indicates that temperature has a limited effect on Ni content. Co and Ni are considered iron-like elements with electrode potentials similar to those of Fe. As shown in Table 8, electrolytic refining primarily separates and purifies elements based on the potential difference between the impurities and Fe. Therefore, the removal of Co and Ni is difficult, and they are considered trace elements. When the electrolyte comes into contact with the equipment, it is easily contaminated by the external environment. This has a substantial impact on the content of Co and Ni elements.
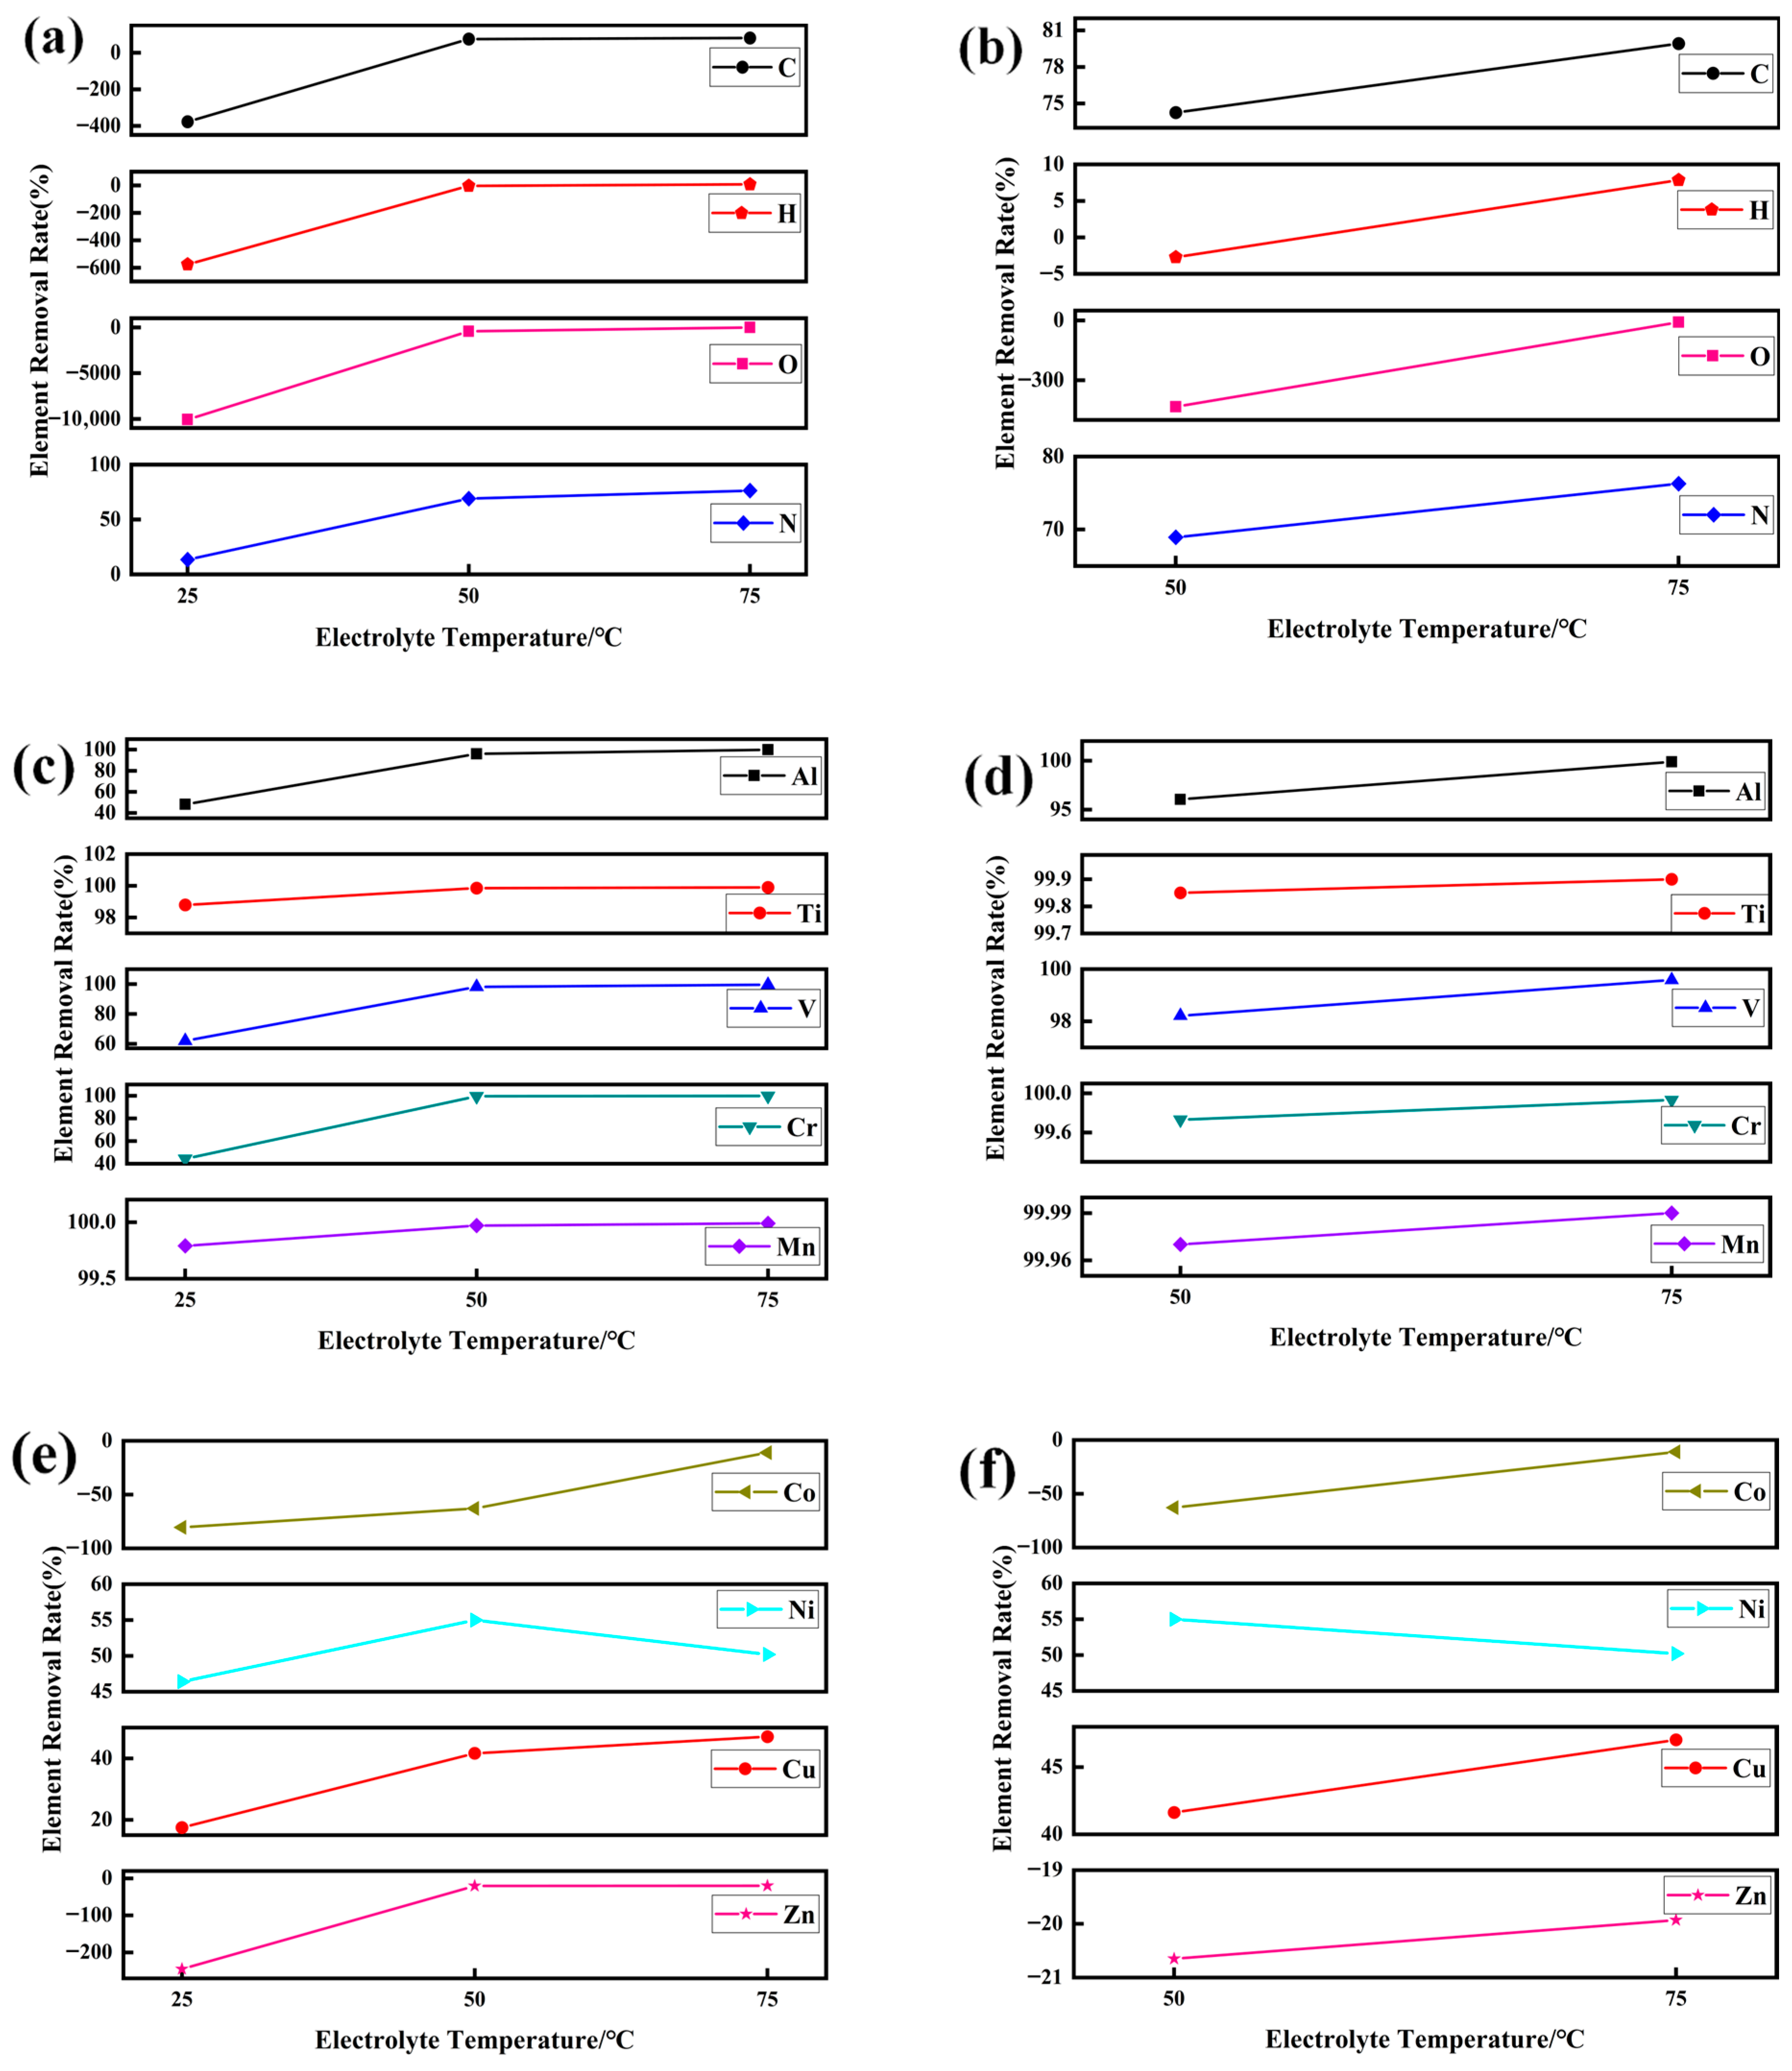
The removal rates of gaseous elements and major metal elements are shown in Figure 4 to better illustrate the effect of electrolyte temperature on the removal of major metal elements. The removal rate is a key indicator used to measure the extent of impurity element removal or reduction. As shown in Figure 4a, a significant increase in the removal rate of gaseous elements occurs when the temperature rises from 25 °C to 50 °C. However, from 50 °C to 75 °C, the trend is less pronounced. A local enlargement is shown in Figure 4b, where it can be clearly observed that the removal rate of gaseous elements continues to increase between 50 °C and 75 °C. Thus, the removal rate of gaseous elements increases as the electrolysis temperature rises. In Figure 4c, the removal rate of Al, Ti, V, Cr, Mn, and other elements is increasing at 25 °C to 50 °C. A similar local enlargement is provided in Figure 4d. It is apparent that the removal rates of these elements remain on the rise from 50 °C to 75 °C. The removal rate of these elements increased with an increase in electrolysis temperature and reached a peak at 75 °C. Temperature has a significant effect on the removal rates of elements such as Al, Ti, V, Cr, and Mn. In Figure 4e, an obvious increasing trend in the removal rates of Co and Cu is observed. However, the removal rate of Ni does not increase with the rise in temperature. Research has shown that [45] during high-temperature electrolysis, the critical pH value for the hydrolysis and precipitation of Ni is significantly different from that of Fe. Ni can be effectively removed by adjusting the pH value, which requires further in-depth research. A local magnified view is also shown in Figure 4f. It can be observed that the removal rate of Zn increases as the temperature rises.

3.2. Microstructure of Electrolytic Pure Iron

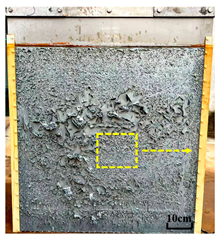
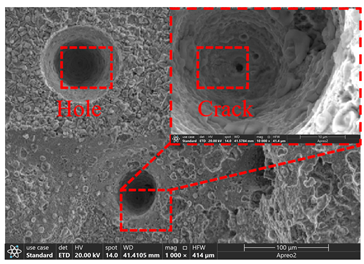
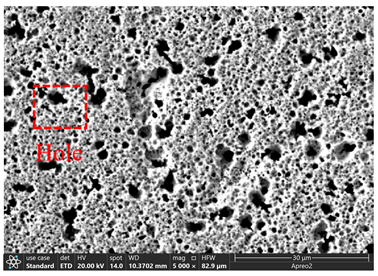
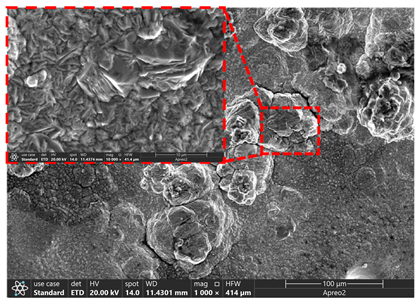
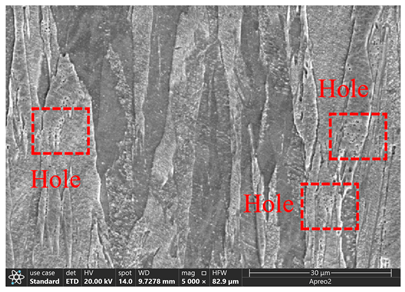
In order to further investigate the effect of electrolysis temperature on electrolytic pure iron, the macro- and micro-morphology of electrolytic pure iron at different temperatures was observed. As shown in Table 9, the surface of electrolytic pure iron experiences severe cracking during electrolysis at 25 °C. It is mostly fragmented, with warping or flipping occurring, and almost no flat electrolytic pure iron is observed. The microscopic surface morphology, shown within the yellow box, exhibits some relatively deep and unevenly sized pores. By magnifying and observing the pores in the microstructure, it is found that the pores spiral inward overall, with uneven walls and large protrusions attached. At the bottom of the pores, small cavities remain, and cracks are present. The microscopic morphology of the cross-section is relatively loose, almost completely filled with pores, and lacks typical strip-like characteristics.
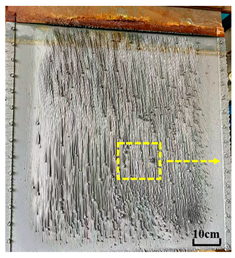
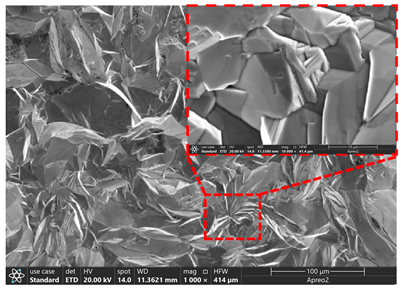
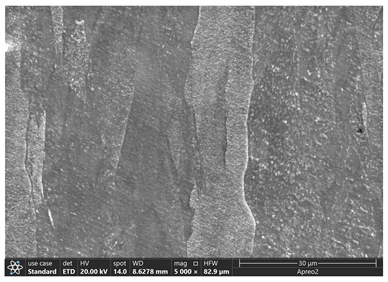
When the electrolysis temperature is increased to 50 °C, the macroscopic surface cracking phenomenon is significantly eliminated. The surface shows a silver-white metallic luster, but numerous elongated grooves and nodular structures are present. It is presumed that external environmental factors have influenced this, such as impurities in the electrolysis cell that were not completely filtered out. These impurities adhere to the surface of the electrolytic pure iron and continue to deposit, resulting in uneven grooves or nodular formations. In the microscopic surface morphology, shown within the yellow box, the pores vanish entirely, and a small amount of crystalline structure emerges. After magnification, a small amount of irregular polygonal nucleus structures [46] were observed. The cross-sectional microscopic morphology exhibits a typical strip distribution, while a small number of pores are still observed, indicating that the increase in temperature has improved the internal structure of the electrolytic pure iron but has not fully eliminated the pores.
The frequency of the filter machine cycle was increased from 30 Hz to 45 Hz. The circulation speed was enhanced. The filtration efficiency was improved. Following the increase in the electrolysis temperature to 75 °C, no grooves or nodular formations appeared on the macro-surface. Smooth, flat, silver-white electrolytic pure iron was produced. In magnifying the surface morphology (within the yellow box), we can see that it exhibited a distinct angular, irregular polygonal nucleus structure. No flaky nodular formations or oxides were observed. The grains on the cross-section were relatively coarse, with a predominantly elongated shape, and pores were no longer present.

4. Discussion on the Principle of Electrolytic Purification

4.1. Reaction Principle

During the process of metallic iron deposition, competitive reactions occur at both the cathode and anode.
(1)
Cathodic Fe deposition and H2 evolution.
On the cathode, two competing electrochemical reactions occur: Fe deposition and the hydrogen evolution reaction [47].
F e 2 + + 2 e = Fe
2 H + + 2 e = H 2
The standard electrode potential for Fe2+/Fe is −0.44 V vs. SHE (Standard Hydrogen Electrode). Due to the high overpotential of H2 on metallic iron, the main reaction occurring at the cathode is not hydrogen evolution but iron deposition. Before the deposition layer of Fe covers the cathode, the hydrogen evolution reaction (HER) is considered the main side reaction. It is also the main cause of the reduced current efficiency at the initial stage of electrodeposition. The HER can occur in neutral solutions via the Volmer–Heyrovsky pathway (Reactions (3) and (4)) or the Volmer–Tafel pathway (Reactions (4) and (5)). Both pathways involve the adsorption and desorption of hydrogen intermediates (Hads) at the electrode surface [48,49]. The formation of Hads is influenced by the composition of the electrolyte and the cathode material.
H 2 O + e = H ads + O H
H 2 O + H ads + e = H 2 + O H
2 H ads = H 2
(2)
Anode Fe oxidation and O2 evolution.
At the anode, two electrochemical reactions occur: Fe oxidation and the oxygen evolution reaction.
4 O H 4 e = 2 H 2 O + O 2
Fe 2 e = Fe 2 +
Fe 2 + e = Fe 3 +
Because the standard electrode potential of iron differs from that of other impurities, under certain conditions, iron can precipitate from an aqueous electrolyte containing ferrous ions. Impurities with a more positive electrode potential than iron will precipitate in the anode mud. Impurities with a lower electrode potential than iron will completely dissolve in the solution and cannot precipitate at the cathode. This enables the electrochemical removal of impurity elements.

4.2. Purification Principle of Gas Element

Because of the different removal mechanisms of gaseous and metallic elements in electrolytic pure iron, the effects of different electrolytic temperatures on the gaseous and metallic elements also vary.
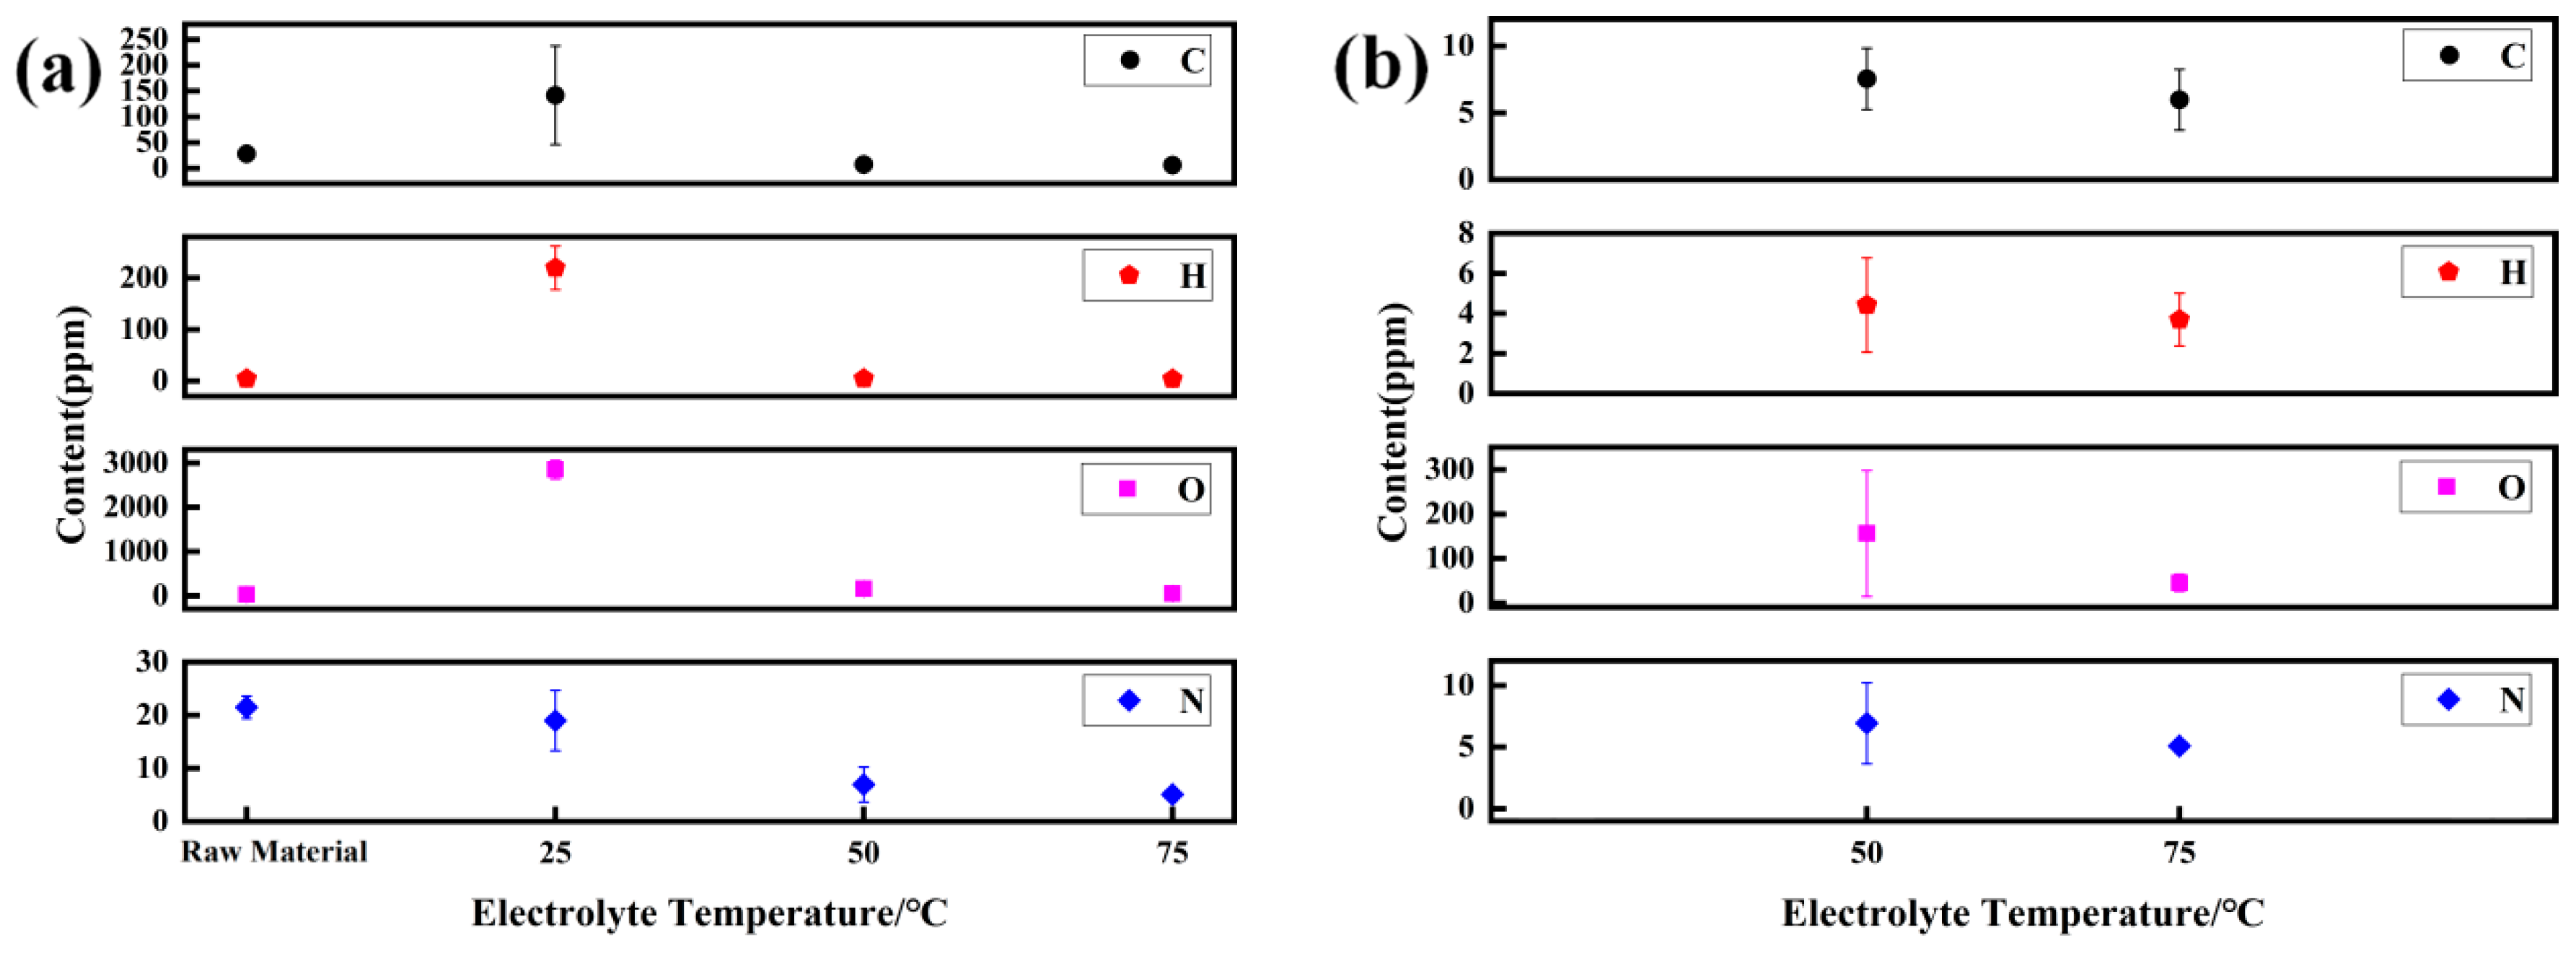
To better clarify the trend in gas element content changes in electrolytic pure iron under varying electrolysis temperatures, Table 5 was converted into a trend graph. As illustrated in Figure 5, the gaseous elements in electrolytic pure iron increase significantly under low-temperature electrolysis conditions. Upon increasing the electrolyte temperature, a dramatic decrease in gaseous elements is observed, particularly for oxygen. The variations in each gaseous element at 50 °C and 75 °C are hard to intuitively demonstrate in Figure 5a. Therefore, a local magnification is provided in Figure 5b. It can be observed that as the electrolysis temperature increases, the content of each gaseous element exhibits a declining trend. This indicates that elevating the temperature effectively removes gaseous elements from the raw material (DT4). A detailed comparison of the gaseous element content at three temperatures was conducted. It can be observed that higher temperatures result in fewer residual gaseous elements.
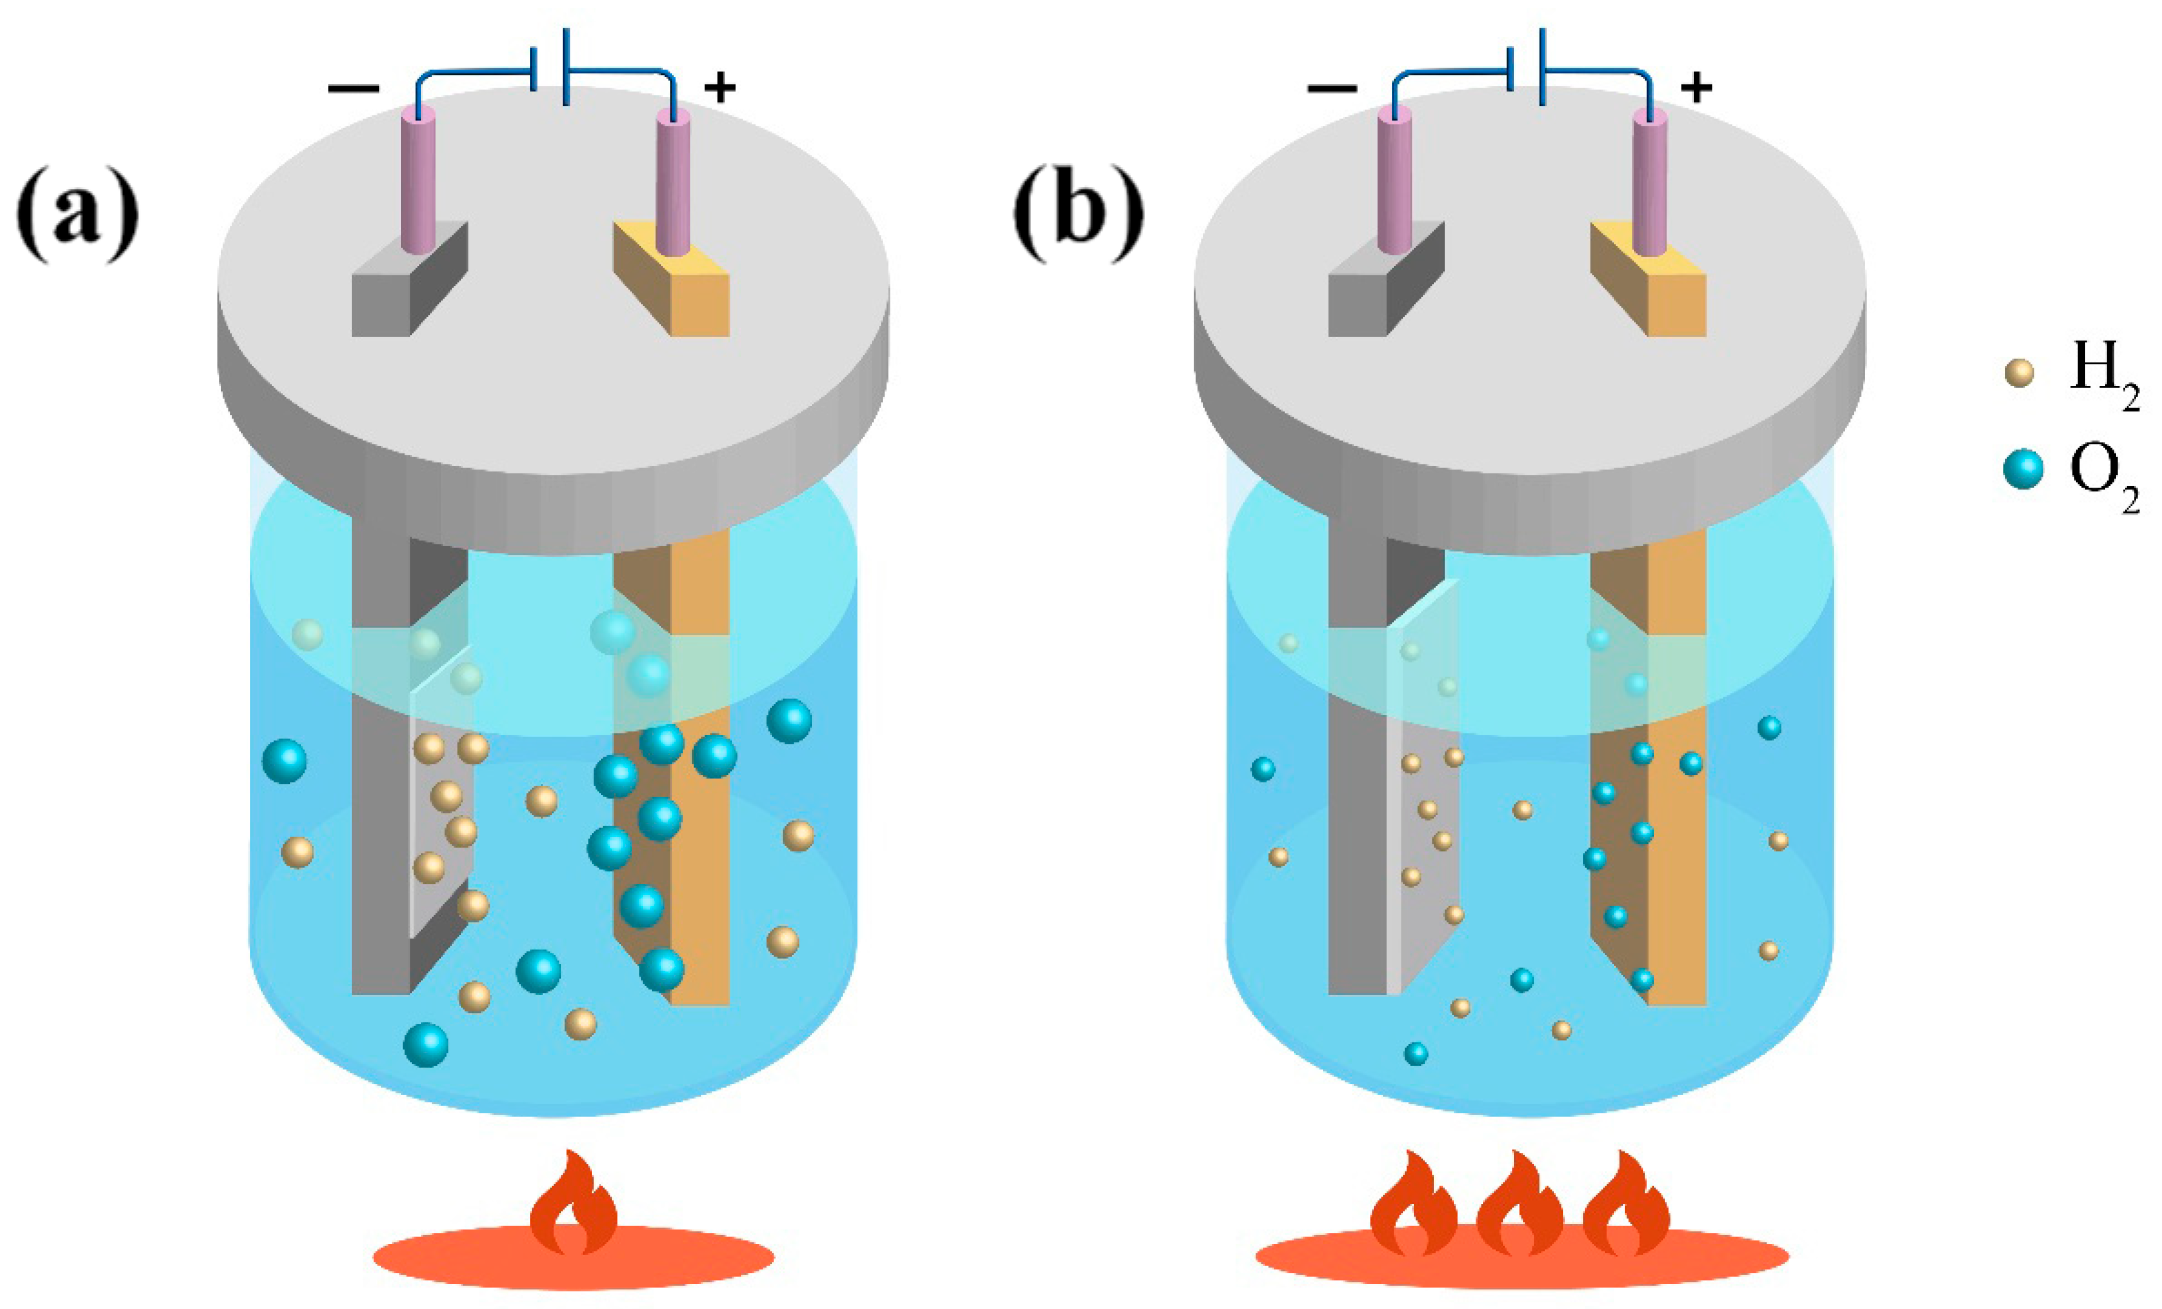
A schematic diagram is used to show the changes in gas during the electrolysis process at various electrolysis temperatures. As shown in Figure 6a, during low-temperature electrolysis, hydrogen or oxygen evolution reactions occur, influenced by the chemical reactions during electrolysis. A significant amount of hydrogen and oxygen gas is produced in the solution, with the gases freely dispersed around the anode and cathode plates and attaching to the surface of the electrodes. At this point, the solution temperature is relatively low, leading to a decrease in gas activity and a reduction in their movement rate. When the gas adheres to the surface of the electrode, it is difficult to remove. A significant amount of gaseous elements is present in the electrolytic pure iron. The purity and properties of the electrolytic pure iron are worsened. Producing electrolytic pure iron with a smooth and even surface becomes challenging.
The solubility of the gas in the solution decreases after heating the electrolyte. As shown in Figure 6b, in general, the electrolysis temperature has a significant impact on the viscosity of the electrolyte. Higher temperatures will lower the viscosity of the electrolyte solution. This is because higher temperatures increase the thermal motion energy of solvent molecules. The molecular kinetic energy increases. The intermolecular forces weaken. This leads to enhanced flowability and a decrease in viscosity. Therefore, the electrolyte flows more smoothly. The gas content in the electrolyte is reduced. This indicates that heating the electrolyte can effectively alleviate the issue of excessive residual gas elements in electrolytic pure iron.
As the temperature increases, the overvoltage of iron decreases faster than that of hydrogen, and the hydrogen content in electrolytic pure iron is greatly reduced, which can improve current efficiency. This results in a denser structure of electrolytic pure iron. Additionally, as the temperature increases, the solubility of hydrogen in the aqueous solution decreases. At lower temperatures, the partial pressure of hydrogen in the solution is elevated, the hydrogen evolution potential further shifts positively, and a larger amount of hydrogen is evolved. The electrolytic pure iron produced has a high hydrogen content, and brittle behavior is observed, which has been confirmed through gas analysis and the visual observation of electrolytic pure iron [42].
The newly evolved hydrogen atoms precipitated are mostly combined into hydrogen molecules. They escape from the electrolyte along the electrode surface in the form of bubbles, and only a small quantity penetrates the iron lattice structure, gathering near the grain boundaries. M.I. Ismail et al. [50] investigated the morphological characteristics of copper electro-deposition on stainless steel cathodes. It was noted that alternating copper deposition occurred in the tunnel-like layered structure of the metallographic sample. The morphology of hydrogen release and the parallel hydrogen escape lines within the layers were observed. The theoretical amount of hydrogen evolution was estimated by calculating the Coulomb number of hydrogen evolution. It was determined that approximately 86–98% of the precipitated hydrogen escapes as bubbles [42].
In fact, under constant pressure, the influence of temperature on the solubility of gas in a liquid is associated with the entropy change (dissolution entropy) occurring during the dissolution process [51]. The molar Gibbs free energy of the solute gas is G 2 . m g . The partial molar Gibbs free energy (chemical potential) of the solute gas in the solution is μ 2 . Based on the phase equilibrium condition,
μ 2 G 2 . m g = 0
Clearly, μ 2 G 2 . m g is a function of temperature, pressure, and the mole fraction x 2 of the solute in the solution. At constant pressure, d μ 2 G 2 . m g can be expanded:
d μ 2 G 2 . m g = μ 2 G 2 . m g T P , x 2 d T + μ 2 G 2 . m g ln x 2 T , P d ln x 2
When gas–liquid equilibrium is reached at a constant pressure, d μ 2 G 2 . m g = 0 , and
0 = μ 2 G 2 . m g T P , x 2 d T + μ 2 G 2 . m g ln x 2 T , P d ln x 2 constant   pressure , saturated
By dividing both sides of the above equation by d T , we derive the following:
μ 2 G 2 . m g T P , x 2 + μ 2 G 2 . m g ln x 2 T , P ln x 2 T P , saturated = 0
According to thermodynamic principles, μ 2 T P , x 2 = S 2 ( S 2 represents the partial molar entropy of the solute gas in the solution), and G 2 . m g T P = S 2 . m g ( S 2 . m g represents the molar entropy of the pure solute gas).
μ 2 G 2 . m g T P , x 2 = S 2 S 2 . m g
By substituting Equation (13) into Equation (12), we derive the following:
S 2 S 2 . m g = μ 2 G 2 . m g ln x 2 T , P ln x 2 T P , saturated
For most gas, when the pressure P is close to the standard pressure, the standard state of the solute can be represented as μ 2 Θ . The chemical potential of the solute gas is then given by
μ 2 = μ 2 Θ + R T ln a 2
a 2 represents the activity of the solute in the solution. μ 2 G 2 . m g can be written as
μ 2 G 2 . m g = μ 2 μ 2 Θ + μ 2 Θ G 2 . m g
By substituting Equation (15) into Equation (16), the result is
μ 2 G 2 . m g = R T ln a 2 + μ 2 Θ G 2 . m g
μ 2 Θ G 2 . m g is evidently a quantity that depends only on the solute and is independent of the solution composition. Therefore, when T and P are constant, differentiating ln x 2 gives
μ 2 G 2 . m g ln x 2 T , P = R T ln a 2 ln x 2 T , P
According to thermodynamics, it is known that the activity of the solute is a 2 = f 2 f 2 Θ (where f 2 is the fugacity of the solute, and f 2 Θ is its fugacity in the standard state). When the solute gas forms a dilute solution in the solvent, Henry’s law applies: f 2 = k x x 2 .
a 2 = f 2 f 2 Θ = k x x 2 f 2 Θ
f 2 Θ is the fugacity of the solute in its standard state, which is independent of the composition of the solution. For a specified solvent and solute in a dilute solution, where T and P are constant, Henry’s constant k x is also a constant value.
ln a 2 ln x 2 T , P = 1
By substituting Equations (18) and (20) into Equation (14), the result is
Δ S 2 = S 2 S 2 . m g = R T ln x 2 T P , saturated = R ln x 2 ln T P , saturated
In Equation (21), Δ S 2 = S 2 S 2 . m g refers to the molar entropy change during the dissolution of the gas, which is the dissolution entropy.
From Equation (21), it can be seen that when Δ S 2 < 0, the solubility of the gas decreases as the temperature increases. The entropy change during the dissolution process of both oxygen and hydrogen is typically negative. For oxygen, it is around −120 J/(mol·K), and for hydrogen, it is about −130 J/(mol·K). When the temperature rises, gas is more likely to escape from the liquid and transform into the gas phase. Consequently, the electrolyte can be heated to remove the gaseous elements.

4.3. Purification Principle of Metal Elements

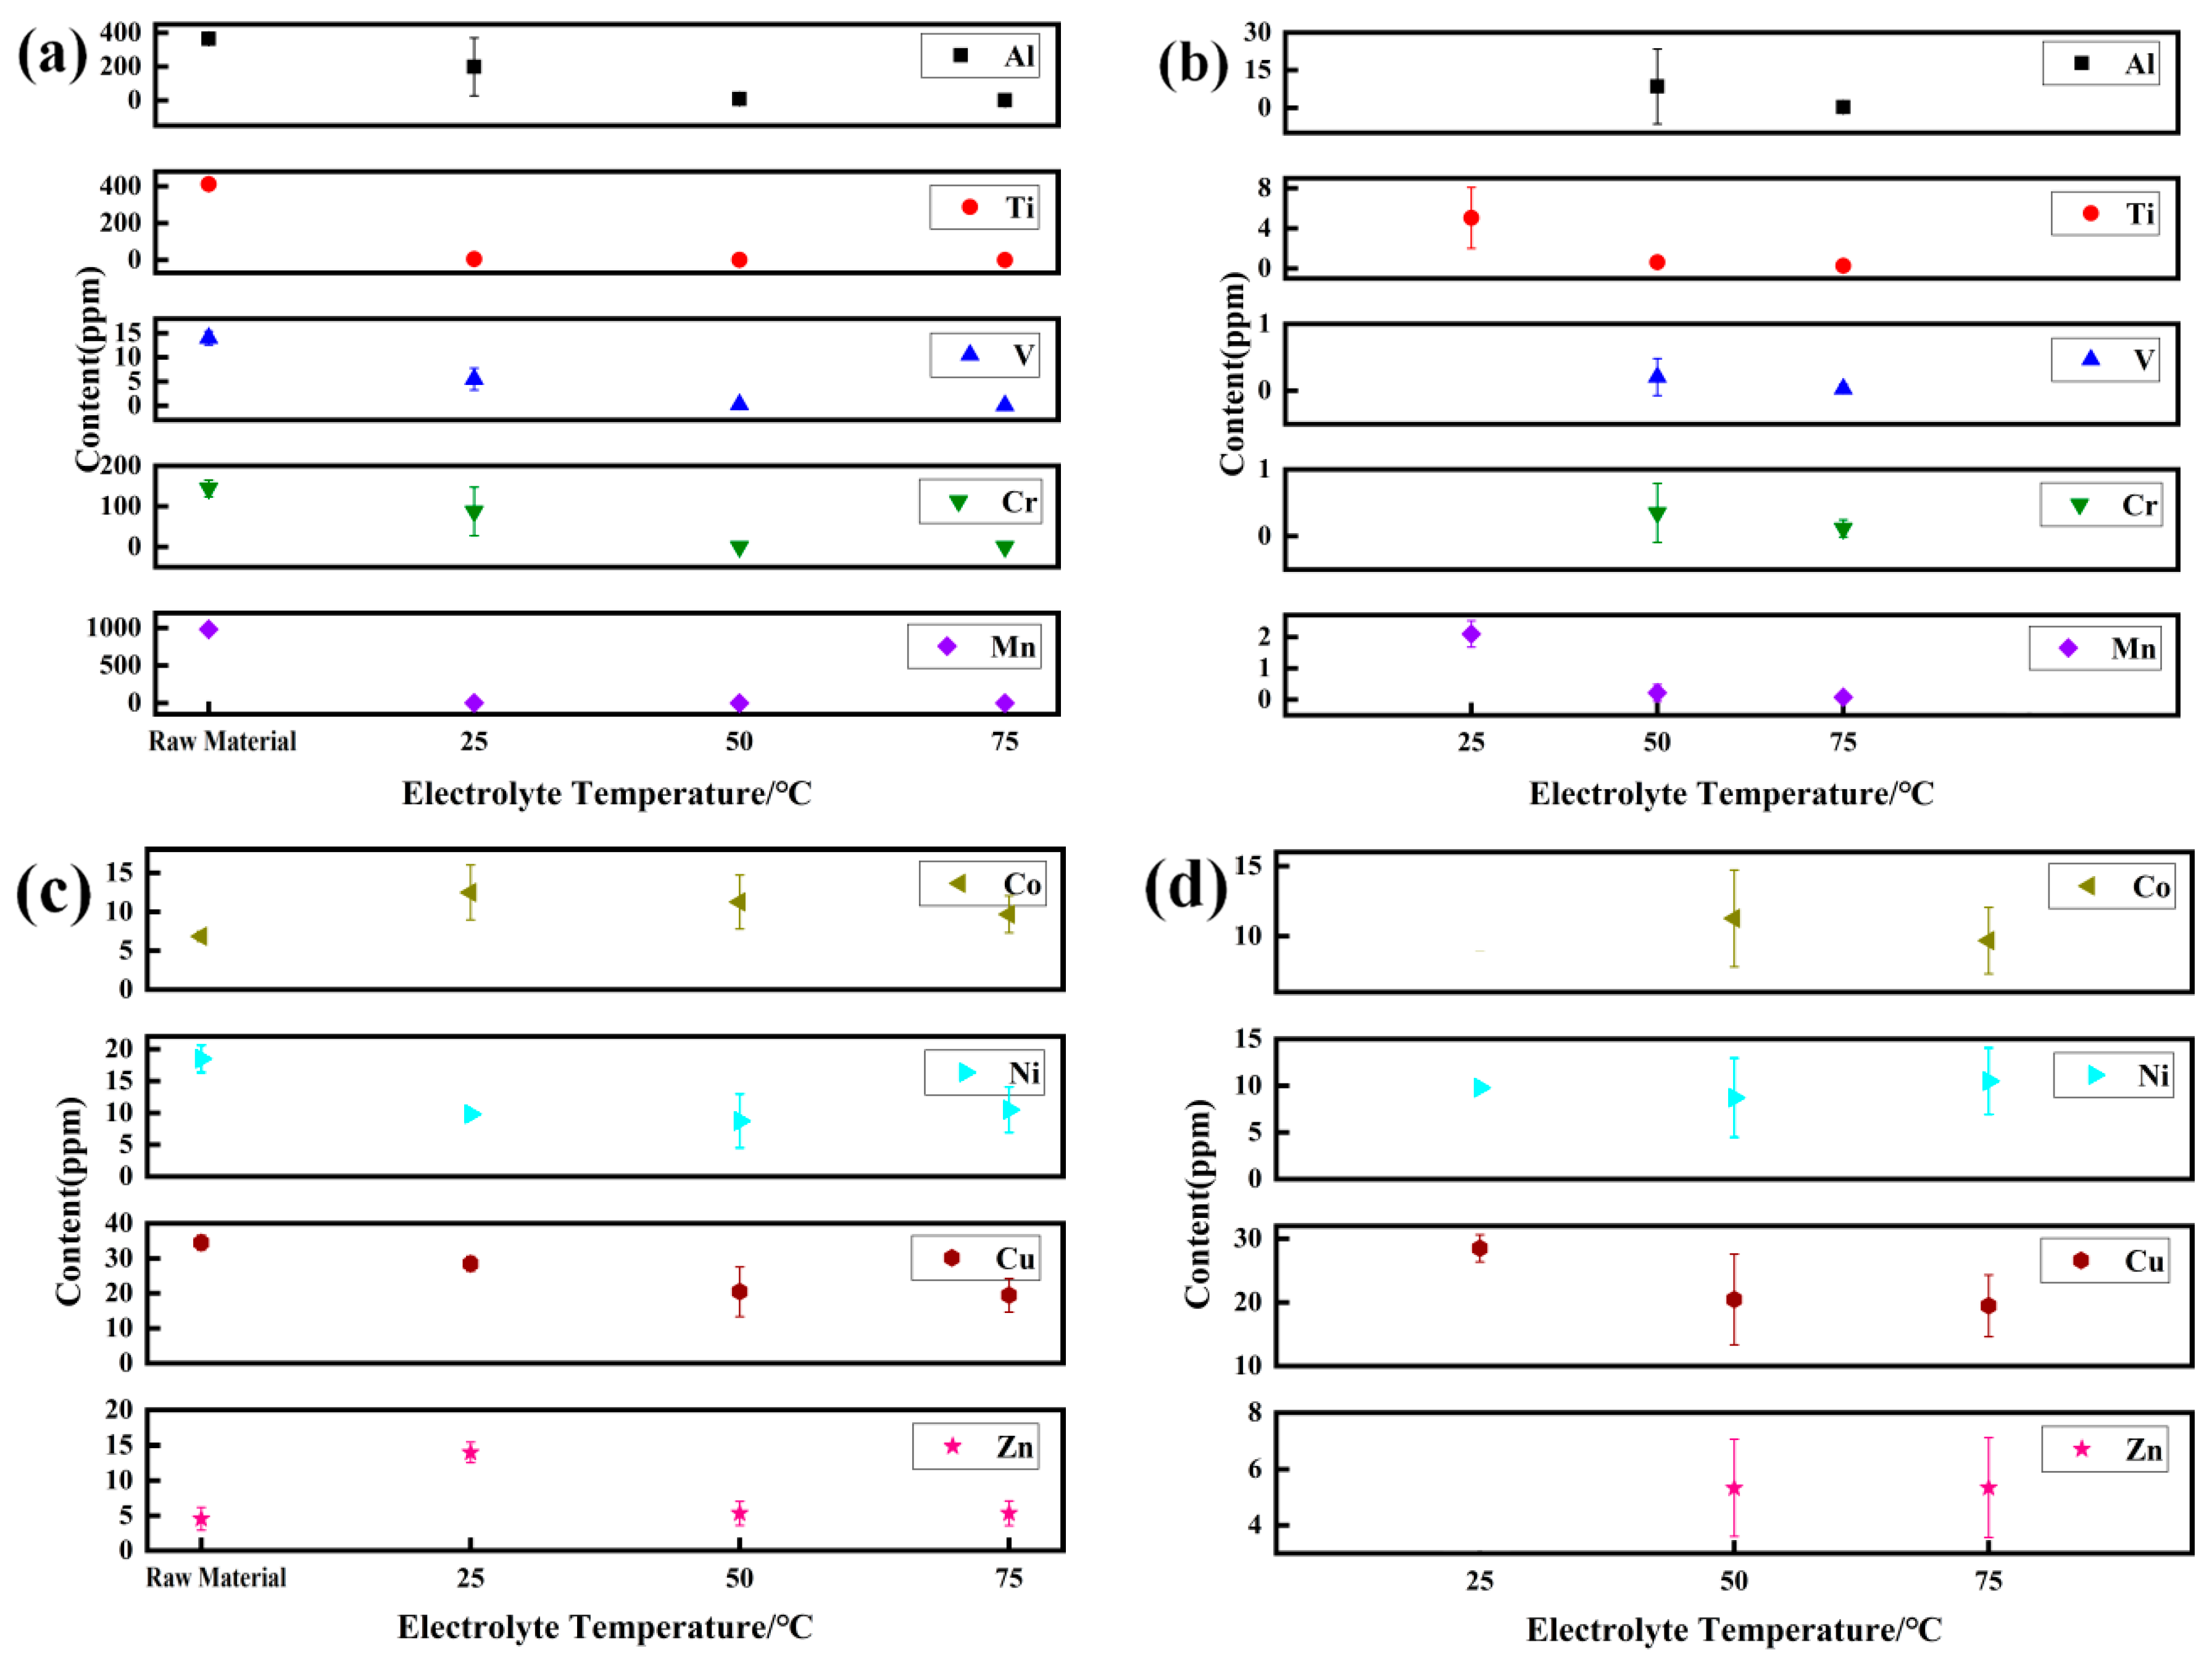
To more clearly demonstrate the variation trend in impurity metal element content in electrolytic pure iron at different electrolysis temperatures, Table 7 is plotted as a trend chart. From Figure 7a, it can be observed that when other process conditions and environmental factors are kept constant, the content of all metal elements, except for Ni, decreases with the increase in electrolyte temperature. Figure 7b provides a clearer representation of the declining trend in the content of metal elements like Al, Ti, V, Cr, and Mn under different electrolysis temperatures.
Changes in the content of elements like Co, Ni, Cu, and Zn from the raw material (DT4) in various electrolysis temperatures can be demonstrated by Figure 7c. It can be observed that although the contents of Co and Zn elements also decrease with an increase in electrolyte temperature, their contents during electrolysis at 75 °C are still higher than those of the raw material (DT4). The trend variation in the content of elements such as Co, Ni, Cu, and Zn at different electrolysis temperatures is also shown by Figure 7d. The content of Ni increases as the electrolyte temperature continues to rise, resulting in a higher residual amount.
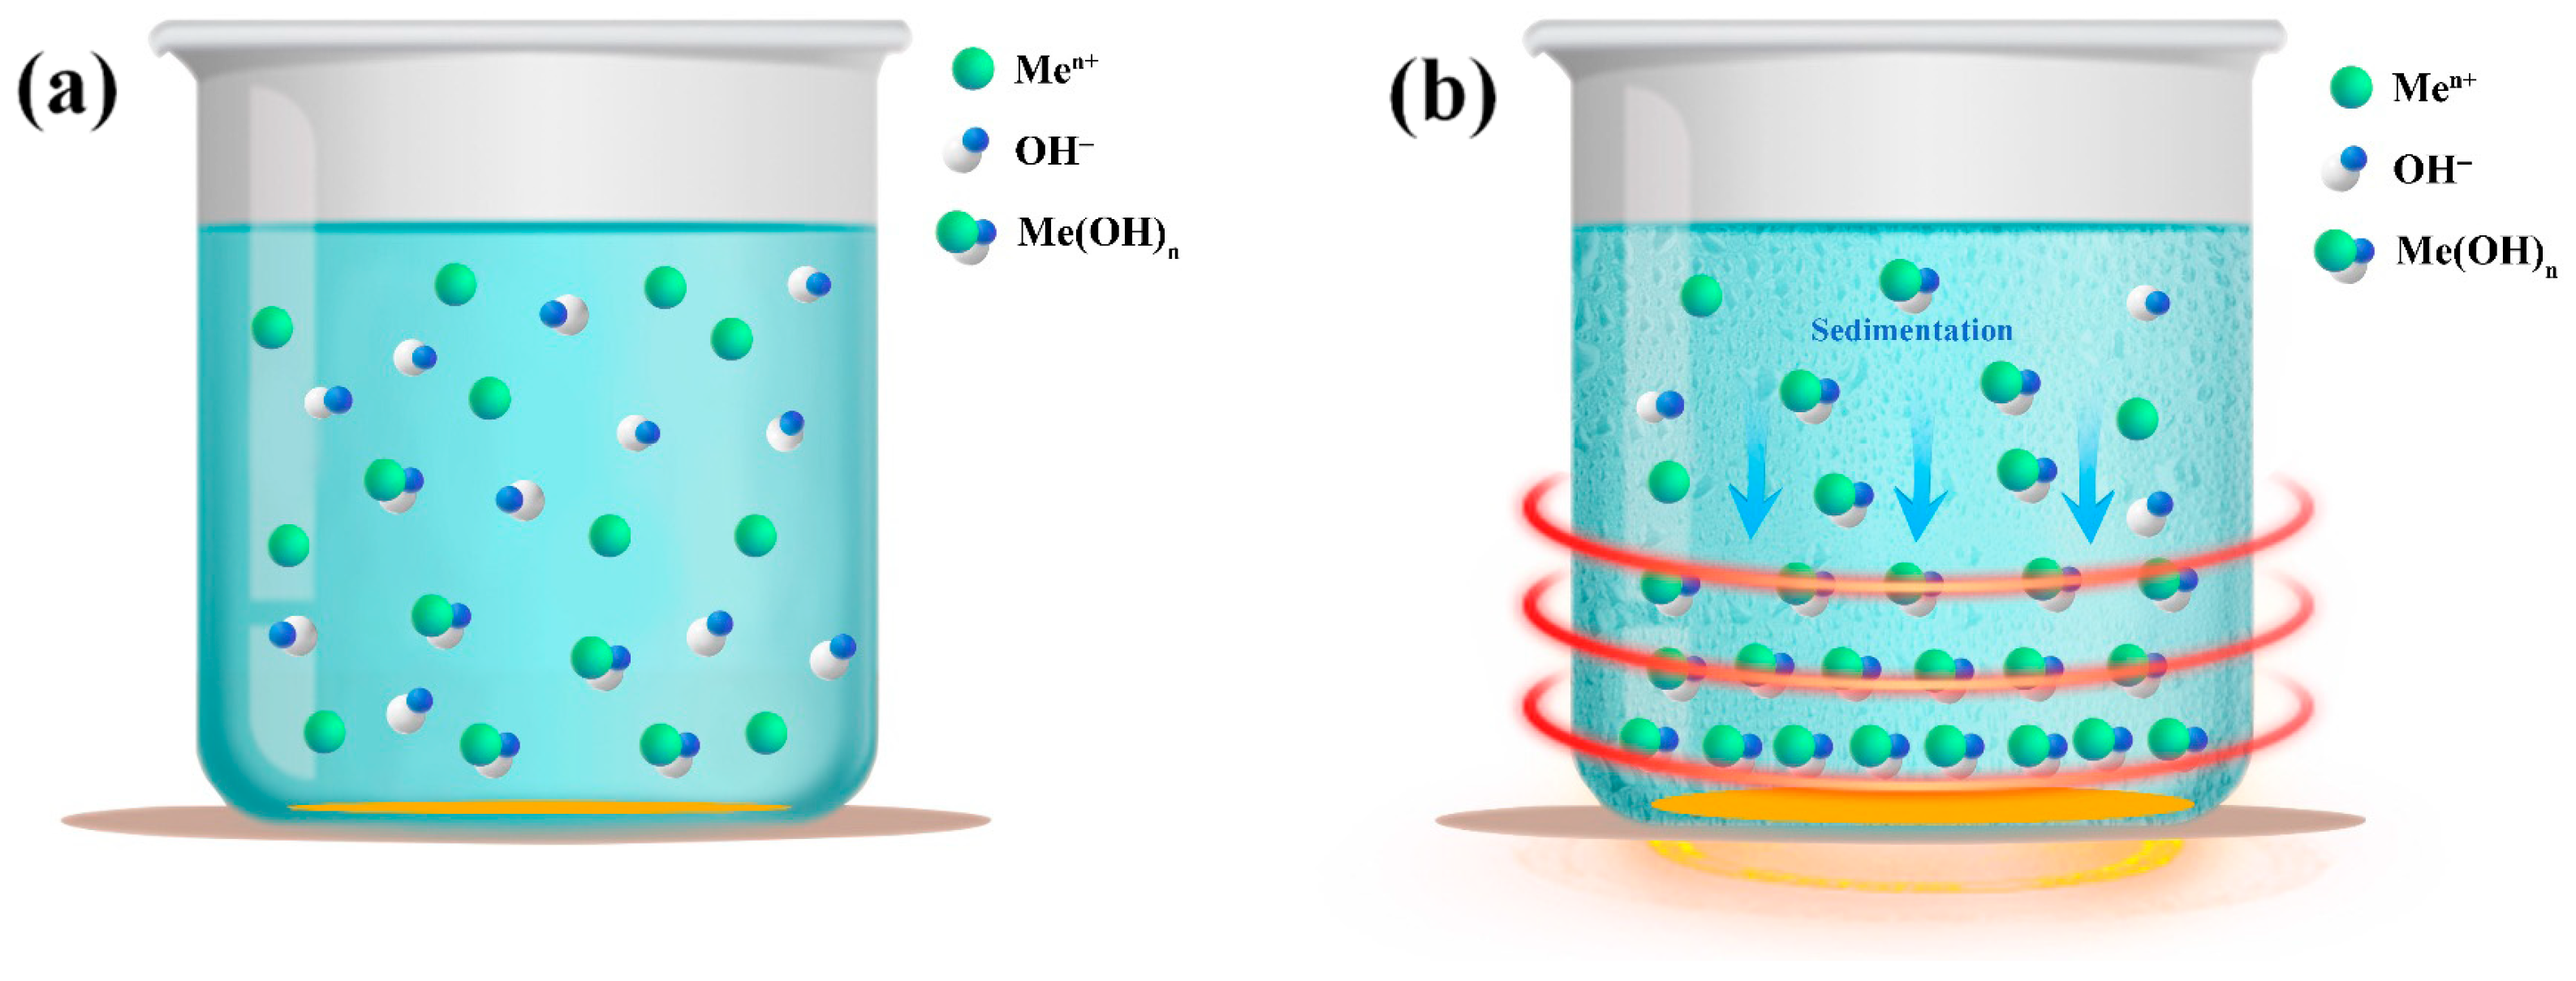
In the electrolytic pure ironmaking process, the pH values at which different metal salts hydrolyze to form hydroxide precipitates in aqueous solutions are distinct. The increase in electrolyte temperature alters the critical pH values at which impurity metal elements undergo hydrolytic precipitation, enabling the removal of metals that were previously difficult to eliminate after precipitation. As illustrated in Figure 8a, during low-temperature electrolysis, most of the impurity metals in the electrolyte exist in ionic form, which makes it difficult for them to react with hydroxide ions and form precipitates. Upon heating the electrolyte, the critical pH value for the hydrolysis and precipitation of impurity metal ions begins to decrease. Under the condition that Fe(II) in the aqueous solution does not undergo hydrolysis, the pH of the electrolyte is adjusted to facilitate the hydrolysis and precipitation of impurity metal ions. Consequently, the metal ions gradually convert into hydroxide precipitates that settle at the bottom of the electrolyte, thereby achieving the removal effect.
The hydrolysis reaction of metal ions occurs as shown in the following equation:
M e n + + n H 2 O = Me OH n + n H +
During the hydrolysis of metal ions, no electron transfer occurs, but H+ ions are involved. The equilibrium constant expression is as follows:
K α = a M e n + · a H 2 O n a Me ( OH ) n · a H + n = a M e n + a H + n
The equation at constant temperature is as follows:
Δ r G Θ = RT ln K α = RT ln a M e n + a H + n = 2.303 RT lg a M e n + + npH
It can be inferred that
pH = Δ r G Θ 2.303 nRT 1 n lg a M e n + = p H Θ 1 n lg a M e n +
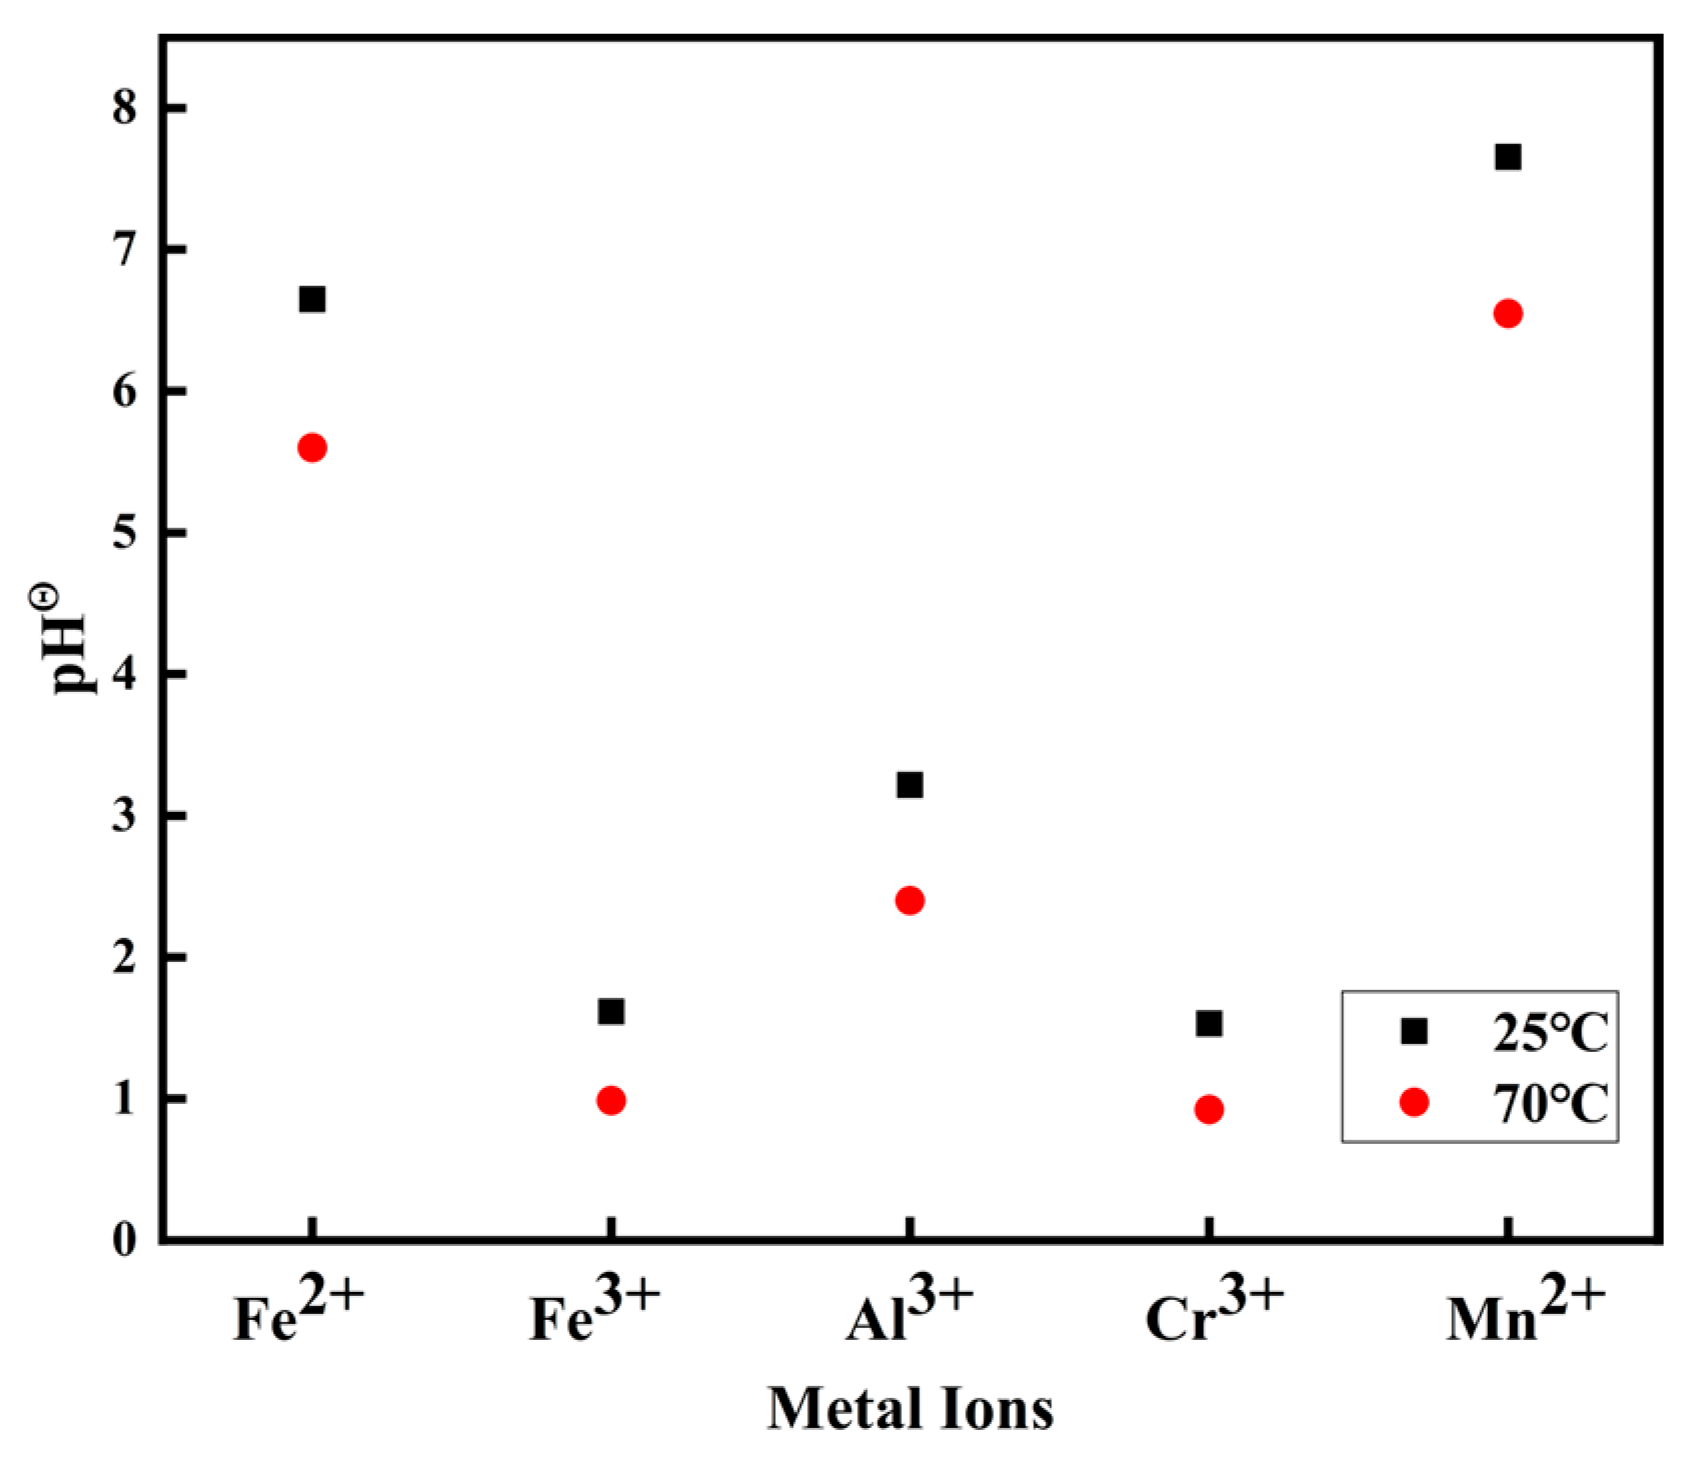
Therefore, when the pH of the electrolyte is greater than the critical p H Θ , the a M e n + is less than 1. Metal ions will undergo hydrolytic precipitation. The critical p H Θ refers to the pH at which metal ions start to hydrolyze and form a precipitate during the hydrolysis reaction. The p H Θ values for the hydrolytic precipitation of different metal ions at 25 °C and 70 °C are shown in Figure 9, also showing that the critical p H Θ of various metal ions decreases as the solution temperature increases. Because the variation in the critical p H Θ primarily depends on the hydrolysis constant k h of the metal ions and the effect of temperature on the hydrolysis constant, the larger the hydrolysis constant, the lower the critical p H Θ is. This indicates that metal ions are more susceptible to hydrolysis reactions. The hydrolysis constant k h generally increases with the rise in solution temperature. An increase in temperature accelerates the rate of the hydrolysis reaction. This makes metal ions more likely to precipitate in the form of hydroxides. Consequently, this achieves the removal of impurity metal elements, although the potential of Cr is similar to that of Fe. However, Cr undergoes a hydrolysis reaction in acidic solutions, as illustrated in Equation (26):
C r 3 + + 3 H 2 O Cr OH 3 + 3 H +
The hydrolysis reaction proceeds to the right, generating a large amount of Cr OH 3 precipitate. At high temperatures, the hydrolysis of Cr ions is further accelerated. This generates more Cr OH 3 precipitate. This allows for a more effective removal of Cr elements.

5. Conclusions

The influence of electrolyte temperature on the preparation of ultra-high-purity electrolytic pure iron was studied through composition analysis and microstructural characterization. The following conclusions can be drawn:
(1)
When electrolysis was performed at 75 °C, the purity of the electrolytic pure iron reached a maximum of 4N1.
(2)
At 75 °C, it was found that the total gas element content was the lowest at only 46.07 ppm. The hydrogen evolution potential was found to shift negatively at high temperatures, and a decrease in hydrogen evolution was observed. The hydrogen content in the prepared electrolytic pure iron was relatively low, reducing the possibility of hydrogen embrittlement. Except for metals like Co, Ni, Cu, and Zn, which are difficult to remove, the removal rate of other metal elements was above 99.9%.
(3)
As the electrolysis temperature increased, the macroscopic morphology transitioned from severe cracking to a smooth and intact form. The microstructure of the surface and cross-section evolved from pores to a typical irregular polygonal nucleus structure with banded features.

Author Contributions

Conceptualization, D.Z.; methodology, G.X., X.C. and J.B.; validation, J.B. and M.Z.; formal analysis, D.Z.; investigation, D.Z., T.L., B.W., X.C. and M.Z.; resources, B.W. and H.D.; data curation, G.X. and B.W.; writing—original draft preparation, D.Z.; writing—review and editing, T.L.; visualization, M.Z.; project administration, H.D.; funding acquisition, H.D. All authors have read and agreed to the published version of the manuscript.

Funding

The authors gratefully acknowledge the support of the Hebei Province Key Research and Development Program (No. 20311009D).

Data Availability Statement

The original contributions presented in this study are included in the article. Further inquiries can be directed to the corresponding authors.

Conflicts of Interest

Author Jiaxin Bai was employed by the company Hebei Province Longfengshan Casting Industry Co., Ltd. The remaining authors declare that the research was conducted in the absence of any commercial or financial relationships that could be construed as a potential conflict of interest.

Glossary

TermDefinition
Electrolytic Pure IronHigh-purity iron of 99.9% purity and above was obtained by electrolytic deposition.
PurityThe proportion of iron elements in high-purity electrolytic iron is characterized.
It is usually represented by “N”.
For instance, 4N denotes a purity of 99.99%, while 5N signifies a purity of 99.999%.
Impurity ElementsElements other than iron exist in high-purity electrolytic iron.
Gas ImpuritiesIncluding carbon, hydrogen, oxygen, nitrogen, and other elements.
part per million (ppm)One millionth, commonly used to precisely indicate the extremely low content of impurity elements in high-purity electrolytic iron.
Electrolytic CellThe core equipment for conducting the electrolysis reaction. It is primarily composed of an anode, cathode, and electrolyte.
AnodeThe electrode through which the current flows in. Industrial pure iron is generally used.
CathodeThe electrode through which the current flows out. Pure titanium plates are generally used.
ElectrolyteThe liquid in the electrolytic cell that conducts current and participates in electrochemical reactions.
Electrolytic RefiningThe method of purifying crude metals based on the principle of electrolysis in the preparation of high-purity electrolytic iron based on the differences in the redox reaction activities of different elements on the electrodes. Iron in crude iron preferentially dissolves at the anode and enters the electrolyte in the form of ions. Most of the impurities remain in the anode mud, and high-purity iron is ultimately obtained at the cathode.
Electrolysis TemperatureThe temperature of the electrolyte during electrolysis.
Current DensityThe current intensity passing through the electrode per unit area. It is an important parameter in the electrolysis process.
pH value of the electrolyteThe indicator for assessing the acidity or alkalinity of the electrolyte. It plays a significant role in the electrolysis process.
Removal efficiencyA key indicator for measuring the extent to which impurity elements are removed or reduced. The calculation formula is as follows:
(Initial Content − Final Content)/Initial Content × 100%

References

  1. Jonathan, W.; Xu, H.; Wang, X.F.; Liao, X.C. China Accelerates Towards Carbon Neutrality: Steel Industry Carbon Reduction Pathways. 22 November 2024. Available online: https://www.mckinsey.com.cn/ (accessed on 13 July 2025).
  2. Wang, X.; Yang, H.T.; Yu, X.H.; Hu, J.C.; Cheng, J.X.; Jing, H.L. Research progress in the preparation of iron by electrochemical reduction route without CO2 emissions. J. Appl. Electrochem. 2023, 53, 1521–1536. [Google Scholar] [CrossRef]
  3. Abiko, K. Why do we study ultra-high purity base metals. Mater. Trans. JIM 2000, 41, 233–237. [Google Scholar] [CrossRef]
  4. Luo, Z.J.; Xu, J.Y.; Weng, W.; Tan, W.; Chi, X.P.; Zhong, S.P. Study on Arsenic Removal Process by Electrodeposition and Effect of Additives on Electrodeposition. Nonferrous Met. (Extr. Metall.) 2023, 7–16. [Google Scholar]
  5. Wang, F.Q.; Lu, M.H.; Wang, S.J.; Wang, F.; Xia, X.W.; Geng, S.H.; Zou, X.L.; Lu, X.G. Application advances of ionic liquids in hydrometallurgical leaching and electrodeposition. J. Shanghai Univ. (Nat. Sci. Ed.) 2023, 29, 569–589. [Google Scholar]
  6. Wang, H.; Cao, X.Z.; Xue, X.X. Research progress on electrodeposition of tin and tin alloys coatings in eutectic solvents. Plat. Finish. 2023, 45, 56–61. [Google Scholar]
  7. Zhang, Z.K. Preparation of Purity Iron by Low-Carbon Steel Electrolysis; Dalian Maritime University: Dalian, China, 2022. [Google Scholar]
  8. Zhang, D.; Wang, B.; Cao, X.; Bai, J.X.; Liu, T.S.; Dong, H. Electrolytic preparation of pure iron in aqueous solutions state-of-the-art. J. Lron Steel Res. 2025, 37, 708–727. [Google Scholar]
  9. Zhou, J.; Li, X.Y.; Tian, M.G.; Yan, W.; Zhang, D.M.; Xu, H. Research Progress on Treatment and Recovery of Metals in Wastewater by Electrodeposition. Chin. J. Anal. Chem. 2023, 51, 1735–1746. [Google Scholar]
  10. Fu, F.E.; Xu, C.Y.; Li, J.R.; Wang, Z.X. Research Progress of Chromium Electrodeposition from Deep Eutectic Solvents. Mater. Prot. 2024, 57, 155–167. [Google Scholar]
  11. Yu, P.P.; Zhou, X.J.; Mukhtar, A.; Wang, S.S.; Huang, R.Q.; Wu, K.M. Research status and prospect of high purity iron preparation. China Metall. 2023, 33, 9–20. [Google Scholar]
  12. Hang, T.; Xue, Q.; Li, M. A Review on Metal Micro-Nanostructured Array Materials Routed by Template-Free Electrodeposition. Acta Metall. Sin. 2022, 58, 486–502. [Google Scholar]
  13. Xu, Z.H.; Liu, A.M.; Liu, F.G.; Lu, X.Q.; Liu, Y.B.; Shi, Z.N. Research progress on the preparation of rare earth metals and their alloys by molten salt electrolysis. China Nonferrous Metall. 2025, 54, 9–24. [Google Scholar]
  14. Liu, L.; Cai, C.C.; Dong, X.B. Study on the mechanism of enhanced Ga electrodeposition on three dimensional porous electrodes. Chin. J. Process Eng. 2023, 23, 136–143. [Google Scholar]
  15. Lie, J.Z.; Huang, Z.X.; Jie, X.H.; Mai, Y.J. Electrodeposition of gradient nanostructured copper coating and its tribological behavior. Electroplat. Finish. 2023, 42, 1–7. [Google Scholar]
  16. Li, X.H.; Deng, R.R.; Li, Y.; Xu, C.Y.; Hua, Y.X.; Zhang, Q.B. Application of additives for the electrodeposition of metals and alloys from ionic liquids. Chin. J. Eng. 2024, 46, 657–675. [Google Scholar]
  17. Showa Denko. Preparation of Electrolytic Iron. JP1997111488, 28 April 1997. [Google Scholar]
  18. Toho Zinc Co., Ltd. Preparation of Electrolytic Pure Iron. JP2005105334, 21 April 2005. [Google Scholar]
  19. Wang, S.P.; Xue, Y.P.; Fan, L.; Pan, Y.Z.; Cheng, J.; Cui, B.J. Effects of Janus Green B Leveler on Nucleation Mechanism of Cobalt Electrodeposition in Chip Interconnection. Surf. Technol. 2024, 53, 178–187. [Google Scholar]
  20. Lin, M.P.; Jiao, H.D.; Yuan, R.; Li, Y.Y.; Wang, L.L.; Sun, R.Y.; Tian, D.H.; Jiao, S.Q. Recent progress on electrodeposition of metal/alloy films or coatings in deep eutectic solvents. Trans. Nonferrous Met. Soc. China 2014, 1–36. Available online: https://link.cnki.net/urlid/43.1239.tg.20241022.1624.004 (accessed on 22 July 2025).
  21. Chu, X.P.; Li, Y.X.; Liu, J.X.; Liu, N.H.; Lai, X.Q.; Luo, Y.B.; Li, W.L. Research progress of electroplating technology in ionic liquid system. Plat. Finish. 2025, 47, 89–99. [Google Scholar]
  22. Wang, H.; Cao, X.Z.; Xue, X.X. Study on Electrodeposition of Antimony in Choline Chloride-Ethylene Glycol Eutectic Solvent. J. Electrochem. 2022, 28, 62–70. [Google Scholar]
  23. Liu, J.R.; Wei, Y.S.; Ou, Y.Y.B.; Li, R.Y.; Li, T.F.; Hou, J.H.; Liu, H.Q.; Qiu, R. Preparation of superhydrophobic coating and its corrosion resistance on aluminum surface by one-step electrodeposition. Plat. Finish. 2025, 47, 29–36+73. [Google Scholar]
  24. Maryam, M.; Amira, S.; Prima, F.; Rahem, A.; Fiset, M.; Mantovani, D. Effect of electrodeposition current density on the microstructure and the degradation of electroformed iron for degradable stents. Mater. Sci. Eng. B 2011, 176, 1812–1822. [Google Scholar]
  25. Abbar, A.H.; Abdul-Ridha, J.Y.; Kareem, S.H. Electrolytic preparation of Iron powder with particle Size Less than 106 μm. Iraqi J. Chem. Pet. Eng. 2007, 8, 51–57. [Google Scholar] [CrossRef]
  26. Ye, C.M.; Huang, J.; Li, W.B.; Zhang, Y.; Hu, Z.T.; Ren, K.M. Effects of Ammonium Sulfite on Electrolytic Manganese. Hydrometall. China 2022, 41, 351–354. [Google Scholar]
  27. Ai, L.T.; Wang, Y.Z. Manufacture of high quality electrolytic pure iron powder from waste steel scraps. China Resour. Compr. Util. 1994, 13, 17–20. [Google Scholar]
  28. Ai, L.T.; Song, F.L.; Wang, J.C.; Lu, Q.K.; Guo, J.B. Preparation, performance and use of electrolytic pure iron. J. Process Eng. 1993, 14, 76–78. [Google Scholar]
  29. Abd El Meguid, E.A.; Abd El Rehim, S.S.; Moustafa, E.M. Electroplating of iron from alkaline gluconate baths. Thin Solid Film. 2003, 443, 53–59. [Google Scholar] [CrossRef]
  30. Jartych, E.; Jałochowski, M.; Budzyński, M. Influence of the electrodeposition parameters on surface morphology and local magnetic properties of thin iron layers. Appl. Surf. Sci. 2002, 193, 210–216. [Google Scholar] [CrossRef]
  31. Liu, B.; Song, X.S.; Song, X.C.; Yue, Z.L.; Fan, J.S. Single-Membrane Double Chamber Electrodeposition Process of Manganese Metal. Nonferrous Met. (Extr. Metall.) 2024, 1, 11–20. [Google Scholar] [CrossRef]
  32. Guan, P.P.; Liu, A.M.; Zhang, X.; Kang, H.G.; Su, K.J.; Meng, Q.L.; Liu, Z.S.; Shi, Z.N. Electrodeposition of copper in 1, 3-dimethyl-2-imidazolidinone-AlCl3-Cu2O ionic liquid. Chin. J. Nonferrous Met. 2024, 34, 268–278. [Google Scholar]
  33. Ye, C.M.; Li, W.B.; Huang, J.; Zhang, Y.; Hu, Z.T.; Wu, Z.X. Effects of 1-butyl-3-methylimidazole on Electrodeposition of Manganese. Nonferrous Met. (Extr. Metall.) 2022, 12, 29–33. [Google Scholar] [CrossRef]
  34. Zhang, X.X.; Gao, Y.; Liu, Y.H.; Sun, X.J. Preparation of Co/W catalyst by electrodeposition and study on its performance in electrocatalytic hydrogen evolution. Mod. Chem. Ind. 2025, 45, 184–187. [Google Scholar]
  35. Rudnik, E. Effect of pH-dependent bath speciation on cobalt electrodeposition from sulfate−gluconate solutions. Trans. Nonferrous Met. Soc. China 2025, 35, 2399–2420. [Google Scholar] [CrossRef]
  36. Liu, C.Q.; Peng, Q.C.; Xue, Z.L.; Huang, H.B.; Qiu, W.T. Preparation of electrolytic pure iron powder and its compression sintering properties. J. Iron Steel Res. 2019, 31, 822–829. [Google Scholar]
  37. Cao, D.W.; Song, W.L.; Xu, Y.X. Exploration of production process conditions of electrolytic pure iron. J. Fuzhou Univ. (Nat. Sci. Ed.) 1961, 107–111. [Google Scholar]
  38. Qing, Y.; Tan, D.S.; Wan, S.B.; Ding, W.Z. Treatment of Ferrous Chloride Solution by Ion Exchange Membrane Electrolysis Process. Hydrometall. China 2016, 35, 503–506. [Google Scholar]
  39. Chen, D.M.; Gu, L.; Chen, P.Y.; Gao, J.T.; Wang, Y.G.; Li, S.Q. Pre-Experiment on Electrolyzing Pure Iron in Aqueous Solution by Clean Energy. J. Iron Steel Res. 2011, 23, 4. [Google Scholar]
  40. Dong, H.B.; Hou, M.S.; Liu, C.; Liu, R.Z.; Li, S.Q. Electrolytic preparation of iron from aqueous solution using solar energy. Electroplat. Finish. 2012, 31, 3. [Google Scholar]
  41. Cao, W.M.; Yin, R.H.; Yan, H.G.; Ye, Z.Q. Pure Iron Electrolyzed from Scrap Iron Chips and its Corrosion Characteristics. Electrochemistry 2003, 9, 93–97. [Google Scholar] [CrossRef]
  42. Lu, W.C.; Xu, Y.L.; Liu, P.A.; Wang, Z.L. Electroforming of Iron Foil. Chin. J. Process Eng. 1988, 9, 7–13. [Google Scholar]
  43. Showa Denko. Manufacturing Method of High Purity Electrolytic and Electrolytic Cell. JP1989212788, 25 August 1989. [Google Scholar]
  44. Huang, H.B.; Peng, Q.C.; Qiu, W.T. Preparation of high purity iron by industrial pure iron electrolysis. J. Chongqing Univ. 2017, 40, 59–70. [Google Scholar]
  45. Wei, C.; Li, C.X. Zinc Extraction Metallurgy; Metallurgical Industry Press: Beijing, China, 2013; pp. 81–82. [Google Scholar]
  46. Xie, Z. Nonlinear Dynamic Behaviors and Regulation Law of Electrode Reaction of Manganese Electrodeposition; Chongqing University: Chongqing, China, 2021. [Google Scholar]
  47. Xu, Q.; Li, A.Q.; Sun, C.T.; Cheng, H.W.; Zou, X.L.; Lu, X.G. Progress of Research on Fabrication of Iron by Electrochemical Process. Shanghai Met. 2021, 43, 93–99. [Google Scholar]
  48. Mazloomi, K.; Gomes, C. Hydrogen as an energy carrier: Prospects and challenges. Renew. Sustain. Energy Rev. 2012, 16, 3024–3033. [Google Scholar] [CrossRef]
  49. Zheng, Y.; Jiao, Y.; Jaroniec, M.; Qiao, S.Z. Advancing the electrochemistry of the hydrogen-evolution reaction through combining experiment and theory. Angew. Chem. Int. Ed. 2015, 54, 52–65. [Google Scholar] [CrossRef] [PubMed]
  50. Ismail, M.I.; Fahidy, T.Z. Morphological characteristics of copper deposition on stainless steel cathodes. J. Appl. Electrochem. 1981, 11, 543–549. [Google Scholar] [CrossRef]
  51. Chen, X.H. The Relationship between Gas Solubility and Temperature. Univ. Chem. 1993, 8, 54–56. [Google Scholar]
Figure 1. A schematic diagram of the electrolytic refining device. (a) Schematic diagram of the principle; (b) production diagram at the site.
Metals 15 01055 g001
Figure 2. The effect of electrolysis temperature. (a) The variation in purity; (b) the changes in current efficiency and voltage.
Metals 15 01055 g002
Figure 3. Morphology and energy spectrum analysis of inclusions in 2N6 electrolytic pure iron.
Metals 15 01055 g003
Figure 4. Removal efficiency of gaseous elements and major metal elements at different electrolysis temperatures. (a) Removal rate of gas impurity elements at different temperatures; (b) Removal efficiency of gas impurity elements at 50 °C and 75 °C; (c) Removal rate of metallic impurity elements at different temperatures; (d) Removal efficiency of metal impurity elements at 50 °C and 75 °C; (e) Removal rate of coexisting metallic impurity elements at different temperatures; (f) Removal efficiency of coexisting metal impurity elements at 50 °C and 75 °C.
Metals 15 01055 g004
Figure 5. The variation trend in residual gaseous element content at different electrolysis temperatures. (a) Comparison of gas impurity element content at different temperatures with raw materials; (b) Change trend of gas impurity element content at 50 °C and 75 °C.
Metals 15 01055 g005
Figure 6. Changes in gas molecules during the electrolysis process at different temperatures: (a) low temperature; (b) high temperature.
Metals 15 01055 g006
Figure 7. Variation trend in impurity metal element content at different electrolyte temperatures. (a) Comparison of metallic impurity element content at different temperatures with raw materials; (b) Change trend of metallic impurity element content at three different temperatures; (c) Comparison of coexisting metallic impurity element content at different temperatures with raw materials; (d) Change trend of coexisting metal impurity element content at three different temperatures.
Metals 15 01055 g007
Figure 8. The variation in metal ions in the electrolyte at different temperatures: (a) low temperature; (b) high temperature.
Metals 15 01055 g008
Figure 9. The variation trend in the critical p H Θ for the hydrolysis of metal ions at different temperatures [45].
Metals 15 01055 g009
Table 1. Electrode materials and process parameters.
T/°CCathode MaterialAnode MaterialCFe2+/(mol·L−1)Current Density/(A·m−2)pHElectrolyzing Time/hNumber of Experiments
25Titanium
metal sheets
Industrial
pure iron
3.51002.5725
50
75
Table 2. The composition of analytical-grade FeCl2·4H2O (ppm).
ComponentSulfateFe(Ⅲ)CuZnAsPbAlkali Metals and Alkaline Earth Metals
Content≤200≤100≤150≤20≤2≤50≤400
Table 3. The materials and equipment used in the experiment.
Materials and EquipmentVersionManufacturer
FeCl2·4H2Ohttp://www.tmreagent.com/Xian Tianmao Chemical Co., Ltd. (Xi’an, China)
C2H5OHhttp://www.qschem.com/Jiangsu Qiangsheng Functional Chemical Co., Ltd. (Changshu, China)
HClhttps://www.ksjingke.com/Kunshan Jingke Microelectronics Materials Co., Ltd. (Kunshan, China)
High-purity titanium plate700 mm × 700 mm × 2 mmHefei Wenghe Metal Materials Co., Ltd. (Hefei, China)
DT4760 mm × 820 mm × 2 mmTaiyuan Iron & Steel (group) Co., Ltd. (Taiyuan, China)
High-frequency switch power supply10000A8VYangjiang Jianxing Changsheng Electromechanical Equipment Co., Ltd. (Yangjiang, China)
Portable pH meterhttps://www.smartsensor.cn/Dongguan Wanchuang Electronic Products Co., Ltd. (Dongguan, China)
Electric heating hot water boilerCWDR-72KW-DHenan Hengxin Boiler Manufacturing Co., Ltd. (Zhoukou, China)
Filter machineTSB-2018-3-PKunshan Meibao Environmental Protection Equipment Co., Ltd.
(Kunshan, China)
PVC electrolytic cell/Yangjiang Jianxing Changsheng Electromechanical Equipment Co., Ltd.
(Yangjiang, China)
Table 4. Comparison of different process parameters and electrolytic pure iron characteristics.
ElectrolyteAnodeCathode Process ParametersCharacteristicReference
pHT (°C)Current Density (A/m2)
Chlorate saltIron filings + Graphite plateLead–tin alloy2~375400Split[37]
500/
600Rough
80300With bumps
Poor toughness
500With bumps
600Rough
85300With bumps
400/
500Few bumps
600/
90400Tightly smooth
500/
600/
Graphite rodLow-carbon steel2.075800Current Efficiency is 50.2%[39]
Industrial pure ironPassivated metal2.5791000~2000CE is 92.13%[42]
953N
CE is 98.67%
Platinum-coated titanium plateStainless steel1.5~550~7050~200Heavy metal impurities <0.05 ppm[43]
Industrial pure ironStainless steel4.0~5.540~6070~150Co, Cu
<0.01 ppm
[18]
Industrial pure ironTitanium plate2.5251002N6
CE is 65.3%
Self-made
50 3N6
CE is 84.9%
754N1
Smooth
CE is 96.8%
Table 5. Chemical composition of gaseous elements in electrolytic pure iron at different electrolysis temperatures (ppm).
ElementCHON
DT428 ± 2.834 ± 1.4128 ± 1.4221.5 ± 2.12
25 °C142 ± 96.17220 ± 42.432850 ± 212.1319 ± 5.66
50 °C7.55 ± 2.294.43 ± 2.36156.22 ± 141.836.94 ± 3.28
75 °C5.98 ± 2.273.69 ± 1.3131.31 ± 19.085.09 ± 0.42
Table 6. Changes in oxygen content in 2N6 electrolytic pure iron before and after annealing (ppm).
SampleO
Before annealing2850 ± 212.13
After annealing25 ± 22.54
Table 7. Chemical composition of major metals in electrolytic pure iron at different electrolysis temperatures (ppm).
ElementAlTiVCrMnCoNiCuZn
DT4365.0 ± 21.21412.5 ± 17.6714.0 ± 1.41144.5 ± 20.51982.5 ± 17.676.8 ± 0.6318.5 ± 2.1234.5 ± 2.124.5 ± 1.63
25 °C198.5 ± 171.835.1 ± 3.045.5 ± 2.2687.5 ± 60.112.1 ± 0.4212.5 ± 3.549.8 ± 0.1428.5 ± 2.1314.0 ± 1.41
50 °C8.5 ± 14.940.63 ± 0.450.21 ± 0.270.35 ± 0.440.21 ± 0.2711.3 ± 3.458.7 ± 4.2320.5 ± 7.125.34 ± 1.72
75 °C0.25 ± 0.480.26 ± 0.420.02 ± 0.060.09 ± 0.110.07 ± 0.057.7 ± 2.389.5 ± 3.5718.5 ± 4.835.33 ± 1.77
Table 8. Standard electrode potential of metals in aqueous solution at 25 °C.
Electrode NotationsElectrode ReactionE/VPotential Difference with Iron/V
Fe2+/FeFe2+ + 2e = Fe−0.4400
Co2+/CoCo2+ + 2e = Co−0.2770.163
Ni2+/NiNi2+ + 2e = Ni−0.2500.190
Cu2+/CuCu2+ + 2e = Cu+0.3370.777
Zn2+/ZnZn2+ + 2e = Zn−0.7630.323
Table 9. A comparison of the microstructural images (acquired with SEM) of the surface and section corresponding to the selected area.
T/°CCathode with DepositSurfaceCross-Section
25Metals 15 01055 i001Metals 15 01055 i002

Metals 15 01055 i003
50Metals 15 01055 i004
Metals 15 01055 i005
Metals 15 01055 i006
75Metals 15 01055 i007Metals 15 01055 i008
Metals 15 01055 i009
Disclaimer/Publisher’s Note: The statements, opinions and data contained in all publications are solely those of the individual author(s) and contributor(s) and not of MDPI and/or the editor(s). MDPI and/or the editor(s) disclaim responsibility for any injury to people or property resulting from any ideas, methods, instructions or products referred to in the content.