Article

Influence of Tramp Elements on Phase Transformations, Microstructure and Hardness of a 0.3 wt.%C Low-Alloyed Steel

1
Christian Doppler Laboratory for Knowledge-Based Design of Advanced Steels, Department of Materials Science, Montanuniversität Leoben, 8700 Leoben, Austria
2
Department of Materials Science, Montanuniversität Leoben, Franz-Josef-Straße 18, 8700 Leoben, Austria
3
voestalpine Forschungsservicegesellschaft Donawitz GmbH, 8700 Leoben, Austria
4
voestalpine Wire Rod Austria GmbH, 8700 Leoben, Austria
5
Helmholtz-Zentrum Hereon, Institute of Materials Physics, 21502 Geesthacht, Germany
6
SKF AB, SE-415 50 Göteborg, Sweden
*
Author to whom correspondence should be addressed.
Metals 2025, 15(9), 1053; https://doi.org/10.3390/met15091053
Submission received: 4 August 2025 / Revised: 16 September 2025 / Accepted: 18 September 2025 / Published: 20 September 2025

Abstract

Decarbonizing the steel industry relies on a transition from carbon-intensive blast furnace technology to scrap-based secondary steelmaking using electric arc furnaces. This transition introduces tramp elements and leads to their gradual accumulation, which can significantly influence the functional properties of chemically sensitive steel grades. In this study, the combined impact of several tramp element contents on the phase transformations, microstructure and mechanical properties of a 0.3 wt.% C low-alloyed steel was investigated. To achieve this, a reference alloy was produced using the conventional blast furnace production route. It was then compared with two trial alloys, which contained intentionally elevated levels of tramp elements and were produced through an experimental melting route designed to simulate scrap-based electric arc furnace production. The experimental characterization included light optical and electron microscopy, electron back-scatter diffraction, in situ synchrotron high-energy X-ray diffraction coupled with dilatometry, and Vickers hardness testing. The results revealed the formation of displacive transformation products such as martensite and showed that austenite was retained in the tramp element-enriched trial alloys. The combination of solid solution strengthening and martensitic transformation led to a gradual increase in hardness. These findings underscore the critical role of tramp elements in determining the microstructural and mechanical response of steels produced from scrap-based feedstock.

1. Introduction

Steel manufacturing is responsible for approximately 9% of global CO2 emissions, releasing nearly 2 tons of CO2 per ton of steel produced via blast furnace into the atmosphere [1,2]. The main source of emissions is the use of coal as a reductant and energy source during the smelting of iron ore (Fe2O3) to produce pig iron [3]. In efforts to decarbonize the steel industry, the transition away from traditional carbon-based blast furnace processes is vital. Currently, two alternative iron- and steelmaking technologies that could potentially replace the traditional blast furnace production route appear to be feasible. First, the hydrogen-based direct reduction of iron oxides in shaft reactors emerges as a transformative method for sustainable steelmaking. This process integrates metal extraction, alloying and compaction in a single solid-state step, bypassing the reliance on carbon-based reductants and high-temperature melting, which are major contributors to CO2 emissions [4,5]. By utilizing green hydrogen derived from renewable energy sources, this method has the potential to deliver a near-zero-carbon pathway for producing sponge iron, positioning it as a cornerstone for decarbonizing the steel industry [6]. However, large-scale adaptation is constrained by the limited availability of green H.
The second approach, steel recycling through the electric arc furnace (EAF) manufacturing route, presents an efficient way to reduce the steel industry’s carbon footprint by utilizing scrap-based feedstock instead of mined iron ore. EAF-based steel production significantly lowers energy consumption and CO2 emissions, and its environmental benefits can be further improved when combined with renewable or low-carbon energy sources [7].
However, the utilization of scrap metal in the EAF-based production route is not straightforward and presents a series of metallurgical challenges [8]. The main hurdle to full-scale adaptation is the introduction and accumulation of impurities, often referred to as trace and tramp elements, such as As, Cu, Co, Cr, Ni, Sn, Mo, W, P and S [9]. While intentional steel alloying is a common practice to enhance properties like tensile strength, elongation, yield point or proof stress, soundness in the welding area, fracture toughness and bendability [10], the unintentional incorporation of trace and tramp elements, particularly As, Cu, Sn, P and S, poses critical concerns. These elements can significantly alter phase transformation behavior, leading to undesirable changes in the microstructure, phase composition and mechanical properties of steels [11].
There are three principal strategies to prevent the introduction and accumulation of trace and tramp elements into recycled steel. The first mitigation strategy involves the sorting of scrap metal to minimize the introduction of undesirable elements into the steelmaking process. The second strategy focuses on the removal of tramp elements during pre-treatment or smelting stages [12]. Standard techniques include leaching in NH3, HCl and H2SO4 as well as electrochemical extraction to remove Cu, Sn and Zn from steel scrap [13,14,15], whereas other alternatives include oxidation or sulfidation [15,16]. Additionally, tramp elements can be removed by volatilization into the gas phase or through diffusion into the slag phase during the smelting process [17,18]. The third strategy is based on understanding the fundamental mechanisms by which trace and tramp elements affect the functional properties of the steel in question. This approach includes the development of novel alloy design strategies and the application of a tailored thermal treatment to either mitigate the effect of trace and tramp elements or, if possible, even harness the effects that are otherwise only achieved by intentional alloying. Even though these methods are well established, in the case of tramp elements, assuming ppm concentrations, these methods become ineffective [10,12,19,20].
In this study, a low-alloyed hypoeutectoid steel in the reference state and after the addition of several trace and tramp elements in the ppm range is investigated. In the following paragraphs, a brief literature overview is provided, focusing on the effects of the particular relevant trace and tramp elements.
The individual and combined influence of P, S, Ni, Cu, Mo, Sn and Co on the transformation behavior, microstructure and functional properties of steels has been reported by Raabe et al. in Ref. [7]. Houpert et al. [20] quantitatively investigated potential problems related to increased amounts of Mo, Cr and Ni, which can be considered as tramp elements in low-alloyed steels. The study shows that Mo alone or in combination with Cr and Ni forms hard stable carbides and enhances solid solution strengthening, resulting in increased hardness, strength and oxidation resistance. However, the observed increase in hardness and strength comes at the cost of reduced ductility, which is critical for the formability of steels [20].
The impact of additional alloying by Cu, Ni and Cr in advanced TRIP steels was investigated by Kim et al. [21]. The results indicate that the addition of Cu or Cu + Ni increased the volume fraction of retained austenite and improved the strength-to-ductility ratio. On the other hand, increasing the Cr or Cr + Ni content in the TRIP steel led to a ferrite–martensite dual-phase steel with superior strength but inferior ductility. Furthermore, the increase in Cr elevated austenite hardenability, which led to the formation of martensite after isothermal transformation [18]. Generally, Cu, Ni and Cr influence phase stability in steels, with Cr stabilizing ferrite and Cu and Ni stabilizing austenite, thereby suppressing the formation of diffusion-controlled microstructures like pearlite and favoring harder, displacive structures such as bainite or martensite. This effect is particularly evident in alloys with elevated concentrations of austenite-stabilizing tramp elements, which lower the pearlite transformation temperature and increase the fraction of displacive phases [22].
Sekunowo et al. [23] systematically investigated the impact of Cu as a tramp element in elevated concentrations of up to 0.39 wt.% in construction steel with a base composition of Fe–0.15C–1.5Mn–1.5Si, similar to the steel investigated in this study. A Cu concentration above 0.23 wt.% led to severe microstructural distortions, surface cracks and compromised mechanical properties. The primary driving force for these effects was the formation of Cu-rich precipitates at grain boundaries in combination with hot shortness. This phenomenon arises at processing temperatures exceeding the melting point of Cu (1085 °C), when segregated Cu forms a liquid phase that coats the grain boundary, reducing grain cohesion and hindering effective load transfer between pearlite grains. These effects culminated in reductions in ultimate tensile strength, impact resistance and hardness by 54, 74 and 65%, respectively [23].
Tramp elements such as P, S, As, Sn and Sb are generally known to be detrimental to steel properties as they segregate at grain boundaries, promote temper embrittlement and reduce ductility and toughness [16]. Furthermore, Inujima and Ichikawa [24] investigated the effect of Sn on the mechanical properties of a low-alloyed steel grade. Their study revealed that Sn promotes solid solution and precipitation strengthening mechanisms through the formation of intermetallic Sn compounds. As a result, tensile strength and hardness increased, whereas ductility and toughness were reduced [24].
The main objective of the present experimental study is to investigate the aggregate impact of P, S, Ni, Cu, Mo, Sn and Co elements, introduced through secondary steel manufacturing, on phase transformation behavior, phase composition, microstructure, grain morphology and hardness in a low-alloyed hypoeutectoid steel. For this purpose, in situ high-energy synchrotron X-ray diffraction (HE-XRD), coupled with dilatometry, is used to evaluate crystalline phases and changes in sample dimension during the heat treatment. In addition, the investigated steels were probed using light optical microscopy (LOM) and electron back-scatter diffraction (EBSD) in their as-delivered and heat-treated conditions. The Vickers hardness of investigated alloys in both as-delivered and heat-treated states was evaluated to assess the combined influence of phase composition and microstructure.

2. Materials and Methods

2.1. Composition of Steel Alloys

In this work, a low-alloyed hypoeutectoid steel grade was investigated with respect to the influence of increasing trace and tramp elements. For this purpose, the Reference alloy 0.285 wt.%C alloyed with Mn, Si and V (denoted as the Reference alloy) was produced via the blast furnace (BF) route. In contrast, two additional trial alloys designated as Medium-Scrap and High-Scrap alloys were produced with intentionally increased trace and tramp element concentrations, as presented in Table 1, through an experimental melting route to simulate scrap-based electric arc furnace (EAF) production [25].

2.2. Microstructural Characterization

Cross-sections of as-delivered and heat-treated alloys were examined using an Axio Imager M2 light optical microscope (LOM) (Carl Zeiss AG, Oberkochen, Germany) after 3 s of Nital etching (3% HNO3 ethanol solution). A detailed microstructural investigation was conducted using a Tescan Magna scanning electron microscope (SEM) (Brno, Czech Republic) equipped with an eFlash electron backscatter diffraction (EBSD) detector from Bruker (Billerica, MA, USA). The SEM was operated at a 20 kV acceleration voltage and a 6 nA beam current, while the exposure time at the detector was set to 15 ms. The EBSD sample preparation involved multiple metallographic steps: (i) dilatometer samples, in both as-received and heat-treated conditions, were sectioned to expose the cross-section and hot-embedded in Struers Polyfast phenolic resin (Struers GmbH, Ballerup, Denmark) at 180 °C and 15 bar pressure for 15 min; (ii) manual grinding was performed using 320-grit SiC paper; and (iii) a multi-step, water-free polishing procedure that was carried out using Struers (Struers HmbH, Ballerup, Denmark) polishing discs with 9 µm, 3 µm (DAC disc), 1 µm (NAP disc), and a final polishing step 0.05 µm QATM Etosil E (ATM Qness GmbH, Mammelzen, Germany) on a Struers chemical polishing disc.

Martensite Phase Assessment

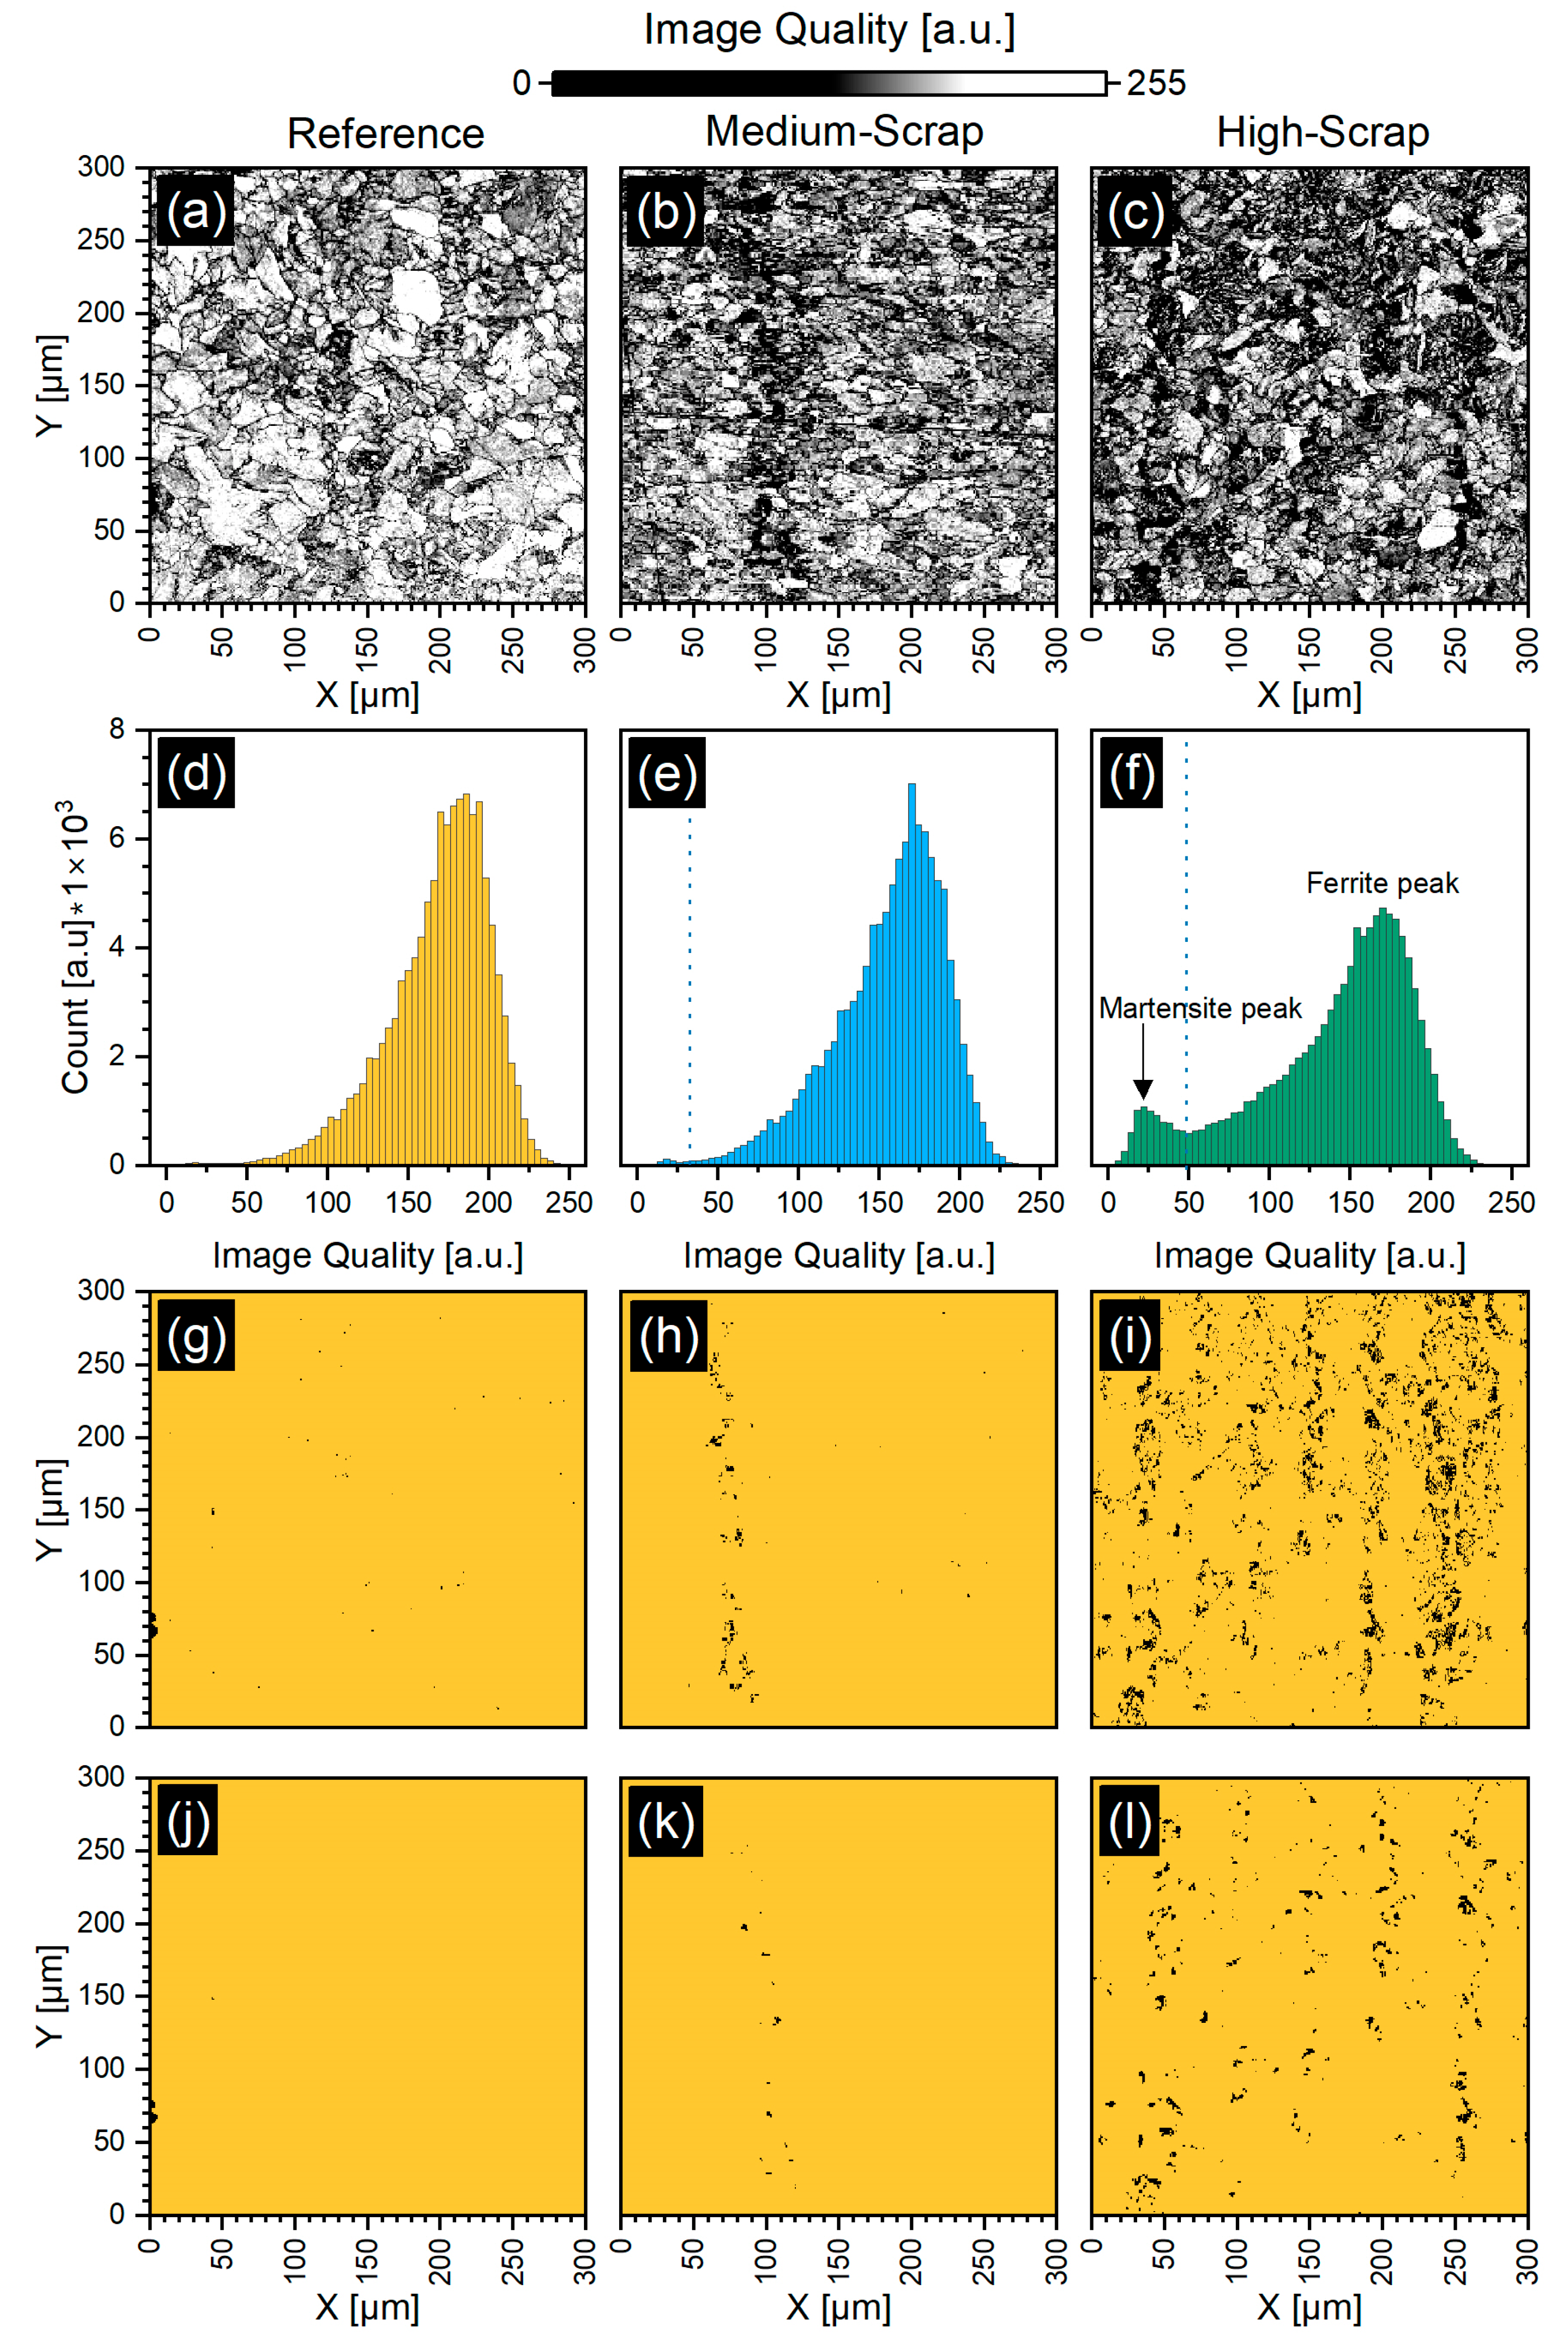
The chosen cooling rate of 2 °C/s (cf. Section 2.3) during the dilatometry experiments may result in the formation of martensite. Given the close relationship between the body-centered tetragonal (BCT) structure of martensite and the body-centered cubic crystal (BCC) structure of ferrite [26], distinguishing between these two phases by X-ray diffraction (cf. Section 2.3) is a challenging task. Calcagnotto et al. [27] developed a routine to quantitatively evaluate the presence of martensite from EBSD measurements. This approach is based on the analysis of EBSD patterns, where the indexing quality (IQ) can be correlated with the occurrence of martensite and its BCT phase. In the first step, the IQ threshold value (TV) is determined by graphing the IQ distributions of BCC-associated measurement points in a histogram. Specifically, the TV is identified as the minimum point in the bimodal distribution of the IQ histogram. EBSD-measured points with IQ values below the TV are associated with martensite. If the IQ distribution shows only a single peak, it indicates that no martensite is present. As a first approximation, all points with IQ values below the threshold are associated with martensite. However, this approach does not distinguish between grain boundaries and martensite-associated points. To eliminate the contribution of grain boundary regions, a second condition is implemented: a given point is associated with martensite only if at least three neighboring points also have IQ values below the TV.

2.3. In Situ HE-XRD Analysis

In situ HE-XRD experiments were conducted at the P07B beamline at PETRA III of the Deutsches Elektronen-Synchrotron (DESY), Hamburg, Germany. Cylindrical samples (5 mm in diameter, 10 mm in length) were prepared by wire arc erosion. Sample heating and length monitoring were performed using a customized DIL 805A/D dilatometer (TA Instruments, New Castle, DE, USA) integrated in the beamline. Temperature monitoring was realized by an S-type thermocouple spot-welded at the center of the sample surface. The samples were austenitized in a vacuum at 1000 °C for 15 min (heating rate: 3 °C/s) and subsequently cooled to room temperature using He (cooling rate: 2 °C/s). A collimated monochromatic X-ray beam with an energy of 87.1 keV (λ = 0.014235 nm) and cross-section of 0.2 × 0.2 mm2 was used. Full Debye–Scherrer diffraction rings were collected using a PerkinElmer XRD 1621 area detector (Waltham, MA, USA) (resolution of 2048 × 2048 pixels), positioned ~1.12 m behind the sample. Each stored pattern was compiled from 20 bright-field and 20 dark-field images, with an exposure time of 0.2 s per image, resulting in a total acquisition time of approximately 10 s. Prior to measurements, the experimental set-up was calibrated on an NIST (National Institute of Standards and Technology) standard LaB6 powder (SRM 660b). Further details of the set-up can be found in Ref. [28]. The recorded 2D diffraction patterns were axially integrated into 1D 2θ-intensity diffractograms using PyFAI-based software (version 2023.9.0) [29,30].

2.4. Rietveld Refinement

The temperature-dependent evolution of crystalline phases within the samples was evaluated quantitatively using Profex 5.5.0 [31], an open-source software for multiphase Rietveld refinement [32]. The instrumental configuration was modeled using the built-in Profex tool and calibrated against a reference LaB6 diffraction pattern in LeBail mode. The heat treatment process involved two phase transformations: α-Fe + Fe3C → γ-Fe → α-Fe + Fe3C + (γ-Fe). The refinement procedure was divided into five distinct regions: phase transformation regions and non-transformation regions. Diffraction peaks were fitted by Pseudo-Voigt functions, and relevant crystallographic information files (.cif) were retrieved from the Materials Project [33] for Im-3m (229), α-Fe (mp-13), Fm-3m (225), γ-Fe (mp-150), Pnma (62) and Fe3C (mp-510623) from the database, version v2025.04.10, and incorporated into the model. The analysis adhered strictly to the guidelines established by the International Union of Crystallography Commission on Powder Diffraction to ensure reliable results [34]. To achieve a high level of agreement between the model and experimental data, temperature-dependent parameters—such as lattice constants, peak broadening, micro-strain, and crystalline size distribution—were refined [35]. The precision of the model was assessed using two parameters: χ2 and the difference curve [36]. Refinement of the scale factors was carried out to determine quantitative volume fraction of individual phases [37]. A detailed list of refined parameters, including refinement limits, is provided in Appendix A, see Table A1.

2.5. Hardness Testing

Hardness testing was performed using a DuraScran G5 Hardness tester (Emco Test) (EMCO-TEST Prüfmaschinen GmbH, Kuchl, Austria). The tests were conducted after the EBSD investigation on the previously polished surfaces. The Vickers indenter applied a force of 98.06 N (HV10), following standard Vickers hardness testing practices. A high load equivalent to 10 kgf was intentionally selected to average the hardness values over a large number of grains. The reported hardness represents the average of 5 and 13 indentations for the as-delivered and heat-treated samples, respectively, which were evenly distributed diagonally across the sample surface to minimize the influence of potential microstructure variations from the edges to the center of the sample.

3. Results

3.1. Cross-Sectional Grain Morphology

Optical micrographs of the as-delivered and heat-treated samples after etching with Nital are presented in Figure 1. Nital etching enhanced the visibility of the ferritic–pearlitic microstructure, making it easier to distinguish the individual phases based on color contrast: ferrite appears whitish, whereas pearlite appears dark. The contrast between ferrite and pearlite in etched microstructures arises from their differing etching behaviors. In pearlite, the presence of cementite promotes localized galvanic activity at ferrite–cementite interfaces, resulting in accelerated etching and a darker appearance. In contrast, ferrite is etched more uniformly and to a lesser extent, appearing comparatively lighter. All three as-delivered samples of the Reference, Medium-Scrap and High-Scrap alloys, presented in Figure 1a–c, respectively, exhibit a similar ferritic–pearlitic microstructure with elongated uniaxial ferritic and pearlitic grains at approximately the same phase content and comparable grain size. This microstructure is typical for a low-alloyed low-carbon steel after hot rolling [38]. After heat treatment, the retained ferritic–pearlitic microstructure in the case of all alloys presents more regularly distributed, equiaxial grains.
Additionally, complex microstructure features composed of uniaxial needle-shaped constituents were observed, as visible in Figure 1d–f for the Reference alloy and Medium-Scrap and High-Scrap trial alloys, respectively. This newly developed microstructure is acicular ferrite [39]. The analysis of micrographs with 200× magnification, presented in Figure 1g–i, reveals an increasing fraction of this newly developed phase with an increasing concentration of trace and tramp elements. This phenomenon suggests an enhancement in the displacive transformation with a higher content of trace and tramp elements. Hatzenbichler et al. [40] investigated the influence of trace and tramp elements on the average grain size of a hypoeutectoid steel grade with similar chemical composition before the heat treatment. The results indicate a slightly finer microstructure in the High-Scrap trial alloy, as suggested by the Abrams three-circle method, where the ASTM grain size increases by approximately 0.3 from the Reference to the High-Scrap trial alloy.

3.2. Grain Morphology and Quantitative Martensite Characterization via EBSD

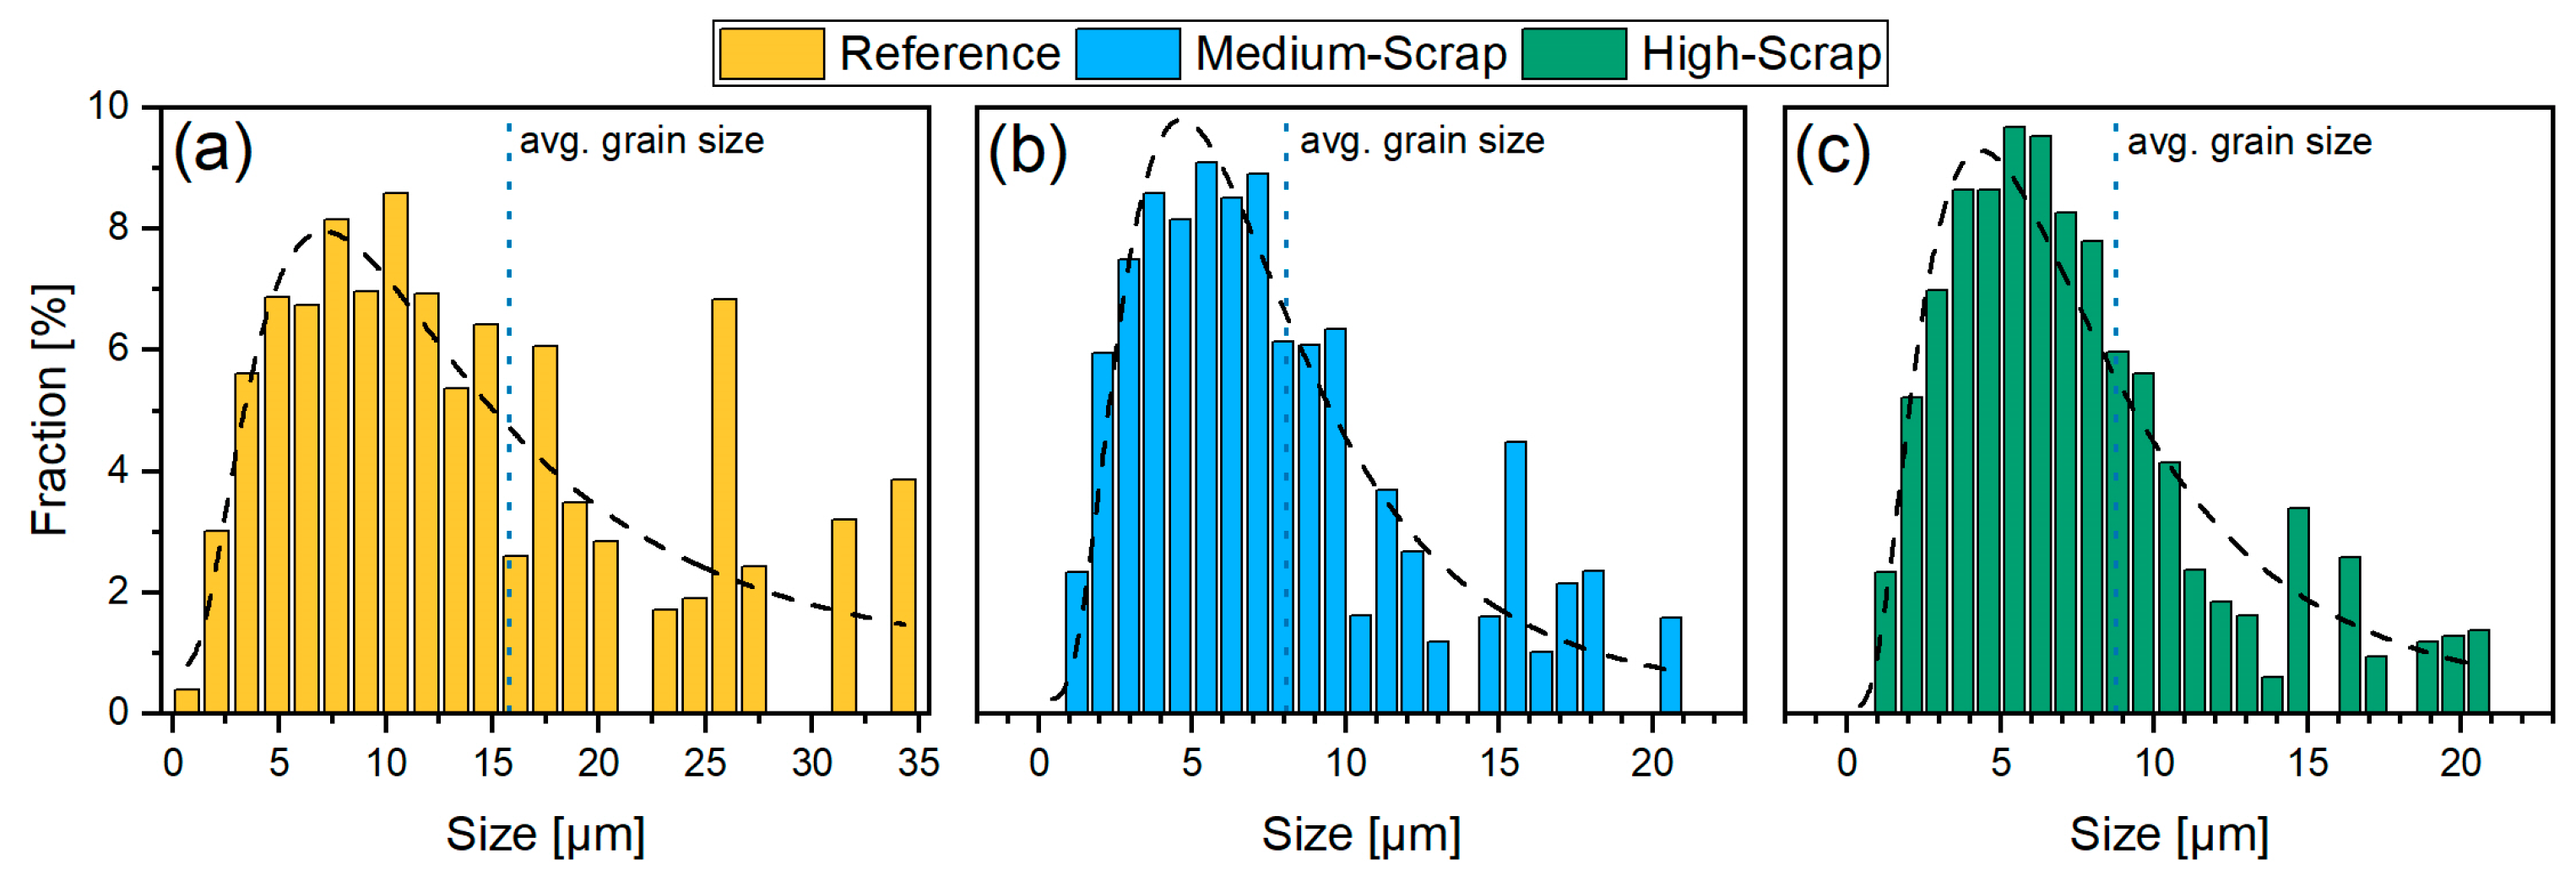
EBSD analysis was performed on the Reference alloy and Medium and High-Scrap trial alloys after the heat treatment. The inverse pole figures revealed no significant preferential orientation in the heat-treated state and are presented in Appendix A (cf. Figure A1). In addition to the inverse pole figures, EBSD data was used to analyze the (BCC) α-Fe grain size distributions [41]. Corresponding histograms of the Reference alloy and Medium and High-Scrap trial alloys under the heat-treated condition are presented in Figure 2.
The data indicates that the average grain size decreased from 15.81 ± 6.3 µm for the Reference alloy to 8.09 ± 0.87 µm and 8.75 ± 1.69 µm for the Medium-Scrap and High-Scrap trial alloys, respectively. This result is consistent with the results of [40] and further supported by Mehta et al. [42], where the size of the prior austenite grains (PAGs) decreased with an increasing concentration of trace and tramp elements as tramp elements segregate to grain boundaries, resulting in a solute drag effect [43]. As PAG boundaries serve as ferrite nucleation sites during cooling, it is expected that smaller PAGs will result in a smaller average ferrite grain size after the phase transformation, as investigated by Park et al. [44].
Furthermore, the histograms of EBSD image quality for the three heat-treated samples are presented in Figure 3a–c. It is apparent from Figure 3 that, with the increasing content of trace and tramp elements, the BCC image quality and pattern recognition decrease. In accordance with the methodology developed by Calcagnotto et al. [27], histograms for the image quality factor were generated from IQ maps and are presented in Figure 3d–f for the three alloy variants. For the Reference alloy, an IQ distribution with a single peak is visible (Figure 3d), whereas for the Medium alloy (Figure 3e), a bimodal distribution begins to form. In the High-Scrap (Figure 3f) variant, two distinct peaks are visible, with a threshold value marked by a dotted line located at the minimum between the two peaks. The additional peak on the left-hand side of the dotted line is attributed to martensite with a lower IQ compared to ferrite, according to Calcagnotto et al. [27]. In contrast, the Reference alloy exhibits only one peak, which is associated with the BCC ferrite phase. The black areas shown in Figure 3h and Figure 3i represent the fraction of the EBSD image quality below the threshold value, defined in Figure 3e and Figure 3f, which was set for the Medium and High-Scrap trial alloys, respectively, after also applying the first elimination condition introduced in the Section Martensite Phase Assessment. Figure 3k,l present the final qualitative analysis of martensite for the Medium and High-Scrap trial alloys, respectively, after applying the secondary condition (in the Section Martensite Phase Assessment). When comparing the Reference alloy to Medium and High-Scrap trial alloys shown in Figure 3j, Figure 3k and Figure 3l, respectively, a trend of an increasing martensite phase fraction can be seen with the increasing concentration of trace and tramp elements.

3.3. In situ Evaluation of Phase Transformation Behavior as a Function of Trace and Tramp Elements

3.3.1. Evaluation of Phase Transformation Temperatures by Dilatometry

The three alloys were continuously heated in situ using the dilatometer integrated into the P07B beamline, which allows for monitoring the length changes in the samples during the thermal cycle while also recording 2D diffractograms. Figure 4 presents the in situ-recorded changes in the length (∆L) vs. temperature curves for the Reference, Medium and High-Scrap samples.
Initially, during heating, thermal expansion was observed in the sample, which can be interpreted by lattice expansion. After reaching the critical transformation temperature, a contraction was detected, which is linked to the phase transformation from (BCC) α-Fe + (orthorhombic) Fe3C to (FCC) γ-Fe [45]. The contraction can be attributed to the higher packing density of the (FCC) γ-Fe phase compared to the (BCC) α-Fe phase. The critical transformation temperatures determined by the tangential method from the recorded dilatometer curves, Ac1 and Ac3, which represent the start and end of the ferrite–pearlite to austenite phase transformation, respectively, are presented in Table 2.
The relatively low variability of Ac1 and Ac3 with the increase in trace and tramp elements in the alloys suggests that the initial comparable microstructures of the three samples (discussed in Section 3.1) governs the phase transformation behavior.
A detailed analysis of the cooling curves (Figure 4c) reveals a systematic shift in the austenite-to-pearlite transformation to lower temperatures with the increasing concentrations of trace and tramp elements. The austenite decomposition temperature (AR3) decreased by 29 °C from the Reference to the High-Scrap alloy. AR3 temperatures for all three samples are summarized in Table 2. This reduction indicates a pronounced influence of residual elements on the transformation kinetics.
Additionally, the martensite start (Ms) temperature for all investigated alloys (Reference, Medium-Scrap and High-Scrap) was calculated based on an empirical formula proposed by Trzaska [46], taking into account the chemical composition of individual samples as well as the cooling rate (−2 °C/s), and was also experimentally determined from the dilatometer curves. Empirically calculated Ms temperatures for all investigated alloys are presented in Table 2. The start of martensite formation, at the Msexp temperature, is denoted by a sudden expansion in the dilatometer curve, as seen in Figure 4d. In a detailed analysis of the cooling parts of the dilatometer curves, this phenomenon was observed only in the case of the High-Scrap sample at 292 °C, signifying martensite formation. For the Reference and Medium-Scrap samples, it was not possible to reasonably determine the Ms temperature as the concentration of martensite was insufficient for reliable analysis.

3.3.2. Qualitative Phase and Microstructure Analysis by HE-XRD

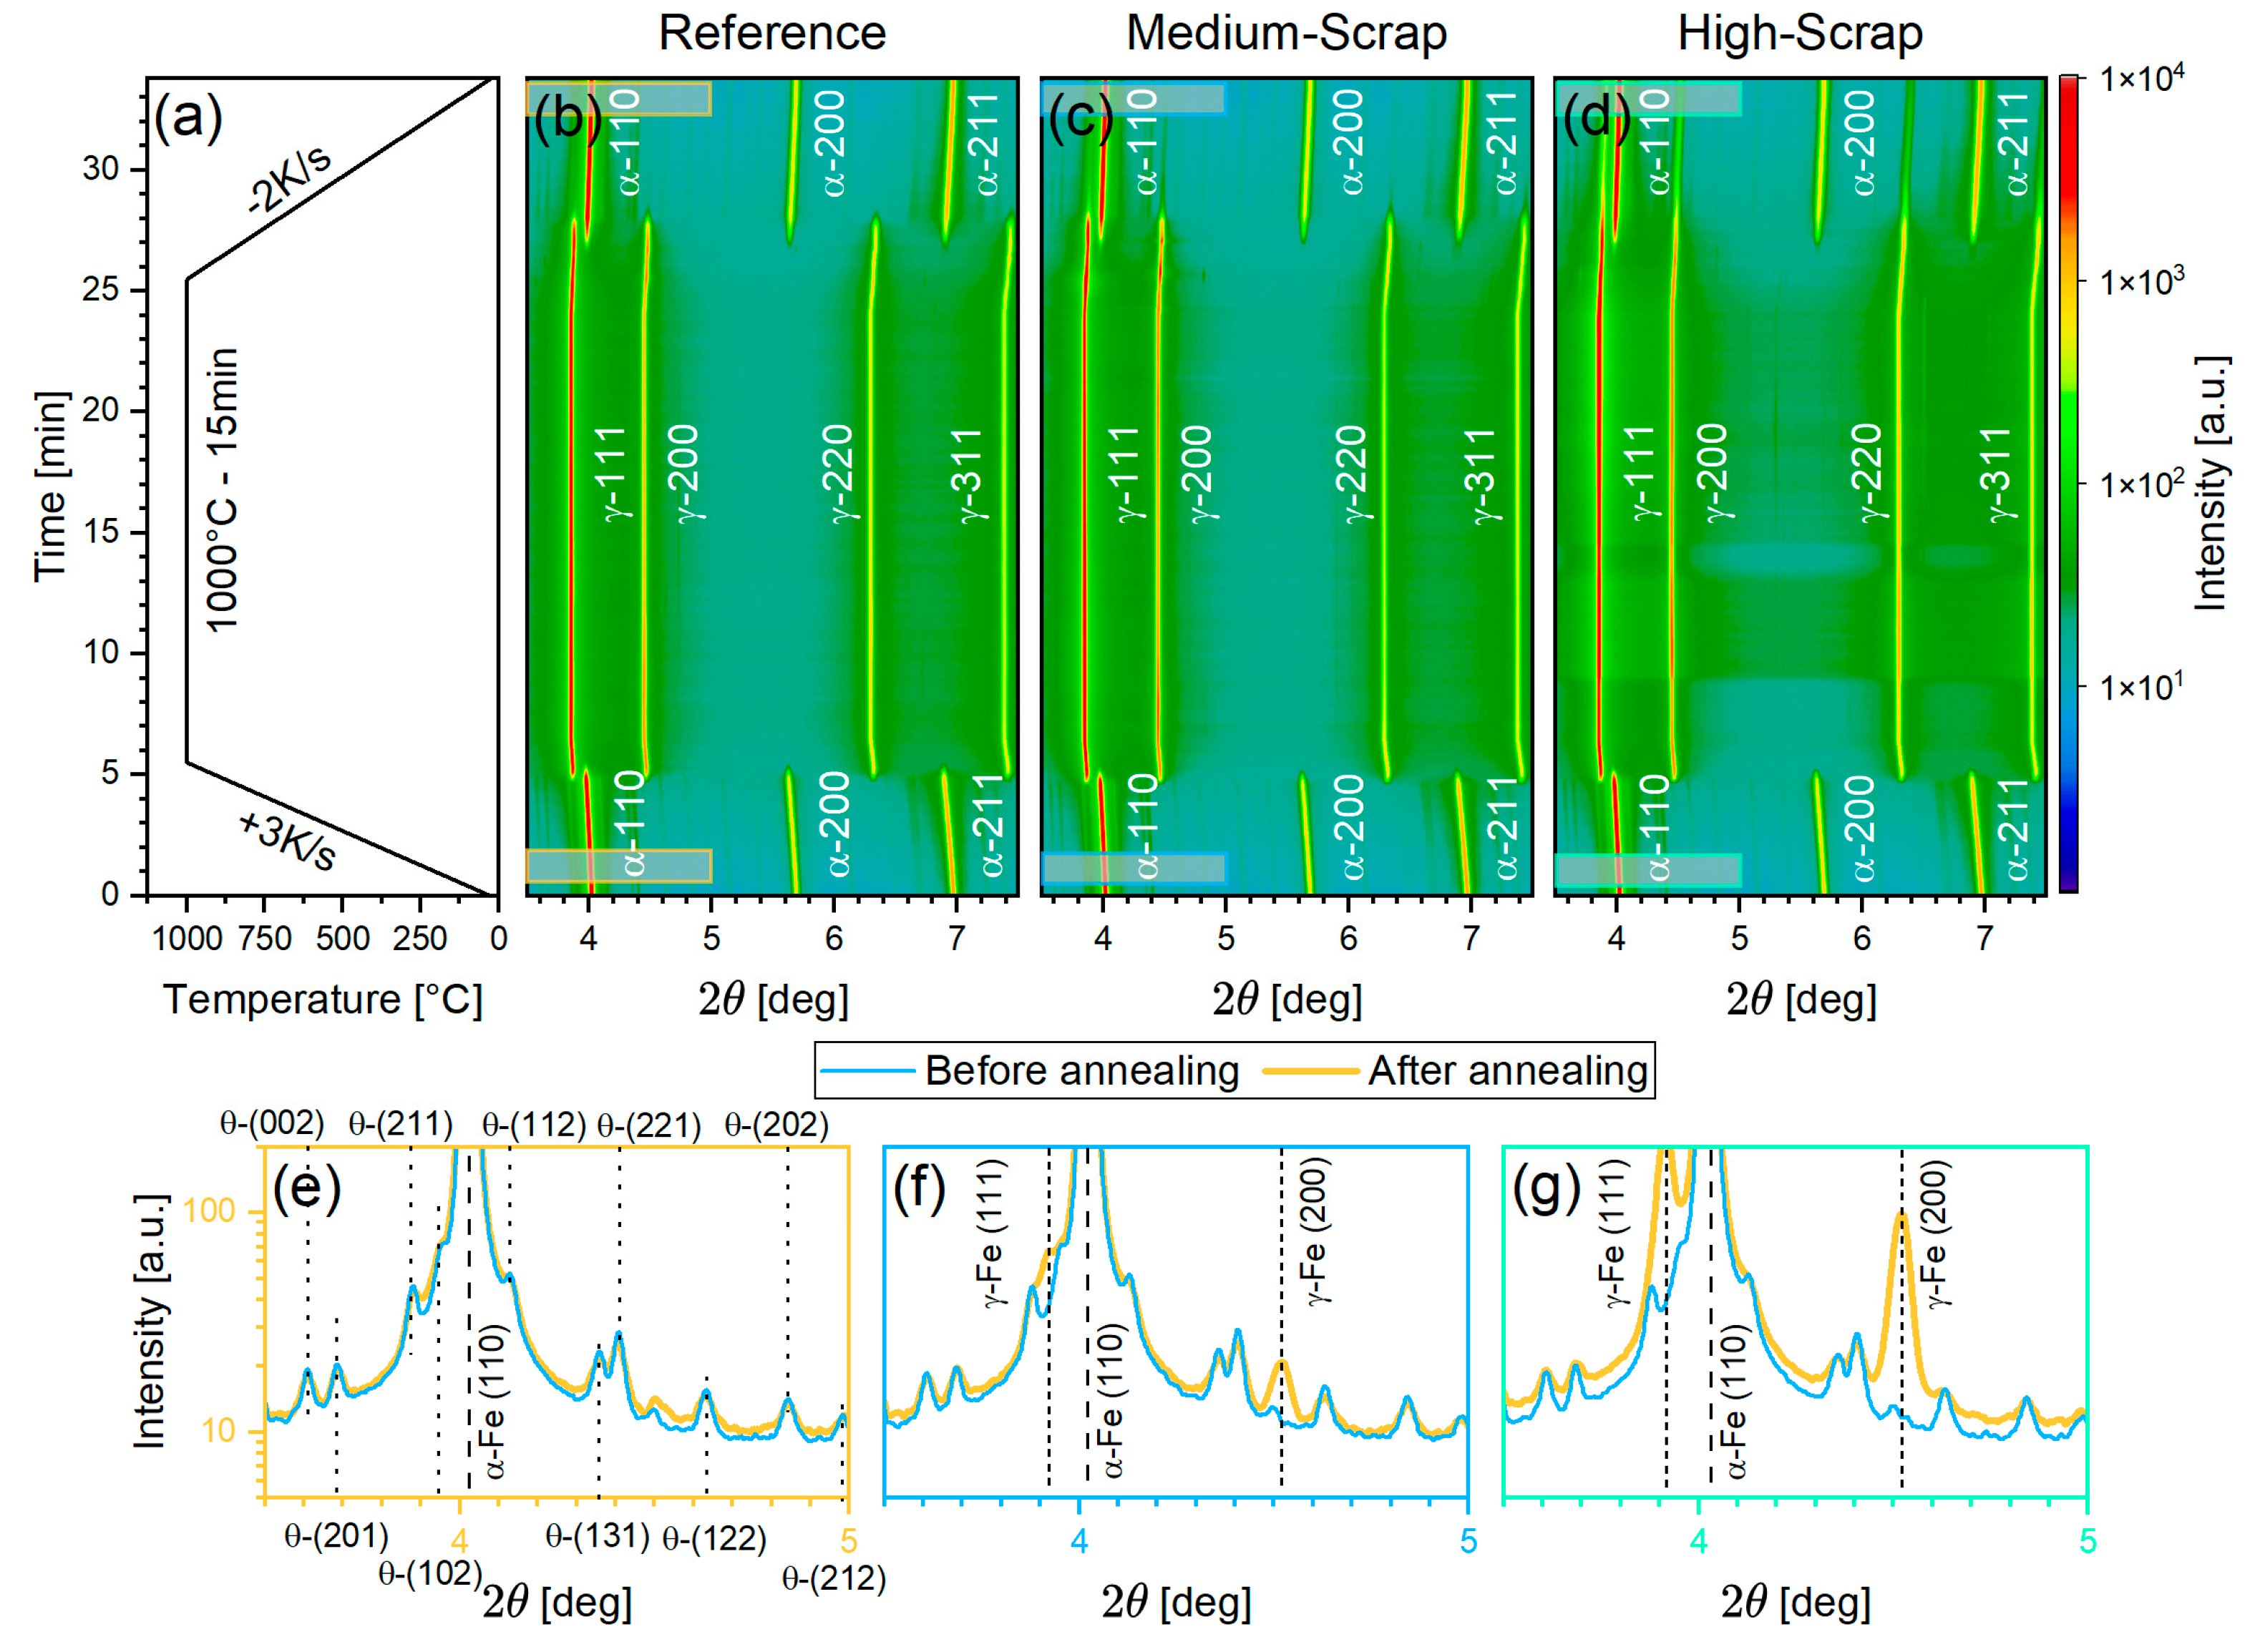
The recorded 2D diffractograms were azimuthally integrated for every exposure to obtain diffraction intensity dependence on Bragg’s angle, 2θ. The intensity-2θ profiles were further stacked into contour plots, also referred to as phase plots. These are presented in Figure 5b–d for the Reference alloy and Medium and High-Scrap trial alloys throughout the thermal cycles. Initially, at the beginning of the heating experiment, the three alloys were composed of the BCC α-Fe phase and the orthorhombic Fe3C cementite phase, as indicated by the particular reflections in Figure 5b–d. The exclusive presence of ferrite and cementite before the heat treatment is also confirmed by the intensity-2θ profiles presented in Figure 5e, Figure 5f and Figure 5g for the Reference alloy and two trial alloys, the Medium and High-Scrap alloys, respectively.
As the temperature increases during the dilatometer experiment, ferrite and cementite diffraction peaks shift to lower diffraction angles, reflecting the thermal expansion of their lattices. Additionally, a decrease in the intensity of BCC α-Fe-associated diffraction peaks was observed with the increasing temperature, even well below Ac1. This phenomenon is linked to carbon redistribution, which can reduce the crystallographic coherence of ferrite, leading to a decrease in diffraction peak intensity. Furthermore, an increase in the intensity of the cementite peaks was discerned from the phase plots (Figure 5b–d) up to the start of the phase transformation at ~730 °C. This increase can be related to the coarsening of cementite lamellas [47]. As cementite lamellas coarsen, the size of coherently diffracting domains increases, which also results in a diffraction intensity increase.
The α-Fe → γ-Fe phase transformation could be observed in the temperature range of 729–832 °C, in agreement with the dilatometry data in Figure 4 and Table 2, and it was accompanied by a complete dissolution of the cementite phase. Throughout the holding period of 15 min, only strong FCC γ-Fe diffraction peaks were detected. No significant changes were observed in the austenite diffraction peaks during the holding period, suggesting phase stability.
Upon cooling, austenite diffraction peaks shifted to higher angles, reflecting the lattice contraction. The γ-Fe → α-Fe phase transformation occurred in the temperature interval consistent with the dilatometer data outlined in Figure 4 and Table 2. Additionally, cementite precipitation from austenite shifted from 602 °C in the case of the Reference alloy to 583 and 579 °C for the Medium and High-Scrap samples, respectively. This observation is in agreement with the changed chemical composition of investigated alloys (see Table 1). The increasing concentration of austenite-stabilizing elements (see Table 1) prolongs the thermodynamic stability of austenite to lower temperatures, delaying cementite precipitation.
In the case of the Reference alloy, the initial phase composition was recovered, as confirmed by the diffraction patterns in Figure 5b,e. Similarly, the initial phase composition of the α-Fe and Fe3C phases was recovered in the case of the Medium-Scrap trial alloy, even though faint γ-200 and γ-220 reflections were recorded by the detector, visible in Figure 5c and Figure 5f.
Finally, the High-Scrap trial alloy exhibited a presence of relatively strong reflections of the FCC γ-Fe phase after the thermal cycle, as can be seen in Figure 5d and in the intensity-2θ profile presented in Figure 5g.
In the as-delivered state, the intensities and full width at half maximum (FWHM) of the α-Fe 200 diffraction peaks of all three alloys ranged between 827 and 847, as well as between 27.58 and 28.89 × 10⁻³ deg (cf. Table 3) respectively, indicating that the samples’ microstructures were comparable before the heat treatment.
On the other hand, the heat treatment had a measurable impact on both the intensities and FWHMs of the α-200 diffraction peaks in the Reference, Medium and High-Scrap alloys. Beginning with the Reference alloy, despite the recovery of the phase composition after the heat treatment (cf. Figure 5b,e), the intensity and the FWHM of the α-Fe 200 diffraction peak slightly decreased by ~61 a.u. and increased by ~3 × 10⁻³ deg, respectively, compared to the data from the as-delivered counterparts. For the analysis of microstructural changes in the Medium-Scrap and High-Scrap trial alloys, the decrease in intensity by ~7% and the increase in FWHM by ~12% can be used as the baseline.
Comparably, in the Medium-Scrap trial alloy, the relative changes are ~12% and ~16% for the α-Fe 200 diffraction peak intensity and FWHM, respectively, which indicates a ~4% increase in variation with the increased content of trace and tramp elements. In the case of the High-Scrap trial alloy, the changes are even higher, yielding a 10% decrease in the α-Fe 200 diffraction peak intensity and again a 16% increase in the FWHM. For both samples, a significant contribution to the higher FWHMs and lower intensities can be found in the presence of retained austenite, as can be seen from Figure 5f,g for the Medium and High-Scrap trial alloys.
Furthermore, the complementary EBSD analysis (in Section 3.2) indicated the presence of a martensite BCT crystal structure [26]. Since the distortion of the martensitic phase is only ~3% compared to the BCC α-Fe phase, α-Fe and martensite diffraction peaks are expected to overlap, which will result in an FWHM increase.
Given the qualitative analysis so far, introducing the trace and tramp elements specified in Table 1 leads to significant changes in phase composition, which will be presented in detail in the following section.

3.3.3. Quantitative Phase Analysis Using Rietveld Refinement

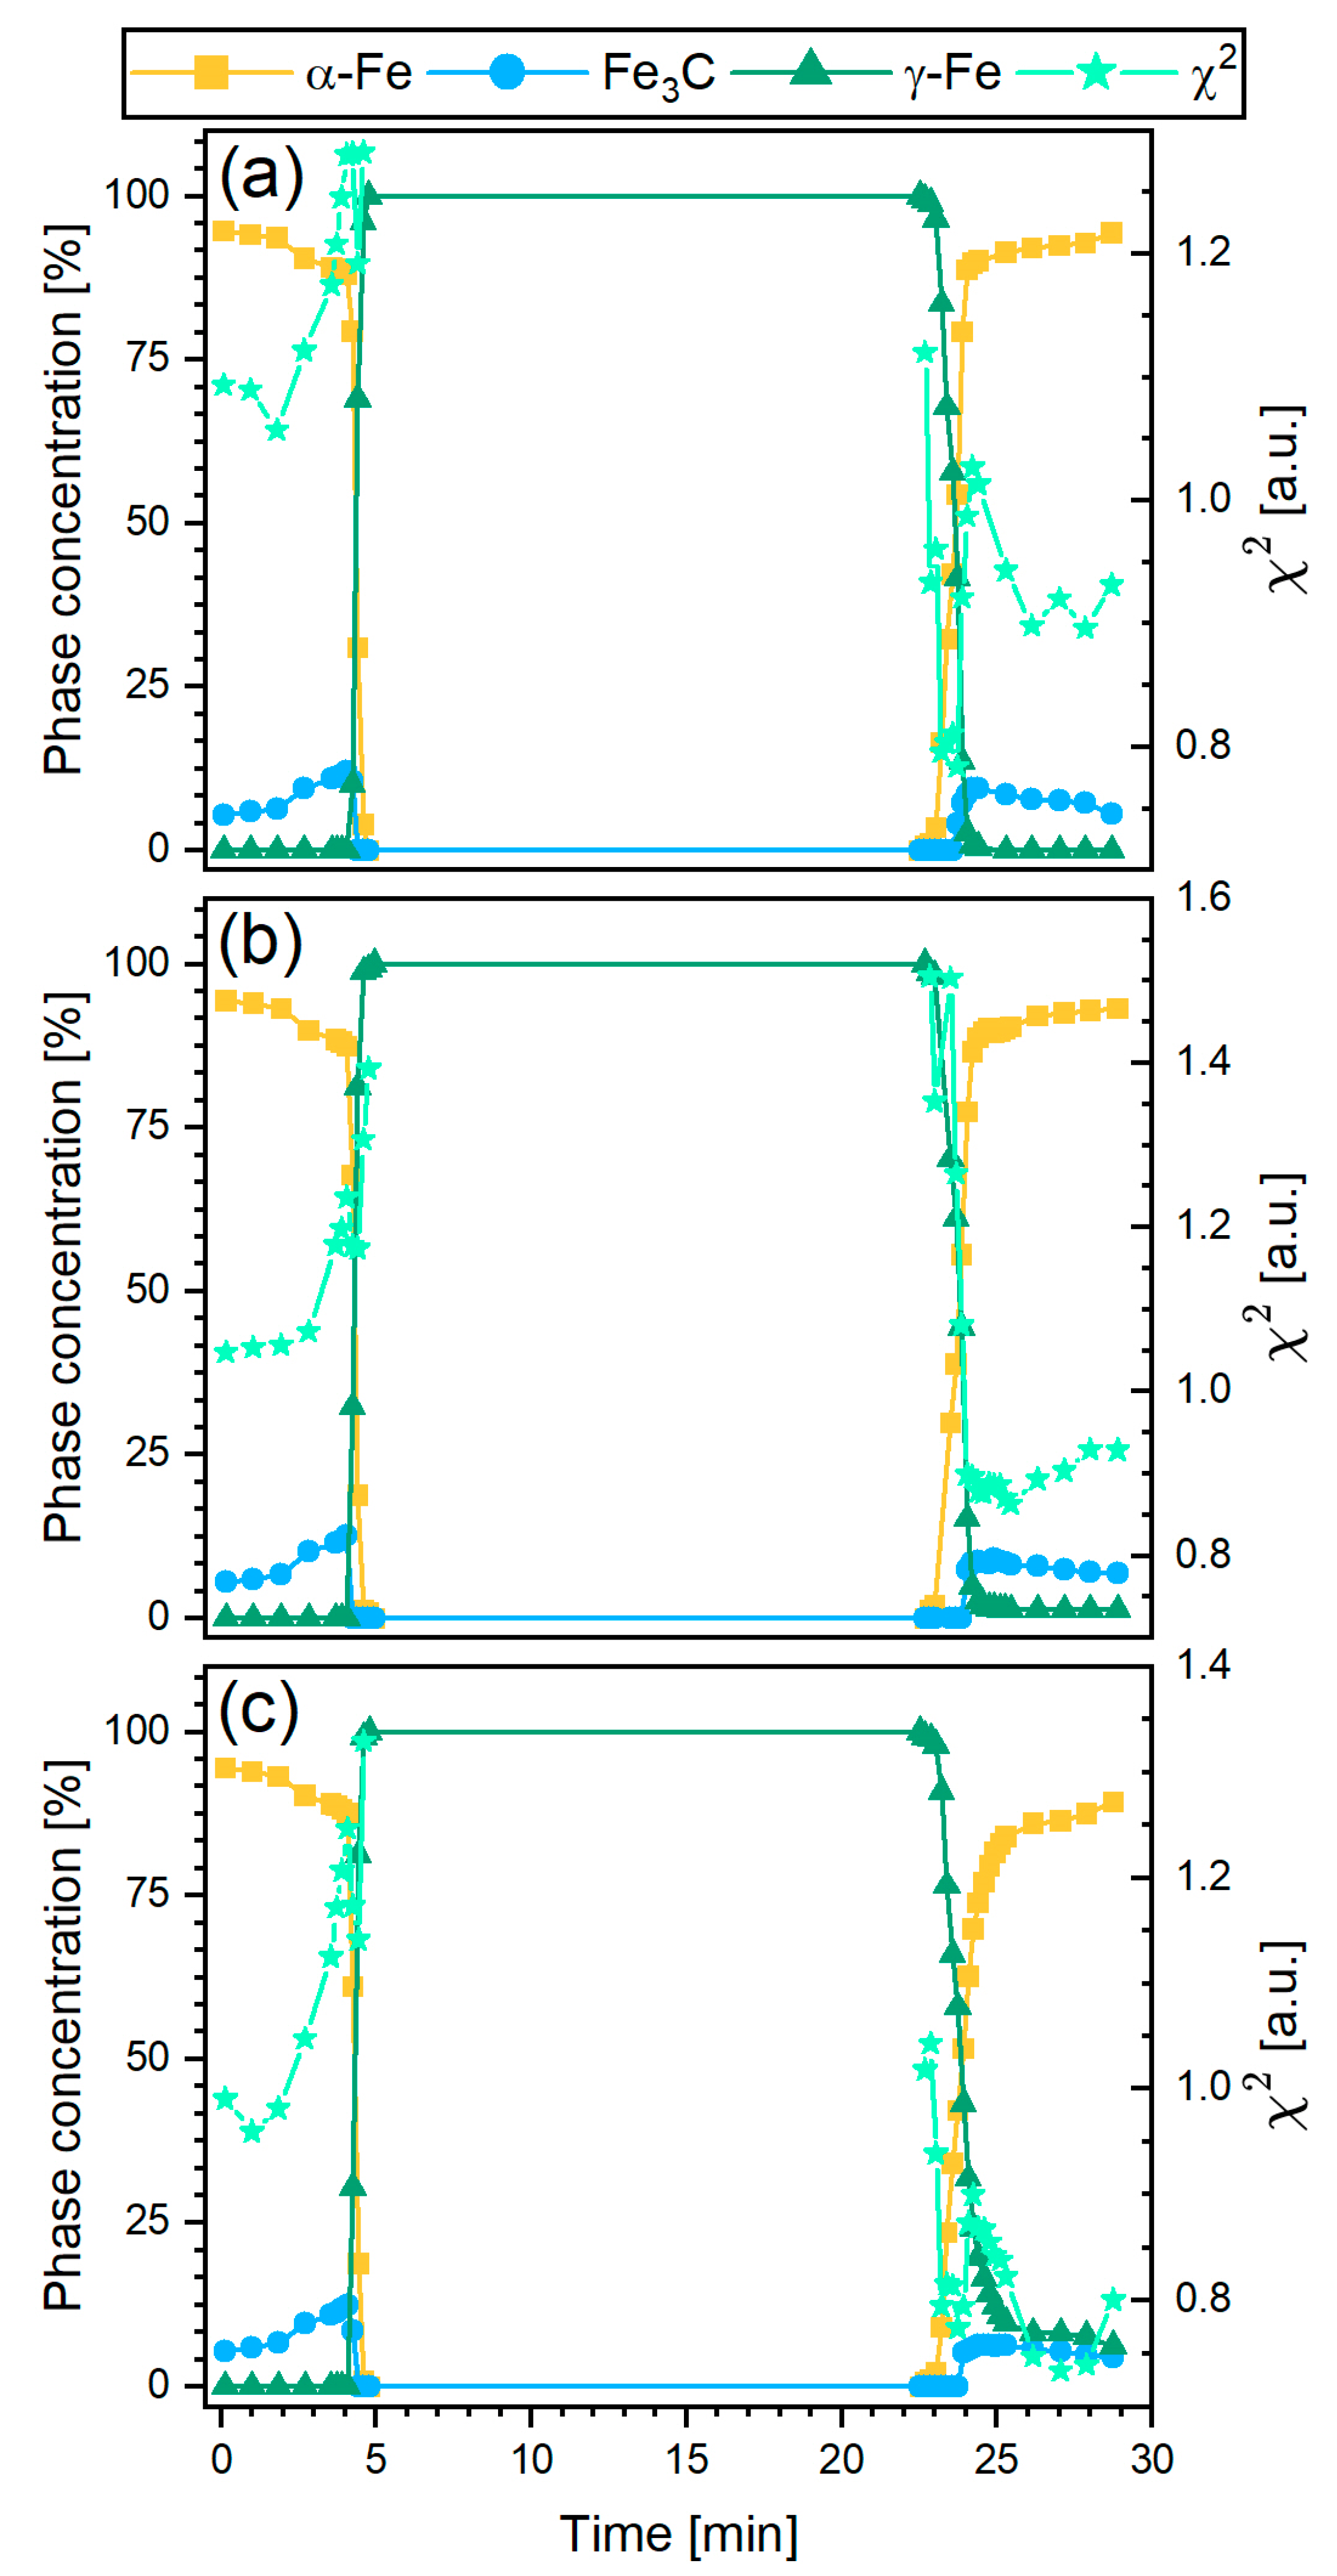
In addition to the qualitative phase analysis presented above, the intensity-2θ profiles, evaluated from the 2D diffraction patterns at different stages of the thermal cycles, were further evaluated using Rietveld refinement. The main objective was to quantitatively evaluate the volume fraction of the α-Fe, γ-Fe and Fe3C phases within the three alloys, the results of which are presented in Figure 6a–c.
The quantitative multiphase Rietveld refinement revealed ~95% ferrite and 5% cementite phase volume fraction in the as-delivered state for all investigated alloys (cf. Figure 6). Upon heating, the volume fraction of ferrite decreases in favor of cementite, which can be related to possible cementite lamellae grain growth [41]. The gradual broadening of α-Fe and Fe3C diffraction peaks during heating can be attributed to the thermal motion of the scattering centers, as described by the Debye–Waller factor. This effect increases with temperature, leading to a reduction in the coherence of scattering and corresponding peak broadening (Figure 6) [48]. This reasoning is further supported by the observation that the increase in the Fe3C content during heating is reversible for the Reference alloy. Specifically, during cooling, following the phase transformation from γ-Fe → α-Fe + Fe3C, the α-Fe content is slightly increased at the expense of the Fe3C content (Figure 6a).
Upon reaching the Ac1 temperature (summarized in Table 2 for the individual alloys), the α-Fe + Fe3C → γ-Fe phase transformation progressed rapidly, accompanied by the complete dissolution of the α-Fe and cementite phases when reaching Ac3. Between Ac3 and the maximal temperature, as well as during the holding period, no changes in the phase composition could be detected within the resolution of the in situ X-ray diffraction experiment (Figure 6). For the Reference alloy, upon reaching AR3 during cooling, the austenite transforms rapidly into ferrite and cementite (Figure 6a). In particular, the phase transformation is completely reversible, meaning that at the end of the thermal cycle, the same volumetric amounts of ferrite and cementite are present compared to the beginning.
Qualitatively, the phase transformation during cooling observed in the Medium-Scrap variant yields no significant difference compared to the Reference alloy (cf. Figure 6a,b). However, the detailed investigation yielded reduced ferrite phase fractions of 0.64 ± 0.007 vol.% compared to the as-delivered state. Additionally, as already seen by the qualitative phase analysis presented above (cf. Figure 6c), a certain amount of retained austenite is present. Although the intensities of the austenite peaks were too low for a thorough quantification in the case of the Medium-Scrap trial alloy, the presence of the γ-Fe suggests approx. 0.75% volume fraction of retained austenite after the heat treatment (Figure 6b).
Finally, in the case of the High-Scrap trial alloy, significant differences are observed upon reaching the onset of the phase transformation temperature during cooling (Figure 6c). Primarily, one can observe that the slope of the austenite dissolution in the time domain (~23–25 min into the experiment, corresponding to temperatures of 744 and 433 °C, respectively) is considerably lower for the High-Scrap alloy (Figure 6c) in comparison to the Reference (Figure 6a) and Medium-Scrap (Figure 6b) alloys. Additionally, the retained austenite phase fraction in Figure 6c does not reach a plateau immediately, but this is observed for the Medium-Scrap trial alloy in Figure 6b. Both of these observations indicate a continuous transformation of austenite into the BCC α-Fe phase. It can be assumed that the continuously formed phase between 400 °C (25.5 min) and room temperature (end of experiment) identified as BCC α-Fe is in fact BCT martensite. Under this assumption, we can estimate the volume fraction of martensite in the High-Scrap sample to be approximately 2.71%. This interpretation is in agreement with the microstructural analysis presented in Section 3.2, where EBSD analysis revealed an increased martensite formation with an increasing concentration of trace and tramp elements. Furthermore, the volume fraction of austenite at room temperature (end of the experiment) was estimated to be 6.2 vol.%.
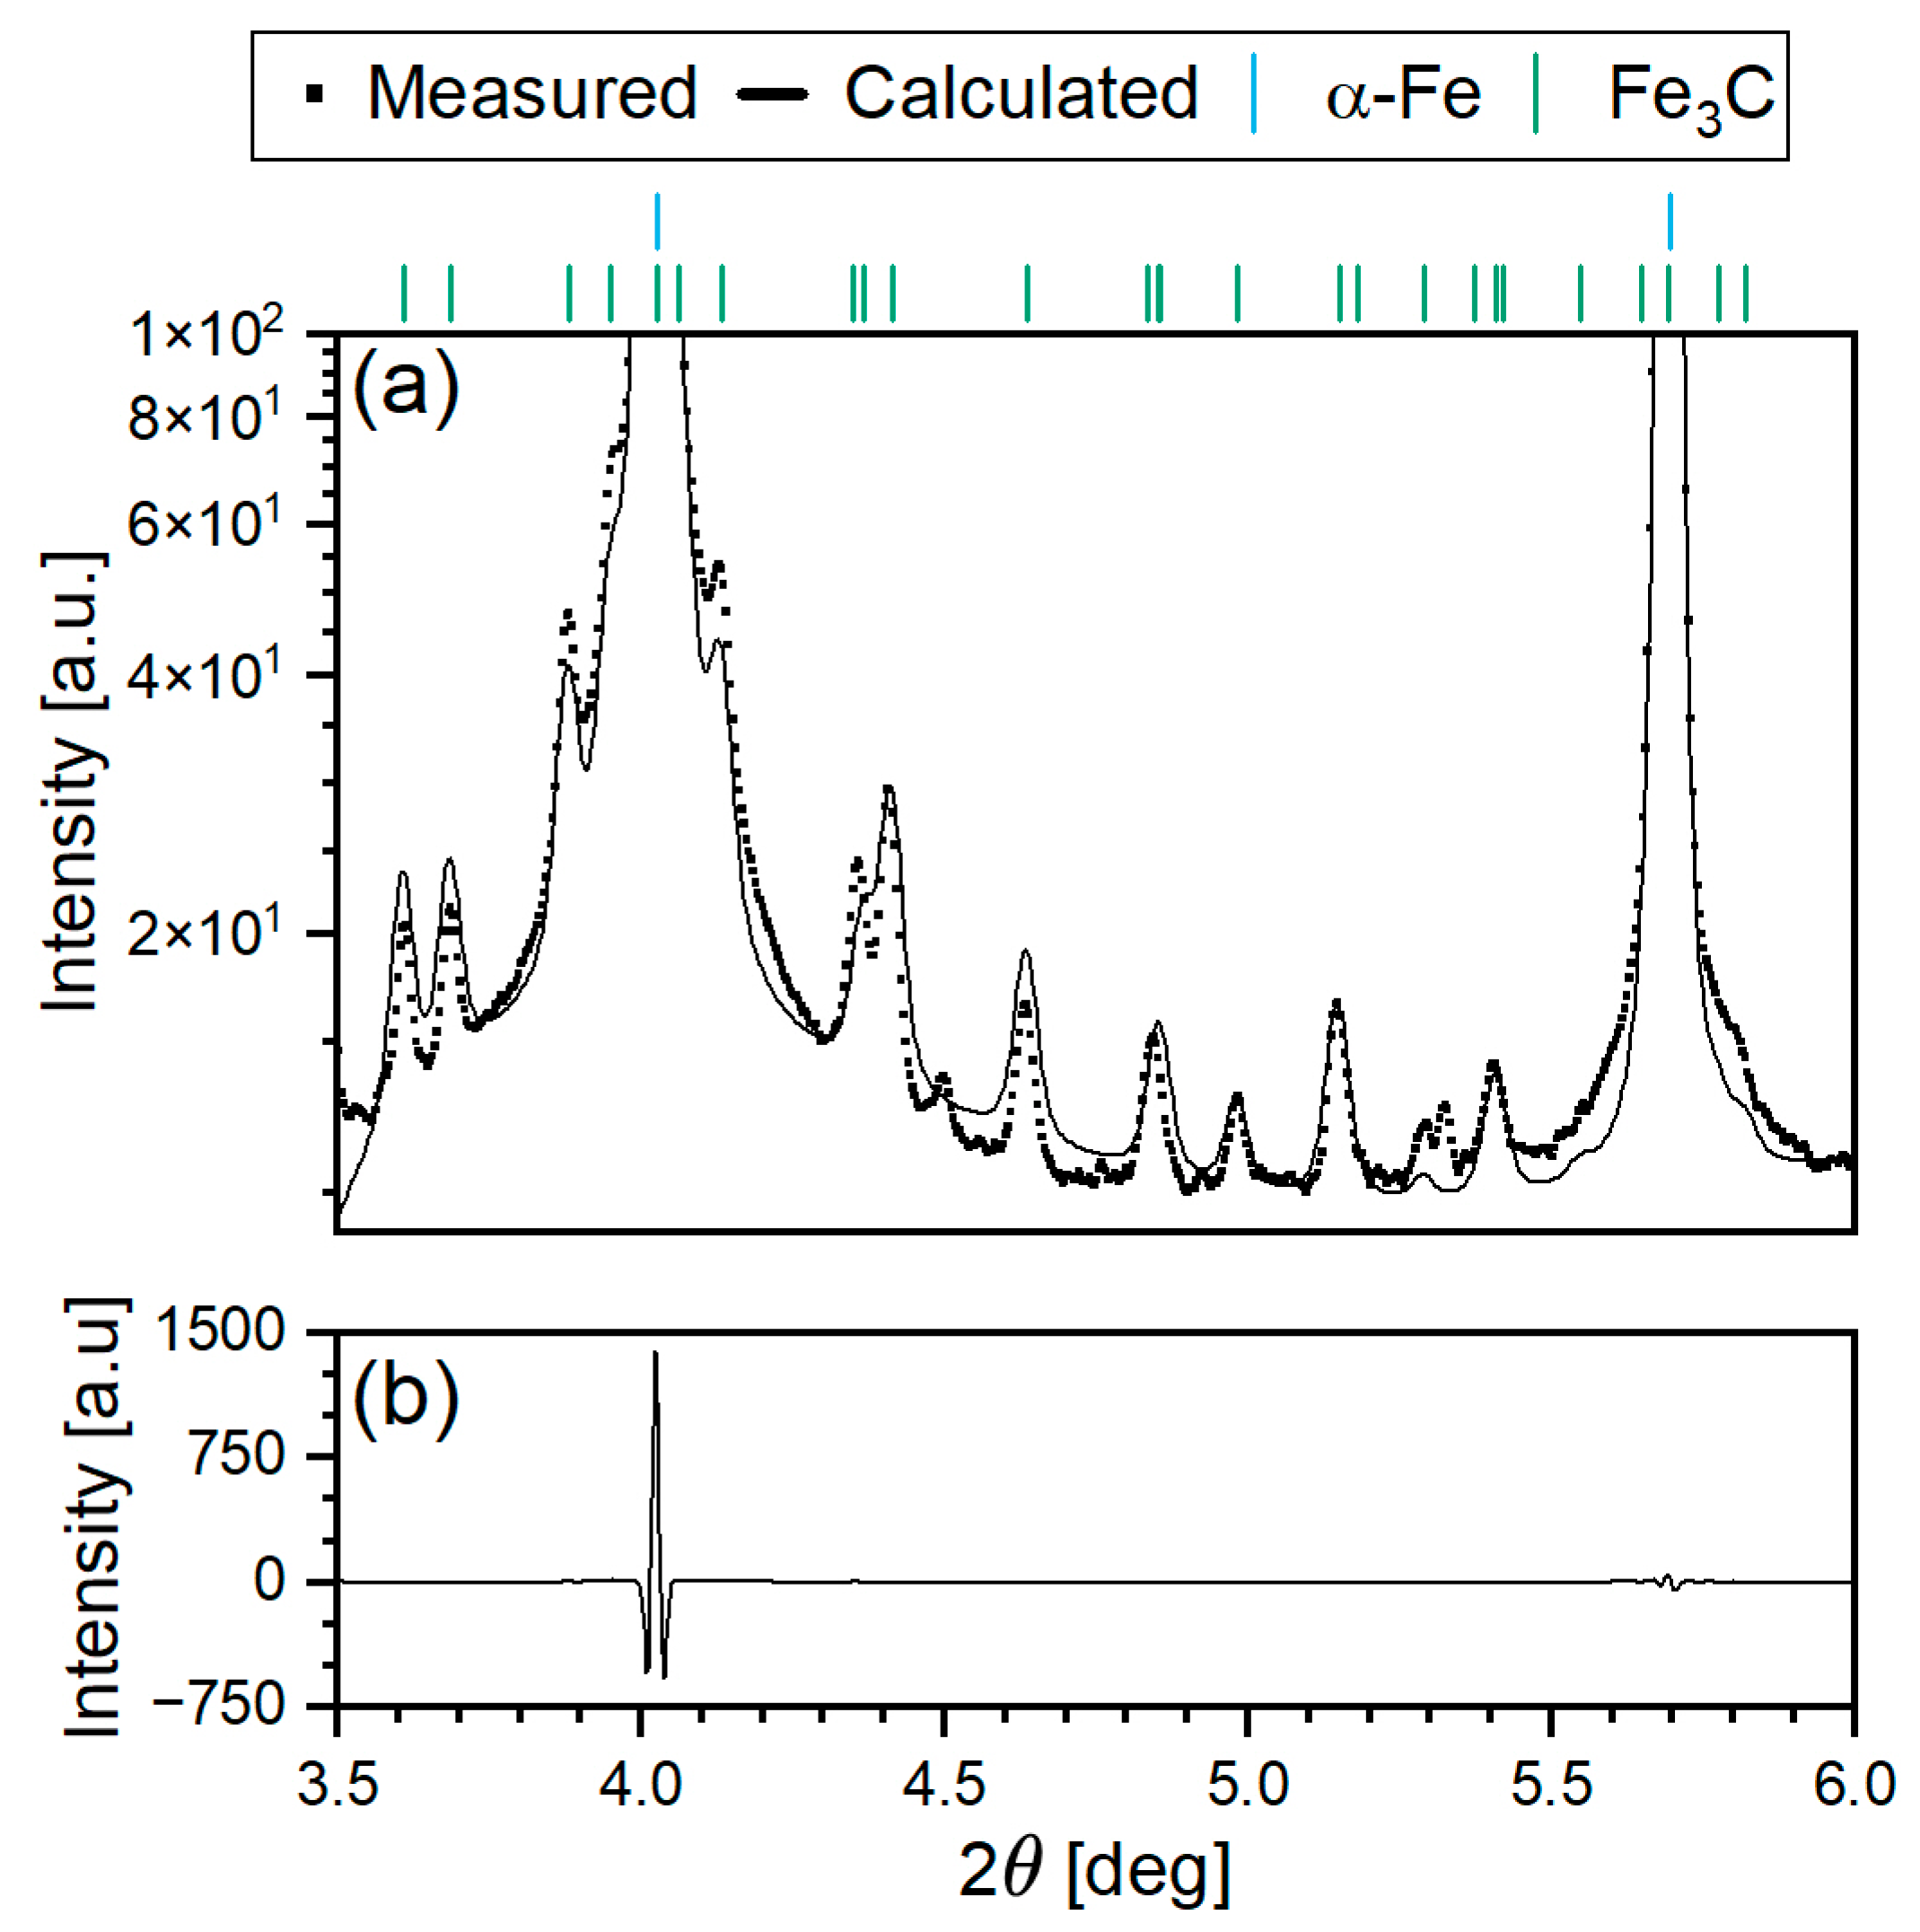
The reliability of the refinement was assessed using the χ2 parameter and the difference curve. Figure 6 presents the χ2 values for individual refinements of the Reference alloy and the two trial alloys. The χ2 values remain close to 1 and increase near the phase transformation regions. This increase can be attributed to several factors, including peak broadening and overlapping associated with the emergence or coexistence of multiple phases and evolving microstructural features such as strain or crystallite size variations, which are often not fully accounted for in the refinement model. Figure A2 in Appendix A shows a representative measured diffraction pattern and the corresponding calculated curve from Rietveld refinement of the Reference alloy at room temperature before heat treatment. The close agreement between the data, along with the minimal deviations in the difference curve in Figure 2b, confirms the quality of the fit and the reliability of the structural model.

3.4. Hardness Testing

Vickers hardness measurements were taken on all investigated steel variants (Reference, Medium and High) in both as-delivered and heat-treated conditions. The reported results, shown in Figure 7, represent the averages of 5 and 13 indentations performed along the diagonal across each sample surface for the as-delivered and heat-treated samples, respectively. This approach was chosen to minimize the influence of microstructural gradients that may occur between the center and the edge of the sample. A high load equivalent to 10 kgf produced indentations with a diagonal length of approximately 250 µm, encompassing an average of 10 to 12 grains for hardness measurement.
In the as-delivered state, average Vickers hardness values of 272.2 ± 11.84 HV, 268.2 ± 4.16 HV and 272.6 ± 1.92 HV were measured for the Reference, Medium-Scrap and High-Scrap samples, respectively (see Figure 7).
The overall Vickers hardness of the as-delivered alloys shows only a limited variation of ~7.3 HV (cf. Figure 7), which represents a difference of ~2.5%. This result is in agreement with the microstructural investigation as well as the quantitative phase analysis in this study, where no or very limited differences were observed.
Comparing the Vickers hardness of the three investigated alloys in the as-delivered and heat-treated states, only a small variation of approximately −3% for the Reference alloy and +2.5% for the Medium-Scrap trial alloy is observed. In comparison, the Vickers hardness of the heat-treated High-Scrap trial alloy rose by 8.2% compared to the as-delivered state.
In the heat-treated state, a clear trend of increasing hardness with an increasing concentration of trace and tramp elements is observed (cf. Figure 7). The Vickers hardness values increased from 264.15 ± 7.2 HV for the Reference alloy to 274.69 ± 8.08 HV for the Medium-Scrap alloy and 295 ± 13.28 HV for the High-Scrap trial alloy. These values represent increases of approximately 4 and 11.7%, respectively, compared to the Reference alloy.
The 4% increase in hardness observed in the Medium-Scrap trial alloy is relatively subtle and unlikely to result from changes in microstructure or phase composition. This assumption is supported by prior experimental results, where no significant changes in microstructure (Section 3.1) or phase composition (Section 3.3.3) were detected between the Reference and Medium-Scrap alloys in the heat-treated condition. Stephenson [49] suggests that metallic tramp elements, mainly Cu, Ni, Mo and Sn, even in residual concentrations positively affect hardness primarily through solid solution strengthening. It is plausible that this phenomenon accounts for the incremental 4% increase in the measured hardness of the Medium-Scrap trial alloy.
In contrast, the High-Scrap trial alloy exhibits a more pronounced increase in hardness, namely 11.7% compared to the Reference and 7.7% compared to the Medium-Scrap trial alloy. This increase can be primarily attributed to major microstructural and phase compositional changes due to the increased concentration of trace and tramp elements. This conclusion is supported by the detailed analysis of dilatometer curves (Section 3.3.1), EBSD analysis (Section 3.2) and Rietveld refinement (Section 3.3.3), suggesting the formation of martensite, a very hard iron–carbon phase that, in low-alloyed steels with 0.3 wt.% C, can exhibit hardness values exceeding 610 HV [50]. A secondary contribution to the increased hardness is likely attributable to solid solution strengthening as the overall concentration of residual elements also increases from the Medium-Scrap to the High-Scrap trial alloy (see Table 1).

4. Discussion

The systematic investigations conducted in this study extend the scope of previous research by examining the effects of tramp elements at low concentrations on the microstructural evolution and mechanical properties of hypoeutectoid low-alloyed steels. The primary objective was to comprehensively analyze the combined impact of elements such as P, S, Ni, Cu, Mo, Sn and Co.

4.1. Phase Transformation Behavior

The optical micrographs presented in Figure 1 demonstrate that 3 s of Nital etching effectively enhanced the visibility of the ferritic–pearlitic microstructure, allowing clear differentiation between the ferrite and pearlite phases based on their distinct coloration.
In the as-delivered state, all three alloys, namely the Reference, Medium-Scrap and High-Scrap alloys, exhibited a ferritic–pearlitic microstructure, consistent with previous studies on low-carbon steels [51]. The uniaxial elongated grain structure parallel to the hot-rolling direction, indicated by the red arrow in Figure 1a, suggests the formation of a fiber texture typical of hypoeutectoid low-alloyed steels subjected to hot-rolling. This observation aligns with the findings reported by Zhang et al. [52], who reported similar microstructural characteristics in dual-phase hot-rolled steel. Furthermore, elevated concentrations of trace and tramp elements (cf. Table 1) appeared to have no apparent effect on grain size in the as-delivered state.
After the heat treatment, significant microstructural transformations were observed (cf. Figure 1). The emergence of an equiaxial ferritic–pearlitic grain morphology across all variants indicated full recrystallization during the thermal cycle (Figure 5a). However, a particularly prominent aspect of the newly developed morphology is the appearance and increased prevalence of needle-shaped structures, resembling acicular ferrite, particularly evident in the Medium-Scrap and High-Scrap alloys (see Figure 1h,i). These features are characteristic of displacive phase transformations, likely martensitic in nature. This conclusion is supported by a previous investigation by Malyshevskii et al. [53], who suggested that using Cr, Mo, Cu and Ni as alloying elements in concentrations above 1 vol.% enhances the hardenability of steels. It is reasonable to expect that the cumulative effect of these elements (Cr, Mo, Cu and Ni), even at concentrations less than 1 vol.%, drives the formation of displacive phases, especially in the case of the High-Scrap trial alloy.
While only minor variations in Ac1 and Ac3 temperatures across the investigated alloys (cf. Table 2) were observed, the detailed analysis of the cooling curves, presented in Figure 4c, revealed a significant retardation of the temperature during the austenite-to-pearlite transformation in the case of the High-Scrap trial alloy. This observation is in line with previous findings by Barger and Schulze [22], who demonstrated that elements such as Ni and Cu can extend the austenite phase stability zone. Furthermore, elements such as Sn and Cu are known to segregate to PAG boundaries, inducing a solute drag effect and delaying ferrite grain nucleation [54,55]. Decreased transformation temperatures significantly reduce carbon diffusion, which hinders the formation of diffusion-controlled microstructures, such as pearlite, in favor of displacive phases such as bainite or martensite [22].
The increased hardenability of tramp element-enriched trial alloys was further corroborated by a methodology developed by Calcagnotto et al. [27] based on EBSD analysis (see Section 3.2). The EBSD image quality (IQ) maps presented in Figure 3a–c offer compelling evidence of microstructural diversification due to residual elements. The evolution from unimodal IQ distribution in the Reference alloy to a clear bimodal distribution in the High-Scrap variant strongly indicated the coexistence of BCC ferrite and BCT martensite phases (cf. Figure 3d,e,g). The appearance of this secondary IQ population further reinforced the interpretation of increased displacive transformation behavior, leading to a rising martensite fraction with an increasing scrap content. Furthermore, the dilatometer curve of the High-Scrap trial alloy, presented in Figure 4d, exhibited a distinct sudden expansion, typical for martensite formation. These observations collectively indicate increased fraction of displacive phases, primarily martensite, in tramp element-enriched alloys.
Additionally, the EBSD analysis of the BCC α-Fe grain size, presented in Figure 2, revealed a notable grain refinement with the increasing concentration of trace and tramp elements. The data presented in Figure 2 demonstrated approximately a two-fold reduction in the average grain size when comparing the Reference alloy to the Medium-Scrap and High-Scrap trial alloys. This study attributed the reduction in the prior austenite grain (PAG) size to the segregation of tramp elements, primarily Cu and Sn, at PAG boundaries, which induce a solute drag effect; similar findings were reported by Zhu et al. [56]. Since PAG boundaries serve as α-Fe nucleation sites during the phase transformation, a decrease in PAG size increases the number of nucleation sites, thereby promoting α-Fe grain refinement. This mechanism aligns with observations by Park et al. [44], further supporting the role of tramp elements segregation, even below 1 vol.% concentrations, in influencing microstructural evolution during austenite to pearlite phase transformation.

4.2. Phase Composition Evolution

The HE-XRD (Figure 5) in combination with the Rietveld refinement (Figure 6) revealed the presence of retained austenite in the Medium-Scrap and High-Scrap trial alloys, demonstrating the effect of tramp elements on the austenite phase stability window. A similar effect was reported by Kim et al. [21] in the case of a TRIP-aided cold-rolled steel, where the addition of Cu (+ 0.51 wt.%) and Ni (+ 0.41 wt.%) resulted in an increased volume fraction of retained austenite. Our findings complement these results and even extend their validity to ~ 0.2 vol.% concentrations.
In contrast to the Reference alloy, where the phase transformation is fully reversible, Rietveld refinement of Medium-Scrap and High-Scrap trial alloys revealed a decreased volume fraction of cementite. This observation further complements previous reasoning of obstructed carbon diffusion from austenite, hindering the formation of diffusion-controlled phases and resulting in enhanced formation of displacive phases, like martensite [22]. Continuous formation of martensite in the High-Scrap trial alloy, after reaching the Ms temperature, was further supported by the absence of immediate phase fraction equilibrium after the phase transformation. The continuous decrease in the austenite volume fraction accompanied by the increase in the volume fraction of ferrite-associated phases indicates a continuous formation of displacive phases after reaching the Ms temperature.
These findings further emphasize the influence of tramp elements, even in concentrations of less than 1 vol.%, on the phase composition and formation of displacive phases. The results highlight the importance of tight control of chemical composition of the melt in scrap-based secondary manufacturing.

4.3. Hardness

The reported hardness of the as-delivered alloys, presented in Figure 7, exhibited low variability, with a difference of only 7.3 HV. This result is consistent with previous microstructural (Section 3.1) and phase composition (Section 3.3.3) analyses, which revealed no significant differences among the investigated as-delivered alloys.
In contrast, thermally cycled alloys demonstrated a clear trend of gradually increasing hardness with rising concentrations of trace and tramp elements. For the Medium-Scrap trial alloy, a modest 4% increase in Vickers hardness was observed, which was attributed to solid solution strengthening by metallic tramp elements such as Cu, Ni, Mo and Sn, as suggested by Stephenson [49]. The High-Scrap trial alloy exhibited a more pronounced 11.7% increase in hardness compared to the Reference alloy due to significant microstructural and phase composition changes driven by the elevated concentration of residual elements. This conclusion is supported by the previous detailed analysis of dilatometer curves (Section 3.3.1), EBSD data (Section 3.2) and Rietveld refinement results (Section 3.3.3), which collectively suggest the formation of martensite—a very hard iron-carbon phase, which in low-alloyed steels with 0.3 wt.% C can exceed 610 HV [50]. Additionally, a secondary contribution to the increased hardness in the High-Scrap trial alloy is likely due to solid solution strengthening, as the overall concentration of residual elements increased from the Medium-Scrap to the High-Scrap trial alloy (see Table 1). The detection of retained austenite in the High-Scrap alloy, at a concentration of 6.2 vol.%, had only limited impact on hardness, as the hardness of this phase falls in between that of ferrite and pearlite [57].

4.4. Impact of This Study on Future Alloy Designs

This study demonstrated that the presence of unintentional alloying elements, such as Ni, Cu, Mo, Co and Sn, promotes the formation of displacive transformation products within the low-alloyed hypoeutectoid steel microstructure, leading to alterations in its mechanical properties. The findings of this work suggest that the extent of these effects is strongly dependent on the concentration of tramp elements (Table 1). This relationship arises from the experimental results: while the Medium-Scrap trial alloy exhibited moderate changes, the High-Scrap trial alloy showed a markedly more pronounced response.
Taking into consideration the experimental results presented in Section 3, we can propose a framework of strategies to mitigate the adverse effects of tramp elements in secondary steels. This framework encompasses two complementary approaches: (i) counteralloying, and (ii) modification of processing parameters, such as the cooling rate.
Counteralloying offers the possibility to balance the detrimental influence of residual elements through the addition of selected alloying elements. By carefully tailoring the chemical composition, the negative impact of tramp elements on phase stability and transformation kinetics can be offset, thereby preserving the desired mechanical properties. For example, micro-alloying with Si, Mn and B can reduce Cu-induced surface hot shortness by reducing copper enrichment at the steel-scale boundary. Secondly, adjusting the processing parameters, primarily the cooling rate during processing, can be performed as a countermeasure against the segregation and precipitation effects induced by tramp elements, additionally suppressing the formation of displacive phases. However, a slower cooling rate may increase the pearlite interlamellar spacing, resulting in a negative impact on mechanical strength [58,59,60].
Together, these approaches illustrate that the mitigation of tramp element effects cannot rely on a single measure but requires a combination of compositional and processing strategies. Their effective implementation, however, depends on a deeper understanding of the mechanisms by which residual elements alter phase transformation behavior, particularly regarding nucleation, growth and partitioning phenomena.
The results presented in this work outline the influence of residual elements at concentrations lower than 0.2 vol.% and highlight that even at these concentrations, tramp elements may present a challenge in EAF scrap-based steelmaking.

5. Conclusions

This study systematically examined the aggregate influence of P, S, As, Sn and Sb on the microstructure, phase transformations and resulting hardness of a hot-rolled low-alloyed hypoeutectoid steel grade (~0.3 wt.% C). Sample behavior during heat treatment of a Reference alloy prepared through the BF production route was compared to ones with intentionally enriched trace and tramp element concentrations (Table 1) produced via the experimental melting route to simulate scrap-based electric arc furnace (EAF) production.
Optical microscopy, performed after an optimized 3 s period of Nital etching, revealed a characteristic uniaxial ferritic–pearlitic microstructure in the as-delivered condition, which was consistent across all alloy variants. Furthermore, a fiber texture, typical for hot-rolled wires, was observed. Despite the increasing residual element concentrations, the initial grain size and phase distribution remained largely unchanged. After the heat treatment, the OM analysis indicated an isotropic, equiaxial grain morphology as a result of recrystallization. Additionally, an emergence of needle-shaped phases, more pronounced within Medium-Scrap and High-Scrap alloys, suggested enhanced displacive phase transformations.
Dilatometer analysis revealed that the austenite formation temperatures (Ac1 and Ac3) remained relatively unchanged across all compositions, indicating that the transformation onset is primarily microstructure-dominated. In contrast, a pronounced retardation of the austenite-to-pearlite transformation during cooling was observed for the High-Scrap trial alloy, with a 29 °C decrease in AR3, attributed to the expansion of the austenite field by austenite-stabilizing elements and the solute drag induced by residual element segregation. Martensite formation was observed exclusively in the High-Scrap variant at 292 °C, providing further evidence that tramp elements have an influence on the transformation kinetics, enhancing the displacive phase transformation.
The evolution of microstructure and phase composition during thermal cycling was evaluated by in situ HE-XRD. While no relevant differences between the individual alloys were observed during heating or isothermal holding, the analysis of the cooling process revealed significant differences between the three alloys. The increased concentration of tramp elements led to the formation of retained austenite (in Medium-Scrap and High-Scrap trial alloys). Additionally, Rietveld refinement revealed a continuous formation of martensite as the phase concentration of austenite began to decrease, whereas the volume concentration of ferrite continuously increased after reaching the Ms temperature. These results further support previous findings suggesting that an increased concentration of residual elements results in hindered formation of diffusion-controlled phases in favor of displacive phases.
The hardness measurements further corroborate these findings: as-delivered alloys exhibited comparable hardness values, indicating minimal influence of residuals. However, post-heat treatment, hardness progressively increased with the scrap content. This was attributed to a combined effect of solid solution strengthening, grain refinement and, in the High-Scrap variant, martensite transformation.
These findings provide critical insights into the thermomechanical behavior of secondary steels, underscoring the need for adaptive processing strategies in scrap-based steel manufacturing. Given the inevitable presence of tramp elements in secondary raw materials, it is essential to accommodate their influence with a carefully designed processing framework, such as that presented in Section 4. Effective implementation of this framework is achieved when it is tailored to the specific operational needs of steel producers, particularly in cases where variations in microstructure or mechanical response fall outside the acceptable range of parameters. By integrating the framework with existing process windows and technological capabilities, producers can optimize quality assurance without substantial modifications to established production routes. This alignment ensures that the framework is not only scientifically rigorous but also practically feasible, supporting its adoption as a tool for improving process robustness and product consistency in industrial environments.
Further research should focus on strategies to manage the increased levels of tramp elements and on optimizing the main chemical composition (e.g., counteralloying), production parameters and heat treatment processes to achieve equivalent mechanical properties and steel quality as for steels produced through the blast furnace production route.

Author Contributions

Conceptualization, M.G. (Marek Gocnik), P.H. and M.G. (Matthew Galler).; methodology, M.G. (Marek Gocnik), M.M., A.S. and C.-O.A.O.; software, C.-O.A.O.; formal analysis, M.G. (Marek Gocnik); investigation, M.G. (Marek Gocnik), L.H., M.M. and A.S.; resources, P.H., M.G. (Matthew Galler)., A.S., J.K. and R.S.; writing—original draft preparation, M.G. (Marek Gocnik); writing—review and editing, L.H., M.M., P.H., M.G. (Matthew Galler)., C.-O.A.O., J.K. and R.S.; visualization, M.G. (Marek Gocnik); supervision, P.H., M.G. (Matthew Galler)., J.K. and R.S.; project administration, M.G. (Marek Gocnik). All authors have read and agreed to the published version of the manuscript.

Funding

The financial support provided by the Austrian Federal Ministry of Economy, Energy and Tourism; the National Foundation for Research, Technology and Development; and the Christian Doppler Research Association is gratefully acknowledged.

Data Availability Statement

The raw data supporting the conclusions of this article will be made available by the authors on request.

Conflicts of Interest

Author Phillip Haslberger was employed by the company voestalpine Forschungsservicegesellschaft Donawitz GmbH. Author Matthew Galler was employed by the company voestalpine Wire Rod Austria GmbH. Author Claes-Olof A. Olsson was employed by the company SKF AB. The remaining authors declare that the research was conducted in the absence of any commercial or financial relationships that could be construed as a potential conflict of interest.

Appendix A

Table A1. List of refined parameters during the Rietveld refinement for individual phases, including lower and upper bounds. Parameter Gewicht (eng. weight) controls the phase scale parameter.
α-FeFe3Cγ-Fe
ParameterMinMaxMinMaxMinMax
Lattice Parameter (a) [nm]0.280.320.50.520.350.39
Lattice Parameter (b) [nm]--0.670.69--
Lattice Parameter (c) [nm]--0.440.46--
Scale Factor [a.u.]030103
Crystalline Size
Distribution [a.u.]
010101
Micro Strain
[nm−2 × 10⁻³]
00.100.100.1
Gewicht ParameterSPHAR8 SPHAR8 SPHAR8
Figure A1. (a), (b) and (c) show EBSD orientation maps of the Reference, Medium-Scrap and High-Scrap samples, respectively. Presented orientation maps represent the crystallite orientation with respect to the Z-axis. The orientation legend in (a) and the scale bar in (b) apply to all presented images.
Metals 15 01053 g0a1
Figure A2. (a) Experimentally measured diffraction data (points) and the calculated diffraction pattern (solid line) obtained from the Rietveld refinement. (b) Difference curve showing intensity residuals between the measured and calculated patterns.
Metals 15 01053 g0a2

References

  1. World Steel Association. Available online: https://worldsteel.org/data/world-steel-in-figures-2023/ (accessed on 18 December 2024).
  2. Maier, R.; Gerres, T.; Tuerk, A.; Mey, F. Finding Tipping Points in the Global Steel Sector: A Comparison of Companies in Australia, Austria, South Korea and the USA. Glob. Environ. Change 2024, 86, 102846. [Google Scholar] [CrossRef]
  3. Sun, G.; Li, B.; Guo, H.; Yang, W.; Li, S.; Guo, J. Thermodynamic Study of Energy Consumption and Carbon Dioxide Emission in Ironmaking Process of the Reduction of Iron Oxides by Carbon. Energies 2021, 14, 1999. [Google Scholar] [CrossRef]
  4. Boretti, A. The Perspective of Hydrogen Direct Reduction of Iron. J. Clean. Prod. 2023, 429, 139585. [Google Scholar] [CrossRef]
  5. Chevrier, V. Ultra-Low CO2 Ironmaking. Steel Times Int. 2020, 44, 29–34. [Google Scholar]
  6. Spreitzer, D.; Schenk, J. Reduction of Iron Oxides with Hydrogen—A Review. Steel Res. Int. 2019, 90, 1900108. [Google Scholar] [CrossRef]
  7. Raabe, D.; Jovičević-Klug, M.; Ponge, D.; Gramlich, A.; Kwiatkowski Da Silva, A.; Grundy, A.N.; Springer, H.; Souza Filho, I.; Ma, Y. Circular Steel for Fast Decarbonization: Thermodynamics, Kinetics, and Microstructure Behind Upcycling Scrap into High-Performance Sheet Steel. Annu. Rev. Mater. Res. 2024, 54, 247–297. [Google Scholar] [CrossRef]
  8. Dworak, S.; Rechberger, H.; Fellner, J. How Will Tramp Elements Affect Future Steel Recycling in Europe?—A Dynamic Material Flow Model for Steel in the EU-28 for the Period 1910 to 2050. Resour. Conserv. Recycl. 2022, 179, 106072. [Google Scholar] [CrossRef]
  9. Li, G. Chapter 1.4.3—Steel Scraps. In Treatise on Process Metallurgy; Seetharaman, S., McLean, A., Guthrie, R., Seetharaman, S., Sohn, H.Y., Eds.; Elsevier: Amsterdam, The Netherlands, 2025; pp. 151–165. ISBN 978-0-443-33732-1. [Google Scholar]
  10. Daigo, I.; Tajima, K.; Hayashi, H.; Panasiuk, D.; Takeyama, K.; Ono, H.; Kobayashi, Y.; Nakajima, K.; Hoshino, T. Potential Influences of Impurities on Properties of Recycled Carbon Steel. ISIJ Int. 2021, 61, 498–505. [Google Scholar] [CrossRef]
  11. Bell, S.; Davis, B.; Javaid, A.; Essadiqi, E. Final Report on Effect of Impurities in Steel; Natural Resources Canada: Ottawa, ON, Canada, 2006. [Google Scholar] [CrossRef]
  12. Gao, Z.; Sridhar, S.; Spiller, D.E.; Taylor, P.R. Review of Impurity Removal Methods in Steel Scrap Recycling. J. Solid Waste Technol. Manag. 2021, 47, 732–745. [Google Scholar] [CrossRef]
  13. Aktas, S.; Ma, E.A. Recovery of Zinc from Galvanized Scraps. Turk. J. Eng. Env. Sci. 2002, 26, 395–402. [Google Scholar]
  14. Chin, D.-T. Electrochemical Extraction of Copper from Scrap Steel. AIChE J. 1977, 23, 434–440. [Google Scholar] [CrossRef]
  15. Cho, W.D.; Fan, P. Methods and Systems for Removing Copper from Ferrous Scrap. US7789936B2, 7 September 2010. [Google Scholar]
  16. Sano, N.; Katayama, H.; Sasabe, M.; Matsuoka, S. Research Activities on Removal of Residual Elements from Steel Scrap in Japan. Scand. J. Metall. 1998, 27, 24–30. [Google Scholar]
  17. Savov, L.; Janke, D. Evaporation of Cu and Sn from Induction-Stirred Iron-Based Melts Treated at Reduced Pressure. ISIJ Int. 2000, 40, 95–104. [Google Scholar] [CrossRef]
  18. Jung, S.-H.; Kang, Y.-B. Simultaneous Evaporation of Cu and Sn from Liquid Steel. Metall. Mater. Trans. B 2016, 47, 2564–2570. [Google Scholar] [CrossRef]
  19. Davis, J.R. (Ed.) Alloying: Understanding the Basics; ASM International: Almere, The Netherlands, 2001; ISBN 978-1-62708-297-6. [Google Scholar]
  20. Houpert, C.; Lanteri, V.; Jolivet, J.M.; Guttmann, M.; Birat, J.P.; Jallon, M.; Confente, M. Influence of Tramp Elements in the Production of High Quality Steels Using the Scrap/Electric Arc Furnace Route. Rev. Met. Paris 1997, 94, 1369–1384. [Google Scholar] [CrossRef]
  21. Kim, S.-J.; Gil Lee, C.; Lee, T.-H.; Oh, C.-S. Effect of Cu, Cr and Ni on Mechanical Properties of 0.15 Wt.% C TRIP-Aided Cold Rolled Steels. Scr. Mater. 2003, 48, 539–544. [Google Scholar] [CrossRef]
  22. Bargel, H.-J.; Schulze, G. (Eds.) Werkstoffkunde; Springer-Lehrbuch; Springer: Berlin/Heidelberg, Germany, 2012; ISBN 978-3-642-17716-3. [Google Scholar]
  23. Sekunowo, O.I.; Durowaye, S.I.; Gbenebor, O.P. Effect of Copper on Microstructure and Mechanical Properties of Construction Steel. Int. J. Chem. Nucl. Metall. Mater. Eng. 2014, 8, 785–789. [Google Scholar]
  24. Inujima, K.; Ichikawa, K. Influence of Sn on Practical Performances of Structural Steels. IJMMME 2020, 6, 27–34. [Google Scholar] [CrossRef]
  25. Madias, J. Electric Furnace Steelmaking. In Treatise on Process Metallurgy; Elsevier: Amsterdam, The Netherlands, 2024; pp. 243–265. ISBN 978-0-323-85373-6. [Google Scholar]
  26. Nowell, M.; Wright, S.; Carpenter, J. Differentiating Ferrite and Martensite in Steel Microstructures Using Electron Backscatter Diffraction. In Proceedings of the Materials Science and Technology Conference and Exhibition 2009, MS and T’09, Pittsburgh, PA, USA, 25–29 October 2009; Volume 2. [Google Scholar]
  27. Calcagnotto, M.; Ponge, D.; Raabe, D. Microstructure Control during Fabrication of Ultrafine Grained Dual-Phase Steel: Characterization and Effect of Intercritical Annealing Parameters. ISIJ Int. 2012, 52, 874–883. [Google Scholar] [CrossRef]
  28. Lin, S.; Borggren, U.; Stark, A.; Borgenstam, A.; Mu, W.; Hedström, P. In-Situ High-Energy X-Ray Diffraction Study of Austenite Decomposition During Rapid Cooling and Isothermal Holding in Two HSLA Steels. Metall. Mater. Trans. A 2021, 52, 1812–1825. [Google Scholar] [CrossRef]
  29. Kieffer, J.; Karkoulis, D. PyFAI, a Versatile Library for Azimuthal Regrouping. J. Phys. Conf. Ser. 2013, 425, 202012. [Google Scholar] [CrossRef]
  30. Ashiotis, G.; Deschildre, A.; Nawaz, Z.; Wright, J.P.; Karkoulis, D.; Picca, F.E.; Kieffer, J. The Fast Azimuthal Integration Python Library: pyFAI. J. Appl. Crystallogr. 2015, 48, 510–519. [Google Scholar] [CrossRef]
  31. Doebelin, N.; Kleeberg, R. Profex: A Graphical User Interface for the Rietveld Refinement Program BGMN. J. Appl. Crystallogr. 2015, 48, 1573–1580. [Google Scholar] [CrossRef]
  32. Rietveld, H.M. A Profile Refinement Method for Nuclear and Magnetic Structures. J. Appl. Crystallogr. 1969, 2, 65–71. [Google Scholar] [CrossRef]
  33. Jain, A.; Ong, S.P.; Hautier, G.; Chen, W.; Richards, W.D.; Dacek, S.; Cholia, S.; Gunter, D.; Skinner, D.; Ceder, G.; et al. Commentary: The Materials Project: A Materials Genome Approach to Accelerating Materials Innovation. APL Mater. 2013, 1, 011002. [Google Scholar] [CrossRef]
  34. McCusker, L.B.; Von Dreele, R.B.; Cox, D.E.; Louër, D.; Scardi, P. Rietveld Refinement Guidelines. J. Appl. Crystallogr. 1999, 32, 36–50. [Google Scholar] [CrossRef]
  35. Balzar, D.; Popa, N. Analyzing Microstructure by Rietveld Refinement. Rigaku J. 2005, 22, 16–25. [Google Scholar]
  36. Toby, B.H. R Factors in Rietveld Analysis: How Good Is Good Enough? Powder Diffr. 2006, 21, 67–70. [Google Scholar] [CrossRef]
  37. Stinton, G.W.; Evans, J.S.O. Parametric Rietveld Refinement. J. Appl. Crystallogr. 2007, 40, 87–95. [Google Scholar] [CrossRef]
  38. Jiao, H.; Xie, X.; Hu, X.; Zhao, L.; Misra, R.D.K.; Liu, D.; Tang, Y.; Hu, Y. Role of Hot Rolling in Microstructure and Texture Development of Strip Cast Non-Oriented Electrical Steel. Metals 2022, 12, 354. [Google Scholar] [CrossRef]
  39. Liu, Z.; Kobayashi, Y.; Yin, F.; Kuwabara, M.; Nagai, K. Nucleation of Acicular Ferrite on Sulfide Inclusion during Rapid Solidification of Low Carbon Steel. ISIJ Int. 2007, 47, 1781–1788. [Google Scholar] [CrossRef]
  40. Hatzenbichler, L.; Vincely, C.; Haslberger, P.; Galler, M.; Glushko, O.; Holec, D.; Clemens, H.; Schnitzer, R. Effect of tramp elements on the microstructural evolution of a ferritic-pearlitic steel. Pract. Metallogr. 2025, 62, 148–175. [Google Scholar] [CrossRef]
  41. Collins, J.; Taylor, M.; Scarlett, A.L.; Palmiere, E.J.; Pickering, E.J. Prior Austenite Grain Measurement: A Direct Comparison of EBSD Reconstruction, Thermal Etching and Chemical Etching. Mater. Charact. 2024, 208, 113656. [Google Scholar] [CrossRef]
  42. Mehta, B.; Yang, X.; Höglund, L.; Mu, W.; Hedström, P. Toward Scrap-Tolerant Steels: Investigating the Role of Cu and Sn Micro-Segregations on Solidification Microstructure and Cracking. J. Sustain. Metall. 2025, 11, 1908–1921. [Google Scholar] [CrossRef]
  43. Bloder, B.; Scheiber, D.; Raninger, P.; Ecker, W.; Antretter, T. Modeling Solute Drag during Austenite–Ferrite Transformation with Ab Initio Binding Energies. Materialia 2024, 36, 102128. [Google Scholar] [CrossRef]
  44. Park, M.; Shibata, A.; Tsuji, N. Challenging Ultra Grain Refinement of Ferrite in Low-C Steel Only by Heat Treatment. Front. Mater. 2020, 7, 604792. [Google Scholar] [CrossRef]
  45. García De Andrés, C. Application of Dilatometric Analysis to the Study of Solid–Solid Phase Transformations in Steels. Mater. Charact. 2002, 48, 101–111. [Google Scholar] [CrossRef]
  46. Trzaska, J. Empirical Formulas for Calculating Continuous Cooling Transformation Diagrams. Available online: https://journalamme.org/article/01.3001.0013.7946/en (accessed on 2 July 2025).
  47. Zhou, L.; Fang, F.; Kumagai, M.; Pickering, E.; Yu, T.; Zhang, X. Structure Restoration and Coarsening of Nanocrystalline Cementite in Cold Drawn Pearlitic Wire Induced by Low Temperature Annealing. Scr. Mater. 2022, 215, 114696. [Google Scholar] [CrossRef]
  48. Nielsen, J.; McMorrow, D. Kinematical Scattering II: Crystalline Order. In Elements of Modern X-Ray Physics; John Wiley & Sons, Ltd.: Hoboken, NJ, USA, 2011; pp. 147–205. ISBN 978-1-119-99836-5. [Google Scholar]
  49. Stephenson, E.T. Effect of Recycling on Residuals, Processing, and Properties of Carbon and Low-Alloy Steels. Metall. Trans. A 1983, 14, 343–353. [Google Scholar] [CrossRef]
  50. Krauss, G. (Ed.) Steels: Processing, Structure, and Performance; ASM International: Materials Park, OH, USA, 2010; ISBN 978-0-87170-817-5. [Google Scholar]
  51. Bhadeshia, H.; Honeycombe, R. Chapter 3—Iron-Carbon Equilibrium and Plain Carbon Steels. In Steels: Microstructure and Properties, 4th ed.; Bhadeshia, H., Honeycombe, R., Eds.; Butterworth-Heinemann: Oxford, UK, 2017; pp. 59–100. ISBN 978-0-08-100270-4. [Google Scholar]
  52. Zhang, M.; Xu, H.; Cao, W.; Dong, H. Effect of Hot-Rolling Parameters on the Microstructure and Property of Fe–Mn–Al–C Micro–Laminated Dual Phase Steels. ISIJ Int. 2016, 56, 861–867. [Google Scholar] [CrossRef]
  53. Malyshevskii, V.A.; Semicheva, T.G.; Khlusova, E.I. Effect of Alloying Elements and Structure on the Properties of Low-Carbon Heat-Treatable Steel. Met. Sci. Heat. Treat. 2001, 43, 331–335. [Google Scholar] [CrossRef]
  54. Devra, V.K.; Maity, J. Solute Drag Effect on Austenite Grain Growth in Hypoeutectoid Steel. Philos. Mag. Lett. 2020, 100, 245–259. [Google Scholar] [CrossRef]
  55. Kern, M.; Bernhard, M.; Kang, Y.-B.; Bernhard, C. In Situ Study and Assessment of the Phosphorus-Induced Solute Drag Effect on the Grain Boundary Mobility of Austenite. Acta Mater. 2024, 269, 119826. [Google Scholar] [CrossRef]
  56. Zhu, Q.; Gao, J.; Zhao, H.; Guan, D.; Zhang, Y.; Huang, Y.; Li, S.; Yang, W.; Wang, K.; Wang, S.; et al. Effects of Residual Elements on the Microstructure and Mechanical Properties of a Q&P Steel. J. Mater. Sci. Technol. 2025, 221, 143–154. [Google Scholar] [CrossRef]
  57. Neetu; Sangal, S.; Mondal, K. Effect of Various Phase Fractions of Bainite, Retained Austenite, Intercritical Ferrite and Pearlite on the Wear Behaviour of Multiphase Steels. Wear 2022, 500–501, 204355. [Google Scholar] [CrossRef]
  58. Llopis, A.M. Effect of Alloying Elements in Steels on the Kinetics of the Austenite to Bainite Transformation; Lawrence Berkeley Laboratory: Berkeley, CA, USA, 1975; Report No. LBL-4555. [Google Scholar]
  59. Kapoor, I.; Davis, C.; Li, Z. Effects of Residual Elements during the Casting Process of Steel Production: A Critical Review. Ironmak. Steelmak. 2021, 48, 712–727. [Google Scholar] [CrossRef]
  60. Shibata, K.; Seo, S.-J.; Kaga, M.; Uchino, H.; Sasanuma, A.; Asakura, K.; Nagasaki, C. Suppression of Surface Hot Shortness Due to Cu in Recycled Steels. Mater. Trans. 2002, 43, 292–300. [Google Scholar] [CrossRef]
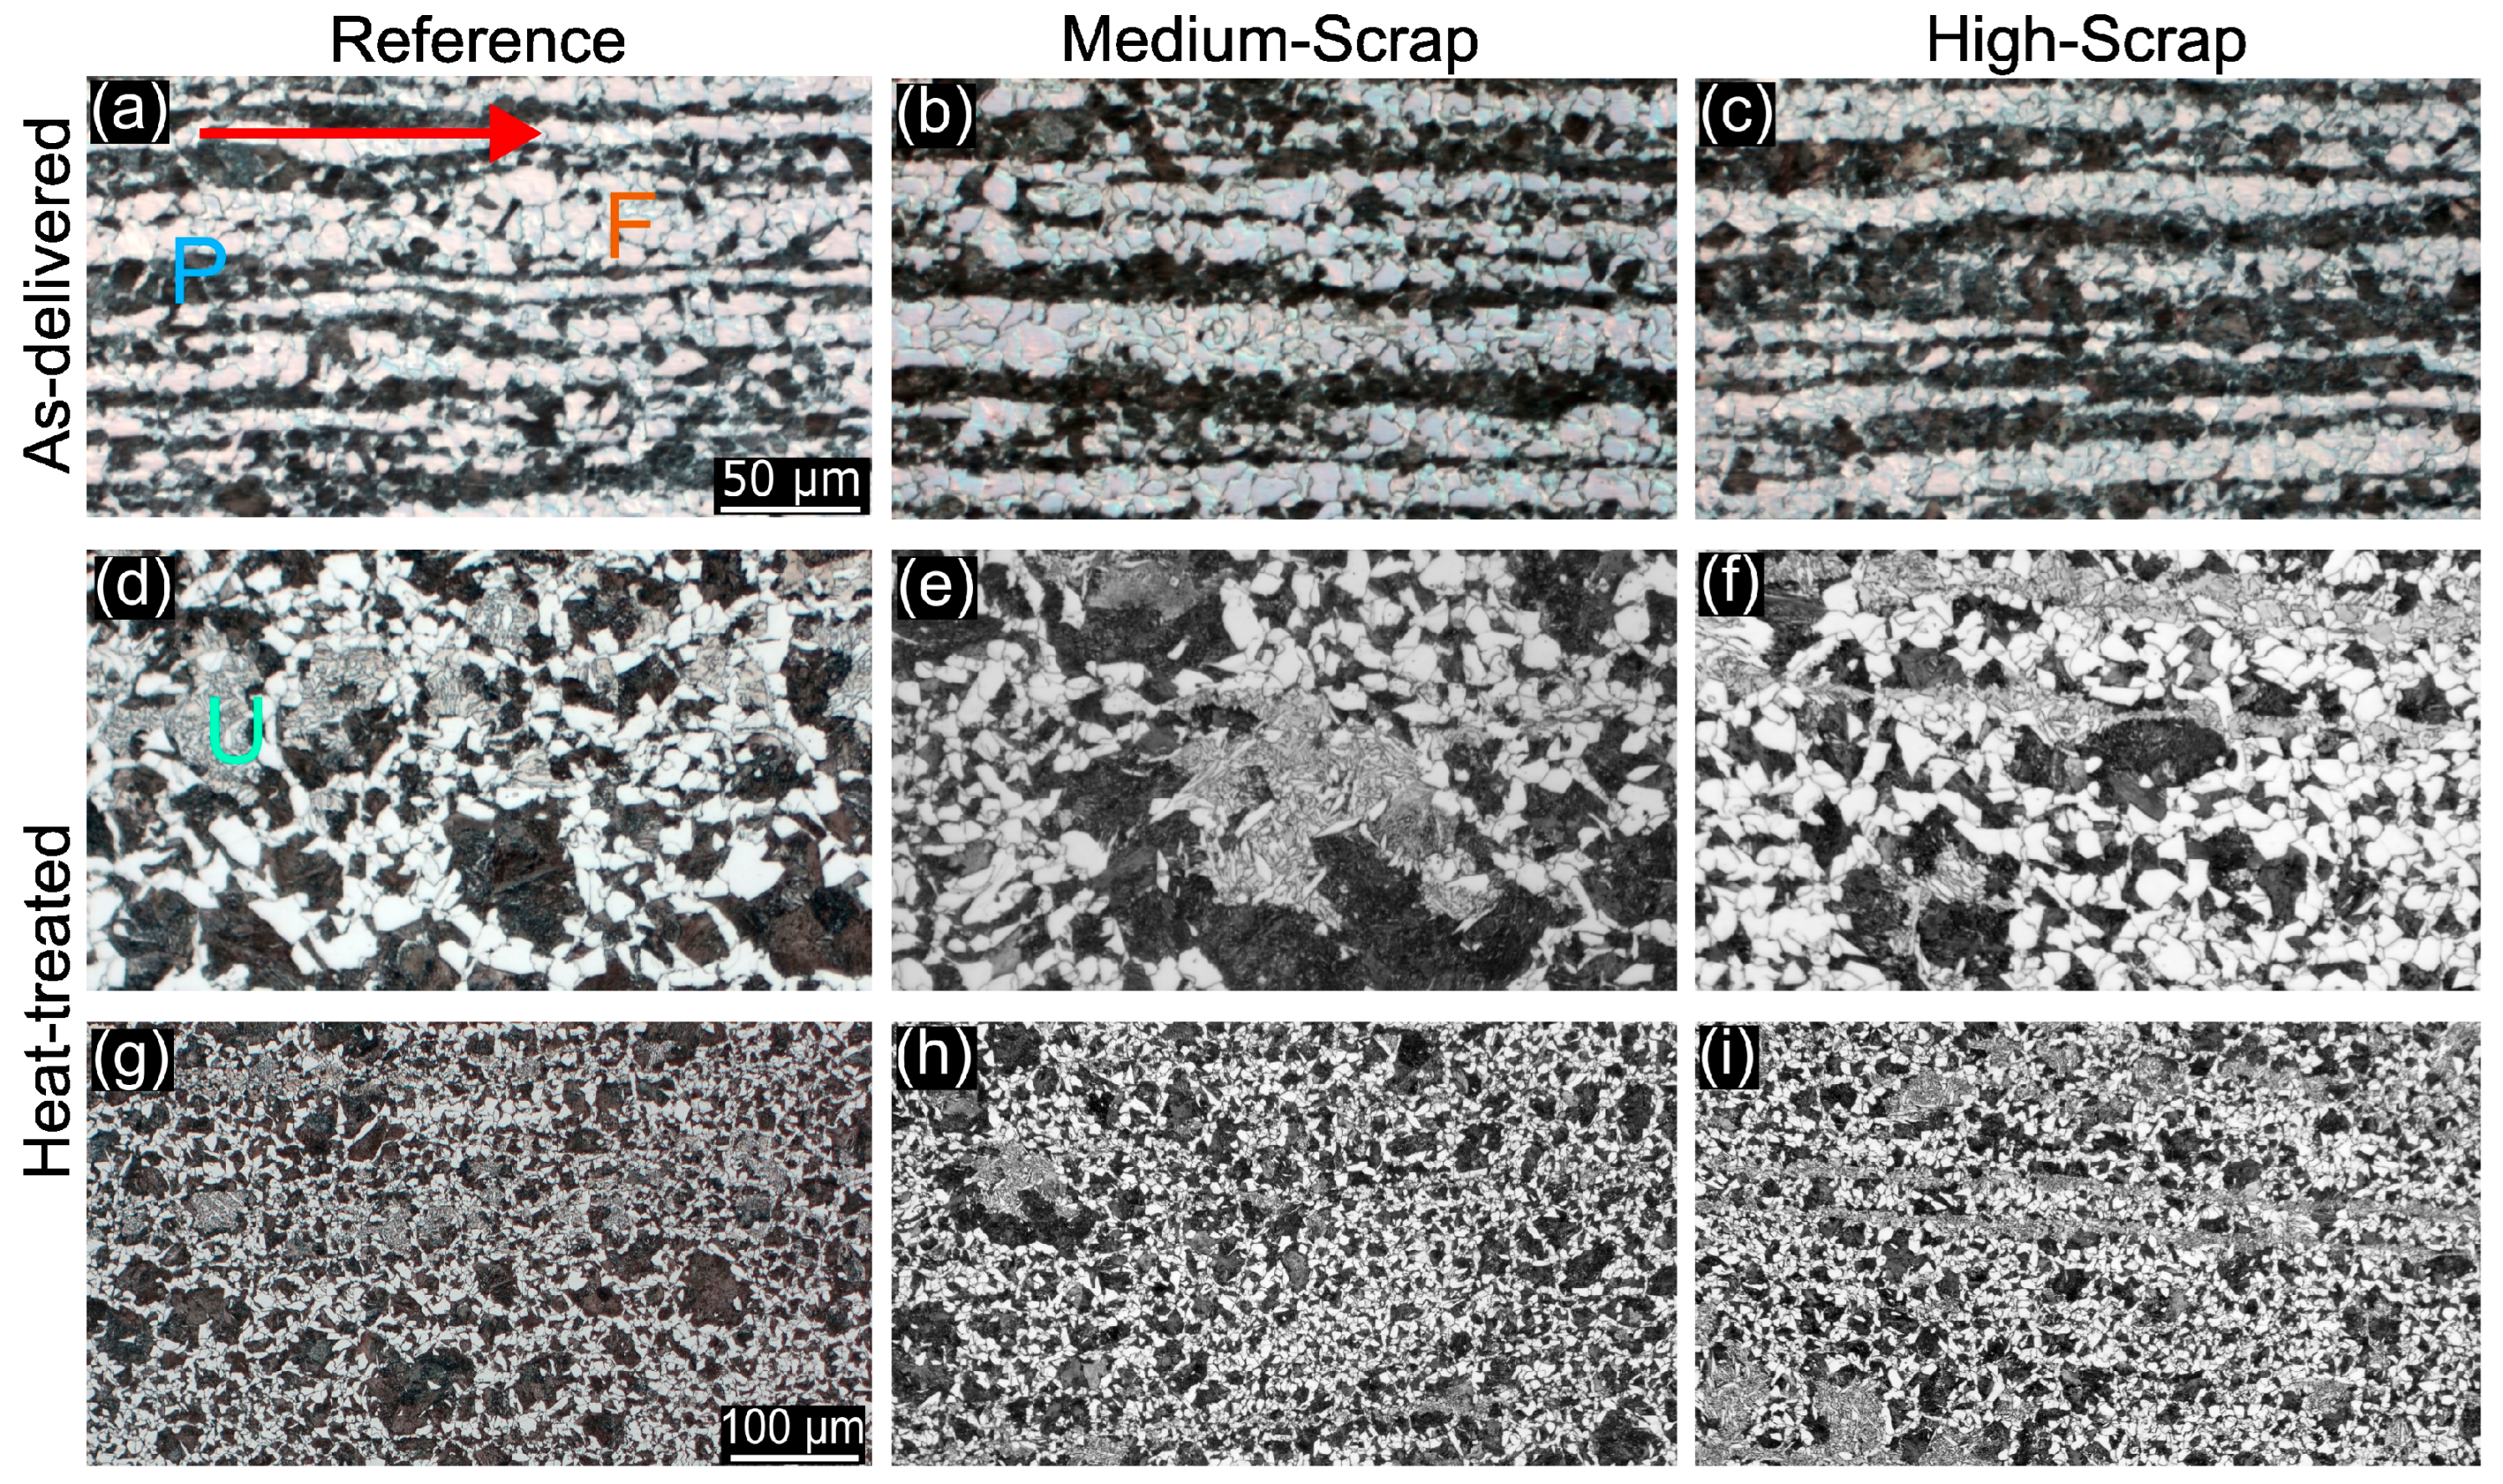
Figure 1. LOM micrographs of Reference alloy and Medium and High-Scrap trial alloys in the as-delivered and heat-treated states, etched with Nital, are presented in (af). Additional LOM micrographs of heat-treated, Nital-etched samples are shown in (gi). The markers F, P and U represent ferrite, pearlite and mixed phases, respectively. The red arrow in (a) signifies the hot rolling direction for all as-delivered samples. The scale bars in (a) and (g) apply to (af) and (gi), respectively.
Metals 15 01053 g001
Figure 2. Histograms of BCC α-Fe grain size distributions of (a) Reference, (b) Medium-Scrap and (c) High-scrap alloys in heat-treated state from the EBSD analysis. The black dashed line represents fitted lognormal distribution, and the dark blue dotted line marks the average grain size.
Metals 15 01053 g002
Figure 3. A qualitative phase analysis of martensite occurrence based on EBSD measurements. In (ac), the image quality of the EBSD pattern recognition is presented, while in (df), BCC image quality histograms of the pattern recognition for (a), (b) and (c) are shown, respectively. The blue dotted lines in (e,f) signify the threshold values. Using the quality condition in the section Martensite Phase Assessment, the image quality of the EBSD pattern recognition is first segmented by the threshold value in (df), which collates images (gi), respectively. After the outlier removal, a qualitative representation of the martensite phase occurrence is presented in (jl) for the Reference alloy and the Medium and High-Scrap variants, respectively.
Metals 15 01053 g003
Figure 4. Dilatometer curves of the Reference alloy and Medium and High-Scrap trial alloys measured in situ. In (a), dilatometer curves over the entire temperature region are presented. In (b,c), the respective regions of phase transformations during heating and cooling are presented. In (d), a detailed investigation of the Ms temperature of the High-Scrap trial alloy is shown.
Metals 15 01053 g004
Figure 5. In (a), the temperature–time cycle applied during the heat treatment is presented, while in (bd), Intensity-2θ diffractograms recorded in situ are collated into phase plots of the Reference, Medium and High-Scrap alloys in a 2θ range of 3.5–7.5 deg, respectively. Additionally, in (eg), a comparison of individual intensity-2θ profiles from before and after the thermal cycle, picked from highlighted regions in (bd), are shown for the Reference, Medium-Scrap and High-Scrap alloys, respectively.
Metals 15 01053 g005
Figure 6. Time evolution of the phase composition of α-Fe, Fe3C and γ-Fe. (a), (b) and (c) represent the Reference, Medium and High-Scrap alloys, respectively.
Metals 15 01053 g006
Figure 7. Vickers hardness (HV 10) of the Reference, Medium-Scrap and High-Scrap alloys in both as-delivered and heat-treated conditions. Results represent an average of 13 indentations performed in the diagonal direction across the sample surface.
Metals 15 01053 g007
Table 1. Increased concentrations of trace and tramp elements (in wt.%) in Medium-Scrap and High-Scrap trial alloys compared to the Reference alloy.
Trial AlloyPSNiCuMoSnCo
Medium-Scrap−0.0035−0.0017+0.03+0.06+0.15+0.002−0.004
High-Scrap+0.0035−0.0047+0.1+0.12+0.037+0.019+0.006
Table 2. Ac1, Ac3, AR1, AR3 and Msexp temperatures in °C determined by linear approximation of dilatometer curves. Empirical martensite start temperature (Msemp) was determined via empirical formula proposed by Trzaska. Adapted from ref. [39].
HeatingCoolingMs
SampleAc1 [°C]Ac3 [°C]AR1 [°C]AR3 [°C]Msemp [°C]Msexp [°C]
Reference742 ± 5810 ± 5580 ± 5691 ± 5319
Medium745 ± 5813 ± 5578 ± 5690 ± 5323
High738 ± 5807 ± 5447 ± 5662 ± 5321292
Table 3. Diffraction peak intensities and FWHMs of investigated alloys from before and after the temperature cycle. Diffraction peaks were fitted with a Pseudo-Voigt function.
Before AnnealingAfter Annealing
Intensity [a.u.]FWHM [deg. × 10−3 ]Intensity [a.u.]FWHM [deg. × 10−3 ]
α-Fe (200)α-Fe (200)α-Fe (200)γ-Fe (200)α-Fe (200)γ-Fe (200)
Reference847 ± 327.58 ± 0.13786 ± 2.030.77 ± 0.11
Medium827 ± 327.86 ± 0.15730 ± 2.032.28 ± 0.12
High837 ± 328.89 ± 0.12759 ± 2.682 ± 133.60 ± 0.1645.23 ± 0.64
Disclaimer/Publisher’s Note: The statements, opinions and data contained in all publications are solely those of the individual author(s) and contributor(s) and not of MDPI and/or the editor(s). MDPI and/or the editor(s) disclaim responsibility for any injury to people or property resulting from any ideas, methods, instructions or products referred to in the content.