Article

Influence of Pre-Corrosion in NaCl Solution on Cavitation Resistance of Steel Samples (42CrMo4)

1
Maritime Faculty, University of Montenegro, 85330 Kotor, Montenegro
2
University of Belgrade, Institute of Chemistry, Technology and Metallurgy, National Institute of the Republic of Serbia, 11000 Belgrade, Serbia
3
Faculty of Technology and Metallurgy, University of Belgrade, 11000 Belgrade, Serbia
4
The Academy of Engineering Sciences of Serbia (AESS), 11120 Belgrade, Serbia
*
Author to whom correspondence should be addressed.
Metals 2025, 15(9), 1041; https://doi.org/10.3390/met15091041
Submission received: 12 June 2025 / Revised: 10 September 2025 / Accepted: 13 September 2025 / Published: 19 September 2025

Abstract

Marine applications often involve metallic materials, including steel, that must endure harsh conditions such as cavitation erosion (CE). This study investigates the CE behavior of 42CrMo4 steel, both in its original state and after pre-corrosion in a 3.5% NaCl solution for 120 days, simulating a simplified marine environment. Cavitation testing was conducted using an ultrasonic vibratory setup with a stationary sample, at intervals of 10 and 30 min, with a total testing time of 150 min. Mass loss (ML), mass loss rate (MLR), mean depth of erosion (MDE), and level of degradation (LoD) were calculated, while surface roughness (Rz) was measured using a TR200 tester. Surface changes were analyzed through field emission scanning electron microscopy (FESEM) and image analysis techniques. Morphological parameters such as the number of pits, average diameter, and total pit area were used to quantify surface damage. Results showed that pre-corroded samples exhibited a significantly higher erosion rate than non-corroded ones. Pre-corrosion introduced microcracks and surface defects that served as initiation sites for cavitation damage. These imperfections increased surface roughness and created favorable conditions for pit formation, leading to faster and deeper material loss. Image and FESEM analyses confirmed the presence of larger and deeper pits in pre-corroded samples compared to the smaller and shallower pits in non-corroded specimens. This study highlights the impact of pre-corrosion on the cavitation resistance of 42CrMo4 steel and demonstrates the effectiveness of combining mass loss data with morphological and surface analyses for evaluating cavitation damage under marine-like conditions.

Graphical Abstract

1. Introduction

Cavitation erosion (CE) is a severe form of mechanical wear caused by the repeated formation and violent collapse of vapor cavities in a liquid flow [1,2,3]. These collapses generate microjets and shockwaves that impact the material surface, leading to pit formation and mass loss over time [4,5,6,7]. In dynamic systems such as pumps, turbines, propellers, and valves, especially those operating in marine or hydraulic conditions, cavitation represents a critical degradation mechanism. Moreover, in such environments, cavitation does not act alone—its interaction with corrosion significantly accelerates material deterioration, especially in long-term exposure [8,9].
To study cavitation resistance, several experimental approaches are used [10], including
-
Vibratory Cavitation Apparatus (ASTM G32-16(2021)e1 [11]);
-
Cavitating Liquid Jets (ASTM G134-17 [12] and Variants);
-
High-speed Cavitation Tunnels.
In this paper, the first approach will be considered for cavitation erosion testing. In a theoretical way of testing, the history of testing begins with mass loss monitoring, as one of the easiest parameters to monitor. This approach for degradation detection is often used and is also implemented in cavitation erosion experiments. One of the earliest and most accessible ways to monitor cavitation damage is by tracking mass loss, which remains a standard method for evaluating material degradation under cavitation conditions. Mass loss and mass loss rate could be monitored using simple balance equipment, which is most widespread and accessible. According to the ASTM G32-16(2021)e1 Standard [11], the degradation of the material can be described by the cavitation curve. At this cavitation curve, four stages can be detected, such are: initialization (I), acceleration (A), deceleration (D), and steady state (S), presented in Figure 1 [6,7,10,11,13,14]. This model is widely used for tracking the progression of cavitation-induced damage.
As mentioned earlier, excessive loadings cause degradation and frequent breakdowns on the surfaces of components exposed to cavitation. Throughout their service life, components including hydrofoils, valves, pumps, pipes, and propellers are all impacted by cavitation, one of the most prevalent destructive issues in fluid-flow systems and maritime applications. Furthermore, some operating circumstances, such as substantial erosion conditions. Materials like metals, ceramics, polymers, and composites are frequently used to create components with the highest cavitation resistance [10,11,13,14,15].
Mass loss monitoring is simple and cost-effective, but combining it with image analysis significantly enhances the quality of data on surface degradation. Besides the procedure described in standard methods, image analysis, a very useful tool could also be implemented for cavitation erosion monitoring of the surface of the sample [16,17,18,19].
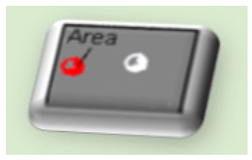
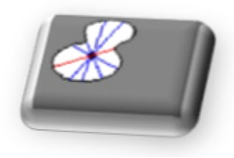
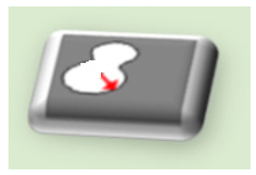
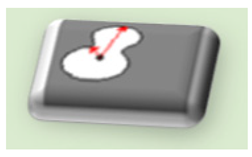
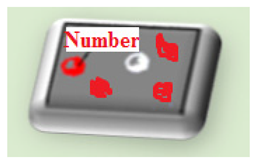
Many morphological parameters can be used for monitoring the surface degradation, but the most often used are presented in Table 1.
Steel remains one of the most widely used engineering materials due to its favorable combination of mechanical properties, cost-efficiency, and affordability. Among low-alloy steels, 42CrMo4 is particularly valued for its high tensile and fatigue strength, good ductility, and hardenability, which result from its tempered martensitic microstructure [20,21,22]. These properties make it suitable for the production of critical mechanical components such as shafts, crankshafts, connecting rods, pump parts, and turbines, especially in demanding marine and hydraulic environments [23,24,25]. However, while 42CrMo4 steel offers mechanical reliability, its resistance to surface degradation in aggressive environments such as those involving seawater exposure is relatively low [6,7].
Marine environments are inherently corrosive, dominated by chloride ions and influenced by fluctuating physical, chemical, and biological factors that accelerate surface deterioration [26,27,28]. Corrosion is a complex electrochemical process driven by interactions between the metal and seawater constituents such as dissolved oxygen, salts, and organic matter [29,30]. Components made of 42CrMo4, when exposed to such conditions, can develop surface defects and microstructural damage that compromise their long-term performance [31]. This degradation not only affects corrosion resistance but also increases susceptibility to other forms of damage, particularly cavitation erosion in dynamic fluid environments.
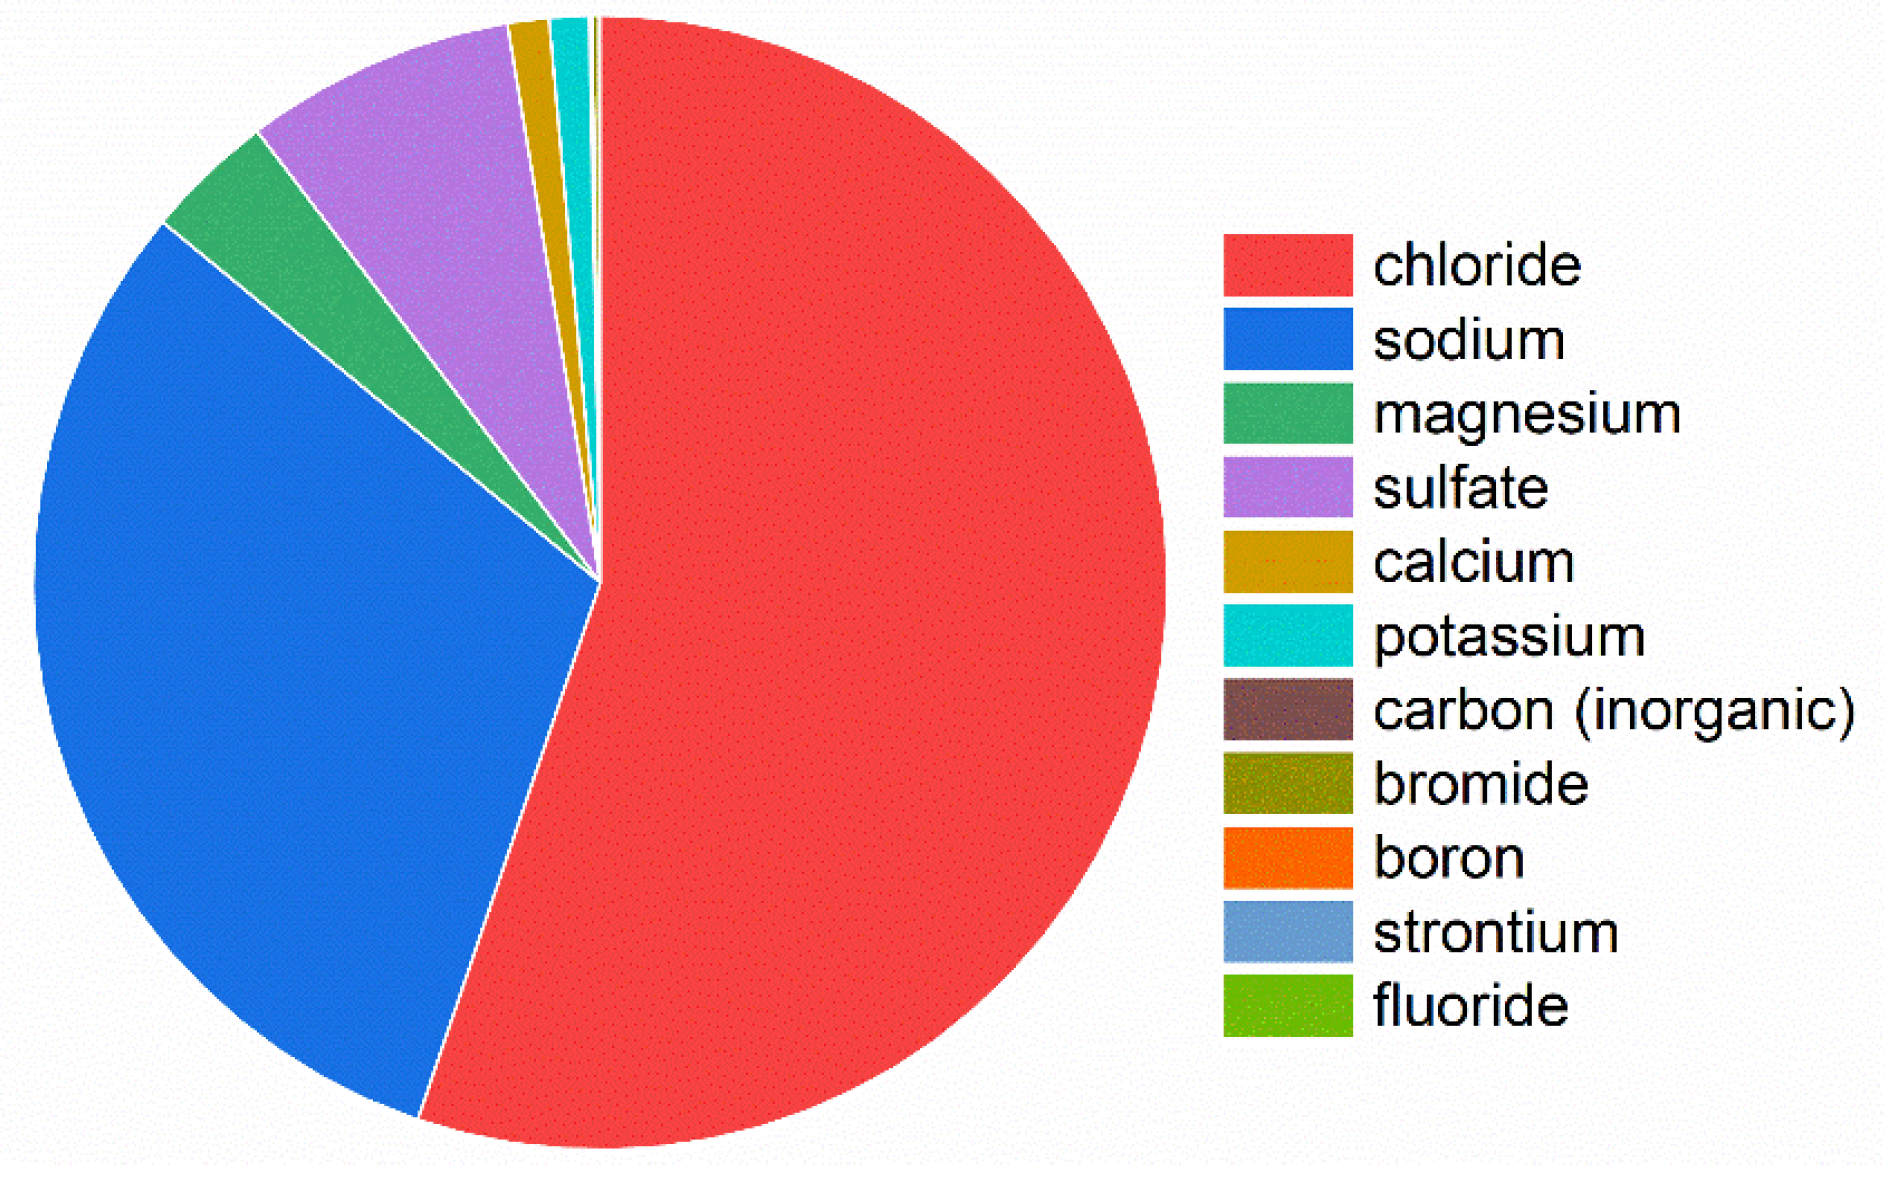
In engineering practice, corrosion is influenced by both natural and man-made factors, such as shipping, storage, manufacturing operations, inadequate surface protection, and industrial pollution [32,33,34,35,36]. Given the practical difficulty of using real seawater in laboratory studies due to its complex chemical and biological composition (as shown in Figure 2), researchers often substitute seawater with standardized NaCl solutions to simulate marine corrosion effects under controlled conditions [37,38,39,40]. This approach enables reproducible testing and is widely accepted in material degradation studies [41,42].
Biological composition of seawater can include bacteria, algal spores, diatoms, animal larvae (starfish larvae, barnacle larvae), animal and plant fouling plants, seaweed, tube worms, mussels, and different types of algae [45].
Previous studies on steel samples exposed to cavitation have primarily focused on C–Mn eutectoid steel, with particular attention given to microstructural changes [46]. Research has also been conducted on various types of stainless steels, where the characterization of surface damage under cavitation conditions was a key aspect [47]. Additionally, the effect of heat treatment on the cavitation behavior of AISI 420 stainless steel has been investigated [8]. More recently, 316L stainless steel samples fabricated using selective laser melting (SLM) technology, with varying processing parameters, have also been studied [48]. Despite these efforts, there remains a noticeable gap in the literature regarding detailed morphological characterization of cavitation-induced surface damage, as well as quantitative assessments of damage severity caused by cavitation erosion.
This study focuses on understanding the cavitation behavior of 42CrMo4 steel after pre-corrosion exposure in simulated seawater conditions. Despite its practical importance, research on the cavitation resistance of 42CrMo4 steel following pre-corrosion remains limited. In this paper, selected 42CrMo4 steel samples immersed in NaCl solution for 120 days (pre-corrosion) are subjected to cavitation erosion testing to investigate the influence of pre-corrosion on the material.

2. Materials and Methods

The material used in this study is 42CrMo4 low-alloy steel, produced by conventional casting and supplied as hot-rolled plates (10 × 1000 × 2000 mm). Samples for testing were cut from these plates into cuboid sections. The steel was heated to 1024 °C and processed through four flat rollers. The chemical composition of the material is provided in Table 2.
The corrosion behavior of structural steel 42CrMo4 was investigated by immersion in a 3.5% NaCl solution according to standard ISO 11130:2017 (E) for 120 days [38]. The cavitation erosion test was conducted using the ultrasonic vibration method (with a stationary sample) according to the ASTM G32-16(2021)e1 standard procedure [11]. Cavitation testing was performed at intervals of 10 and 30 min, with a total testing time of 150 min. Before and after each interval of the cavitation testing, the mass loss (ML) of the samples was measured using an analytical balance with an accuracy of ±0.1 mg. Mass loss rates are measured and calculated using standard procedures. The ASTM G32-16(2021)e1 standard provides several criteria for assessing the degradation of material caused by cavitation erosion. According to the standard, the mean depth of erosion or penetration (MDE refers to the average thickness of material that is removed from a specific surface area and is defined as “the volume divided by the area of the specified surface”. This value can be calculated by dividing the measured mass loss by the material density, as described in Equation (1) [38]:
M D E = m ρ · A
where A is the specimen’s eroded area, ρ is its density, and Δm is the cumulative mass loss related to the exposure period of cavitation.
Surface roughness (Rz) was measured using a TR200 Surface Roughness Tester (SaluTron® Messtechnik GmbH, Frechen, Germany) over a 4.0 mm length. Surface changes during cavitation testing were observed using a field emission scanning electron microscope (FESEM) for both samples exposed solely to cavitation and those pre-corroded for 120 days. The surface morphology and elemental composition of the samples were analyzed at the start of the test and during the testing period to monitor any changes. A trinocular metallurgical microscope, an optical microscope (OM), EU instruments EUME 640 (AmScope, Irvine, CA, USA), was used for surface characterization of the steel sample. A field emission scanning electron microscope (FESEM, JEOL JSM 7001F, JEOL Ltd., Tokyo, Japan) at 1000× magnification was employed for this analysis, alongside energy-dispersive X-ray spectroscopy (EDS) using the OXFORD Xplore 15 instrument (Oxford Instruments, Oxfordshire, UK). The results provided valuable insights into the corrosion behavior of the metal. The degree of cavitation damage and cavitation damage combined with pre-corrosion on the sample’s surface was monitored through image analysis using the Image-Pro Plus 6.0 software package (IPP, Media Cybernetics, 2006, Rockville, MD, USA). This software enables the determination of various descriptors that provide a morphological characterization of the formed pits. The selected morphological parameters for monitoring were the number of pits, average pit area, and total pit area. Based on these results, the level of degradation could be calculated by the following equation:
Level of degradation = (Pi/Po)·100
where Pi is the total area of the formed pits after i number of cycles, and Po is the original area equal to the surface of the probe (200.96 mm2).

3. Results and Discussion

3.1. Cavitation Before Pre-Corrosion

3.1.1. Mass Loss and Mass Loss Rate

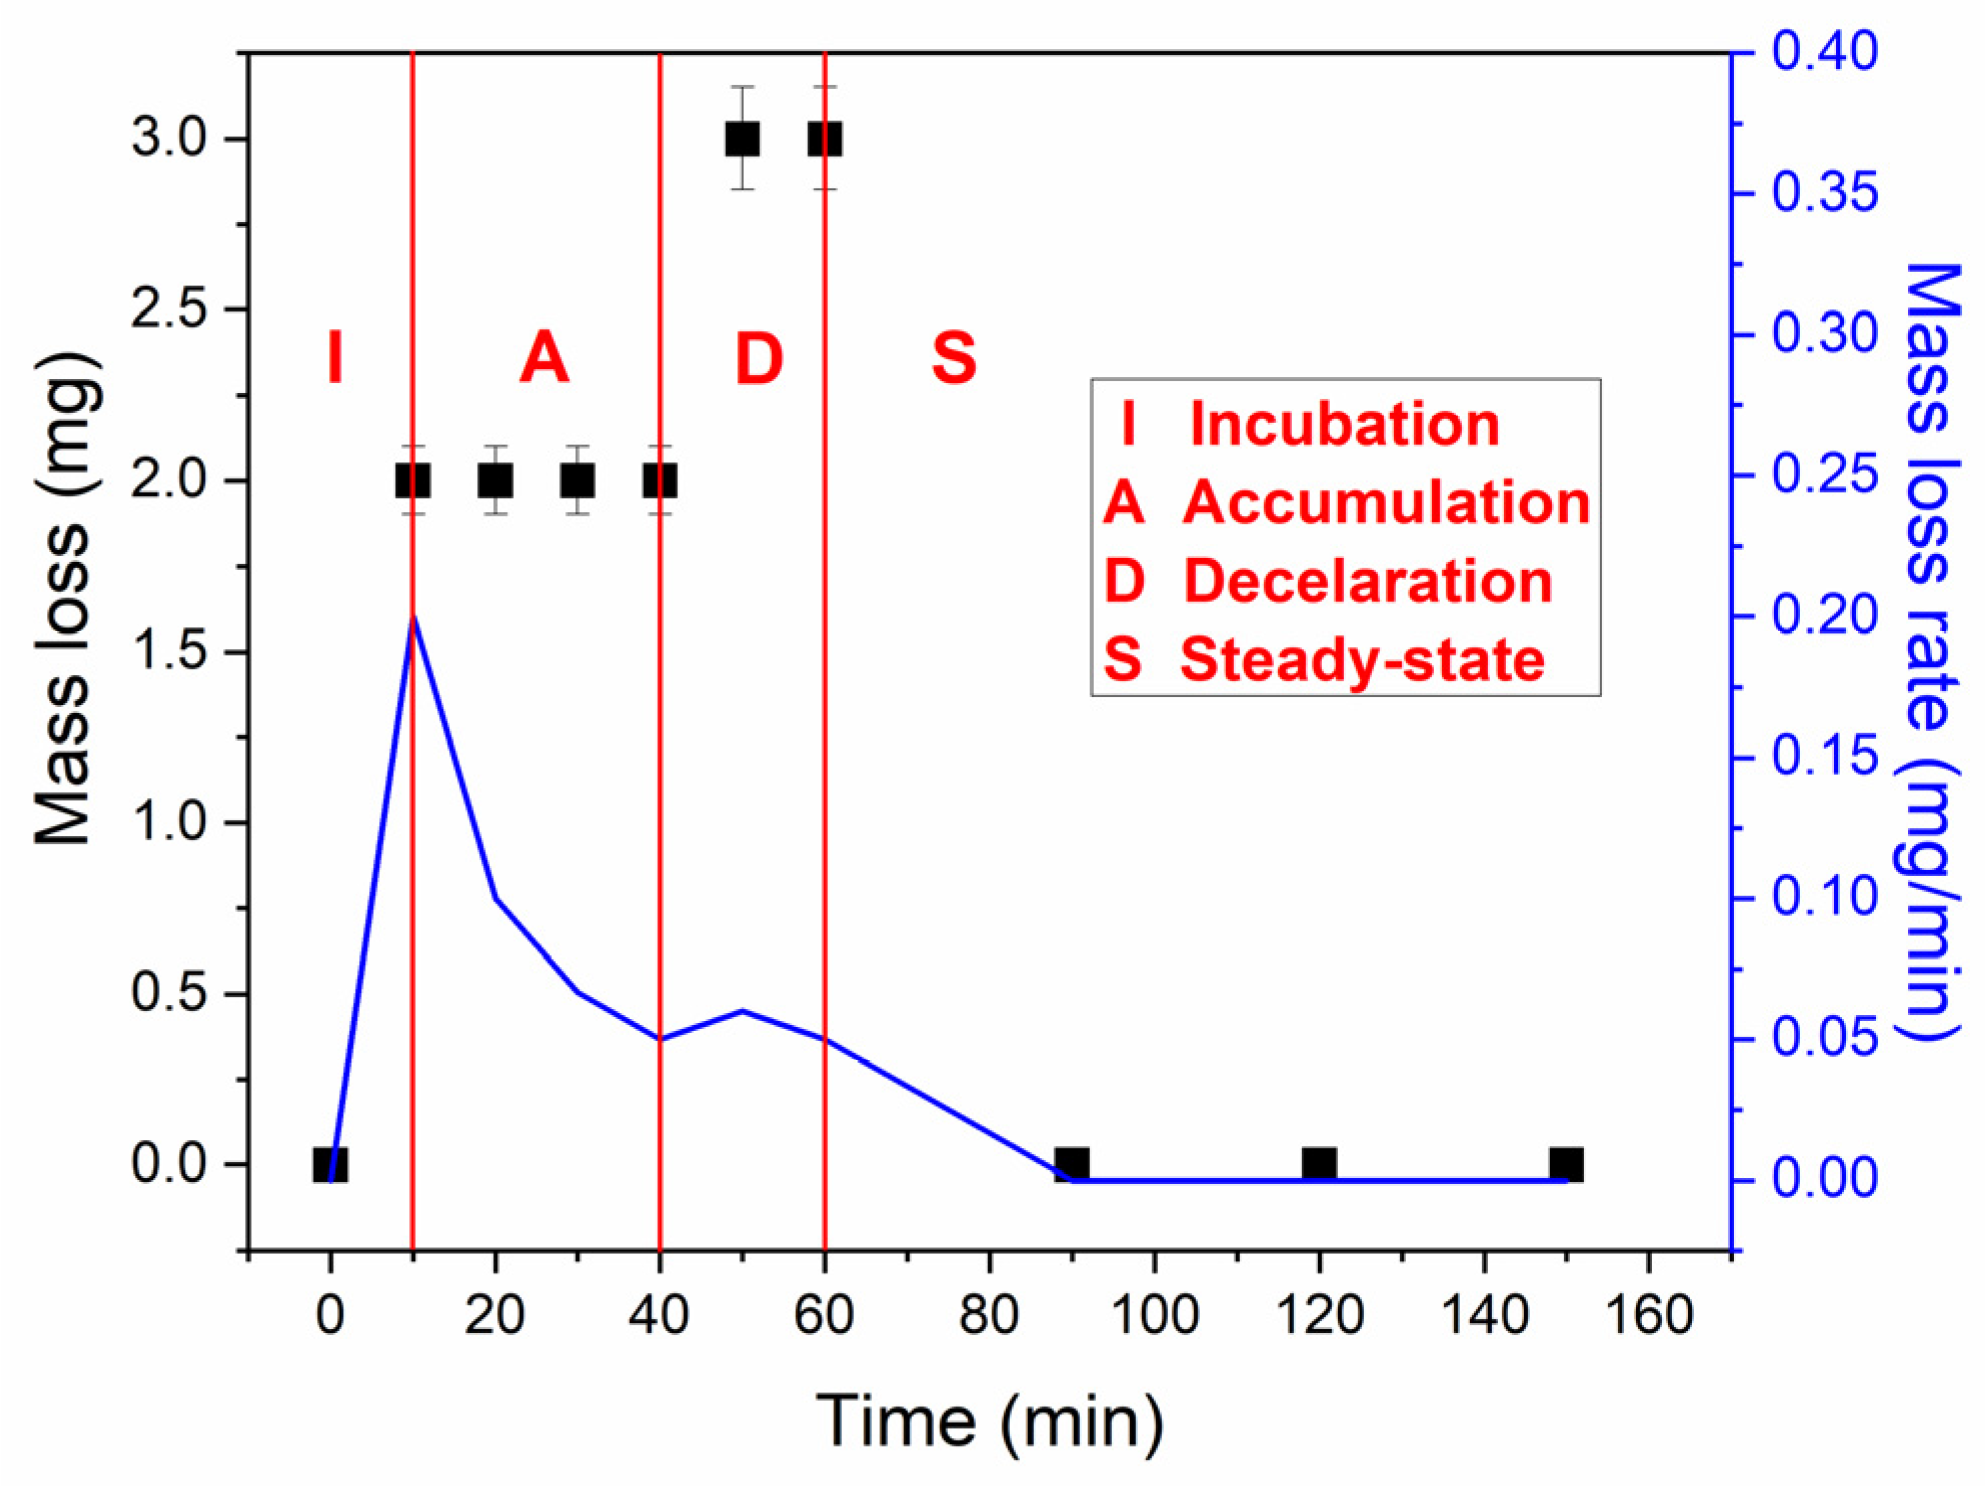
According to the most commonly used method for displaying results related to monitoring degradation progression caused by cavitation, mass loss (ML) and mass loss rate (MLR) are utilized, while the obtained results are presented in Figure 3.
Different periods of cavitation are marked. The incubation period (I) is very short, indicating the initial formation of cavitation pits, when the sample is most sensitive to pit formation, and the energy required for pit formation is rather low. The accumulation period (II) lasts 30 min (from 10 to 40 min) and represents more pronounced material removal and intensified cavitation degradation progress. It can be assumed that during this period, plastic deformation begins, leading to micro-pitting and material weakening, resulting in increased erosion and fatigue damage. The following period, lasting 20 min (from 40 to 60), is called the attenuation period. This phase is characterized by the highest mass loss rate and a steady, severe material loss, while the cavitation process is fully developed, reaching a plateau and stabilization. The steady-state period begins after 60 min, marked by a sharp decline in mass loss rate. Since the exposure time continues up to 150 min, further experiments will provide the results for the duration of this period. Generally, as the exposure time increases, the mass loss rate (MLR) of the specimens decreases. A noticeable decrease in mass loss rate is observed after the first 10 min of cavitation, and this downward trend continues until the end of the test. A gradual decrease in mass loss rate is observed with extended test periods.

3.1.2. Image and Morphological Characterization of the Samples

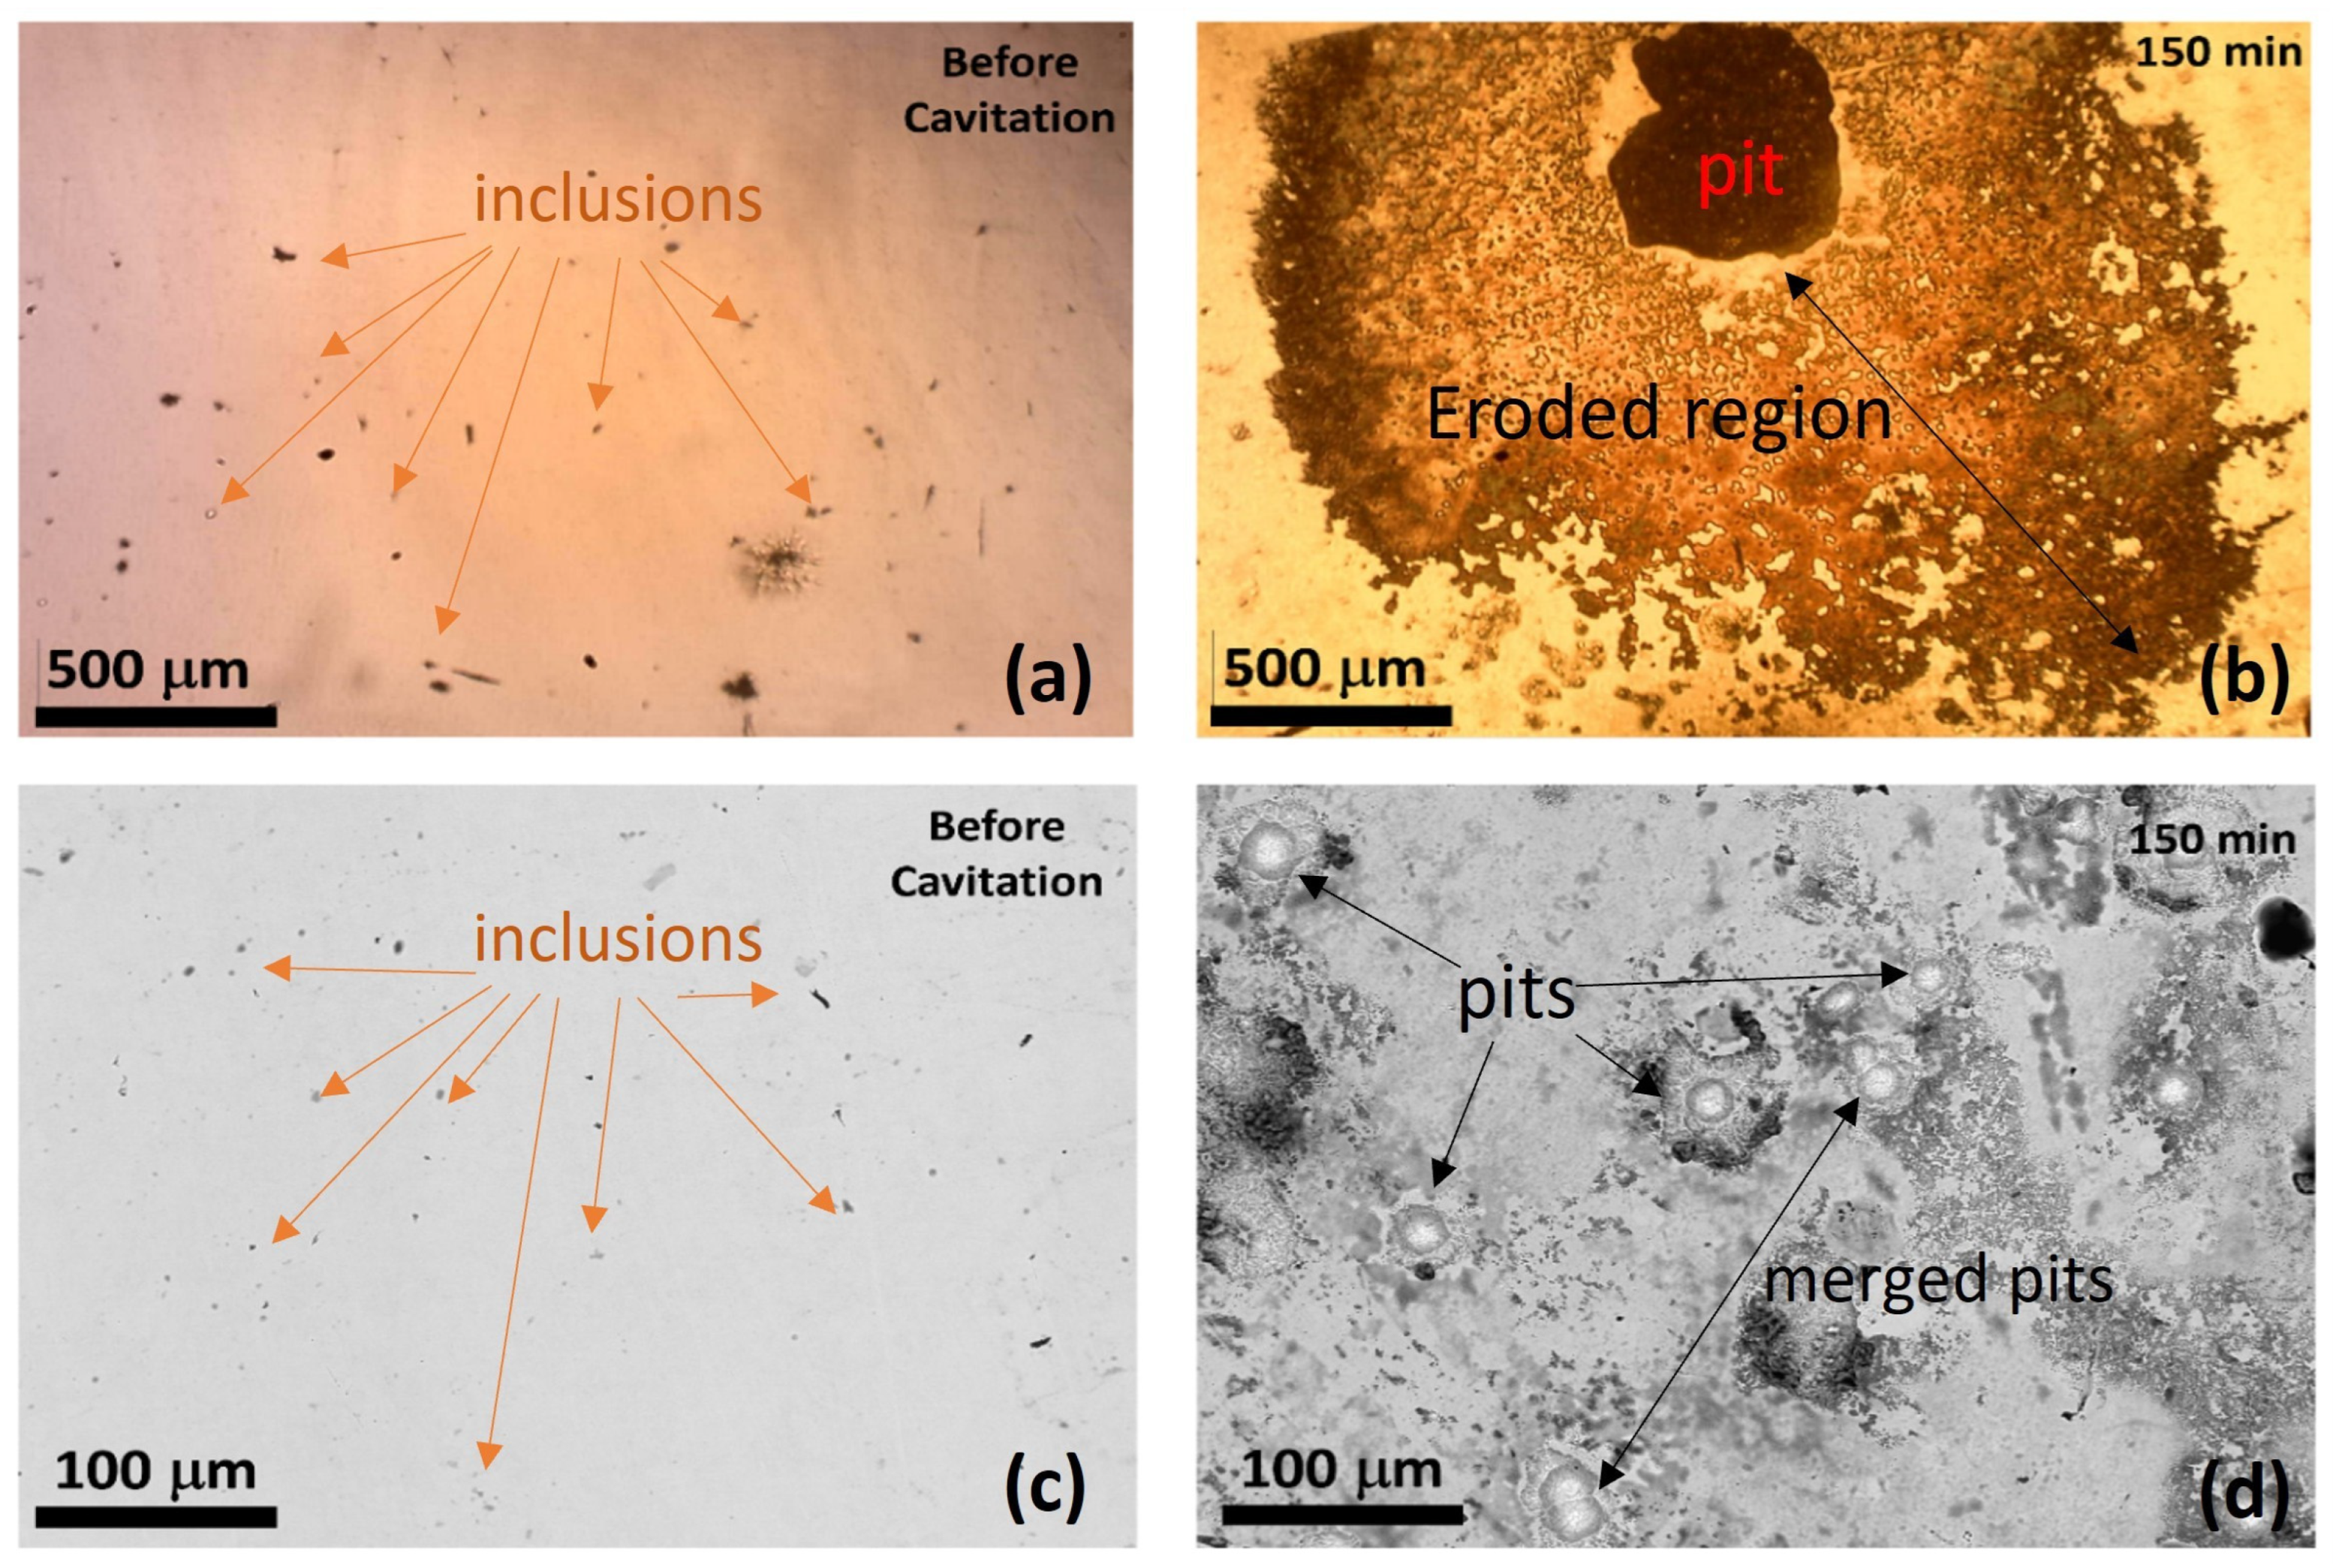
Surface degradation was monitored using micrographs obtained using optical microscopy (OM) and scanning electron microscopy (SEM). The appearance of the sample surfaces captured by OM and SEM before and during testing is presented in Figure 4.
On optical and scanning electron microscope (SEM) images taken before and after cavitation testing in distilled water, cavitation-induced pits and surface damage are clearly visible (Figure 4). Optical microscopy of the tested steel surface before exposure (Figure 4a) revealed a smooth morphology, with only polishing marks and occasional inclusions visible. No cavitation-induced features, such as pits or cracks, were observed. After 150 min of cavitation exposure (Figure 4b), the surface exhibited significant degradation, characterized by a large erosion cavity surrounded by a dense distribution of smaller pits. The damaged region appeared rough and heterogeneous, indicating considerable material loss and localized coalescence of defects.
Scanning electron microscopy provided a more detailed view of the cavitation-induced damage. Before testing, the surface was relatively smooth, with scattered micro-imperfections and inclusions, but no evidence of cavitation attack (Figure 4c). After 150 min of cavitation, the surface morphology was drastically altered, showing numerous circular pits of varying sizes, many with raised rims formed by plastic deformation due to microjet and shockwave impacts (Figure 4d). In several areas, pits merged into larger irregular cavities, accompanied by microcracks and spalling of surface layers, which are typical of advanced cavitation erosion. These observations confirm that prolonged cavitation exposure leads to progressive material degradation, roughening, and severe surface damage in 42CrMo4 low-alloy steel, and therefore were further monitored and analyzed to assess the progression and severity of surface deterioration.
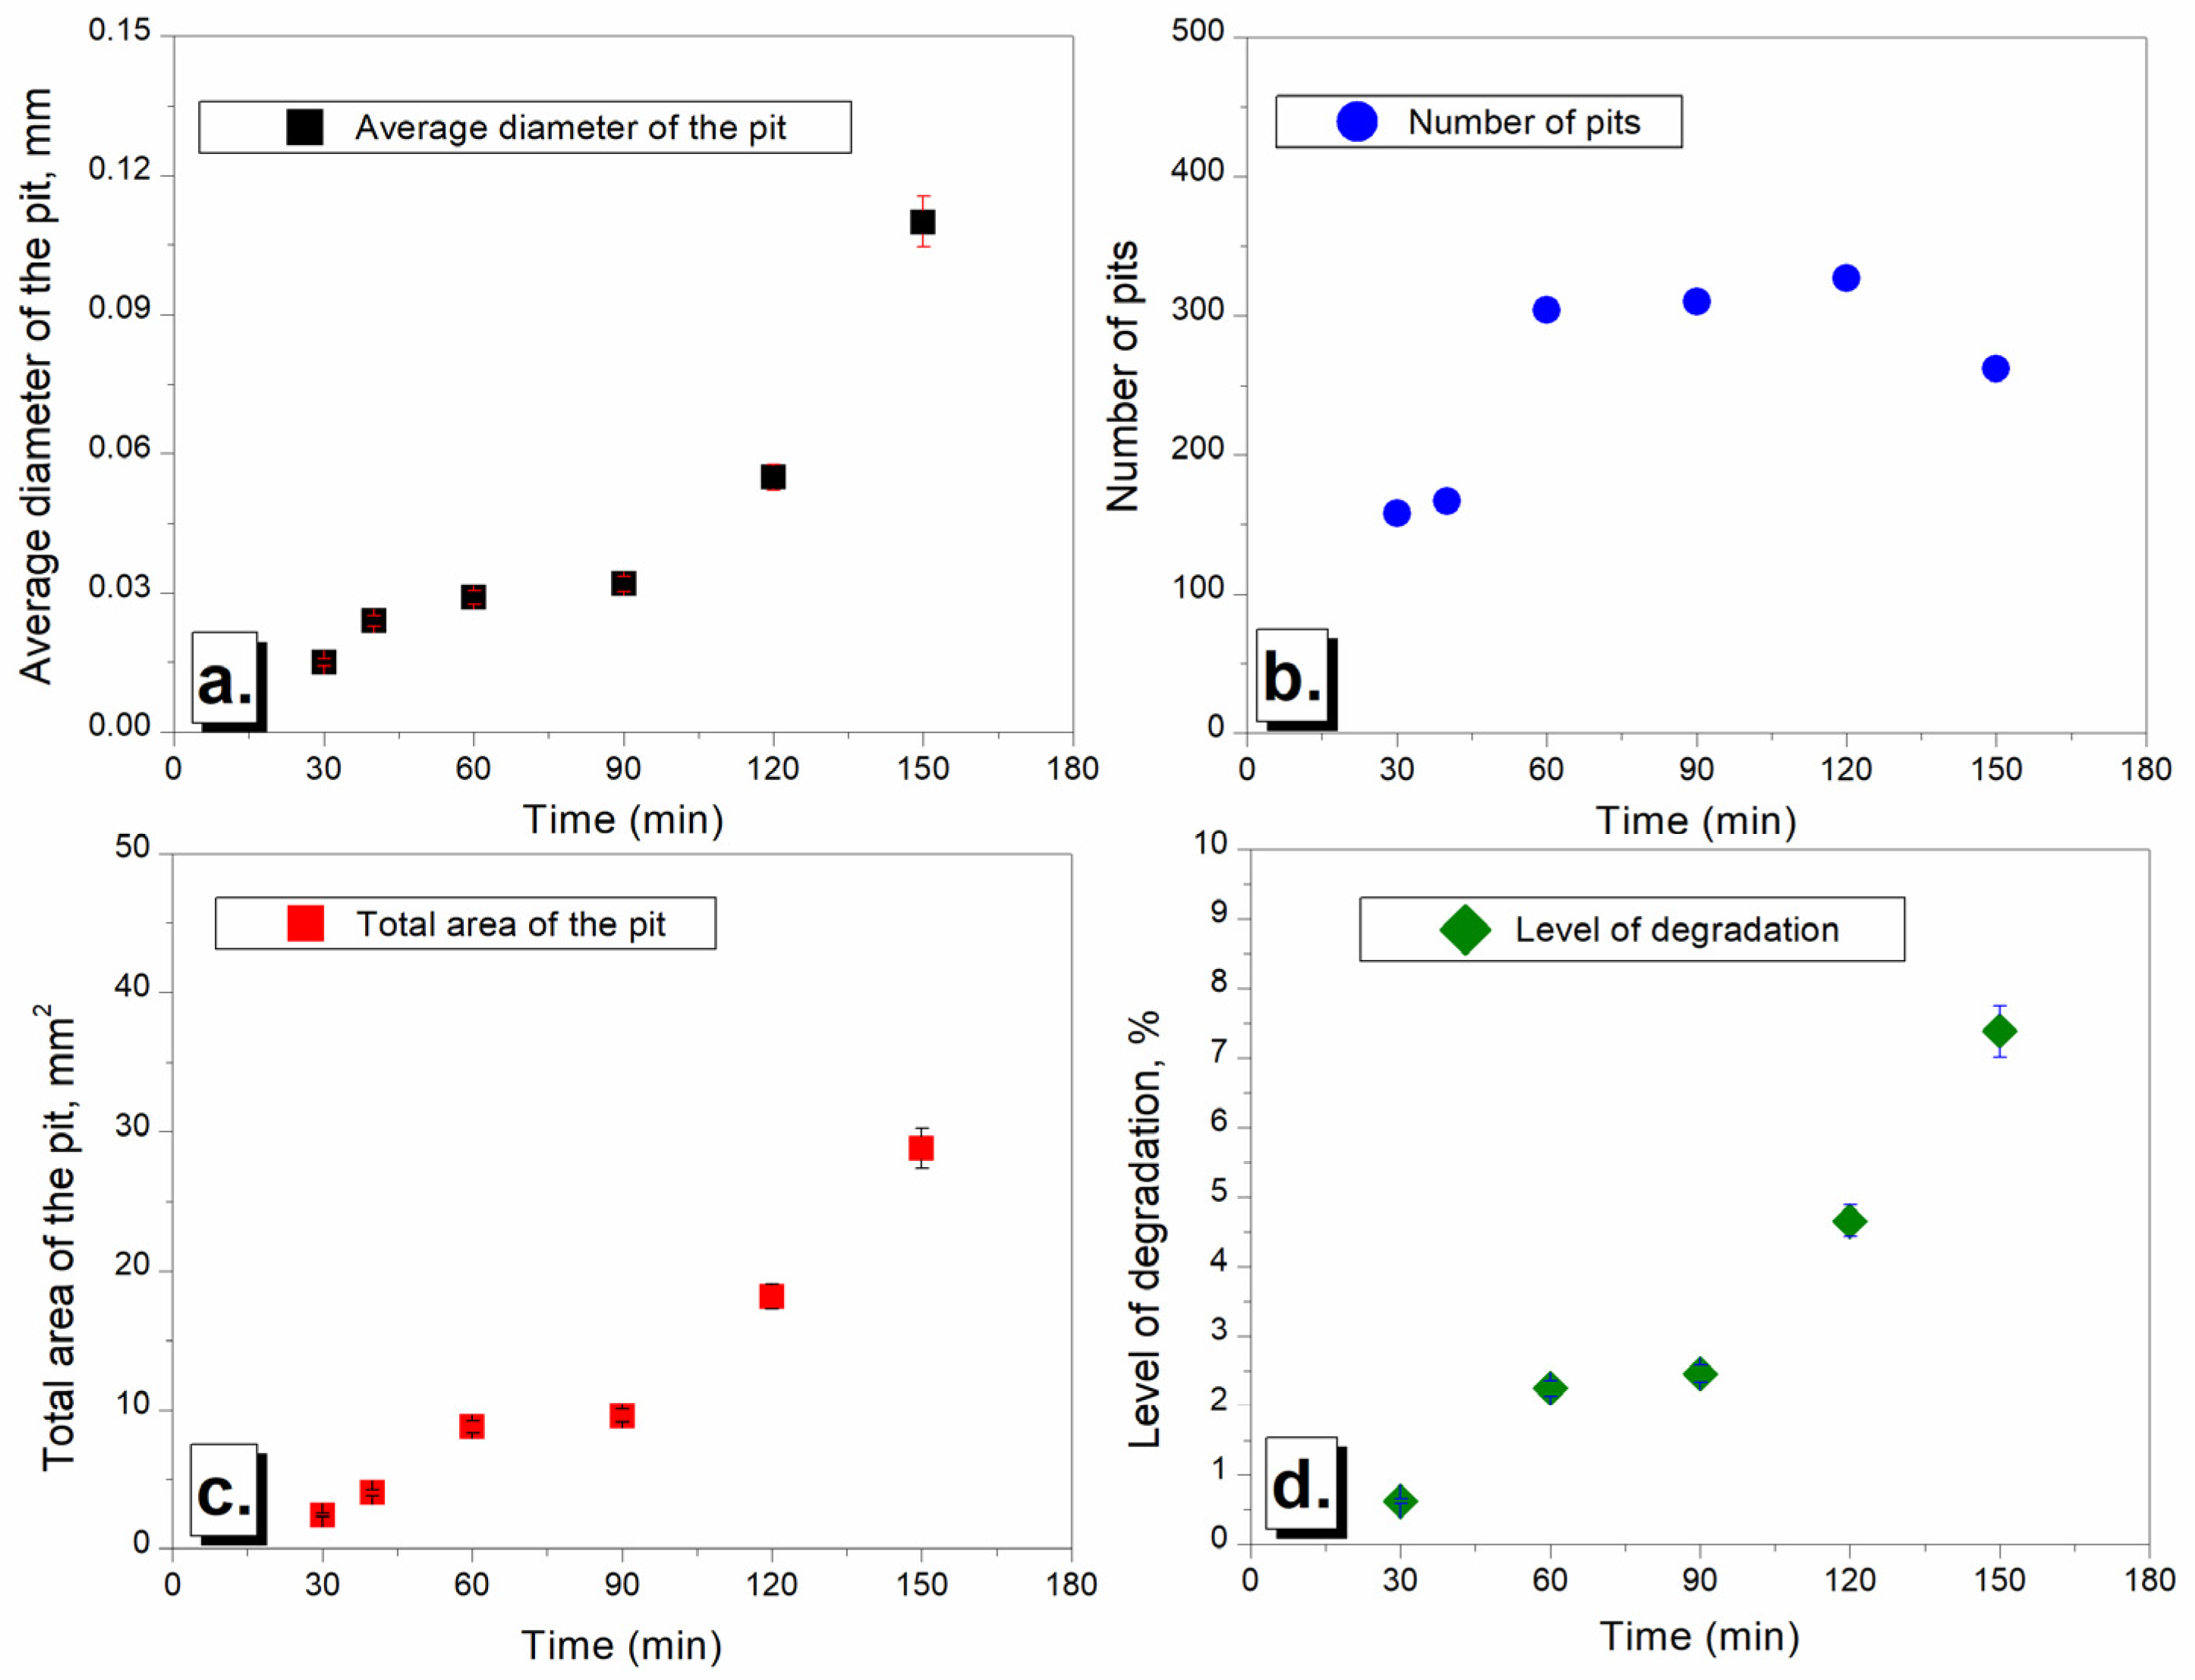
Based on the image analysis and the program for the morphological characterization of induced defects (Image Pro Plus), selected parameters, such as the average diameter of the pits, the total area of the pits, the number of formed pits, and total degradation, were determined, and the obtained results are presented in Figure 5. These parameters were chosen because they can quantify the degradation level through the total area of formed pits. Additionally, the obtained values of these selected parameters can help determine the degradation mechanism. Specifically, the number of formed pits and their relation to exposure time, along with the total and average area of pits, can indicate which mechanism is dominant during a specific period of cavitation erosion. This may reveal whether the process involves pit formation, pit growth, or the merging of already formed pits into larger ones.
The average surface area of a single pit increases with each period during the cavitation erosion test. Initially, the average area of the pit increases slightly, showing small differences among the values, until 90 min. After that, it grows rapidly, reaching approximately 0.1 mm2 within 150 min. The total area of the pit increases, almost linearly, after each period during the cavitation erosion test. The exception is the period between 60 and 90 min, when the total area of the pit increases only slightly. After 90 min, the total area of the pit rises rapidly until reaching approximately 30 mm2 at 150 min. The number of formed pits during the cavitation erosion test shows an increase consistently during cavitation erosion testing over all time up to 120 min, at which point the number of formed pits begins to slightly decrease.
The highest values of pit number were observed between 60 and 120 min, suggesting that pit formation can be considered as the dominant mechanism. In the period from 120 to 150 min, there is a decline in the pit numbers, suggesting the mechanism of pit growth and their merging. These observations are supported by the values of average pit area and the total area of degraded surface, which exhibit slow growth between 60 and 90 min and significant growth after 90 min.

3.2. Cavitation After Immersion in NaCl Solution

3.2.1. Mass Loss and Mass Loss Rate

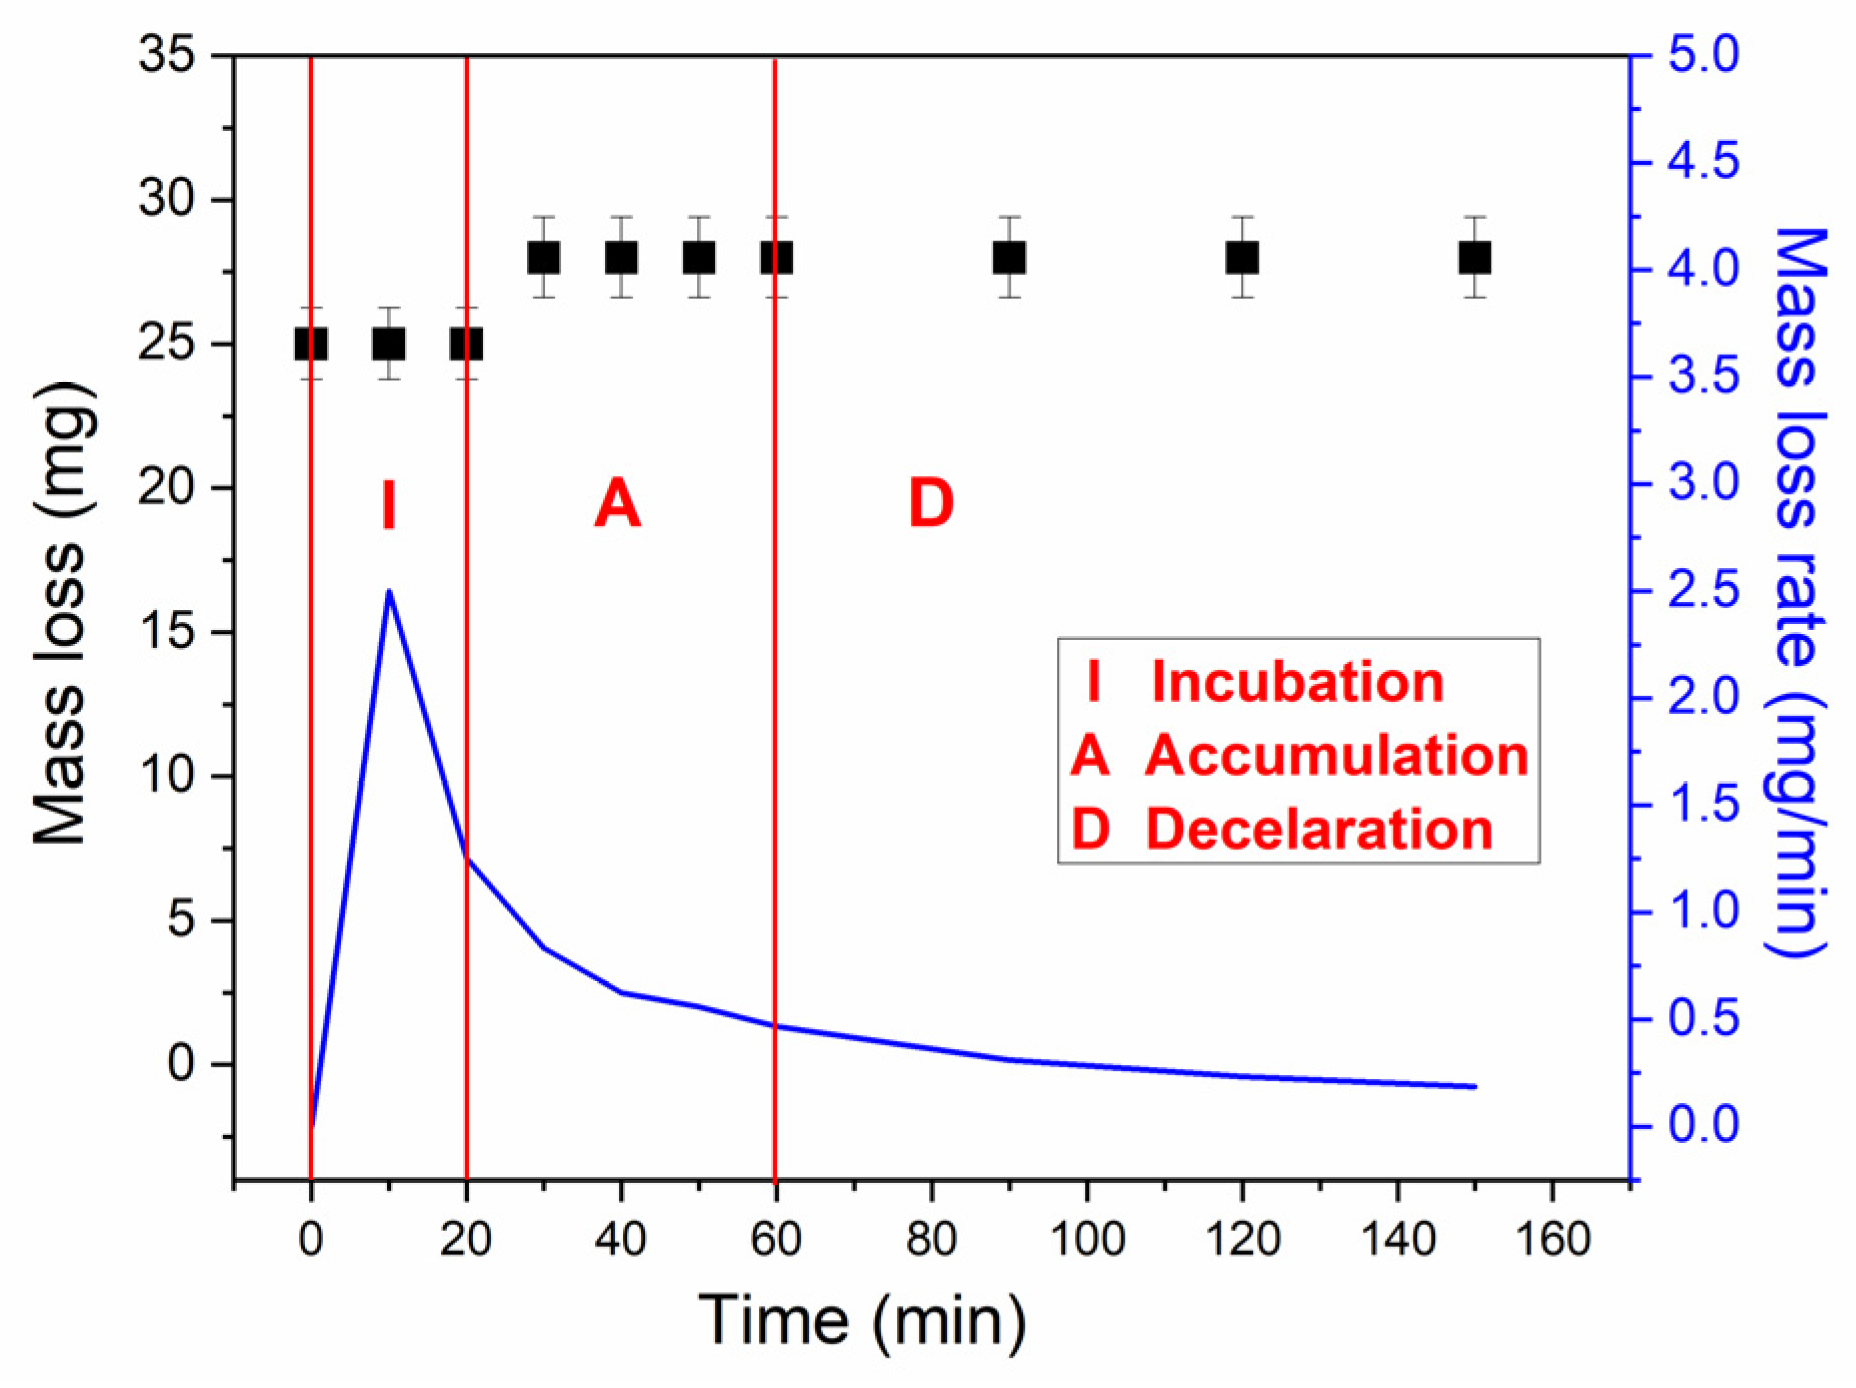
One of the historical attempts for degradation monitoring, including the monitoring of cavitation erosion, is mass loss measurements. The obtained results are given in Figure 6. The sample was measured before cavitation testing, and compared to the sample before immersion, the mass loss was 25 mg.
As can be seen, three stages can be observed:
-
Initialization (I), which was observed till 40 min of testing,
-
Acceleration (A) observed from 40 to 60 min of testing, and
-
Deceleration (D) observed from 60 min of testing.
The finishing stage, steady-state stage, was not observed, as the time of testing was 150 min; it is expected to reach this stage at a longer time of testing/exposure. The mass loss rate of the specimens decreases gradually with increased exposure time, showing a noticeable decline after the first 10 min of testing.

3.2.2. Image and Morphological Characterization of the Samples

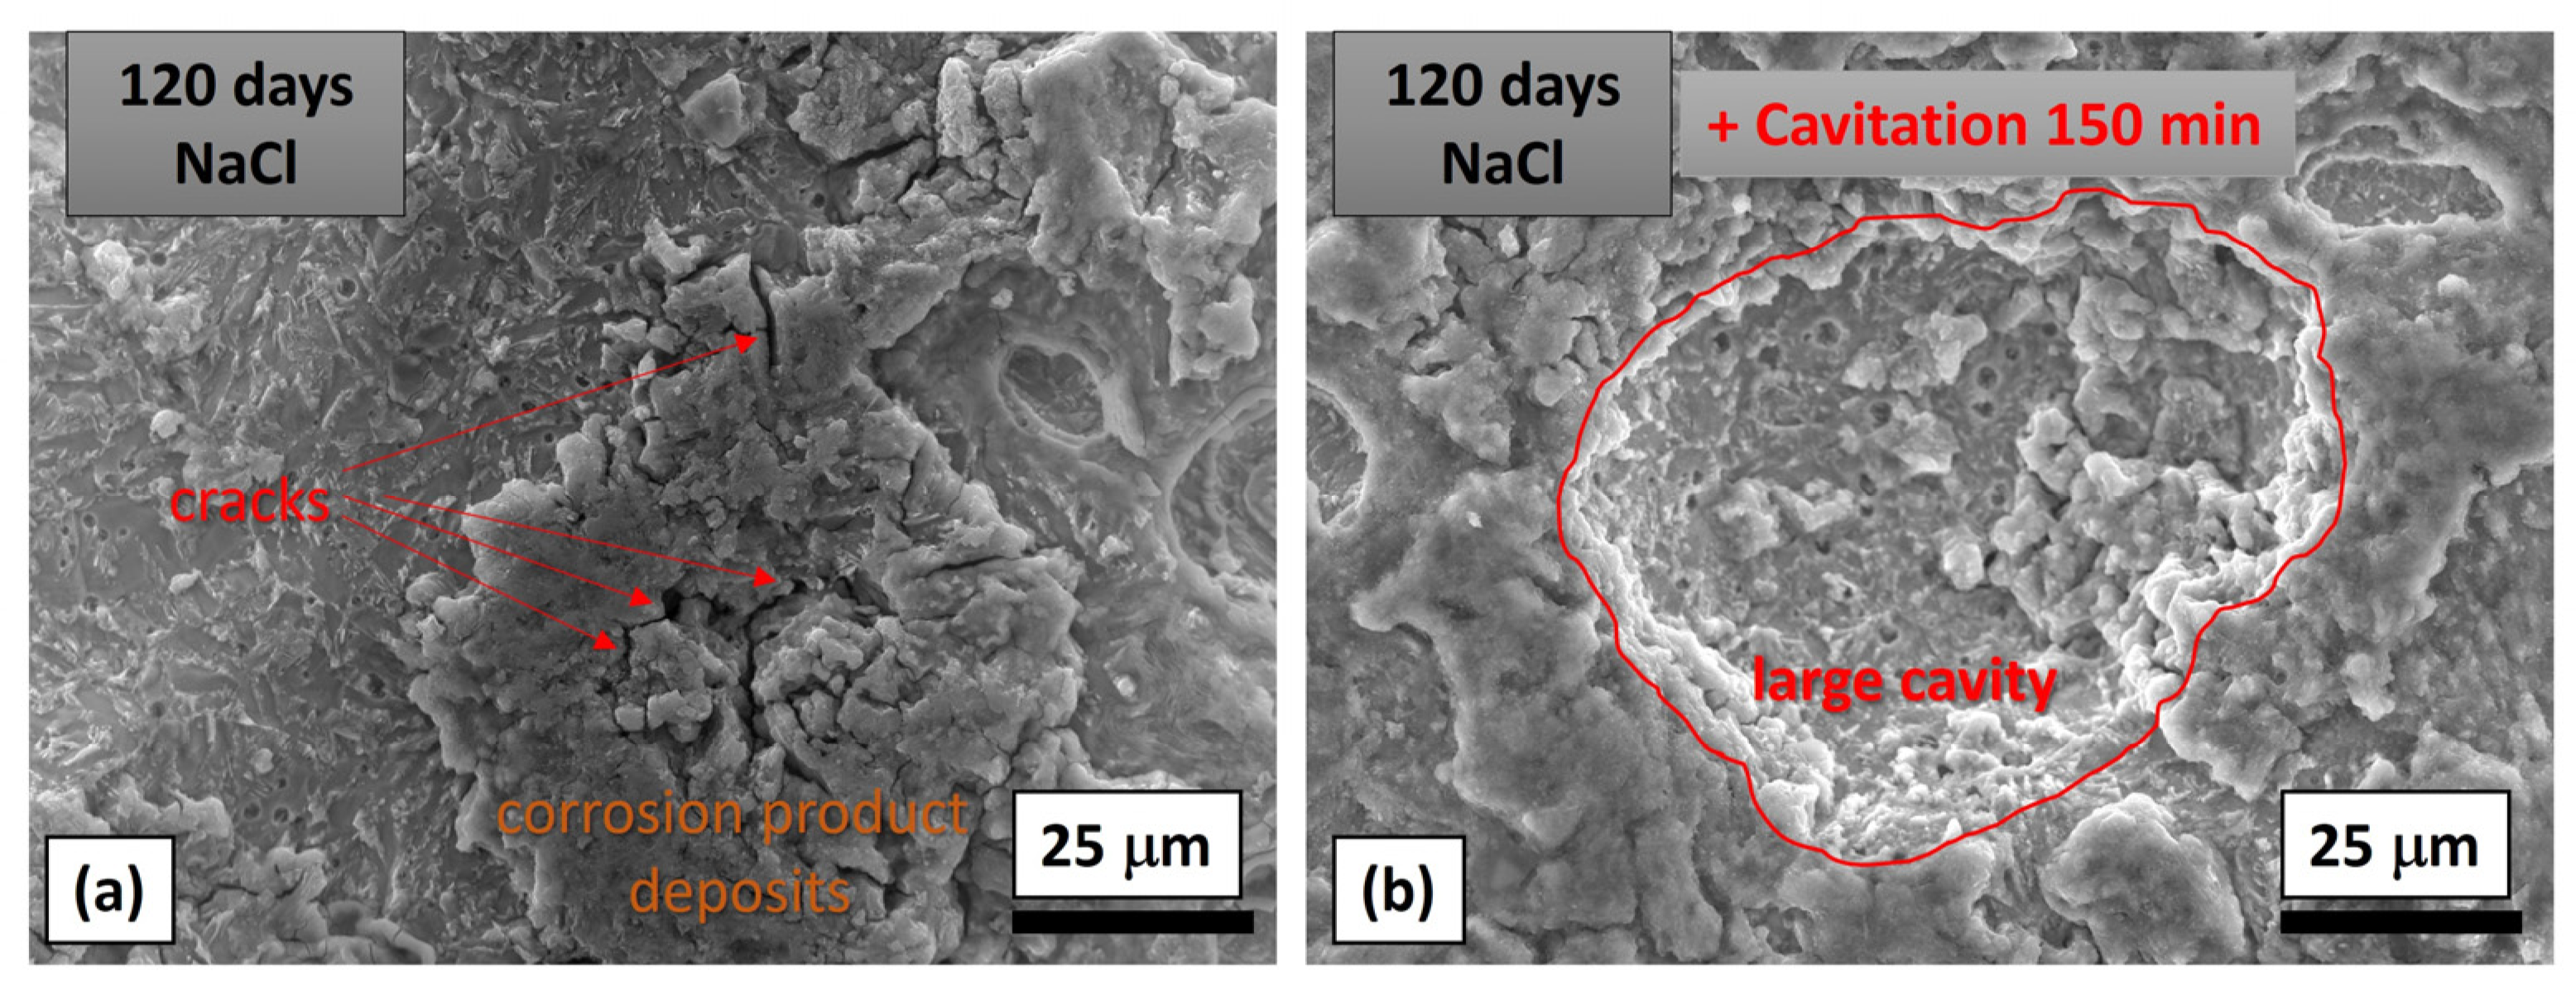
Cavitation erosion was monitored using images of the sample before and during testing, which are presented in Figure 7.
Figure 7 shows the sample after 120 days of immersion in a 3.5% NaCl solution: (a) before cavitation exposure and (b) after 150 min of cavitation testing. It is clearly evident that the damage is significantly deeper and more pronounced when the sample has been pre-corroded.
Microstructural observations from the SEM micrograph in Figure 7a reveal significant corrosion on the sample surface, characterized by relatively uniform damage due to dissolution processes. The morphology exhibited irregular roughness and the presence of corrosion product deposits, including localized pits that are partially covered by these deposits. The specimen subsequently subjected to 150 min of cavitation after the corrosion stage (Figure 7b) showed significantly more pronounced surface degradation. The existing corrosion pits served as potential nucleation sites for cavitation erosion, leading to the formation of large and deep cavities with elevated edges. These characteristics indicate plastic deformation, pit coalescence, and spalling caused by cavitation microjets and shock waves impacts. Compared to corrosion alone, the combined effects of corrosion and cavitation show a pronounced synergistic effect, where cavitation accelerates the removal of material weakened by prior corrosion attack.
For the pre-corroded samples, mass loss occurs due to chemical and/or electrochemical reactions between the metal and its environment, leading to the formation and subsequent detachment of corrosion products. On the other hand, samples exposed to cavitation suffer mechanical damage caused by the collapse of cavitation bubbles, which induces material fatigue, local pressures, surface erosion, and the appearance of pits and cavities. After exposure to corrosion followed by cavitation testing, the samples exhibit faster and more intense degradation, with the damage in the form of pits and cracks being significantly more pronounced compared to samples where cavitation was not applied. Surface roughness increases, and the presence of pre-existing defects accelerates the mechanical damage caused by cavitation. This combination of chemical and mechanical attack leads to greater mass loss and reduced material resistance.
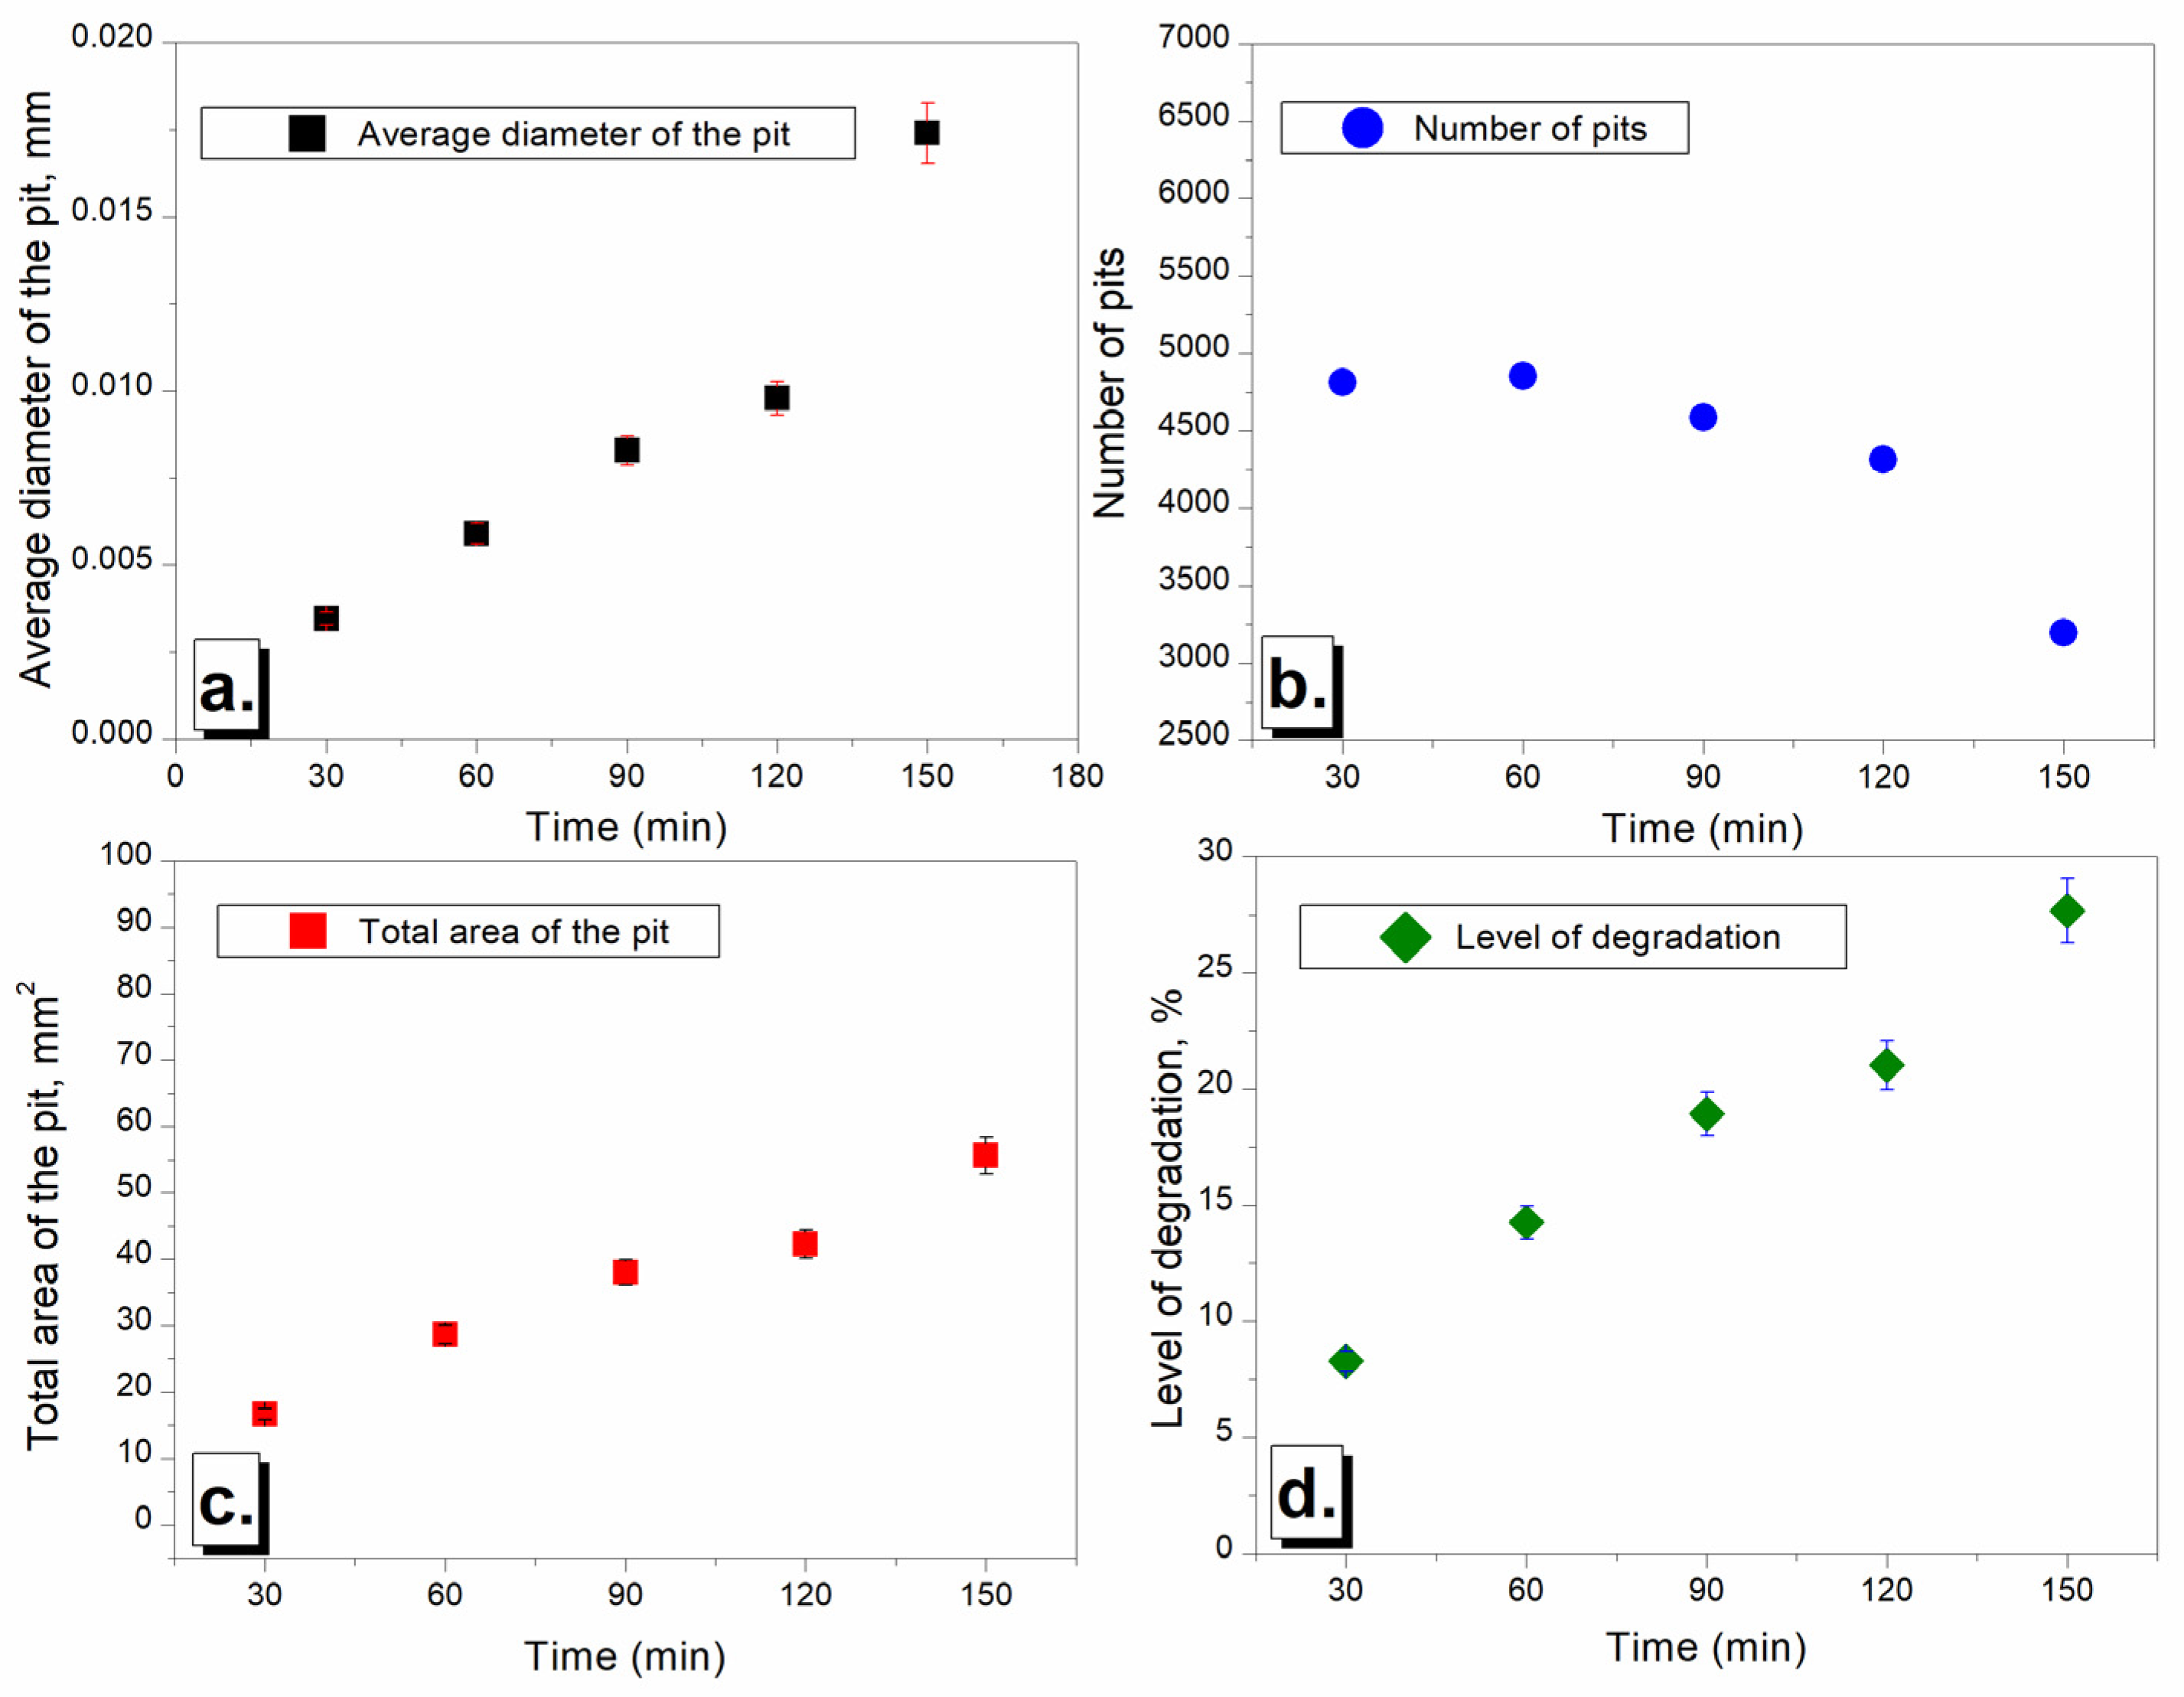
Morphological characterization of the induced defects was performed through image analysis utilizing the Image Pro Plus software. Quantitative parameters—including average pit diameter, total pit area, pit count, and overall material degradation—were systematically evaluated. The resulting data are presented in Figure 8.
Results presented in Figure 8 pointed out that the number of formed pits is increasing till 60 min, and after 60 min till 150 min the number decreases. This suggests that for the first 60 min dominant mechanism is forming pits, and after 60 min, merging pits is also significant, as the damaged surface is not decreasing, leaving a small surface for new pits to form. The average and total area of formed pits is increasing during testing, and more rapidly after 120 min. The level of degradation is, as expected, increasing during the period of testing.

3.3. Comparison of Cavitation Behavior Before and After Immersion in NaCl Solution

3.3.1. Mass Loss and Mass Loss Rate

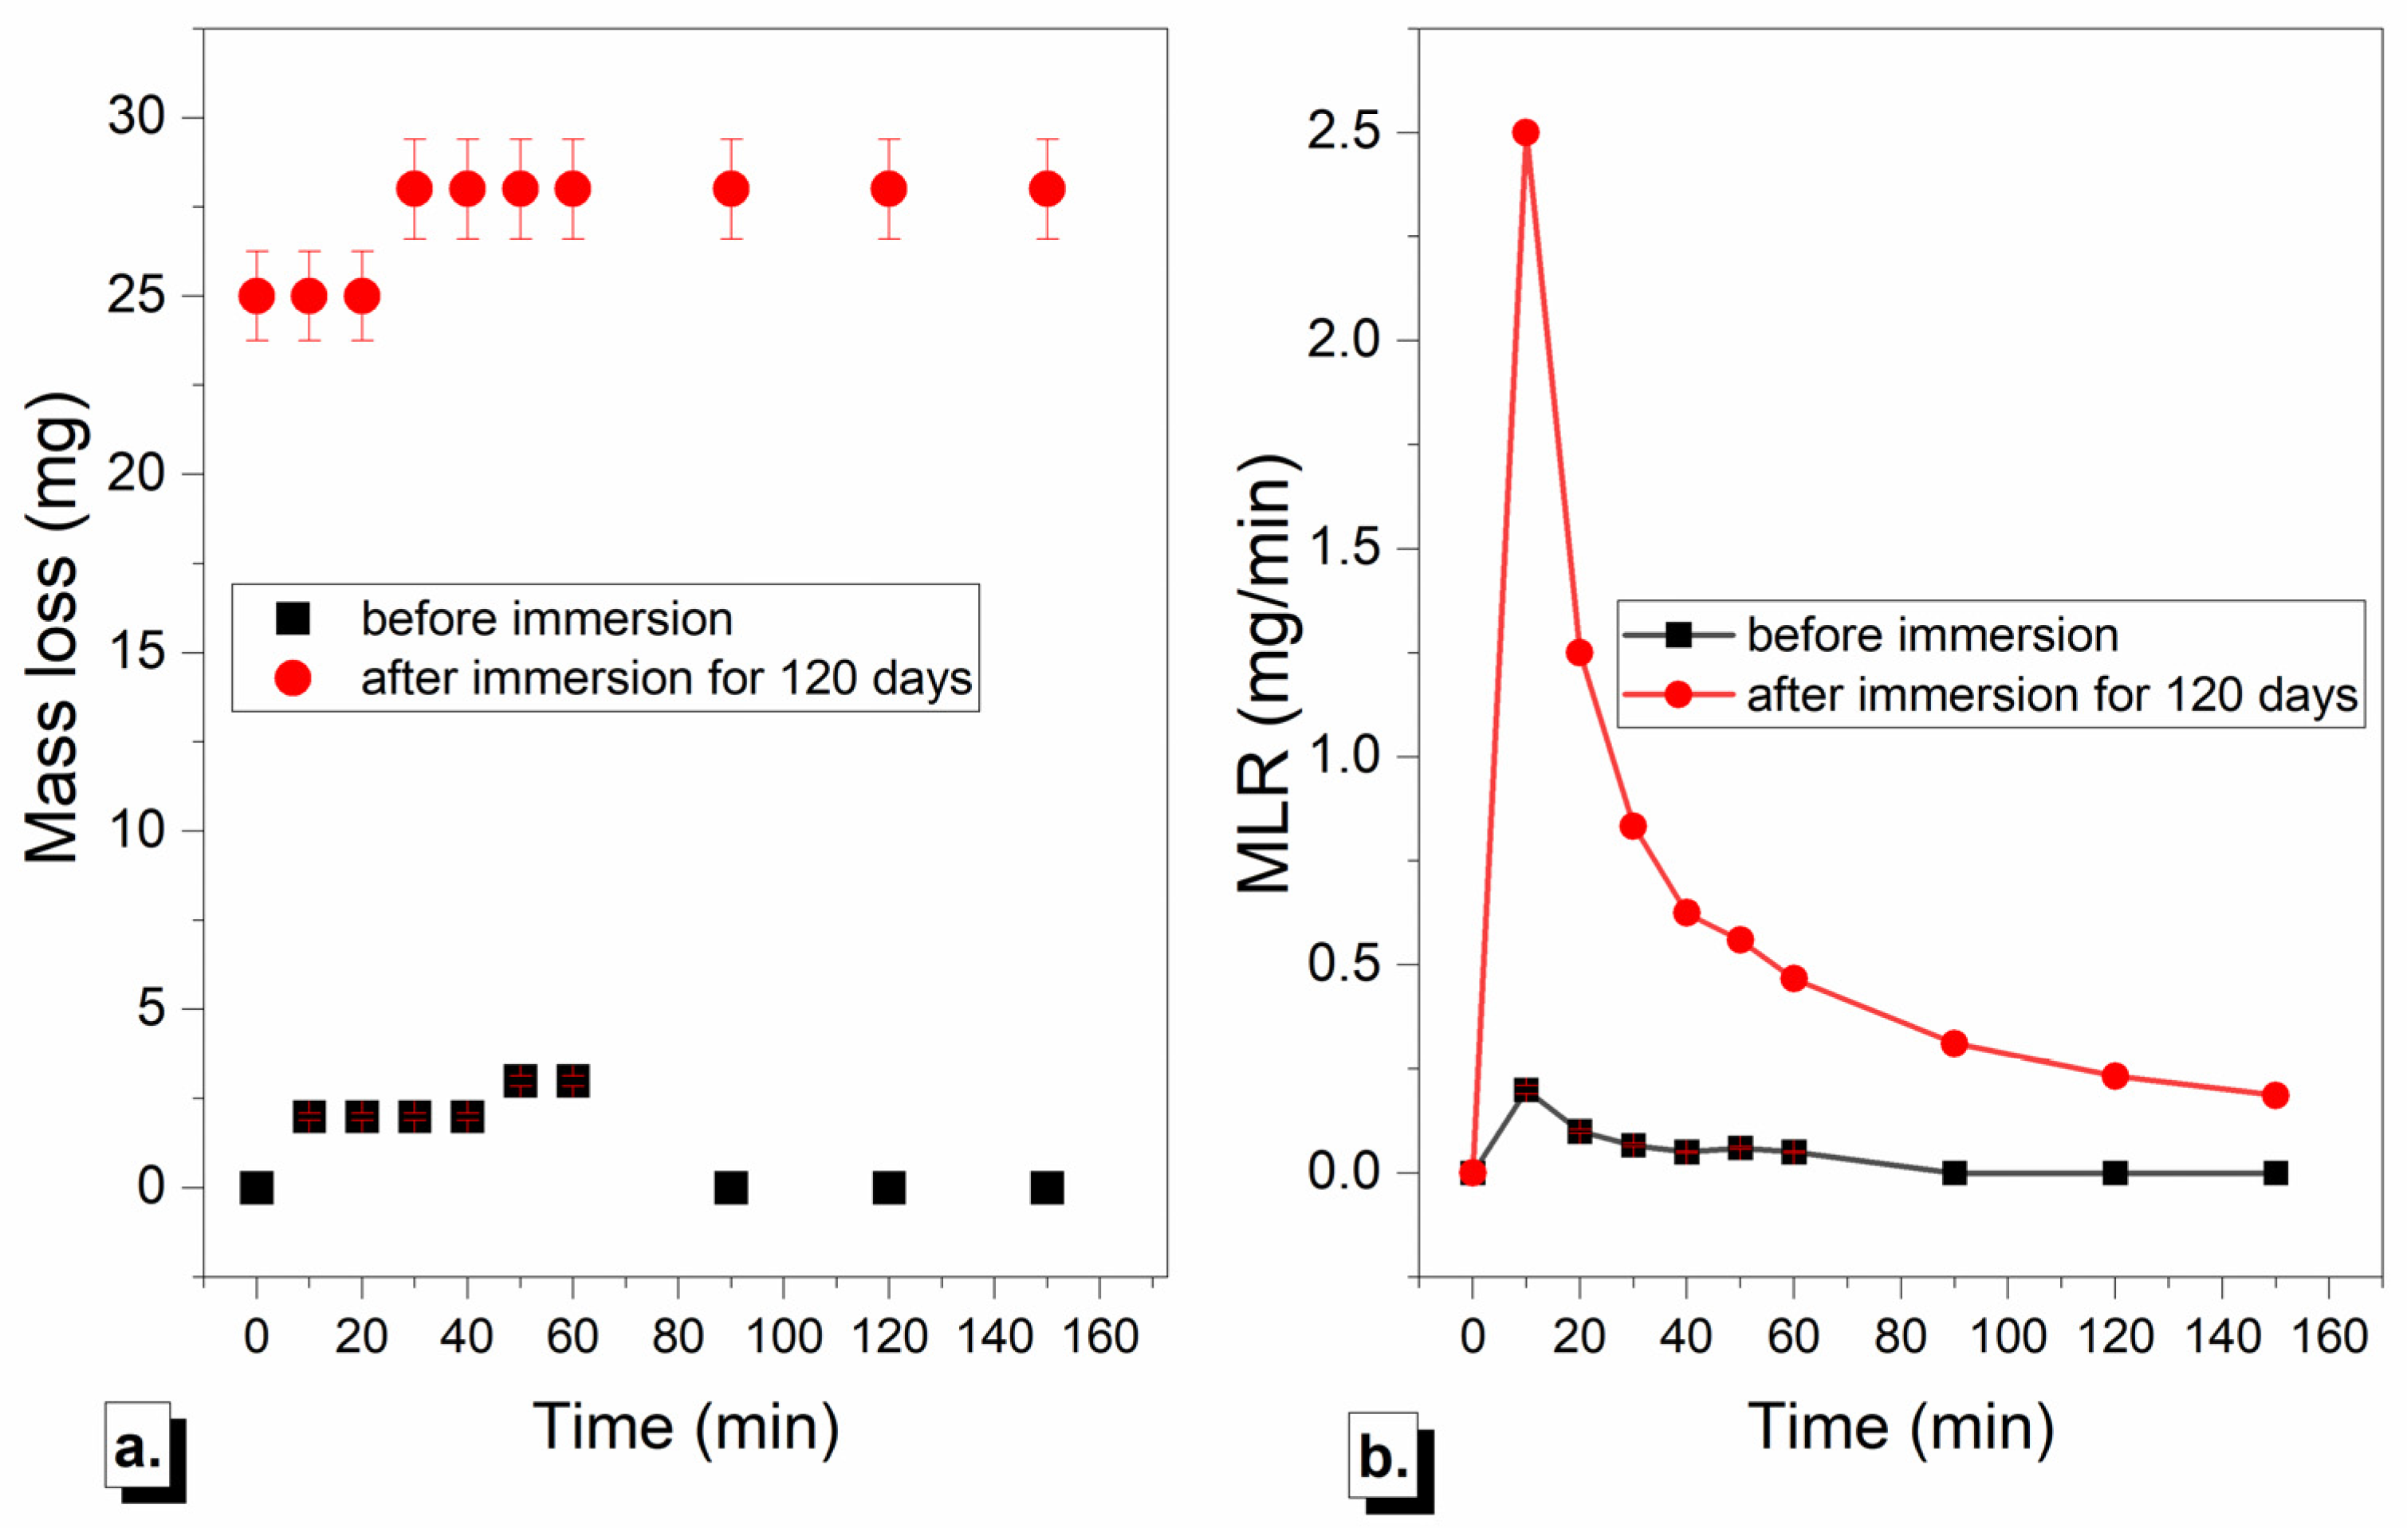
Figure 9 presents a comparison of (a) mass loss and (b) mass loss rate for samples subjected to cavitation, as well as those pre-immersed in NaCl solution for 120 days before cavitation testing.
The obtained mass loss rate results clearly indicate the influence of prior corrosion on subsequent cavitation behavior, as evidenced by the increased mass loss rate in samples subjected to pre-corrosion compared to those tested under non-corroded conditions. While this outcome aligns with expectations, a comparative analysis of mass loss rate alongside selected morphological parameters may provide a more comprehensive understanding and quantitative assessment of the effect of pre-corrosion on cavitation erosion resistance.
The dependence of mass loss rate (MLR) on cavitation exposure time for samples without and with 120 days of pre-corrosion is shown in Figure 1. At the beginning of cavitation, the MLR for pre-corroded samples increases rapidly, indicating that pre-existing surface damage, such as microcracks and initial pits, made the material more vulnerable to erosion. Although the MLR starts to decline after the initial stage, it remains higher than that of the non-corroded sample, likely due to increased surface roughness that facilitates ongoing damage, albeit with reduced efficiency. Between 90 and 150 min, the curve stabilizes at lower values, suggesting a steady-state erosion rate. This behavior implies that the surface has reached a damage threshold where further cavitation attacks are less effective. The initial sharp rise in MLR highlights the significant weakening of the steel’s surface caused by pre-corrosion, while the later stabilization indicates that existing damage limits further material loss.

3.3.2. Mean Depth of Erosion and Surface Roughness

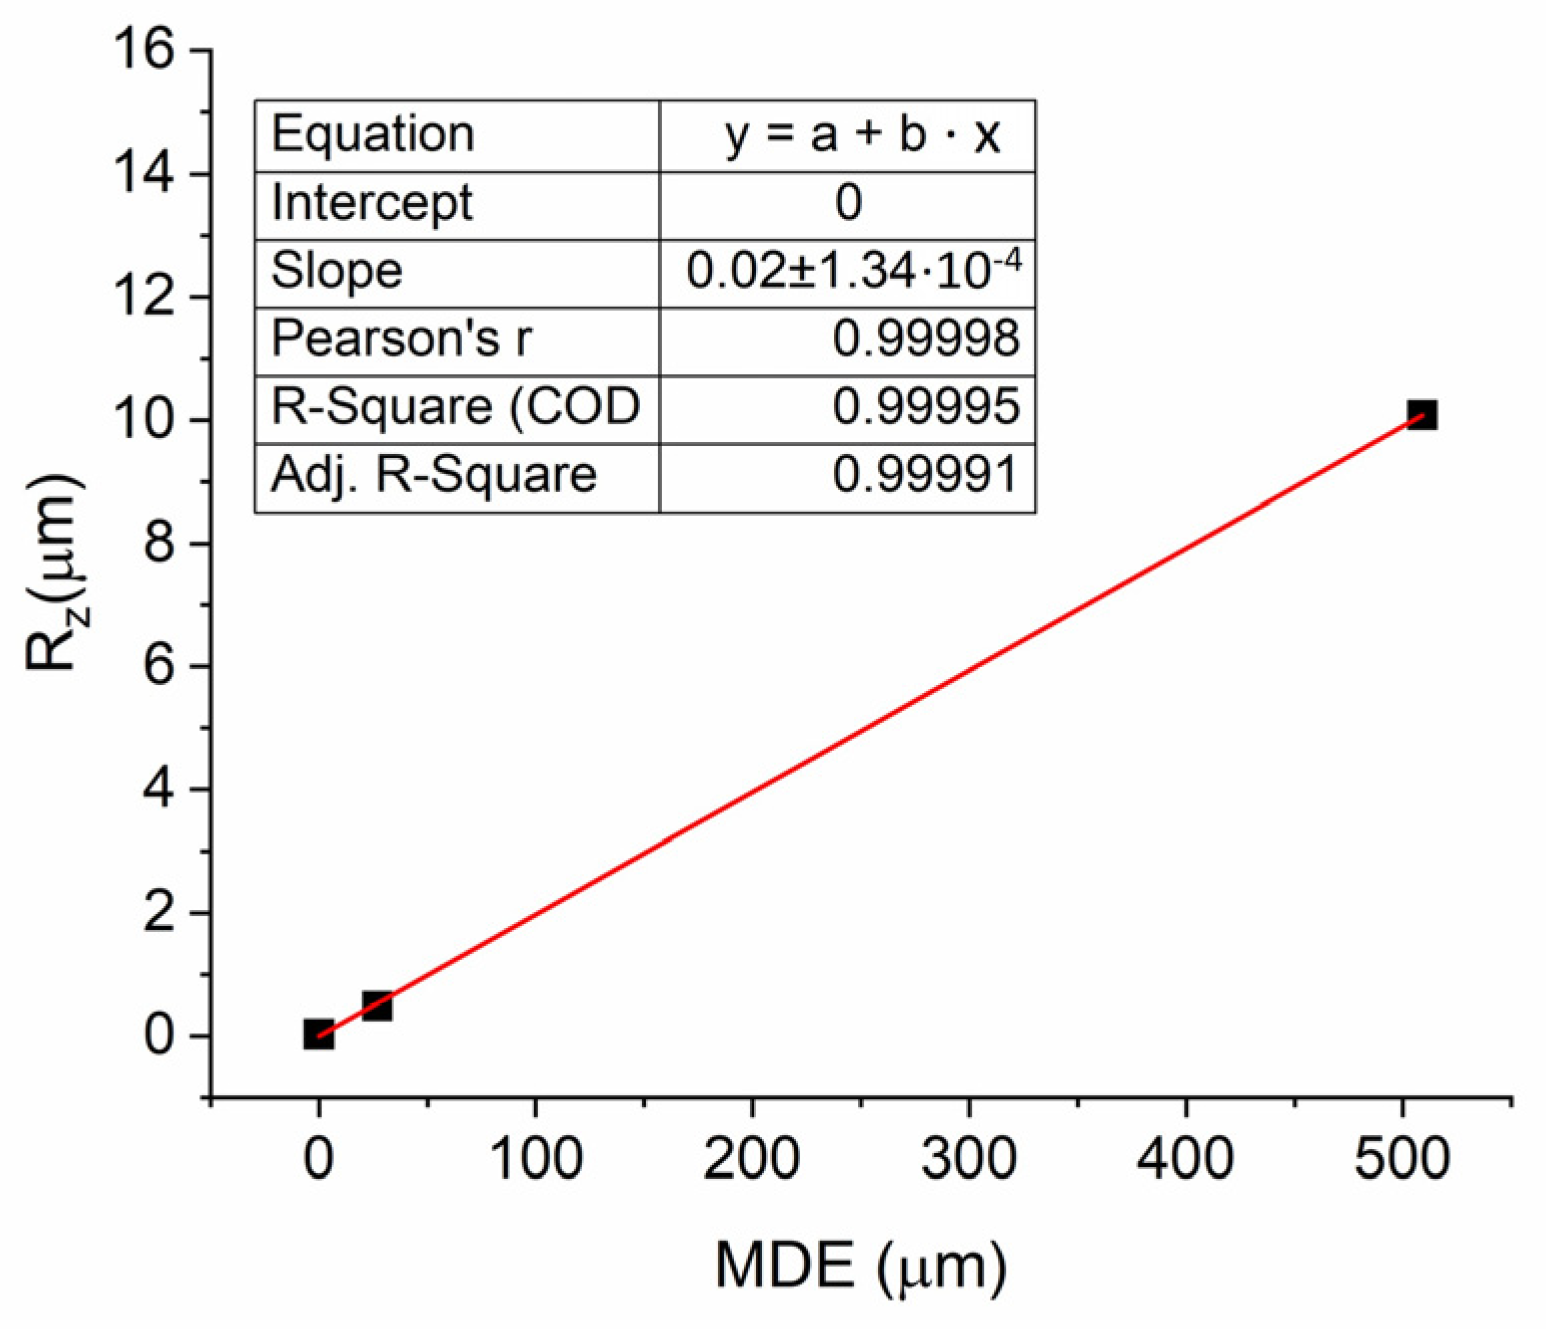
The Mean Depth of Erosion (MDE) was calculated, and the surface roughness (Rz) was measured to assess the extent of cavitation-induced surface degradation. To establish a correlation between MDE and Rz, it is necessary to understand how these two parameters, although fundamentally different, relate to surface damage. MDE represents the average depth of material loss caused by cavitation erosion over the exposed surface, while Rz measures the maximum height difference between the five highest peaks and five lowest valleys within the measured surface area. Although MDE reflects the overall material penetration due to erosion, and Rz characterizes the surface texture and irregularities, their relationship provides valuable insight into the progression and morphology of surface damage.
In Figure 10, the relationship between these two parameters is presented, along with the derived empirical model, which shows that Rz can be approximated by the equation
Rz = 0.02∙MDE
Although both MDE and Rz indicate surface damage, they describe different characteristics of the degradation process. The large discrepancy, often reaching two orders of magnitude between MDE and Rz, is attributed to the synergistic effect of cavitation and corrosion in the presence of NaCl solution. Corrosion induces microcracks and weakened zones on the material surface, allowing cavitation waves to penetrate more deeply and cause accelerated erosion compared to samples exposed to cavitation alone. Consequently, cavitation combined with corrosion leads to more pronounced surface deformation and deeper damage, reflected by the higher MDE and increased roughness.
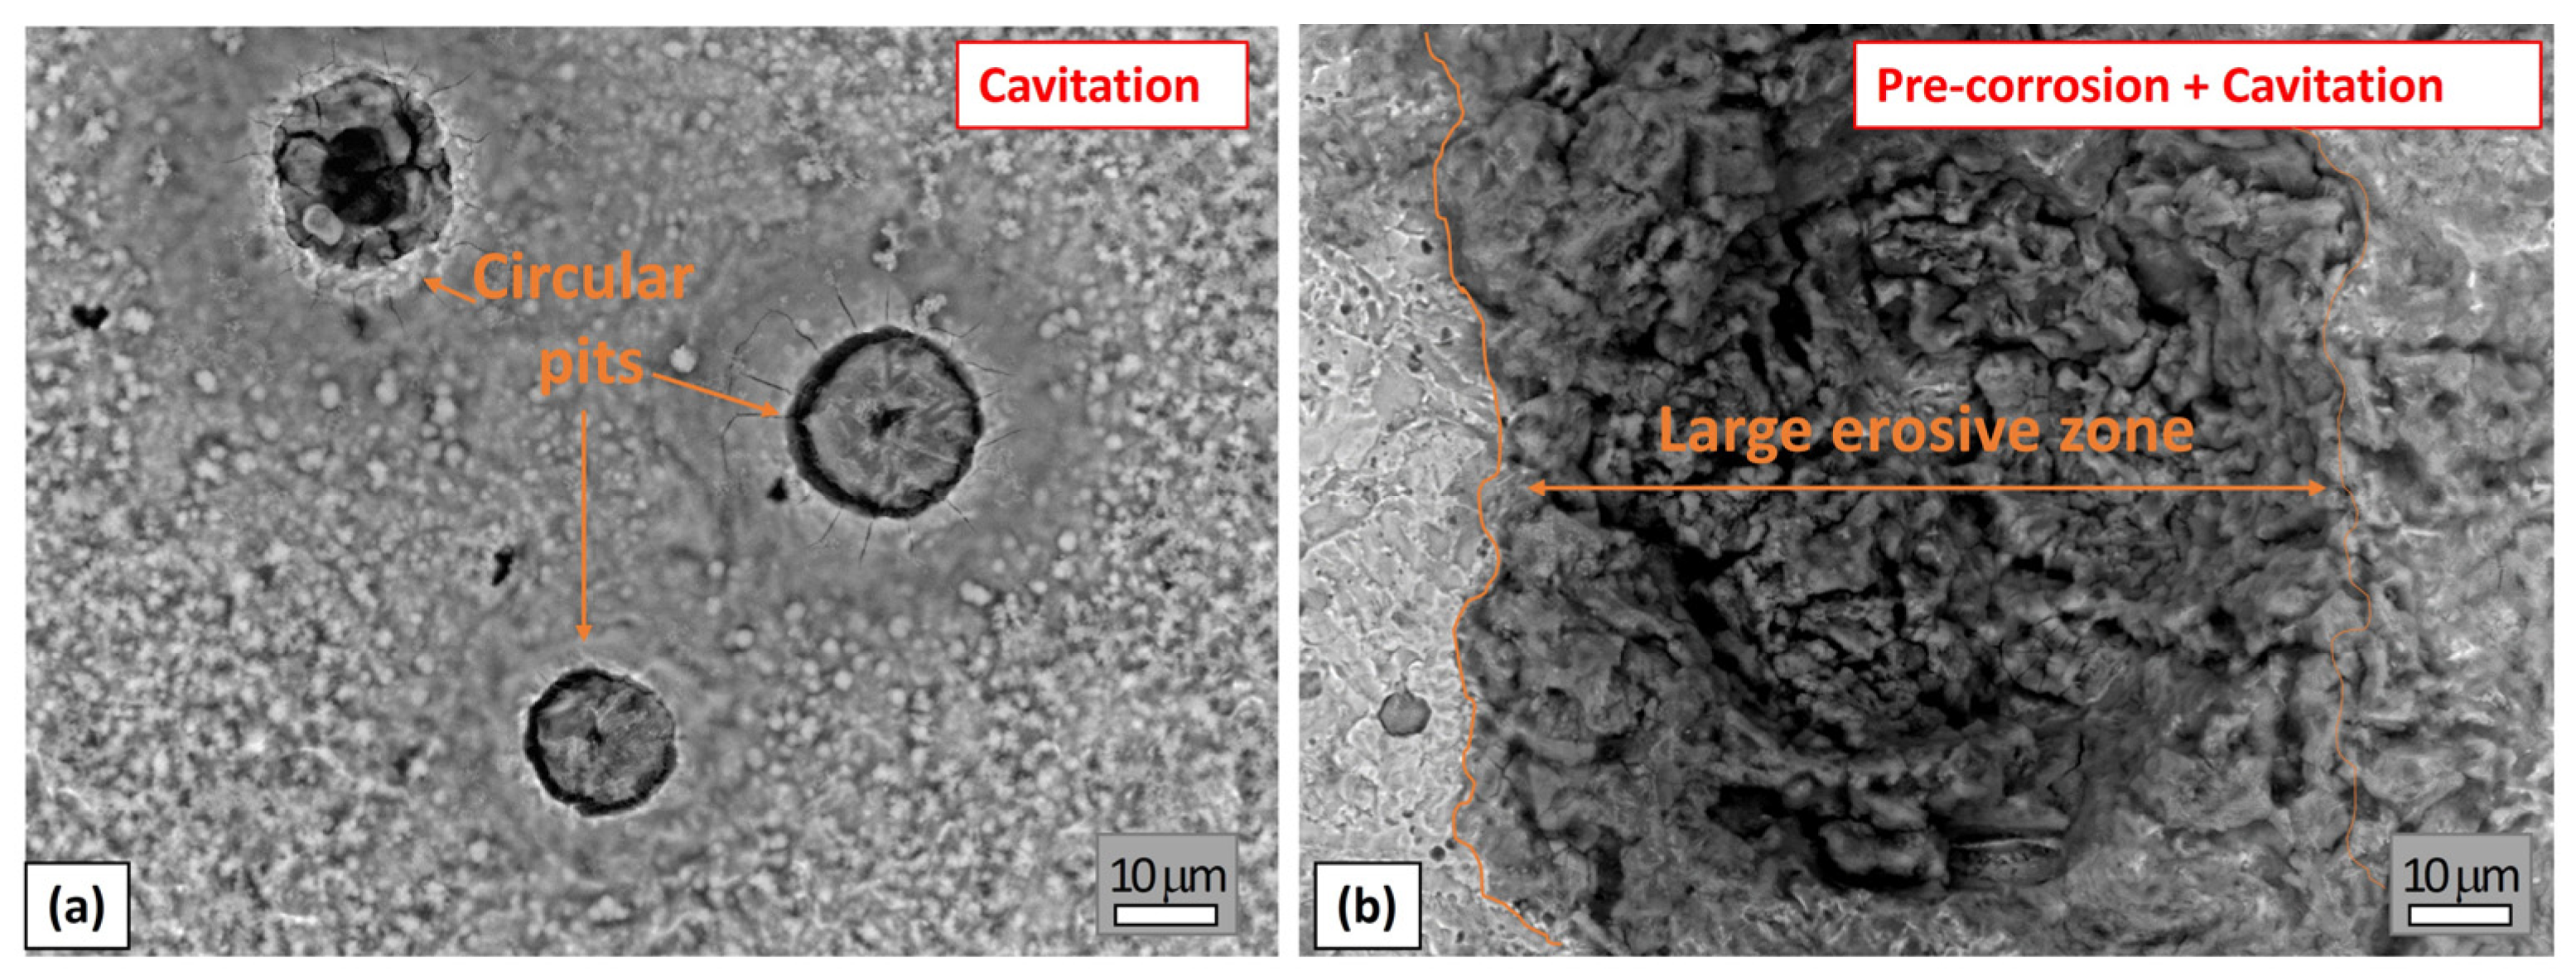
In this study, an empirical correlation was found between Rz and MDE, expressed as Rz = 0.02 × MDE, indicating that surface roughness increases proportionally with the mean erosion depth, but at a much smaller scale. This relationship highlights that while MDE and Rz measure different aspects of surface damage, they remain linked through the progression of cavitation-induced degradation. Figure 11 shows SEM micrographs of pits formed on the 42CrMo4 steel samples with and without 120 days of pre-corrosion in NaCl, illustrating the differences in surface morphology under these conditions.
Based on the SEM images, a significant difference in surface morphology can be observed between the 42CrMo4 steel samples subjected to 120 days of pre-corrosion in a 3.5% NaCl solution followed by 150 min of cavitation, and those exposed to cavitation alone for 150 min without any prior treatment. These images clearly illustrate the contrasting effects of cavitation only versus the combined impact of long-term pre-corrosion and subsequent cavitation on the steel surface. The SEM images of the pre-corroded samples reveal the formation of larger and deeper pits on the steel surface. These pits likely result from the corrosive attack during the 120-day exposure in the NaCl solution, which causes microscopic cracks, intergranular corrosion, and other surface defects. Such damage facilitates the easier formation of larger surface depressions during subsequent cavitation testing. During cavitation, this already weakened material is more susceptible to further damage and erodes faster, leading to the development of larger pits compared to samples that were not pre-corroded.
The observed differences in surface morphology are closely linked to the mass loss rate measured during the cavitation tests shown in Figure 9b. Samples that underwent pre-corrosion exhibited a higher susceptibility to mass loss because the microscopic cracks and surface defects formed during the corrosion process facilitated the cavitation attack. The increased surface roughness caused by pre-corrosion created nucleation sites for the formation of deeper pits during cavitation, which in turn accelerated material removal. This synergistic effect led to significantly greater mass loss in the pre-corroded samples compared to those exposed to cavitation alone.

3.3.3. Morphological Characterization of the Samples

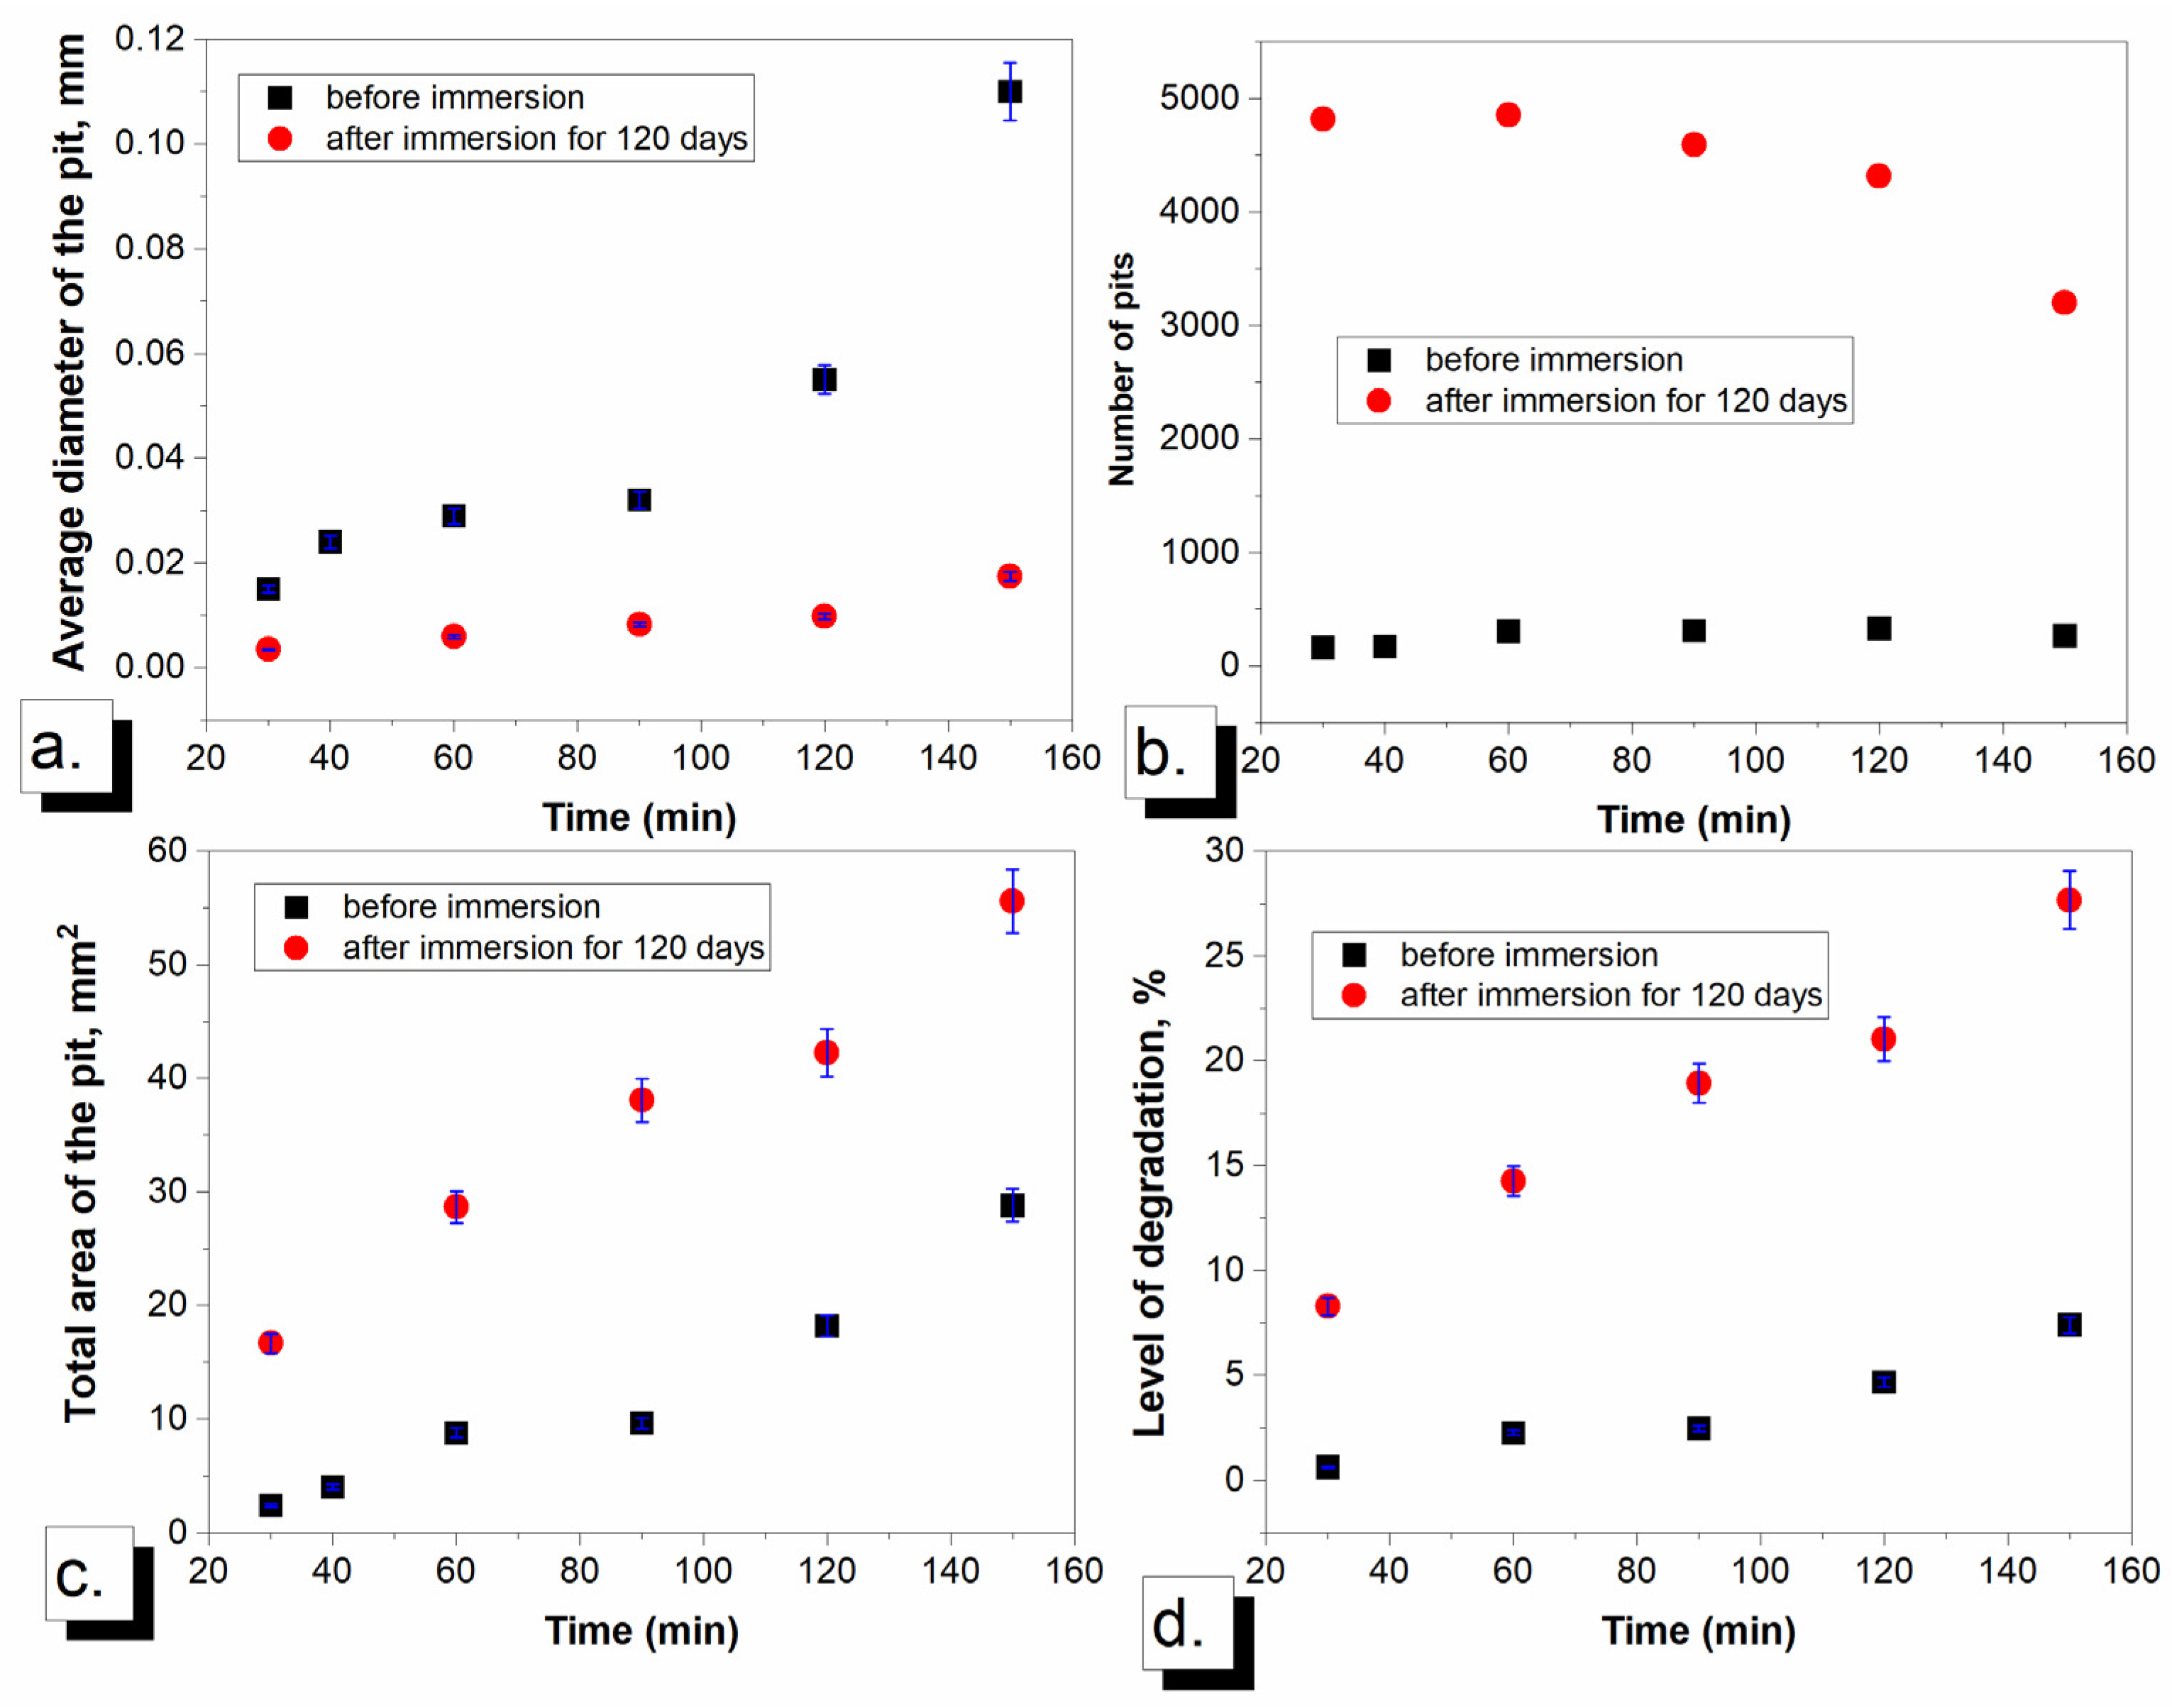
Comparison related to the selected morphological parameters used for characterization and quantification of the defects caused by cavitation and cavitation after corrosion is presented in Figure 12a–d.
The average diameter of the pits formed in the pre-corroded sample was lower compared to the non-corroded sample, suggesting that prior corrosion may promote the initiation of smaller pits. However, other morphological parameters—including the total pit area, the number of pits, and the overall degradation level—exhibited significantly higher values in the sample subjected to NaCl immersion. This indicates that pre-corrosion has a substantial impact on subsequent cavitation erosion behavior. The most pronounced effect was observed in the number of pits formed, which increased by several orders of magnitude in the pre-corroded sample. These findings suggest that NaCl immersion notably reduces the material’s resistance to pit formation during cavitation, with the number of formed pits emerging as the most sensitive indicator of this degradation mechanism.

4. Conclusions

This study demonstrated that pre-corrosion significantly affects the cavitation erosion behavior of 42CrMo4 steel. Samples pre-exposed to a 3.5% NaCl solution for 120 days exhibited higher mass loss rates and more severe surface damage compared to non-corroded samples. The synergistic effect of corrosion and cavitation led to the formation of microcracks and surface defects, which served as initiation sites for accelerated material degradation. SEM analysis confirmed the presence of deeper and larger pits in pre-corroded samples, while a clear correlation was observed between surface roughness and erosion depth. Surface roughness (Rz) was found to correlate with the mean depth of erosion (MDE) through the empirical relation Rz = 0.02 MDE, reflecting how surface irregularities develop alongside erosion depth. SEM analysis confirmed that pre-corroded samples developed larger and deeper pits, explaining the higher susceptibility to cavitation erosion.
A comparative analysis of mass loss, mass loss rate, and morphological indicators underscores the significant impact of pre-corrosion on cavitation erosion behavior. The results indicate that prior immersion in NaCl solution strongly influences pit nucleation and growth, leading to increased pit density, greater total damage area, and enhanced material degradation. While smaller pits were preferentially formed in the pre-corroded samples, their substantially higher number contributed to a more severe erosion profile.
The integration of mass loss measurements with image-based morphological analysis proved to be a reliable and informative method for assessing cavitation damage and the role of prior corrosion, offering valuable insight into material durability under marine-like conditions. These findings highlight the critical role of pre-corrosion in accelerating cavitation damage and emphasize the need to consider environmental corrosion effects when evaluating material durability in marine applications.

Author Contributions

Conceptualization, S.N., A.A. and T.V.-H.; methodology, S.M. and S.D.; software, A.A. and T.V.-H.; validation, S.D., S.M. and T.V.-H.; formal analysis, A.A. and T.V.-H.; investigation, A.A. and S.M.; writing—original draft preparation, S.N. and T.V.-H.; writing—review and editing, A.A.; visualization, A.A. and S.D.; supervision, T.V.-H. All authors have read and agreed to the published version of the manuscript.

Funding

This work was financially supported by the Ministry of Science, Technological Development and Innovation of the Republic of Serbia (Contract Nos. 451-03-136/2025-01/200036 and 451-03-136/2025-03/200135).

Institutional Review Board Statement

Not applicable.

Informed Consent Statement

Not applicable.

Data Availability Statement

The original contributions presented in the study are included in the article, further inquiries can be directed to the corresponding author.

Acknowledgments

This work was supported by the Ministry of Science, Technological Development and Innovation of the Republic of Serbia [grant numbers 451-03-136/2025-03/200135 and 451-03-136/2025-03/200026]. This research contributes to the implementation of the United Nations 2030 Agenda for Sustainable Development, specifically addressing Goal 9: Industry, Innovation and Infrastructure (https://sdgs.un.org/goals, accessed on 12 September 2025). By developing an innovative approach for evaluating the degradation mechanisms of 42CrMo4 steel in aggressive environments, this study supports industrial innovation and the advancement of sustainable and resilient infrastructure.

Conflicts of Interest

The authors declare no conflicts of interest.

Abbreviations

The following abbreviations are used in this manuscript:
CECavitation Erosion
MLMass Loss
MLRMass Loss Rate
MDEMean Depth of Erosion
LoDLevel of Degradation

References

  1. Hammitt, F.G. Cavitation and Multiphase Flow Phenomena; McGraw-Hill Companies: New York, NY, USA, 1980. [Google Scholar]
  2. Brennen, C.E. Cavitation and Bubble Dynamics; Cambridge University Press: New York, NY, USA, 2014. [Google Scholar]
  3. Volkov-Husović, T.; Ivanić, I.; Kožuh, S.; Stevanović, S.; Vlahović, M.; Martinović, S.; Stopic, S.; Gojić, M. Microstructural and Cavitation Erosion Behavior of the CuAlNi Shape Memory Alloy. Metals 2021, 11, 997. [Google Scholar] [CrossRef]
  4. Gao, G.; Zhang, Z. Cavitation Erosion Mechanism of 2Cr13 Stainless Steel. Wear 2021, 488–489, 204137. [Google Scholar] [CrossRef]
  5. Zakrzewska, D.E.; Krella, A.K. Cavitation Erosion Resistance Influence of Material Properties. Adv. Mater. Sci. 2019, 19, 18–34. [Google Scholar] [CrossRef]
  6. Mohammadizadeh, S.; Dalfré Filho, J.G.; Sampaio Descovi, C.; Genovez, A.I.B.; Teixeira Buttignol, T.E. Experimental Analysis of Cavitation Erosion: Parameter Sensitivity and Testing Protocols. Coatings 2024, 14, 1288. [Google Scholar] [CrossRef]
  7. Basumatary, J.; Nie, M.; Wood, R.J.K. The Synergistic Effects of Cavitation Erosion–Corrosion in Ship Propeller Materials. J. Bio- Tribo-Corros. 2015, 1, 12. [Google Scholar] [CrossRef]
  8. Raami, L.; Varis, T.; Valtonen, K.; Wendler, M.; Volkova, O.; Peura, P. Enhancing the Cavitation Erosion Resistance of AISI 420-Type Stainless Steel with Quenching and Partitioning. Wear 2023, 526–527, 204897. [Google Scholar] [CrossRef]
  9. Chahine, G.L.; Franc, J.-P.; Karimi, A. Laboratory Testing Methods of Cavitation Erosion. In Advanced Experimental and Numerical Techniques for Cavitation Erosion Prediction; Springer: Cham, Switzerland, 2014; pp. 21–35. [Google Scholar] [CrossRef]
  10. Volkov-Husović, T.; Martinović, S.; Alil, A.; Vlahović, M.; Dimitrijević, B.; Ivanić, I.; Pavkov, V. Comparative investigation of ultrasonic cavitation erosion for two engineering materials. J. Min. Metall. Sect. B-Metall. 2024, 60, 295–304. [Google Scholar] [CrossRef]
  11. ASTM G32-16(2021)e1; Standard Test Method for Cavitation Erosion Using Vibratory Apparatus. ASTM International: West Conshohocken, PA, USA, 2021.
  12. ASTM G134-17; Standard Test Method for Erosion of Solid Materials by Cavitating Liquid Jet. ASTM International: West Conshohocken, PA, USA, 2017.
  13. Yang, R.; Chen, X.; Tian, Y.; Chen, H.; Boshkov, N.; Li, H. An Attempt to Improve Cavitation Erosion Resistance of UHMWPE Coatings through Enhancing Thermal Conductivity via the Incorporation of Copper Frames. Surf. Coat. Technol. 2021, 425, 127705. [Google Scholar] [CrossRef]
  14. Alil, A.; Martinović, S.; Živojinović, D.; Volkov Husović, T. Analysis of the Behavior of the Mullite Samples Surface Exposed to the Cavitation Using a Statistical Analysis Approach. Eng. Fail. Anal. 2025, 171, 109402. [Google Scholar] [CrossRef]
  15. Russ, J.C.; Neal, F.B. The Image Processing Handbook; CRC Press: Boca Raton, FL, USA, 2015. [Google Scholar]
  16. Vlahović, M.; Alil, A.; Devečerski, A.; Živojinović, D.; Volkov-Husović, T. Non-Destructive Examination for Cavitation Resistance of Talc-Based Refractories with Different Zeolite Types Intended for Protective Coatings. Materials 2023, 16, 5577. [Google Scholar] [CrossRef]
  17. Martinović, S.; Alil, A.; Milićević, S.; Živojinović, D.; Volkov Husović, T. Morphological Assessment of Cavitation Caused Damage of Cordierite and Zircon Based Materials Using Principal Component Analysis. Eng. Fail. Anal. 2023, 148, 107224. [Google Scholar] [CrossRef]
  18. Revie, R.W.; Uhlig, H.H. Corrosion and Corrosion Control: An Introduction to Corrosion Science and Engineering; John Wiley & Sons: Hoboken, NJ, USA, 2008. [Google Scholar]
  19. Xu, Q.; Yang, X.; Liu, J.; Jiang, D.; Qiu, Z. Improved Corrosion Resistance of 42CrMo4 Steel by Reconstructing Surface Integrity Using Ultrasonic Surface Rolling Process. Mater. Today Commun. 2023, 35, 105932. [Google Scholar] [CrossRef]
  20. Bartošák, M.; Horváth, J.; Španiel, M. Isothermal Low-Cycle Fatigue and Fatigue-Creep of a 42CrMo4 Steel. Int. J. Fatigue 2020, 135, 105538. [Google Scholar] [CrossRef]
  21. Zhu, Z.; Lu, Y.; Xie, Q.; Li, D.; Gao, N. Mechanical Properties and Dynamic Constitutive Model of 42CrMo Steel. Mater. Des. 2017, 119, 171–179. [Google Scholar] [CrossRef]
  22. Xu, Q.; Liu, Y.; Lu, H.; Liu, J.; Cai, G. Surface Integrity and Corrosion Resistance of 42CrMo4 High-Strength Steel Strengthened by Hard Turning. Materials 2021, 14, 6995. [Google Scholar] [CrossRef]
  23. Maskavizan, A.J.; Quintana, J.P.; Dalibón, E.L.; Márquez, A.B.; Brühl, S.P.; Farina, S.B. Evaluation of wear and corrosion resistance in acidic and chloride solutions of Cathodic Arc PVD chromium nitride coatings on untreated and plasma nitrided AISI 4140 steel. Surf. Coatings Technol. 2024, 494, 131476. [Google Scholar] [CrossRef]
  24. Roberge, P. Handbook of Corrosion Engineering; McGraw-Hill: Columbus, OH, USA, 1999. [Google Scholar]
  25. Li, N.; Chen, Y.-J.; Kong, D.-D. Wear Mechanism Analysis and Its Effects on the Cutting Performance of PCBN Inserts during Turning of Hardened 42CrMo. Int. J. Precis. Eng. Manuf. 2018, 19, 1355–1368. [Google Scholar] [CrossRef]
  26. Abbas, M.; Rizvi, S.H.M.; Sarfraz, S.; Raza, A.; Khan, A.; Loya, A.; Najib, A. Evaluation of the influence of dissolved nitrates on corrosion behaviour of ship structural steel exposed to seawater environment. Ocean Eng. 2024, 298, 117268. [Google Scholar] [CrossRef]
  27. Raja, P.B.; Ismail, M.; Ghoreishiamiri, S.; Mirza, J.; Ismail, M.C.; Kakooei, S.; Rahim, A.A. Reviews on Corrosion Inhibitors: A Short View. Chem. Eng. Commun. 2016, 203, 1145–1156. [Google Scholar] [CrossRef]
  28. Fernandes, J.S.; Montemor, F. Corrosion. In Materials for Construction and Civil Engineering: Science, Processing, and Design; Gonçalves, M.C., Margarido, F., Eds.; Springer International Publishing: Cham, Switzerland, 2015; pp. 679–716. [Google Scholar] [CrossRef]
  29. Nodoushan, E.J.; Lee, Y.J.; Na, H.-J.; You, B.-H.; Lee, M.-Y.; Kim, N. Effects of NaCl and temperature on rheological characteristics and structures of CTAB/NaSal wormlike micellar solutions. J. Ind. Eng. Chem. 2021, 98, 458–464. [Google Scholar] [CrossRef]
  30. Que, Z.; Saario, T.; Toivonen, A.; Ehrnstén, U. Stress corrosion cracking initiation susceptibility of Alloy 182 with different surface treatments. Corros. Sci. 2022, 196, 110037. [Google Scholar] [CrossRef]
  31. Balangao, J.K. Corrosion of Metals: Factors, Types and Prevention Strategies. J. Chem. Health Risks 2024, 14, 79–87. [Google Scholar]
  32. Maurya, P.M. Effect of Corrosion on Metals and Its Prevention. Res. Anal. J. 2022, 5, 5–9. [Google Scholar] [CrossRef]
  33. Huang, Y.; Zhang, J. Materials Corrosion and Protection; Walter de Gruyter GmbH & Co KG: Berlin, Germany, 2018; pp. 5–7, 59, 78–81. [Google Scholar] [CrossRef]
  34. Causes of Corrosion. Available online: https://www.avdec.com/about/articles/causes_of_corrosion (accessed on 13 May 2025).
  35. Gudić, S.; Nagode, A.; Šimić, K.; Vrsalović, L.; Jozić, S. Corrosion Behavior of Different Types of Stainless Steel in PBS Solution. Sustainability 2022, 14, 8935. [Google Scholar] [CrossRef]
  36. Refait, P.; Chaves, I. Corrosion and Protection of Steels in Marine Environments: State-of-The-Art and Emerging Research Trends; MDPI: Basel, Switzerland, 2022. [Google Scholar]
  37. ASTM G1-03(2017)e1; Standard Practice for Preparing, Cleaning, and Evaluating Corrosion Test Specimens. ASTM International: West Conshohocken, PA, USA, 2003.
  38. ISO 11130 (E):2017; Corrosion of Metals and Alloys—Alternate Immersion Test in Salt Solution. The International Organization for Standardization (ISO): Geneva, Switzerland, 2017.
  39. Seawater Composition. Available online: https://www.eps.mcgill.ca/~courses/c542/CHOC_Week%202a(Seawater&Salinity)_2020.pdf (accessed on 28 April 2025).
  40. Millero, F.J.; Feistel, R.; Wright, D.G.; McDougall, T.J. The Composition of Standard Seawater and the Definition of the Reference-Composition Salinity Scale. Deep Sea Res. Part I Oceanogr. Res. Pap. 2008, 55, 50–72. [Google Scholar] [CrossRef]
  41. Physical, Chemical, and Biological Aspects of Water—Volume I; EOLSS Publications: Oxford, UK, 2010.
  42. Duxbury, A.C.; Mackenzie, F.T.; Byrne, R.H. Seawater|Composition, Salinity, Distribution, & Facts. In Encyclopedia Britannica; Encyclopedia Britannica, Inc.: Chicago, IL, USA, 2018. [Google Scholar]
  43. Earth Guide: Educational Resources in Earth, Marine, Environmental, and Planetary Sciences. Available online: https://earthguide.ucsd.edu/ (accessed on 26 April 2025).
  44. Gotbooks.miracosta.edu. Available online: https://gotbooks.miracosta.edu/oceans/chapter7.html (accessed on 27 April 2025).
  45. Available online: https://www.usna.edu/NAOE/_files/documents/Courses/EN380/Course_Notes/Marine%20Environment%20and%20Seawater%20Properties.pdf (accessed on 24 April 2025).
  46. Rajput, A.; Ramkumar, J.; Mondal, K. Cavitation Behavior of Various Microstructures Made from a C–Mn Eutectoid Steel. Wear 2021, 486–487, 204056. [Google Scholar] [CrossRef]
  47. Liu, L.; Zhang, L.; Huang, C.; Guo, H.; Man, J.; Yu, P. Experimental Study of Surface Damage of Stainless Steel Subjected to Cavitation Collapse in Aqueous Environment. Coatings 2023, 13, 1356. [Google Scholar] [CrossRef]
  48. Ding, H.; Tang, Q.; Zhu, Y.; Zhang, C.; Yang, H. Cavitation Erosion Resistance of 316L Stainless Steel Fabricated Using Selective Laser Melting. Friction 2021, 9, 1580–1598. [Google Scholar] [CrossRef]
Figure 1. Cavitation curves with marked degradation periods; solid line—correlation of volume loss with exposure time; dashed line—correlation of volume loss rate with exposure time. Adapted from Refs. [10,11,13,14,15].
Metals 15 01041 g001
Figure 2. Chemical composition of seawater. Adapted from Refs. [43,44,45].
Metals 15 01041 g002
Figure 3. Mass loss and mass loss rate during cavitation testing.
Metals 15 01041 g003
Figure 4. The appearance of the sample surface before (a,c) and during (b,d) cavitation erosion testing in distilled water obtained by OM and SEM, respectively.
Metals 15 01041 g004
Figure 5. Selected morphological parameters: (a) average diameter of formed pits, (b) number of pits, (c) total area of formed pits, and (d) level of degradation.
Metals 15 01041 g005
Figure 6. Mass loss and mass loss rate during cavitation testing after immersion for 120 days in NaCl.
Metals 15 01041 g006
Figure 7. Sample after 120 days of immersion, (a) before cavitation and (b) after 150 min of cavitation testing.
Metals 15 01041 g007
Figure 8. Selected morphological parameters: (a) average diameter of formed pits, (b) number of pits, (c) total area of formed pits, and (d) level of degradation.
Metals 15 01041 g008
Figure 9. Comparison of (a) mass loss and (b) mass loss rate for samples exposed to cavitation, and samples pre-immersed in NaCl solution for 120 days before cavitation testing.
Metals 15 01041 g009
Figure 10. Correlation between mean depth of erosion (MDE) and surface roughness (Rz) for 42CrMo4 steel samples subjected to cavitation. The fitted model shows a linear relationship: Rz = 0.02 × MDE.
Metals 15 01041 g010
Figure 11. SEM images of the surface morphology of a 42CrMo4 steel sample after only 150 min of cavitation exposure (a), and a sample that underwent 120 days of pre-corrosion in 3.5% NaCl followed by cavitation exposure (b).
Metals 15 01041 g011
Figure 12. Comparison of the morphological parameters: (a) average diameter of the formed pit, (b) the number of pits, (c) the total area of the formed pits, and (d) the level of degradation.
Metals 15 01041 g012
Table 1. Selection of morphological parameters. Adapted from Refs. [16,17,18,19].
Morphological ParameterDefinitionImage
AreaArea of object. Does not include the hole areaMetals 15 01041 i001
Diameter (mean)Average length of diameters measured at 2-degree intervals and passing through the object’s centroidMetals 15 01041 i002
Radius (max)Maximal distance between the object’s centroid and outlineMetals 15 01041 i003
Radius (min)Minimal distance between the object’s centroid and outlineMetals 15 01041 i004
Radius ratioThe ratio between the maximal and minimal radiusMetals 15 01041 i005
RoundnessThe measure of how closely the shape of an object approaches that of a mathematically perfect circleMetals 15 01041 i006
Number of pits/defectsNumber of selected objectsMetals 15 01041 i007
Table 2. Chemical composition of 42CrMo4 low-alloy steel (weight%).
42CrMo4
Element (wt.%)CCrMoMnSiNiCuAlSP
0.400.930.200.650.290.030.040.0440.0030.009
Fe-balanced.
Disclaimer/Publisher’s Note: The statements, opinions and data contained in all publications are solely those of the individual author(s) and contributor(s) and not of MDPI and/or the editor(s). MDPI and/or the editor(s) disclaim responsibility for any injury to people or property resulting from any ideas, methods, instructions or products referred to in the content.