Article

Investigation of Hot Deformation Behavior for 45CrNi Steel by Utilizing an Improved Cellular Automata Method

1
School of Materials Science & Engineering, Taiyuan University of Science and Technology, Taiyuan 030024, China
2
Department of Mechanical Engineering, Tsinghua University, Beijing 100084, China
*
Author to whom correspondence should be addressed.
Metals 2025, 15(9), 1015; https://doi.org/10.3390/met15091015
Submission received: 10 August 2025 / Revised: 1 September 2025 / Accepted: 9 September 2025 / Published: 12 September 2025

Abstract

The hot deformation discipline of typical 45CrNi steel under a strain rate ranging from 0.01 s−1 to 1 s−1 and deformation temperature between 850 °C and 1200 °C was investigated through isothermal hot compression tests. The activation energy involved in the high-temperature deformation process was determined to be 361.20 kJ·mol−1, and a strain-compensated constitutive model, together with dynamic recrystallization (DRX) kinetic models, was successfully established based on the Arrhenius theory. An improved second-phase (SP) cellular automaton (CA) model considering the influence of the pinning effect induced by SP particles on the DRX process was developed, and the established SP-CA model was further utilized to predict the evolution behavior of parent austenite grain in regard to the studied 45CrNi steel. Results show that the average absolute relative error (AARE) associated with the austenite grain size and the DRX volume fraction achieved through the simulation and experiment was overall below 5%, indicating good agreement between the simulation and experiment. The pinning force intensity could be controlled by regulating the size and volume fraction of SP particles involved in the established SP-CA model, and the DRX behavior and the average grain size of the studied 45CrNi steel treated by high-temperature compression could also be predicted. The established SP-CA model exhibits significant potential for universality and is expected to provide a powerful simulation tool and theoretical foundation for gaining deeper insights into the microstructural evolution of metals or alloys during high-temperature deformation.

1. Introduction

Due to the superior combination of exceptional strength, remarkable toughness, and good hardenability, 45CrNi steel is commonly employed in the production of diverse critical parts, including connecting rods, aerospace landing gear, marine gearboxes, etc. [1,2]. Generally, the microstructural evolution of metals and alloys during hot working invariably involves a series of complex physical metallurgical phenomena, such as recovery, recrystallization, and grain growth. Owing to its ability to refine and control the grain size, dynamic recrystallization (DRX) is among the most critical microstructural evolution mechanisms during hot working. The control of DRX is significantly important for improving the formability and refining grains, which are essential for achieving an optimal strength–ductility synergy [3,4,5,6]. Since DRX behavior is highly sensitive to various deformation conditions, such as temperature, strain rate, and strain, it is essential to understand the kinetics and microstructural evolution of DRX during high-temperature plastic deformation for 45CrNi steel to realize the control of grain size distribution [7,8,9]. In practical processes such as hot rolling or forging, the refinement of the initial microstructure and regulation of crystallographic orientation can be realized through the DRX mechanism, and DRX analysis is commonly employed to adjust microstructural features, grain size, and texture component in regard to steel [9,10]. Since DRX plays a crucial role in refining grain structures and could serve as a productive method for improving both strength and toughness, the basic theory and discipline related to DRX during the hot working process draws a great attention from scholars [11,12,13]. However, it is difficult to directly observe the evolution of the microstructure involved in the hot deformation process. The traditional method is to observe the microstructure evolution behavior through rapid cooling to retain the high-temperature microstructure; the final state of the microstructure information could be achieved through this method, but the transient information related to DRX behavior could not be captured.
With the development of computational materials science, the cellular automaton (CA) technique has been proven to be an effective method for predicting and investigating the microstructure evolution behavior of metallic materials treated by the hot working process, and CA could overcome the traditional difficulty related to the observation of microstructure evolution during the hot working process [14,15,16,17,18,19]. Due to its characteristics of high computational speed and strong flexibility, CA is widely applied for simulating the DRX behavior of materials during the hot deformation process, and the characteristic parameters of a microstructure can be determined through quantitative simulation via the integration of CA and visualization techniques. Currently, the CA method has been effectively employed to model the microstructural evolution of metallic materials, and the dynamic changes in microstructure encompassing phenomena such as DRX volume fraction and grain size variations can be simulated for diverse metals and alloys [20,21,22,23,24]. For instance, a CA model was applied to predict the distribution features of grain size induced by DRX for an Ni-based super-alloy with high precision [20]. A CA model that incorporates the evolution of dislocation density, recrystallization nucleation, and grain growth during deformation was successfully developed to simulate microstructural evolution and stress response under shifted strain rate compression conditions [21]. A CA model incorporating the visco-plastic self-consistent (VPSC) and continuous dynamic recrystallization (CDRX) models is developed to simulate the plastic deformation and microstructure evolution concurrently during the hot working process in regard to aluminum alloys, and macroscopic flow stress, 3D microstructure, and inherent microstructural characteristics such as subgrain size, subgrain boundaries, and textures achieved through the simulation are in good agreement with the experimental results [22]. In addition, a novel CDRX-CA model incorporating physical metallurgy has been developed to accurately capture CDRX behaviors during hot working in regard to the Ti-55511 alloy with high precision [23]. A hybrid modeling approach integrating the finite element method (FEM) and CA at multiple scales was effectively employed to simulate the DRX process in 30CrNiMoVW alloy, demonstrating superior accuracy in characterizing microstructural evolution compared to conventional methods [24]. From the application examples of CA mentioned above, it can be found that CA has been more fully expanded to meet the requirements of microstructure simulating for different metals or alloys, including incorporating VPSC, FEM, etc. The presence of the second-phase (SP) particles is usually ignored during the CA simulation in regard to different metals or alloys, and a CA model considering the influence of SP particles is rarely reported. In actuality, the morphology, size, and distribution of SP particles have a significant impact on the evolution behavior of the microstructure during the plastic deformation of steel [25,26,27,28].
Based on the background stated above, a typical kind of Cr-Ni steel is selected as the investigated target, and an SP-CA model related to DRX is explored to study the influence of the pinning effect induced by SP particles on the DRX behavior of the studied Cr-Ni steel, including the nucleation and grain growth. The investigation in this study is expected to provide valuable insight for the deeper exploration of the microstructure evolution behavior related to DRX in regard to the studied 45CrNi steel, and it can further act as a significant reference for regulating the composition design or thermo-mechanical processing in regard to different metals or alloys.

2. Experimental Procedure

2.1. Materials and Experimental Procedure

The material chosen for this study was 45CrNi steel, with its chemical constitution presented in Table 1. A bar with a dimension of Φ160 mm treated by a continuous casting and continuous rolling process was firstly prepared, and the rod was sectioned into cylindrical specimens (Φ8 mm × 12 mm) using wire electrical discharge machining. All surfaces, including the two ends, were then ground and polished to achieve a mirror-like finish. The compression tests were performed on a Gleeble-3800D thermo-mechanical simulator (Dynamic Systems Inc., Poughkeepsie, NY, USA), and the specimens were heated uniformly to 1200 °C at a heating rate of 10 °C/s, followed by a 2 min isothermal hold. Afterward, the specimens were cooled uniformly at 10 °C/s to target deformation temperatures spanning 850–1200 °C. Then, a set of high-temperature compression tests were conducted at strain rates of 0.01, 0.1, and 1 s−1, with 50% deformation applied prior to rapid quenching, and the experimental workflow is illustrated in Figure 1a. The sample assembly diagram during the experiment is shown in Figure 1b. Since the high hardenability of the studied 45CrNi steel was induced by the addition of a series of alloying elements including C, Mn, Cr, Ni, etc., the final transformation product was confirmed to be martensite after a treatment of hot compression followed by water quenching, and the size of morphology of the parent austenite during hot deformation could be retained at ambient temperature, which could provide favorable conditions for investigating the DRX behavior of the studied 45CrNi steel during the hot deformation process. After the compression experiment, metallographic images of the specimens were obtained following etching with a trinitrophenol solution, and the true stress–true strain responses of the investigated steel under uniaxial compression were recorded for subsequent data analysis.

2.2. Microstructural Characterization

To investigate the microstructure of the pressed sample and the post-deformation specimen, slicing was carried out on planes parallel to the applied compressive stress. Microstructural analysis was conducted using an optical microscope (OM, Beijing PRECISE Instrument Co., Ltd., Beijing, China) after mechanical grinding and chemical attack. In a similar approach, Electron Backscatter Diffraction (EBSD)-enabled field-emission scanning electron microscopy was employed to determine the microstructural crystallography, and the voltage, collection speed, and the scanning step for EBSD detection were selected as 20 kV, 199 Hz, and 0.85 μm, respectively. Finally, the post-processing phase was subsequently analyzed and processed employing the Aztec Crystal 3.3 software platform.

3. Results and Discussion

3.1. The Analysis of the True Stress–Strain Curve After Friction and Temperature Correction

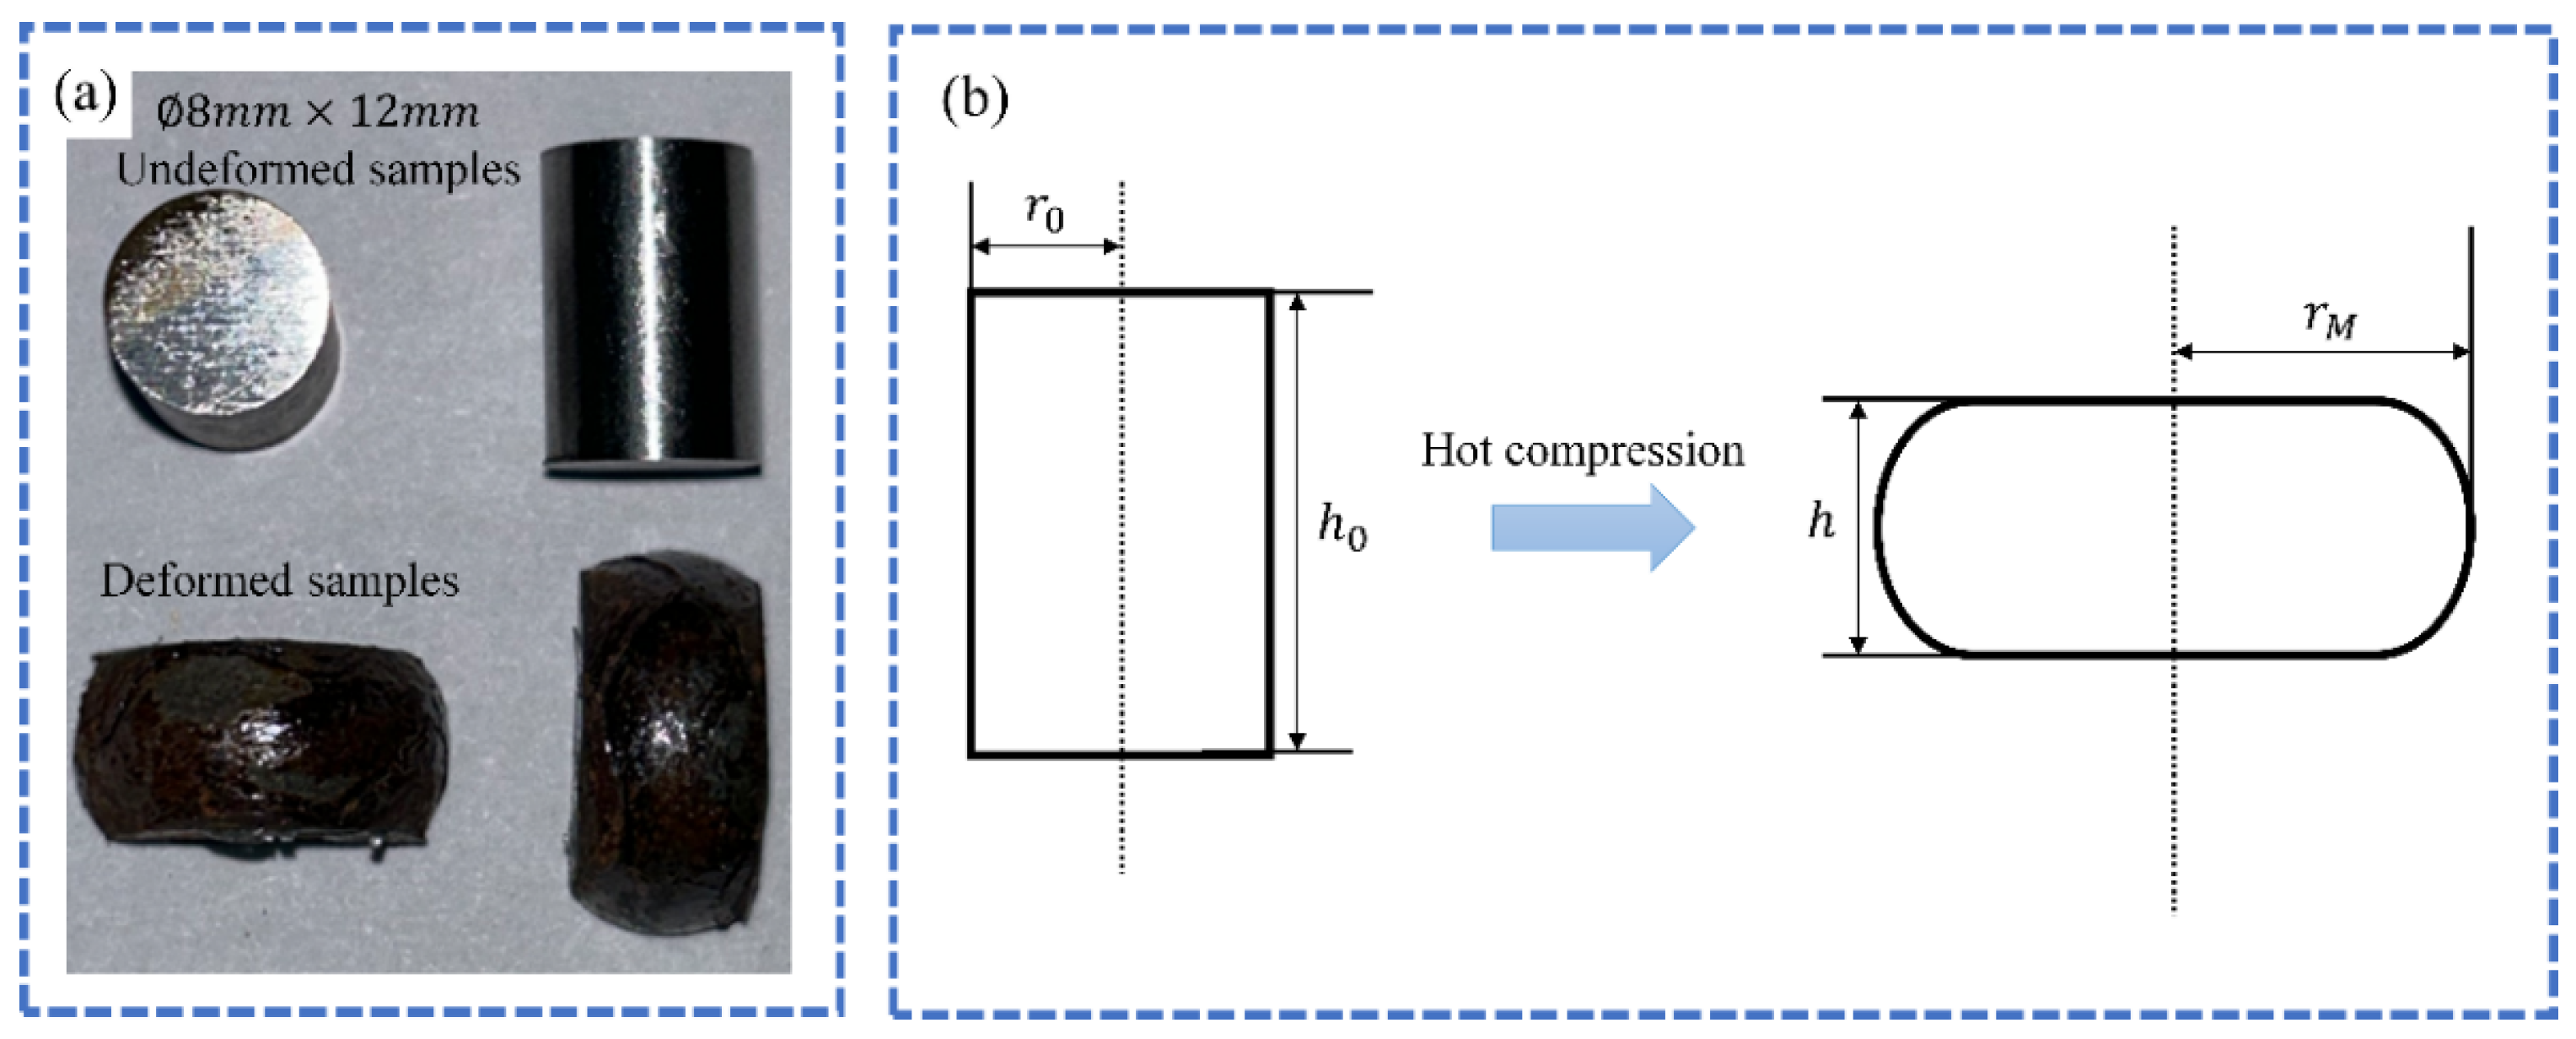
During the compression process, there is friction between the specimen and the clamp, resulting in the deformation of the specimen into a drum shape. Typical photos and schematic diagrams of the compressed specimen are shown in Figure 2a,b, respectively. The drum-shaped coefficient B can be calculated using Equation (1).
B = h r M 2 h 0 r 0 2
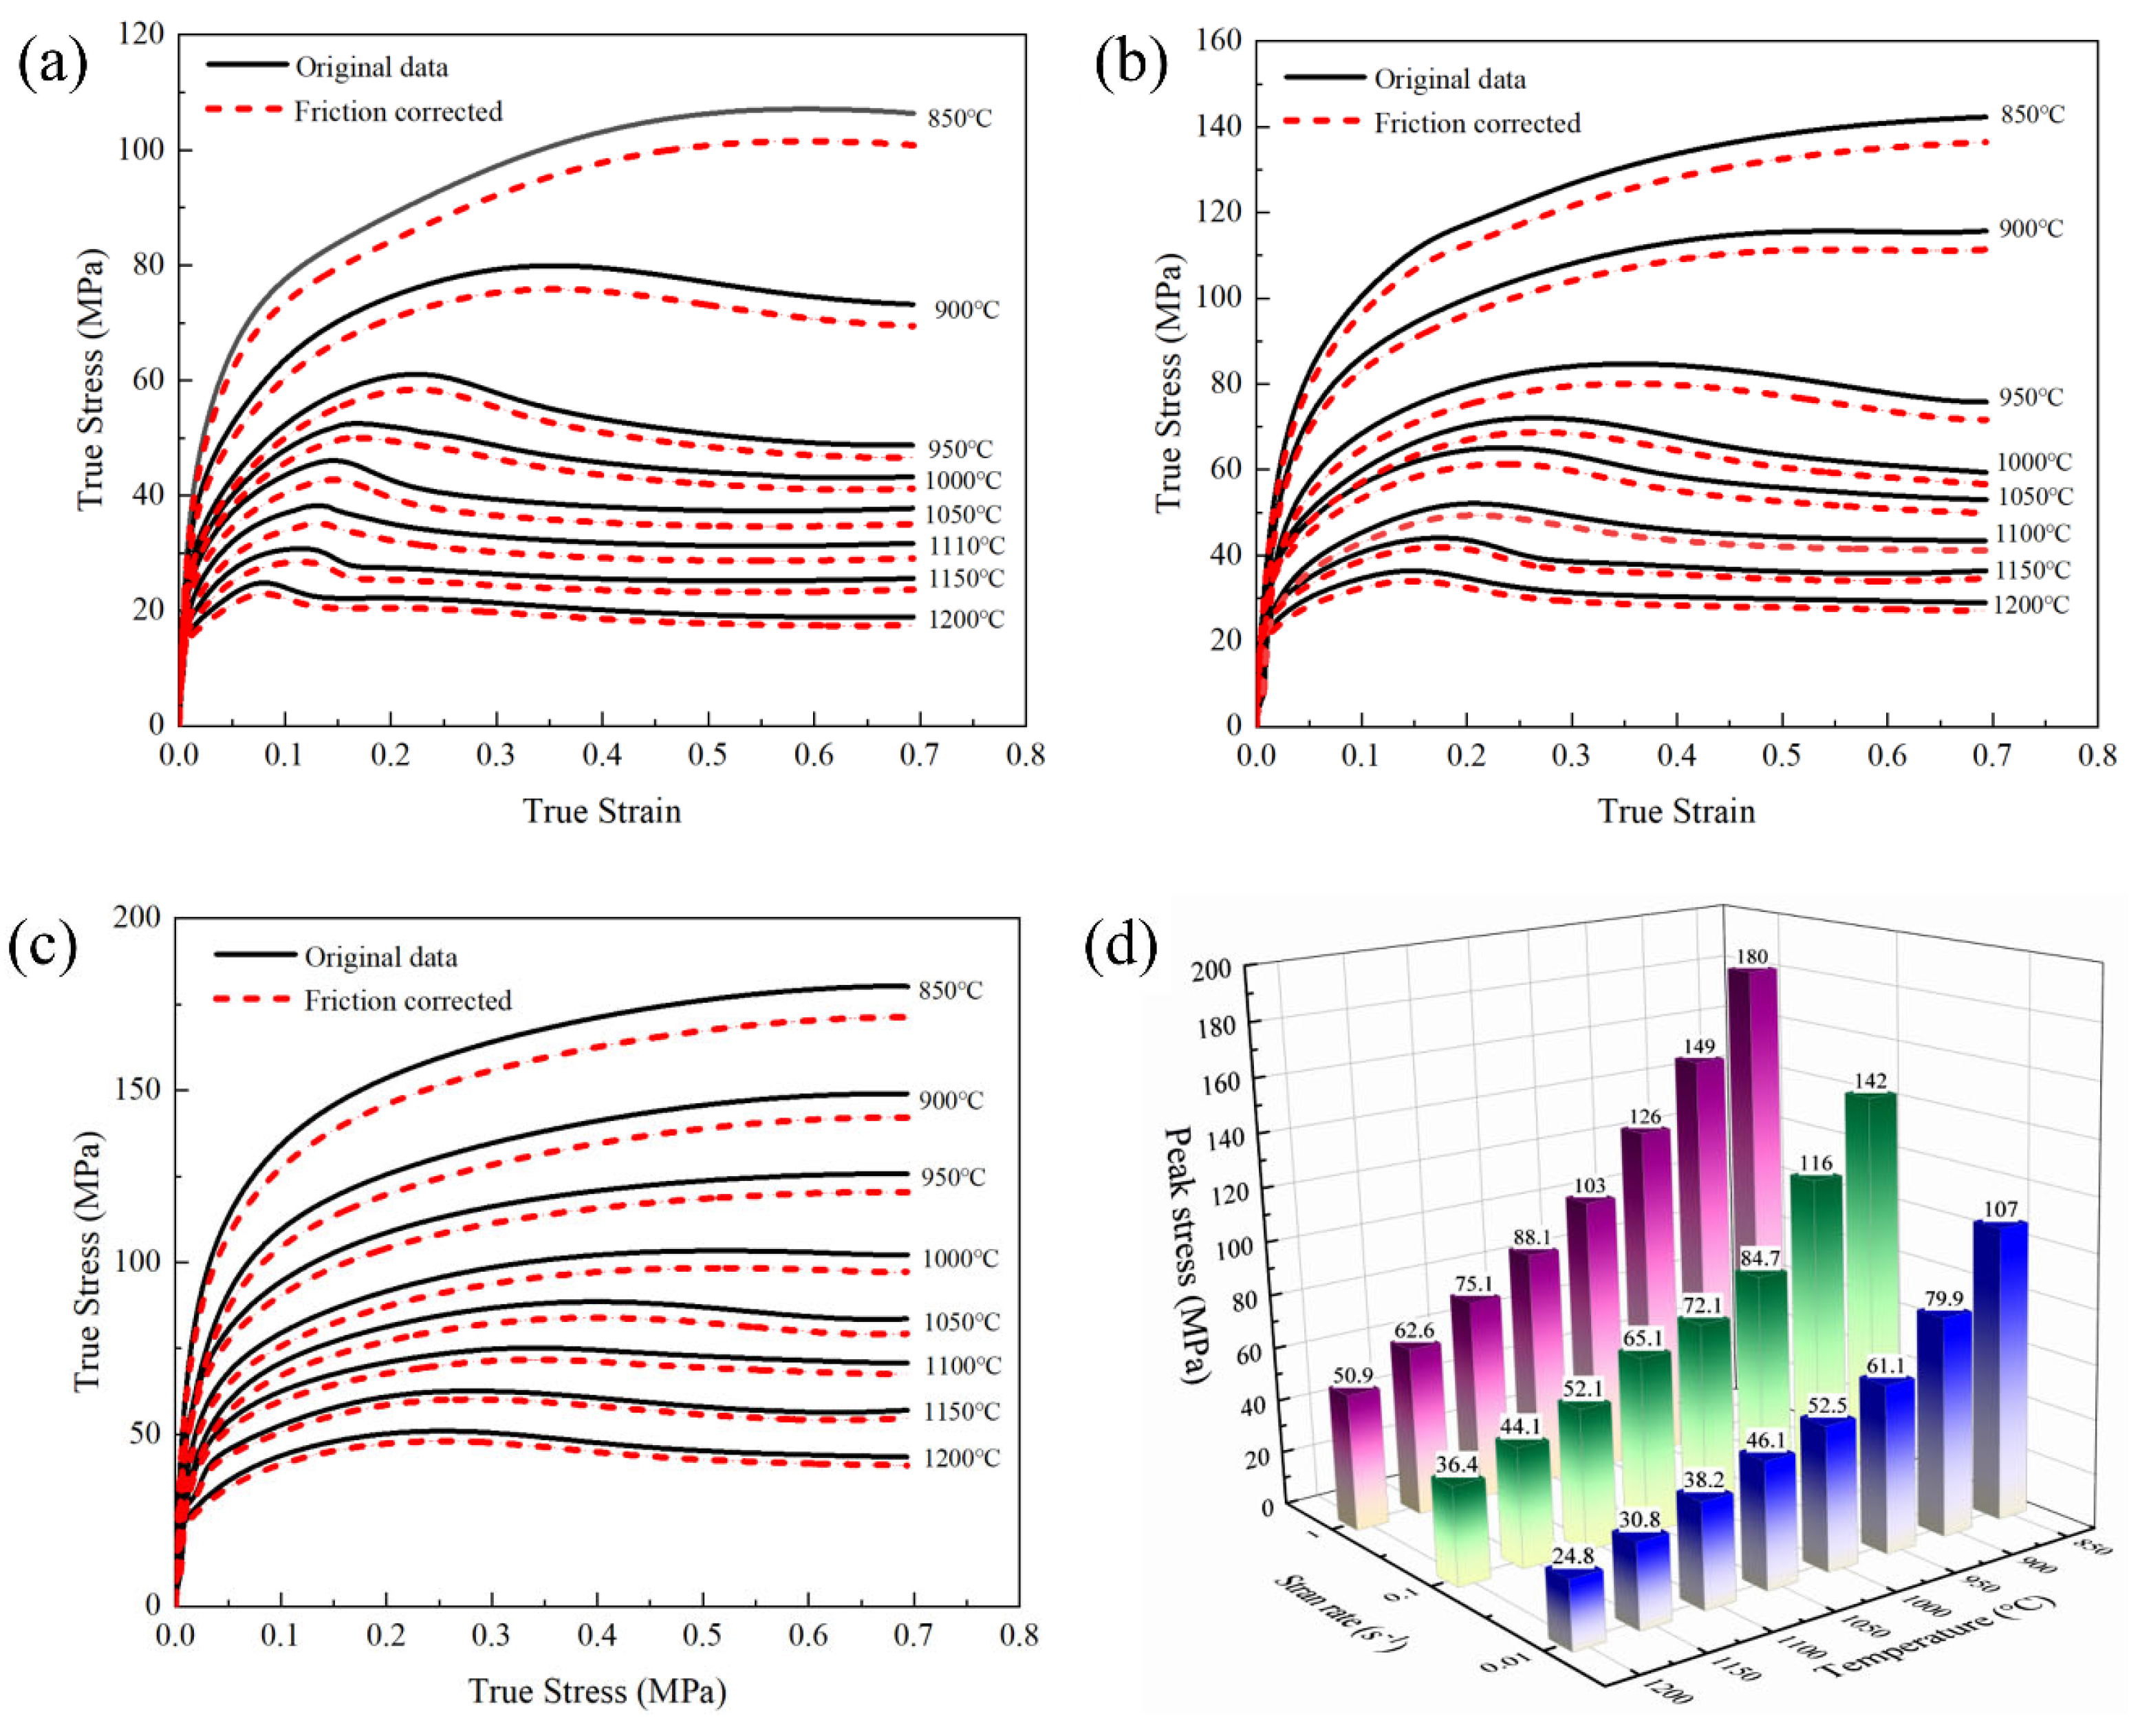
where h 0 and r 0 are the height and radius of the sample before compression, respectively. h, r M represents the actual height and maximum radius of the compressed sample, respectively. When 1.0 B 1.1 , it indicates that friction has little effect on flow stress. When B > 1.1 , friction correction is required for the true stress–strain curve [29,30,31,32]. After calculation, the B values of the studied 45CrNi steel corresponding to different deformation conditions in the compression experiment are shown in Table 2. From Table 2, it can be seen that the drum-shaped coefficient B values within the deformation range are almost greater than 1.1, and some small drum-shaped coefficients are also close to 1.1. Therefore, it is necessary to correct the flow stress values of the samples. In this study, the principle proposed by EBRAHIMI R et al. [30,33] is utilized for friction correction, and the relevant equations are depicted in Equations (2)–(6).
σ f = σ 1 + ( 2 / 3 3 ) f ( r 0 / h 0 ) e x p ( 3 ε / 2 )
f = ( r / h ) b ( 4 / 3 ) ( 2 b / 3 3 )
b = 4 r r h h
r = r 0 h 0 h
r T = 3 h 0 h r 0 2 2 r M 2
where σ f is the corrected flow stress, σ is the measured flow stress, ε is the measured strain, f is the friction factor, b is the barreling parameter, h and r are the height and average radius of the deformed cylinder, h and r are the decrease in height of the deformed cylinder and the difference between the maximum radius and the top radius of the deformed cylinder, respectively, and r T is the top radius of the compressed sample.
The flow stress curve and friction-corrected curve of 45CrNi steel are shown in Figure 3. It can be seen that, during the entire compression process of the sample, the friction-adjusted flow stress is reduced relative to the initial flow stress, and the difference between the two flow stress curves varies with the change in strain. In the early phase of deformation, a lubricant is coated between both extremities of the sample and the interfaces of the indenter and substrate, and friction remains minimal due to the limited contact zone, leading to a negligible disparity between uncorrected and corrected true stress. Under escalating strain, the interfacial area between the specimen extremities and the indenter gradually increases, amplifying friction-induced effects on flow stress and thereby elevating the corresponding deviation. After friction compensation, the flow stress curves show that the role of friction in flow stress becomes increasingly dominant as temperature declines or strain rate rises.
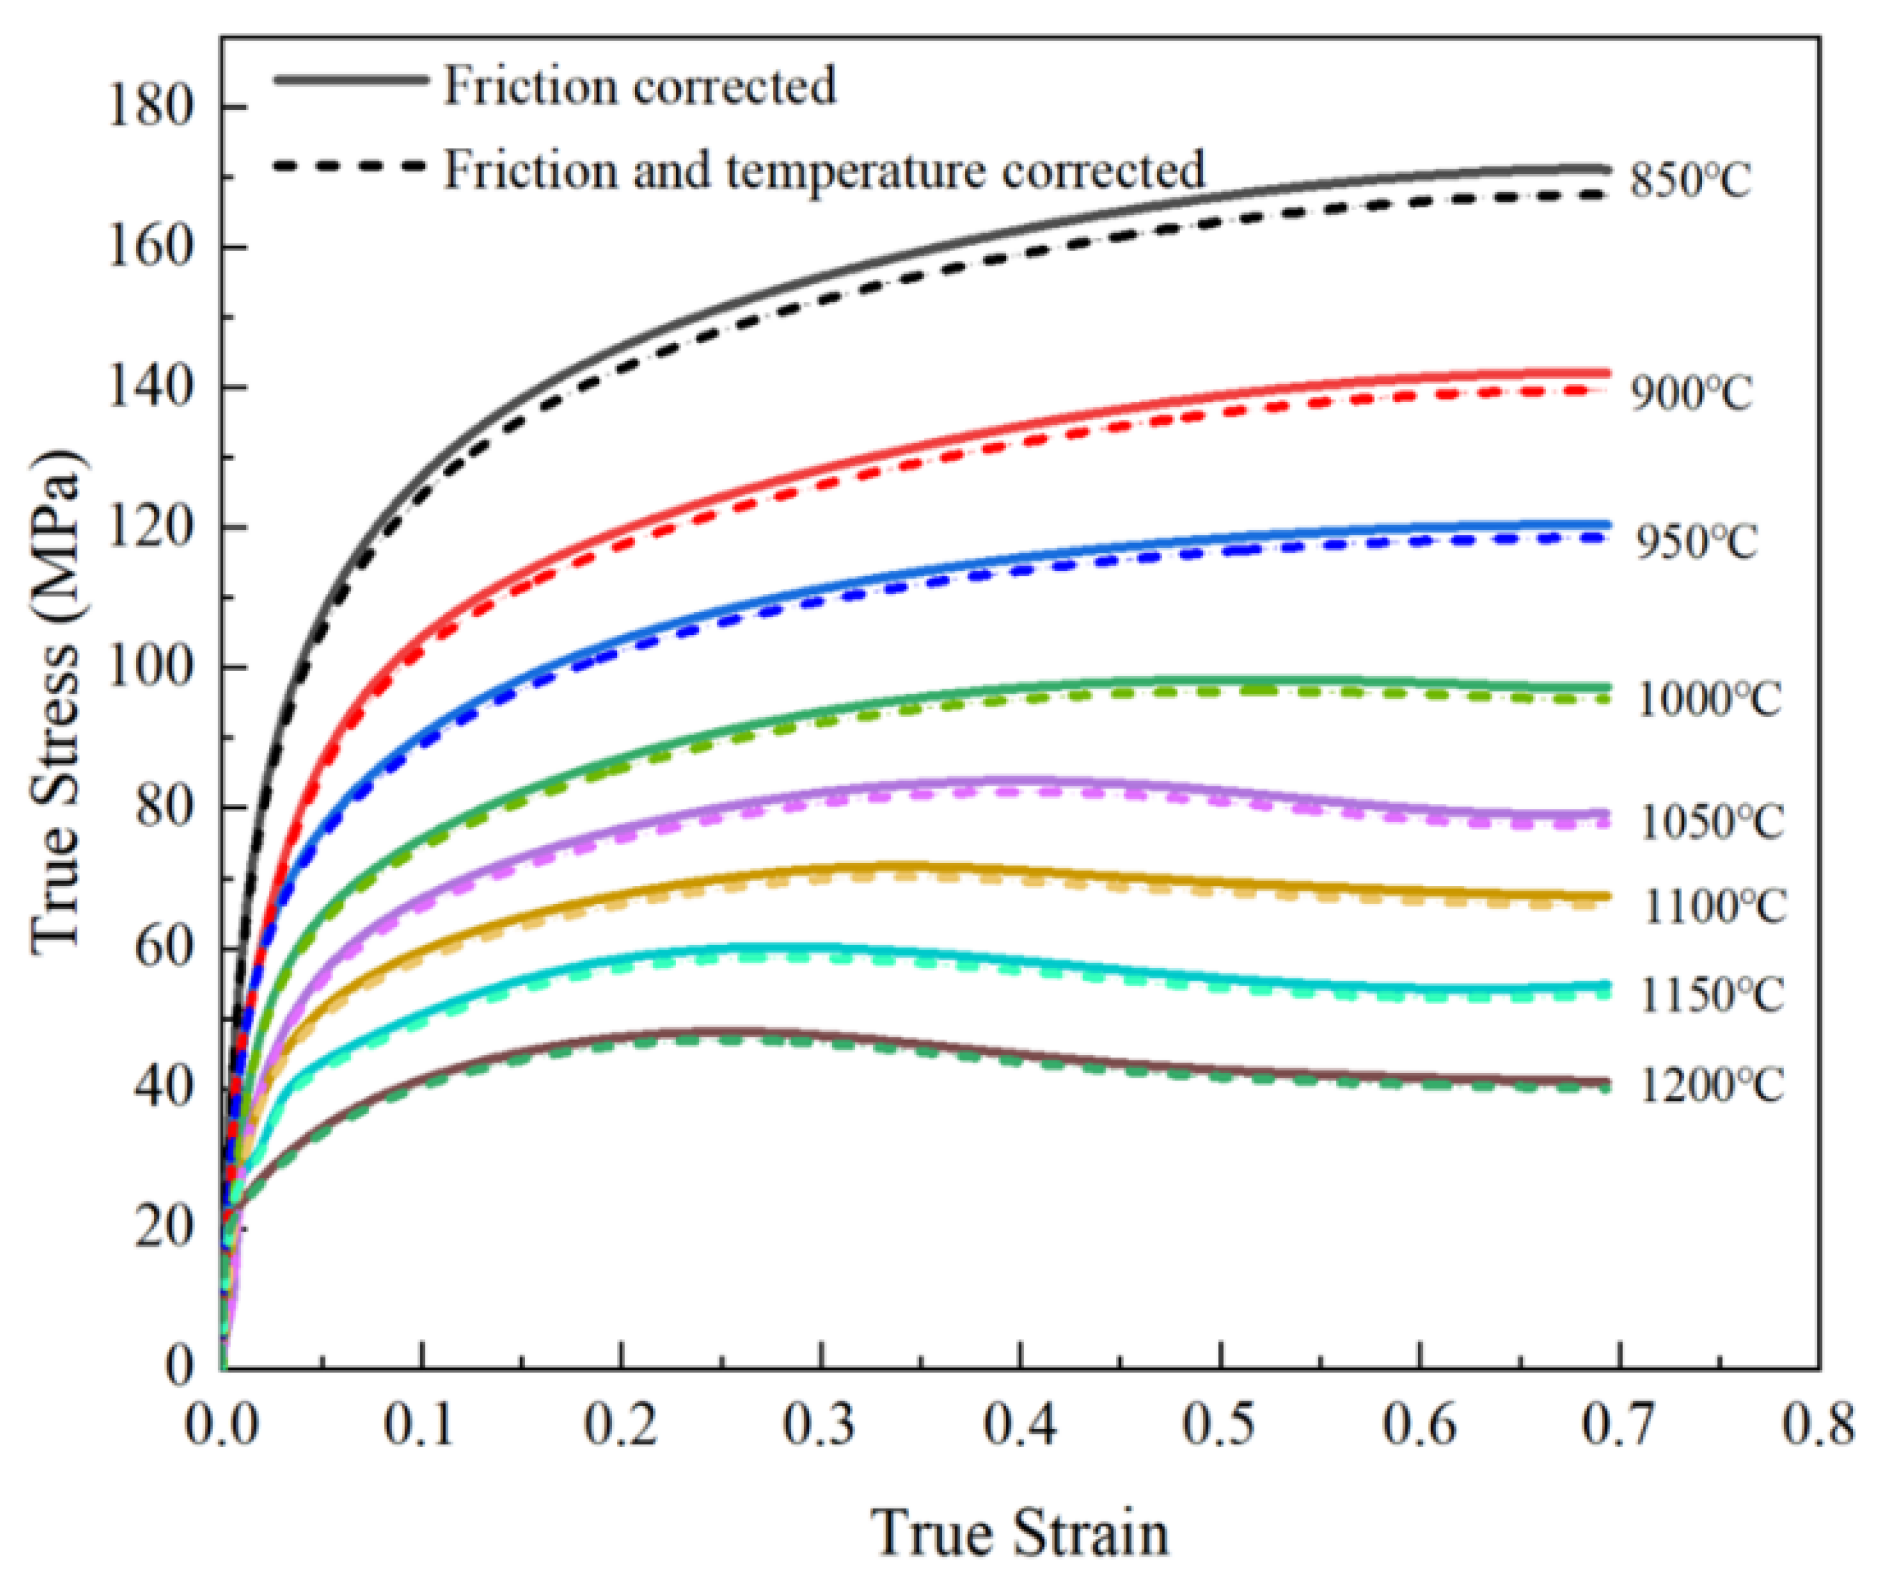
When the compression speed of the sample is fast during hot compression, the heat generated by plastic deformation often cannot be dissipated in time, resulting in the sample heating up, that is, the adiabatic temperature rise effect, and the actual deformation temperature is higher compared to the set temperature. When the strain rate is low below 1 s−1, the effect of adiabatic temperature rise can be ignored, but this effect is more pronounced at high strain rates [30,31,34]. So, it is necessary to perform temperature correction on the flow stress curve. In this study, a temperature rise formula combined with interpolation is further used to perform temperature correction on the flow stress curve after friction correction.
T = 0.95 η ρ C p 0 ε σ d ε
where T represents the temperature change, η is the adiabatic correction coefficient, and the value of η is related to the strain rate. When ε ˙ 0.001   s 1 , η = 0 . When ε ˙ 1 0   s 1 , η = 1 . When 0.001   s 1 < ε ˙ < 10   s 1 , η = 0.25 lg ε ˙ + 0.75 . ρ is the material density, and C p is the specific heat capacity. 0 ε σ d ε is the mechanical work, where the ρ of the studied 45CrNi steel is 7.85   g · c m 3 and the C p is 0.46   J · ( g · K ) 1 .
The area below the flow stress curve after friction correction is taken for additional calculation in this study. Based on the calculated results of temperature rise, the corresponding flow stresses under different deformation conditions are interpolated, and then the temperature correction on the friction-corrected true stress–strain curve is performed. The true stress–strain curves with strain rates of 1 s−1, after friction correction and temperature correction, are shown in Figure 4. From Figure 4, it can be determined that the difference in stress is decreased with increase in deformation temperature at a constant strain rate, and the higher the temperature, the easier it is to deform and the less likely it is to generate deformation heat. Correspondingly, the smaller the temperature rise, the smaller the change in flow stress. The higher deformation heat generated cannot dissipate in time under the higher strain rate, resulting in a larger temperature rise and significant changes in flow stress.

3.2. Construction of Physical Model for 45CrNi Steel

The Arrhenius theory is applied to derive the constitutive relationship and DRX kinetic model of 45CrNi steel, and the specific construction process referred to the author’s previous research [35]. Since the basic physical models are required for the SP-CA model establishment, the constitutive equation and DRX kinetics equation reported in our previous research are adopted in this study, shown in Equations (8) and (9).
σ = 1 α ε l n Z ε A ε 1 n ε + Z ε A ε 2 n ε + 1 1 2 Z = ε ˙ exp Q a c t R T α = 0.0321 0.087 ε + 0.1893 ε 2 0.111 ε 3 0.122 ε 4 + 0.132 ε 5 β = 0.1145 0.265 ε + 0.4691 ε 2 + 1.0142 ε 3 3.324 ε 4 + 2.3213 ε 5 n = 5.8894 7.6941 ε + 39.132 ε 2 117.26 ε 3 + 163.947 ε 4 83.101 ε 5 Q = 537,361.9538 1,811,054.60 ε + 9,656,382.748 ε 2 2,678,050.55 ε 3 + 3,440,600.38 ε 4 1,631,450 . 61 ε 5 ln A = 59.35415 230.9664 ε + 1266.727 ε 2 3508.369 ε 3 + 4448.391 ε 4 2067.438 ε 5 ε ˙ = 2.489 × 10 13 [ S i n h ( 0.015 σ p ) ] 4.81 e x p ( 361,246 T R )
X d = 0 0 ε ε c X d = 1 e x p 1.952 ε ε c ε 0.5 1.055 ( ε > ε c ) ε 0.5 = 0.00156 ε ˙ 0.172 exp 63,669.4 R T

3.3. DRX Theoretical Model of CA

In this study, the models for dislocation density, nucleation, and grain growth employed in the cellular automata (CA) approach, as well as the four widely accepted assumptions for streamlining simulations and analysis, are thoroughly detailed in our prior research [35]. For the studied 45CrNi steel, the SP particles, including the precipitations induced by strain or the thermodynamic equilibrium condition, could pin the austenitic Grain Boundary (GBs) at elevated temperatures, inhibiting the migration of recrystallized austenitic GBs and thereby suppressing the growth of recrystallized grains [36,37,38,39,40]. Hence, the influence of SP particles on DRX should be considered. When GB migration encounters SP particles, the pinning force exerted on the boundary migration is denoted as Pzener, following Equation [41,42,43]:
P z e n e r = 2.6 γ i f v 0.92 r s p
where γ i denotes the surface energy, f v is the volumetric fraction of the SP precipitates, and r s p represents the mean particle radius of the SP precipitates, as represented by the equation below:
f ( i z e n e r ) = τ ρ m ρ i 2 γ i d i 2.6 γ i f v 0.92 r s p
From Equation (11), it is evident that the presence of SP reduces the driving force for recrystallized grain growth due to the decrease in SP size and the increase in SP volume fraction. V i can be expressed by the following equation:
V i = M f ( i z e n e r )
In this study, a two-dimensional numerical model consisting of square cells with the number of 500 × 500 , representing an actual area of 500   μ m × 500   μ m , is utilized to study the DRX progression in 45CrNi steel. The Von Neumann neighborhood rule is adopted in the model, and four dynamic parameters and four architectural variables are assigned for statistical purposes to each cell to depict grain evolution during hot deformation [35,44,45,46].
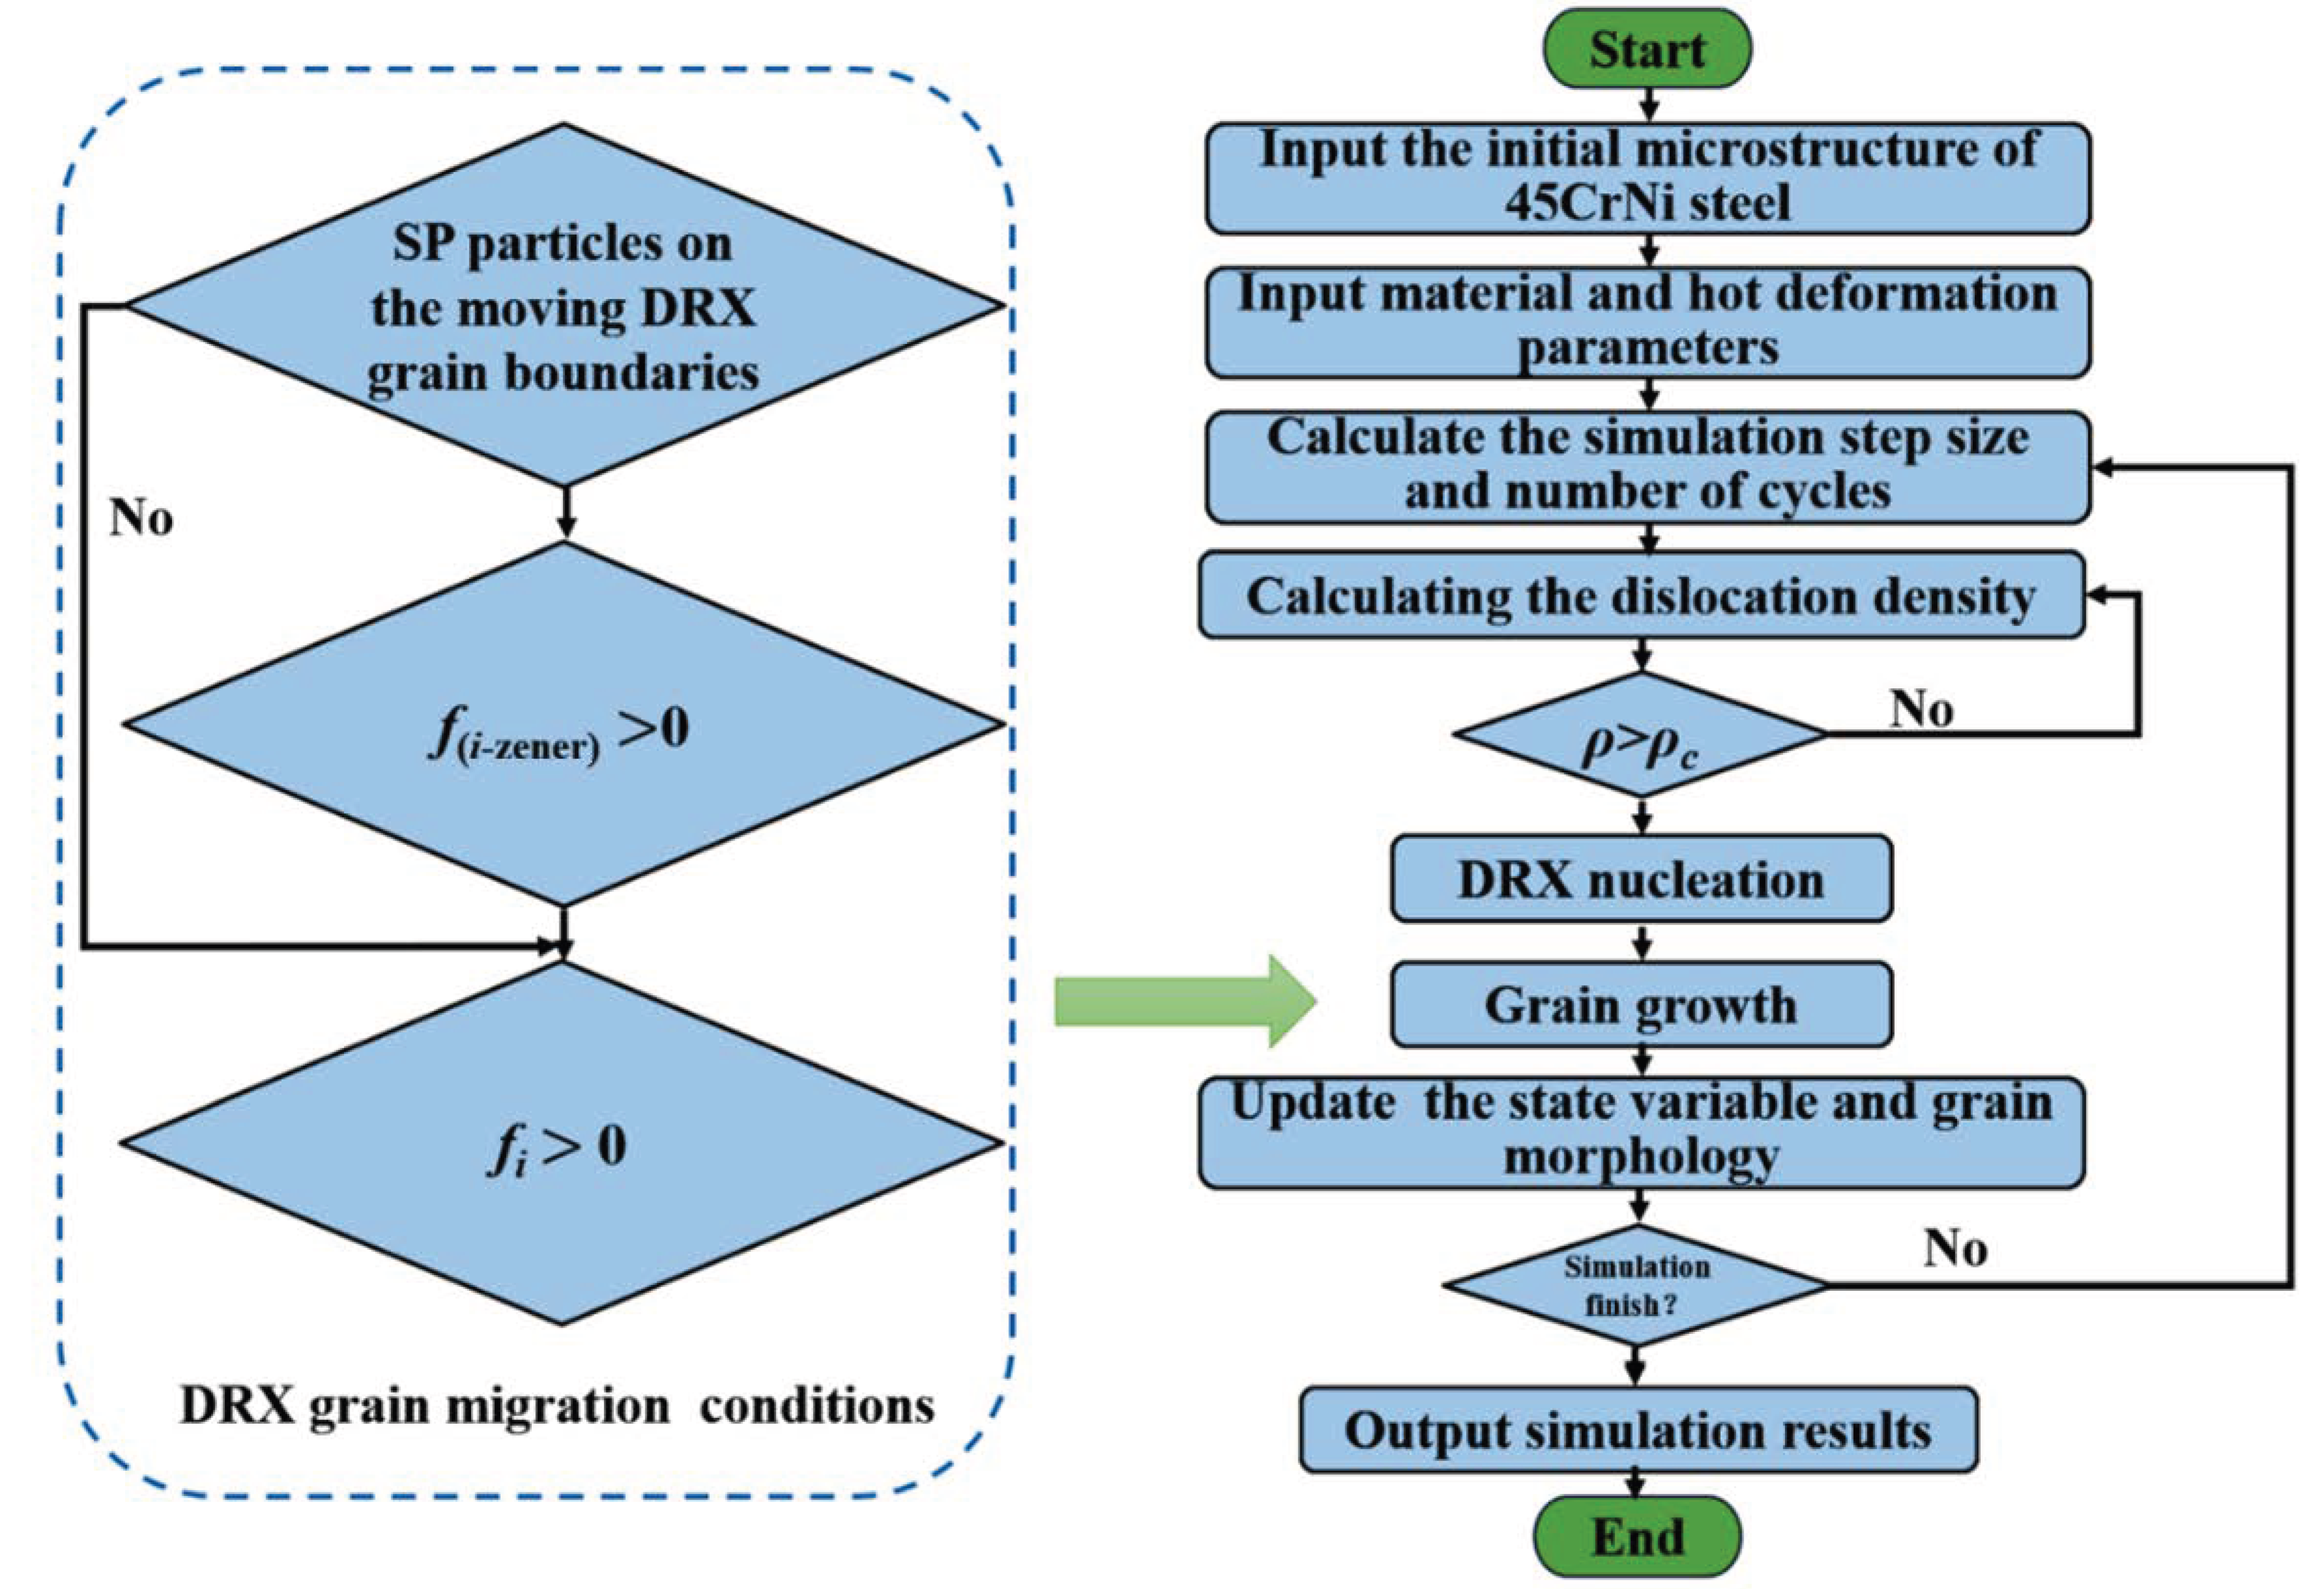
The optimized set of material parameters employed for the SP-CA simulation is presented in Table 3, and the flowchart of the SP-CA model is illustrated in Figure 5. Initially, the calculated results of the normal growth of austenitized grains and SP particles are used as the initial microstructure for the CA simulation. Then, the material parameters and hot deformation parameters are input into the model. The initiation and development of DRX are activated by the SP-CA model, which utilizes dislocation density to model microstructural changes during the hot deformation of 45CrNi steel. The core parameters associated with microstructural transformation and thermal processing, encompassing stress–strain plots, DRX extent, and mean crystallite dimensions, are computed by the CA framework. In addition, the MnS inclusions are the common second-phase particles in medium carbon alloy steel. This type of particle is usually formed by the combination of the residual S element in steel and the Mn element, and has extremely high thermal stability, with a dissolution temperature of up to 1610 °C. Therefore, MnS particles can exist stably throughout the entire hot deformation temperature range of 850–1200 °C and have a significant pinning effect on the grain boundaries, effectively suppressing austenite grain growth. Hence, the MnS inclusions distributed with the average size scale of 200 nm to 3000 nm and with a volume fraction less than 0.12% are adopted in the establishment of the SP-CA model in this study.
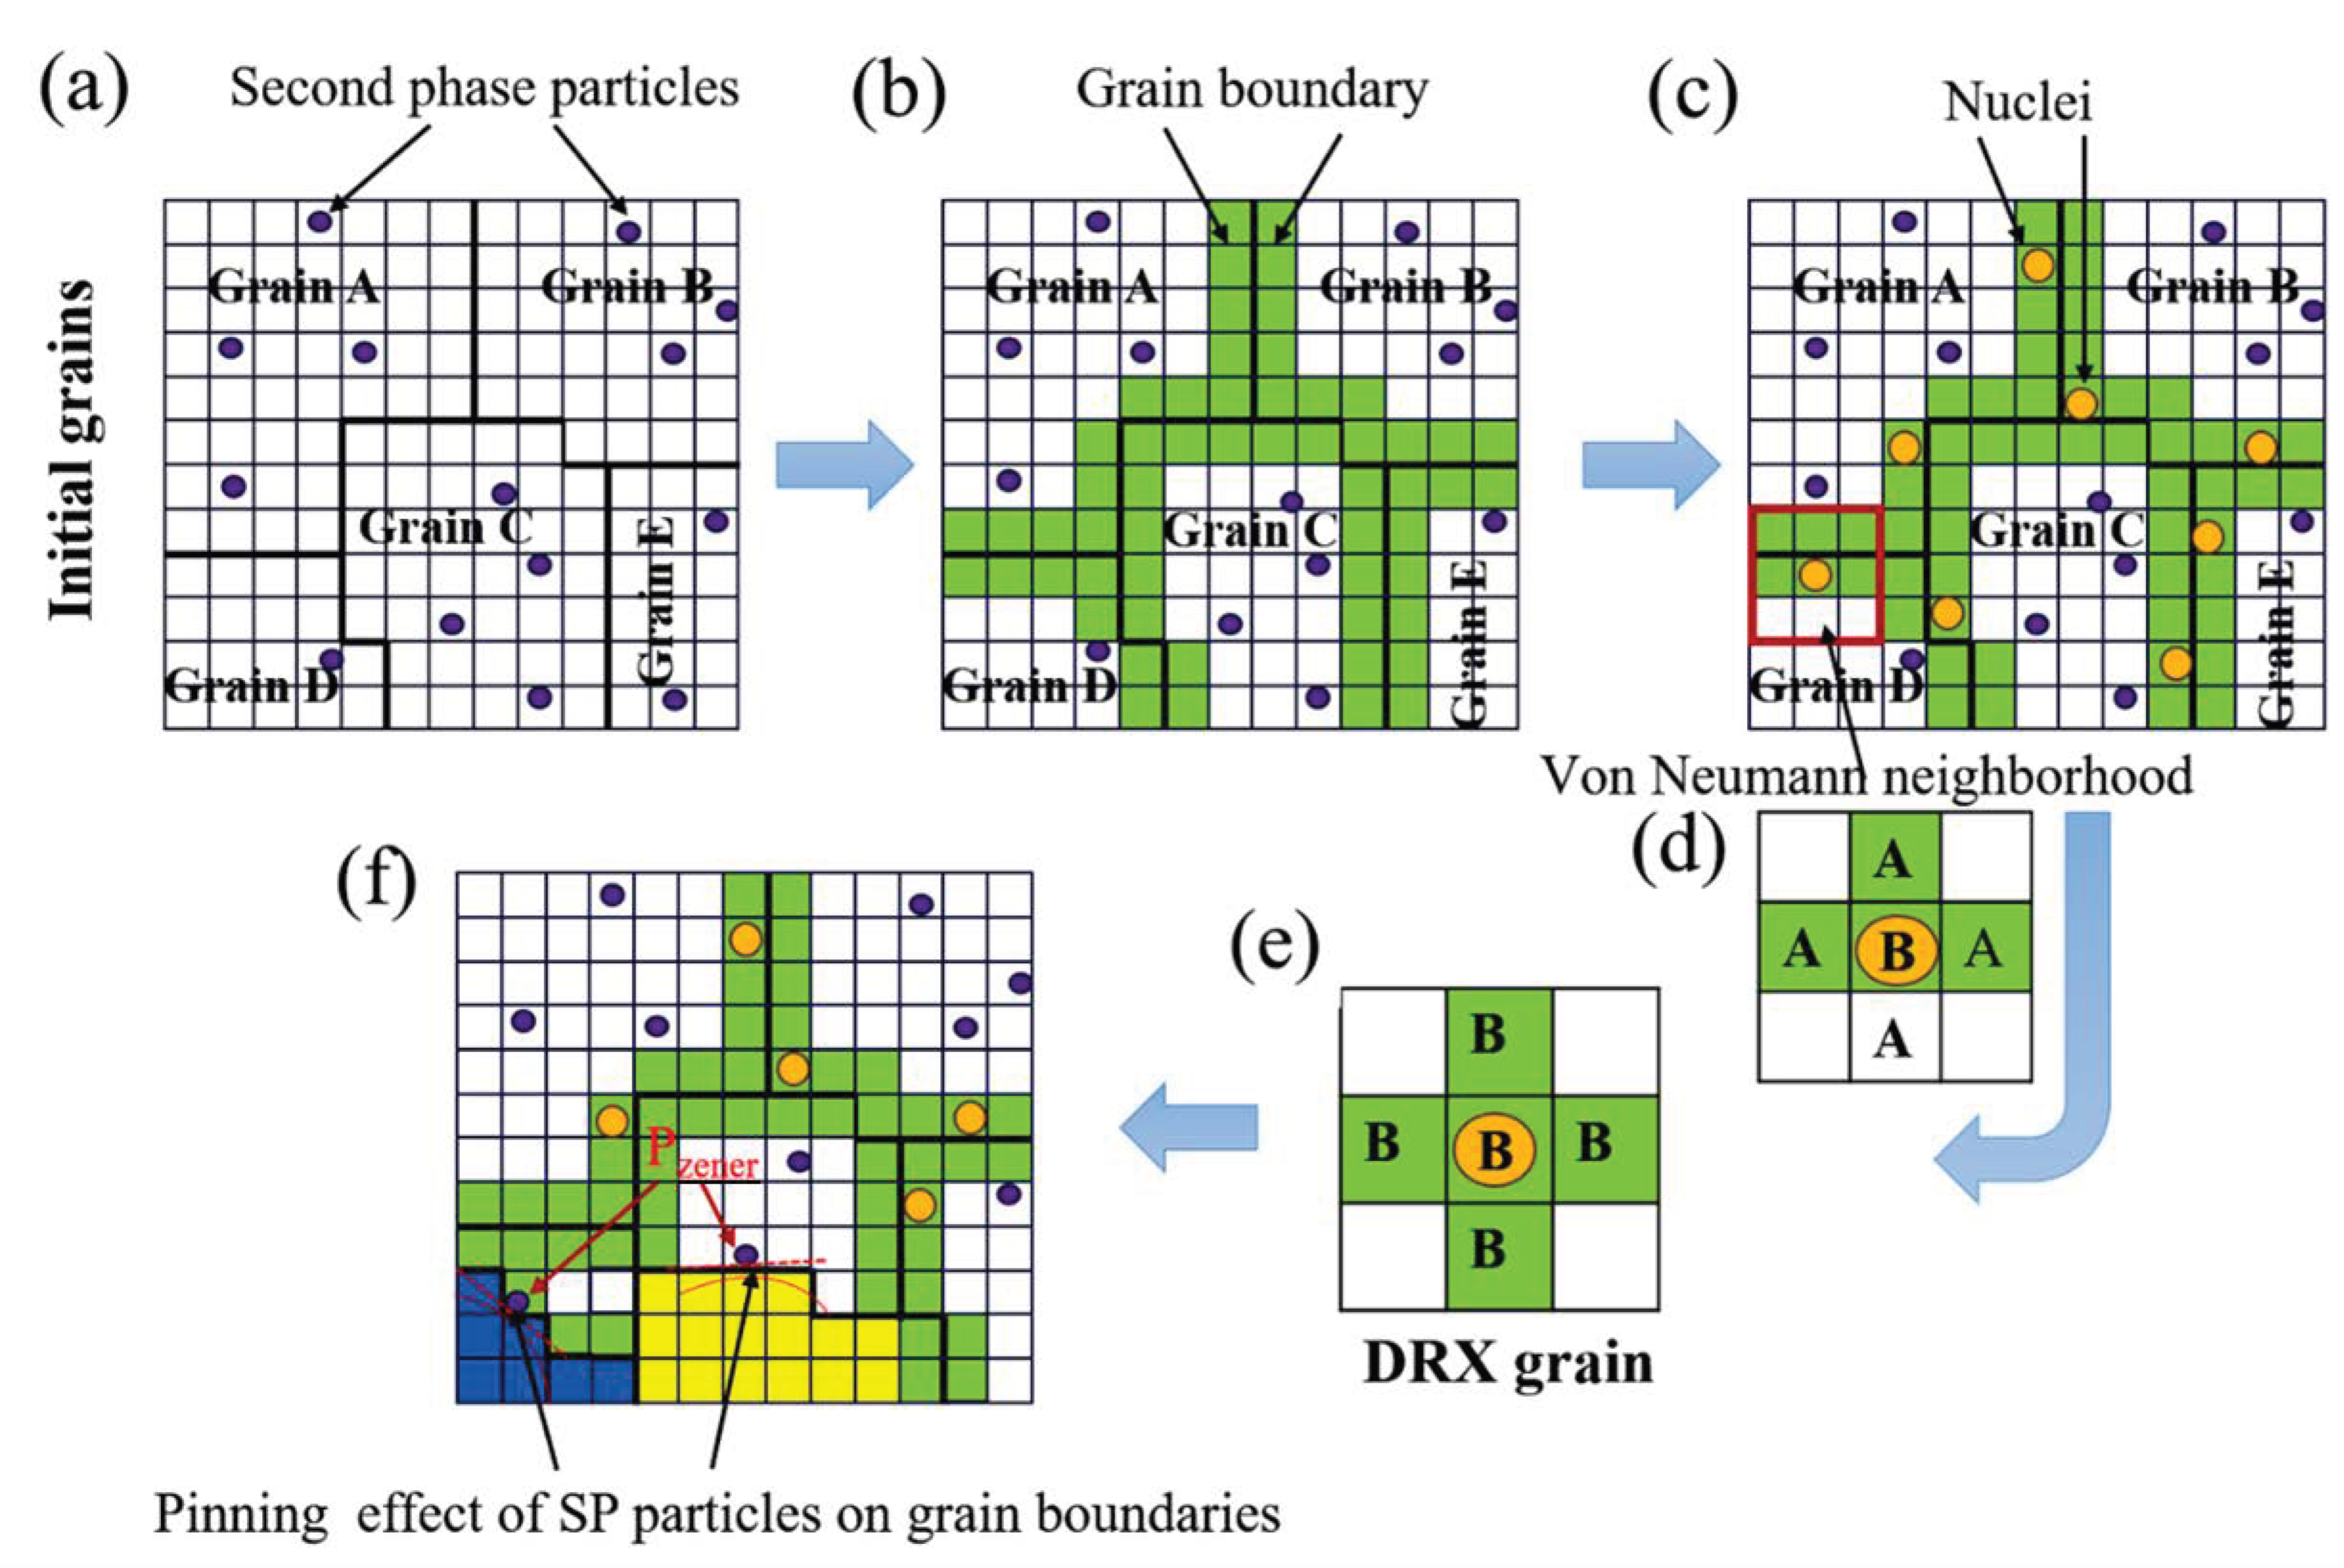
The schematic diagram of the SP-CA simulation process is shown in Figure 6. The original austenitized grains and the SP particles are shown in Figure 6a. When the dislocation density is increased to the critical dislocation density ρ c for DRX to occur, the cell space is firstly scanned, and then the grain boundary variables are updated as shown in Figure 6b. Once a cell satisfies the condition that the dislocation density is greater compared to the critical dislocation density for DRX, a cell becomes a recrystallized nucleus, which indicates the occurrence of DRX. In addition, the development process of the cell can be understood from Figure 6c,d. If the nuclei are located near the grain boundary as marked in the rectangle in Figure 6c, the grain boundary variable is numbered 1, and the cell adjacent to the nuclei should be regarded as a new nuclei through the Von Neumann neighborhood method. The number of the new nuclei cells should also increase by 1, and a random orientation should be assigned to the new nuclei. During the calculation, all the cells are scanned sequentially within each time step, and the cells that satisfy the four conditions for recrystallization state transition will undergo a state transition as shown in Figure 6d. The driving force f i could be achieved, and the condition of f i > 0 is regarded as the criteria to judge the probability of transition. Under the condition of meeting the transition rules and judgment criteria, the tagged cells A can undergo the transition to the recrystallized state numbered B, and the growth of recrystallized grains will be realized as shown in Figure 6e. During the growth of recrystallized grains, the SP particles can act as a pinning effect on the grain boundaries if the movement of the grain boundary encounters the SP particles, which inhibits the growth of recrystallized grains and promotes the formation of finer grain structure as shown in Figure 6f, and the driving force can be determined through Equation (11).
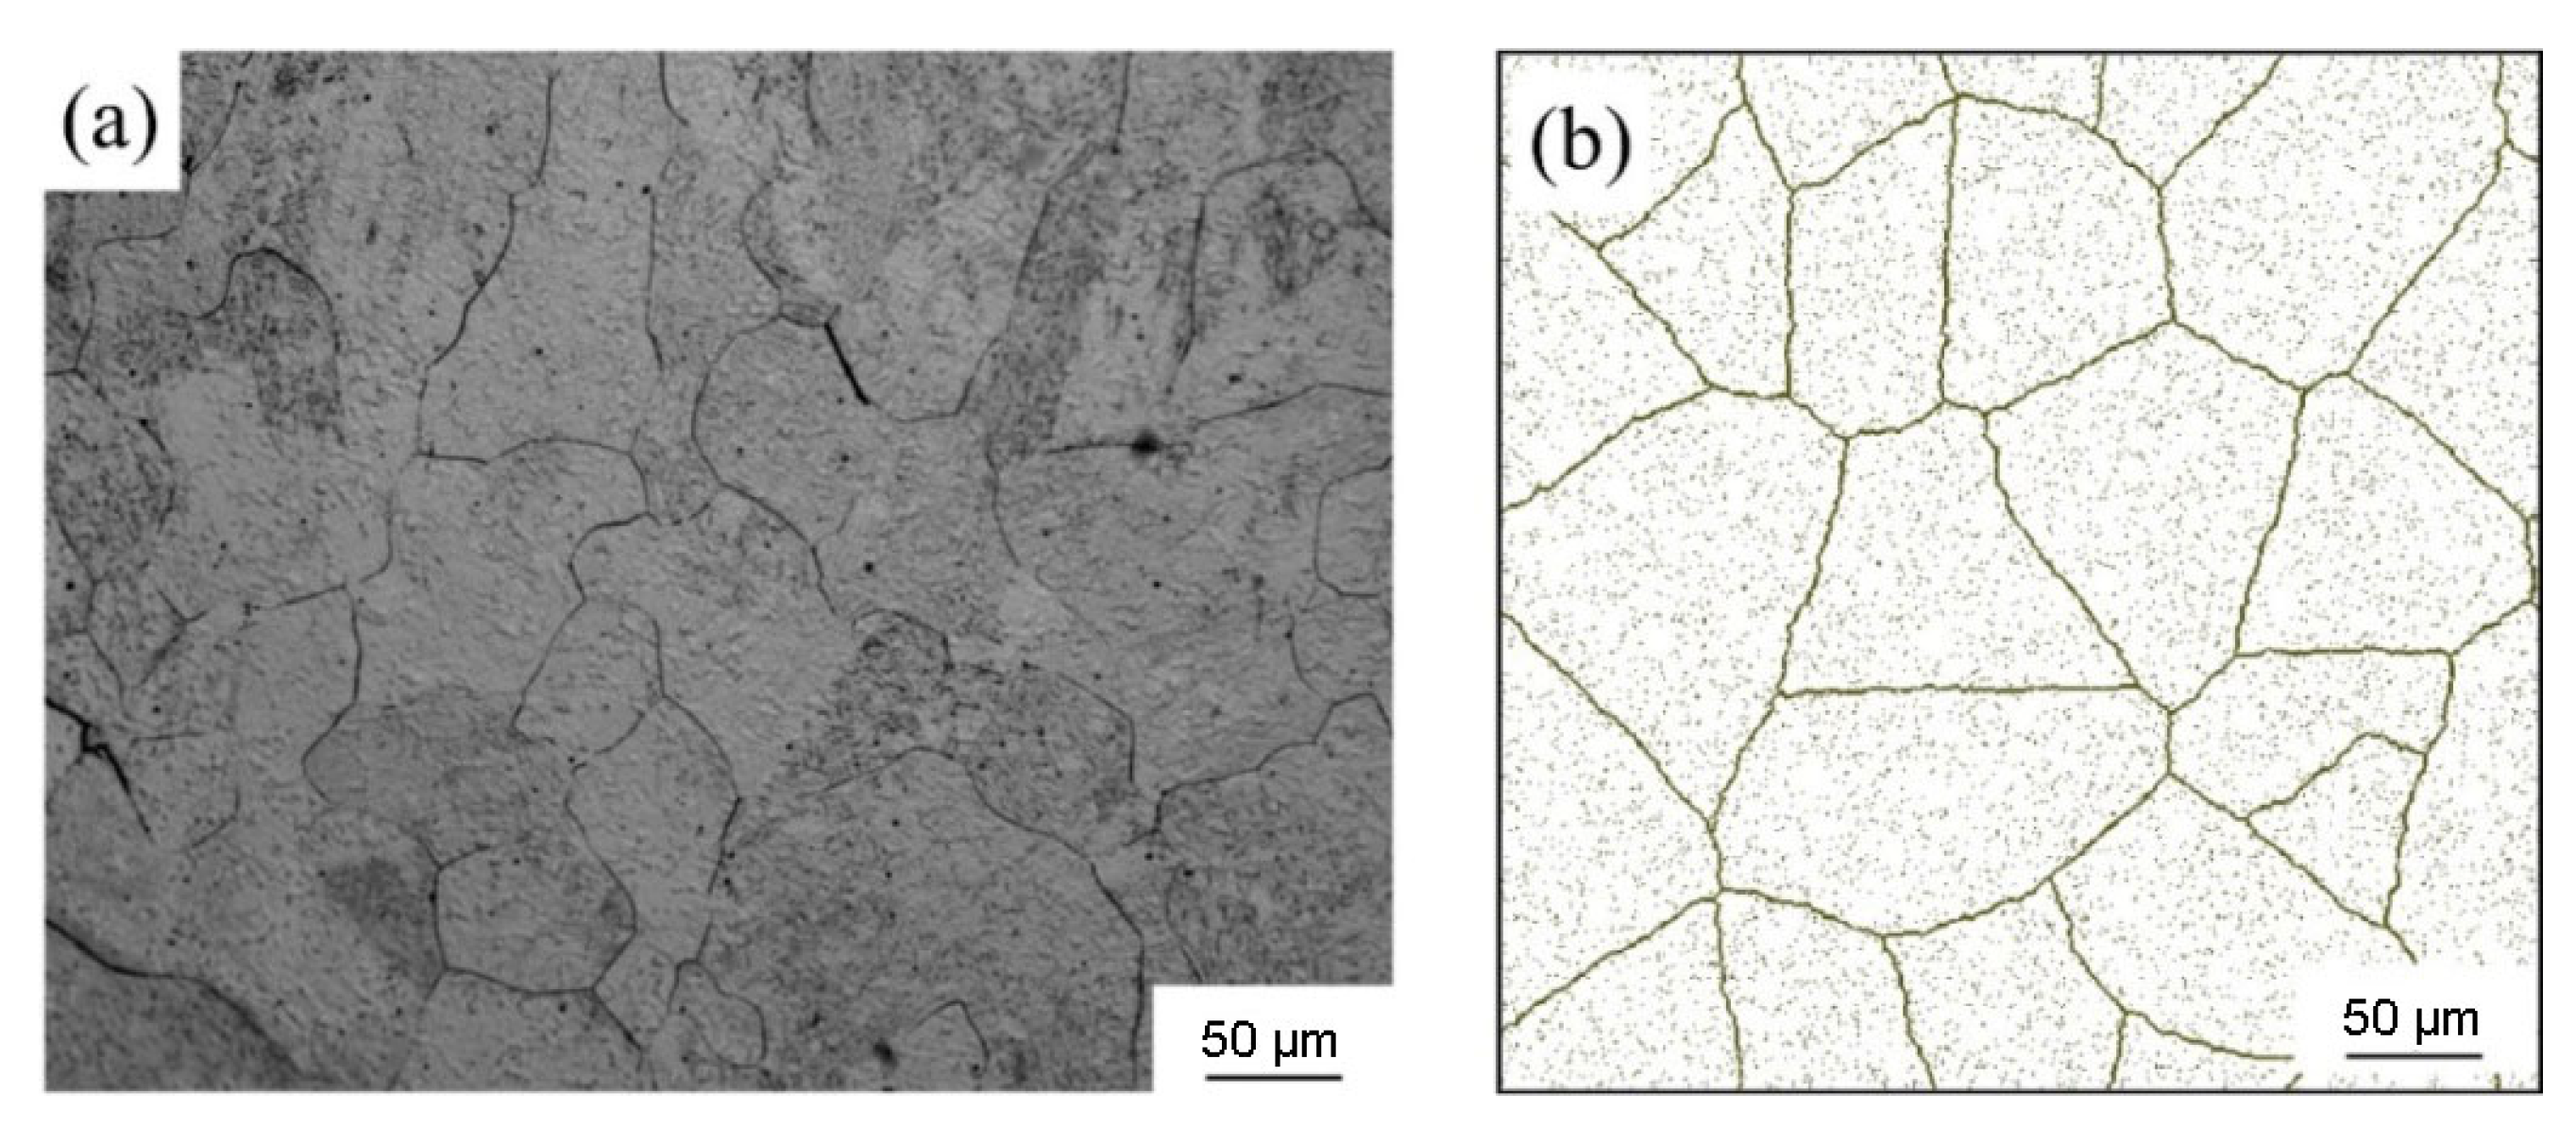
Figure 7 shows the initial austenite microstructure heated to 1200 °C and the corresponding initial austenite microstructure simulated by the SP-CA model. The black dots in Figure 7b represent SP particles. The average grain size of the experimentally measured initial austenite is determined to be approximately ~159.63 μm, while that of the initial austenite achieved through the SP-CA model is approximately ~163.24 μm. It could be confirmed that the SP-CA model’s predictions regarding austenite structure and grain size exhibit strong agreement with experimental data from the primary austenite. The SP-CA model in this study is primarily established based on the single-pass thermo-compression experiment, indicating the model is only applicable to investigating the microstructural evolution during DRX, but not to static recrystallization (SRX) conditions. The applicability of the CA method on the SRX conditions should be further considered from the perspective of recrystallization kinetics.

4. Experimental Results and Analysis

4.1. Simulation of DRX Behavior Utilizing SP-CA Method

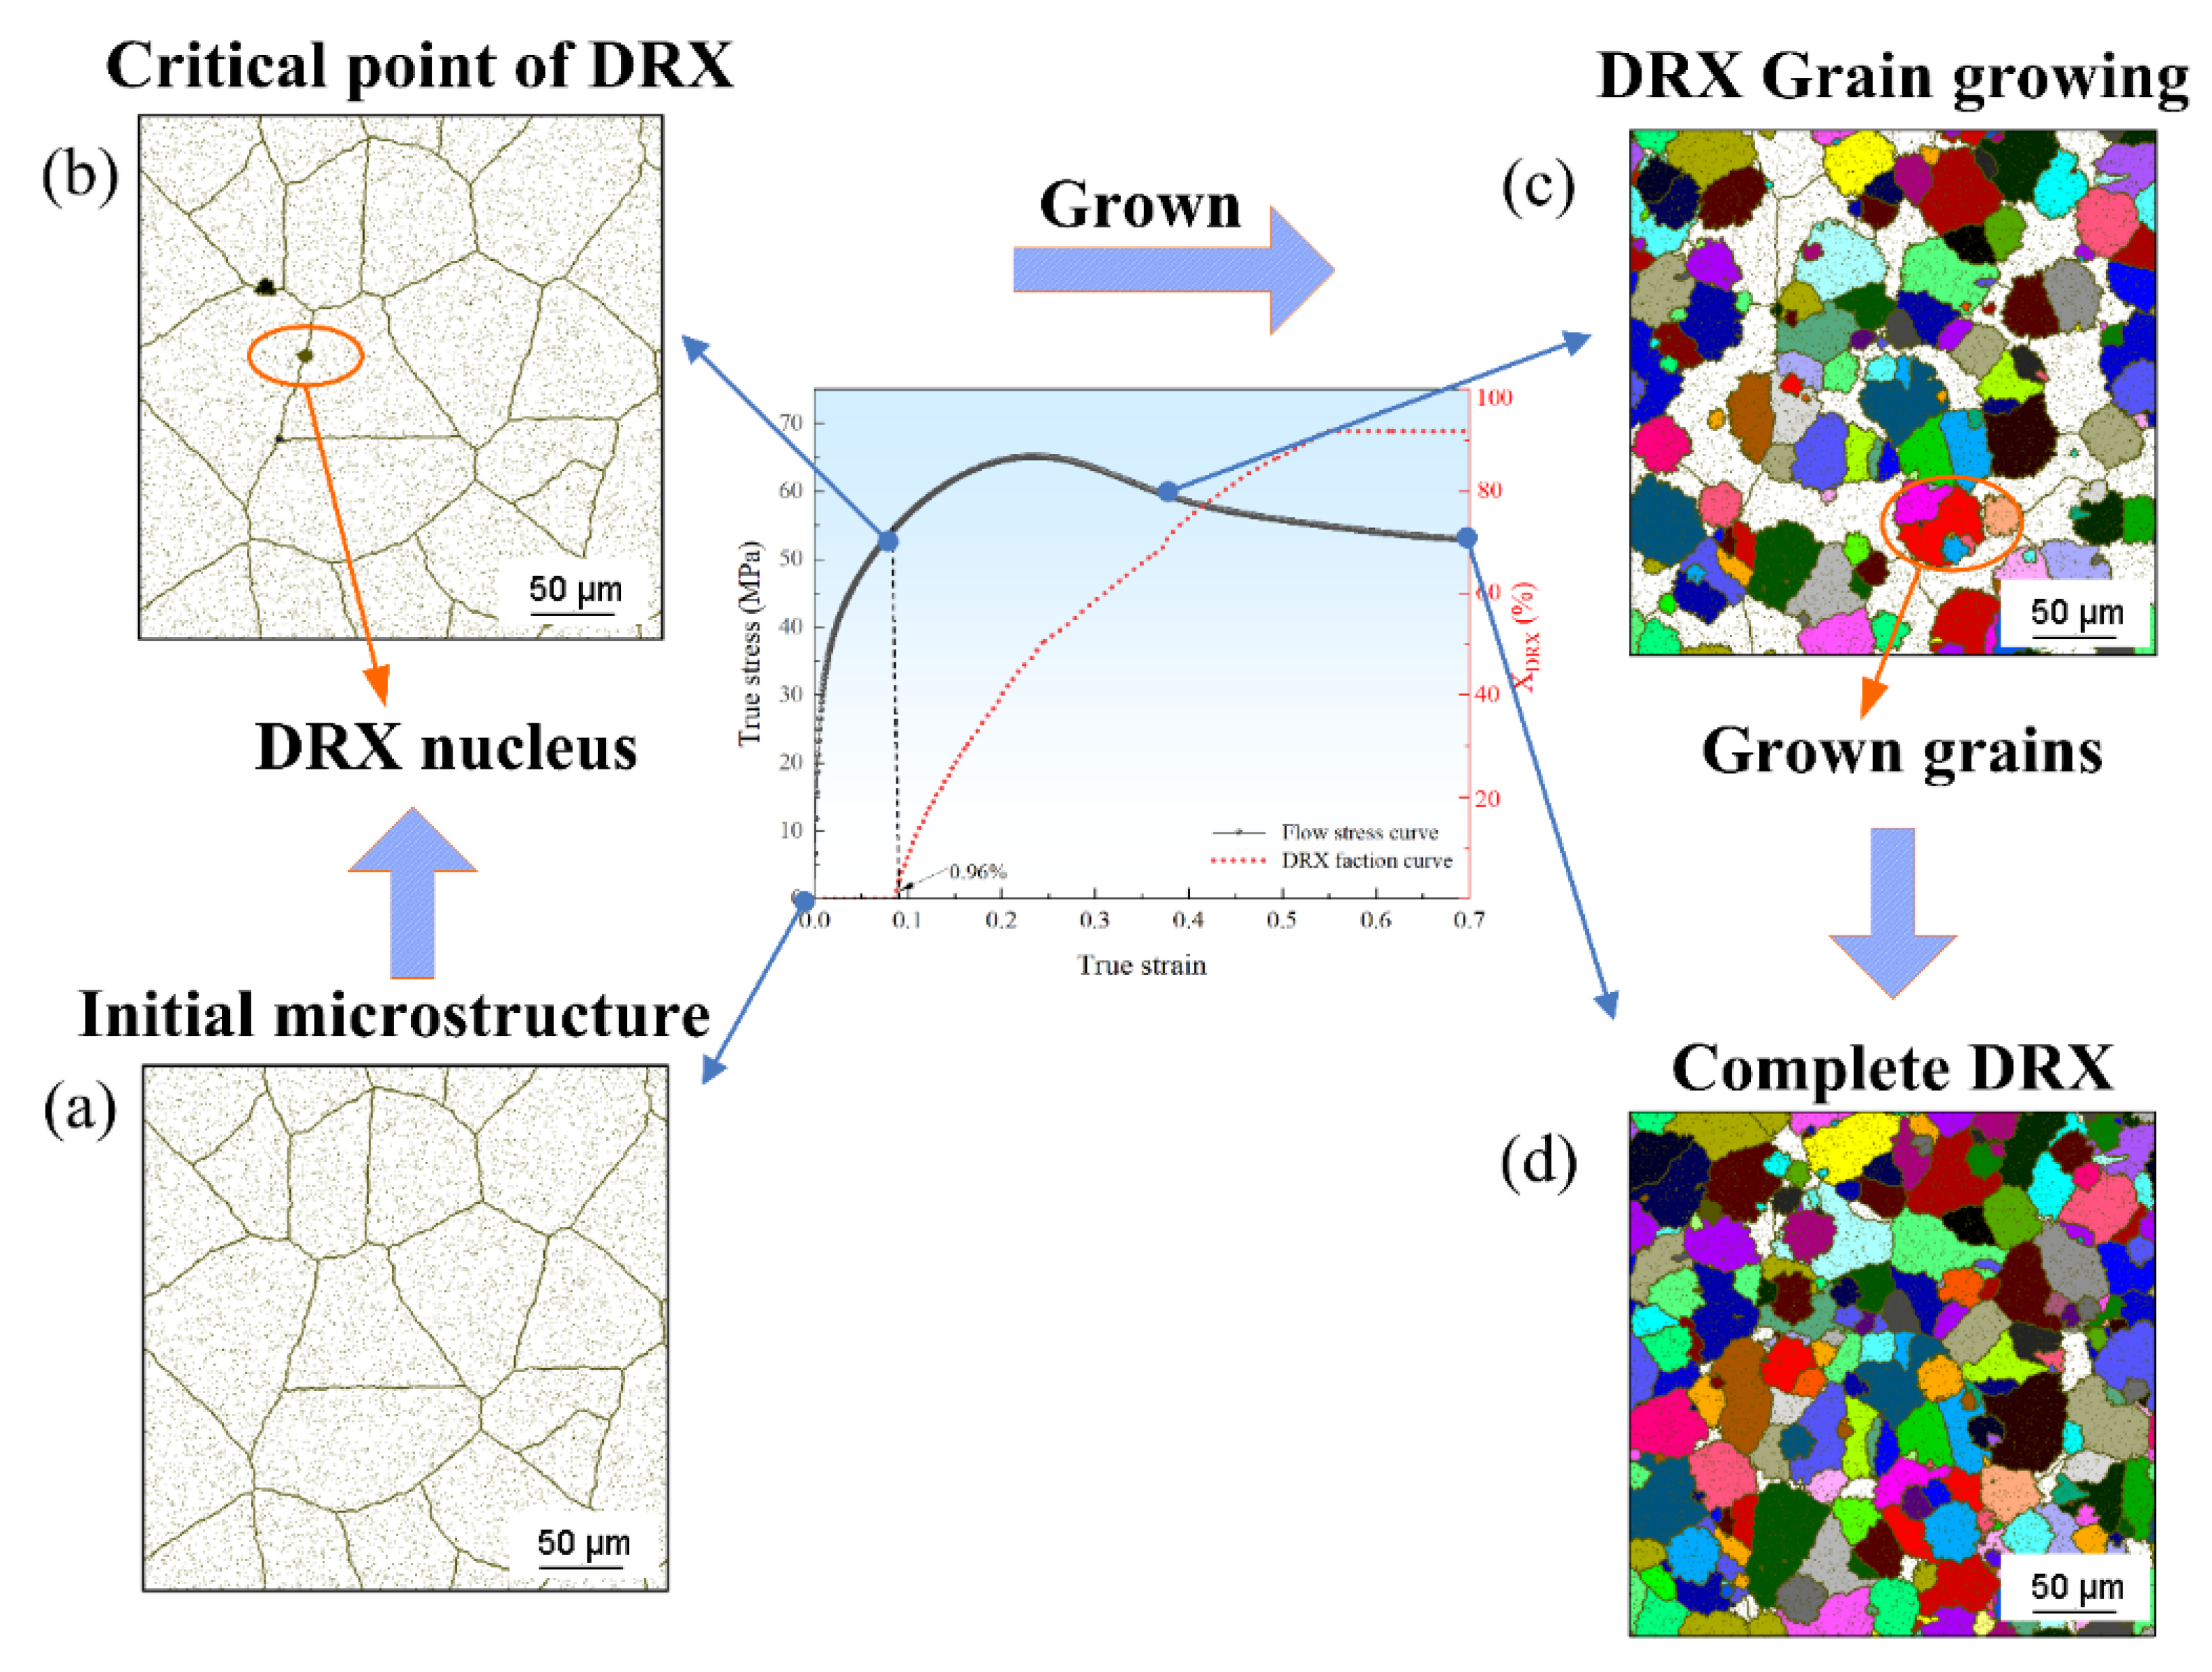
Figure 8 presents the microstructural evolution at different strains simulated by the SP-CA method under a deformation temperature of 1050 °C and a strain rate of 0.1 s−1, where distinct grain colors indicate different crystallographic orientations of the DRX grains and black dots represents SP particles. When the alloy is not in deformation, the DRX cannot occur due to the low dislocation density feature inside the grain and the lack of sufficient activation energy, and the initial grain size of austenite remains large, as shown in Figure 8a. When the strain is increased to the critical strain for DRX with 0.092, the volume fraction of DRX simulated by the SP-CA method is 0.96% as shown in Figure 8b, indicating that DRX begins to occur at the initially simulated austenite grain boundaries. When deformation continues, a significant increase in recrystallization nucleation sites can be clearly observed when the strain reaches 0.35. Meanwhile, the newly formed recrystallized grains begin to grow, as shown in Figure 8c. At this stage, the original microstructure of the 45CrNi steel is gradually replaced by recrystallized grains, and the DRX volume fraction increases to 66.5%. When the strain reaches 0.693, the DRX process is essentially complete, with a DRX volume fraction of 98.2%. Furthermore, comparative analysis between Figure 8a,d clearly demonstrates uniform grain growth after DRX and significant refinement of the recrystallized grain microstructure, which is manifested as fine grain strengthening. The above investigation results indicate that the SP-CA method could be applied to describe the nucleation, grain growth, and steady-state processes of DRX during hot deformation in regard to the studied 45CrNi steel.

4.2. Effect of Deformation Temperature on DRX

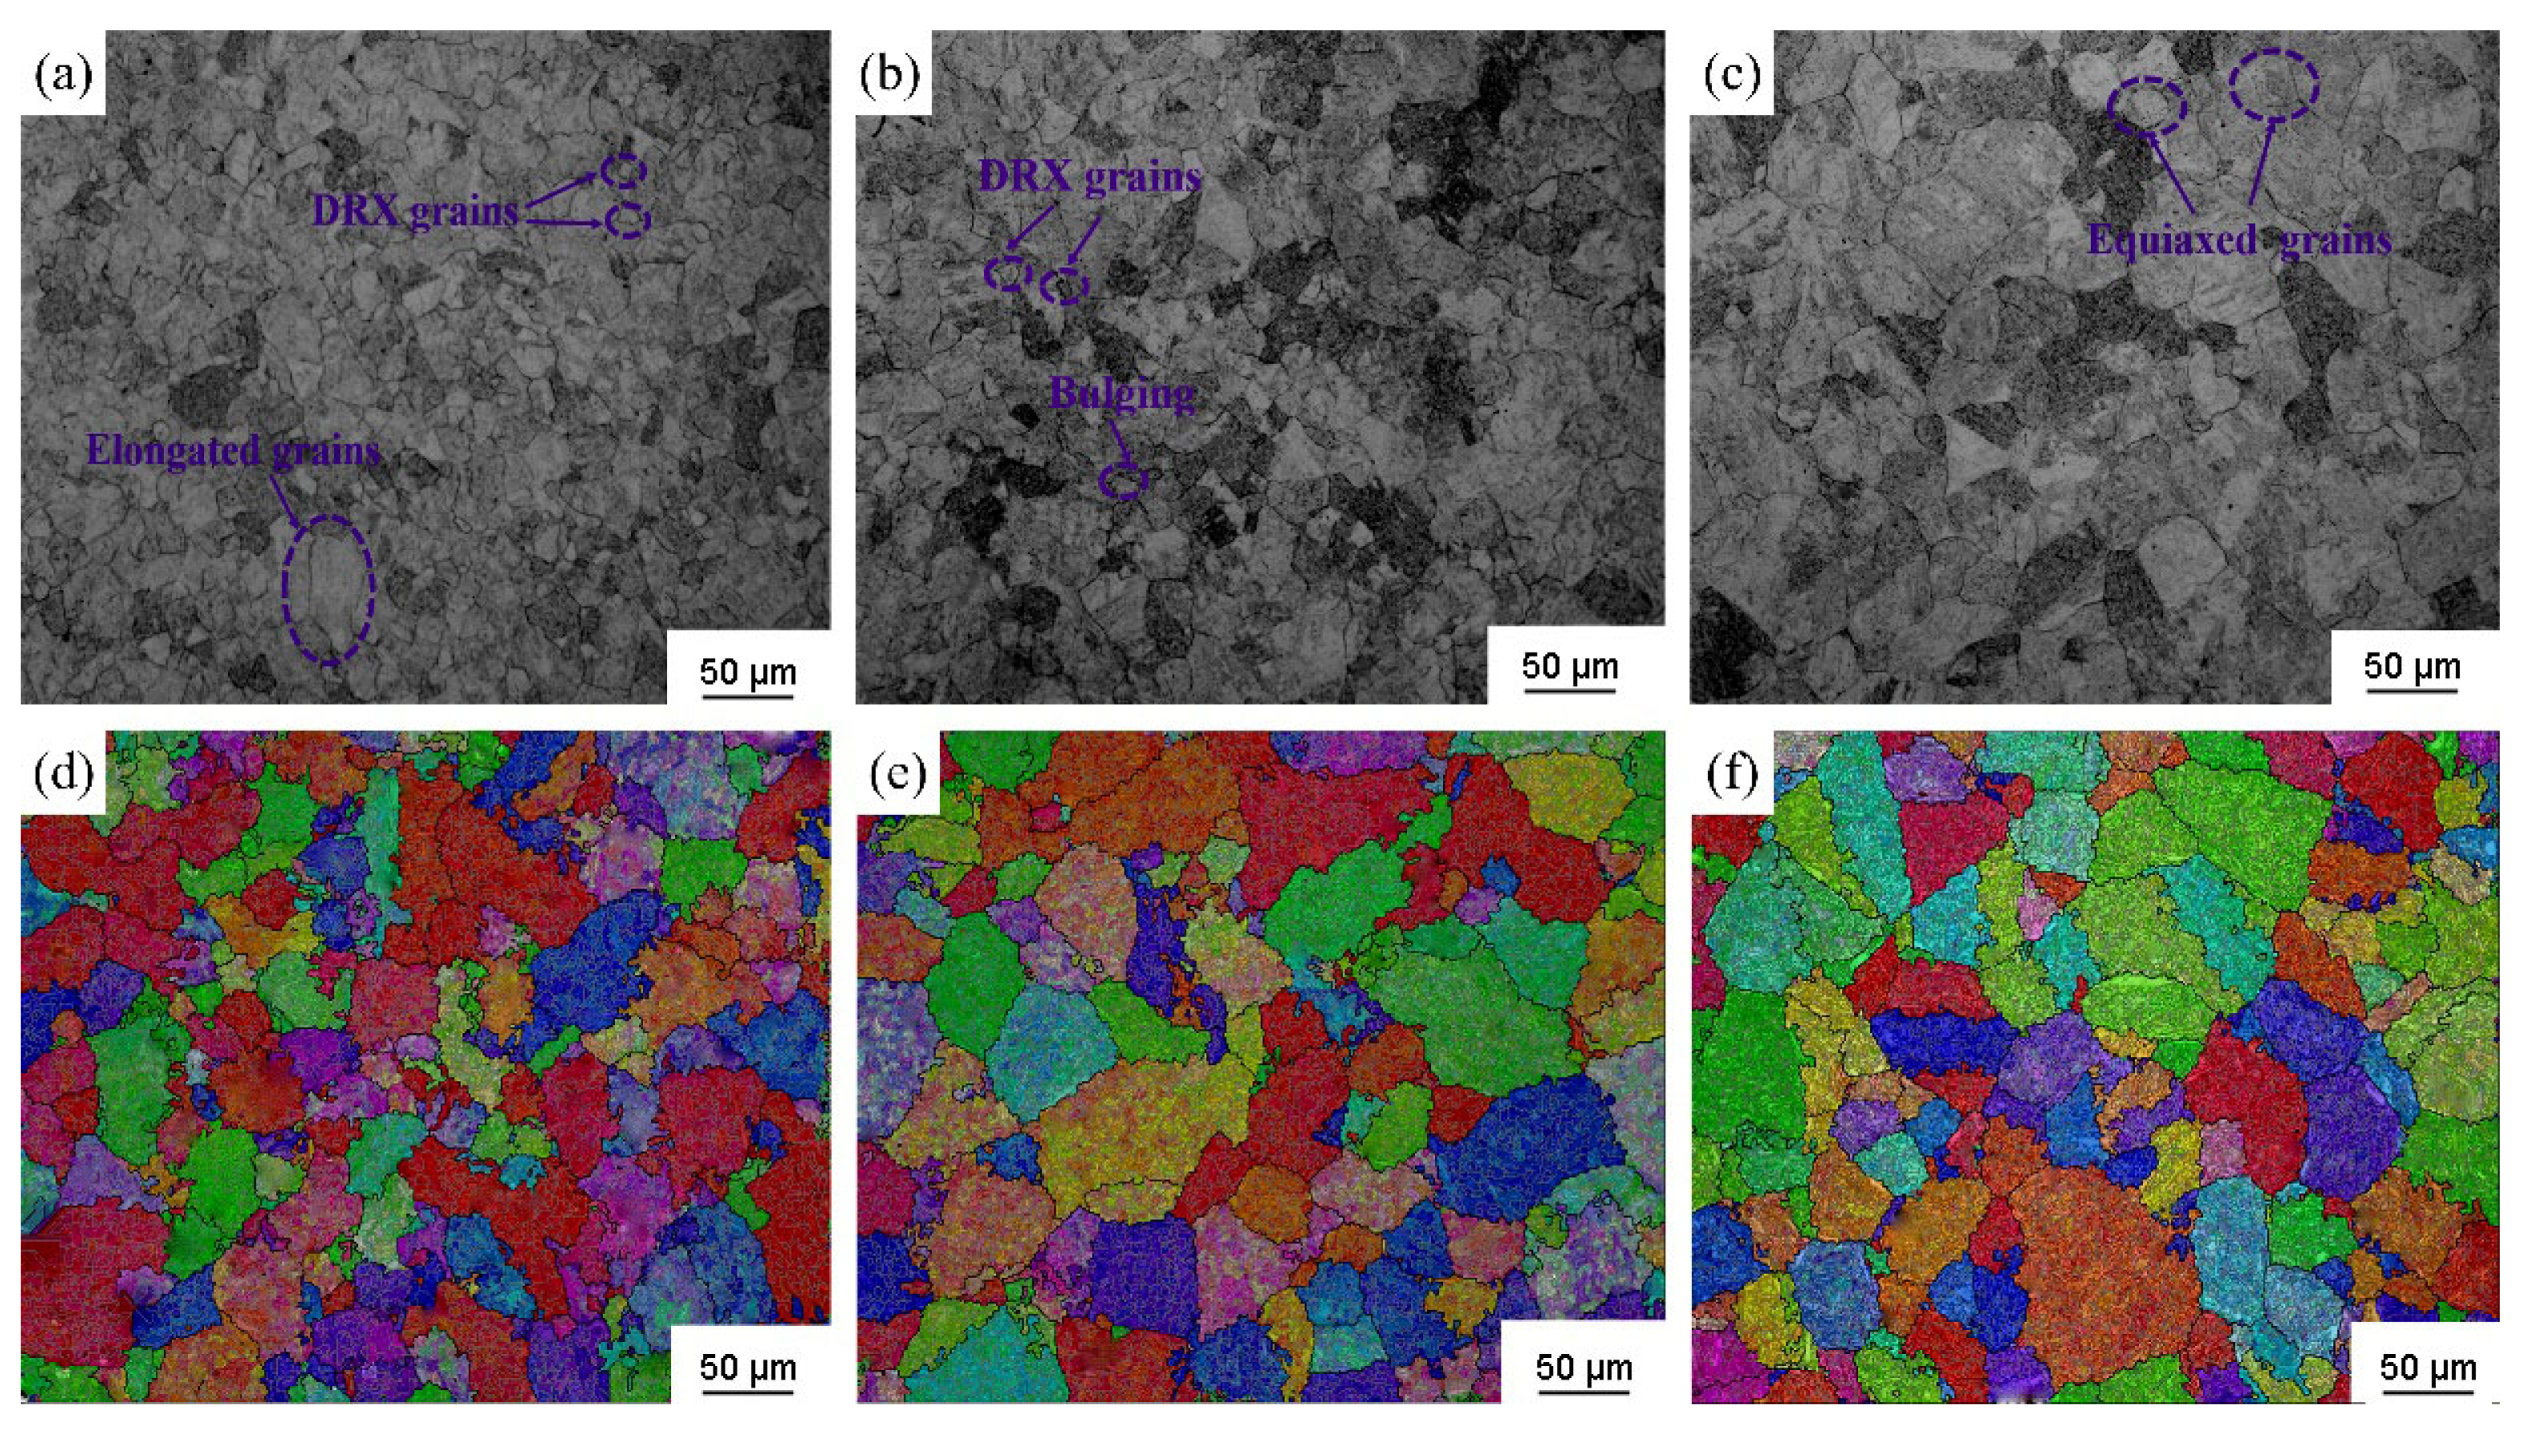
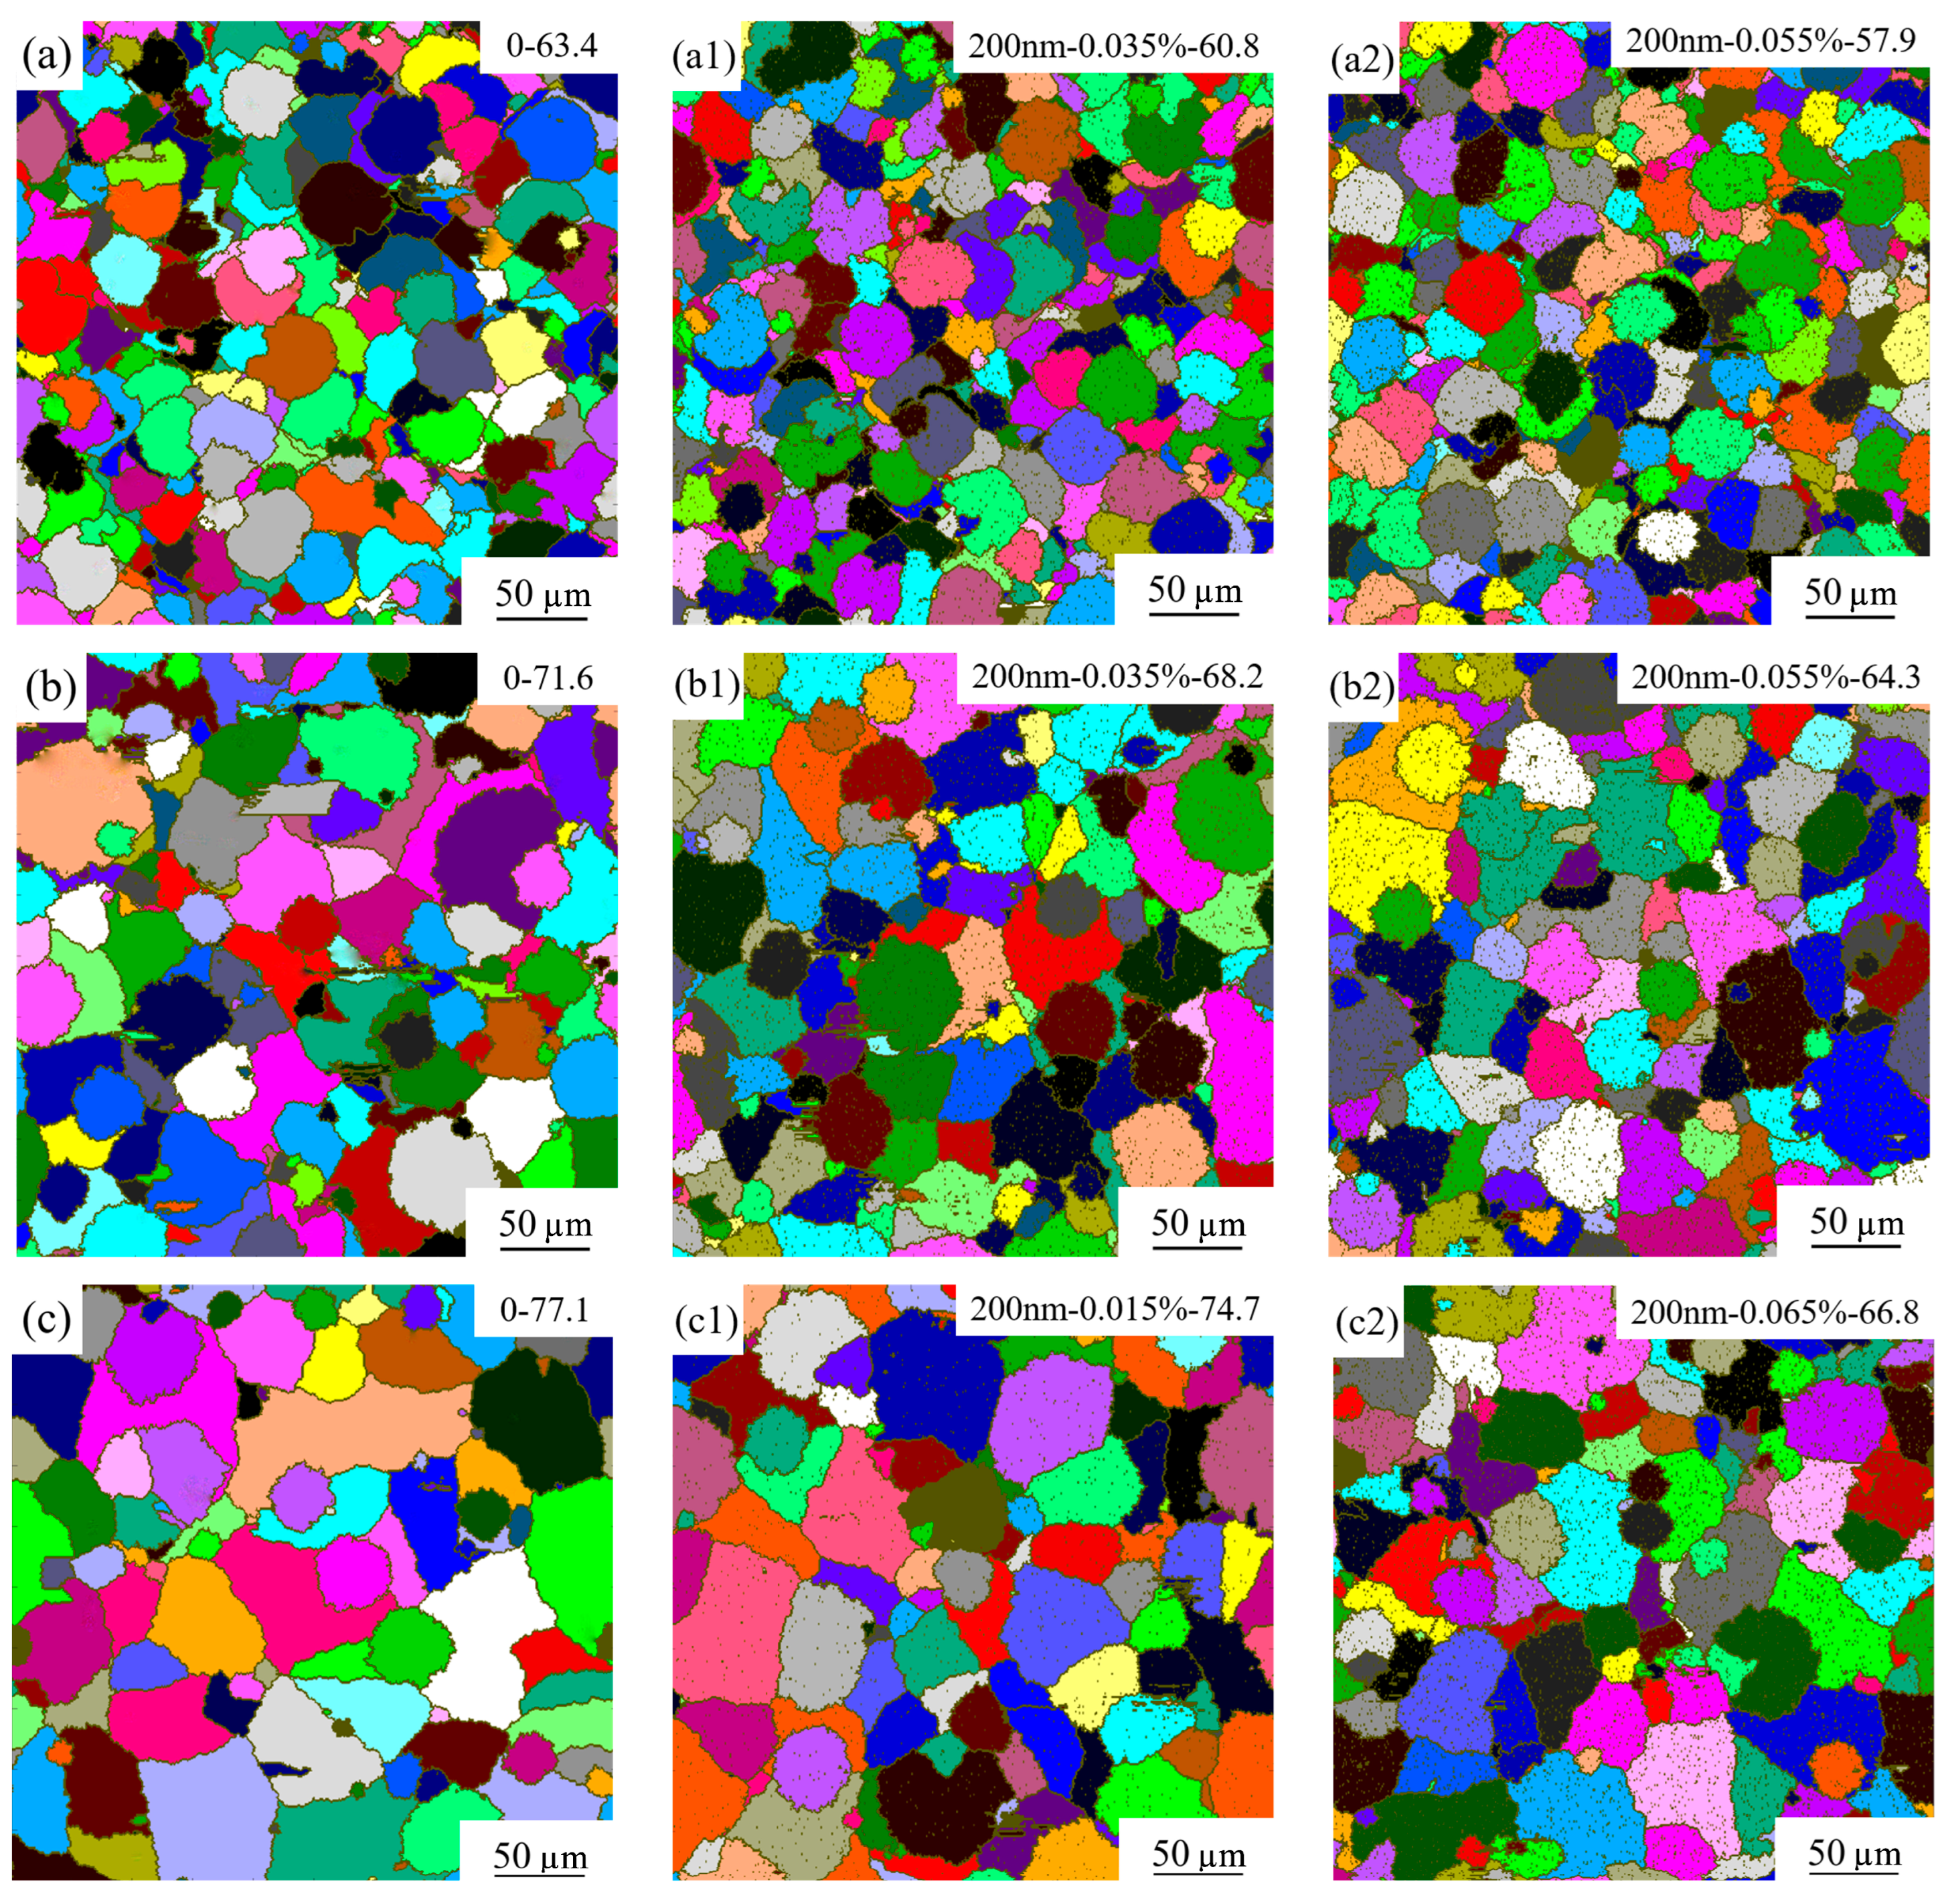
Figure 9 presents the microstructures achieved through experimental characterization and analysis under a constant strain rate of 0.1 s−1, strain of 0.693, and different deformation temperatures of 1050 °C, 1100 °C, and 1150 °C, and the OM graphs and EBSD-reconstructed maps of parent austenite of the studied 45CrNi steel are depicted in Figure 9a–c and Figure 9d–f, respectively. Figure 10 further shows the simulated microstructure maps achieved through the SP-CA model with identical deformation parameters compared to the experimental conditions including strain rate of 0.1 s−1, strain of 0.693, and different deformation temperatures of 1050 °C, 1100 °C, and 1150 °C. In accordance with the calculation results, it can be confirmed that the average grain size of austenite corresponding to simulation conditions without the addition of SP particles at a deformation temperature of 1050 °C is determined to be ~63.4 μm as shown in Figure 10a. For the addition of SP particles with an average diameter of 200 nm and volume fraction of ~0.035% at a deformation temperature of 1050 °C, the average grain size of austenite is determined to be ~60.8 μm as shown in Figure 10(a1). Furthermore, the average grain size of austenite is determined to be ~57.9 μm for the addition of SP particles with an average diameter of 200 nm and volume fraction of ~0.055% at a deformation temperature of 1050 °C as shown in Figure 10(a2). Notably, the distribution of grain size achieved through SP-CA at the SP volume fraction of ~0.055% is similar to the actual distribution of grain size achieved through the experiment. Furthermore, the average grain size of austenite corresponding to simulation conditions without the addition of SP particles at a deformation temperature of 1100 °C is determined to be ~71.6 μm as shown in Figure 10b. And the average grain sizes of austenite corresponding to the addition of SP particles with an average diameter of 200 nm and volume fractions of ~0.035% and ~0.055% at a deformation temperature of 1100 °C are determined to be ~68.2 μm and ~64.3 μm, respectively, shown in Figure 10(b1,b2). Similarly, the simulated average grain size achieved through SP-CA model is closer to the actual average grain size achieved through the experiment at the simulation condition with an SP addition of volume fraction ~0.055%. Figure 10c shows the microstructure feature simulated by the SP-CA model without SP particles at a deformation temperature of 1150 °C, and the average grain size is determined to be ~77.1 μm, which is significantly larger compared to the actual average grain size achieved through experimental characterization. When SP particles with an average diameter of 400 nm and volume fraction of ~0.065% are added, the average grain size obtained through the SP-CA model is determined to be ~66.8 μm as shown in Figure 10(c2), which is virtually similar to the actual size, indicating that the consideration of the influence of SP particles on the distribution of parent austenite is essential and beneficial for accurately predicting the distribution of grain size.
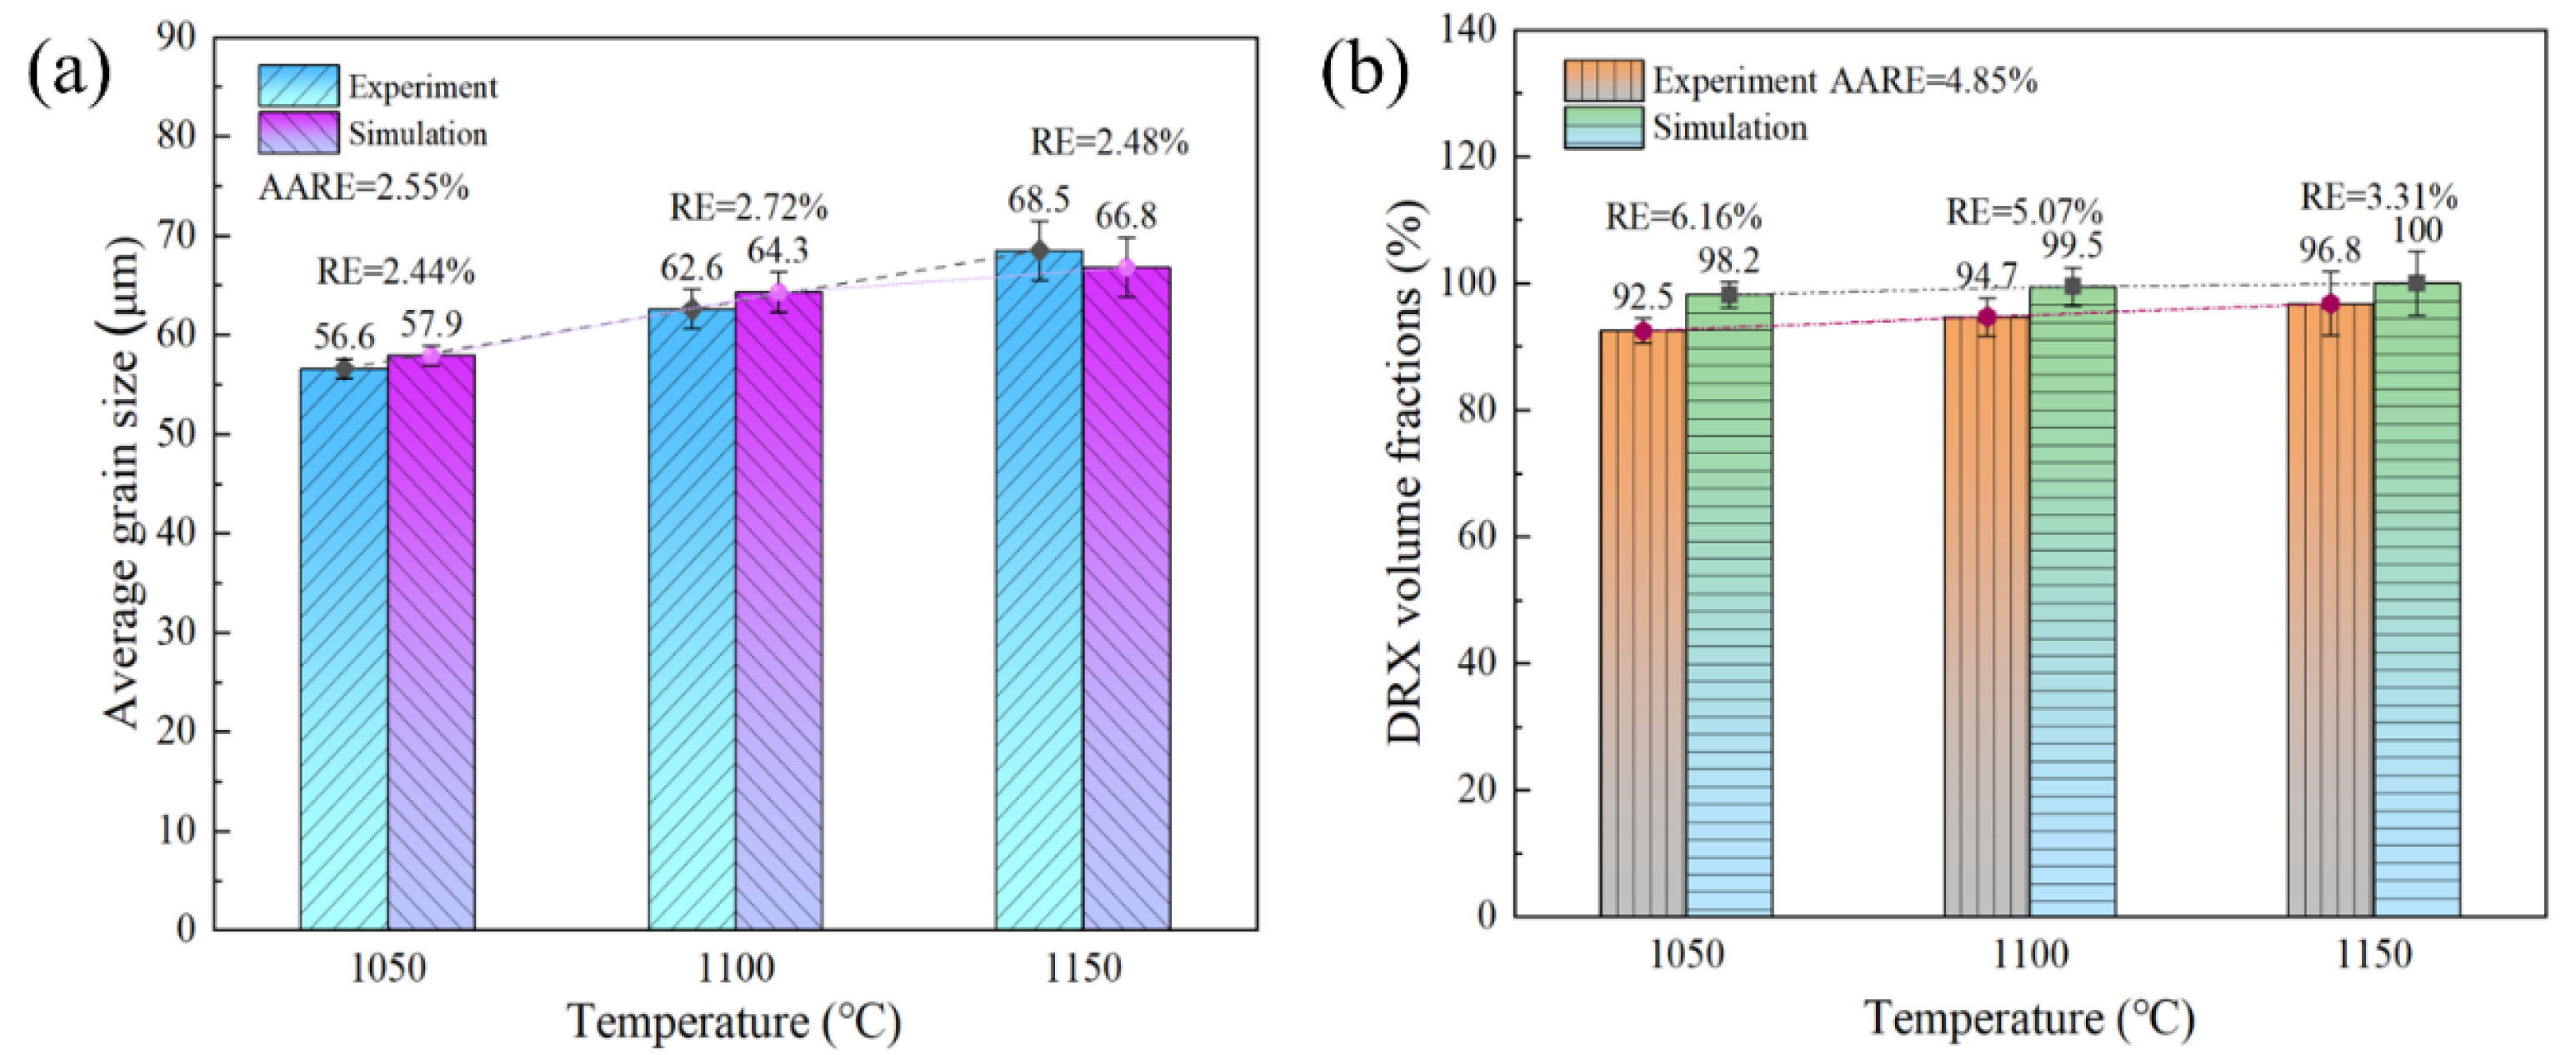
The relative error (RE) and average absolute relative error (AARE) error analysis of the established SP-CA model is then performed corresponding to deformation conditions with a strain rate of 0.1 s−1, strain of 0.693, and different deformation temperatures, and the comparison between the data achieved through experiments and SP-CA calculation is depicted in Figure 11. From the comparison results, it could be confirmed that the REs in average grain size between experimental and simulated values at different deformation temperatures are determined to be ~2.44%, ~2.72%, and ~2.48%, respectively, with an AARE of ~2.55%, shown in Figure 11a. The REs in the DRX volume fraction between experimental and simulated values at different deformation temperatures are determined to be ~6.61%, ~5.07%, and ~3.31%, respectively, with an AARE of ~4.85%, shown in Figure 11b. The error analysis results demonstrate that the experimental values are essentially consistent with the SP-CA simulation results, with an overall average error below ~5%, indicating that the modified SP-CA model can effectively simulate the DRX behavior of the studied 45CrNi steel under varying deformation conditions. Additionally, it can be observed that both the average grain size of the parent austenite and the DRX volume fraction are increased with rising deformation temperature as illustrated in Figure 11, the predominant reason being that the influencing parameters of microstructure evolution, including dislocation activity, grain boundary mobility, and the pinning effect of SP particles, could be influenced significantly by deformation temperature. Microstructural analysis reveals that lower dislocation activity and grain boundary migration rates result in the formation of a small number of fine DRX grains alongside elongated deformed grains at deformation temperature of 1050 °C, shown in Figure 9a,b. When the temperature is increased to 1100 °C, deformed grains are further refined via bulge nucleation, accompanied by the formation of more DRX grains, verified by Figure 9b,e. At the higher deformation temperature of 1150 °C, the deformation energy, dislocation mobility, and grain boundary migration capability are significantly enhanced, and DRX grains are rapidly grown into larger equiaxed grains in the mechanism of complete DRX as shown in Figure 9c,f.

4.3. Effects of Strain Rate on DRX

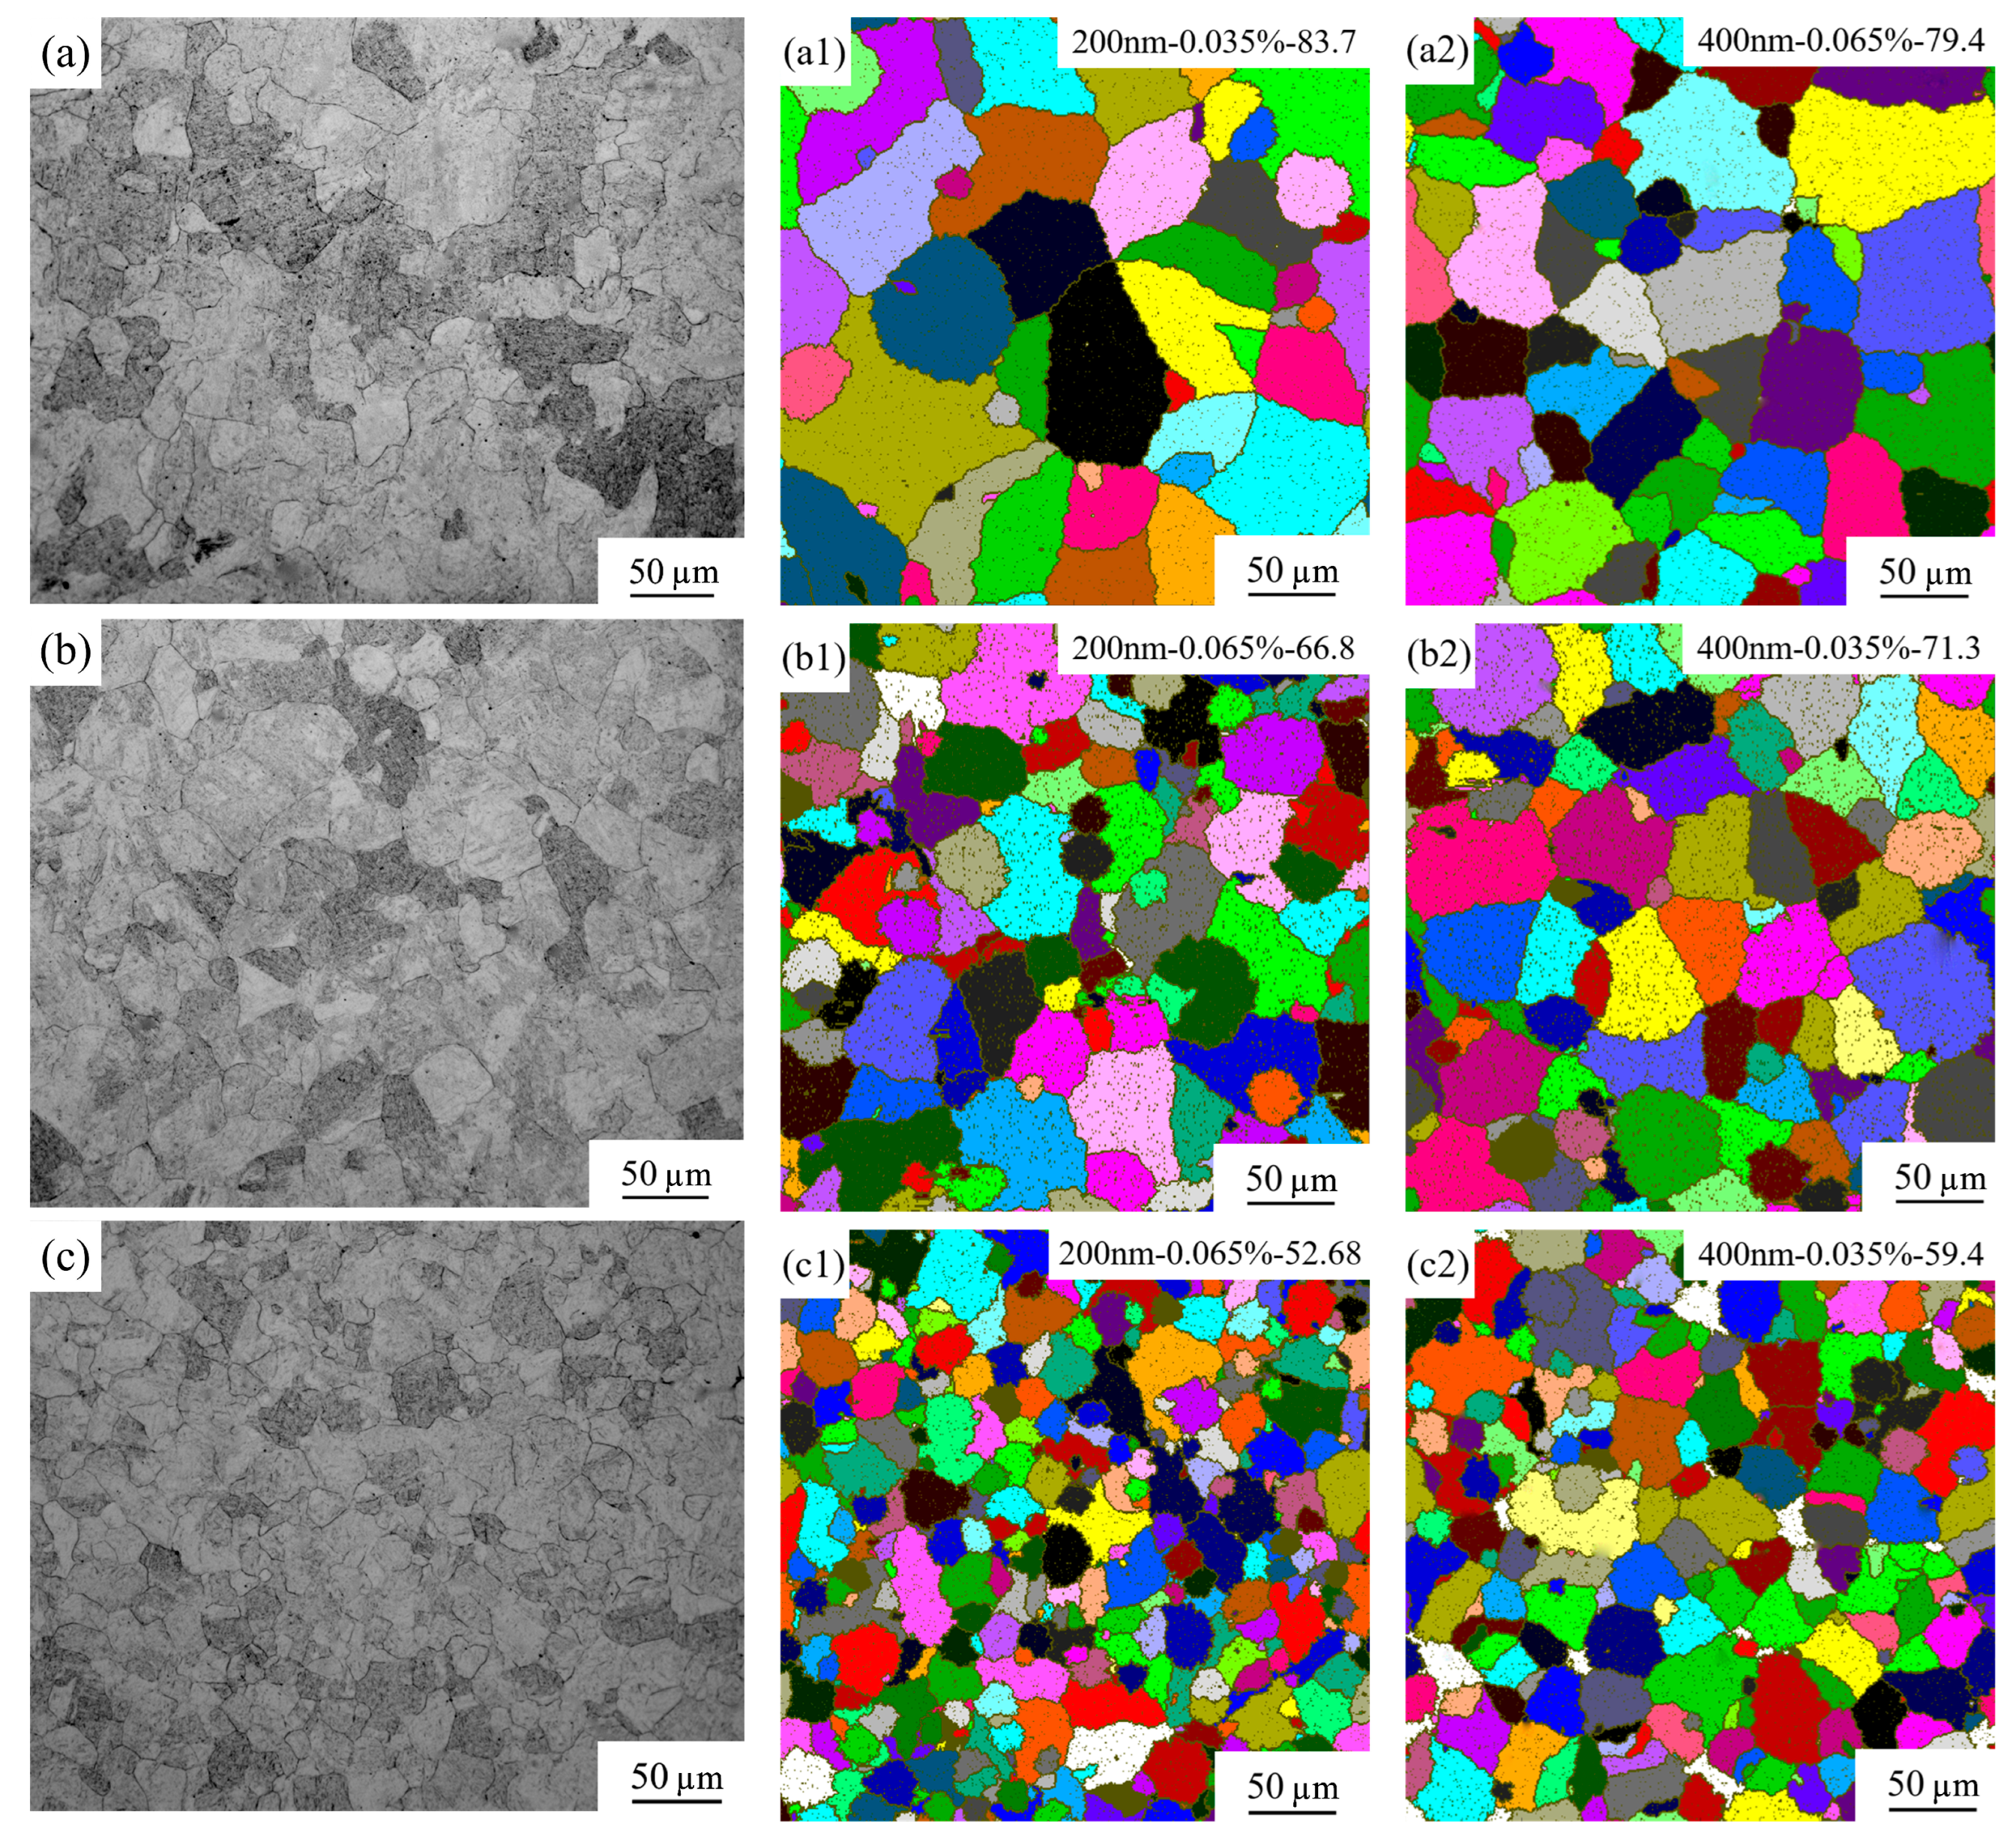
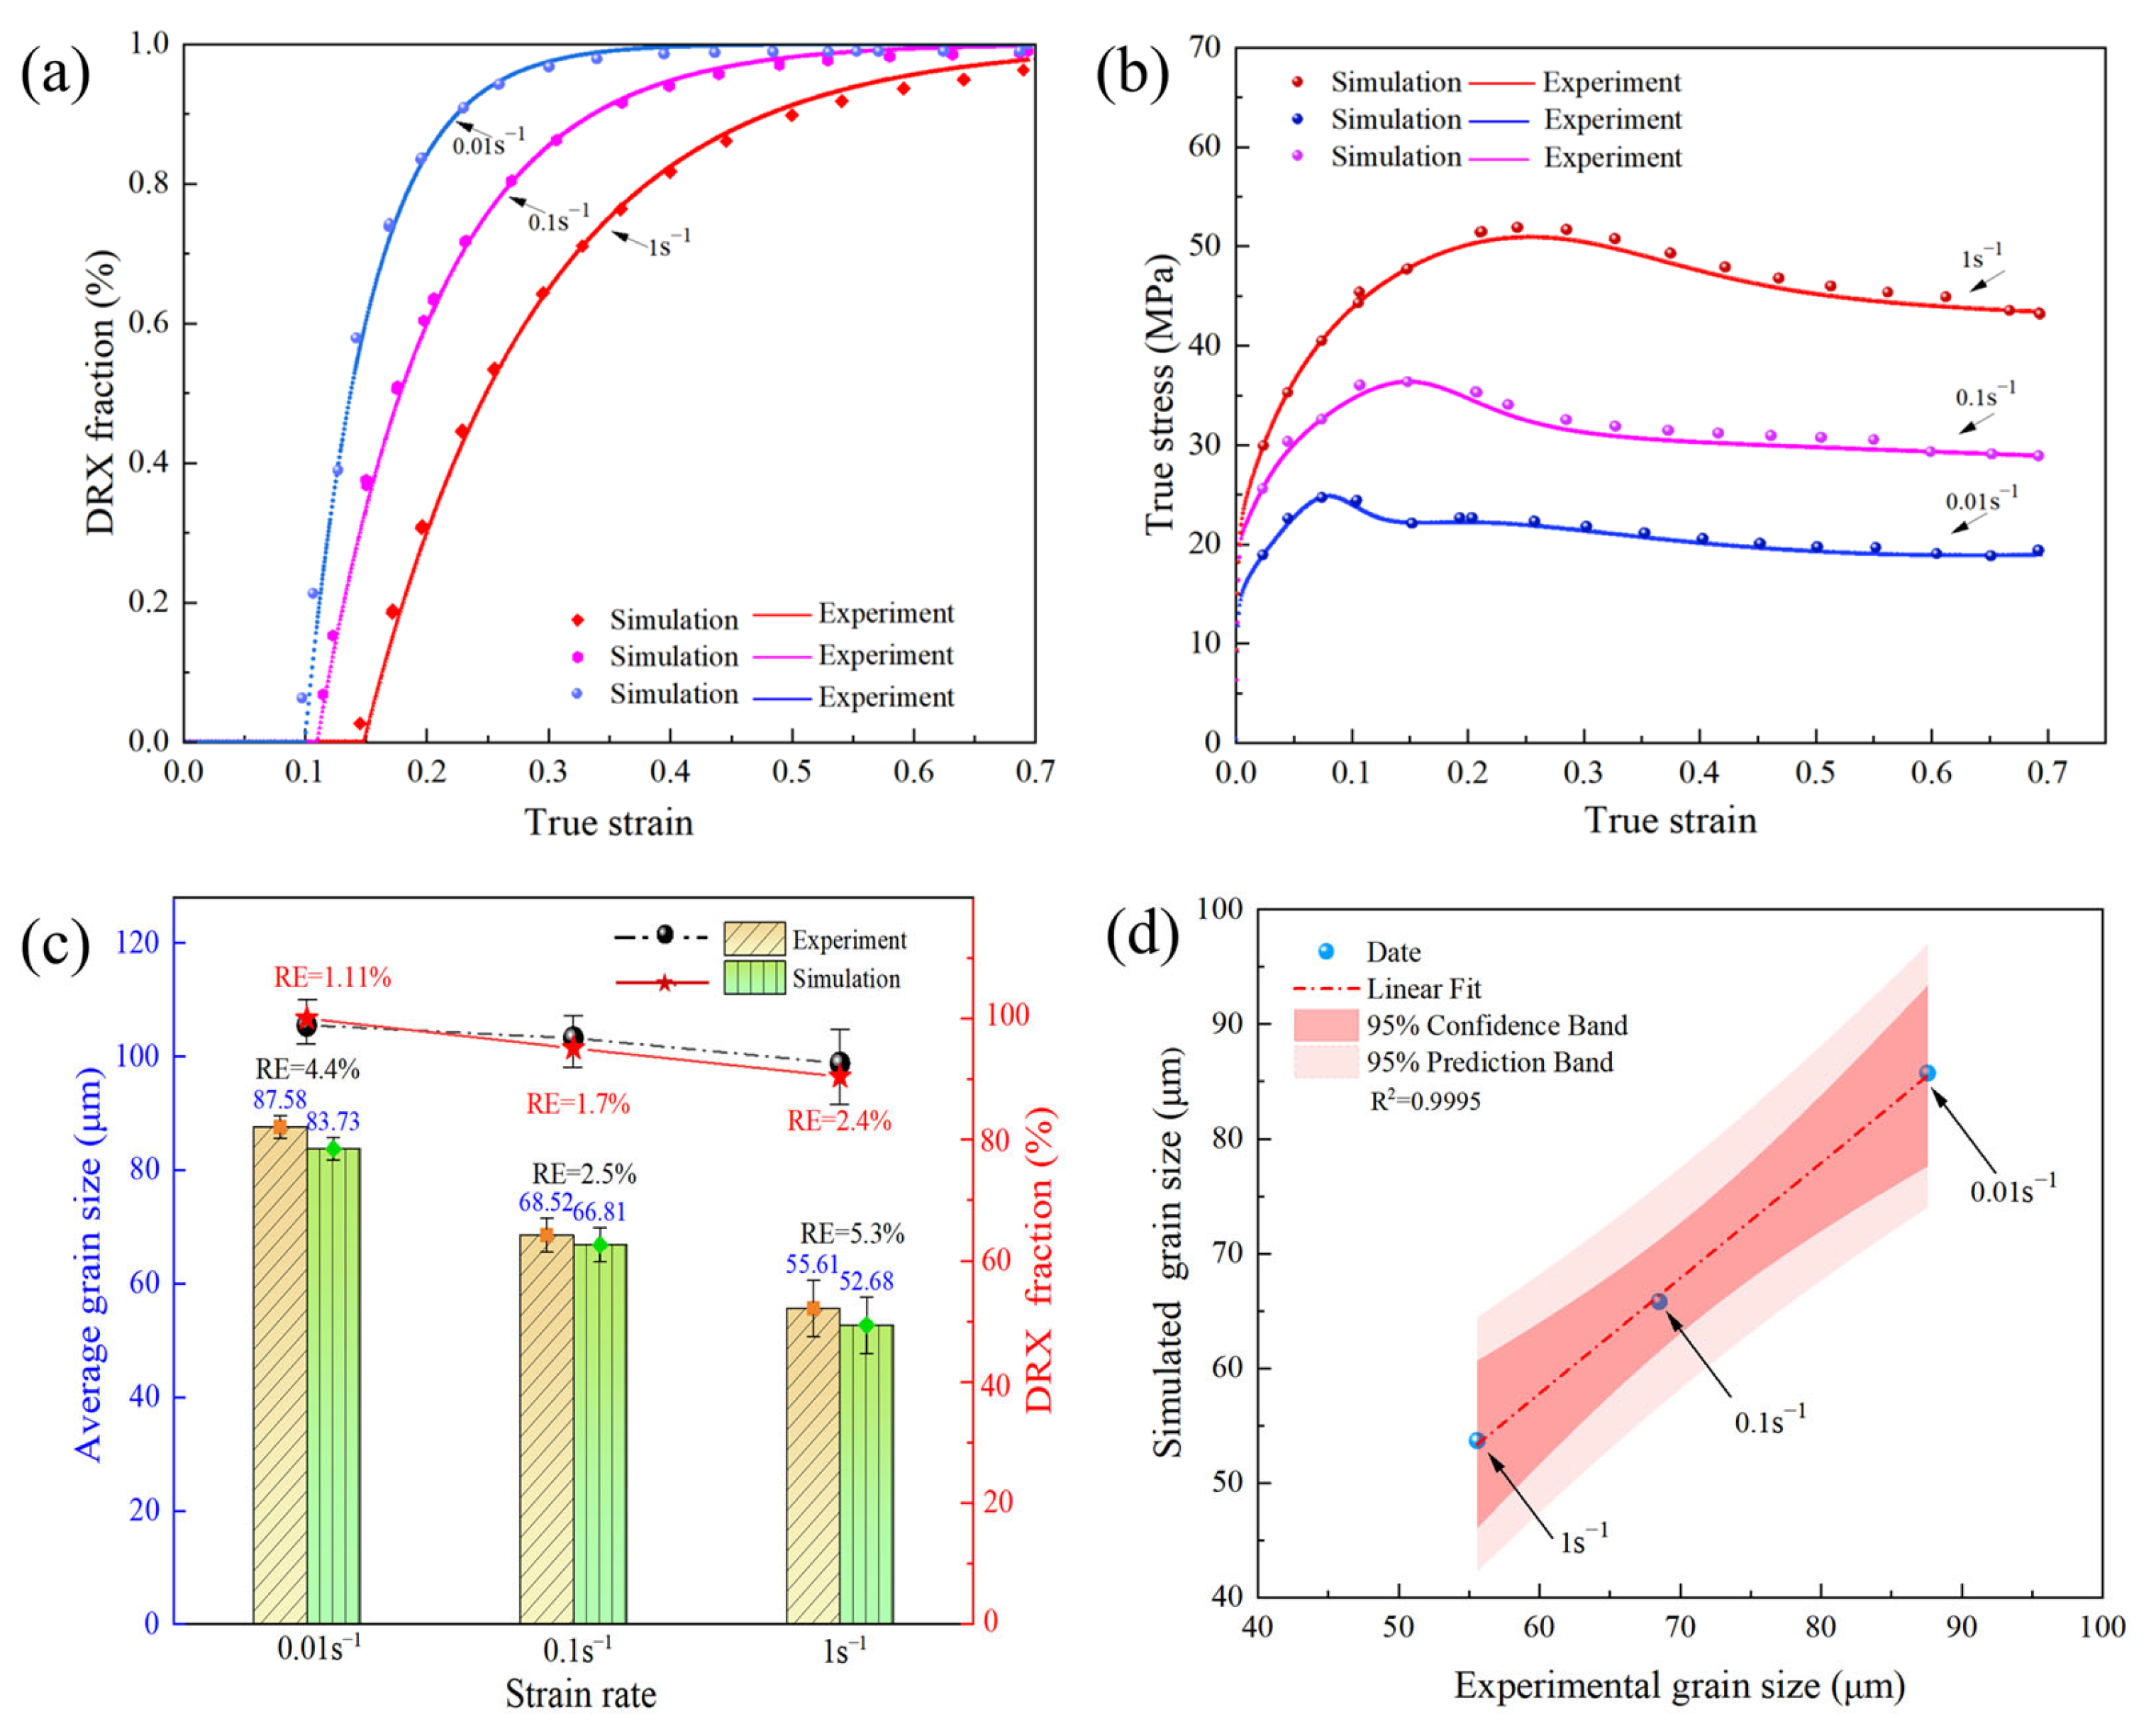
Figure 12 presents the microstructures of the studied 45CrNi steel achieved through experimental characterization and SP-CA calculation under a constant hot working temperature of 1150 °C, strain of 0.693, and different strain rates of 0.01 s−1, 0.1 s−1, and 1 s−1, respectively. The OM graphs corresponding to 0.01 s−1, 0.1 s−1, and 1 s−1 achieved through experiments are depicted in Figure 12a–c. The average grain size and DRX volume fraction of the studied 45CrNi steel corresponding to different deformation conditions achieved through experimental characterization and SP-CA calculation are further statistics, as shown in Figure 13. In accordance with the comparison results, it can be determined that the difference in microstructural and deformation features, including DRX volume fraction, flow stress curves, and average grain size, achieved through the experiment and SP-CA calculation under constant deformation temperature and varying strain rates is relatively small, which demonstrates excellent agreement between the simulation and experiment. For DRX kinetics, there are sigmoidal (S-shaped) characteristics in DRX kinetics in regard to the studied 45CrNi steel, where a reduction in the DRX volume fraction is observed with higher strain rates as shown in Figure 13a. The sigmoidal curves achieved through the experiment and SP-CA calculation indicate the evolution pattern of DRX in regard to the studied 45CrNi steel, where an initial stage with minimal DRX fraction and slow growth rate occurs firstly, followed by a period with a rapid increase stage and stable development stage. This trend regarding the DRX volume fraction obtained in this research is consistent with conventional DRX kinetic models.
For the flow curves of the studied 45CrNi steel, the stress–strain curves achieved through the experiment and SP-CA calculation are depicted in Figure 13b, and the consistency and overlap of the variation trend for the stress–strain curves achieved through the experiment and simulation are high, indicating a high degree of accuracy for the simulation. At the initial hot deformation stage, the DRV mechanism is dominated at any different strain rate, and the dislocation is accumulated, accompanied by an increase in dislocation density when the deformation continues. Once the strain reaches up to the critical value, the stacking fault energy satisfies the condition for DRX nucleation. When strain hardening and dynamic recovery achieve a balance, the stress–strain response stabilizes into a steady-state deformation regime, where the DRX volume fraction is stable, approaching to a fully complete state of DRX. With the further increase in strain, the DRX volume fraction is increased due to ongoing nucleation and growth of DRX. Consequently, it can be determined that DRX volume fraction could be reduced by increasing the strain rate at a given temperature and strain level, and DRX nucleation occurs more readily with decreasing strain rate or increasing deformation temperature.
Figure 13c displays the error plots related to the average grain size and DRX volume fraction by comparing the experimental and simulated results achieved at a constant deformation temperature of 1150 °C and different strain rates. In accordance with the statistics, it can be confirmed that the REs of average grain size corresponding to strain rates of 0.01 s−1, 0.1 s−1, and 1 s−1 are determined to be ~4.4%, ~2.5%, and ~5.3%, respectively, with a maximum RE of 5.3%. Similarly, the REs of DRX volume fraction corresponding to strain rates of 0.01 s−1, 0.1 s−1, and 1 s−1 are determined to be ~1.1%, ~1.7%, and ~2.4%, respectively, with a maximum RE of 2.4%. The investigation related to the distribution of DRX volume fraction and average grain size clearly reveals that the DRX volume fraction decreases with increasing strain rate, and the average grain size is also diminished at a higher strain rate, as shown in Figure 13. Generally, the growth of recrystallized grains at the boundaries of the parent austenite can be promoted by decreasing strain rate coupled with increased deformation time and accumulated strain. Conversely, fine recrystallized grains continuously nucleate at both parent grain boundaries and the boundaries of existing recrystallized grains at a high strain rate. The goodness of fit between the simulation and experiment for average grain sizes in regard to the studied 45CrNi steel is determined to be 0.9995, as shown in Figure 13d. The relatively high goodness of fit (R2 = 0.9995), together with an AARE within ~5% for the average grain size and DRX volume fraction, demonstrates the effectiveness of the modified SP-CA model in predicting DRX behavior and grain size evolution in regard to the studied 45CrNi steel.
In conclusion, the influence of SP particles on the microstructure feature could not be ignored in regard to the studied 45CrNi steel, and should be significantly valued. The influencing mechanism of SP particles on the microstructure should be understood based on the interaction behavior between the SP particles and the grain boundary. Generally, SP particles at elevated temperatures can impede the migration of recrystallized GBs through a pinning effect, and the inhibition toward the grain boundary can further suppress the grain growth, facilitating the achievement of fine parent austenite. Subsequently, the refined austenite grains are beneficial for the refinement of the final microstructure during phase transformation, significantly influencing the resultant mechanical properties. Hence, it is crucial to fully understand the influence of SP particles on microstructure evolution during microstructure regulation. In this study, an SP-CA model is established that considers the influence of SP particles, including the particle size and volume fraction, based on the traditional CA method, and the SP-CA model is applied to simulate microstructural evolution behavior during hot deformation. The distribution of average grain size and variation in DRX volume fraction corresponding to different deformation conditions in regard to the studied 45CrNi steel, including deformation temperature, strain, and strain rate, could be successfully predicted with high precision, which can offer an enhanced approach for accurately simulating and optimizing the size and volume fraction of precipitate particles to investigate the evolution of dynamically recrystallized microstructures under varying deformation conditions. This framework is expected to provide a powerful tool for gaining deeper insight into the high-temperature deformation behavior and microstructural evolution of alloyed high-strength steels.

5. Conclusions

(a)
The DRX kinetic model of the studied 45CrNi steel is established as follows:
X d = 0 0 ε ε c X d = 1 e x p 1.9517961 ε ε c ε 0.5 1.05468 ( ε > ε c ) ε 0.5 = 0.00156334 ε ˙ 0.172 exp 63,669.4 R T
(b)
The variation disciplines of average grain size and DRX volume fraction achieved through the experiment and SP-CA calculation in regard to the studied 45CrNi steel are consistent. Meanwhile, the average grain size and DRX volume fraction of the parent austenite increase gradually with rising deformation temperature and decreasing strain rate under constant strain.
(c)
The simulation results associated with the average grain size and DRX volume fraction achieved through the SP-CA model are in good agreement with the experimental results, with an AARE of less than 5%, indicating that the improved SP-CA model can accurately predict the DRX behavior of 45CrNi steel during hot deformation. According to the improved SP-CA model, the Zener pinning effect exerted by randomly dispersed SP particles on the initial austenite grain boundaries inhibits the DRX volume fraction in the 45CrNi steel from attaining 100%, even during the steady-state stress phase.

Author Contributions

J.Z.: investigation, writing—original draft, funding acquisition; S.D.: investigation, formal analysis; H.L.: methodology, writing—review and editing; W.H.: writing—review and editing, funding acquisition. All authors have read and agreed to the published version of the manuscript.

Funding

This research was funded by National Key Research and Development Program of China (No. 2023YFB3405404), National Nature Science Foundation of China (No. 52304409).

Data Availability Statement

The original contributions presented in this study are included in the article. Further inquiries can be directed to the corresponding author.

Acknowledgments

The authors acknowledge the financial support from “National Key Research and Development Program of China (No. 2023YFB3405404), National Nature Science Foundation of China (No. 52304409)”.

Conflicts of Interest

The authors declare that they have no known competing financial interests or personal relationships that could have appeared to influence the work reported in this paper.

References

  1. Zhao, J.; Jiang, Z.Y. Thermomechanical processing of advanced high strength steels. Prog. Mater. Sci. 2018, 94, 174–242. [Google Scholar] [CrossRef]
  2. Bodyakova, A.; Belyakov, A. Microstructure and mechanical properties of structural steels and alloys. Materials 2023, 16, 5188. [Google Scholar] [CrossRef]
  3. Li, D.Z.; Zhao, X.M.; Zhang, H.L.; Li, J. Flow stress-strain curves and dynamic recrystallization behavior of high carbon low alloy steels during hot deformation. J. Mater. Res. Technol. 2025, 35, 3144–3160. [Google Scholar] [CrossRef]
  4. Lee, C.; Jo, S.; Kim, Y.; Choi, Y.; Lee, K.; Jeon, J.B. Hot deformation behavior and dynamic recrystallization of Fe-24Mn steel: Influence on cryogenic hardness. J. Mater. Res. Technol. 2025, 36, 10547–10562. [Google Scholar] [CrossRef]
  5. Zhang, K.; Zhang, T.; Zhang, M.; Chen, Z.; Pan, H.; Yang, G.; Zhang, X. Hot deformation behavior, dynamic recrystallization mechanism and processing maps of Ti–V microalloyed high strength steel. J. Mater. Res. Technol. 2023, 25, 4201–4215. [Google Scholar] [CrossRef]
  6. Khodabakhshi, F.; Hasani, N.; Kalaie, M.R.; Hadadzadeh, A.; Wells, M.A.; Mohammadi, M. Dynamic recrystallization under hot deformation of additively manufactured 316 L stainless steel. Mater. Charact. 2023, 202, 113055. [Google Scholar] [CrossRef]
  7. Li, C.; Huang, L.; Zhao, M.; Zhang, X.; Li, J.; Li, P. Influence of hot deformation on dynamic recrystallization behavior of 300M steel: Rules and modeling. Mater. Sci. Eng. A 2020, 797, 139925. [Google Scholar] [CrossRef]
  8. Mozumder, Y.H.; Babu, K.A.; Saha, R.; Sarma, V.S.; Mandal, S. Dynamic microstructural evolution and recrystallization mechanism during hot deformation of intermetallic-hardened duplex lightweight steel. Mater. Sci. Eng. A 2020, 788, 139613. [Google Scholar] [CrossRef]
  9. Lee, J.; Kim, S.; Kim, B.; Kim, D. Physically-based constitutive model and dynamic recrystallization behavior of AISI 4330V mod. Alloy steel under hot working conditions. J. Mater. Res. Technol. 2025, 36, 8146–8159. [Google Scholar] [CrossRef]
  10. Guo, A.; Mao, F.; Shi, R.; Lin, Y.; Yin, L.; Yu, B.; Wei, S. Study on Dynamic Recrystallization Kinetics and Microstructural Refinement of High-Strength 36CrNi3MoV Steel during hot deformation. J. Mater. Res. Technol. 2025, 36, 8999–9012. [Google Scholar] [CrossRef]
  11. Mirzadeh, H.; Cabrera, J.M.; Najafizadeh, A. Constitutive relationships for hot deformation of austenite. Acta Mater. 2011, 59, 6441–6448. [Google Scholar] [CrossRef]
  12. Saadatkia, S.; Mirzadeh, H.; Cabrera, J.M. Hot deformation behavior, dynamic recrystallization, and physically-based constitutive modeling of plain carbon steels. Mater. Sci. Eng. A 2015, 636, 196–202. [Google Scholar] [CrossRef]
  13. Wang, F.; Liu, Z.F.; Hu, W.L.; Zhao, J.H.; He, W.W.; Hou, H. Understanding and exploring anisotropy mechanism of mechanical properties for ferrous alloy under different cooling paths. J. Mater. Res. Technol. 2024, 32, 261–272. [Google Scholar] [CrossRef]
  14. Singh, A.; Haase, C.; Barrales-Mora, L.A. Cellular Automaton Simulation Model for Predicting the Microstructure Evolution of an Additively Manufactured X30Mn21 Austenitic Advanced High-Strength Steel. Metals 2025, 15, 770. [Google Scholar] [CrossRef]
  15. Yu, K.; Wang, M.; Fan, H.; Zhan, Z.; Ren, Z.; Xu, L. Investigation on the Solidification Structure of Q355 in 475 Mm Extra-Thick Slabs Adopting Cellular Automaton-Finite Element Model. Metals 2024, 14, 1012. [Google Scholar] [CrossRef]
  16. Cheng, M.; Wu, X.; Zhang, Z. Study of the Dynamic Recrystallization Behavior of Mg-Gd-Y-Zn-Zr Alloy Based on Experiments and Cellular Automaton Simulation. Metals 2024, 14, 570. [Google Scholar] [CrossRef]
  17. He, Y.Y.; Lei, L.P.; Fang, G. Interactions between dynamic recrystallization and dynamic precipitation during hot forming of magnesium alloy: Multilevel cellular automaton modeling. J. Magnes. Alloys 2025, 13, 1953–1977. [Google Scholar] [CrossRef]
  18. Yang, X.; Tong, D.; Gong, M.; Guo, Z.; Li, C.; Gu, J. Developing and validating a fully coupled model of non-local crystal plasticity and probabilistic cellular automata for dynamic recrystallization simulation. Int. J. Plast. 2025, 190, 104375. [Google Scholar] [CrossRef]
  19. Zhang, C.; Zhang, L.; Xu, Q.; Xia, Y.; Shen, W. The kinetics and cellular automaton modeling of dynamic recrystallization behavior of a medium carbon Cr-Ni-Mo alloyed steel in hot working process. Mater. Sci. Eng. A 2016, 678, 33–43. [Google Scholar] [CrossRef]
  20. Liu, Y.X.; Lin, Y.C.; Li, H.B.; Wen, D.X.; Chen, X.M.; Chen, M.S. Study of dynamic recrystallization in a Ni-based superalloy by experiments and cellular automaton model. Mater. Sci. Eng. 2015, 626, 432–440. [Google Scholar] [CrossRef]
  21. Zhang, C.; Du, Y.; Zhang, L.; Jin, C.; Zhou, X.; Li, F. Hot deformation behavior of C276 superalloy in shifted strain rate compression: Experiments and cellular automaton modelling. J. Alloys Compd. 2022, 898, 162775. [Google Scholar] [CrossRef]
  22. Liu, R.; Zhang, Z.; Zhou, G.; Jia, Z.; Li, D.; Wu, P. A polycrystal plasticity-cellular automaton integrated modeling method for continuous dynamic recrystallization and its application to AA2196 alloy. Int. J. Plast. 2024, 182, 104127. [Google Scholar] [CrossRef]
  23. Wu, G.C.; Lin, Y.C.; Chen, M.S.; Qiu, W.; Zeng, N.F.; Zhang, S.; Naseri, M. Continuous dynamic recrystallization behaviors in a single-phase deformed Ti-55511 alloy by cellular automata model. J. Alloys Compd. 2024, 1002, 175293. [Google Scholar] [CrossRef]
  24. Wang, L.; Qin, J.; Zhai, P.; Jia, H.; Li, M.; Zhu, Y.; Wang, Z. Microstructural Evolution of Dynamic Recrystallization in 30CrNiMoVW Steel During Hot Compression: Constitutive Modeling, Kinetic Model Optimization, and Multiscale FEM coupled CA Simulation. Def. Technol. 2025, in press. [Google Scholar] [CrossRef]
  25. Chen, S.; Li, L.; Peng, Z.; Huo, X.; Sun, H. On the correlation among continuous cooling transformations, interphase precipitation and strengthening mechanism in Ti-microalloyed steel. J. Mater. Res. Technol. 2021, 10, 580–593. [Google Scholar] [CrossRef]
  26. Xiong, Z.; Timokhina, I.; Pereloma, E. Clustering, nano-scale precipitation and strengthening of steels. Prog. Mater. Sci. 2021, 118, 100764. [Google Scholar] [CrossRef]
  27. Peng, Z.; Li, L.; Gao, J.; Huo, X. Precipitation strengthening of titanium microalloyed high-strength steel plates with isothermal treatment. Mater. Sci. Eng. A 2016, 657, 413–421. [Google Scholar] [CrossRef]
  28. Huang, Y.; Zhang, R.; Zhou, Z.; Zhang, P.; Yan, J.; Yuan, Y.; Sun, X. A novel under-aging design to improve the creep rupture life of a precipitation-strengthened Fe–Ni-based superalloy. Mater. Sci. Eng. A 2024, 899, 146459. [Google Scholar] [CrossRef]
  29. Churyumov, A.Y.; Khomutov, M.G.; Tsar’Kov, A.A.; Pozdnyakov, A.V.; Solonin, A.N.; Efimov, V.M.; Mukhanov, E.L. Study of the structure and mechanical properties of corrosion-resistant steel with a high concentration of boron at elevated temperatures. Phys. Met. Metallogr. 2014, 115, 809–813. [Google Scholar] [CrossRef]
  30. Wan, Z.; Hu, L.; Sun, Y.; Wang, T.; Li, Z. Hot deformation behavior and processing workability of a Ni-based alloy. J. Alloys Compd. 2018, 769, 367–375. [Google Scholar] [CrossRef]
  31. Evans, R.W.; Scharning, P.J. Axisymmetric compression test and hot working properties of alloys. Mater. Sci. Technol. 2001, 17, 995–1004. [Google Scholar] [CrossRef]
  32. Roebuck, B.; Lord, J.D.; Brooks, M.; Loveday, M.S.; Sellars, C.M.; Evans, R.W. Measurement of flow stress in hot axisymmetric compression tests. Mater. High Temp. 2006, 23, 59–83. [Google Scholar] [CrossRef]
  33. Ebrahimi, R.; Najafizadeh, A. A new method for evaluation of friction in bulk metal forming. J. Mater. Process. Technol. 2004, 152, 136–143. [Google Scholar] [CrossRef]
  34. Li, L.; Zhou, J.; Duszczyk, J. Determination of a constitutive relationship for AZ31B magnesium and validation through comparison between simulated and real extrusion. J. Mater. Process. Technol. 2006, 172, 372–380. [Google Scholar] [CrossRef]
  35. Dong, S.T.; Wang, J.; Pang, J.; Hu, W.L.; Zhao, J.H.; He, W.W.; Ma, Q.X. Investigation of dynamic recrystallization and grain size evolution behavior of 45CrNi steel treated by upsetting deformation by utilizing FE–CA method. J. Mater. Sci. 2025, 60, 15311–15338. [Google Scholar] [CrossRef]
  36. Dutta, B.; Valdes, E.; Sellars, C.M. Mechanism and kinetics of strain induced precipitation of Nb (C, N) in austenite. Acta Metall. Mater. 1992, 40, 653–662. [Google Scholar] [CrossRef]
  37. Vervynckt, S.; Verbeken, K.; Thibaux, P.; Houbaert, Y. Recrystallization–precipitation interaction during austenite hot deformation of a Nb microalloyed steel. Mater. Sci. Eng. A 2011, 528, 5519–5528. [Google Scholar] [CrossRef]
  38. Schwarze, C.; Kamachali, R.D.; Steinbach, I. Phase-field study of zener drag and pinning of cylindrical particles in polycrystalline materials. Acta Mater. 2016, 106, 59–65. [Google Scholar] [CrossRef]
  39. Hillert, M. On the estimation of the Zener drag on grain boundaries. Scr. Metall. 1984, 18, 1431–1432. [Google Scholar] [CrossRef]
  40. Raabe, D.; Hantcherli, L. 2D cellular automaton simulation of the recrystallization texture of an IF sheet steel under consideration of Zener pinning. Comput. Mater. Sci. 2005, 34, 299–313. [Google Scholar] [CrossRef]
  41. Gouné, M.; Drillet, J.; Maugis, P. Modelling of the interaction between phase transformation and precipitation: Coupled kinetics in microalloyed multiphase steels. Comput. Mater. Sci. 2012, 55, 127–135. [Google Scholar] [CrossRef]
  42. Niu, M.C.; Chen, C.J.; Li, W.; Yang, K.; Luan, J.H.; Wang, W.; Jiao, Z.B. Atomic-scale understanding of solute interaction effects on grain boundary segregation, precipitation, and fracture of ultrahigh-strength maraging steels. Acta Mater. 2023, 253, 118972. [Google Scholar] [CrossRef]
  43. Zhou, F.; Guo, J.; Zhao, Y.; Chu, X.H.; Lei, L.; Zhou, C.S.; Zhao, Z.Z. An improved cellular automaton model of dynamic recrystallization and the constitutive model coupled with dynamic recrystallization kinetics for microalloyed high strength steels. J. Mater. Res. Technol. 2024, 33, 10003–10021. [Google Scholar] [CrossRef]
  44. Lin, Y.C.; Liu, Y.X.; Chen, M.S.; Huang, M.H.; Ma, X.; Long, Z.L. Study of static recrystallization behavior in hot deformed Ni-based superalloy using cellular automaton model. Mater. Des. 2016, 99, 107–114. [Google Scholar] [CrossRef]
  45. Chen, M.S.; Yuan, W.Q.; Lin, Y.C.; Li, H.B.; Zou, Z.H. Modeling and simulation of dynamic recrystallization behavior for 42CrMo steel by an extended cellular automaton method. Vacuum 2017, 146, 142–151. [Google Scholar] [CrossRef]
  46. Guo, Y.N.; Li, Y.T.; Tian, W.Y.; Qi, H.P.; Yan, H.H. Confirmed. The references have been updated. Combined cellular automaton model for dynamic recrystallization evolution of 42CrMo cast steel. Chin. J. Mech. Eng. 2018, 31, 85. [Google Scholar] [CrossRef]
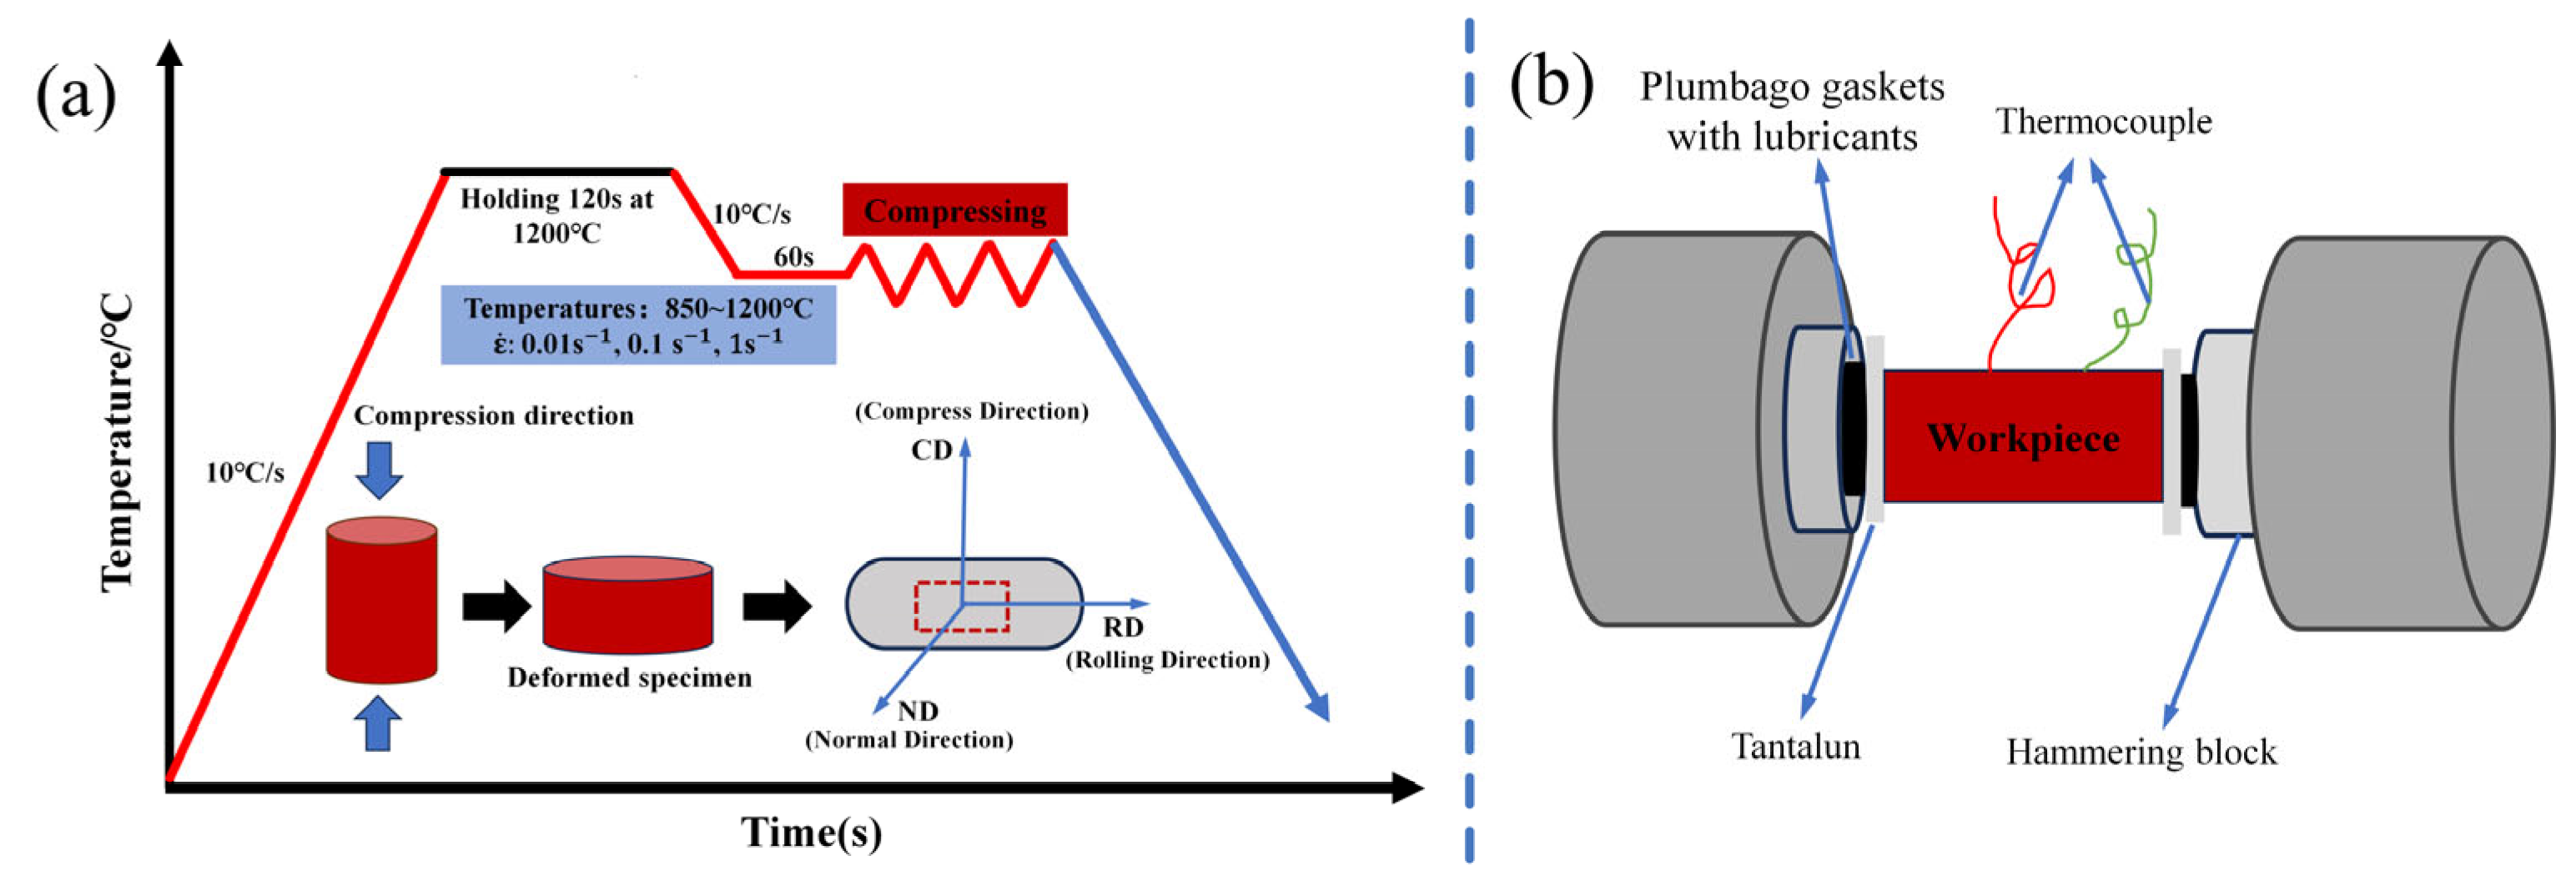
Figure 1. Schematic diagram of (a) experimental process and (b) sample assembly for compression experiment.
Metals 15 01015 g001
Figure 2. Changes in sample shape. (a) Sample photo before and after hot compression; (b) Schematic diagram of compressed sample.
Metals 15 01015 g002
Figure 3. Comparative analysis of friction-adjusted versus raw true stress–strain characteristics and critical stress in 45CrNi alloy steel. (a) ε ˙ = 0.01   s 1 , (b) ε ˙ = 0.1   s 1 , (c) ε ˙ = 1   s 1 , (d) peak stress distribution.
Metals 15 01015 g003
Figure 4. True stress–strain curves of the 45CrNi steel after friction and temperature double correction at a strain rate of 1 s−1.
Metals 15 01015 g004
Figure 5. Schematic representation of the SP-CA modeling approach.
Metals 15 01015 g005
Figure 6. Schematic diagram of SP-CA simulation process: (a) SP particles and initial austenite of DRX, (b) grain boundary, (c) recrystallized nucleation, (d) Von Neumann neighborhood, (e) growth of recrystallized grains, (f) pinning effect of SP particles on grain boundaries.
Metals 15 01015 g006
Figure 7. Microstructural contrast of austenite: (a) native austenite, (b) numerically simulated results (SP-CA method).
Metals 15 01015 g007
Figure 8. SP-CA model-simulated transient microstructures at different compressive strains at strain rate of 0.1   s 1 and temperature of 1050 °C. (a) ε = 0, (b) ε = 0.092, (c) ε = 0.35 , (d) ε = 0.693.
Metals 15 01015 g008
Figure 9. OM maps and EBSD-reconstructed maps of parent austenite of the studied 45CrNi alloy at strain rate of 0.1   s 1 , strain of 0.693, and different hot deformation temperatures of (a,d) T = 1050 °C; (b,e) T = 1100 °C; (c,f) T = 1150 °C.
Metals 15 01015 g009
Figure 10. SP-CA simulation maps of studied 45CrNi alloy at strain rate of 0.1   s 1 , strain of 0.693, and different deformation temperatures of (a,a1,a2) T = 1050 °C; (b,b1,b2) T = 1100 °C; (c,c1,c2) T = 1150 °C.
Metals 15 01015 g010
Figure 11. Data comparison and error analysis of studied 45CrNi steel achieved at strain rate of 0.1   s 1 , strain of 0.693, and different deformation temperatures. (a) Average grain size and error diagram; (b) DRX volume fraction and error diagram.
Metals 15 01015 g011
Figure 12. OM graphs and SP-CA simulation maps of studied 45CrNi steel at deformation temperature of 1150 °C, strain of 0.693, and different strain rates of (a,a1,a2) ε ˙ = 0.01   s 1 ; (b,b1,b2) ε ˙ = 0.1   s 1 ; (c,c1,c2) ε ˙ = 1   s 1 .
Metals 15 01015 g012
Figure 13. Comparison of experimental and SP-CA model simulation results at 1150 °C under different strain rates: (a) DRX volume fraction, (b) flow stress curve, (c) comparison of experimental and simulated values of grain size and DRX volume fraction of the parent phase, (d) comparison of average grain size values.
Metals 15 01015 g013
Table 1. Chemical composition of the studied 45CrNi steel (%, mass fraction).
ElementCSiMnCrNiPSFe
Mass fraction0.450.270.70.61.20.030.035Bal.
Table 2. Bulging coefficient B of studied 45CrNi steel corresponding to different deformation conditions.
Deformation Temperature (℃) Strain   Rate   ( s 1 )
0.010.11
8501.2371.1121.134
9001.0821.1051.119
9501.1331.1061.128
10001.1131.1151.143
10501.1221.1241.114
11001.1091.1131.094
11501.1011.1121.088
12001.2011.1211.092
Table 3. Parameters of the studied 45CrNi steel.
Parameter δ D o b   ( m 3 · s−1)b (m)μ (Pa) θ m v Q a c t   ( J / m o l ) Q b   ( J / m o l )
Value5   ×   10−122.86 × 10−108.2 × 101015°0.35361,246215,000
Disclaimer/Publisher’s Note: The statements, opinions and data contained in all publications are solely those of the individual author(s) and contributor(s) and not of MDPI and/or the editor(s). MDPI and/or the editor(s) disclaim responsibility for any injury to people or property resulting from any ideas, methods, instructions or products referred to in the content.