Article

Influence of Mn in Balancing the Tensile and Electrical Conductivity Properties of Al-Mg-Si Alloy

School of Materials Science & Engineering, Hebei University of Technology, Tianjin 300130, China
*
Author to whom correspondence should be addressed.
Metals 2025, 15(8), 923; https://doi.org/10.3390/met15080923
Submission received: 10 July 2025 / Revised: 8 August 2025 / Accepted: 15 August 2025 / Published: 21 August 2025

Abstract

This study investigated the influence of manganese (Mn) on microstructure evolution and property optimization in Al-0.6Mg-0.58Si-0.24Fe-xMn alloys under both as-cast and hot-extruded conditions. The balance mechanisms of Mn in tensile properties and electrical conductivity of Al-Mg-Si alloy were elucidated, achieving synergistic optimization of strength-elongation-conductivity. For non-equilibrium solidified as-cast alloys, JMatPro simulations coupled with Fe-rich phase size statistics reveal an inhibitory effect of Mn on β-Al5FeSi phase formation. Matthiessen’s rule analysis quantitatively clarifies Mn-induced resistivity variations through solid solution and phase morphology modifications. In hot-extruded alloys, TEM characterization was used to analyze the structure of Al-Fe-Mn-Si quaternary compounds and clarify their combined effects with typical Mg2Si phases on dislocation and subgrain configurations. The as-cast Al-0.6Mg-0.58Si-0.24Fe-0.18Mn alloy demonstrate comprehensive properties with ultimate tensile strength, elongation and electrical conductivity. The contributions of dislocations, grain boundaries and precipitates to resistivity are relatively minor, so the main source of resistivity in hot-extruded alloys is still Mn. The hot-extruded alloy containing 0.18 wt.% Mn still has better properties, with a tensile strength of 176 MPa, elongation of 24% and conductivity of 48.07 %IACS.

1. Introduction

Al-Mg-Si alloys possess low density and excellent intrinsic conductivity. Compared with copper, the conductivity of Al is still lower. Its density is one-third that of copper and the mass resistivity is half that of copper. Consequently, Al-based conductors exhibit superior current-carrying efficiency under equivalent weight conditions, making them ideal materials for overhead conductors such as All Aluminum Alloy Conductor (AAAC) and Aluminum Conductor Steel Reinforced (ACSR) [1,2,3]. However, their development is hampered by the incompatibility of electrical conductivity and mechanical properties [4]. Therefore, achieving the trade-off between mechanical properties and electrical conductivity of Al-Mg-Si alloys has become a research hotspot.
Performance optimization primarily relies on microalloying, plastic deformation, and heat treatment. Notably, iron (Fe), an inevitable impurity in industrial processing, exerts dual influences on alloy properties. On the one hand, Fe reacts with Al and Si to form acicular intermetallic compounds such as β-Al5FeSi, which severely degrade tensile strength and elongation, particularly when Fe content exceeds 0.5 wt.% [5,6,7]. On the other hand, Al5FeSi phases consume excess Si to reduce electron scattering and increase conductivity [8,9]. Zhao et al. [5] demonstrated that adding 0.2 wt.% Fe to Al-0.5Mg-0.35Si alloy increased electrical conductivity but reduced tensile strength by nearly 20%. This clearly highlights the trade-off of Fe on general performance [10].
To suppress harmful β-Al5FeSi phases, manganese (Mn) is introduced to modulate Fe phase morphology. Mn promotes the formation of spherical phases such as α-Al (Fe, Mn) Si, significantly improving mechanical properties [11,12]. Xu et al. [13] revealed that optimizing Mn/Fe ratio synergistically enhances both strength and elongation. This improvement is due to the formation of α-Al15(FeMn)3Si2) phase [14,15,16,17,18]. However, Mn addition complicates the behavior of conductivity. Zheng et al. [19] reported that introducing Mn alone reduced elongation by ~40% and conductivity by ~22% in Al-Mg-Si alloys. Even after rolling deformation restored partial ductility, conductivity was still 10% lower than that of Mn-free alloys. These findings indicate that mechanisms by which Mn affects mechanical properties and conductivity is not yet clear.
The systematic studies of Mn and Fe on the mechanical and electrical properties of Al-Mg-Si alloys remain limited. Therefore, this study aims to elucidate how Mn affects the balance between mechanical properties and electrical conductivity of Al-Mg-Si alloys, and elucidates the mechanisms by which Mn addition governs the evolution of Al(FeMn)Si phases, through microstructural characterization and thermodynamic calculations. It clarifies their impacts on electron transport and dislocation motion. The findings will provide theoretical guidance for the composition design and process optimization of high-performance aluminum conductors.

2. Materials and Experiment Procedures

2.1. Sample Preparation

Al-0.6Mg-0.58Si-0.24Fe and Al-1.9Mn master alloys were employed as raw materials. Samples with varying manganese (Mn) contents were prepared, including original alloy as the reference group (0#), and experimental groups with Mn additions of 0.12 wt.% (1#), 0.18 wt.% (2#) and 0.24 wt.% (3#). The detailed chemical compositions are presented in Table 1. Firstly, in order to prepare alloys with varying levels of manganese, the Al-Mg-Si alloys were melted in a graphite crucible and subsequently transferred to a pit-type resistance furnace at 750 °C for melting. High-purity argon gas was introduced into the melt for 2 min while stirring, followed by 3 min of static treatment to remove slag. After this, varying levels of the Al-1.9Mn master alloy were introduced to the molten aluminum, contingent on the composition of each alloy and held for 10 min to ensure complete dissolution. High-purity argon gas was reintroduced for an additional 3 min of degassing, followed by a 5 min rest period to facilitate slag removal. The molten alloy was poured into a metal mold preheated to 200 °C. After cooling, the cast alloy was retrieved for further processing. The cast alloy was subjected to a solution treatment in a SX-G01123 high-temperature furnace at 560 ± 1 °C for 8 h, followed by air cooling to room temperature.
The material was then hot-extruded using a TXCJ-300 aluminum extruder (Wuxi Weite Machinery and Equipment Manufacturing Plant, Wuxi, China). Preheat the casting billet and extrusion die to 450 °C with an extrusion ratio of 16. Following cooling to room temperature, cylindrical specimens with dimensions of Φ15 × 10 mm were cut from the cast ingots.

2.2. Microscopic Morphology Characterization

Specimens were sequentially ground using sandpapers of increasing grit sizes: 600#, 800#, 1000#, 1500#, and 2000#. Rough grinding was followed by water sanding with 2500# sandpaper to ensure a smooth finish. With each transition to a higher grit, the specimen was rotated 90° to eliminate residual scratches from the previous step. Lower pressure was applied during the use of finer grit sandpapers to achieve a smoother surface. Once a smooth and bright surface was obtained, specimens were mechanically polished using a PG-2 type polishing machine (Yantai Aorun Metallographic Equipment Company Limited, Yantai, China) until no scratches were visible under low-power microscopy. Polished specimens underwent chemical etching using a hydrofluoric acid solution (0.5 mL HF + 99.5 mL H2O). Microstructures of the etched specimens were examined using an Axio Scope A1 light microscope (Zeiss, Oberkochen, Germany). Detailed microstructural analysis was conducted using a JSM-6510A lanthanum hexaboride scanning electron microscope (SEM) (JEOL, Tokyo, Japan) operating in secondary electron mode. The positioning of the sample should be in a direction that is parallel to the direction of hot extrusion. Elemental analysis of specific regions was performed using energy dispersive spectroscopy (EDS) in point, line and surface scan modes. Secondary phases with different contrasts relative to the matrix were identified using backscattered electron mode. The SEM operated at an accelerating voltage of 15 kV and a working current of 55–60 μA. The lengths of Fe-rich phases in the alloy were measured quantitatively using Image-J software (Fiji version), providing a comprehensive assessment of the microstructural features.
The specimens were initially sectioned into thin slices (~300 μm). The sliced specimens were mechanically ground to a thickness of approximately 50 μm. Circular discs with a diameter of 3 mm were punched out from the ground samples to facilitate subsequent electrolytic thinning. The electrolytic twinjet was carried out using an MTP-1A electrolytic twinjet apparatus (YULONG Times Technology, Beijing, China) where the electrolyte was a 30% nitric acid and 70% methanol mixture and the temperature was controlled to −25 ± 1 °C by means of ethanol and dry ice. The dislocations, subcrystalline structure, and precipitated phase (Mg2Si phase) of the specimens (parallel to the direction of hot extrusion) were characterized and analyzed using a JEOL JEM-2100F transmission electron microscope (TEM) (JEOL, Tokyo, Japan).

2.3. Mechanical Properties Test

The tensile test at room temperature is conducted using the WDW-200 electronic universal testing machine (Jinan Shijin Group Co., Ltd., Jinan, China). The tensile speed is set at 2 mm/min, and the test method is in strict accordance with the requirements specified in the national standard GB/T 228-2010 [20] and the axis of the measuring specimen is oriented parallel to the direction of hot extrusion. In order to ensure the accuracy and reliability of the test data, three tensile specimens were taken from each component of the cast Al-0.6Mg-0.58Si-0.24Fe-xMn (x = 0.02, 0.12, 0.18, 0.24) alloy and the hot-extruded Al-0.6Mg-0.58Si-0.24Fe-xMn (x = 0.02, 0.18) was utilized for the experimental investigation. To ensure the accuracy and reliability of the obtained data, a minimum of three specimens from each group were subjected to testing, and the mean value was recorded as the resultant figure.

2.4. Electrical Conductivity Measurement

The electrical conductivity of aluminum alloys during casting and hot extrusion processes was evaluated through the utilization of a Sigma 2008B portable eddy current conductivity meter (Xiamen Tianyan Instrument Co., Ltd., Xiamen, China), incorporating varying concentrations of Mn element, and the axis of the measuring specimen is oriented parallel to the direction of hot extrusion. A total of three independent measurements were obtained for each specimen, subsequently averaged to determine the final conductivity values.

2.5. Thermodynamic Calculation

The Gibbs free energy of formation of β-AlsFeSi alloy was calculated using the TCAL6 database and solidification model with JMatPro software (v13.1). The initial procedure entails the automatic de-sampling process. Subsequently, an evaluation is conducted to ascertain the precision of the automatic take samples. This evaluation is undertaken with the objective of approximating the size of the manual adjustment threshold. Subsequent to a series of automatic adjustments, the manual take is adopted in an attempt to minimize error.

3. Results

3.1. Microstructure Evolution of As-Cast Alloys

Figure 1 shows the typical SEM morphology of 0# and 1# alloys in the as-cast state. There are obvious segregation and elongated acicular non-equilibrium crystal phases at grain boundaries. In Figure 1b, the 0# alloy exhibits elongated acicular precipitates, preliminarily identified as the typical β-Fe phase. The alloy with 0.12 wt.% Mn still contains a significant amount of acicular precipitates (Figure 1d). However, the end of precipitates locally dissolved and fractured (indicated by yellow arrows). The element distribution chart shows enrichment of Fe and Si elements in the β-Fe phase; therefore, it is preliminarily inferred to be β-Al5FeSi.
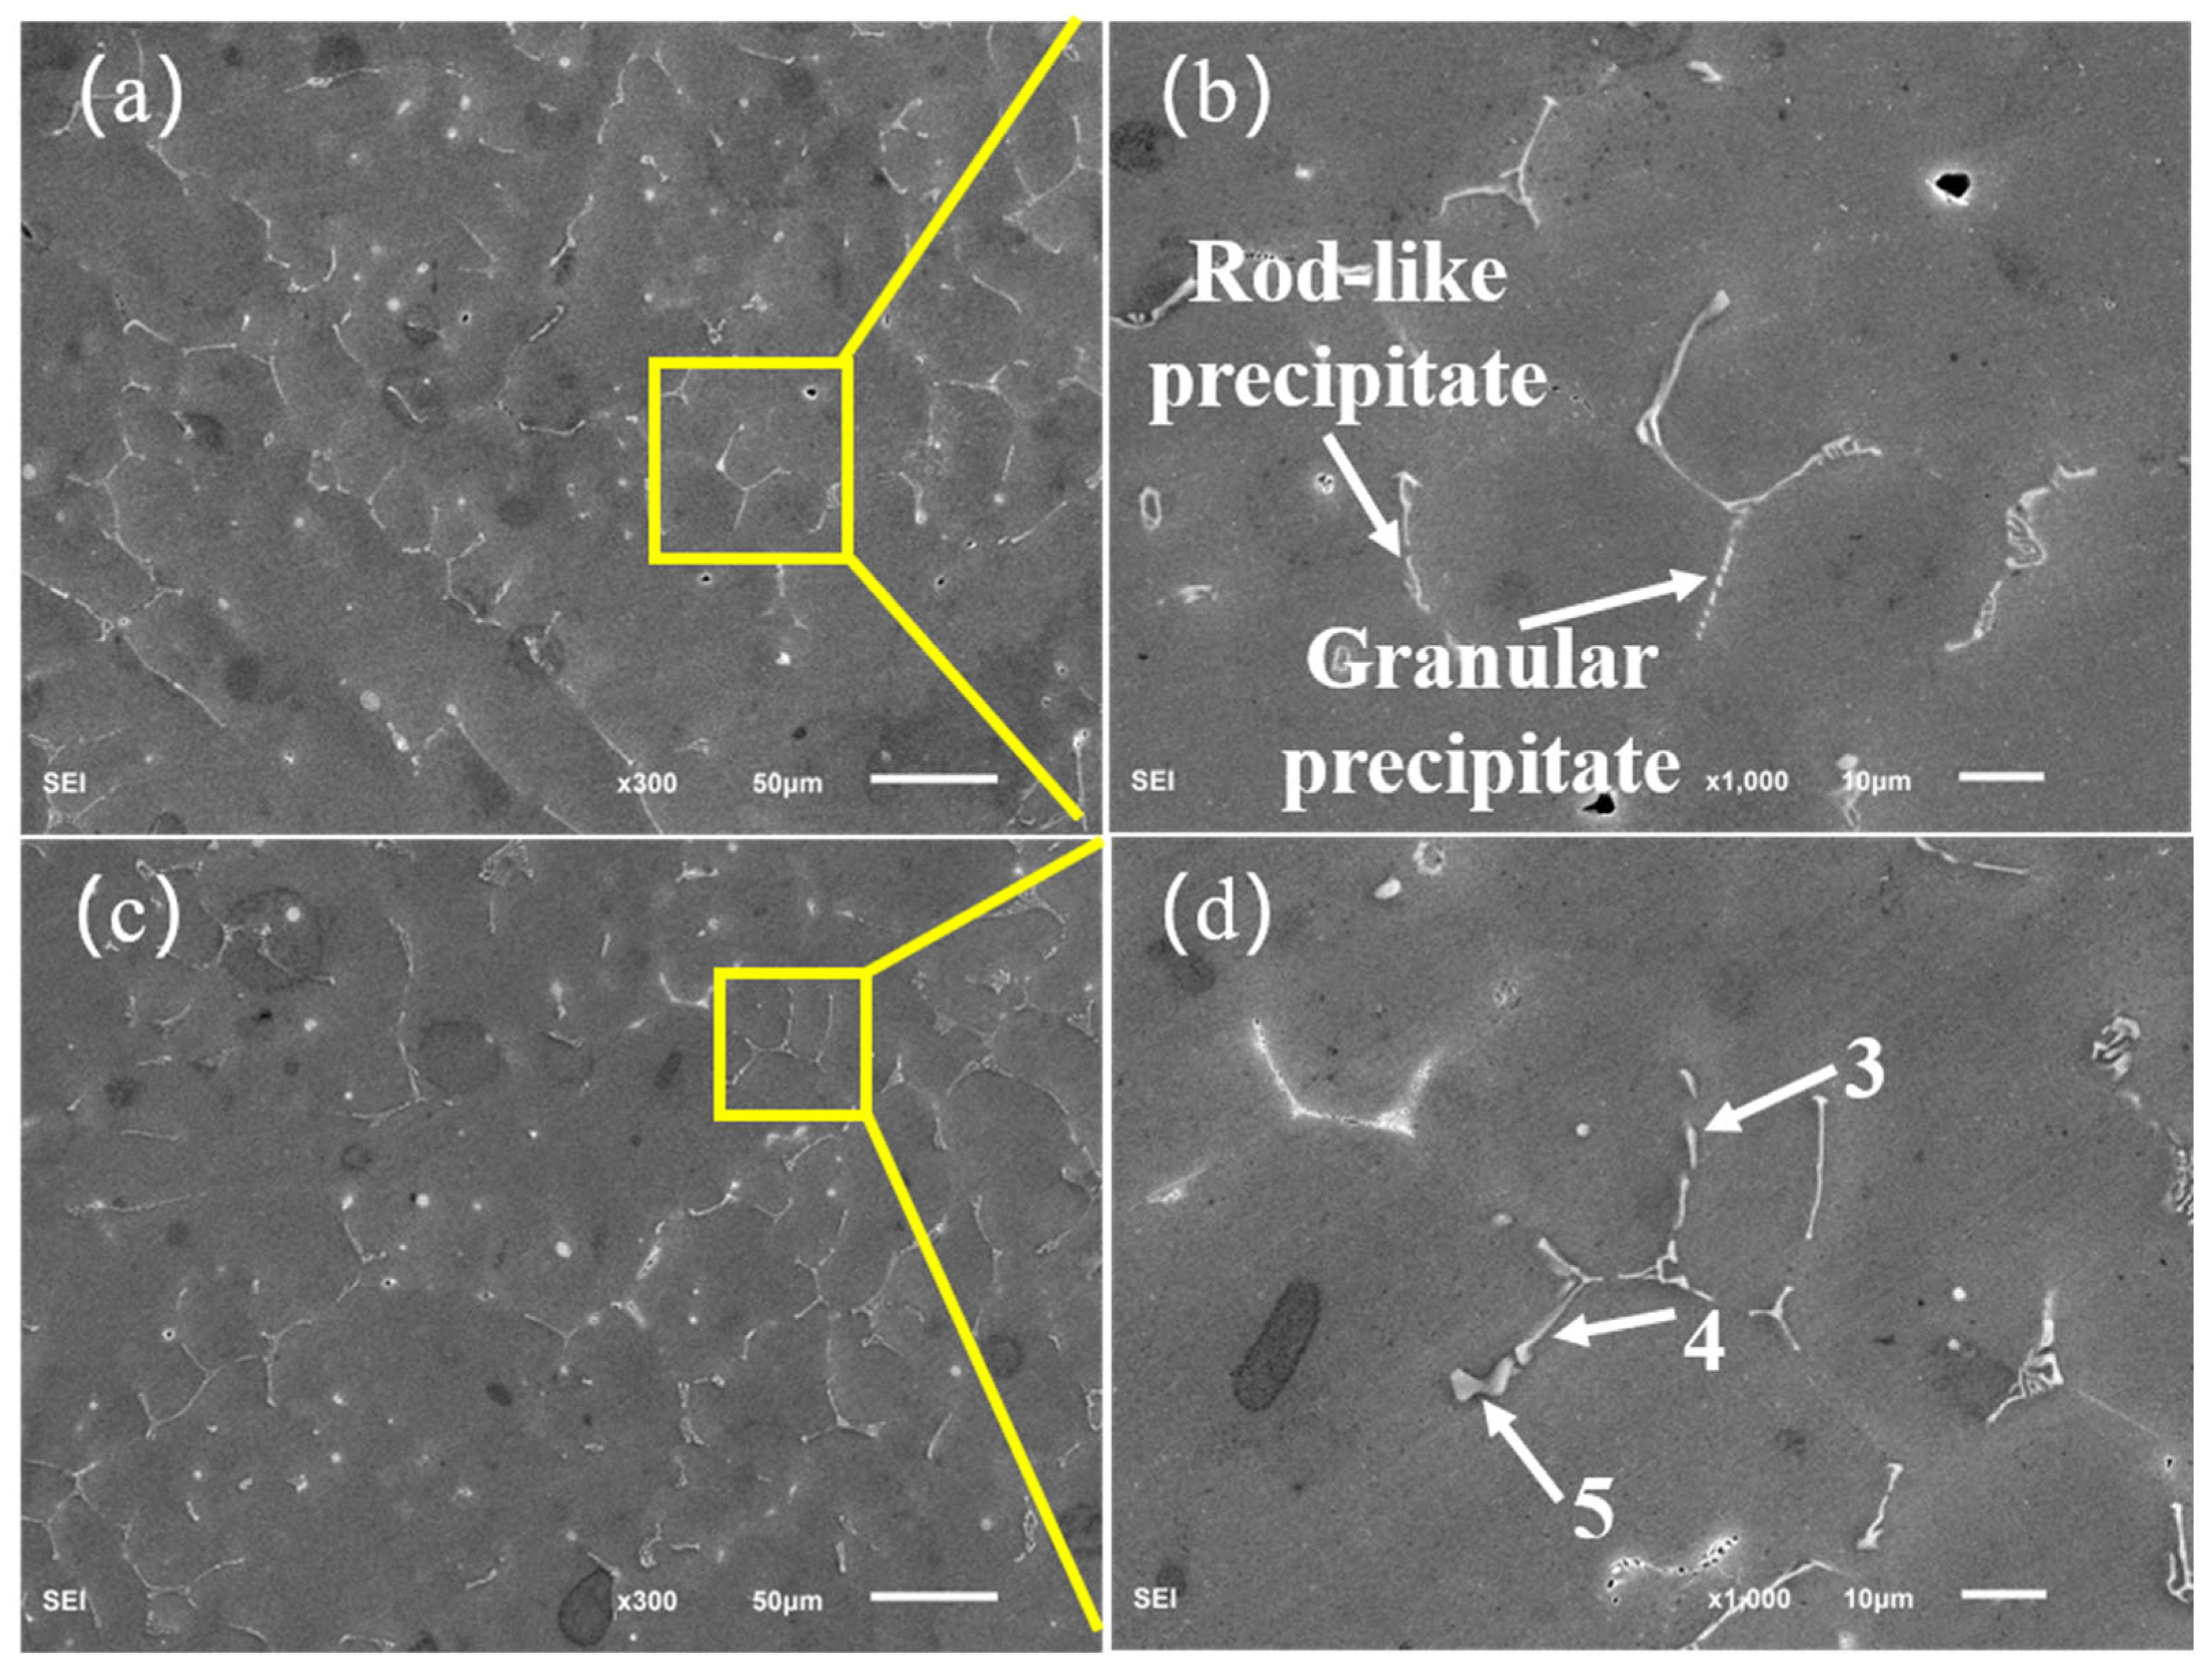
Figure 2 shows the typical SEM morphology of 2# and 3# alloys in the as-cast state. As shown in Figure 2a,b, 0.18 wt.% Mn results in a significant transformation of the long acicular β-Al5FeSi into shorter rod-like and granular precipitates compared with 0# and 1# alloys. When the Mn content is 0.24 wt.%, the Fe-rich phase shows block-like coarsening, as indicated by arrow 5 in Figure 2c,d. Table 2 presents EDS results of precipitates indicated by numerical arrows in Figure 1 and Figure 2. EDS results indicate that compared with 0# and 1# alloys, Mn content of precipitates in the 2# and 3# alloys is significantly increased. By calculating the proportion of element content, it can be found that Fe/Si ratio of long acicular β-Al5FeSi is about 1.0 in 0# and 1# alloys, while (Fe, Mn)/Si values of precipitates are in the range of 1.4–1.8 in 2# and 3# alloys. In summary, morphological evolution and EDS results suggest that long acicular β-Fe is typical β-Al5FeSi phase [21,22,23].
Figure 3 presents the surface scan analysis results of short rod-like precipitates in 2# alloy. Analysis shows that when Mn content is increased to 0.18 wt.%, dissolution fracture occurs inside the long acicular β-Al5FeSi with a specific orientation. Mn enrichment was observed in the short rod-like precipitates, similar to enrichment of Fe and Si [24,25]. These observations highlight the function of Mn in modifying the morphology and distribution of β-Al5FeSi phase.

3.2. Properties of As-Cast Alloys

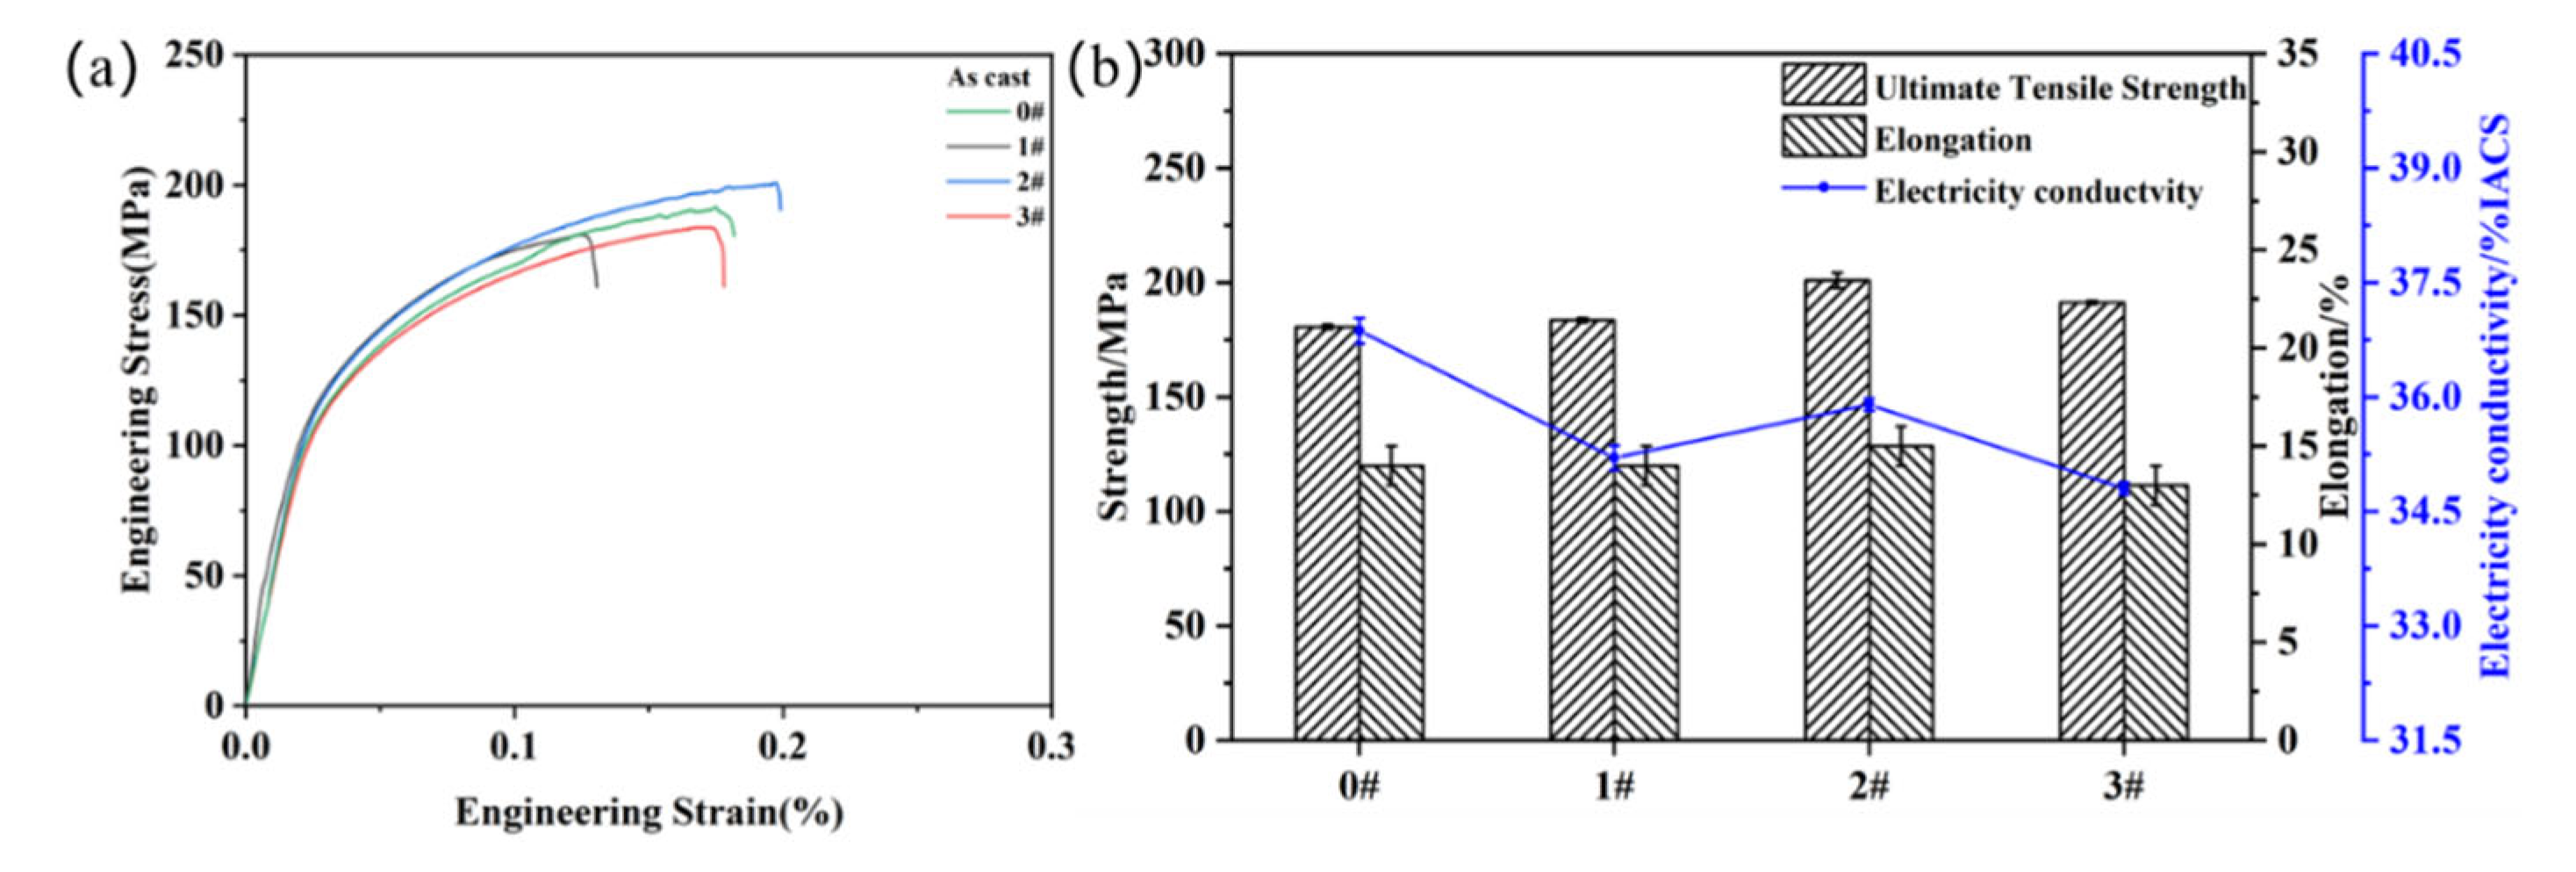
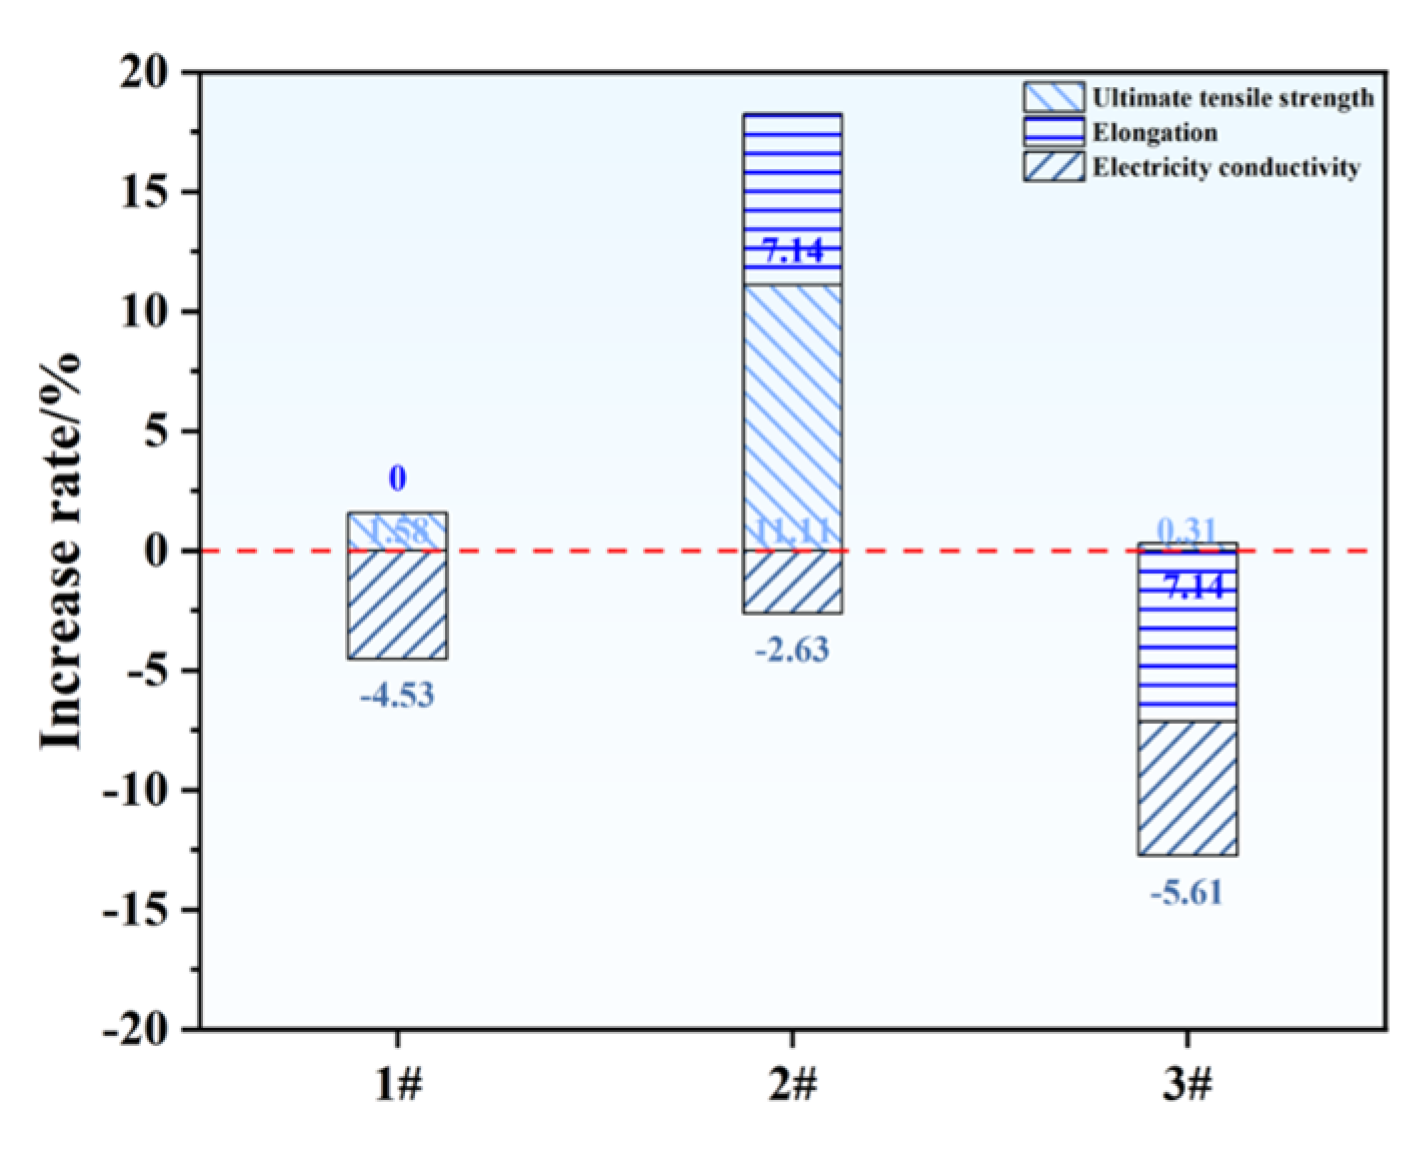
Figure 4 presents tensile properties and electrical conductivity of Al-0.6Mg-0.58Si-0.24Fe-xMn alloys in as-cast state. Figure 5 shows properties change rate of as-cast alloys. As shown in the bar graphs of Figure 4b, tensile strength and elongation exhibit an initial increase followed by a decrease. When the Mn addition is 0.12 wt.%, tensile strength remains relatively unchanged and elongation were significantly lower compared with 0# alloy. Acicular precipitates in 2# alloy transform into short rod-like phases, effectively reducing matrix cutting and disrupting the crack propagation path. 2# alloy shows the highest tensile strength and elongation, reaching 201 MPa and 15%. However, tensile properties of 3# alloy decline, with tensile strength dropping to 191 MPa and elongation reducing to 13%. Tensile strength of 1# and 3# alloys shows a minimal increase compared with 0#, while 3# alloy experiences a 7.14% decrease in elongation. Both of these also show a decrease in electrical conductivity. In addition, 2# alloy demonstrates an increase in tensile strength (11.11%) and elongation (7.14%), with a minimal decrease in electrical conductivity of only 2.63% as illustrated in Figure 5. Overall, as-cast 2# alloy has the best comprehensive properties, achieving a balance between mechanical and electrical conductivity.

3.3. Microstructure Evolution of Hot-Extruded Alloys

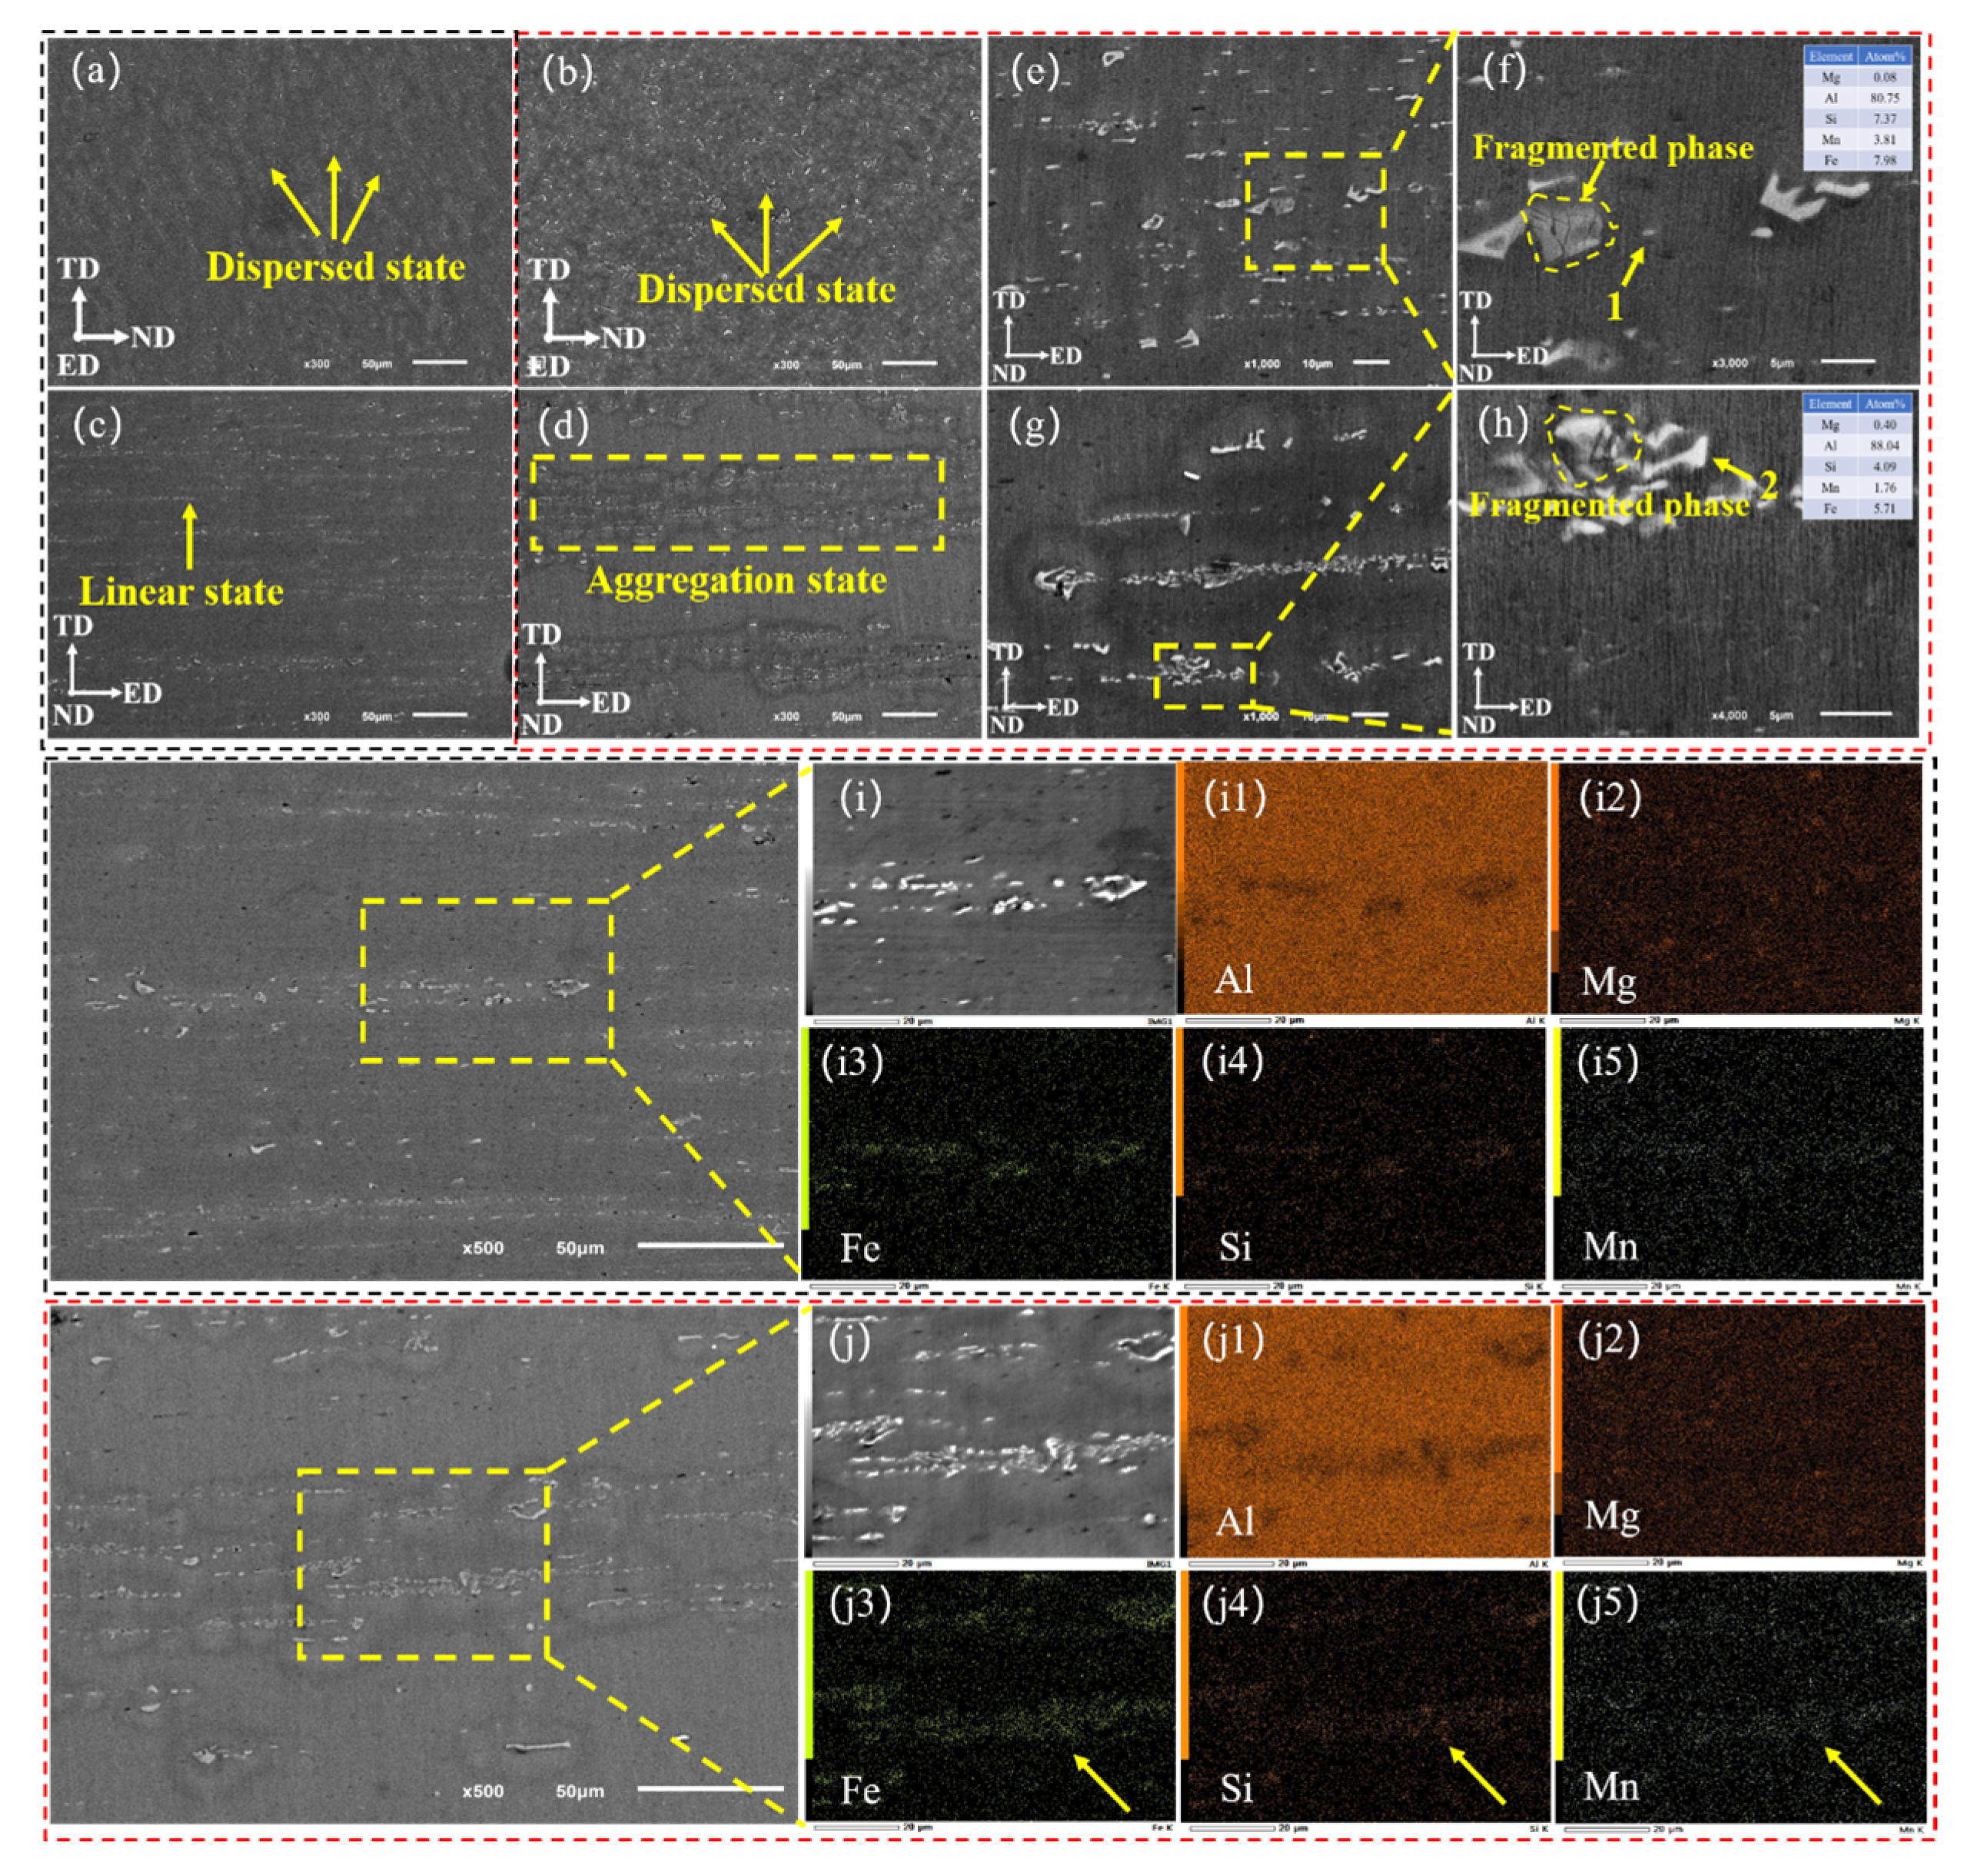
Figure 6 shows the typical microstructure morphology and EDS analysis results of 2# and 3# alloys in hot-extruded state. From Figure 6a–h, it can be observed that hot extrusion promotes fragmentation and distribution of precipitates. Unlike the long acicular and short rod-like precipitates in as-cast alloys, dispersed precipitates appear in hot-extruded alloys. As shown in Figure 6c,d, precipitates in 0# alloy exhibit a linear distribution along extrusion direction, while exhibiting a bundle-like distribution in 2# alloy. As clearly shown in Figure 6f,h, the point-scan of yellow arrows 1 and 2 showed higher Fe, Mn and Si in precipitates. The friction and extrusion forces facilitate more homogeneous and dispersed distribution of precipitates [26]. As illustrated in Figure 6i,j, the elemental distribution of hot-extruded 0# and 2# alloys is demonstrated. The 2# alloy demonstrates a substantial enrichment of Mn and Fe element within the precipitates. This finding indicates that the precipitates undergo not only morphological and dimensional changes, but also form more complex compounds as the manganese content rises. Mn may promote the formation of Al-Fe-Mn-Si quaternary compounds in hot-extruded 2# alloy.

3.4. Properties of Hot-Extruded Alloys

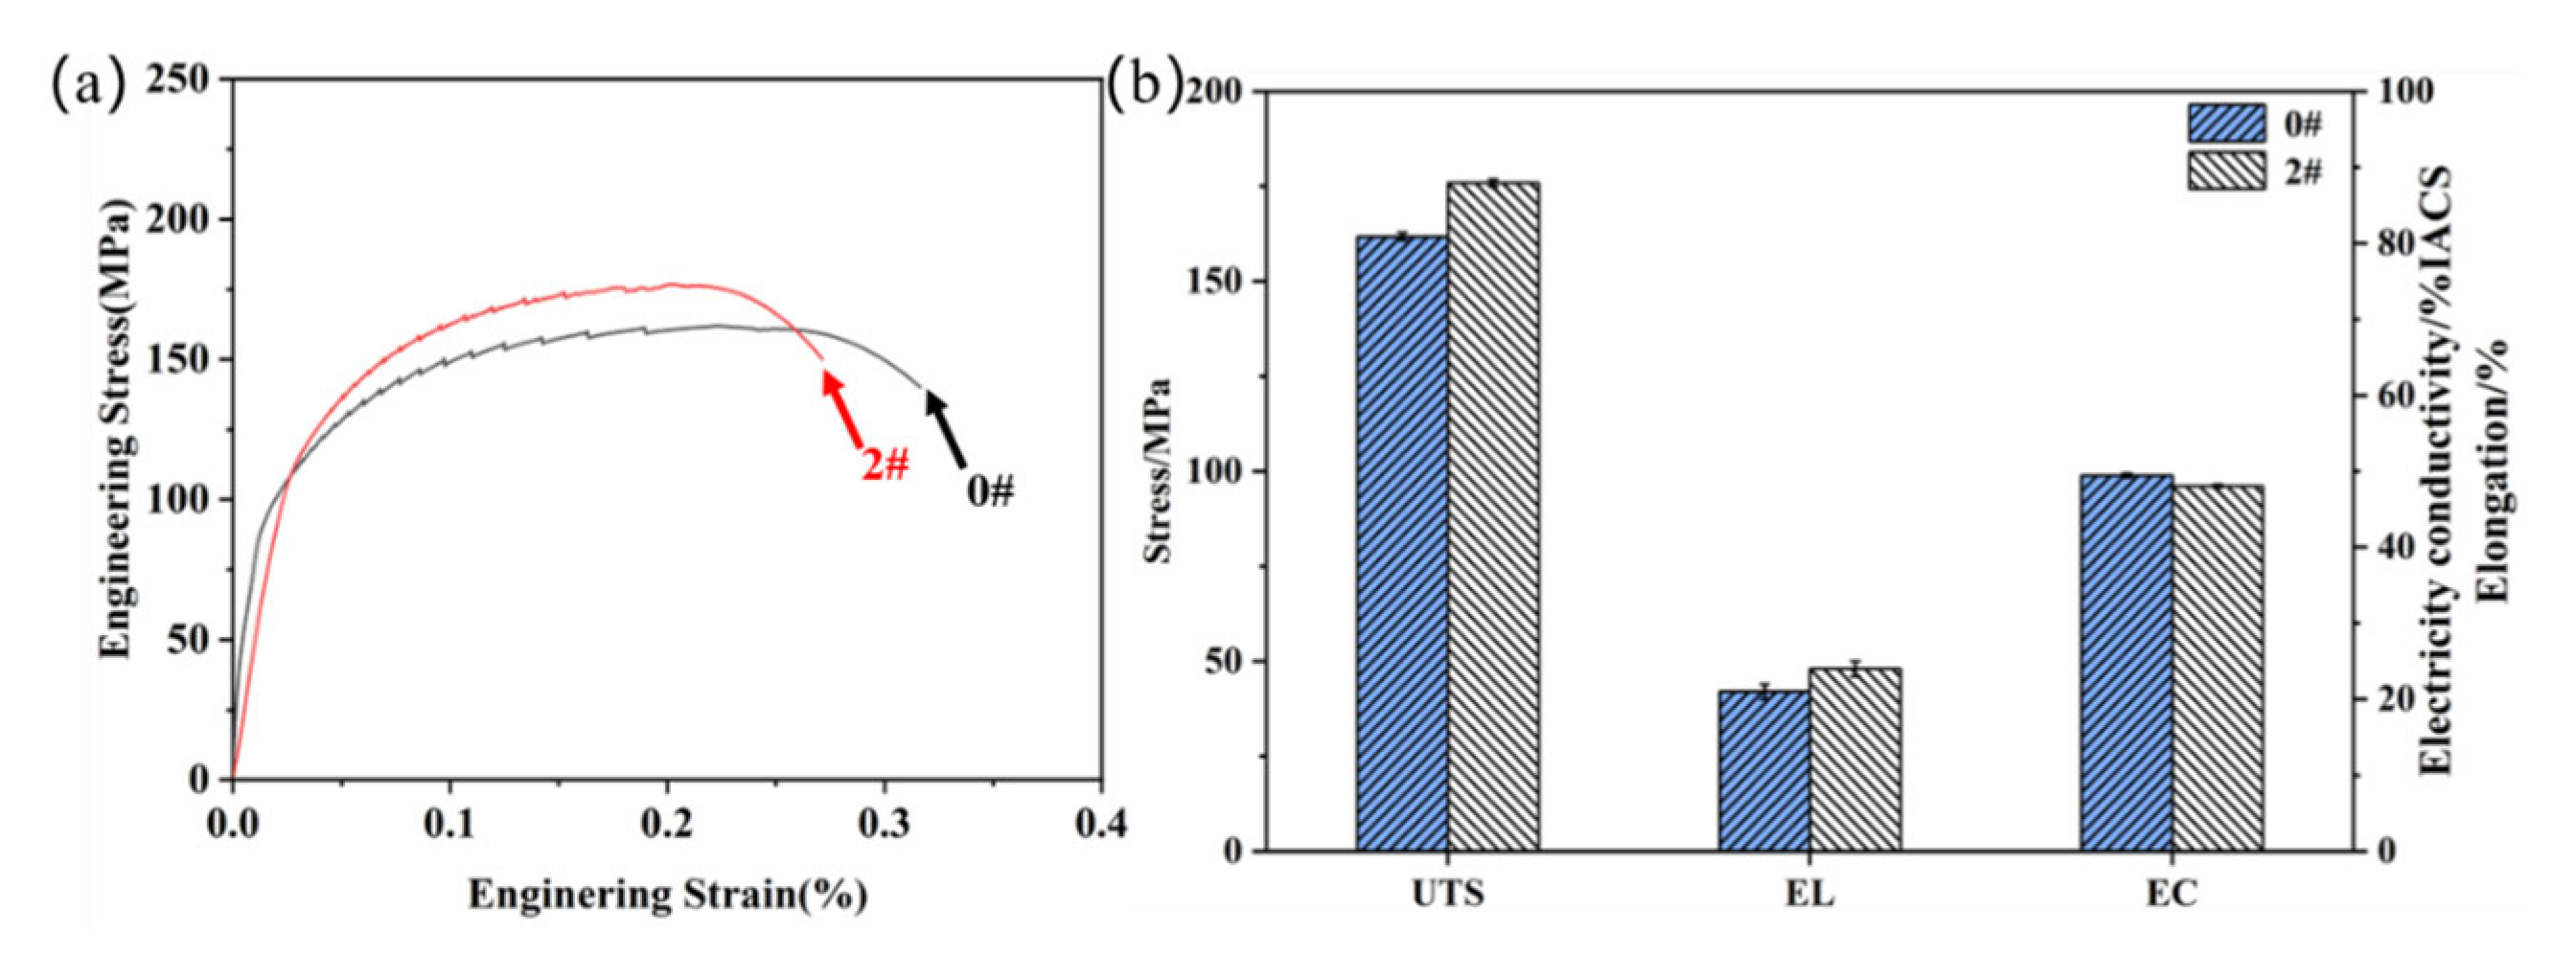
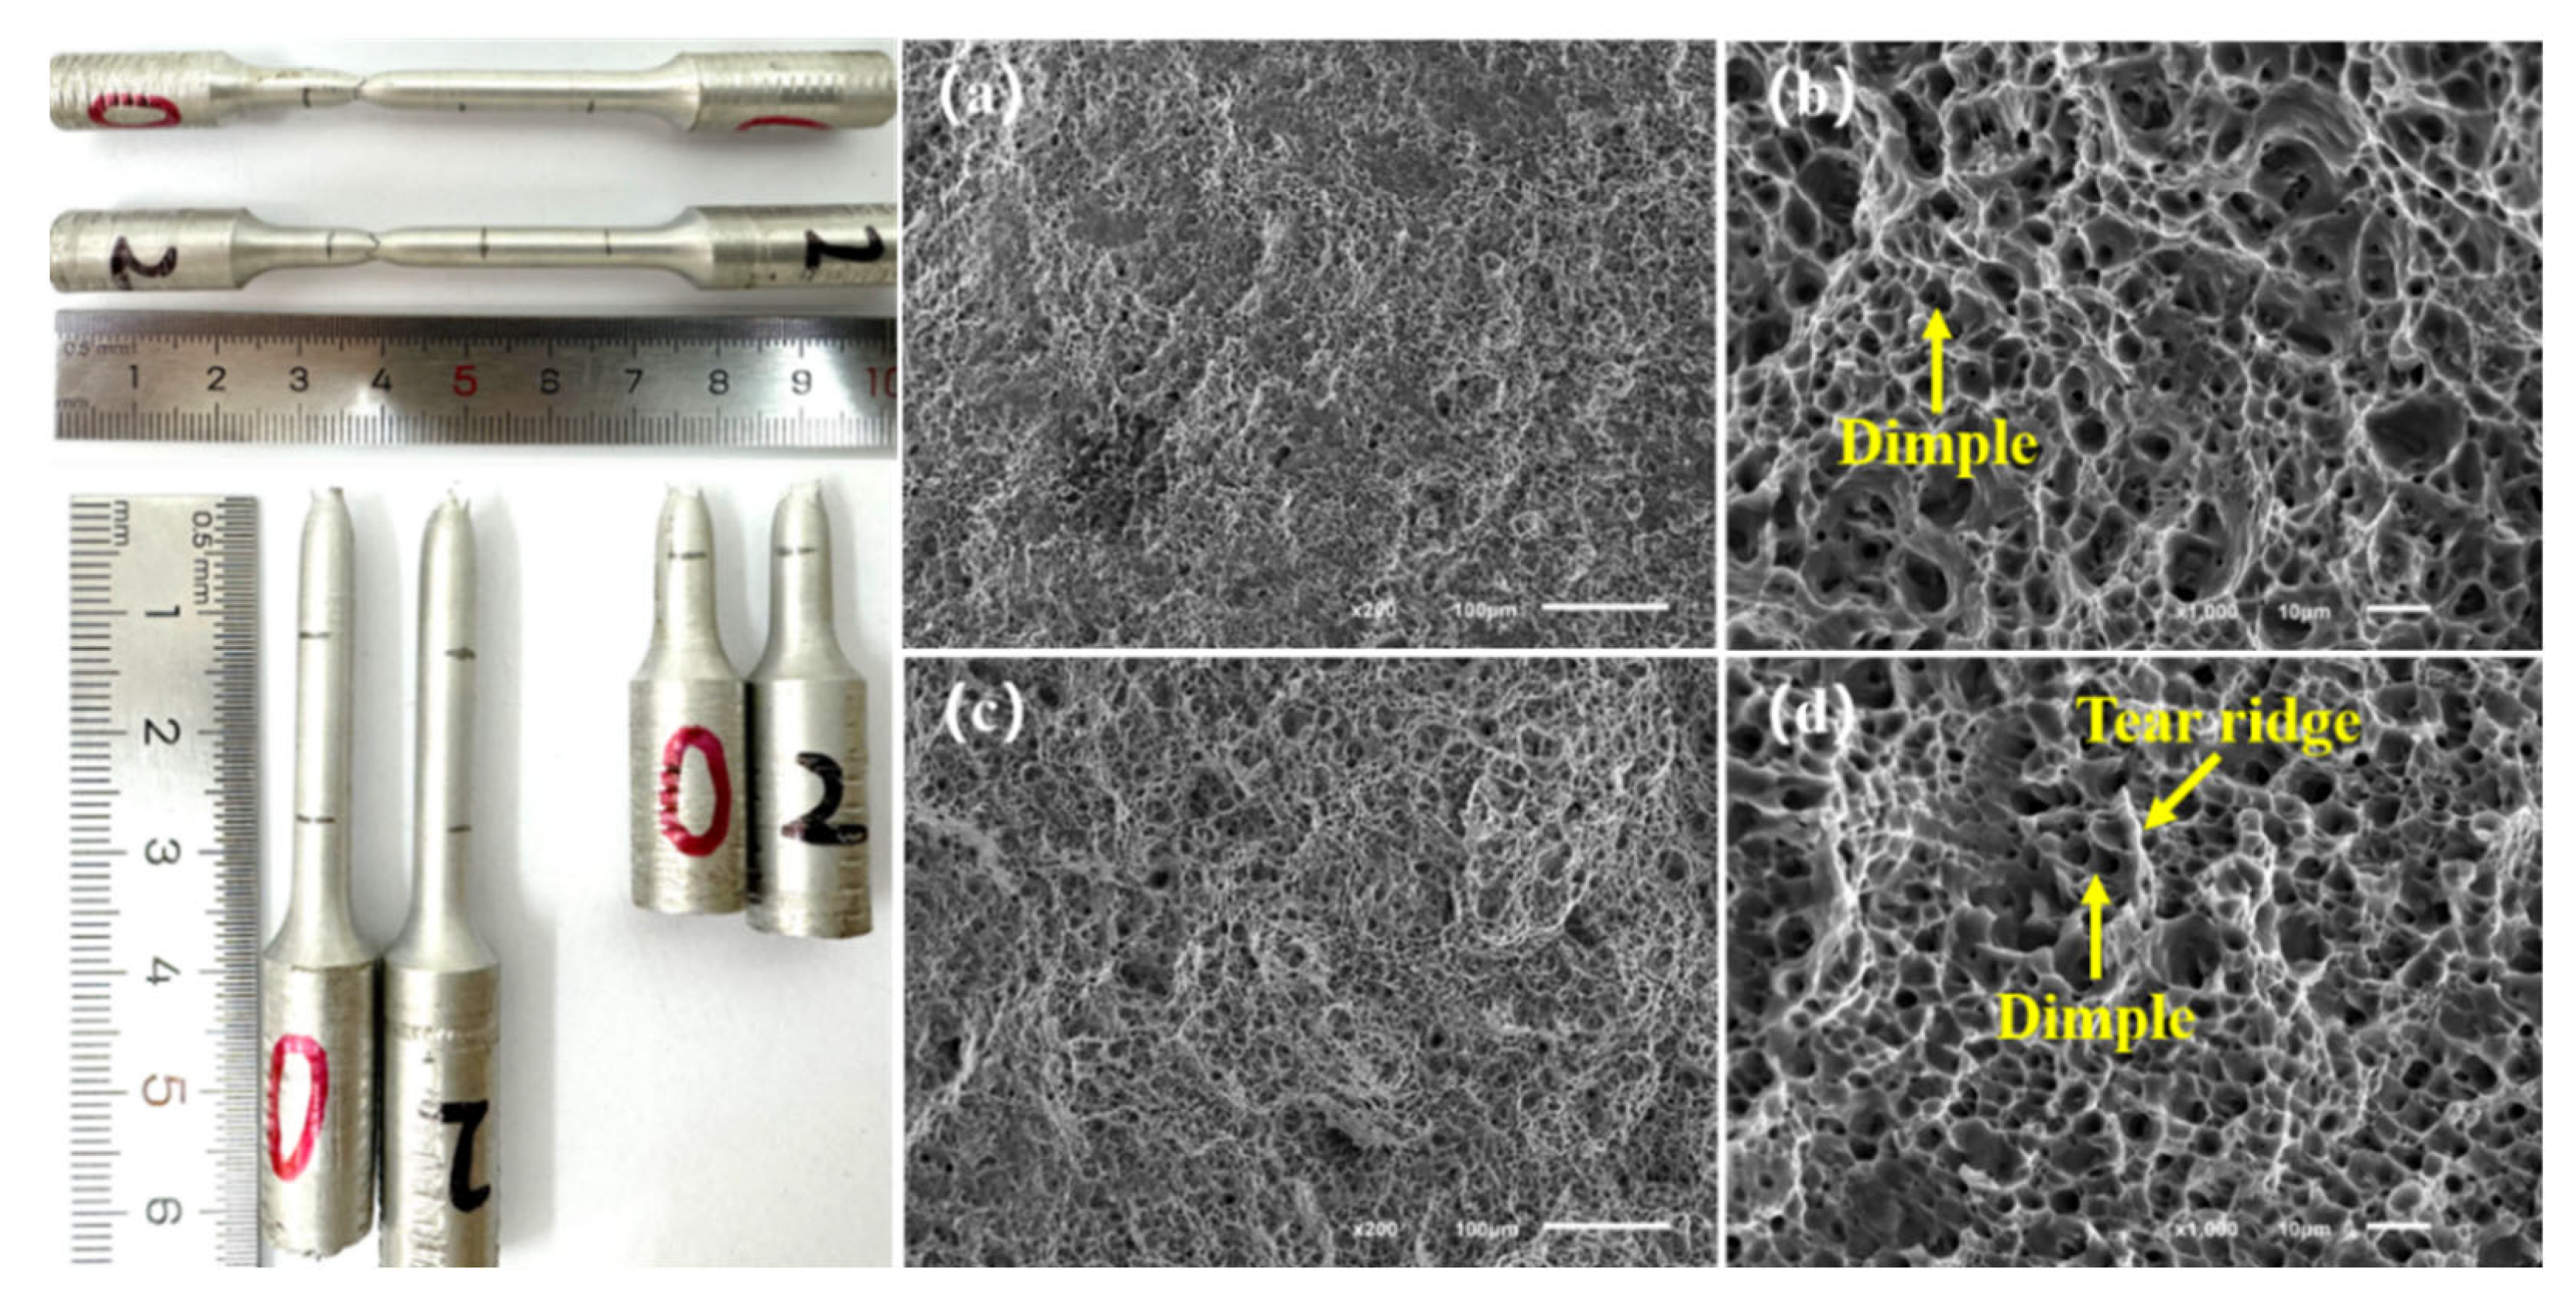
Figure 7 presents tensile properties and electrical conductivity of hot-extruded alloys. After hot extrusion, 0# alloy exhibits a tensile strength of 162 MPa with an elongation of 19%. In comparison, properties of 2# alloy are improved compared with 0# alloy, with a tensile strength increase of 8.72% to 176 MPa and an elongation increase of 26.32% to 24%. The conductivity of 2# alloy decreased by only 2.83%. Power transmission conductors experience various mechanical stresses, such as stretching, bending, torsion and vibration during installation and operation. High plastic toughness allows conductor materials to maintain structural integrity under these stresses, preventing fractures and ensuring reliability and safety. Figure 8 shows typical fracture morphology of the hot-extruded 0# and 2# alloys, from which clear necking and small equiaxed dimples can be observed. The grain refinement and release of residual stress during hot extrusion promote the formation of small ductile dimples, resulting in excellent plasticity [27]. In conclusion, similar to the as-cast state, hot-extruded 2# alloy has a better combination of mechanical properties and conductivity.

4. Discussion

4.1. Formation Mechanism and Morphological Evolution of Fe-Rich Phase

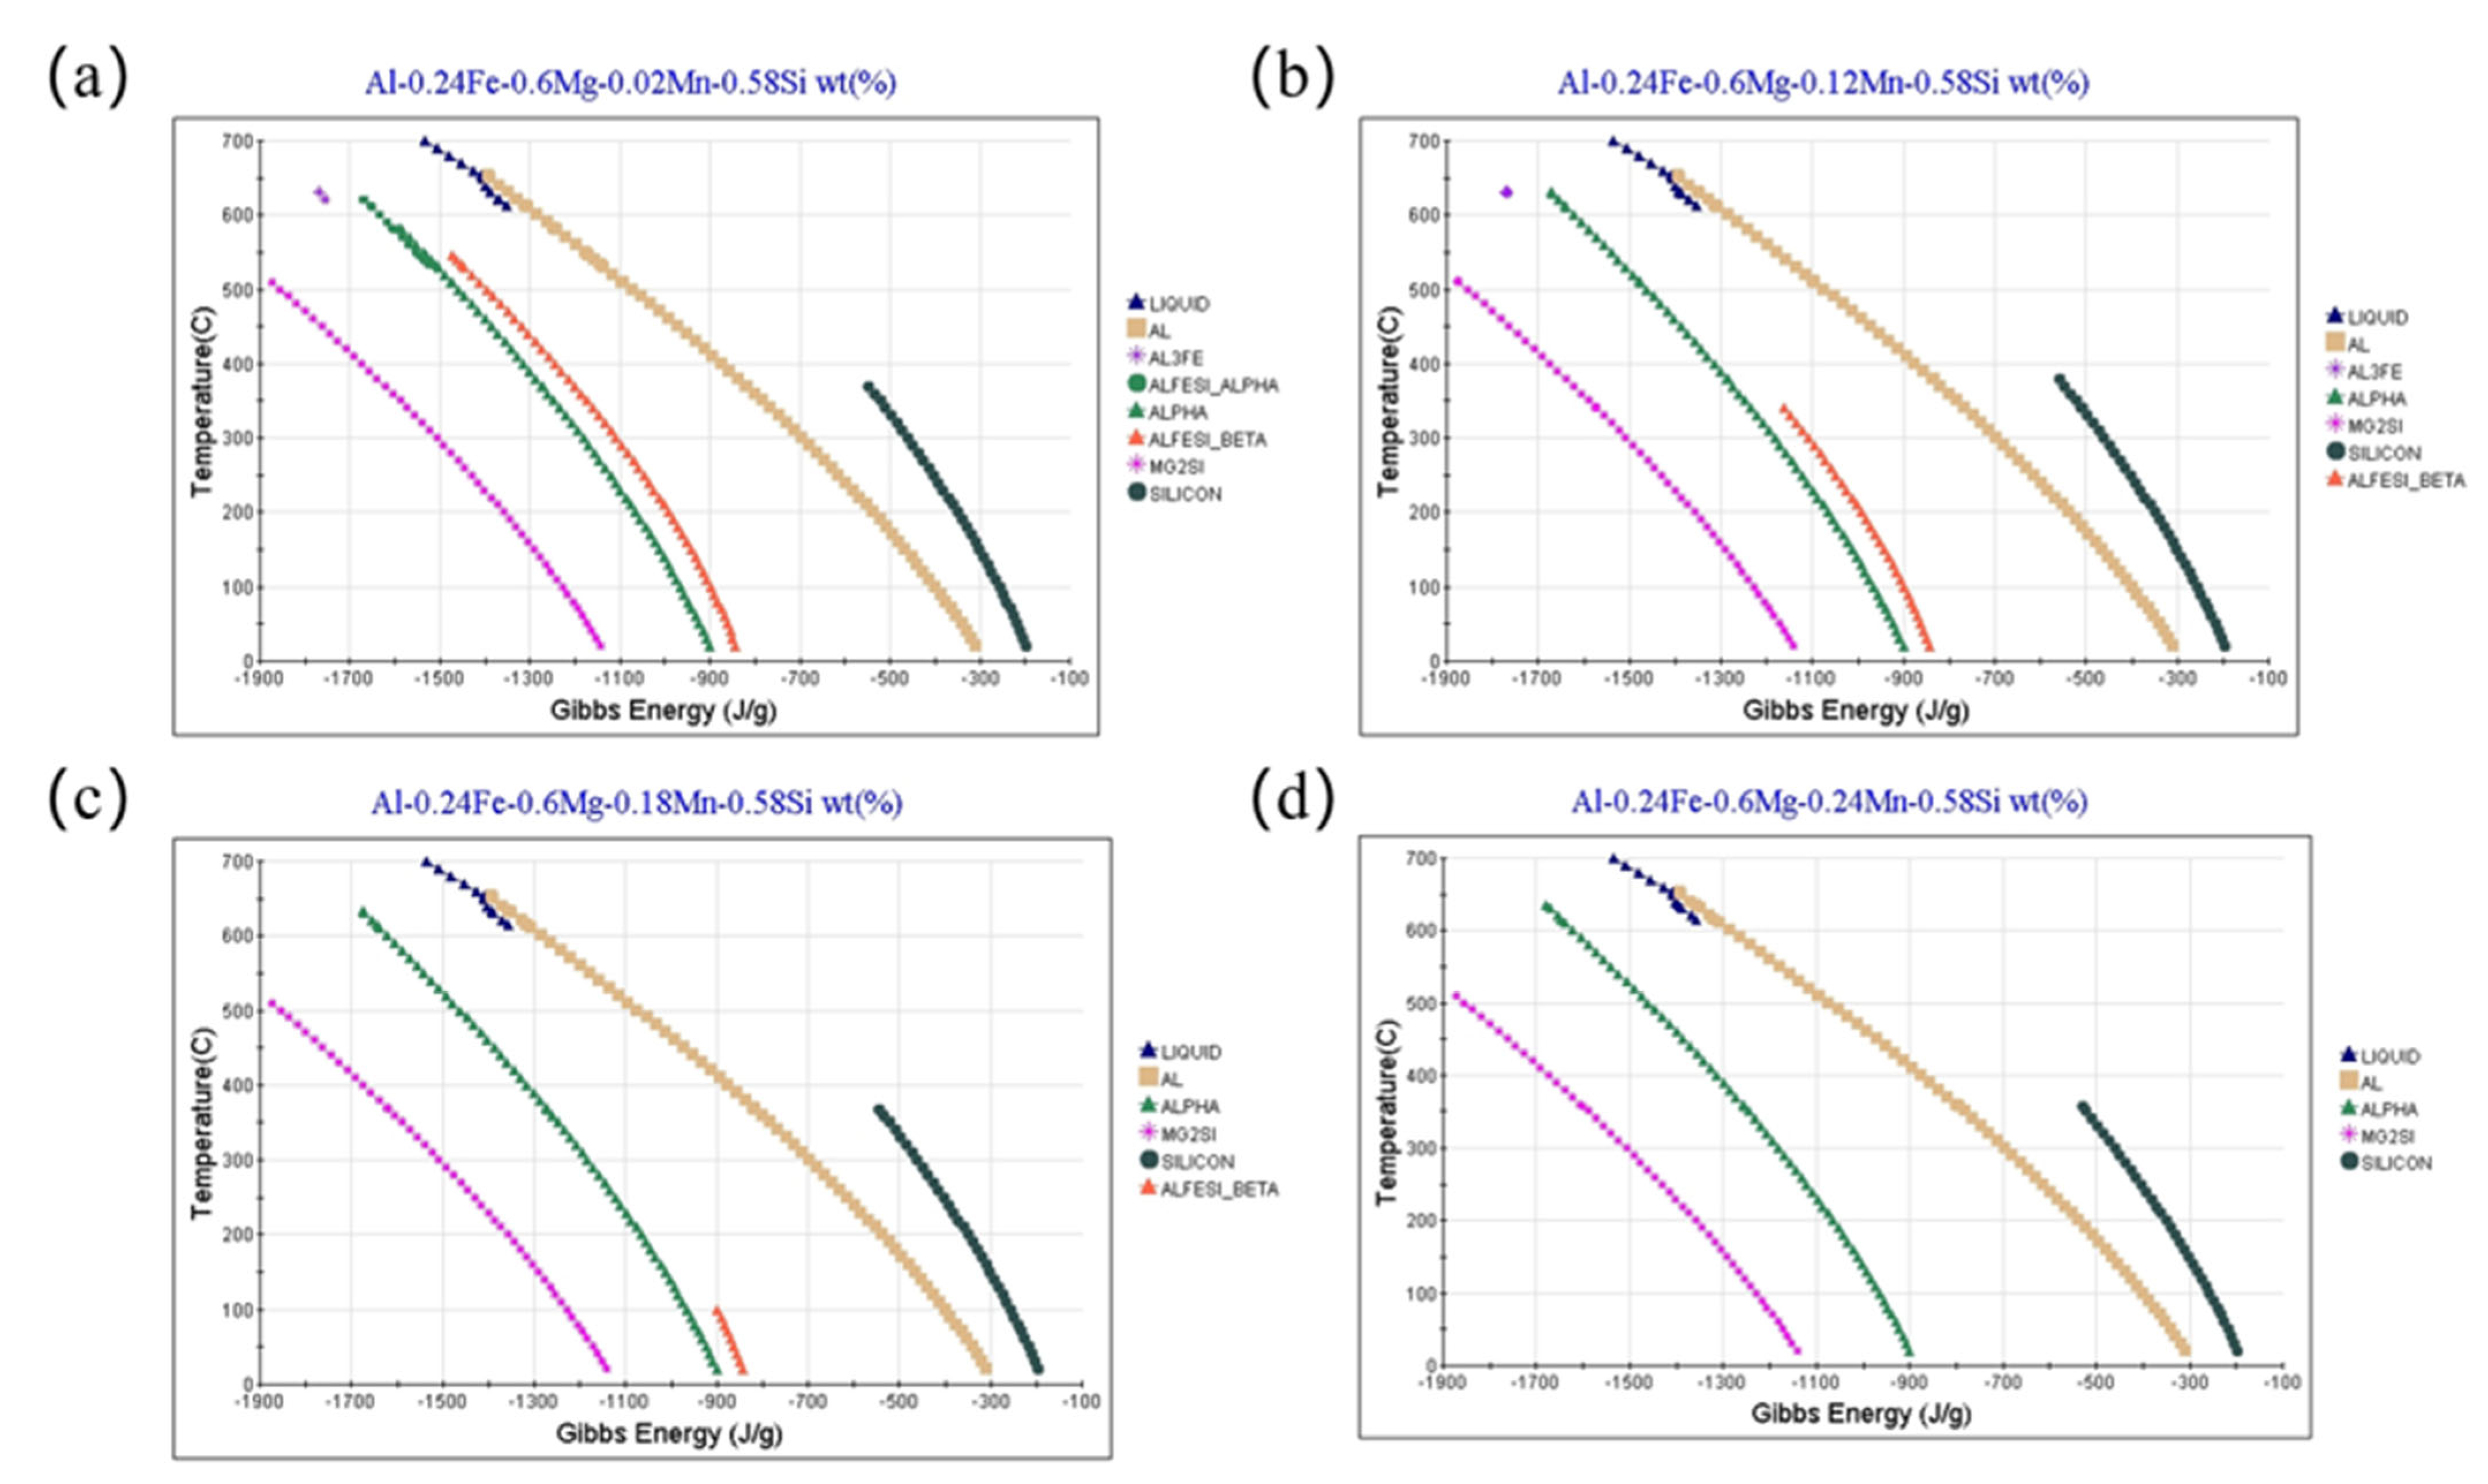
Figure 9 shows the changes in Gibbs free energy of crystalline phases during solidification of as-cast Al-0.6Mg-0.58Si-0.24Fe-xMn alloys. Table 3 shows initial Gibbs free energy and temperature of β-Al5FeSi during solidification process. With the increase of Mn content, initial Gibbs free energy of β-Al5FeSi formation increases and temperature gradually decreases. According to Table 3, it can be seen that initial Gibbs free energy of long acicular β-Al5FeSi phase in 0# and 1# alloys is relatively small and the temperature is high, which is the thermodynamic condition for the formation of β-Al5FeSi. When the Mn content is 0.18 wt.%, the initial Gibbs free energy of β-Al5FeSi increases to −897.74 J/g, higher than the 0# alloy (−1472.17 J/g). The initial formation temperature drops to 99.72 °C, lower than the 0# alloy (545.85 °C). This indicates that Mn shortened the time window for the appearance of β-Al5FeSi phase. In addition, β-Al5FeSi belongs to a monoclinic structure and its densely packed crystal planes are usually {001}. Therefore, it usually takes on acicular and fractures Al matrix during solidification, resulting in decrease in strength and elongation [28,29]. Mn content is still relatively low and there are considerable lattice vacancies inside the β-Al5FeSi phase for dissolution of Mn in 1#, so there are no significant changes in tensile strength and elongation [30,31,32]. When the Mn content increases to 0.18 wt.%, the long acicular β-Al5FeSi phase transforms into a short rod-like and granular formation, reducing the damage to Al matrix and exhibiting the best tensile strength and elongation. However, 0.24 wt.% Mn resulted in Mn segregation within 3#alloy, leading to a continued decrease in properties.
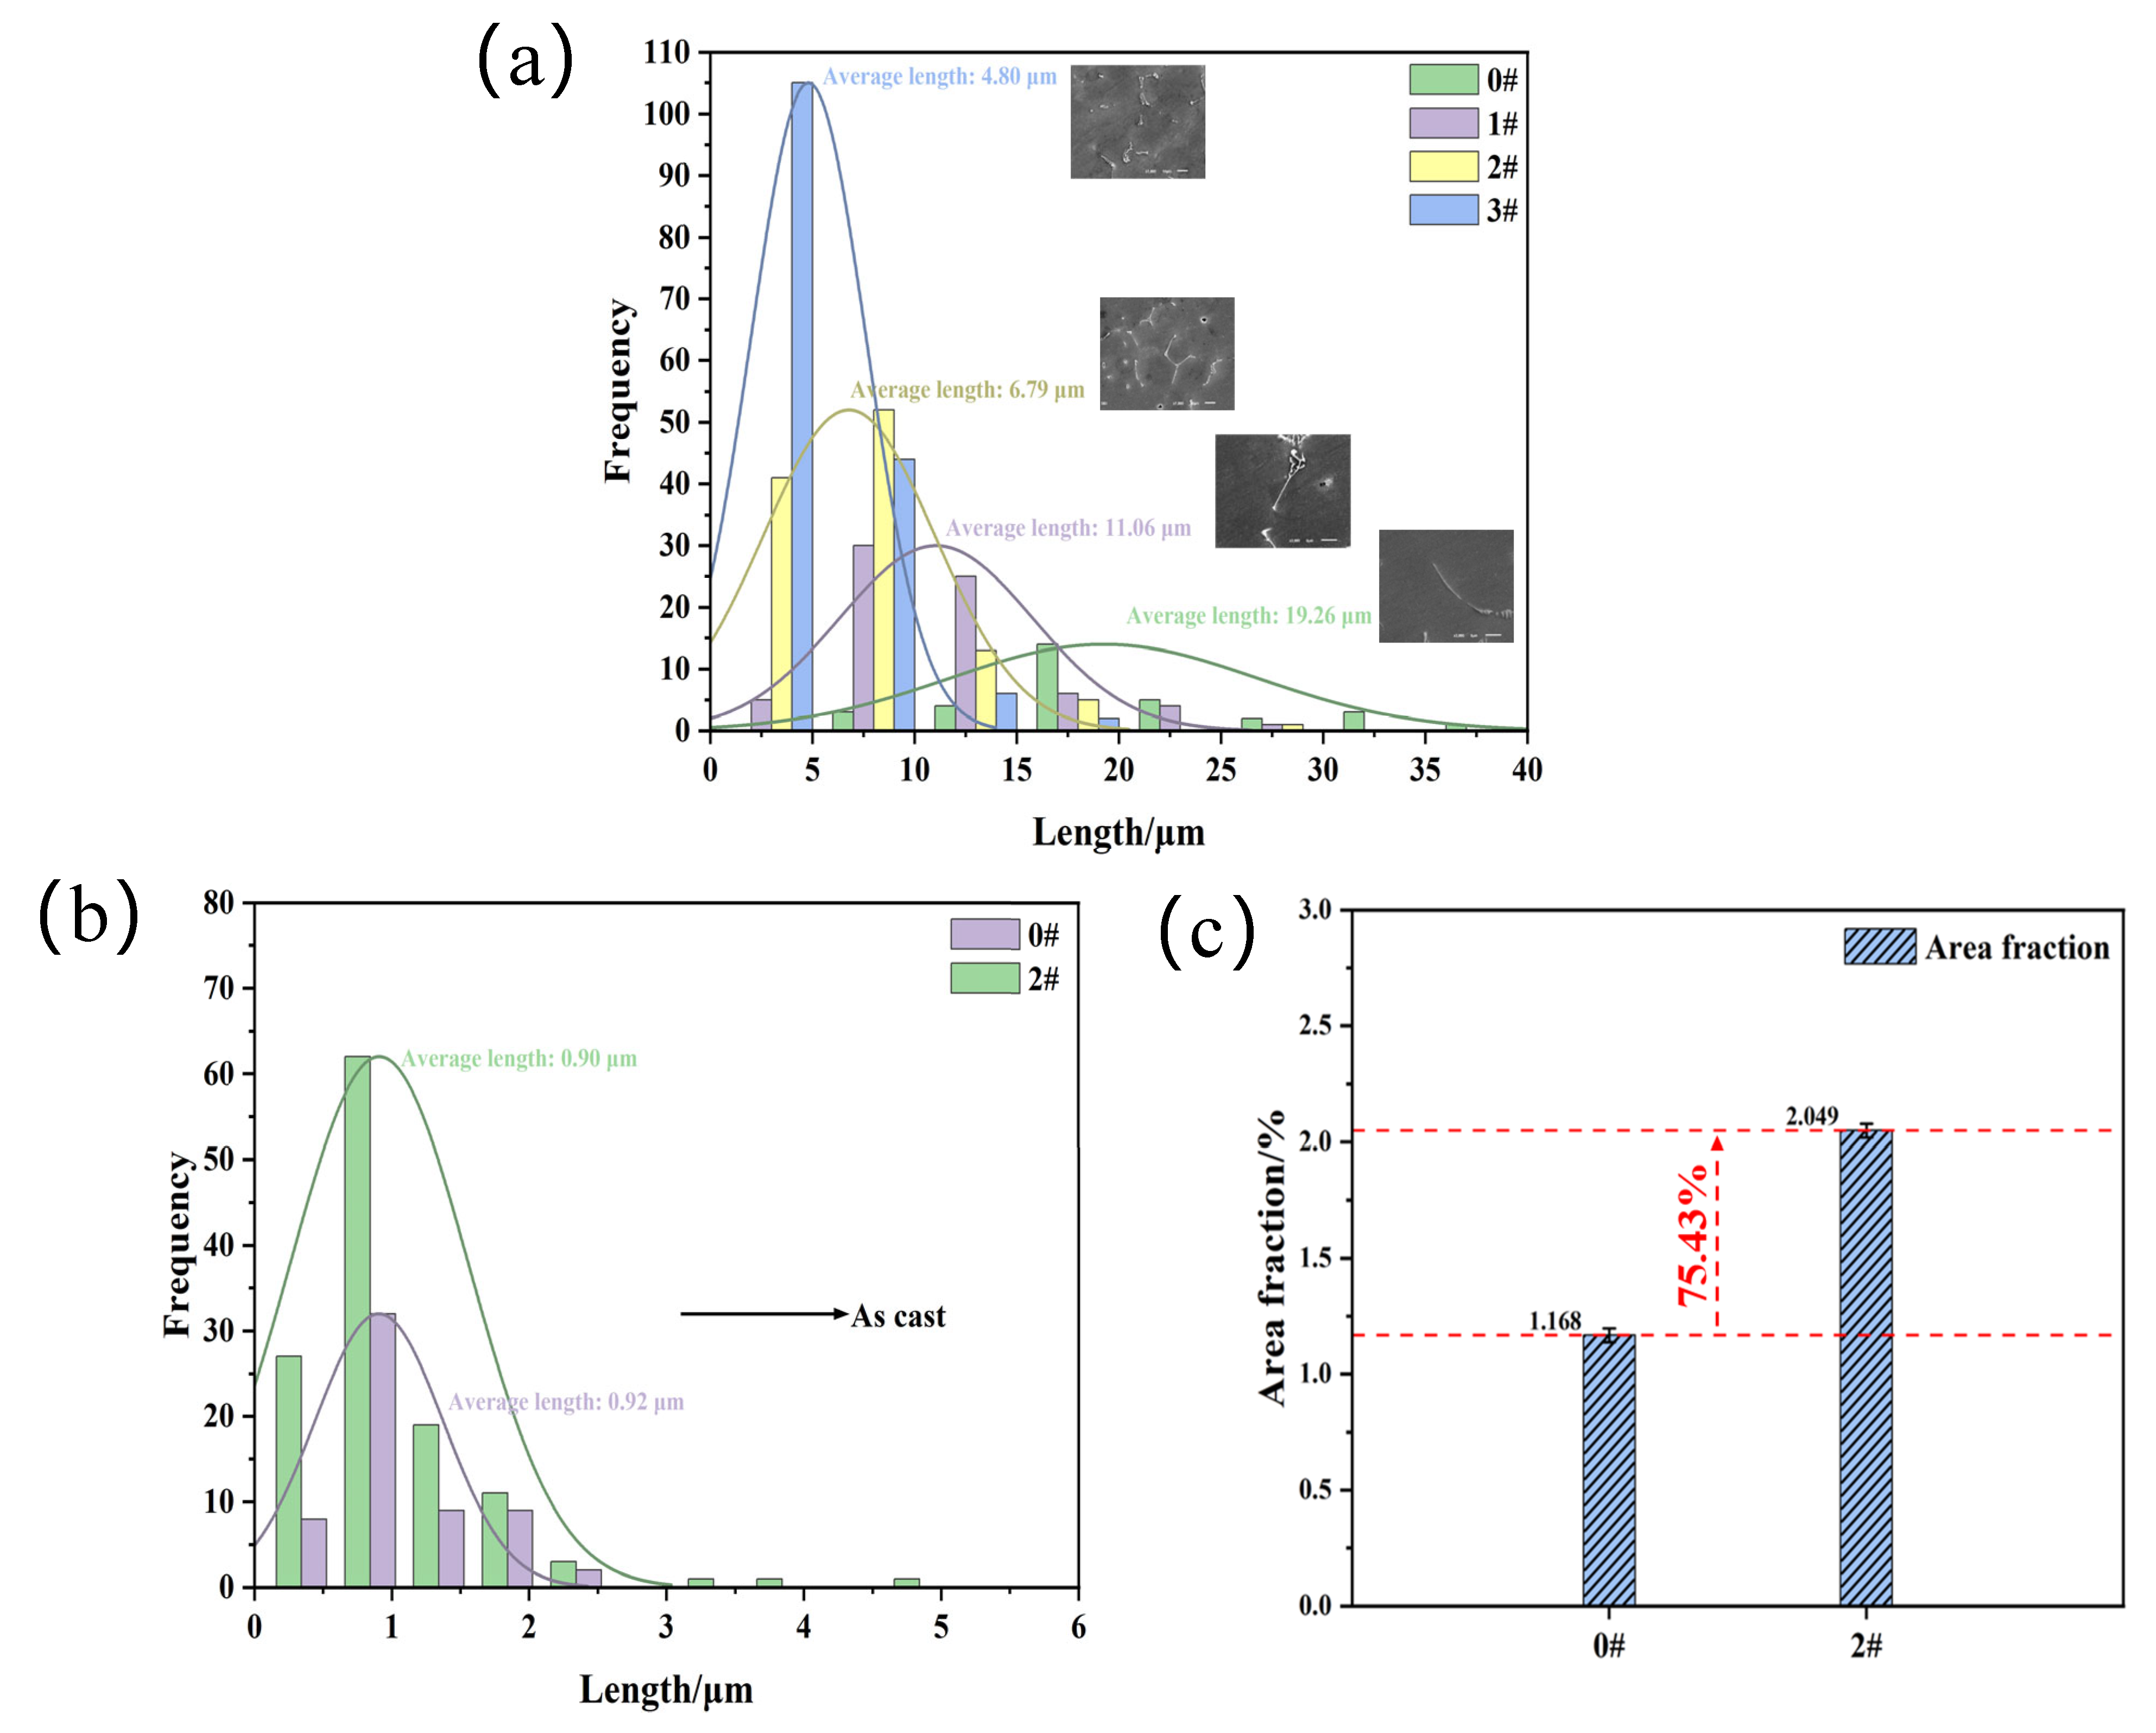
Figure 10 depicts size and density distribution of precipitates in cast and hot-extruded alloys. As Mn content increases, the size of the precipitates continuously decreases and frequency increases. Figure 10a illustrates that the Fe-rich precipitates in as-cast 0# alloy is predominantly distributed within a range of 15–20 μm, with an average length of approximately 19.26 μm and a relatively low frequency of approximately 10. It can be concluded that the size of the Fe-rich phase in 1# alloy is predominantly distributed around 10 μm, with an average length of 11.06 μm and a distribution frequency of 55. Upon increasing Mn content to 0.18 wt.%, the length is shortened to a range of 5–7.5 μm and an average length of 6.79 μm. The presence of a large number of short rod-like precipitates in the microstructure is mutually confirmed. The length of the Fe-rich precipitates in 3# alloy is mainly concentrated at 5 μm, with an average length of ~4.80 μm and the frequency number surging to 150. Based on the gradual shortening of the length of Fe-rich precipitates and the increase of distribution frequency, it is confirmed that Mn affects morphological changes of Fe-rich precipitates in as-cast alloys. The 0.18 wt.% Mn is both a content node for microstructure transformation and properties change in as-cast alloys. From Figure 10b, it can be seen that phase size in hot-extruded 0# and 2# alloys is smaller (<1 μm). The average size of phases in 0# alloy is 0.92 μm, while it is mainly distributed in the range of 0.25–1.25 μm and has an average size of 0.90 μm in 2# alloy. In addition, the phase area fraction in 2# alloy is 75.43% higher than that in 0# alloy, as shown in Figure 10c. Statistics of size and area fraction indicate that 0.18 wt.% Mn promotes the formation of high density dispersed phases in hot-extruded alloys, which further affects tensile properties and electrical conductivity [33].

4.2. Strengthening Mechanisms

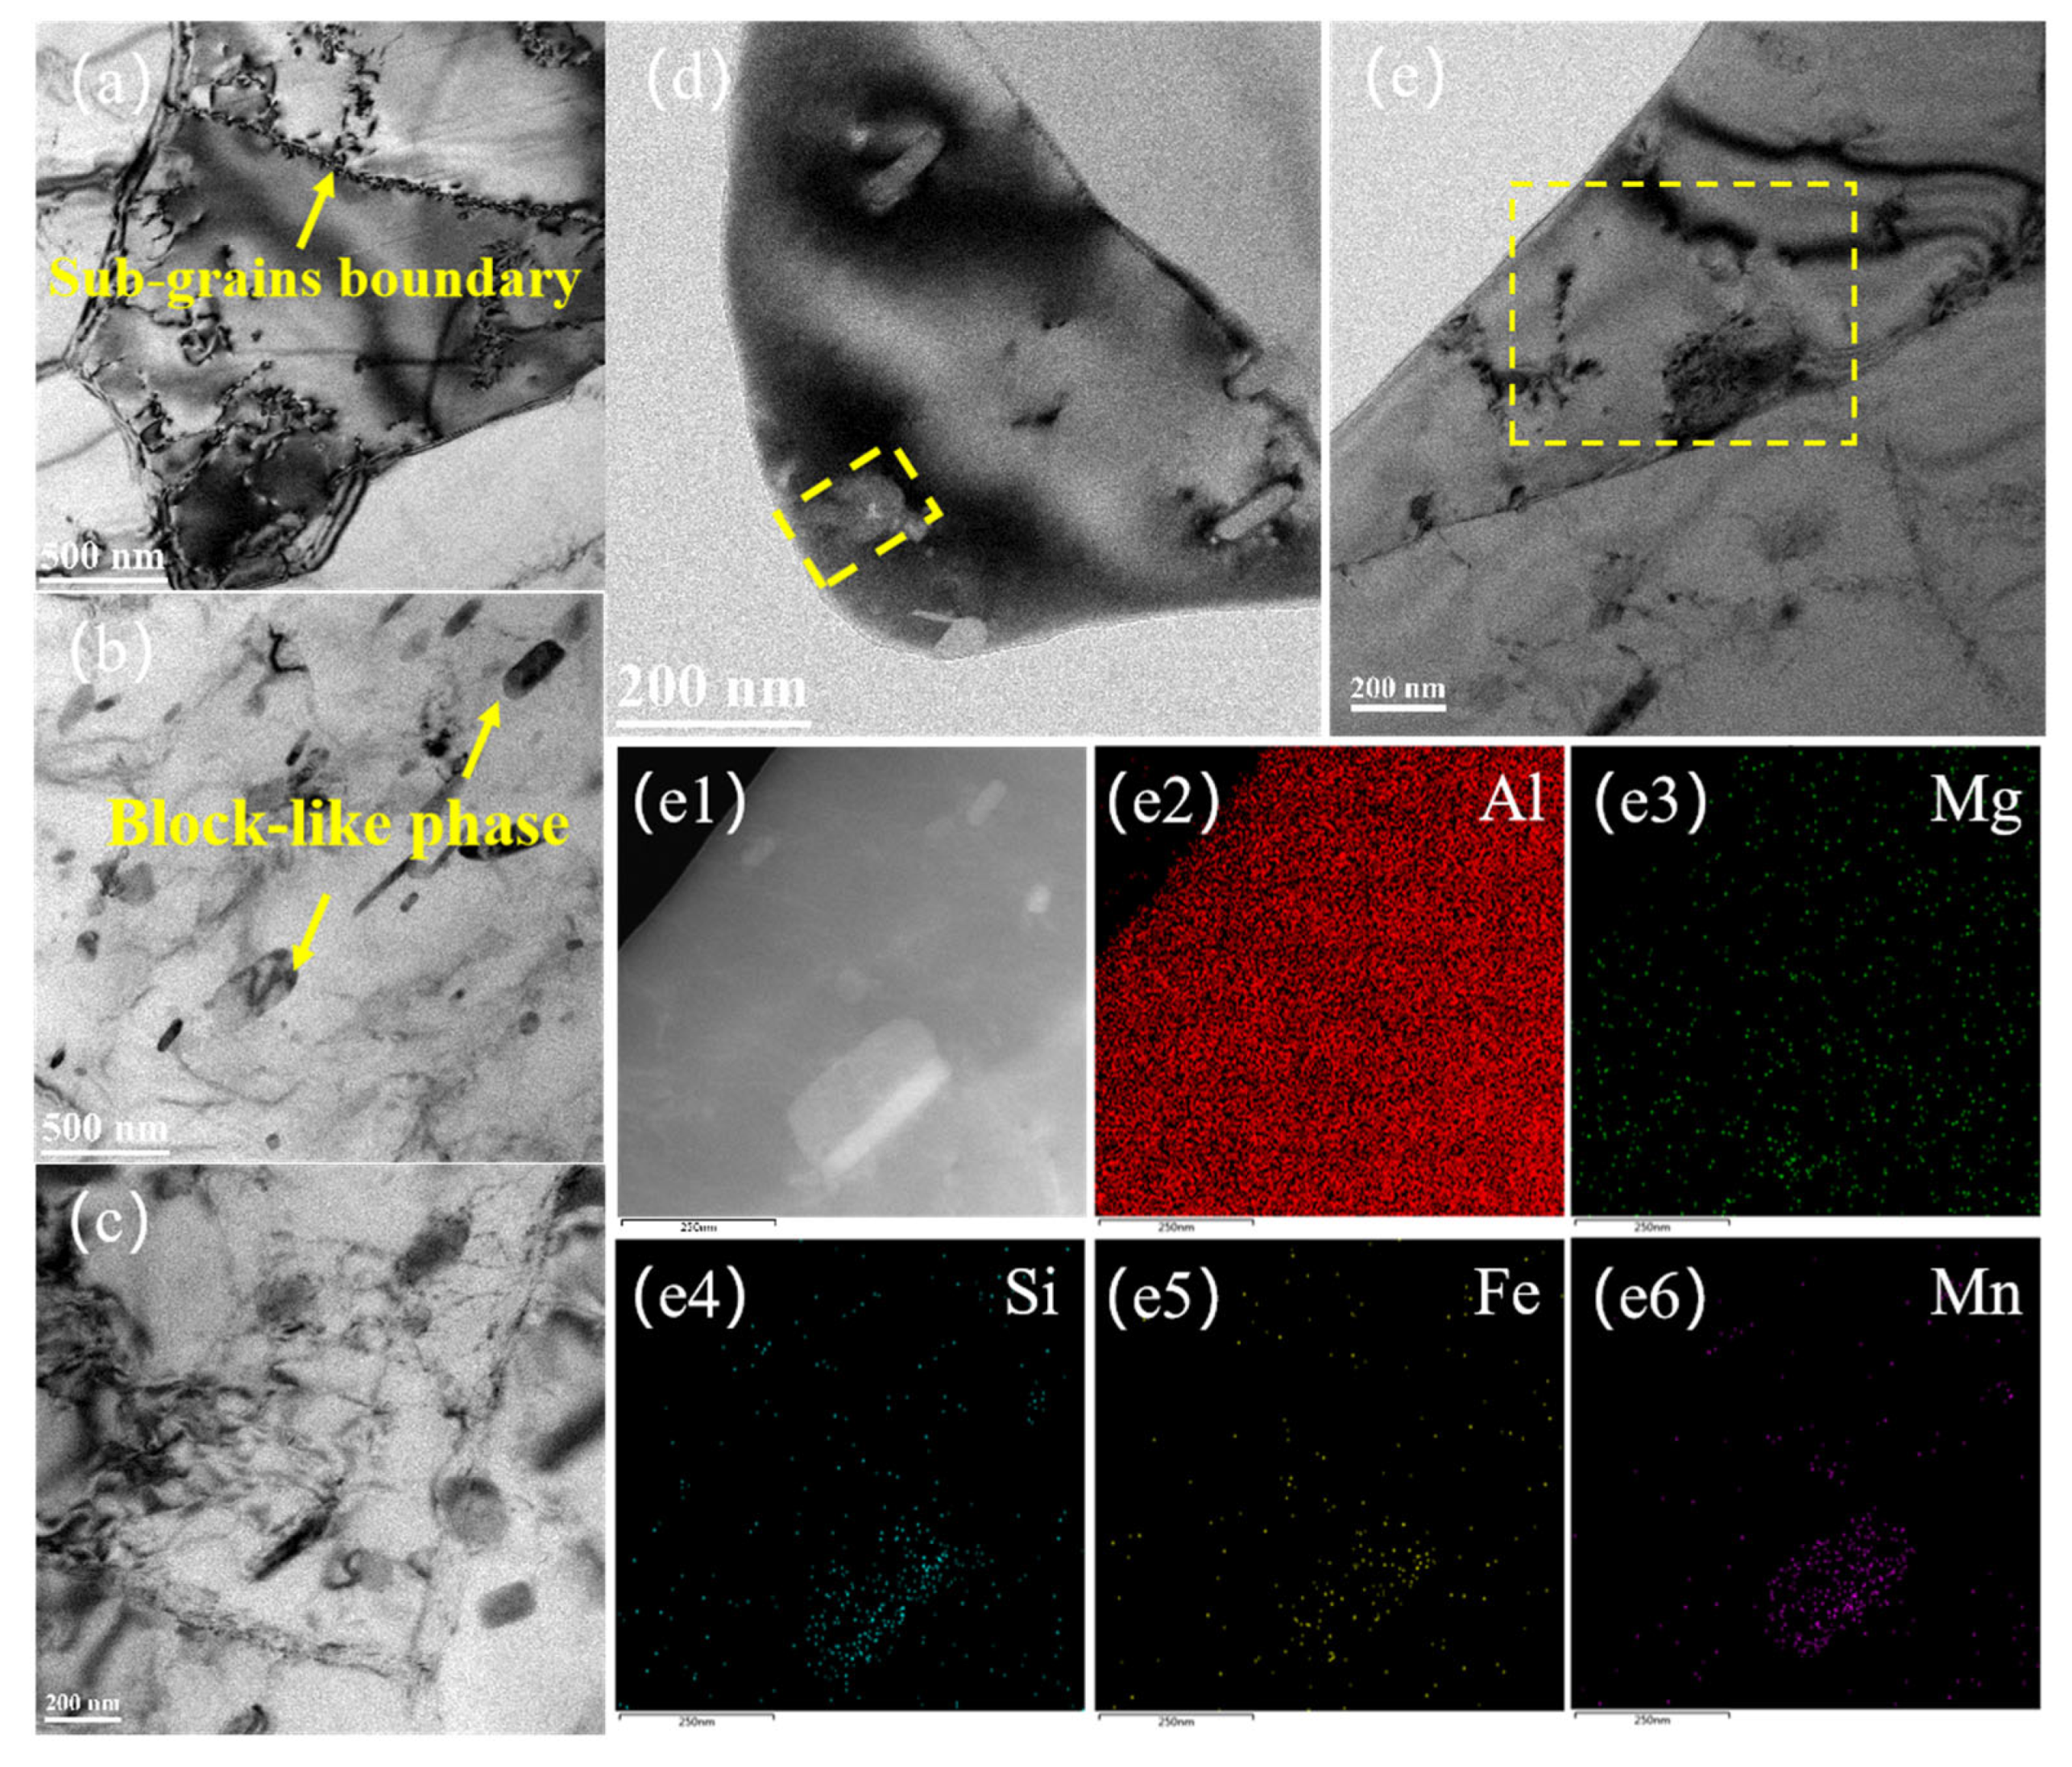
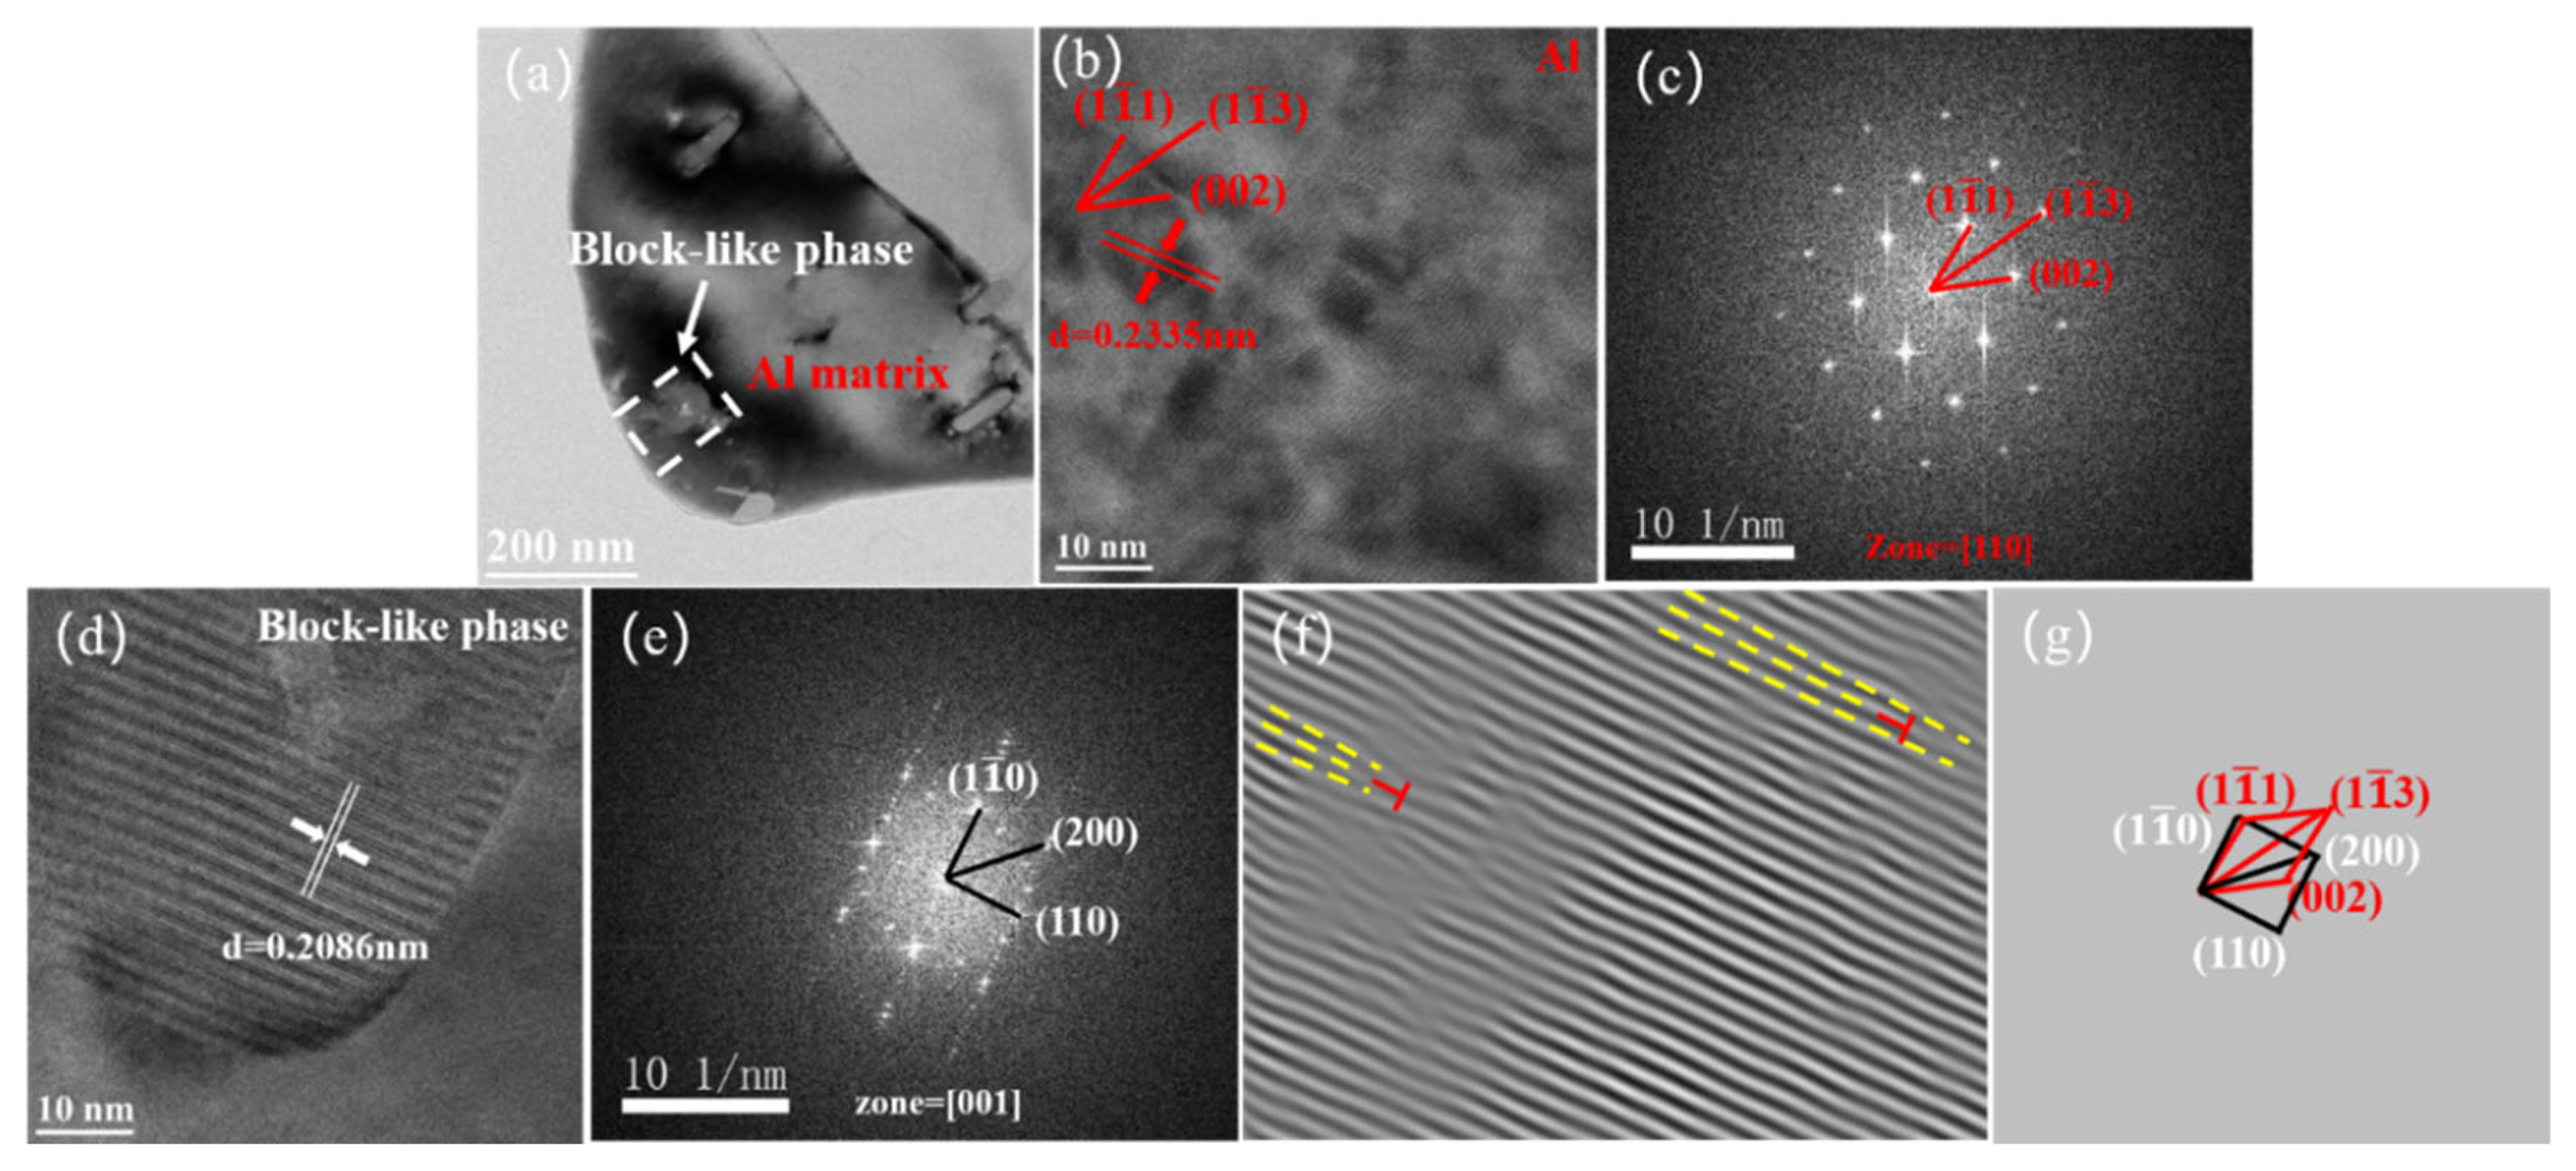
Figure 11 shows the TEM microscopic analysis in hot-extruded 2# alloy. Dislocations entangle, slide and climb under the influence of squeezing force and friction, as illustrated in Figure 11a. Figure 11b–e clearly indicates the presence of a large number of nanoscale block-like phases in hot-extruded 2# alloy. Figure 11(e1–e6) shows element detection results of typical block-like phases. EDS results indicate that these phases are composed of Al, Fe, Mn and Si. To ascertain the type of block-like phase, high-resolution and diffraction spot calibration were conducted. Figure 12d,e shows high-resolution and FFT transformations results, which is body-centered cubic (BCC) and has a lattice constant of 12.7 nm, slightly larger than the reported 12.56 nm. In addition, Mn and Fe belong to the same period of transition metal and have similar densities (Mn is about 7.43 g/cm3, Fe is about 7.87 g/cm3), so their enrichment situations are similar. The common crystal structure of Mn is FCC and BCC structure can be formed at high temperature. According to Fe-C phase diagram, the crystal structure of Fe undergoes the transformation of BCC-FCC-BCC with the increase of temperature; thus, Mn and Fe have similar crystal structures. Also, the atomic radius of Mn is about 1.39 Å and that of Fe about 1.28 Å [34,35,36]. In summary, Mn participates in the substitution of Fe to form the α-Al (Fe, Mn) Si phase, leading to an increase in the tensile strength and elongation of after hot-extruded 2# alloy [17,37]. The formation and growth of the α-Al (Fe, Mn) Si phase do not show a clear orientation relative to matrix, as shown in Figure 11e.
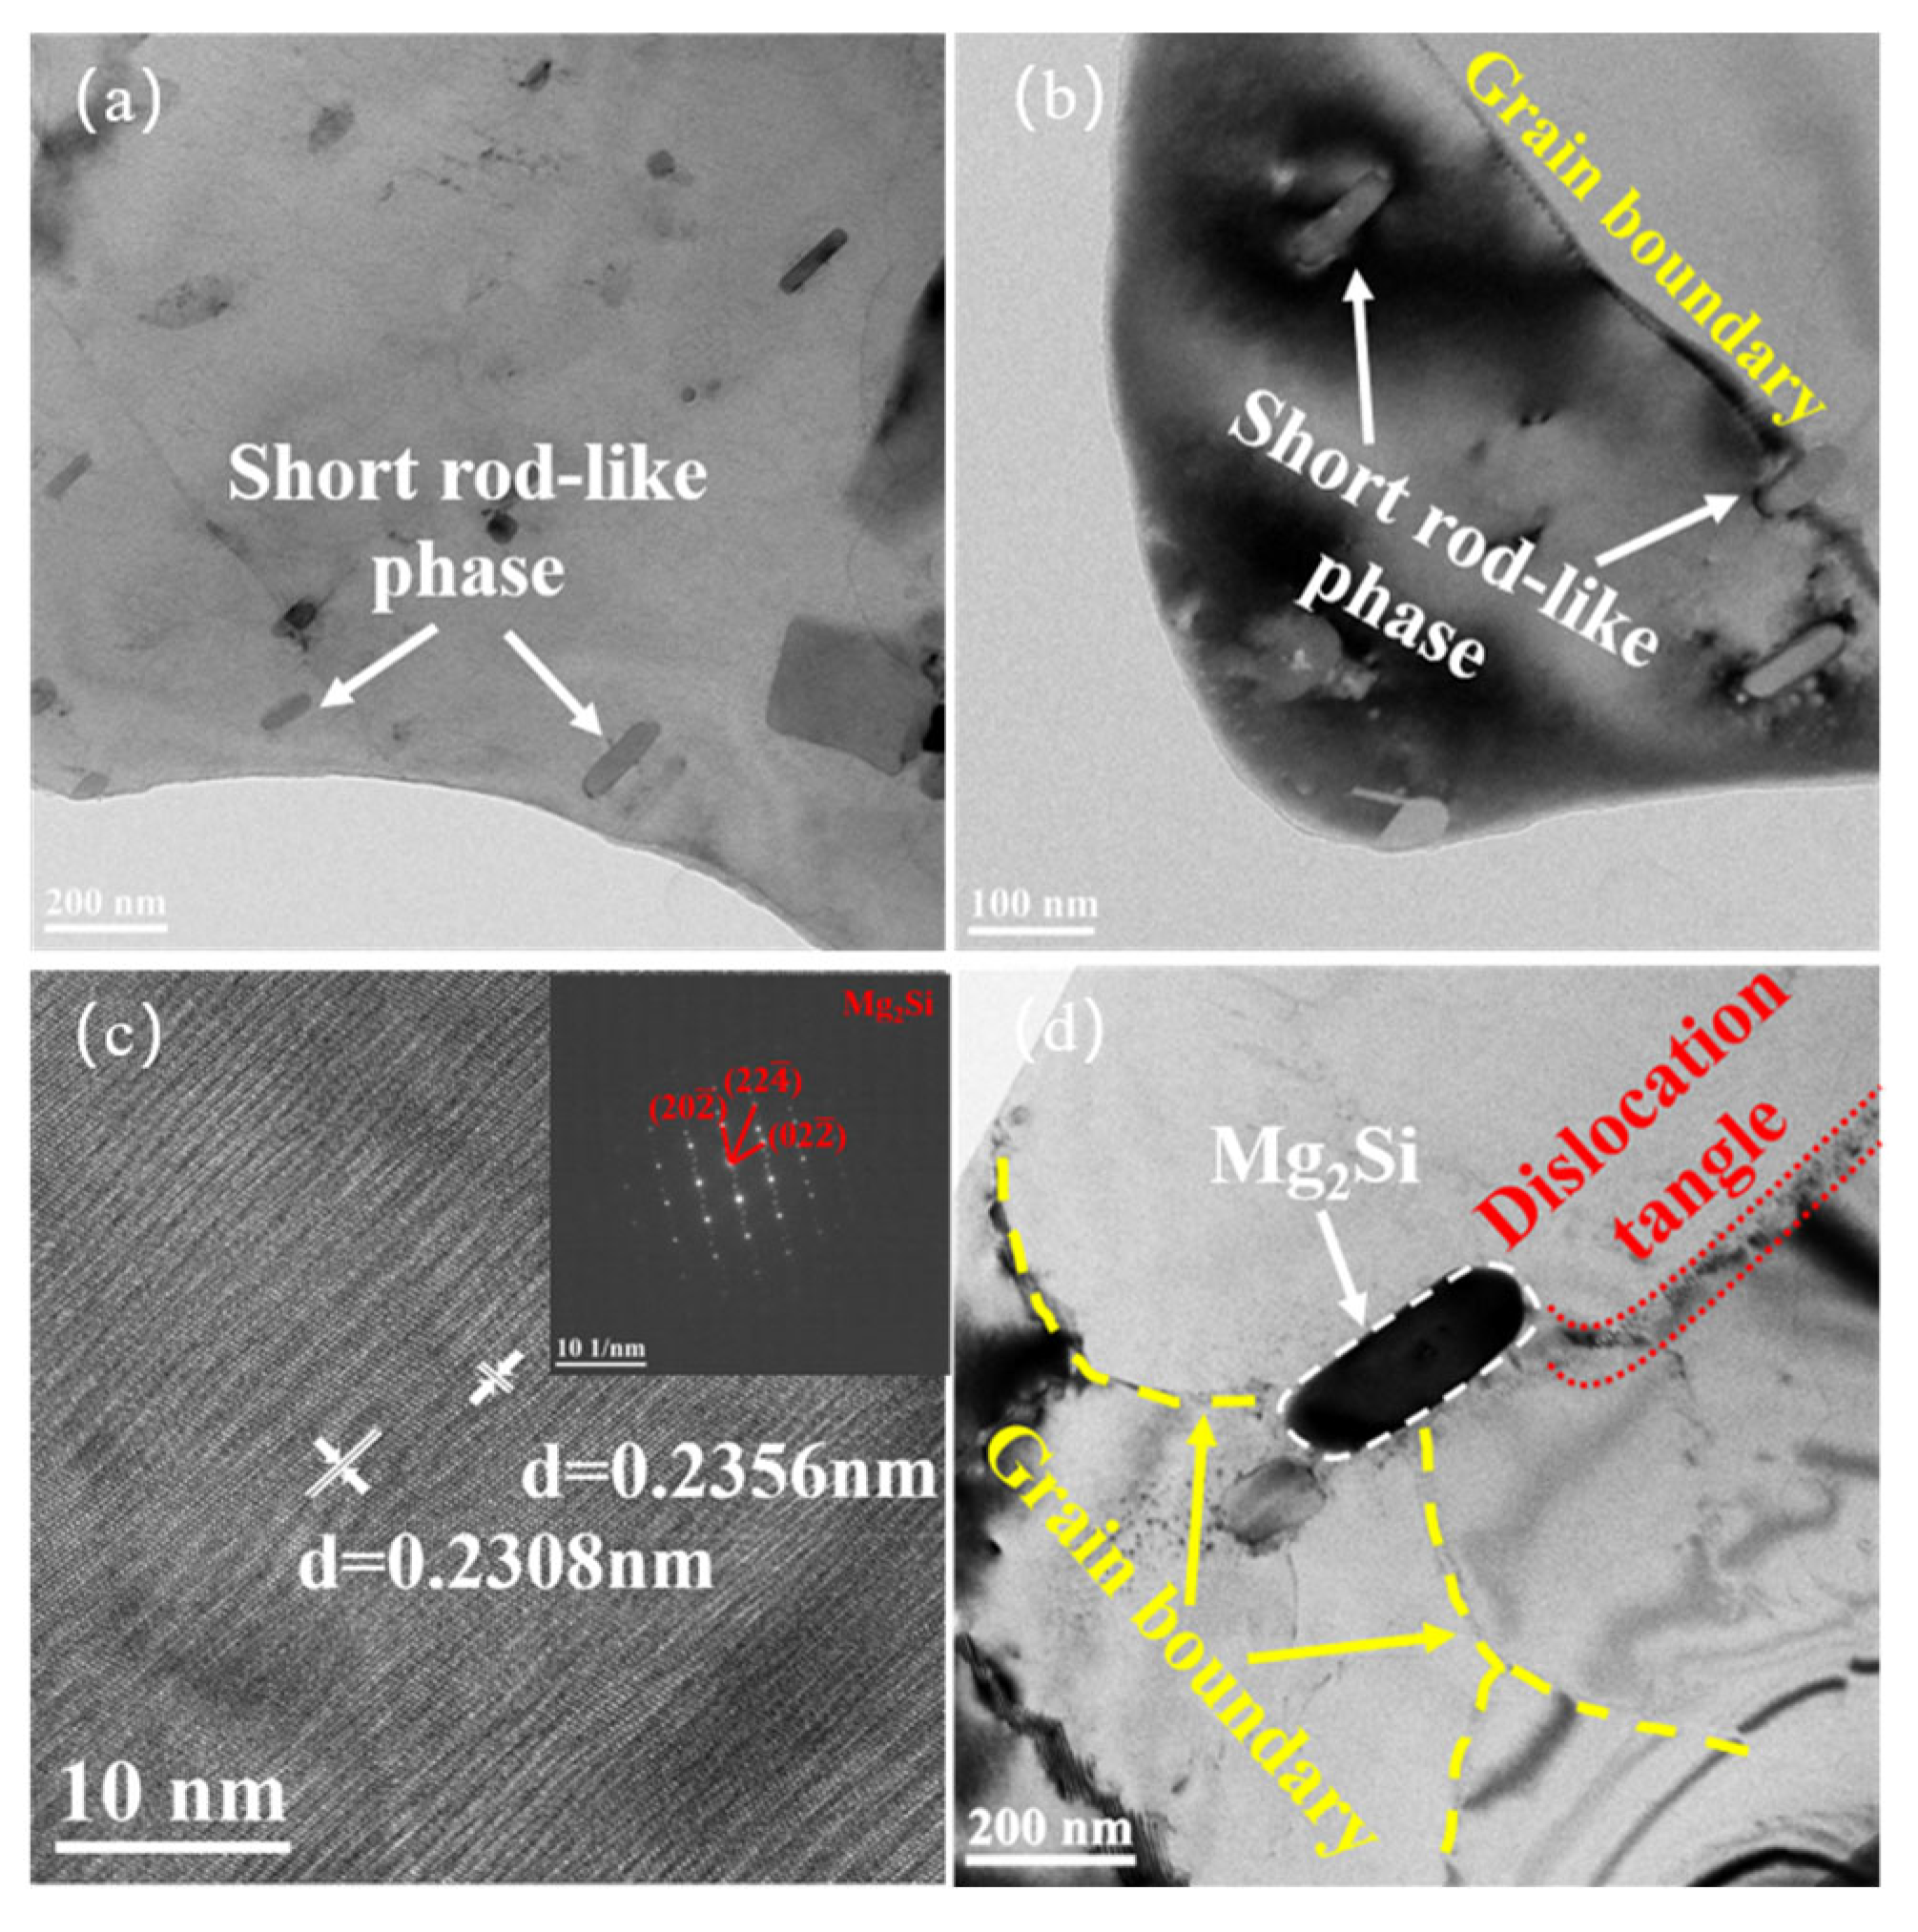
Figure 13 shows the microstructures of typical rod-like phases in hot-extruded 2# alloy. The phase was identified as the Mg2Si phase by high-resolution detection and diffraction spot analysis as shown in Figure 13c. The rod-like morphology allows the Mg2Si phase to have a large specific surface area, providing more opportunities for interaction with the Al matrix, which further has an important effect on the properties of the alloy. The Mg2Si phase in Figure 13d is located at the junction of grain boundaries, which is a region where atoms are irregularly arranged with high energy and activity. On the one hand, Mg2Si phase pinning at grain boundaries improves the deformation resistance of the alloy, thereby enhancing its tensile strength [38]. On the other hand, the nanoscale Mg2Si phase also hinders crack propagation, which is beneficial for improving plasticity of the alloy. In addition, the interaction between Mg2Si phase and grain boundaries also enhances the stability of tensile properties.
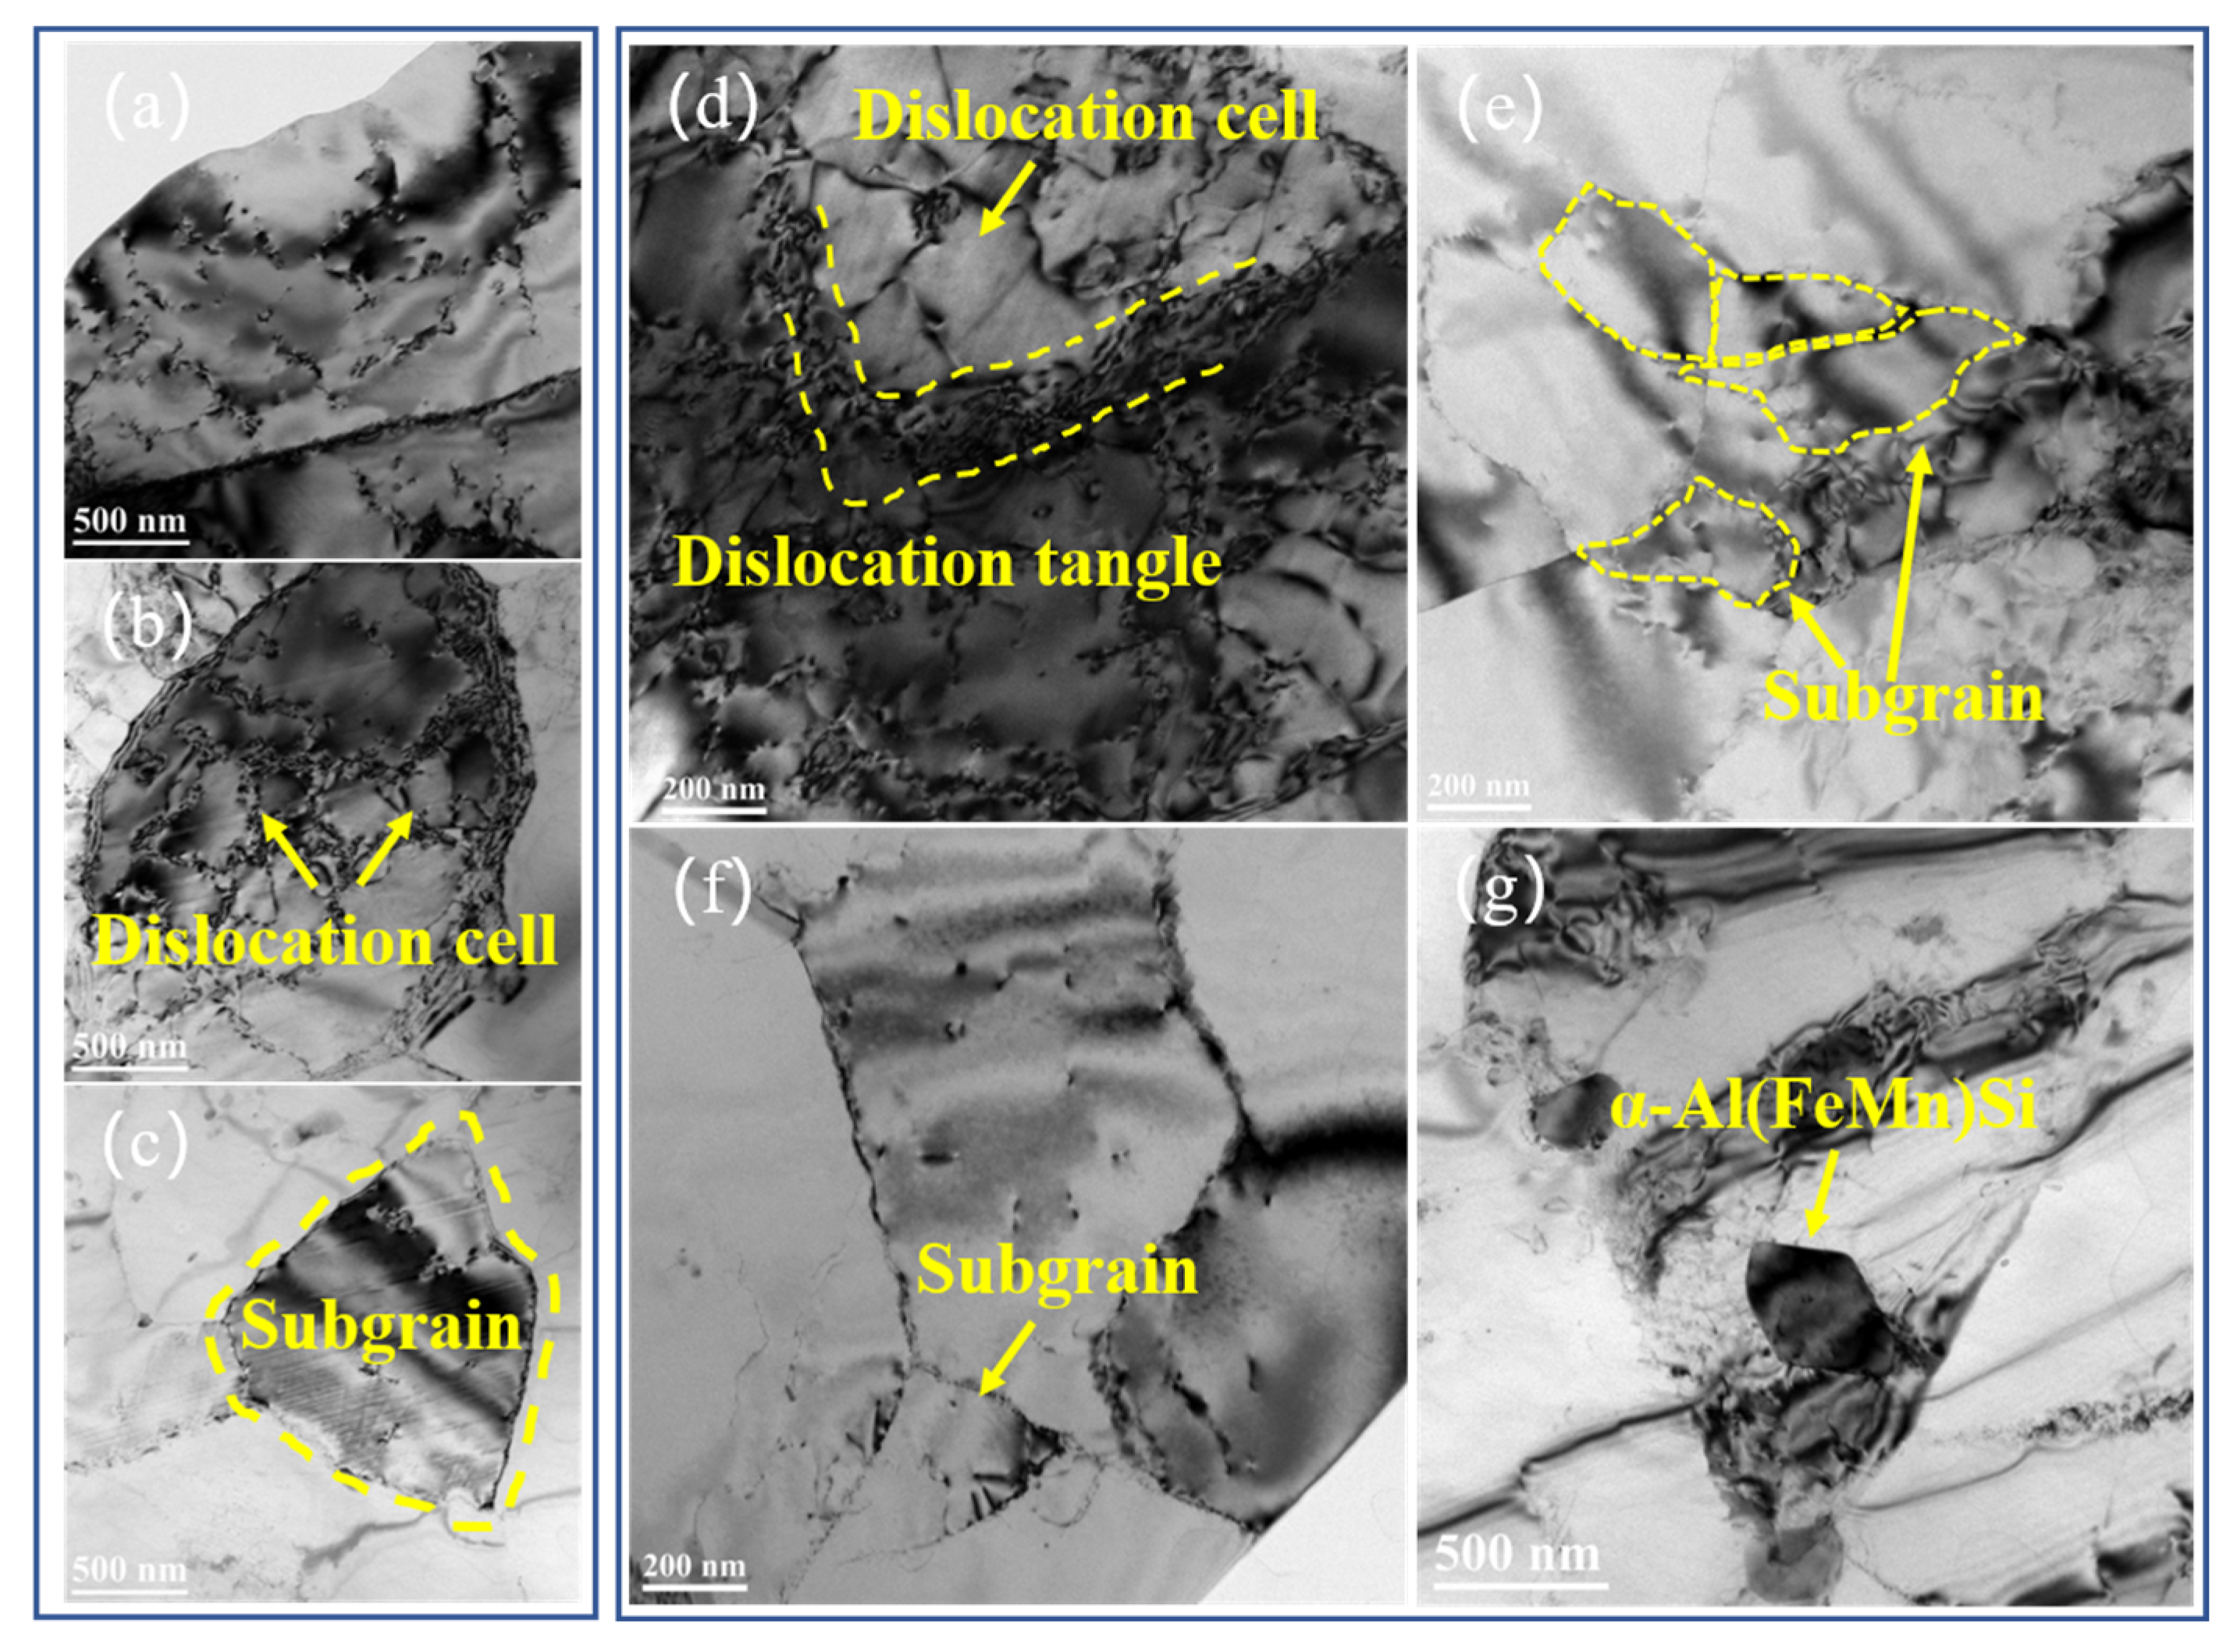
Figure 14 shows dislocation and subgrain configurations of hot-extruded 0# and 2# alloys. During hot deformation, alloys undergo dynamic recovery under the influence of external force and temperature. At initial deformation stage, the stress increases rapidly and dislocation density increases from 1010–1011 m−2 to 1011–1012 m−2 when work hardening occurs [35,36,39,40,41]. Continuous deformation leads to a decrease in the rate of stress increase and material enters the stage of uniform plastic deformation. Dislocation density continues to increase, and dislocation entanglement and cellular substructures are formed. As deformation continues, dislocation cell walls become polygonal and transform into regular boundaries, ultimately forming subgrains (Figure 14c) [42,43]. As shown in Figure 14e,f), compared with 0# alloy, subgrain size in 2# alloy is smaller (~500 nm), which means that there is less dislocation consumption during hot extrusion. This is because α-Al(Fe, Mn)Si aggregates at dislocations and grain boundaries, hindering dislocation migration and suppressing recrystallization, resulting in better strength of 2# alloy [15,44]. Furthermore, high density dislocations hinder crack initiation and propagation, resulting in an elongation of 24% for 2# alloy.
The strength of alloys in the hot-extruded state is lower than that of alloys in the cast state, which is mainly related to the microstructure evolution and the equilibrium mechanism of mechanical properties. Under as-cast conditions, a large number of needle-like β-Al5FeSi phases are present in the alloy (Figure 1), whose hard and brittle properties can effectively impede the dislocation motion and provide significant solid solution strengthening and second-phase strengthening, which leads to the tensile strength of the alloy in as-cast condition reaching 201 MPa. However, during the hot extrusion process (450 °C), the high temperature and pressure caused deformation, resulting in the fracture and transformation of the acicular β-Al5FeSi phase into diffuse α-Al(Fe,Mn)Si particles (Figure 11 and Figure 12). While these diffuse phases retained dislocations, their nanoscale size reduced the stress required for the Orowan bypass mechanism, thereby weakening the strengthening effect. Furthermore, dynamic restitution and recrystallization occur during the process of hot extrusion (Figure 14), and dislocations are reorganized to form subcrystalline structures, which consume the high dislocation densities and reduce the work-hardening effect. Large-size subcrystals (>1 μm) were formed after extrusion of the alloys in the pristine state, whereas the subcrystals of the Mn-containing alloys, although finer (200–500 nm), were still weaker than the high dislocation-density state in the as-cast state. Concurrently, the process of hot extrusion disrupts the brittle phases at the grain boundaries, leading to a substantial enhancement in the alloy’s plasticity (with an increase in elongation from 15% to 24%). However, this also renders the grain boundaries a weaker hindrance to dislocations, thereby further diminishing the strength of the alloy. This equilibrium mechanism suggests that hot extrusion, by modulating the microstructure, trades off a partial loss of strength for a superior combination of properties.

4.3. Conductivity Mechanisms

Table 4 presents the solid solubility of Mg, Si, Fe and Mn in aluminum and the resistivity values caused by unit addition. The electrical conductivity of Al-0.6Mg-0.58Si-0.24Fe-xMn alloys in as-cast changes complexly, showing a trend of first decreasing, then increasing and then decreasing again. Conductivity mechanisms follow the Mattiessen law [45]:
ρ t o t a l = ρ 0 + ρ s s + ρ d i s + ρ g b + ρ p
where ρ t o t a l denotes the total resistivity, ρ 0 denotes the intrinsic resistivity of the crystal lattice, ρ s s , ρ d i s and ρ g b denote the resistivity due to Mg, Si, Mn and Fe solute atoms dissolved in Al matrix, dislocations and grain boundaries, ρ p denotes the resistivity due to precipitation.
Firstly, the conductivity of 1#,2# and 3# alloys is lower than that of 0#. The transformation of the long acicular β-Al5FeSi phase into short rod-like structure reduces hindrance to electron conduction, resulting in an abnormal increase in conductivity of 2# alloy. Due to high electrical resistivity caused by solid solution of Mn ( ρ s s   0 # = 1.08   μ Ω · c m , ρ s s   2 # = 1.55   μ Ω · c m ), the conductivity of 2# alloy is higher than that of 1# and 3# alloys, but still lower than that of 0# alloy, as shown in (Equations (1) and (2)) and Table 4. Compared with 0# alloy, the conductivity of 2# alloy decreased by only 0.97 %IACS (Figure 4b). In addition, when Mn content is increased to 0.24 wt.%, conductivity is the lowest.
ρ s s = i C i s s ρ i s s
where C i s s represents the solid solubility of the element and ρ i s s represents the resistivity due to the solid solution element.
Equation (3) shows the relationship between precipitates and resistivity. The denser the precipitates, the smaller the spacing L, resulting in an increase in ρ p . This is the main reason for 1.1 %IACS decrease in conductivity of as-cast 3# alloy [46].
ρ p = 12 L 1 2
where L denotes the spacing between precipitates.
Based on mechanism analysis in tensile properties and electrical conductivity of as-cast alloys, it is concluded that as-cast alloy with 0.18 wt.% Mn has the best comprehensive properties, achieving a balanced optimization of strength–elongation–conductivity.
The difference in electrical conductivity between hot-extruded alloys and as-cast alloys lies in the resistivity caused by dislocations and grain boundaries. Equations (4) and (5), respectively, represent the relationship between dislocations, grain boundaries and electrical resistivity [47]. Compared with 0# alloy, hot-extruded 2# alloy hinders the recrystallization process and consumes fewer dislocations, resulting in slightly higher electrical resistivity due to dislocations. In addition, according to Equation (5), the change in electrical resistivity caused by grain boundaries is relatively weak in two samples after hot extrusion.
ρ d i s = ρ · ρ d i s
ρ d i s represents the resistivity due to dislocations per unit density of Al matrix ( 2.7 × 10 25   Ω m 3 ) .
ρ g b = ρ g b L
ρ g b represents the resistivity of the grain boundaries to the Al matrix per unit density and L represents the average grain size of the alloy.
Equation (6) represents the effect of high-density and small-sized α-Al (Fe, Mn) Si and Mg2Si on conductivity. Combined with statistics of the phase size and area fraction in Figure 10b,c, the resistivity caused by the precipitation is ρ p   0 # = 8.2 × 10 11   μ Ω c m , ρ p   2 # = 9.6 × 10 11   μ Ω c m .
ρ p = 12 2 π   ×   100   ×   r 2 S f 1 4
2 π × 100 × r 2 S f 1 4 represents sediment spacing, r represents average sediment size, and S f represents sediment area fraction.
In summary, electrical resistivity caused by microstructure is relatively weak, therefore the most important factor affecting electrical conductivity of hot-extruded alloys is still ρ s s . The conductivity of hot-extruded 2# alloy is only reduced by 2.83% compared with 0# alloy, achieving balance between strength–elongation–conductivity.
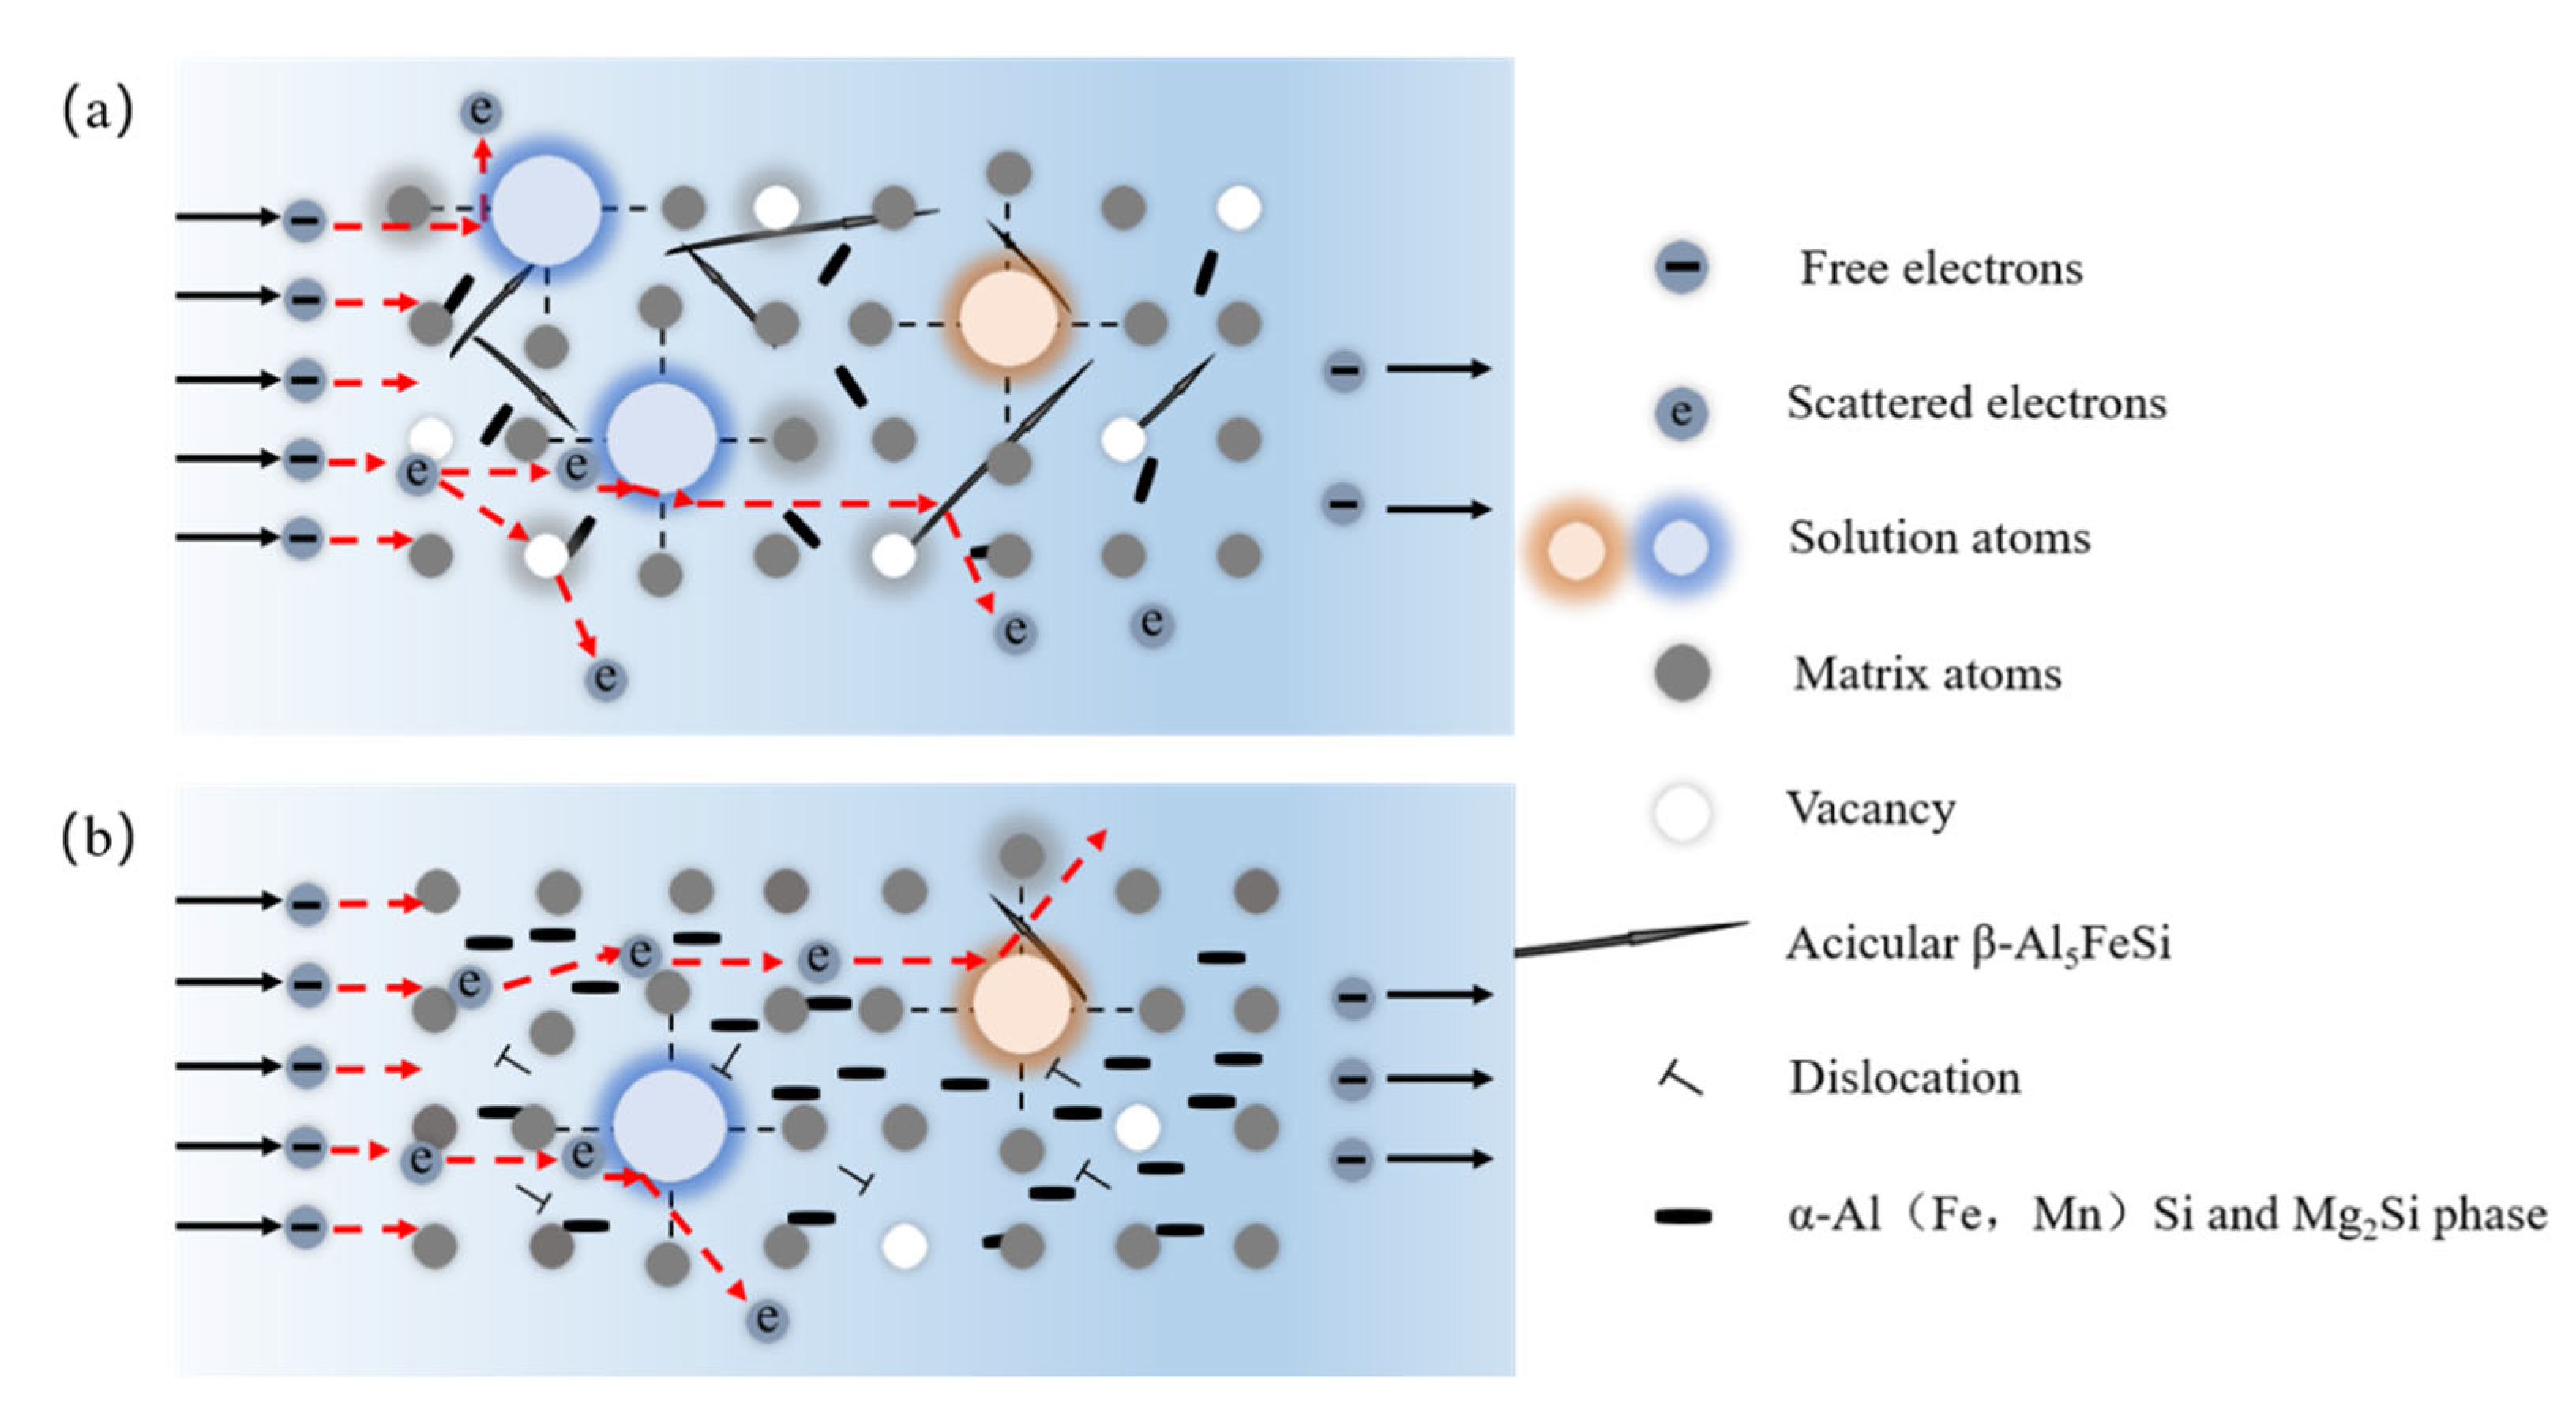
Figure 15 schematically contrasts electron conduction mechanisms in as-cast and hot-extruded alloys, emphasizing how defect evolution, phase redistribution and dislocation dynamics govern conductivity. Microstructurally, impurities and defects act as electron scattering centers and disrupting conduction. However, hot extrusion can eliminate defects, and seal microcracks and voids, which homogenizes the alloy composition and microstructure, thereby alleviating these limitations. This structural refinement minimizes electron path irregularities, fostering a stable rise in conductivity and enabling tailored electrical performance. In as-cast alloys, the accumulation of acicular β-Al5FeSi at grain boundaries exacerbates electron scattering and shortens the mean free path [48]. Interfacial mismatch between these acicular phases and the Al matrix further distorts electron flow, while localized stress fields exacerbate scattering effects. Hot extrusion counteracts electron scattering by inducing the precipitation of finely dispersed α-Al (Fe, Mn) Si and Mg2Si phase (Figure 12 and Figure 13) [49]. Simultaneously, solute absorption by these precipitates purifies the matrix, alleviating lattice strain and establishing a coherent electron transport environment. The process also reduces elastic strain energy via dynamic recovery, diminishing internal stress barriers to conduction. Additionally, extrusion-induced crystallographic textures may create preferential electron pathways [50]. These mechanisms work together to help 0.18 wt.% Mn alloy achieve optimal overall properties. Microstructure control strategy indicates the role of second phase distribution, defects and crystal coherence in achieving the balance of strength–elongation–conductivity.

5. Conclusions

In this study, the role of Mn in matching tensile properties with electrical conductivity for Al-Mg-Si alloy was systematically investigated. The following conclusions were obtained:
The effect of Mn microalloying on the microstructure evolution and properties of as-cast Al-0.6Mg-0.58Si-0.24Fe-xMn (x = 0.02, 0.12, 0.18, 0.24) alloys was studied. Microstructural analysis reveal that the original alloy exhibited numerous elongated needle-like β-Al5FeSi phases along grain boundaries. With increasing Mn content to 0.18 wt.%, Mn-induced thermodynamic modifications promoted morphological transformation of β-Al5FeSi phases from acicular to short rod-like and granular. Tensile properties of as-cast alloys first increase and then decrease with the increase of Mn content. Compared with the original alloy, 2# alloy (0.18 wt.% Mn) shows 11.11% enhancement in tensile strength and 7.14% improvement in elongation. Electrical conductivity exhibited complex behavior, initially decreasing due to Mn-induced lattice distortion, then increasing through β-Al5FeSi phase morphology optimization, followed by subsequent reduction at higher Mn content. Notably, the conductivity reduction was effectively controlled within 2.63% at 2# alloy, achieving an optimal balance between mechanical and electrical properties.
Hot extrusion promotes significant changes in microstructure of Al-0.6Mg-0.58Si-0.24Fe-xMn (x = 0.02, 0.18) alloys. A dual phase strengthening system is formed between α-Al (Fe, Mn) Si phase and Mg2Si phase in 0.18 wt.% Mn alloy, which hinders dislocation slip and inhibits subgrain growth. In addition, according to characteristics of fracture toughness dimples, it shows excellent plasticity and toughness. Therefore, tensile strength of 2# alloy increased by 8.72% and the elongation increased by 26.32%. Analysis of conductivity mechanisms shows that hot extrusion promotes dislocation rearrangement, and welding of internal defects and dispersed phases weaken lattice distortion by consuming Mn solid solution atoms in the Al matrix, resulting in a decrease of only 2.83% in the conductivity of 2# alloy, achieving a favorable balance of strength–elongation–conductivity.

Author Contributions

Methodology, J.D.; validation, J.D., J.H., W.Q., J.W. and Y.W.; formal analysis, J.H. and J.W.; investigation, J.H. and W.Q.; data curation, J.H.; writing—original draft preparation, J.H.; writing—review and editing, J.D.; visualization, Y.W.; supervision, J.D.; project administration, J.D.; funding acquisition, J.D. All authors have read and agreed to the published version of the manuscript.

Funding

This research received no external funding.

Data Availability Statement

The original contributions presented in this study are included in the article. Further inquiries can be directed to the corresponding author.

Acknowledgments

We are grateful to Lei Huang from Hebei University of Technology for his contributions to the validation.

Conflicts of Interest

The authors declare no conflicts of interest.

References

  1. Sauvage, X.; Bobruk, E.V.; Murashkin, M.Y.; Nasedkina, Y.; Enikeev, N.A.; Valiec, R.Z. Optimization of electrical conductivity and strength combination by structure design at the nanoscale in Al–Mg–Si alloys. Acta Mater. 2015, 98, 355–366. [Google Scholar] [CrossRef]
  2. Kalombo, R.B.; Martínez, J.M.G.; Ferreira, J.L.A.; da Silva, C.R.M.; Araújo, J.A. Comparative fatigue resistance of overhead conductors made of aluminium and aluminium alloy: Tests and analysis. Procedia Eng. 2015, 133, 223–232. [Google Scholar] [CrossRef]
  3. Karabay, S. Modification of AA-6201 alloy for manufacturing of high conductivity and extra high conductivity wires with property of high tensile stress after artificial aging heat treatment for all-aluminium alloy conductors. Mater. Des. 2006, 27, 821–832. [Google Scholar] [CrossRef]
  4. Koch, S.; Antrekowitsch, H. Aluminum Alloys for Wire Harnesses in Automotive Engineering. Berg-Huttenmaenn. Monatsh. 2007, 152, 62–67. [Google Scholar]
  5. Zhao, Q.R.; Qian, Z.; Cui, X.L.; Wu, Y.Y.; Liu, X.F. Optimizing microstructures of dilute Al–Fe–Si alloys designed with enhanced electrical conductivity and tensile strength. J. Alloys Compd. 2015, 650, 768–776. [Google Scholar] [CrossRef]
  6. Hansen, V.; Hauback, B.; Sundberg, M.; Rømming, C.; Gjønnes, J. β-Al4.5FeSi: A combined synchrotron powder diffraction, electron diffraction, high-resolution electron microscopy and single-crystal X-ray diffraction study of a faulted structure. Acta Crystallogr. Sec. B Struct. Sci. 1998, 54, 351–357. [Google Scholar] [CrossRef]
  7. Liu, T.L.; Huang, G.R.; Sun, Y.M.; Zhang, L.; Huang, Z.W.; Wang, J.J.; Liu, C.Z. Effect of Mn and Fe on the formation of Fe- and Mn-rich intermetallics in Al–5Mg–Mn alloys solidified under near-rapid cooling. Materials 2016, 9, 88. [Google Scholar] [CrossRef]
  8. Tang, H.-P.; Wang, Q.-D.; Lei, C.; Wang, K.; Ye, B.; Jiang, H.-Y.; Ding, W.-J. Effect of Cooling Rate on Microstructure and Mechanical Properties of Sand-Casted Al–5.0Mg–0.6Mn–0.25Ce Alloy. Acta Metall. Sin. (Engl. Lett.) 2019, 32, 1549–1564. [Google Scholar] [CrossRef]
  9. Cui, X.L.; Li, X.H.; Ye, H.; Cui, H.W.; Pan, Y.K.; Feng, R.; Wu, Y.Y.; Liu, X.F. Study on microstructure characterization, electrical conductivity and mechanical property improvement mechanisms of a novel Al-Si-Mg-Fe-Cu alloy. J. Alloys Compd. 2021, 885, 160959. [Google Scholar] [CrossRef]
  10. Marioara, C.D.; Andersen, S.J.; Jansen, J.; Zandbergen, H.W. Atomic model for GP-zones in a 6082 Al–Mg–Si system. Acta Mater. 2001, 49, 321–328. [Google Scholar] [CrossRef]
  11. Zhang, L.F.; Gao, J.W.; Damoah, L.N.W.; Robertson, D.G. Removal of iron from aluminum: A review. Miner. Process. Extr. Metall. Rev. 2012, 33, 99–157. [Google Scholar] [CrossRef]
  12. Deng, Y.; Yin, Z.; Zhao, K.; Duan, J.; He, Z. Effects of Sc and Zr microalloying additions on the microstructure and mechanical properties of new Al–Zn–Mg alloys. J. Alloys Compd. 2012, 530, 71–88. [Google Scholar] [CrossRef]
  13. Pramod, S.L.; Ravikiran; Prasada Rao, A.K.; Murty, B.S.; Bakshi, S.R. Effect of Sc addition and T6 aging treatment on the microstructure and mechanical properties of Al–4.2Mg–0.3Cu alloy. Mater. Sci. Eng. A 2016, 674, 438–450. [Google Scholar] [CrossRef]
  14. Shabestari, S.G. The effect of iron and manganese on the formation of intermetallic compounds in aluminum–silicon alloys. J. Mater. Sci. Eng. A 2004, 383, 289–298. [Google Scholar] [CrossRef]
  15. Wang, E.R.; Hui, X.D.; Chen, G.L. Eutectic Al–Si–Cu–Fe–Mn alloys with enhanced mechanical properties at room and elevated temperature. Mater. Des. 2011, 32, 4333–4340. [Google Scholar] [CrossRef]
  16. Wang, G.D.; Tian, N.; He, C.S.; Zhao, G.; Zuo, L. Formation of Second-Phases in a Direct-Chill Casting Al-12Si-0.65Mg-xMn Alloy. Acta Metall. Sin. 2018, 54, 1059–1067. [Google Scholar] [CrossRef]
  17. Wang, X.F.; Guo, M.X.; Zhang, J.S.; Zhuang, L.Z. Effect of Zn addition on the microstructure and mechanical properties of Al–Mg–Si–Cu alloys. Mater. Sci. Eng. A 2016, 677, 522–533. [Google Scholar] [CrossRef]
  18. Sreeja Kumari, S.S.; Pillai, R.M.; Rajan, T.P.D.; Pai, B.C. Effects of individual and combined additions of Be, Mn, Ca and Sr on the solidification behaviour, structure and mechanical properties of Al–7Si–0.3Mg–0.8Fe alloy. Mater. Sci. Eng. A 2007, 460, 561–573. [Google Scholar] [CrossRef]
  19. Zheng, Y.; Bian, L.P.; Ji, H.L.; Liu, X.W.; Tian, F. Influence of Ca and Mn on Microstructure, Mechanical Properties, and Electrical Conductivity of As-Cast and Heat-Treated Al-Mg-Si Alloys. Rare Met. Mater. Eng. 2022, 51, 4010–4020. [Google Scholar]
  20. GB/T 228-2010; Metallic Materials—Tensile Testing at Ambient Temperature. Standardization Administration of China: Beijing, China, 2010.
  21. Claves, S.R.; Elias, D.L.; Misiolek, W.Z. Analysis of the Intermetallic Phase Transformation Occurring during Homogenization of 6xxx Aluminum Alloys. Mater. Sci. Forum. 2002, 396, 667–674. [Google Scholar] [CrossRef]
  22. Donnadieu, P.; Lapasset, G.; Sanders, T.H. Manganese-induced ordering in the α-(Al-Mn-Fe-Si) approximant phase. Philos. Mag. Lett. 1994, 70, 319–326. [Google Scholar] [CrossRef]
  23. Liu, X.; Jia, H.L.; Wang, C.; Wu, X.; Zha, M.; Wang, H.Y. Enhancing mechanical properties of twin-roll cast Al–Mg–Si–Fe alloys by regulating Fe-bearing phases and macro-segregation. Mater. Sci. Eng. A 2022, 831, 142256. [Google Scholar] [CrossRef]
  24. Závodská, D.; Tillová, E.; Švecová, I.; Kuchariková, L. Secondary cast Al-alloys with higher content of iron. Mater. Today Proc. 2018, 5, 26680–26686. [Google Scholar] [CrossRef]
  25. Que, Z.P.; Mendis, C.L. Formation of θ-Al13Fe4 and the multi-step phase transformations to α-Al8Fe2Si, β-Al5FeSi and δ-Al4FeSi2 in Al–20Si-0.7Fe alloy. Intermetallics 2020, 127, 106960. [Google Scholar] [CrossRef]
  26. Chang, X.S.; Chen, G.; Sun, W.; Zhang, H.M.; Chu, G.N.; Zhang, X.; Han, F.; Zhang, W.C.; Du, Z.M. Microstructures, mechanical properties and solidification mechanism of a hot tearing sensitive aluminum alloy asymmetric part fabricated by squeeze casting. J. Alloys Compd. 2021, 886, 161254. [Google Scholar] [CrossRef]
  27. Pedersen, K.O.; Westermann, I.; Furu, T.; Børvik, T.; Hopperstad, O.S. Influence of microstructure on work-hardening and ductile fracture of aluminium alloys. Mater. Des. 2015, 70, 31–44. [Google Scholar] [CrossRef]
  28. Mikolajczak, P.; Ratke, L. Interplay between melt flow and the 3D distribution and morphology of Fe-rich phases in AlSi alloys. Metall. Mater. Trans. A 2015, 46, 1312–1327. [Google Scholar] [CrossRef]
  29. Li, Z.G.; Zhang, Z.J.; Zhou, G.W.; Zhao, P.; Jia, Z.H.; Poole, W.J. The effect of Mg and Si content on the microstructure, texture and bendability of Al–Mg–Si alloys. Mater. Sci. Eng. A 2021, 814, 141199. [Google Scholar] [CrossRef]
  30. Chen, H.L.; Chen, Q.; Bratberg, J.; Engström, A. Development and applications of the TCAL aluminum alloy database. Today Proc. 2015, 2, 4939–4948. [Google Scholar] [CrossRef]
  31. Kuijpers, N.C.W.; Kool, W.H.; Koenis, P.T.G.; Nilsen, K.E.; Todd, I.; van der Zwaag, S. Assessment of different techniques for quantification of α-Al(FeMn)Si and β-Al5FeSi intermetallics in AA 6xxx alloys. Mater. Charact. 2002, 49, 409–420. [Google Scholar] [CrossRef]
  32. Poole, W.J.; Wang, X.; Embury, J.D.; Lioyd, D.J. The effect of manganese on the microstructure and tensile response of an Al-Mg-Si alloy. Mater. Sci. Eng. A 2019, 755, 307–317. [Google Scholar] [CrossRef]
  33. Que, Z.P.; Wang, Y.; Fan, Z.Y. Formation of the Fe-containing intermetallic compounds during solidification of Al-5Mg-2Si-0.7 Mn-1.1 Fe alloy. Metall. Mater. Trans. A 2018, 49, 2173–2181. [Google Scholar] [CrossRef]
  34. Bradley, A.J.; Thewlis, J. The crystal structure of α-manganese. Proc. R. Soc. A 1927, 115, 456–471. [Google Scholar]
  35. Taylor, R.M.; Jones, R.M. Constitution and magnetic properties of iron-rich iron-aluminum alloys. J. Phys. Chem. Solids 1958, 6, 16–37. [Google Scholar] [CrossRef]
  36. Chen, Q.; Sundman, B. Modeling of thermodynamic properties for Bcc, Fcc, liquid, and amorphous iron. J. Phase Equilibria 2001, 22, 631–644. [Google Scholar] [CrossRef]
  37. Lodgaard, L.; Ryum, N. Precipitation of dispersoids containing Mn and/or Cr in Al–Mg–Si alloys. Mater. Sci. Eng. A 2000, 283, 144–152. [Google Scholar] [CrossRef]
  38. Jiang, S.Y.; Wang, R.H. Grain size-dependent Mg/Si ratio effect on the microstructure and mechanical/electrical properties of Al-Mg-Si-Sc alloys. J. Mater. Sci. Technol. 2019, 35, 1354–1363. [Google Scholar] [CrossRef]
  39. Moghanaki, S.K.; Kazeminezhad, M. Modeling of the mutual effect of dynamic precipitation and dislocation density in age hardenable aluminum alloys. J. Alloys Compd. 2016, 683, 527–532. [Google Scholar] [CrossRef]
  40. McElfresh, C.; Cui, Y.N.; Dudarev, S.L.; Po, G. Discrete stochastic model of point defect-dislocation interaction for simulating dislocation climb. Int. J. Plast. 2021, 136, 102848. [Google Scholar] [CrossRef]
  41. Lv, J.X.; Zheng, J.H.; Yardley, V.A.; Shi, Z.S.; Lin, J.G. A review of microstructural evolution and modelling of aluminium alloys under hot forming conditions. Metals 2020, 10, 1516. [Google Scholar] [CrossRef]
  42. Wang, Y.X.; Zhao, H.; Chen, X.R.; Gault, B.; Brechet, Y.; Hutchinson, C. The effect of shearable clusters and precipitates on dynamic recovery of Al alloys. Acta Mater. 2024, 265, 119643. [Google Scholar] [CrossRef]
  43. Wei, T.; Wang, Y.D.; Tang, Z.H.; Xiao, S.F. The constitutive modeling and processing map of homogenized Al-Mg-Si-Cu-Zn alloy. Mater. Today Commun. 2021, 27, 102471. [Google Scholar]
  44. Tong, M.M.; Jiang, F.; Wang, H.L.; Jiang, J.Y.; Wu, M.J.; Tang, Z.Q. The evolutions of flow stress and microstructure of Al-Mg-Mn-Sc-Zr alloy at elevated temperatures. Mater. Charact. 2021, 182, 111560. [Google Scholar] [CrossRef]
  45. Hou, J.P.; Li, R.; Wang, Q.; Yu, H.Y.; Zhang, Z.J.L.; Chen, Q.Y.; Ma, H.; Wu, X.M.; Li, X.W.; Zhang, Z.F. Three principles for preparing Al wire with high strength and high electrical conductivity. J. Mater. Sci. Technol. 2019, 35, 742–751. [Google Scholar] [CrossRef]
  46. Raeisinia, B.; Poole, W.J.; Lloyd, D.J. Examination of precipitation in the aluminum alloy AA6111 using electrical resistivity measurements. J. Mater. Sci. Eng. A 2006, 420, 245–249. [Google Scholar] [CrossRef]
  47. Ma, K.K.; Wen, H.M.; Hu, T.; Toppng, T.D.; Isheim, D.; Seidman, D.N.; Lavernia, E.J. Mechanical behavior and strengthening mechanisms in ultrafine grain precipitation-strengthened aluminum alloy. Acta Mater. 2014, 62, 141–155. [Google Scholar] [CrossRef]
  48. Orlova, T.S.; Mavlyutov, A.M.; Bondarenko, A.S.; Kasatkin, I.A.; Murashkin, M.Y.; Valiev, R.Z. Influence of grain boundary state on electrical resistivity of ultrafine grained aluminium. Philos. Mag. 2016, 96, 2429–2444. [Google Scholar] [CrossRef]
  49. Guan, R.; Shen, Y.F.; Zhao, Z.Y.; Wang, X. A high-strength, ductile Al-0.35 Sc-0.2 Zr alloy with good electrical conductivity strengthened by coherent nanosized-precipitates. J. Mater. Sci. Technol. 2017, 33, 215–223. [Google Scholar] [CrossRef]
  50. Wang, Y.; Zhu, L.J.; Niu, G.D.; Mao, J. Conductive Al alloys: The contradiction between strength and electrical conductivity. Adv. Eng. Mater. 2021, 23, 2001249. [Google Scholar] [CrossRef]
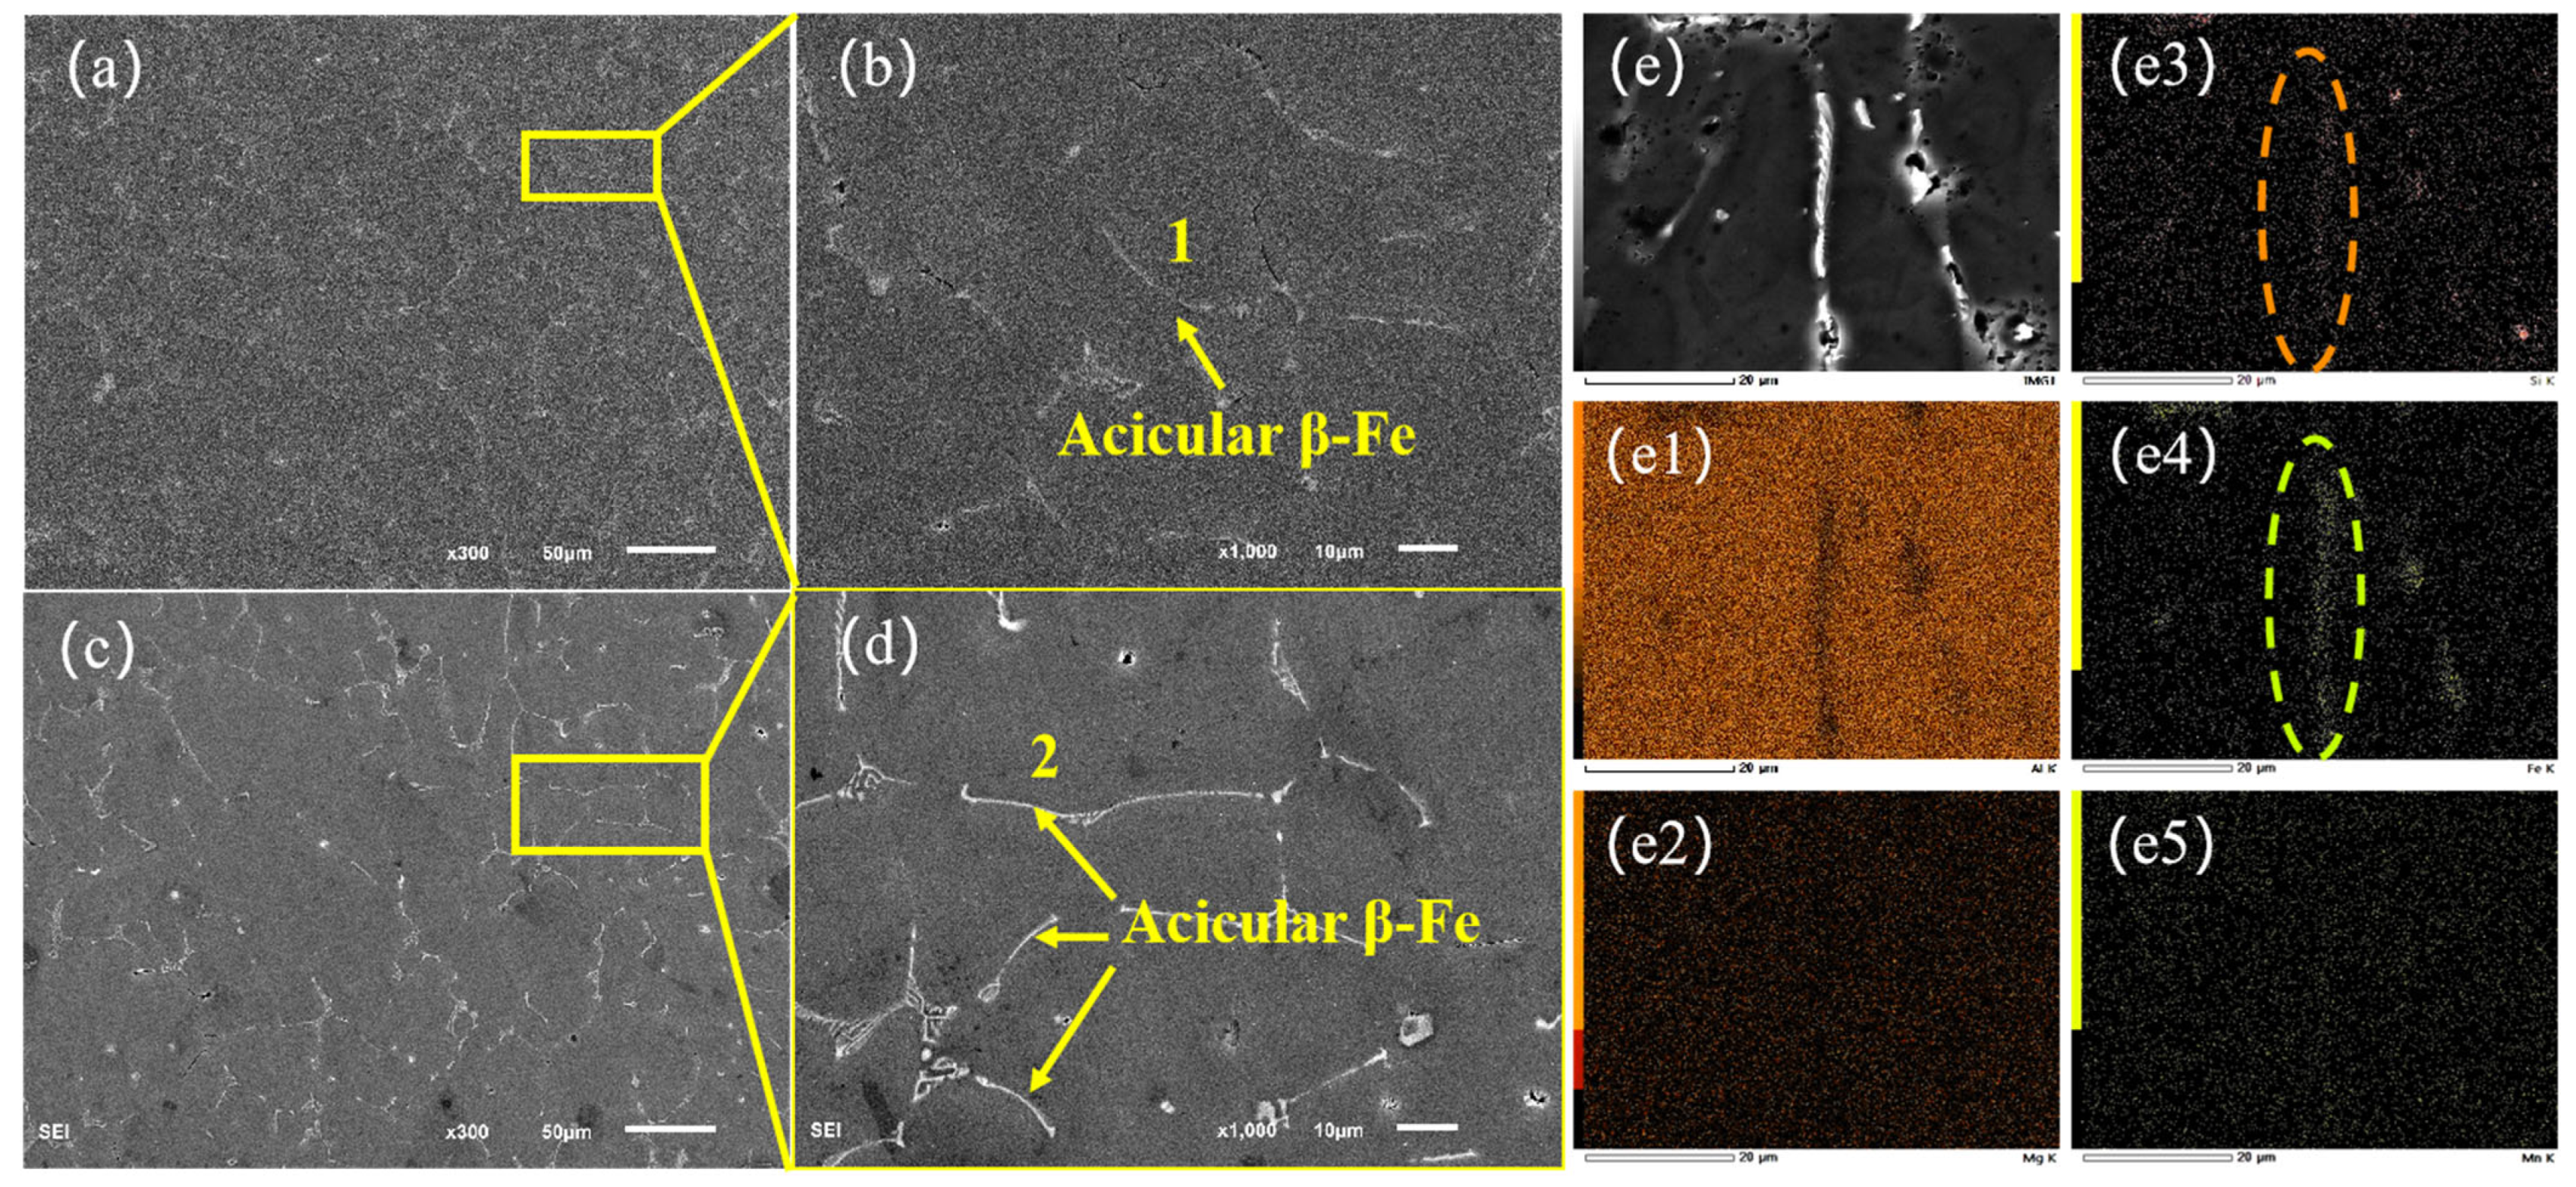
Figure 1. Typical microstructure of as-cast Al-0.6Mg-0.58Si-0.24Fe-xMn alloy: (a,b) original alloy (0#), (c,d) 0.12 wt.% Mn (1#), (ee5) EDS analysis of acicular β-Fe.
Metals 15 00923 g001
Figure 2. Typical microstructure of as-cast Al-0.6Mg-0.58Si-0.24Fe-xMn alloy: (a,b) 0.18 wt.% Mn (2#), (c,d) 0.24 wt.% Mn (3#).
Metals 15 00923 g002
Figure 3. Surface scan results of rod-like precipitate elements in Al-0.6Mg-0.58Si-0.24Fe-0.18Mn alloy (2#). (a) and (a1a5) show a scanning region of a rod-like precipitate and the corresponding distribution of Al, Mg, Si, Mn, and Fe elements, respectively; (b) and (b1b5) show a scanning region of another rod-like precipitate and the corresponding distribution of Al, Mg, Si, Mn, and Fe elements, respectively.
Metals 15 00923 g003
Figure 4. Statistical charts of stress–strain curves and properties in as-cast alloys: (a) engineering stress–strain curve, (b) property statistics.
Metals 15 00923 g004
Figure 5. Statistical chart of property change rate in as-cast alloy.
Metals 15 00923 g005
Figure 6. Typical microstructure of hot-extruded Al-0.6Mg-0.58Si-0.24Fe-xMn alloy. (a,c) Original alloy (0#), (b,d,eh) 0.18 wt.% Mn alloy (2#), (ii5) EDS results of original alloy (0#), (jj5) EDS results of 0.18 wt.% Mn alloy (2#).
Metals 15 00923 g006
Figure 7. Statistical charts of stress–strain curves and properties in hot-extruded alloys: (a) engineering stress–strain curve, (b) property statistics.
Metals 15 00923 g007
Figure 8. Typical fracture morphology of hot-extruded alloys. (a,b): Original alloy (0#), (c,d): 0.18 wt.% Mn alloy (2#).
Metals 15 00923 g008
Figure 9. Gibbs free energy of phases during solidification. (a) Original alloy (0#), (b) 0.12 wt.% Mn (1#), (c) 0.18 wt.% Mn (2#), (d) 0.24 wt.% Mn (3#).
Metals 15 00923 g009
Figure 10. Statistics of size and density distribution of precipitates: (a) as-cast, (b,c) after hot-extruded.
Metals 15 00923 g010
Figure 11. Typical TEM microscopic analysis in hot-extruded 2# alloy: (a) dislocation tangle, (be) block-like phase and EDS results, where (e1) is the TEM image of the block-like phase, and (e2e6) are the corresponding elemental distribution maps of Al, Mg, Si, Fe, and Mn, respectively. Scale bar in (e1e6): 250 nm.
Metals 15 00923 g011
Figure 12. Typical microstructure in hot-extruded 2# alloy: (a) block-like phase, (b,c) HRTEM and diffraction patterns of Al matrix, (d,e) HRTEM and diffraction patterns of block-like phase, (f,g) characteristics of dislocations and block-like phase orientation.
Metals 15 00923 g012
Figure 13. Typical microstructure in hot-extruded 2# alloy: (a,b) rod-like phase, (b,c) HRTEM and diffraction patterns of rod-like phase, (d) interaction between rod-like phase and grain boundaries.
Metals 15 00923 g013
Figure 14. Typical dislocations and subgrain configurations of hot-extruded alloys: (ac) original alloy (0#), (dg) 0.18 wt.% Mn (2#).
Metals 15 00923 g014
Figure 15. Electronic conduction diagram: (a) as-cast, (b) hot-extruded.
Metals 15 00923 g015
Table 1. Nominal composition of experimental Al-0.6Mg-0.58Si-0.24Fe-xMn alloy (wt.%).
MgSiFeMnTiCrOthersAl
0#0.60.580.240.020.020.01≤0.10Bal
1#0.60.580.240.120.020.01≤0.10Bal
2#0.60.580.240.180.020.01≤0.10Bal
3#0.60.580.240.240.020.01≤0.10Bal
Table 2. EDS results at numerical arrows in Figure 1 and Figure 2.
Element
MgAlSiMnFe(Fe, Mn)/Si
10.6896.941.130.131.131.12
20.4894.912.140.332.041.11
30.5990.443.651.284.041.46
40.5392.302.621.093.051.58
51.5880.366.593.997.471.74
Table 3. Initial Gibbs free energy and temperature of β-Al5FeSi during solidification.
Alloy0#1#2#3#
Gibbs Energy/(J/g)−1472.17−1161.56−897.74-
Temperature/°C545.85341.2499.72-
Table 4. The solid solubility of elements in aluminum and the resistivity values caused by unit addition.
ElementMgSiMnFe
Solid solubility14.91.651.820.042
ρ i s s / ( μ Ω · c m ) 0.541.022.942.56
Disclaimer/Publisher’s Note: The statements, opinions and data contained in all publications are solely those of the individual author(s) and contributor(s) and not of MDPI and/or the editor(s). MDPI and/or the editor(s) disclaim responsibility for any injury to people or property resulting from any ideas, methods, instructions or products referred to in the content.