Article

Hot Extrusion Process Grain Size Prediction and Effects of Friction Models and Hydraulic Press Applications

1
Metal Forming Research Corporation (MFRC), Jinju 52818, Republic of Korea
2
Graduate School of Mechanical and Aerospace Engineering, Gyeongsang National University, Jinju 52828, Republic of Korea
3
ReCAFT, School of Mechanical and Aerospace Engineering, Gyeongsang National University, Jinju 52828, Republic of Korea
*
Author to whom correspondence should be addressed.
Metals 2025, 15(8), 887; https://doi.org/10.3390/met15080887
Submission received: 2 July 2025 / Revised: 1 August 2025 / Accepted: 5 August 2025 / Published: 7 August 2025

Abstract

This study focuses on realistic modeling of forming load and microstructural evolution during hot metal extrusion, emphasizing the effects of friction models and hydraulic press behavior. Rather than merely predicting load magnitudes, the objective is to replicate actual press operation by integrating a load limit response into finite element modeling (FEM). By applying Coulomb and shear friction models under both constant and hydraulically controlled press conditions, the resulting impact on grain size evolution during deformation is examined. The hydraulic press simulation features a maximum load threshold that dynamically reduces die velocity once the limit is reached, unlike constant presses that sustain velocity regardless of load. P91 steel is used as the material system, and the predicted grain size is validated against experimentally measured data. Incorporating hydraulic control into FEM improves the representativeness of simulation results for industrial-scale extrusion, enhancing microstructural prediction accuracy, and ensuring forming process reliability.

Graphical Abstract

1. Introduction

Grain refinement and load optimization are critical in hot metal extrusion processes, as they directly affect the final mechanical performance, dimensional accuracy, and production efficiency of high-temperature structural components [1,2,3,4]. The prediction of microstructural evolution, particularly grain size, is essential in optimizing forming processes, improving material strength, and minimizing defects. However, many prior studies have addressed grain prediction without fully considering the dynamic nature of extrusion deformation or the impact of frictional behavior on grain evolution [5]. This creates a gap in simulating actual processing behavior where microstructure development is strongly coupled with process mechanics. Furthermore, many studies still rely on simplified friction assumptions that do not reflect the evolution of boundary conditions during forming [6].
Numerous studies have explored grain refinement using empirical or semi-empirical flow stress models, often assuming ideal forming conditions without accounting for real press mechanics [1,7,8,9,10,11,12]. For example, Sellars and Tegart [13] proposed foundational constitutive equations for hot deformation, yet their formulation assumes a constant strain rate, which does not reflect practical industrial forming environments. Similarly, many recent works use isothermal or fixed boundary simulations that ignore thermal–mechanical gradients and load feedback, leading to predictions that fail to match experimental outcomes under real extrusion loading profiles. These idealized models often produce grain sizes that deviate significantly from experimental measurements when applied to large-scale forming operations [14,15,16,17,18,19].
Friction modeling is another pivotal factor influencing extrusion simulations. While studies such as Lee et al. [20] compare shear and Coulomb models, they typically exclude interaction with dynamic press controls. Friction models alone cannot describe forming behavior accurately if not coupled with realistic machine behavior. In extrusion processes, the boundary interface changes continuously and failing to incorporate adaptive press mechanics results in oversimplified predictions of deformation load and stress distribution [21]. Moreover, many of these studies use a single friction model throughout the process, disregarding potential changes in contact conditions during deformation [22]. However, studies by Joun et al. [23] and Abd Ghawi et al. [24] implemented friction models with careful consideration of evolving contact conditions and applied them in coupled simulation frameworks. In practice, the transition from sticking to sliding conditions can drastically alter local strain rate and temperature, thus influencing recrystallization kinetics.
The integration of finite element method (FEM) frameworks into hot forming simulations has made it possible to link mechanical behavior with microstructural outcomes. However, in many cases, FEM is used to optimize forming load or stress distribution without validating grain evolution accuracy. For instance, Lin and Balint [25] introduced coupled thermomechanical FEM models, yet their application focused more on deformation than on validating the predicted grain structure. Furthermore, many Johnson–Mehl–Avrami–Kolmogorov (JMAK)-based grain models in the literature are implemented using fixed parameters, without dynamic updating based on local strain rate or temperature histories, which limits their capability in realistic process modeling [26,27,28,29,30,31]. This lack of process-structure integration restricts the utility of simulation models for microstructure-sensitive components such as those in power generation or aerospace [32,33,34,35].
One of the most critical and often overlooked aspects in extrusion simulations is the behavior of the hydraulic press system itself. Most previous studies simulate forming using constant velocity or force assumptions, which are inconsistent with how industrial hydraulic presses operate [23]. Realistic presses include load-limiting functions that dynamically adjust ram speed in response to forming resistance [36]. This has a significant influence on local strain rate, temperature evolution, and consequently, grain size. By not modeling hydraulic press behavior, prior simulations ignore how press mechanics mediate deformation history. This study incorporates a realistic hydraulic load limit (specifically 5000 kN) into the FEM framework to simulate velocity decay upon reaching the threshold. This approach captures industrial extrusion responses more effectively, ensuring that strain rate and thermal fields are accurate enough to drive reliable microstructure prediction [37].
This work extends previous efforts Razali et al. [1,2], by adopting a similar modeling framework for flow stress and dynamic recrystallization (DRX) but adapting it to the extrusion process. The forging-focused SCR420HB study validated the use of JMAK models but used constant press motion, whereas extrusion features continuous material flow and press feedback [2,23]. This distinction necessitates the inclusion of dynamic friction and hydraulic press behavior to accurately simulate grain size evolution. By integrating flow and grain size models with hydraulic press dynamics, the study provides more representative predictions for industrial-scale extrusion operations.

2. Experimental Setup and Process Modeling

2.1. Experimental Setup and Process Conditions

The extrusion experiments were conducted using a 1200-ton direct extrusion press system. The billet material was heated using an SX electric resistance furnace, allowing uniform temperature distribution prior to deformation. To reduce interface friction and protect the workpiece surface, glass pads were used as a lubricant for the billet, while the die was lubricated with water-based graphite. These choices helped minimize material sticking and enabled a more uniform flow during hot extrusion [23].
The overall experimental setup is shown in Figure 1, which includes (a) the extrusion press machine in the workshop, (b) the assembled die structure, and (c) a schematic drawing illustrating the die components and the positioning of the workpiece. The extrusion tooling consists of a top and bottom die enclosing a cylindrical billet, which is pressed downward using a pusher die. A glass pad was positioned beneath the billet to serve as an interface lubricant, consistent with industry practices for hot extrusion of high-temperature steels [6].
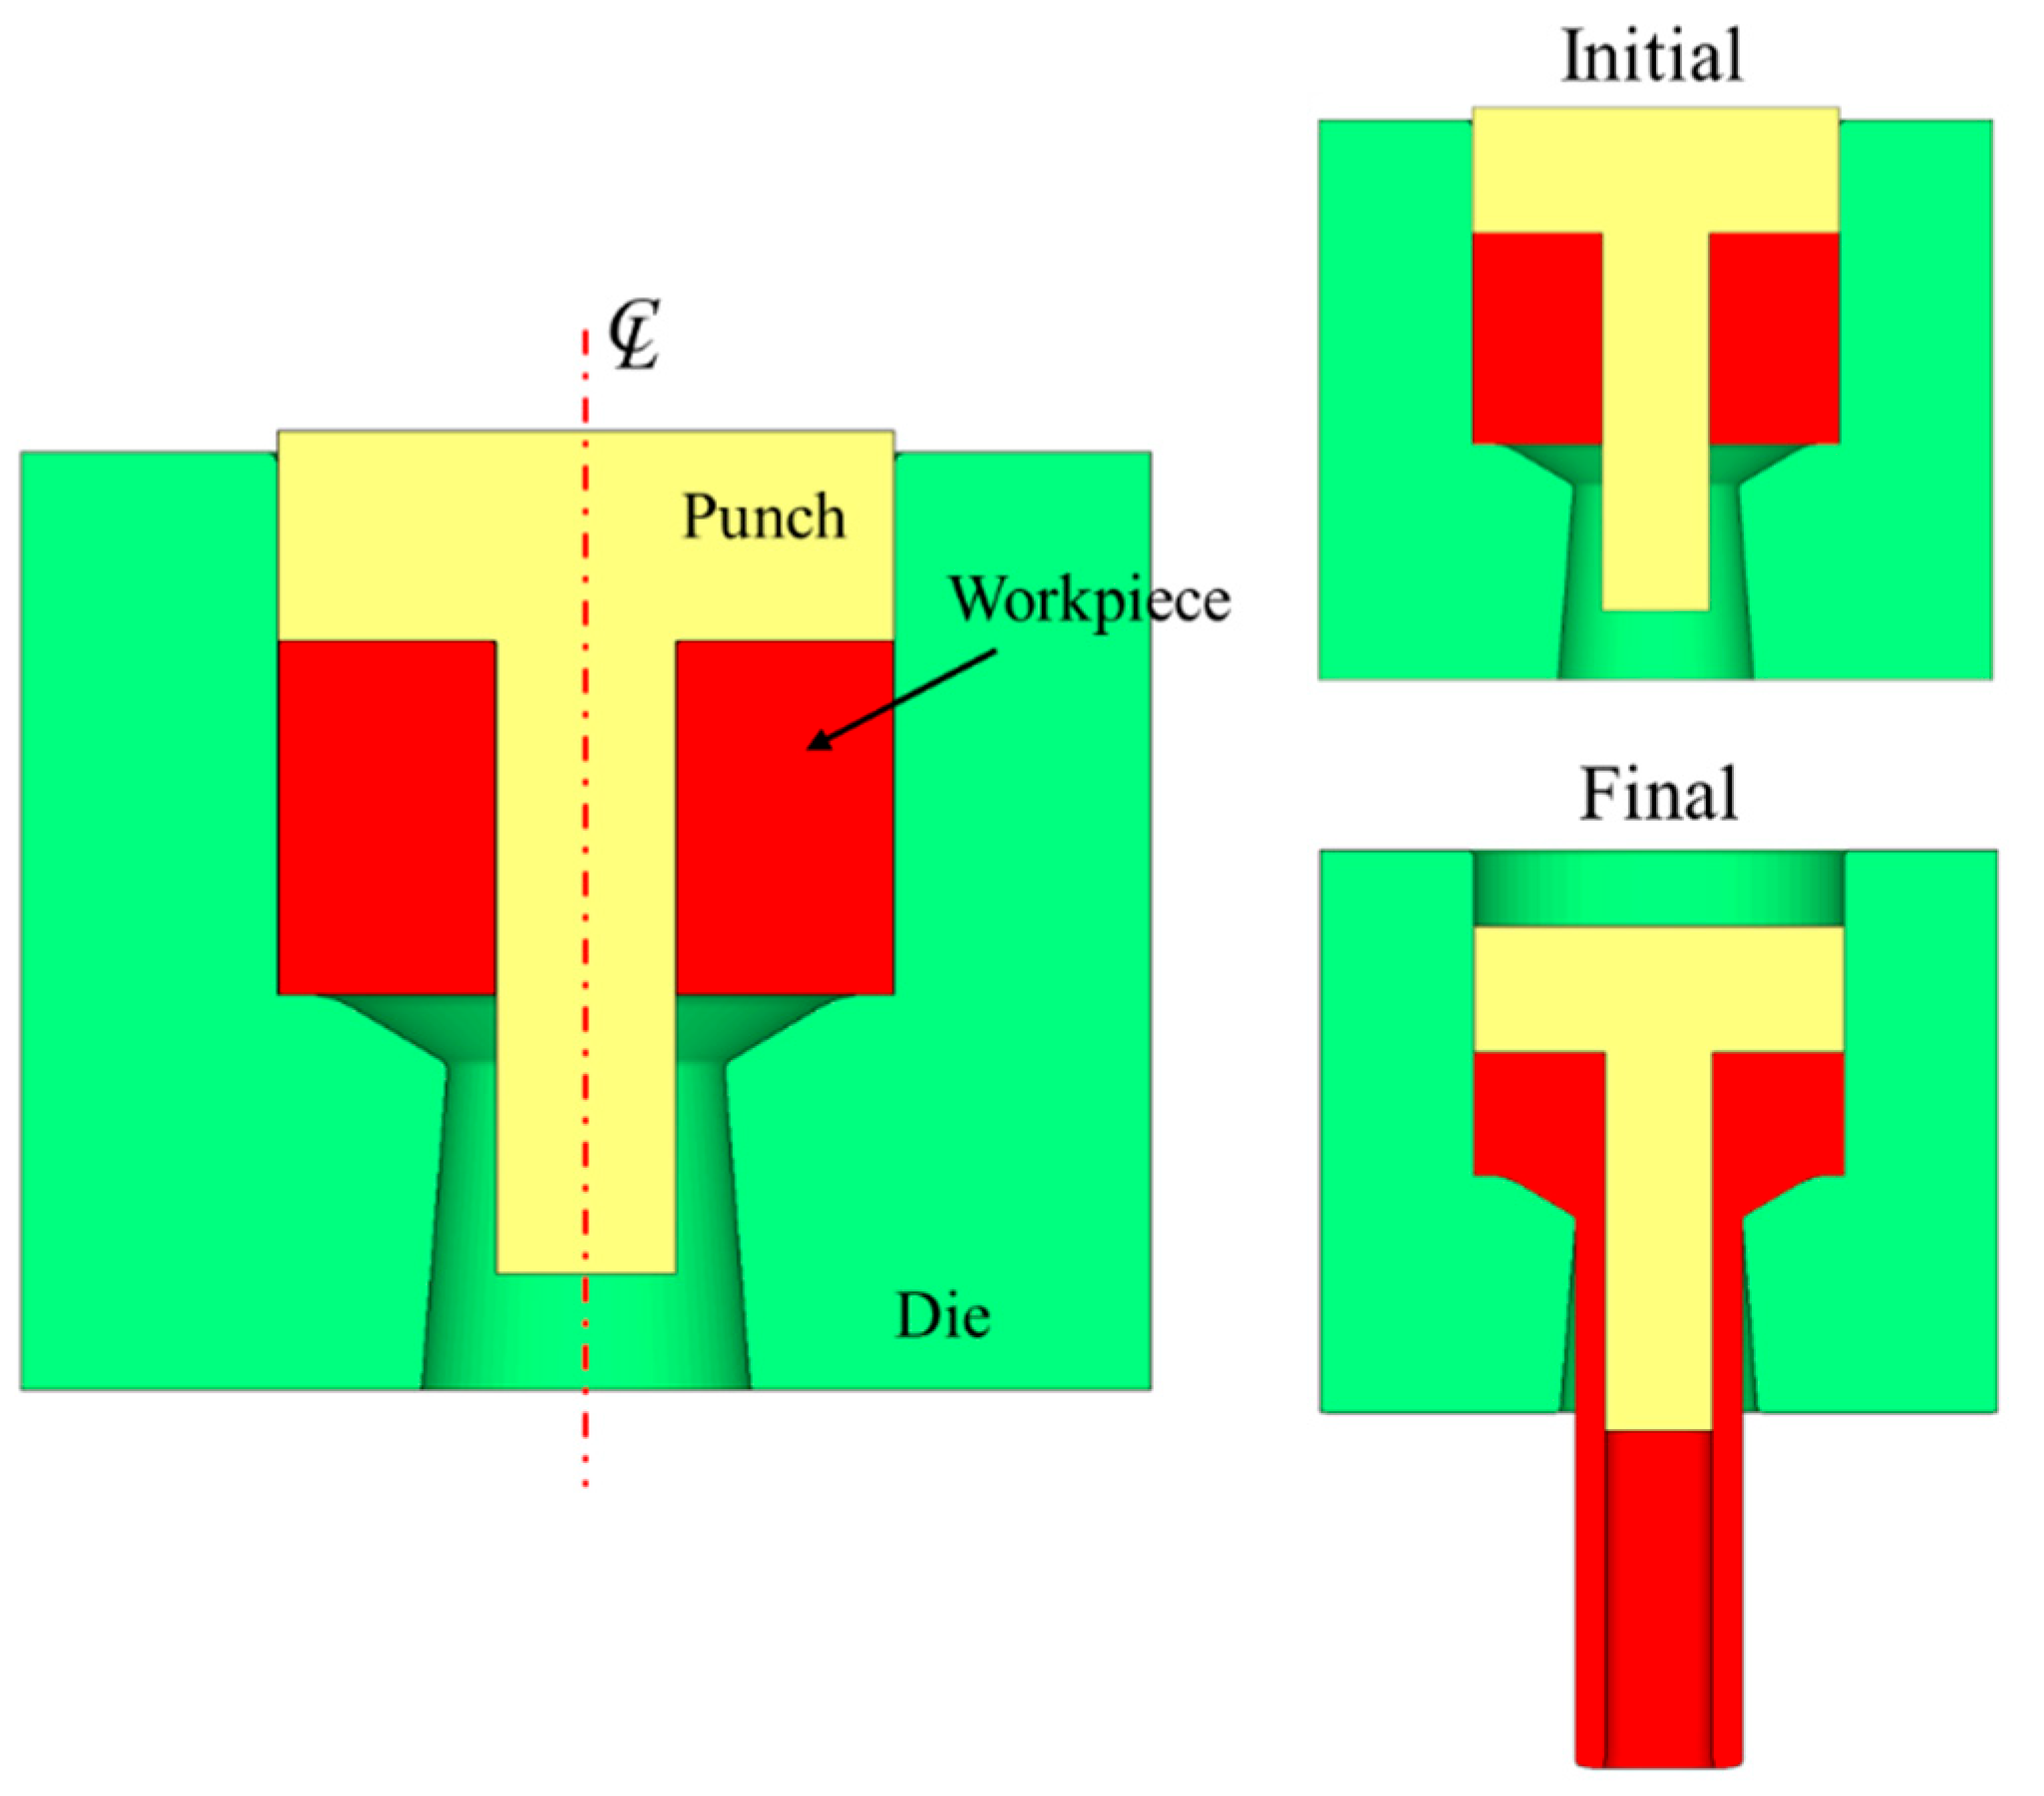
Building upon this experimental configuration, a corresponding finite element model (FEM) was developed using the commercial metal forming simulator AFDEX 2D (Altair Partner Alliance Software) [38], as shown in Figure 2. The axisymmetric simulation model replicates the same tooling layout, with the punch driving the billet through the die cavity under coupled thermal and mechanical loading. AFDEX employs a rigid- or elasto-thermo-viscoelastic finite element formulation, enabling accurate modeling of complex deformation processes (see Appendix A for dimensional comparison). In this study, a mesh consisting of 6000 quadrilateral elements was used (solution convergence discussed in Appendix B), determined to be optimal for achieving both computational efficiency and geometric fidelity of the workpiece [23,39]. A water-based lubricant composed of sodium hydroxide, isophthalic acid, carboxymethyl cellulose, and sodium benzoate was sprayed onto the die and punch surfaces at 200 °C, where it rapidly dried to form a coating. To simulate interfacial behavior, both a Coulomb friction coefficient of 0.2 and a shear friction factor of 0.4 were applied separately to the billet–die interface, allowing a comparative assessment of their effects on deformation behavior and grain size predictions [1,23]. This setup allows for fully coupled thermomechanical analysis and supports advanced material and microstructure modeling, including the implementation of load control, friction behavior, and DRX, which are critical for replicating industrial-scale extrusion conditions with high fidelity [40].
The details of thermal parameters, including specific heat capacity, thermal conductivity, and interfacial heat transfer coefficients for the P91 workpiece and SKD61 die material, are listed in Table 1. These parameters define the boundary conditions used in the simulation and serve as input for process modeling in subsequent sections [38,41]. The die was assumed to behave as a rigid body, and P91 billets were preheated to 1200 °C prior to extrusion. Table 2 summarizes the thermal boundary conditions at the material–die interface and free surfaces, including convective heat transfer coefficients adapted from reference [41]. Heat loss from surfaces not in contact with the tooling was modeled considering natural convection, with coefficients varying based on temperature and environment. It was further assumed that 90% of the plastic work converted into heat, with frictional heat generation equally shared between the die and billet at their interface due to relative sliding [23].

2.2. Friction Modeling and Contact Interface Characterization

Friction at the billet–die interface significantly influences material flow, thermal gradients, and DRX during hot extrusion. To investigate the sensitivity of DRX grain size ( d D R X ) prediction to interfacial friction modeling, two widely adopted formulations [23,40], Coulomb friction (Equation (1)) and constant shear friction (Equation (2)) were compared in this study.
In the Coulomb friction model, the interfacial shear stress ( σ t ) is proportional to the normal contact stress ( σ n ), scaled by the coefficient of friction μ, and expressed as:
σ t = μ σ n g v t v ¯ t ,           w i t h           g v t v ¯ t = 2 π t a n 1 υ t υ ¯ t a
where v t and v ¯ t denote the tangential velocity of the billet and the die surface, respectively, and a is a positive constant. This model effectively captures pressure-sensitive friction behavior, which becomes prominent under the varying contact conditions of hot extrusion [23].
The constant shear friction model, in contrast, assumes a fixed frictional shear stress independent of contact pressure:
σ t = m k g v t v ¯ t ,             w i t h   k = Y 3
where m is the friction factor, and Y is the material’s flow stress used to compute the shear yield stress k. While the constant shear model simplifies implementation, it lacks responsiveness to pressure variations, potentially underestimating localized strain and temperature fields that govern DRX.

2.3. Punch Velocity Control and Load Constraint Conditions

In hot extrusion, the punch movement not only drives material flow but also determines the thermomechanical conditions that influence DRX. To better reflect real processing scenarios, two punch control strategies were evaluated in this study:
(a)
Constant Velocity Mode: The punch initially travels at a fixed velocity of −10 mm/s. However, once the forming load exceeds the press capacity, the velocity is automatically reduced to accommodate the increasing resistance. In this mode, the load was observed to rise beyond 6000 kN, surpassing the actual machine limit of 5000 kN, resulting in an unrealistic representation of the industrial process.
(b)
Hydraulic Press Mode (Load-Constrained): This approach also starts with a −10 mm/s punch velocity, but with an active force limit of 5000 kN imposed. Once this threshold is reached, the punch speed is reduced dynamically to ensure the load remains within the allowable range, more accurately replicating real hydraulic press behavior.
Both strategies were analyzed under Coulomb and constant shear friction conditions to understand their combined effect on microstructural evolution. The load-constrained hydraulic press mode produced a more stable strain rate and temperature distributions, which are critical inputs for DRX modeling. In contrast, the unconstrained constant velocity case, with excessive loads and altered punch motion, led to different thermal and mechanical histories, ultimately affecting d D R X predictions.
These comparisons highlight the necessity of using realistic punch boundary conditions in hot extrusion simulations [23]. Accurately modeling the interplay between punch motion, load control, and interfacial friction is essential for predicting d D R X with high fidelity and aligning simulation outputs with experimental observations.

2.4. Flow Stress Calibration and Implementation

High-temperature uniaxial compression tests were conducted to characterize flow stress behavior across a range of strain rates and temperatures. The resulting data were used to calibrate the generalized piecewise C-m constitutive model, as proposed by Joun et al. [42]. This model incorporates a systematic formulation and a practical parameter identification scheme using bilinear functions of strain rate and temperature, and it remains effective regardless of dependence on state variables. The calibrated model was implemented into the AFDEX FEM solver to simulate material response during extrusion, enabling accurate predictions of strain-rate- and temperature-dependent deformation. The same flow model, previously validated on commercial steel 20MoCrS4, aluminum alloy AHS-2, and magnesium alloy AZ80 [1,41], was adopted in this study and is expressed as follows:
σ ¯ = ( C 0 + C 1 ε ˙ γ ) ε ˙ ( m 0 + m 1 l n ε ˙ )
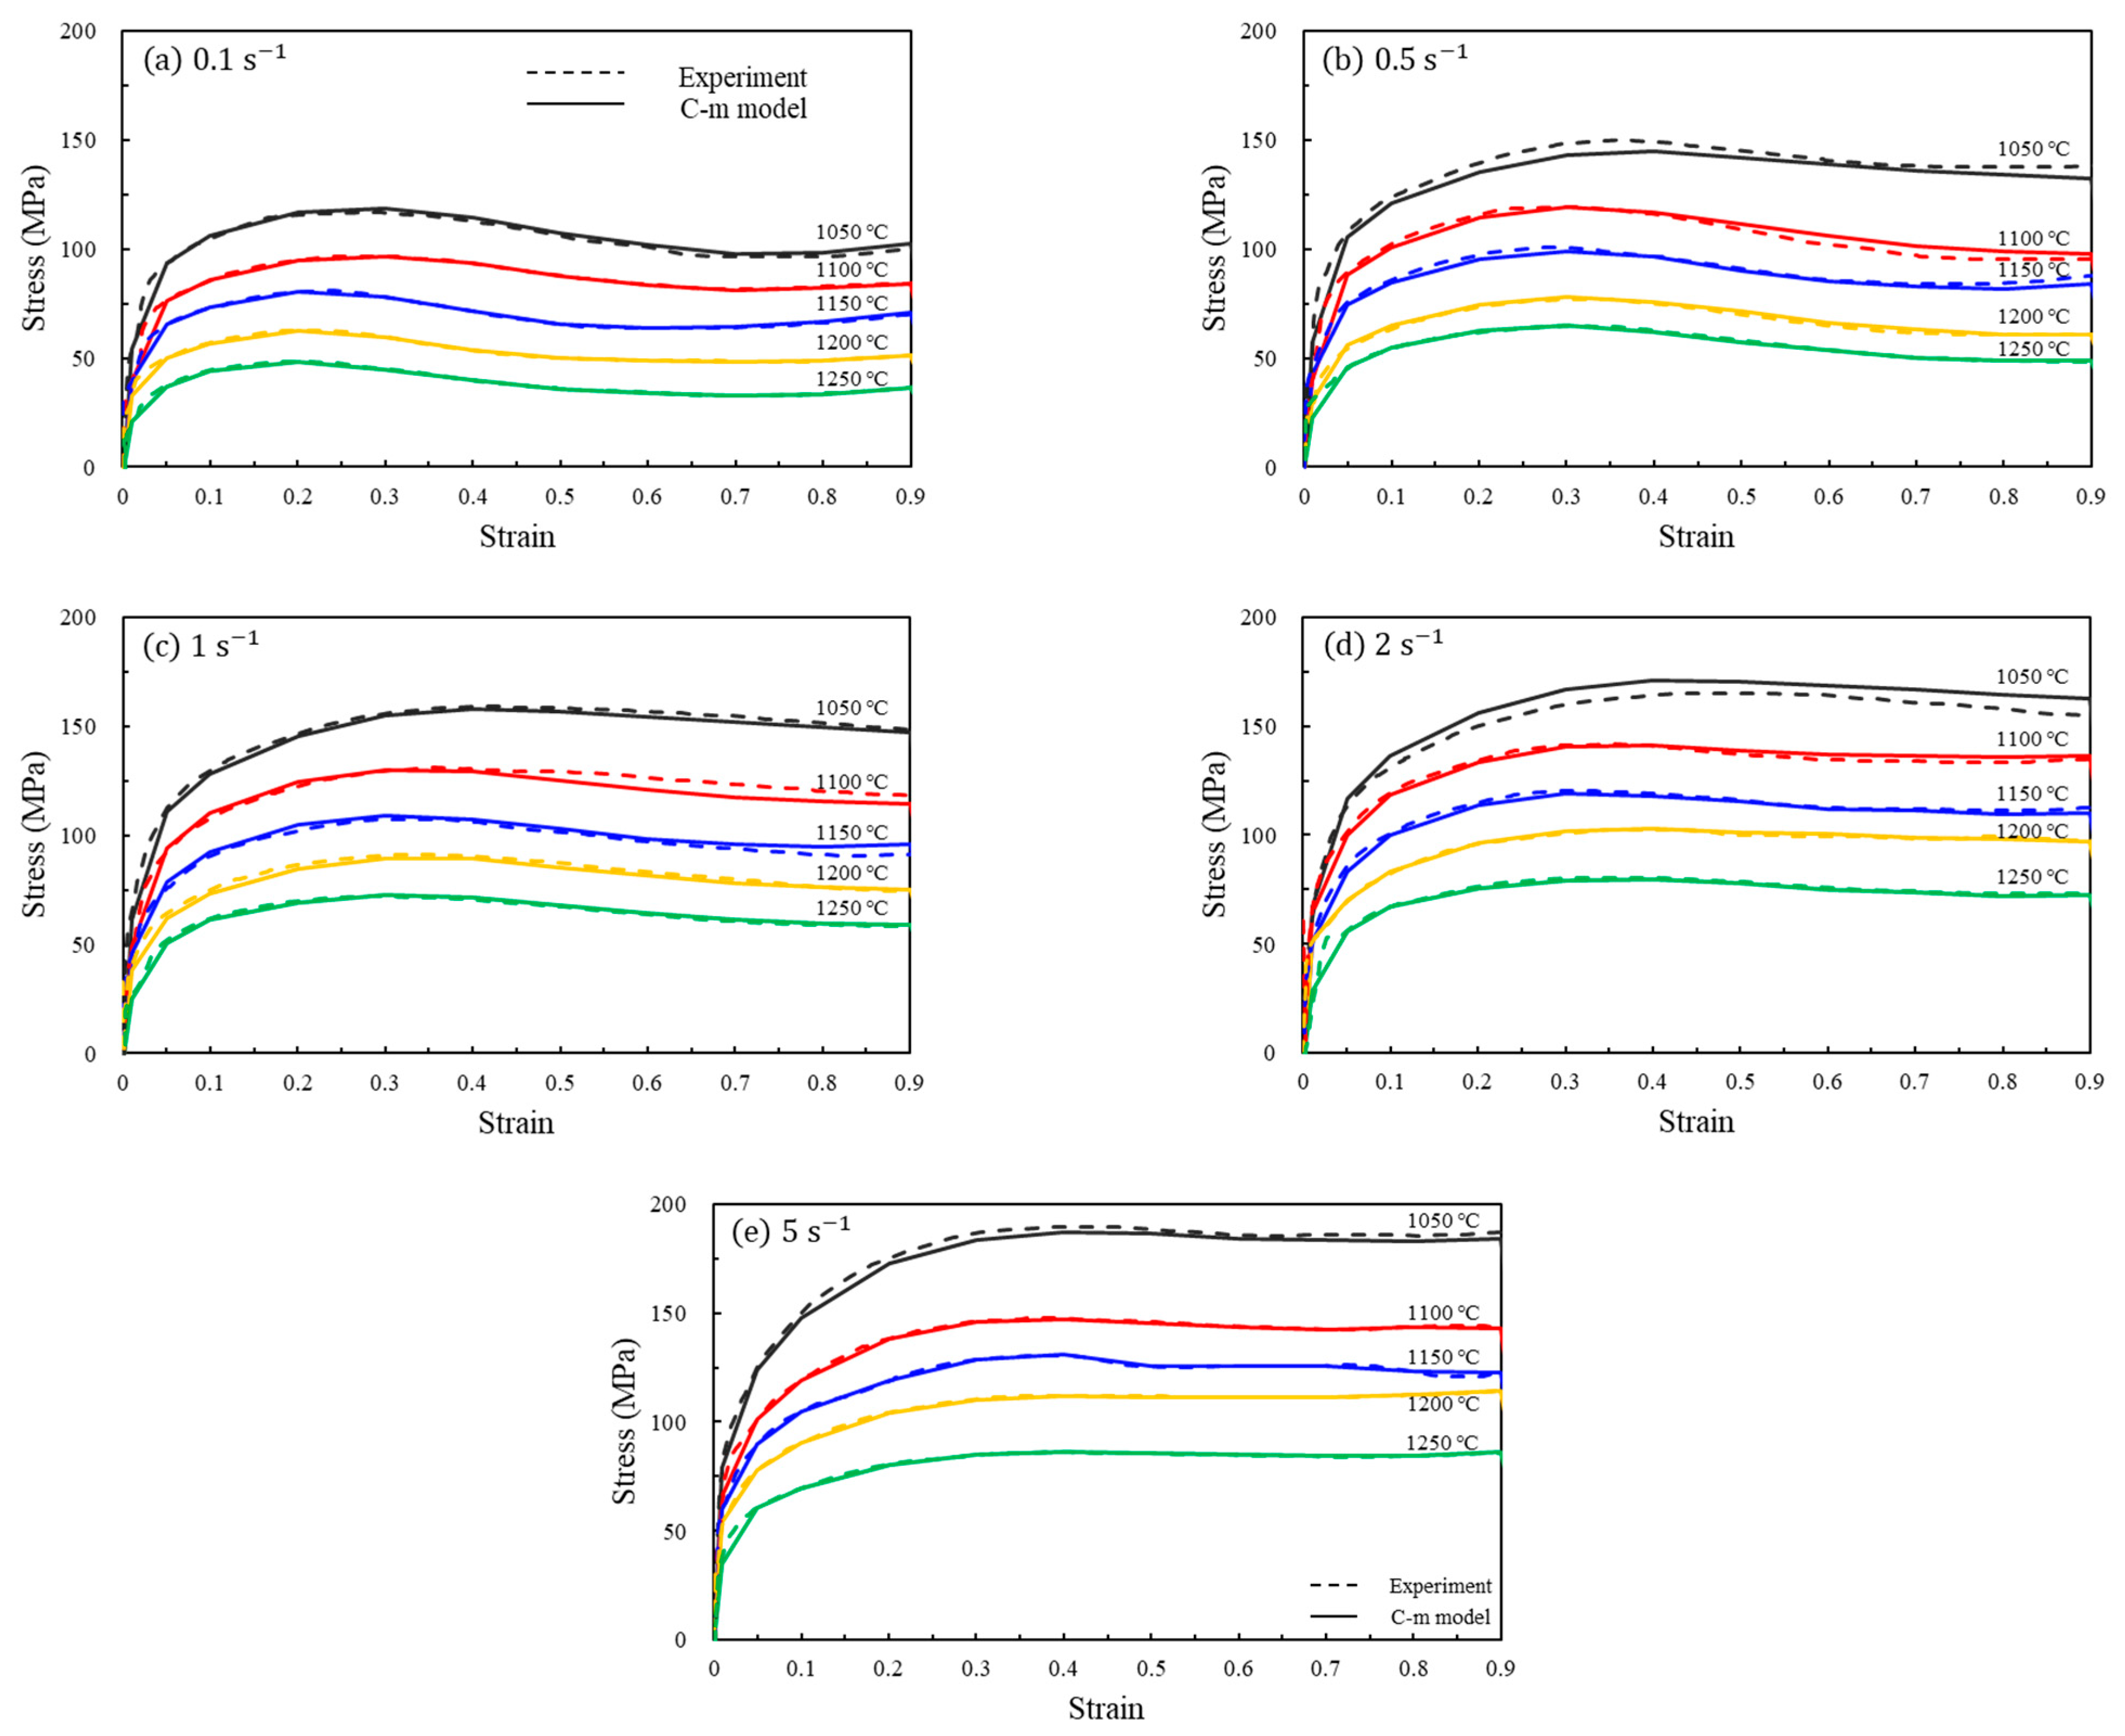
where the parameters C [MPa] and m represent material-specific constants that are defined at given strains and temperatures. These constants are determined by minimizing the discrepancy between experimental data and the fitted flow stress curves [42]. The identified material parameters are summarized in Table 3. As shown in Figure 3, the predicted flow curves exhibit close alignment with the experimental results. The maximum deviation observed is 1.8%, with an average absolute relative error (AARE) of 1.1%, indicating high model accuracy. Owing to its flexible formulation, the model effectively captures flow stress behavior over a range of temperatures and strain rates, enabling precise identification of the strain conditions under which DRX initiates.

2.5. Grain Size Calibration and Implementation

2.5.1. Experimental Grain Size Measurement in Extruded Billets

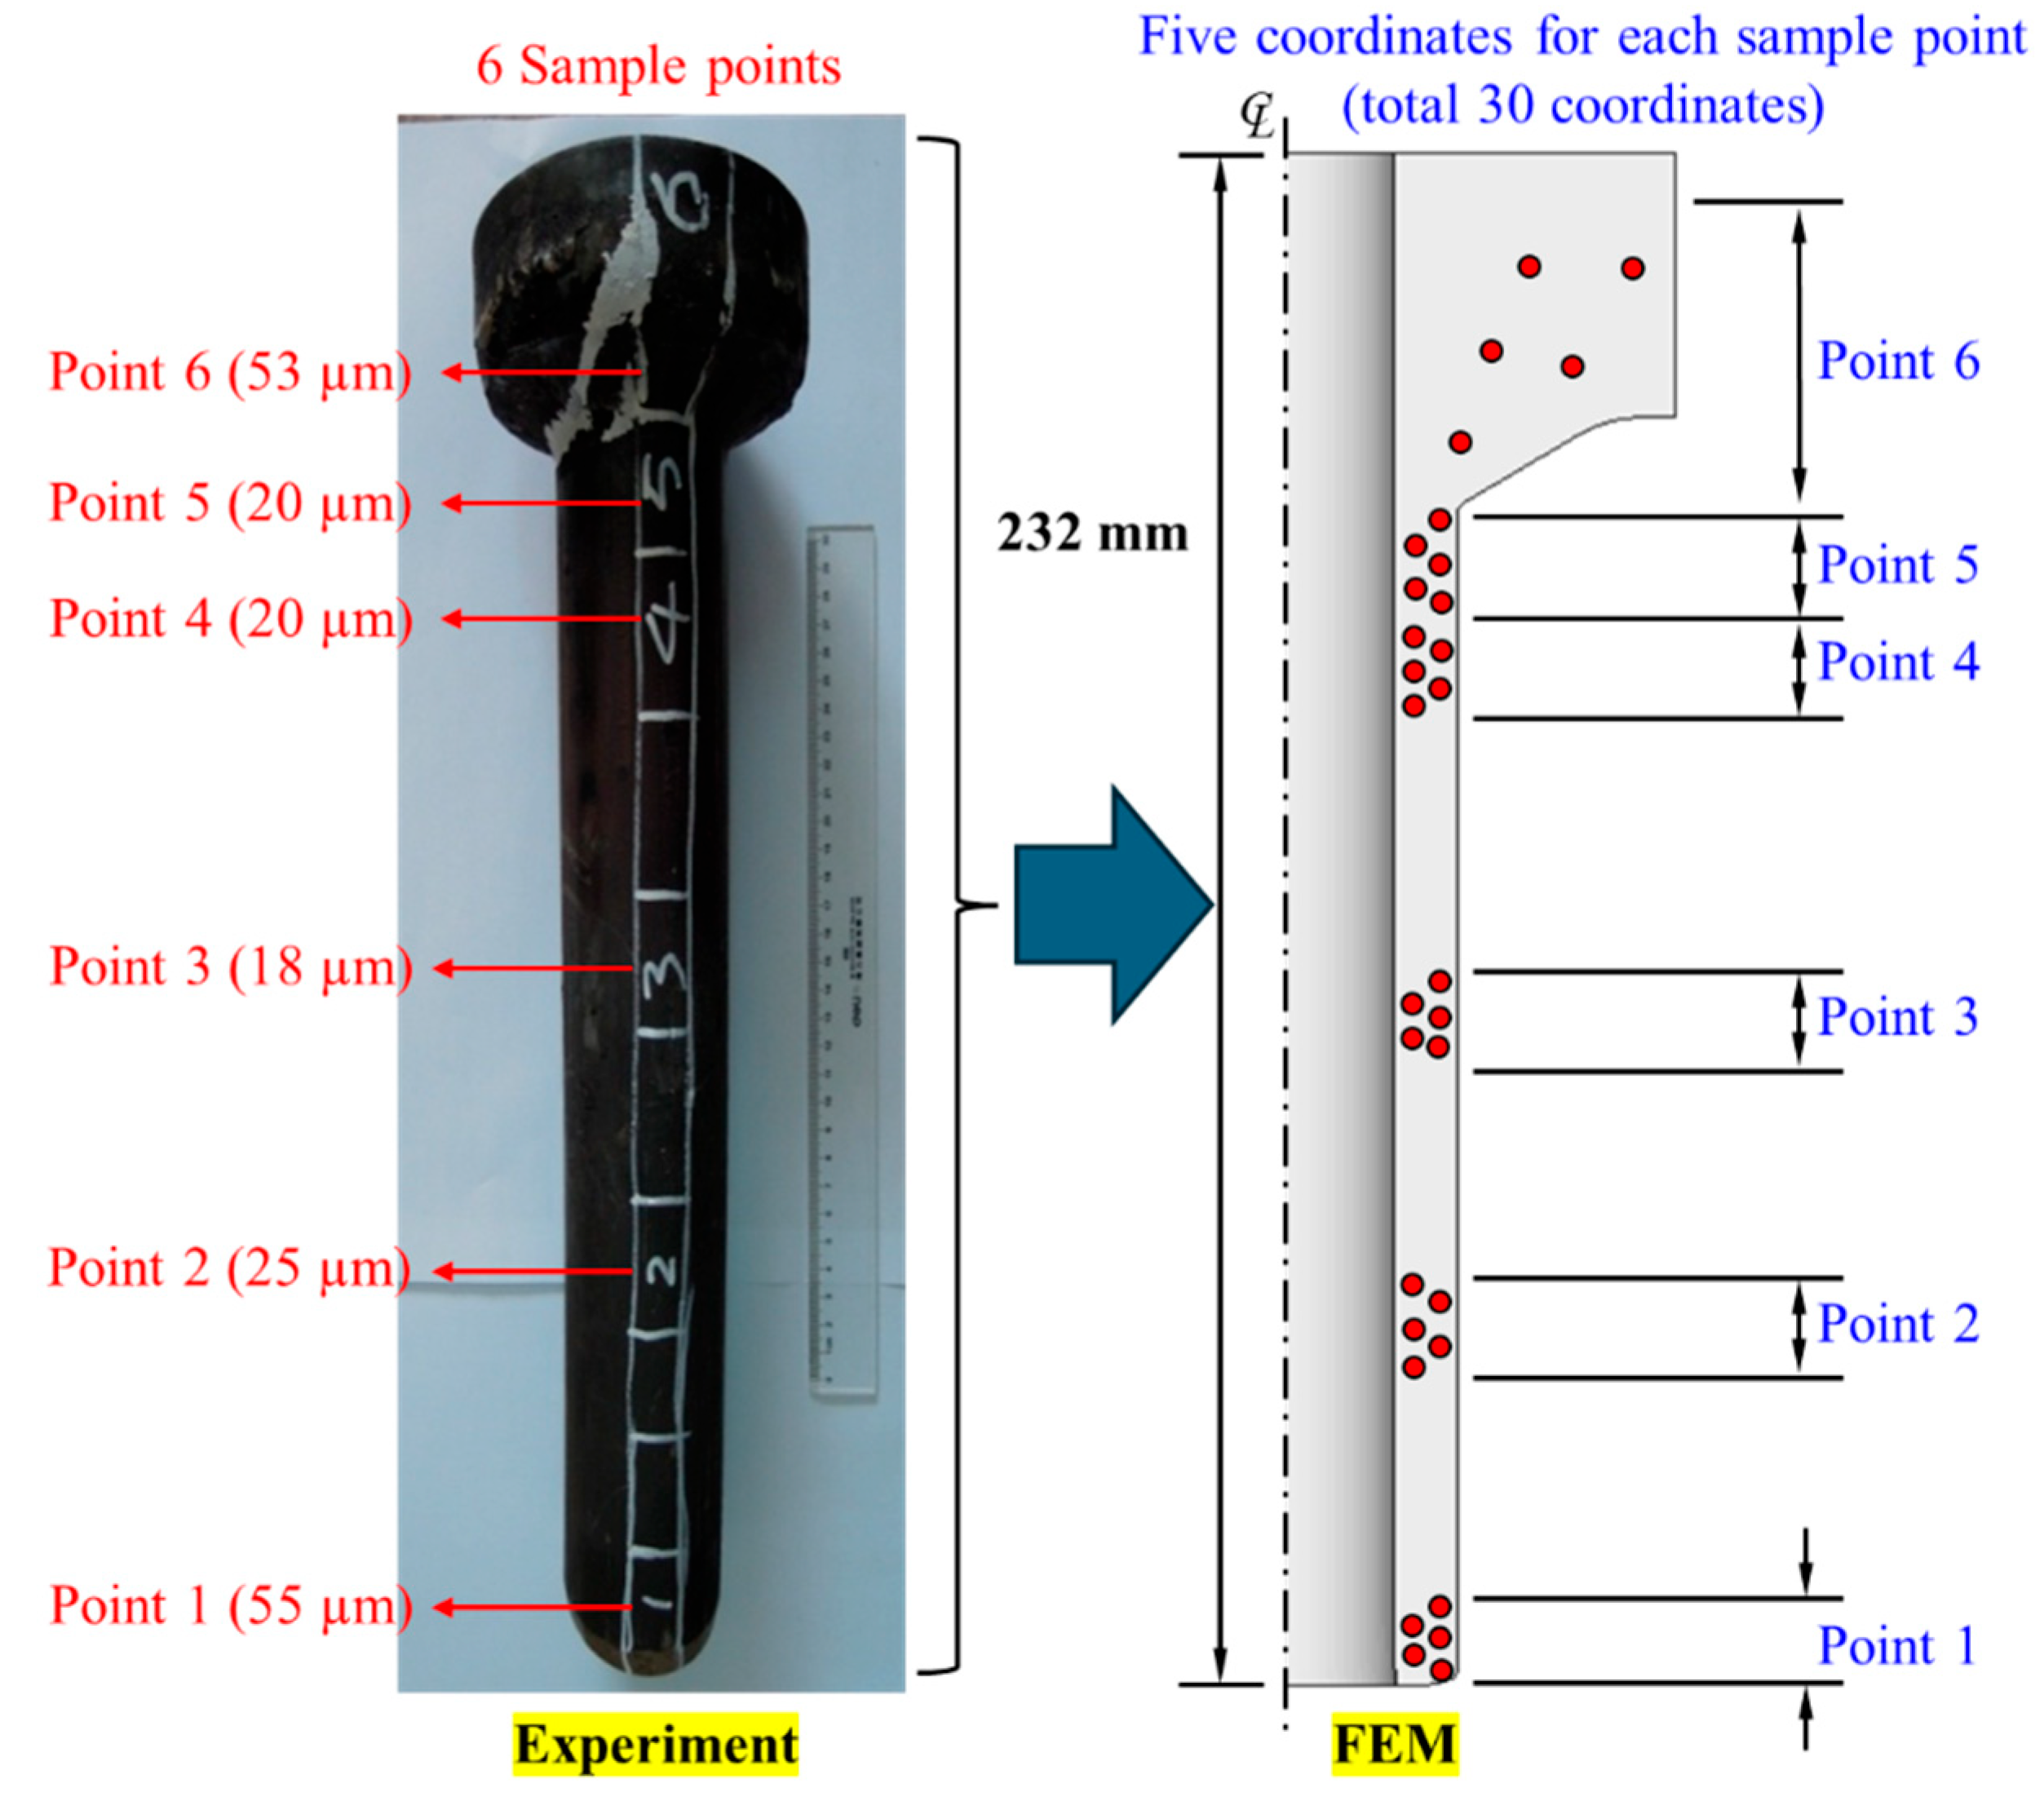
Grain boundaries were effectively revealed using a tailored etching solution consisting of saturated aqueous picric acid, with sodium tridecylbenzene sulfonate added as a surfactant to promote uniform wetting and consistent etching across the sample surface [1]. This preparation step was essential for achieving a clear delineation of grain structures, facilitating accurate microstructural analysis [9]. Grain size measurements, obtained from multiple sampling locations on the specimens and illustrated in Figure 4, reflect the grain size variation induced by the extrusion process. These results underscore the reliability of the etching technique in exposing fine microstructural features and provide a solid foundation for validating the grain size predictions and analyzing the microstructural evolution of P91 steel during hot extrusion.

2.5.2. JMAK-Based Model

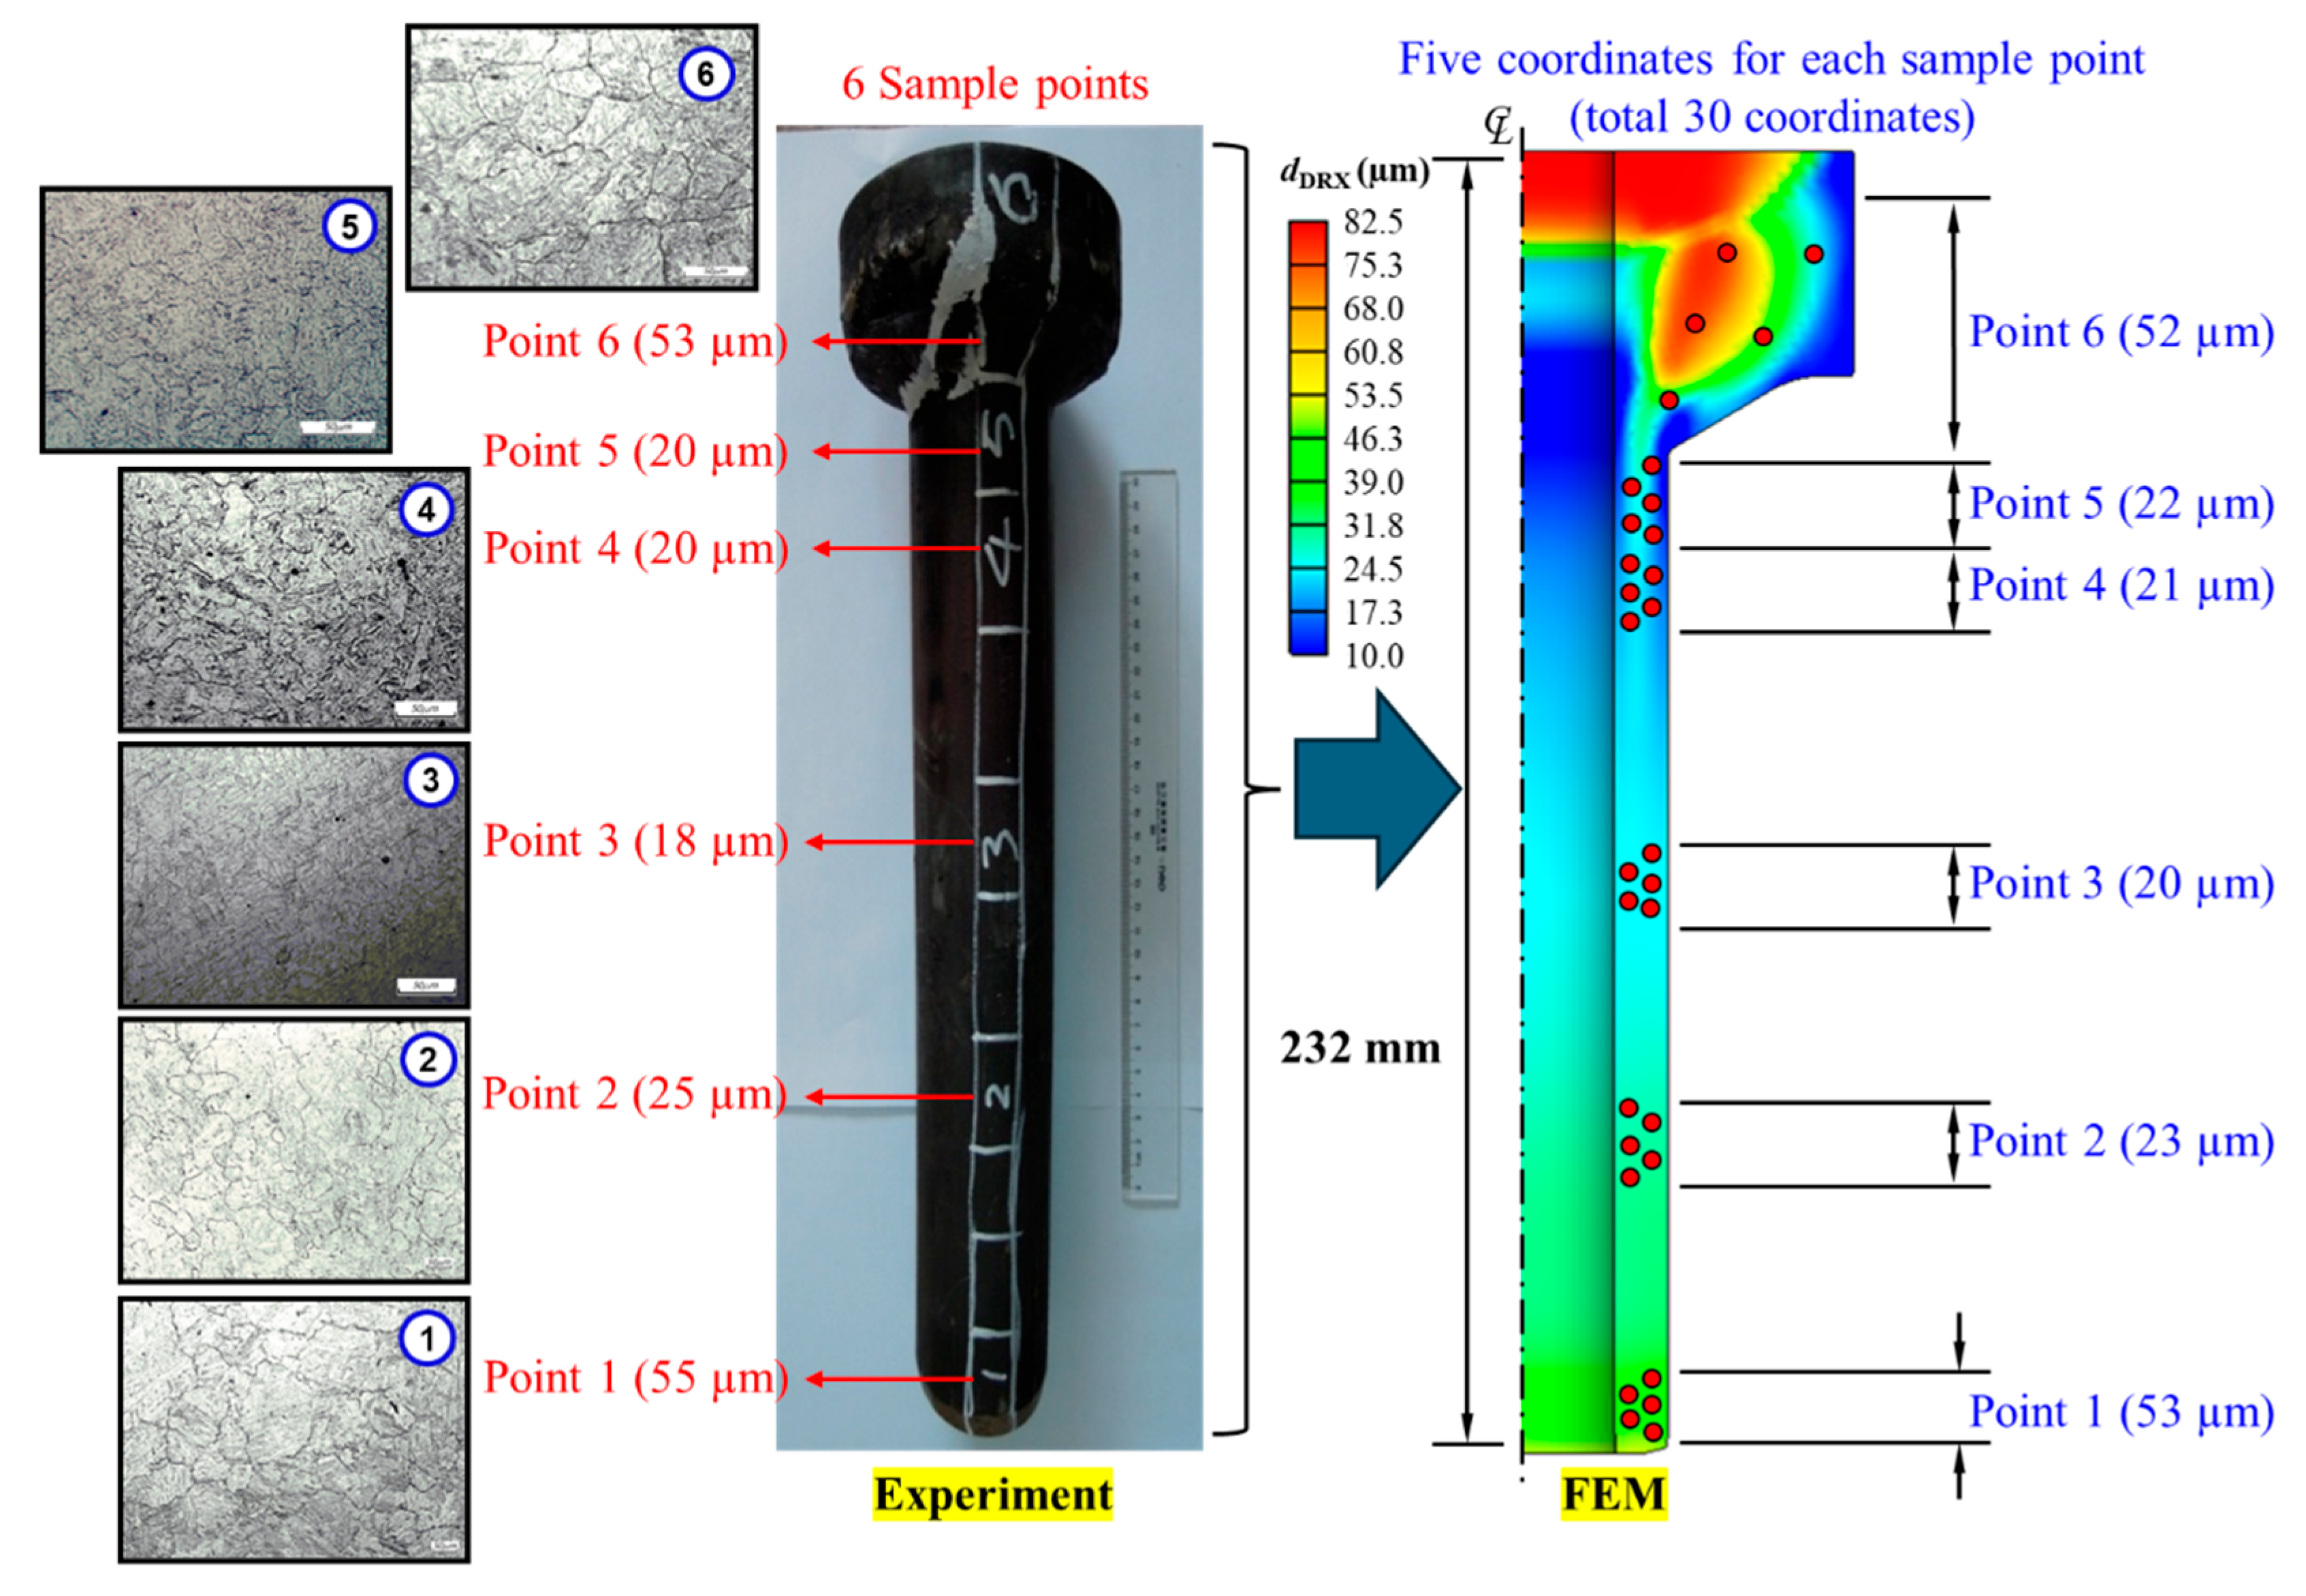
A simulation–experiment coupled approach was developed to predict grain size evolution during the hot extrusion of P91 steel. This methodology integrates FEM-based thermomechanical analysis with post-processing microstructural evaluation, enabling detailed tracking of d D R X . Post-extrusion metallographic analyses were carried out at six longitudinal positions along the extruded billet (see Figure 5), capturing spatial variations in grain size. These measurements were used to validate a JMAK-based DRX model embedded within the simulation workflow. Discrepancies between predicted and experimental grain sizes guided iterative calibration, enabling parameter refinement and model convergence. This comprehensive dataset supports robust validation of the numerical framework under varying strain rate and temperature conditions [1,2].
The evolution of d D R X during hot deformation is often described using phenomenological models grounded in JMAK theory [1,2]. In this study, the d D R X , is modeled based on a set of thermomechanical variables, including effective strain (ε), strain rate ( ε ˙ ) and absolute temperature (T). These variables are local values obtained from specific points in the material during the extrusion simulation using AFDEX. They represent the actual conditions experienced by the material and are used to extract data at selected sample points (as shown in Figure 5) for validation. These state variables define the deformation history and are crucial for capturing microstructural transformations during high-temperature processing. The model also includes key input parameters: the universal gas constant (R), the initial grain size ( d 0 ), and the peak strain ( ε p ), which signifies the onset of DRX. For simulation purposes, R is taken as 8.314472 J/(mol·K), d 0 is fixed at 82.5 µm, and ε p varies with forming conditions. In general, the d D R X is characterized by a piecewise function as follows:
d D R X = d 0                                                                                                       i f   ε < ε p d D R X = a d 0 h ε n ε ˙ m exp Q R T                             i f   ε ε p
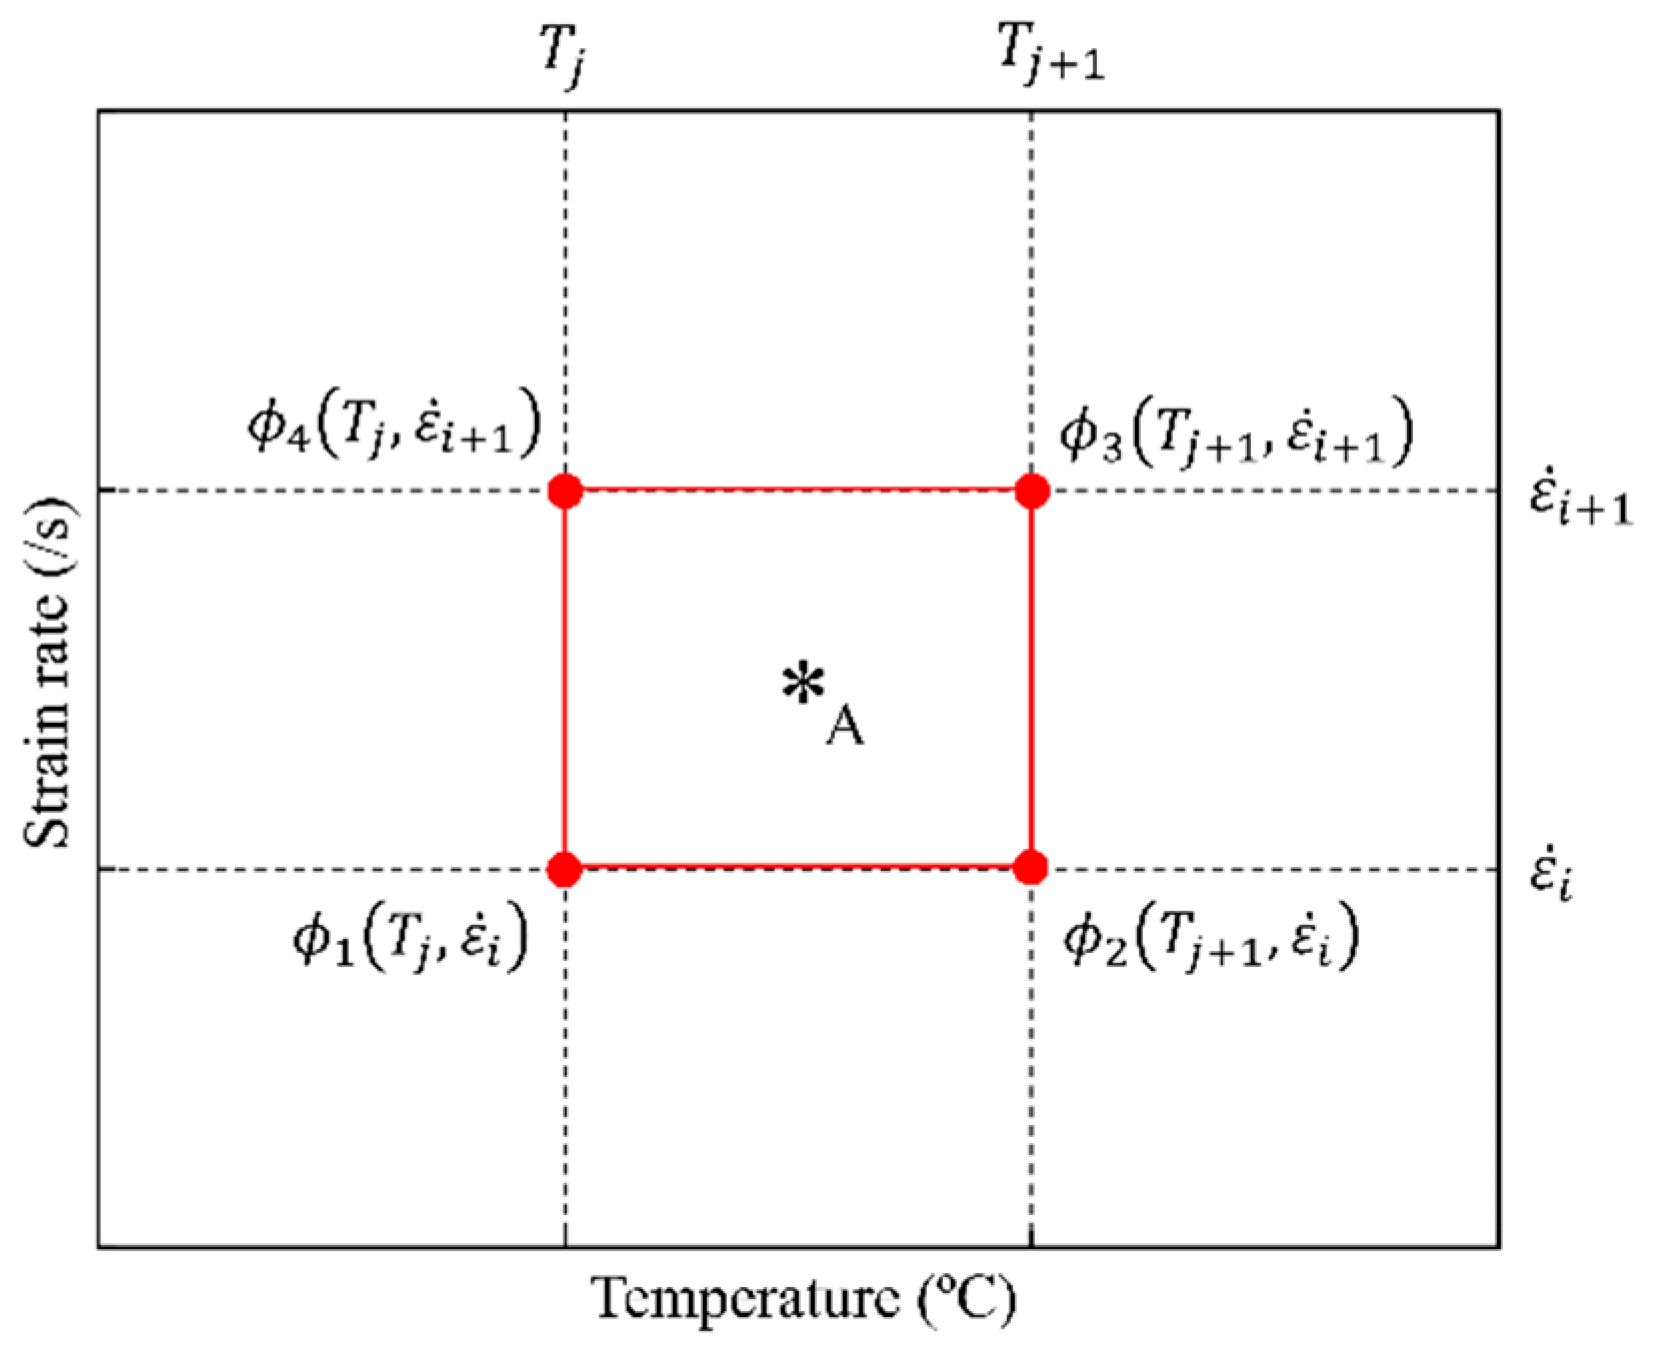
This formulation allows the model to distinguish between pre- and post-DRX deformation states, ensuring an accurate transition once DRX initiates. To describe material sensitivity under different forming conditions, temperature- and strain-rate-dependent microstructural constants a, h, n, m and Q are introduced. These constants are interpolated using a bilinear scheme, enabling a smooth and continuous response across sampled strain rates and temperatures. The interpolation method, detailed in Equation (5) and illustrated in Figure 6, defines a DRX information matrix that enhances the model’s flexibility in predicting d D R X evolution under various thermomechanical paths [1]. These parameters are optimized iteratively by comparing the predicted d D R X at the final step with experimental measurements. The optimization adjusts the constants dynamically as functions of local temperature and strain rate, minimizing the difference until the best fit is achieved.
ϕ = T j + 1 T ε ˙ i + 1 ε ˙ T j + 1 T j ε ˙ i + 1 ε ˙ i ϕ 1 + T j T ε ˙ i + 1 ε ˙ T j T j + 1 ε ˙ i + 1 ε ˙ i ϕ 2 + T j + 1 T ε ˙ i ε ˙ T j + 1 T j ε ˙ i ε ˙ i + 1 ϕ 4 + T j T ε ˙ i ε ˙ T j T j + 1 ε ˙ i ε ˙ i + 1 ϕ 3
In this context, the functions ϕ including pre-exponential factor (a), initial grain size exponent (h), strain exponent (n), strain rate exponent (m), and DRX activation energy (Q), which form part of a DRX information matrix constructed from sampled strain rate and temperature conditions.

2.5.3. FEM-Coupled Optimization Technique

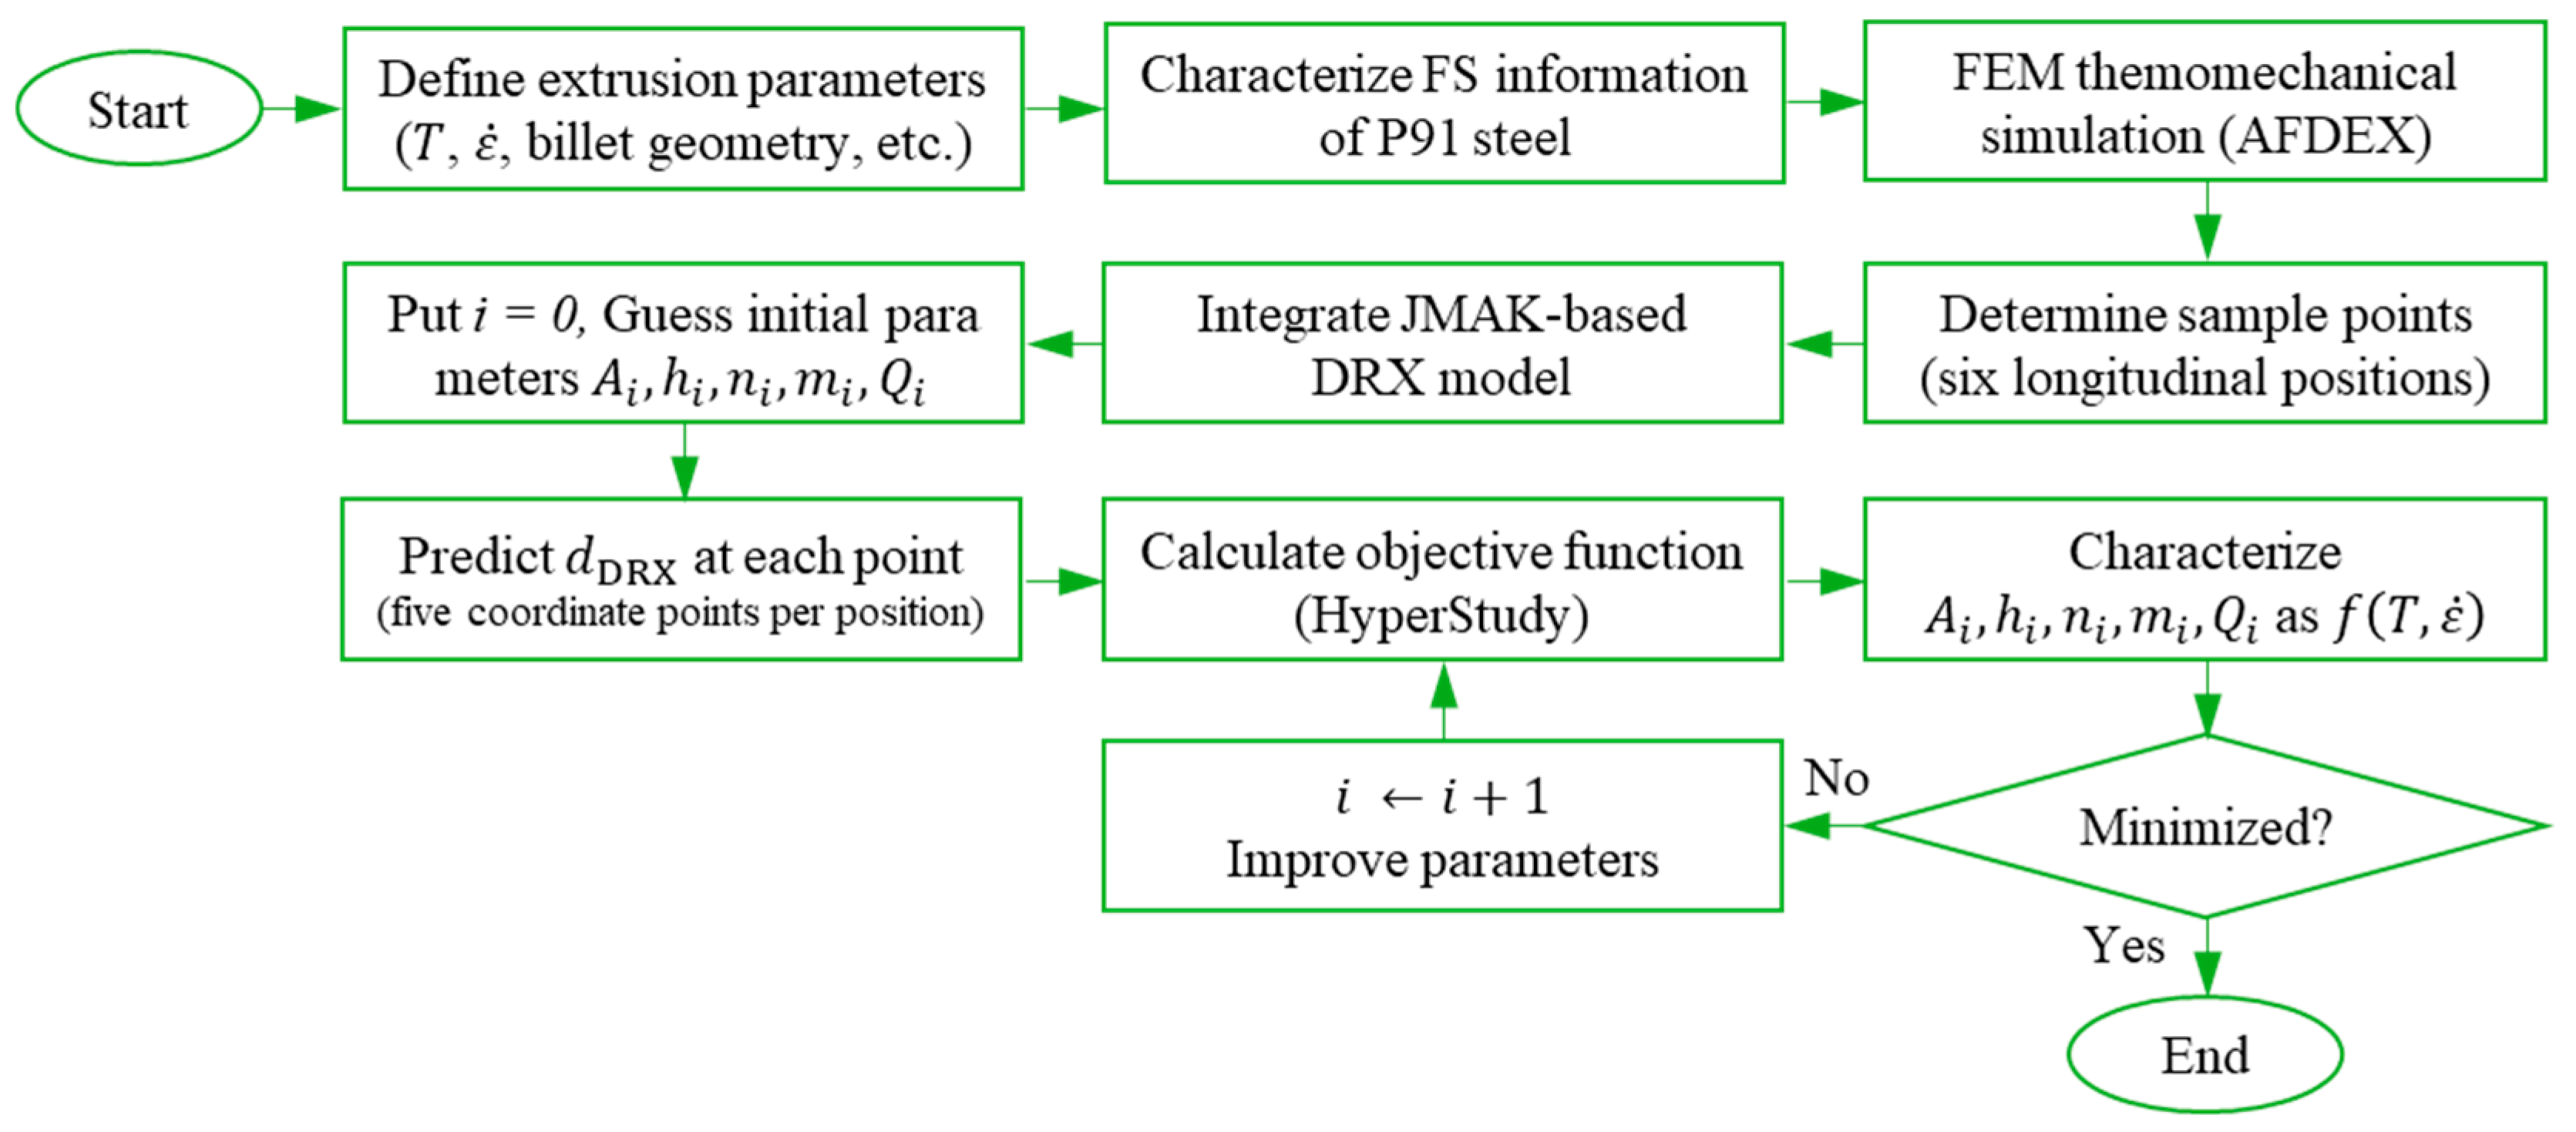
To calibrate the microstructural constants, a parameter identification process was carried out using the HyperStudy optimization platform [42], integrated with finite element simulation results. This approach systematically adjusted the model parameters to reduce the difference between predicted and experimentally measured grain sizes. The iterative steps involved in this calibration workflow are illustrated in the flowchart shown in Figure 7. The optimization was guided by an objective function that quantifies the prediction accuracy, defined as the root-mean-square error across all sample points:
φ o = 1 k i = 1 k d D R X , exp i d D R X , pred i 2
Here, d D R X , exp i and d D R X , pred i denote the experimental and simulated grain sizes at the i-th measurement point, respectively, and k is the total number of calibration data points. This optimization strategy ensures that the fitted model accurately reflects the observed microstructural evolution under different forming conditions.

3. Model Calibration and Validation Framework

3.1. Optimization Outcomes for Microstructural Parameters

As previously described, the material parameter optimization was conducted using a FEM-integrated approach that enabled efficient calibration of the microstructural model [42]. This section presents the results obtained through that optimization framework, highlighting the values identified for d D R X prediction.
The initial stage involved treating the d D R X parameters as fixed universal constants to establish a reference baseline. The outcomes of this preliminary optimization are summarized in Table 4, offering a foundational understanding of the material behavior under idealized conditions.
To enhance model accuracy, the optimization was further refined by incorporating the effects of strain rate and temperature, allowing the parameters to vary accordingly [1]. This advanced calibration yielded a more responsive set of microstructural constants, which are detailed in Table 5. These refined values significantly improved the model’s predictive capability across the range of thermomechanical conditions experienced during hot extrusion.

3.2. Influence of Friction Models and Punch Control Strategies on Hot Extrusion Microstructure Prediction

This section presents a detailed analysis of hot extrusion simulation outcomes based on two distinct friction models, Coulomb and shear, combined with two punch control strategies: constant velocity and hydraulic press control. The evaluation focuses on the evolution of effective strain, stress, temperature, and ultimately d D R X , which are critical for predicting final material properties and validating the microstructural model for P91 steel.
Predictions of d D R X were initially performed using the universal microstructural constants summarized in Table 4. These constants were treated as fixed values, independent of local variations in strain rate and temperature, and served as a baseline for assessing microstructure evolution under hot extrusion conditions. While this approach provided a useful reference, the resulting predictions showed noticeable deviations from experimental measurements, especially when paired with the shear friction model. This highlighted the limitations of applying invariant constants in a process characterized by complex and spatially varying thermomechanical conditions.
To improve predictive fidelity, an enhanced model was employed using functional microstructural constants (Table 5), where the DRX parameters vary as functions of strain rate and temperature. This approach, particularly when combined with the Coulomb friction model and hydraulic press control, produced grain size contours that more closely matched experimental trends. The refinement in accuracy reflects the improved coupling between flow behavior and microstructure response, reinforcing the importance of using physically representative boundary conditions and parameter models in high-temperature-forming simulations.

3.2.1. Strain, Stress and Temperature Distribution

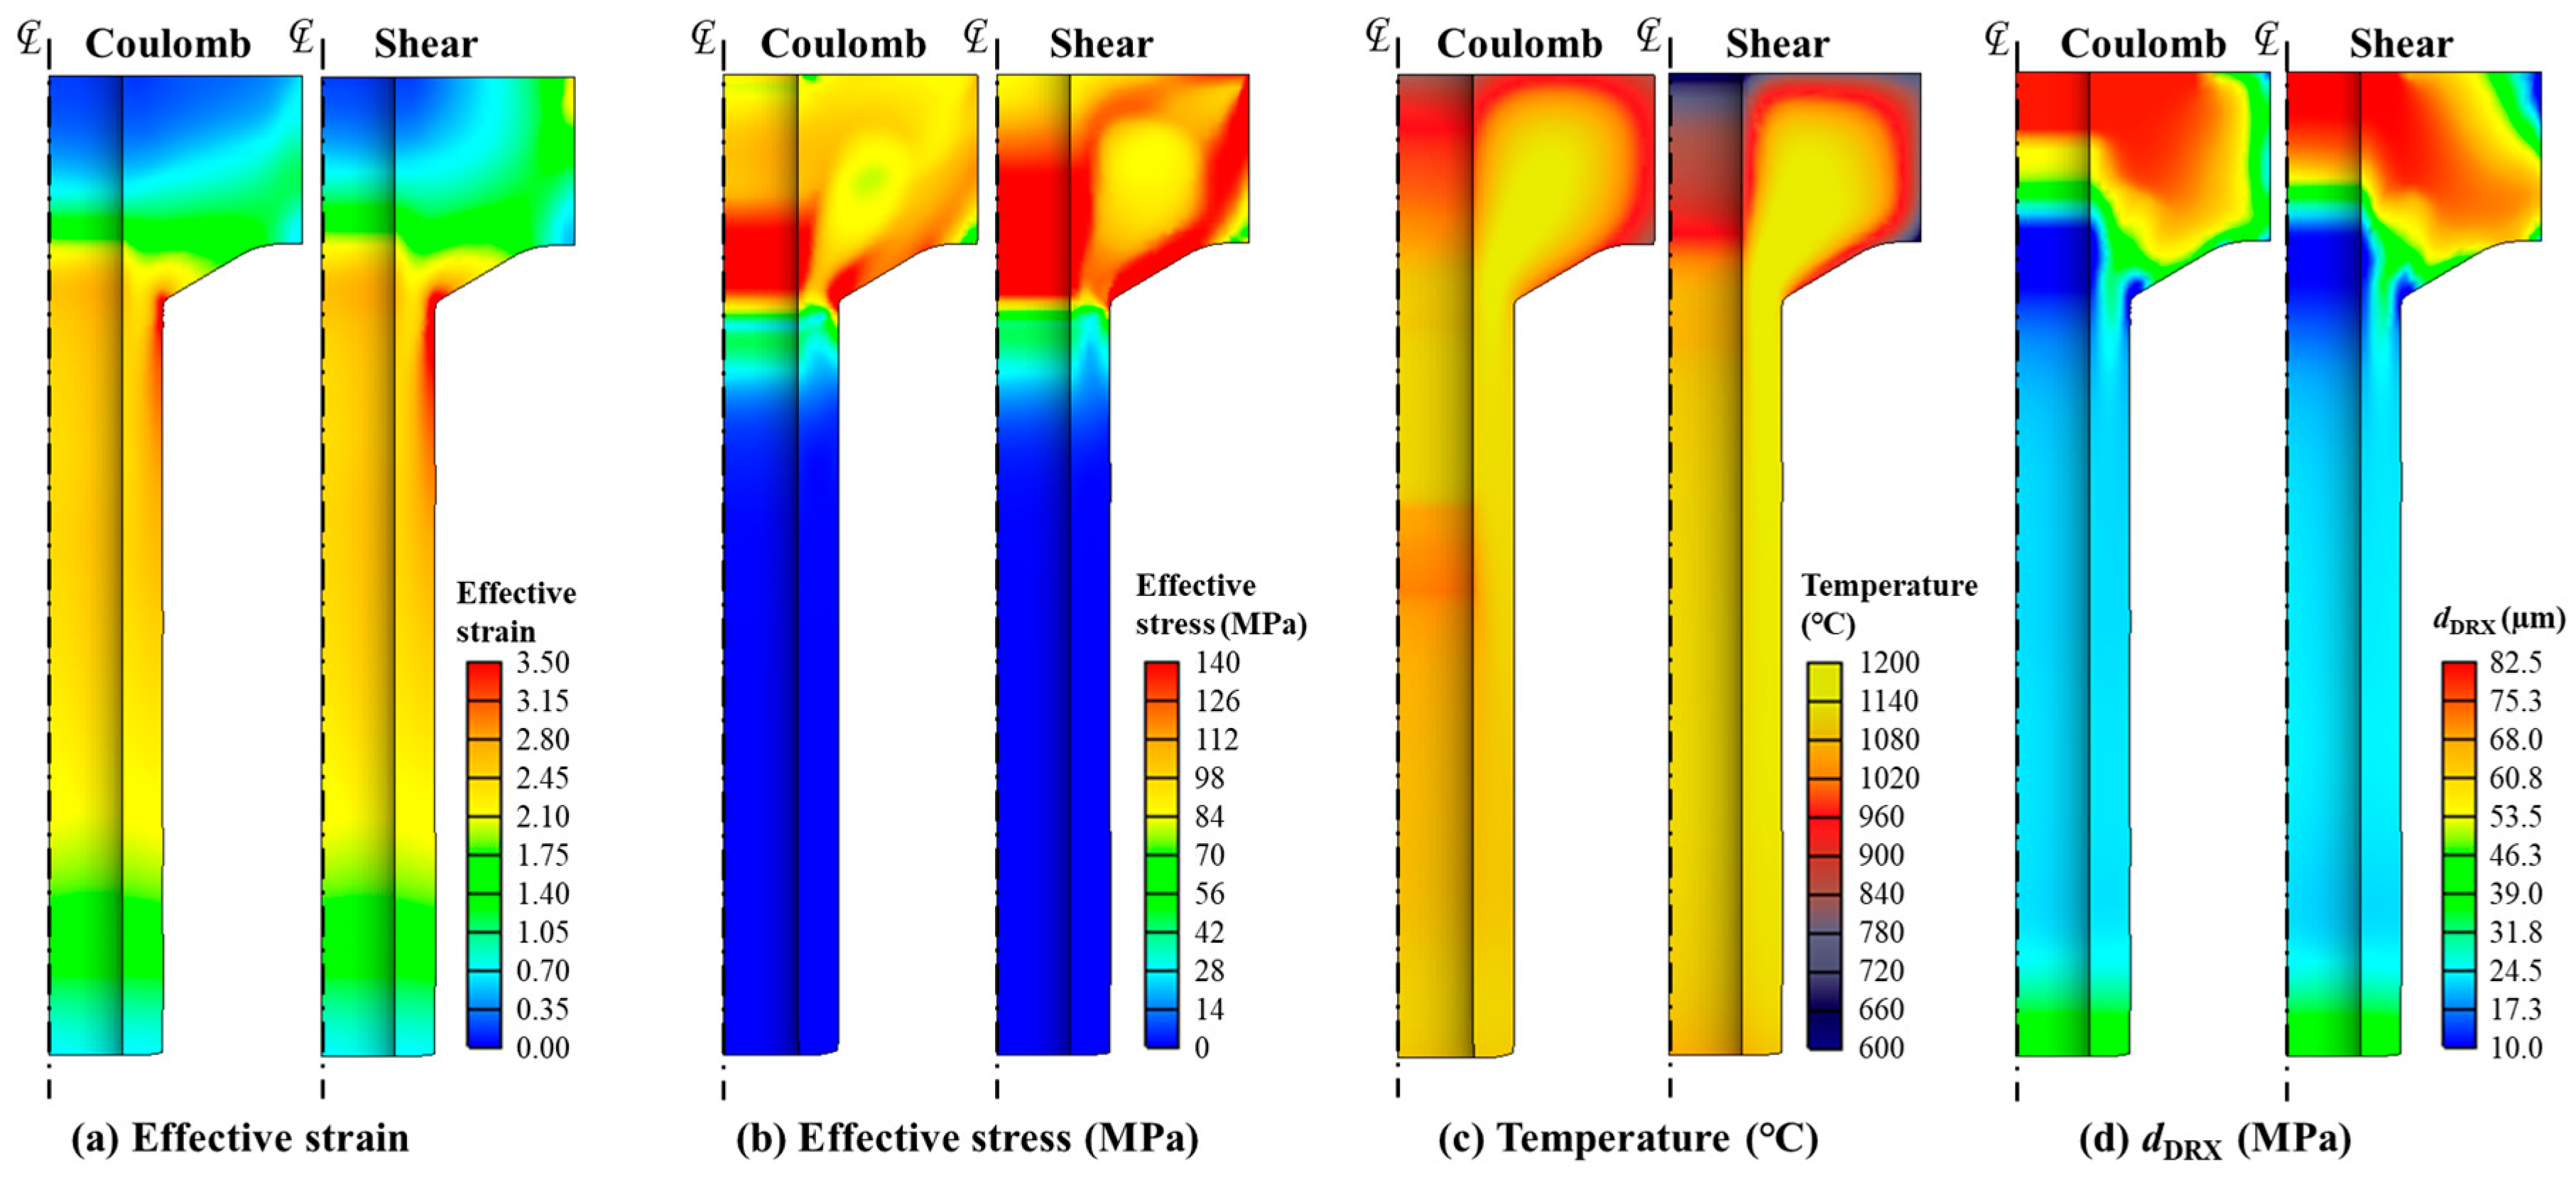
Figure 8a–d present the effective strain, stress, and temperature distributions, respectively, and d D R X for the Coulomb and shear friction models. Together, they reveal distinct differences in thermomechanical behavior that have significant implications for microstructure prediction during hot extrusion of P91 steel.
The effective strain and stress contours in Figure 8a,b show that the Coulomb friction model produces noticeably lower strain and stress magnitudes compared to the shear model, especially in stress-sensitive regions such as the die shoulder, billet–container interface, and bearing zones. This outcome reflects the pressure-dependent nature of the Coulomb model, where frictional resistance scales with local normal pressure [23,43]. As a result, material flow is more stable and realistic, with reduced local overstressing and smoother gradients in both strain and stress fields [23]. In contrast, the shear model assumes constant interfacial shear stress irrespective of pressure distribution [43], leading to exaggerated deformation resistance and elevated strain and stress values across the deformation zone [17,44]. This artificial amplification is especially pronounced near die entry and bearing areas, where abrupt changes in geometry increase contact stress. The resulting overprediction of local strain can distort material flow behavior and compromise the accuracy of downstream predictions, particularly in thermally sensitive processes like DRX.
These differences extend to the temperature distribution, shown in Figure 8c. While the overall temperature profiles appear broadly similar at a glance, localized discrepancies become evident under closer inspection, especially near high-contact regions such as the die shoulder, container wall, and bearing. The shear friction model results in higher local temperatures due to excessive plastic work from overestimated strain rates. These thermal spikes are particularly prominent near the die entry and material acceleration zones. Such overprediction of deformation-induced heating not only misrepresents the true thermal field but also affects the material’s local flow stress, strain path, and softening behavior during forming [21]. In contrast, the Coulomb model yields more moderate and spatially consistent temperature distributions that better reflect actual industrial extrusion conditions. Because it modulates friction according to contact pressure, the Coulomb model prevents unrealistic resistance and energy dissipation in low-pressure zones, thereby limiting artificial heating [23]. This more accurate thermal profile is particularly important in simulating high-temperature alloys such as P91 steel, where both flow behavior and microstructure evolution are extremely sensitive to temperature gradients [1,2].
Noted that localized heat generation due to plastic dissipation plays a critical role in the thermo-mechanical response during hollow extrusion, particularly near the die opening where strain rates are elevated. In the present model, internal heat generation is accounted for based on the mechanical work converted into heat, directly influencing the thermal field. As shown in the temperature contours (Figure 8c), regions near the die exit (corner) especially along the outer surfaces of the extruded ring, exhibit significant thermal accumulation due to intense plastic deformation. This temperature rise results in localized softening and enhances the initiation and progression of DRX, ultimately contributing to the formation of finer grain structures in high-strain regions [45].
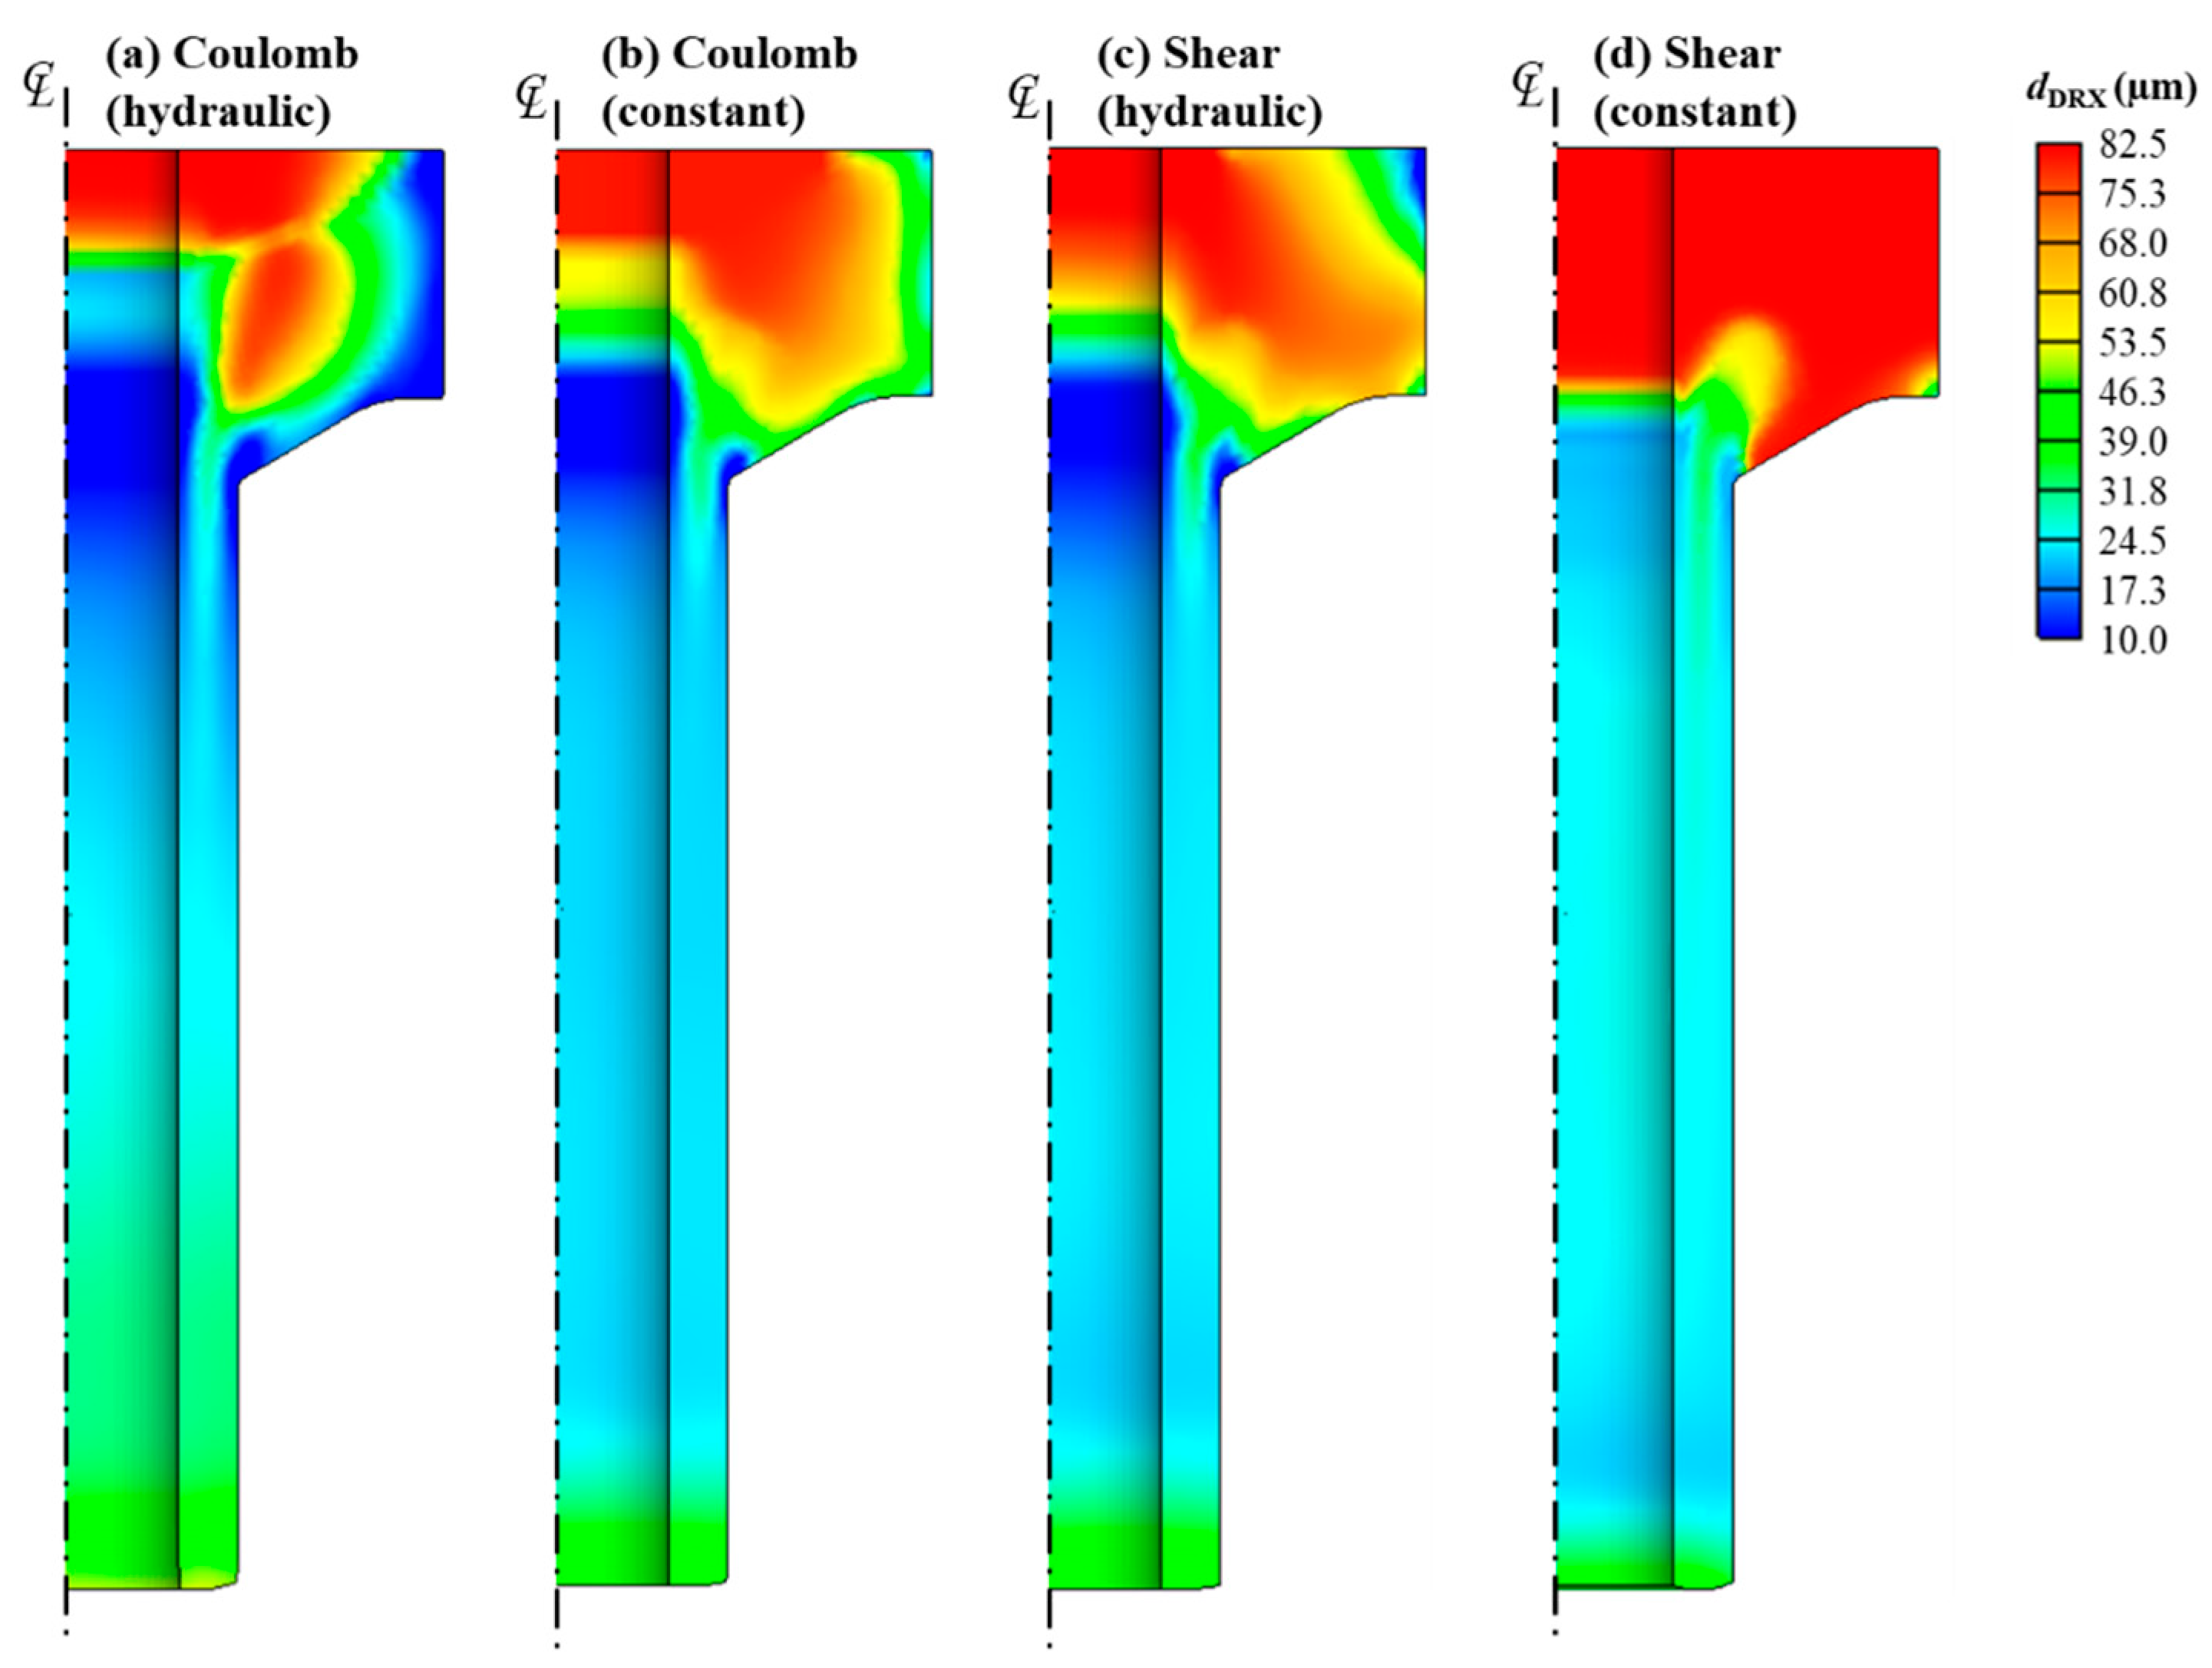
Furthermore, these inaccuracies are particularly problematic in stress-sensitive regions like the die shoulder and bearing zones, where tool–workpiece interaction is most complex [23,43]. In such areas, inaccurate modeling of interfacial friction directly influences the local thermomechanical conditions, which in turn affect microstructure evolution. The shear friction model, by overestimating local stress and strain, leads to higher predicted temperatures and exaggerated strain rates. This not only distorts the flow field but also propagates error into d D R X models, where even small deviations in strain rate or temperature can cause significant variation in predicted grain sizes [42]. As shown in Figure 8d, these discrepancies manifest clearly in the d D R X contours, whereby the Coulomb model yields finer and more uniform grain structures, particularly near the die shoulder and die exit, while the shear model predicts coarser and less consistent grain sizes. This outcome highlights how compounded thermomechanical inaccuracies under the shear model can propagate into unrealistic microstructural predictions, reinforcing the need for physically representative friction modeling in high-temperature deformation simulations.
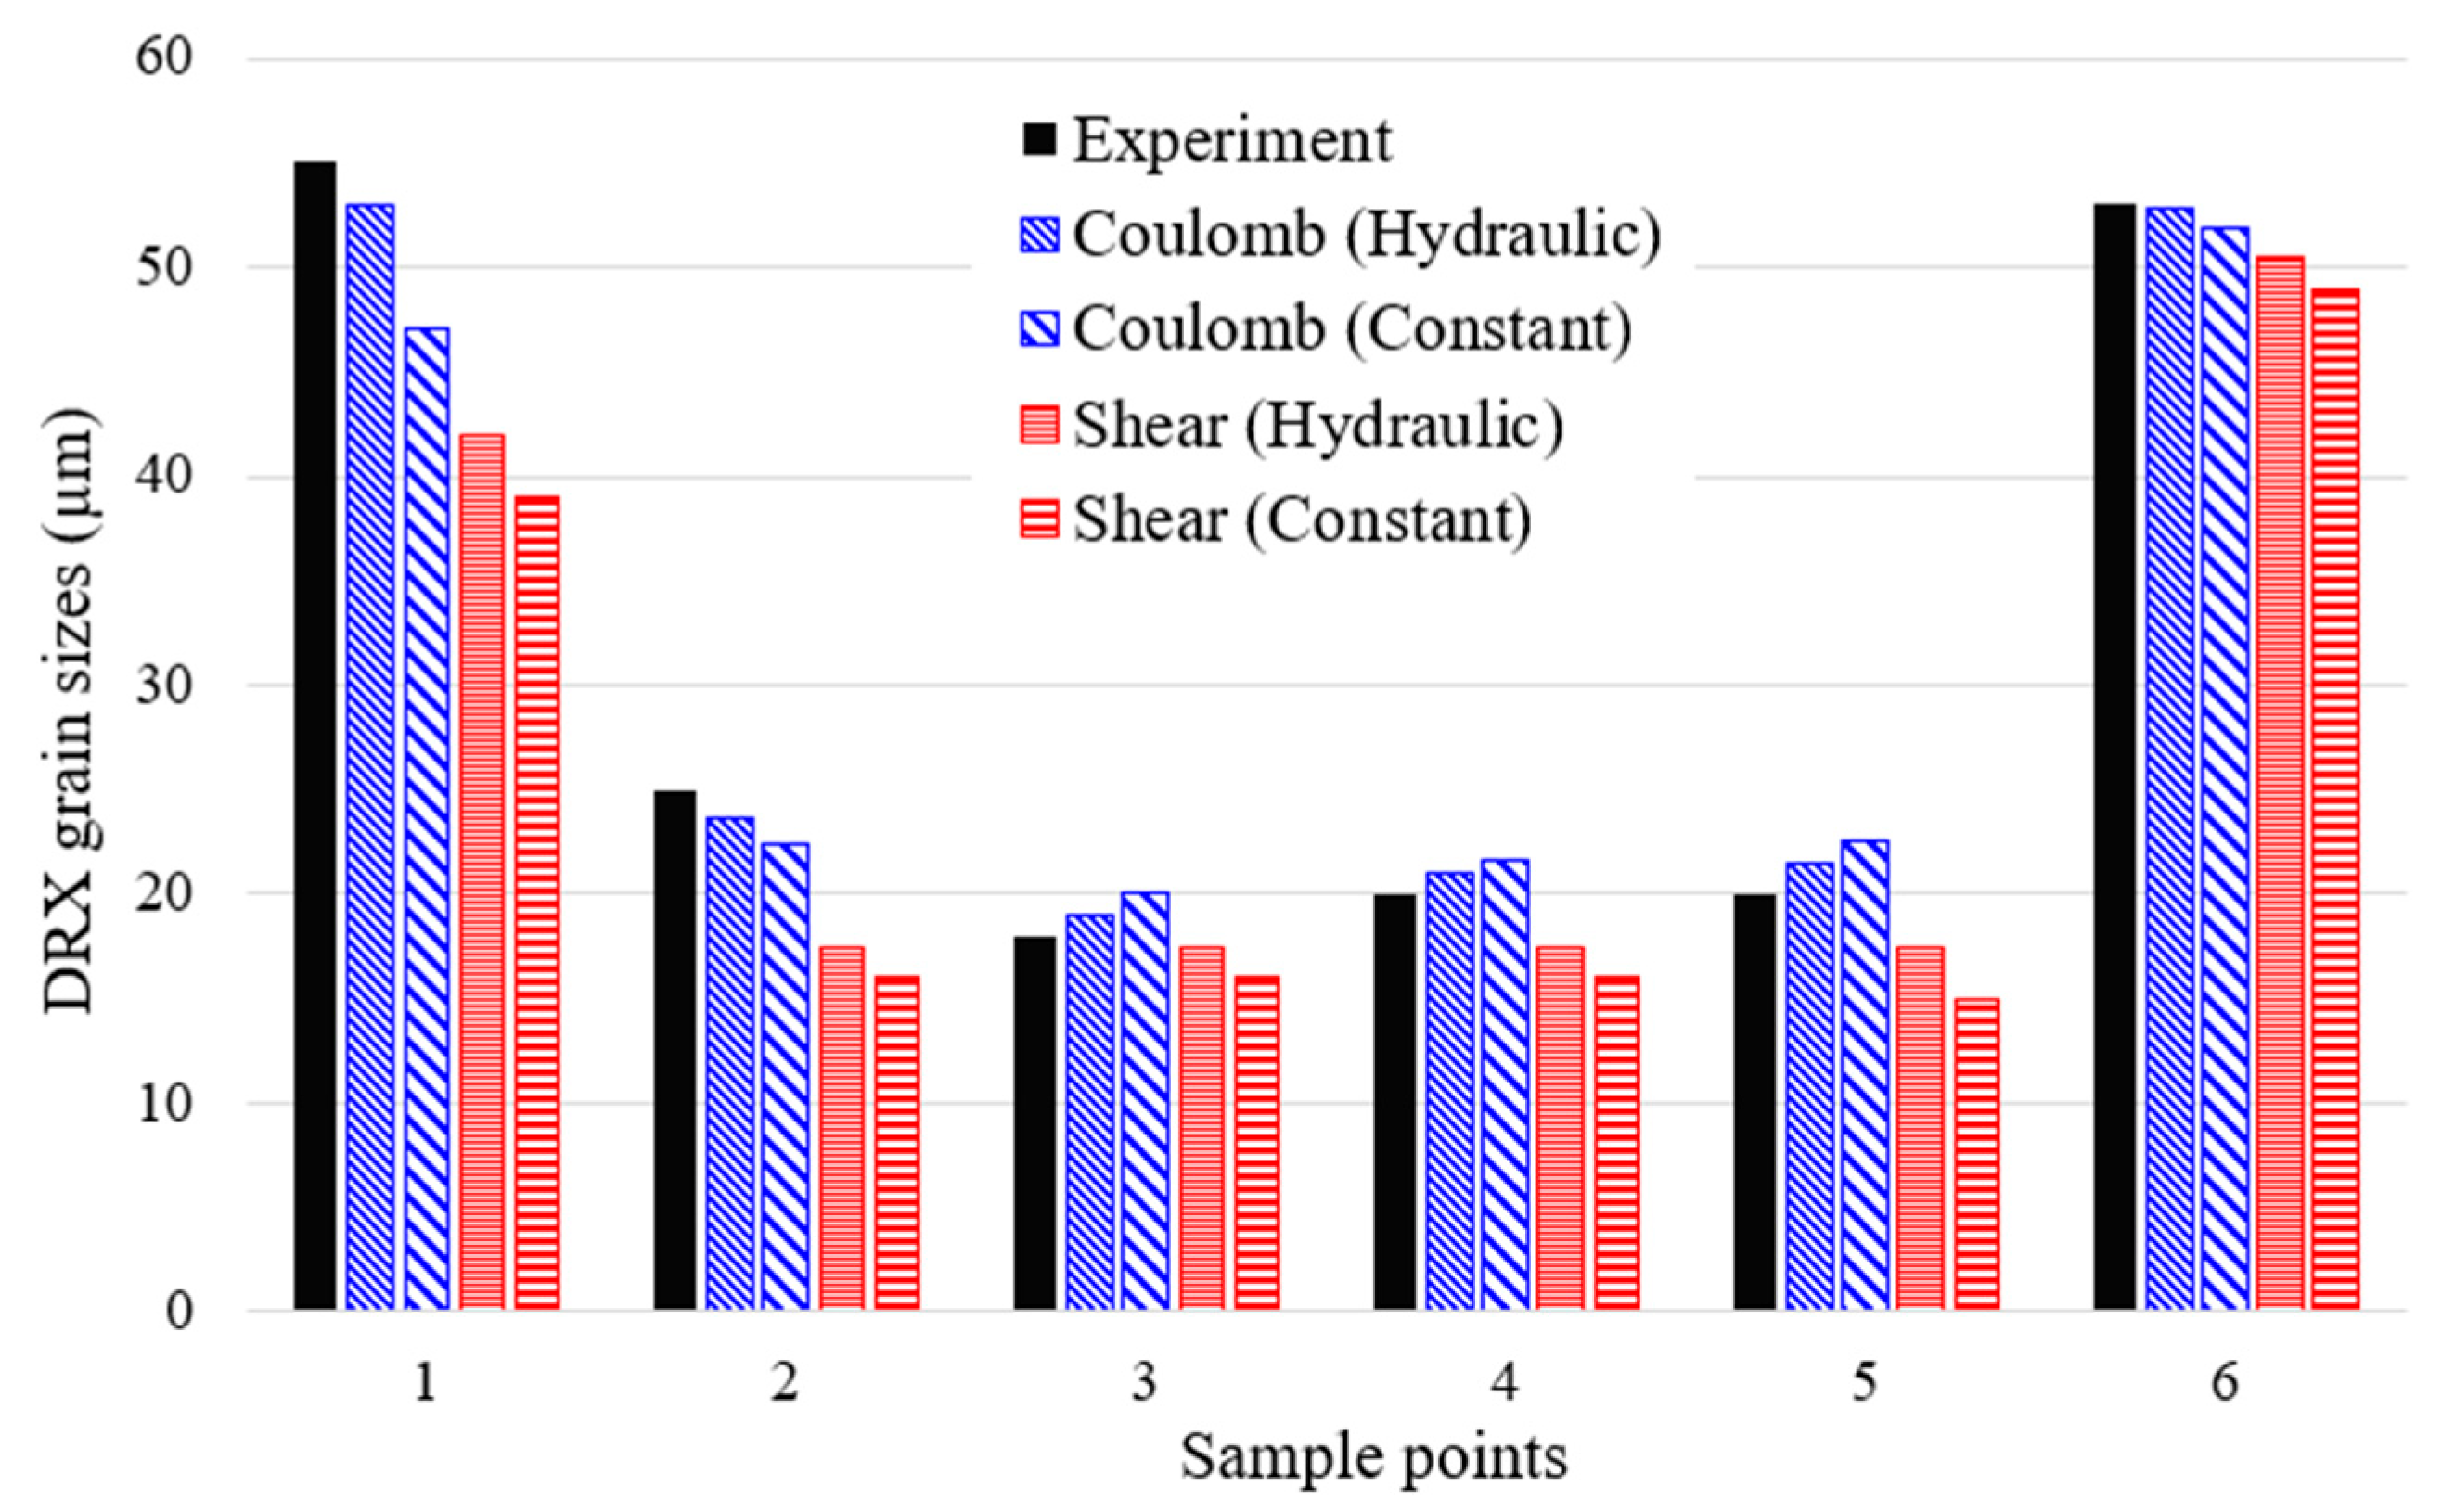
This effect is quantitatively illustrated in Figure 9, which compares the predicted d D R X at six sampling points using Coulomb and shear friction models against experimental data. The Coulomb model consistently yields grain size predictions closer to experimental values, with rough average absolute relative errors (AARE) of about 5–10% across all sample points. In contrast, the shear model shows significantly larger deviations, up to 20–30% error at mid-span points (e.g., Points 2 to 5), where the overestimation of deformation and thermal input is most severe. For instance, at Sample Point 4, the shear model underpredicts grain size by approximately 23%, while the Coulomb model’s prediction is within 7% of the measured value. These deviations underscore the sensitivity of d D R X modeling to accurate thermomechanical input and validate the importance of using a realistic friction representation in high-contact regions.
Overall, the Coulomb friction model demonstrates superior performance in capturing the mechanical response of the material under realistic boundary conditions [23]. Its ability to simulate pressure-sensitive frictional behavior leads to more uniform and stable deformation patterns, minimizing localized overstressing and the risk of tooling damage [37,40]. Moreover, by generating more accurate strain and temperature fields, the Coulomb model improves the fidelity of microstructure predictions, particularly for strain-rate- and temperature-sensitive mechanisms like DRX in P91 steel [1,23]. As shown in Figure 9, this enhanced predictive capability results in d D R X estimates that align more closely with experimental observations, making the Coulomb model better suited for process optimization and material design in hot extrusion applications.

3.2.2. Effect of Punch Control Mode

Two punch control strategies were examined to assess their impact on load response, deformation conditions, and downstream DRX behavior:
(a)
Constant velocity mode at −10 mm/s, which applies a fixed punch speed regardless of material resistance.
(b)
Hydraulic press mode, which adaptively reduces punch velocity to maintain a maximum allowable load of 5000 kN.
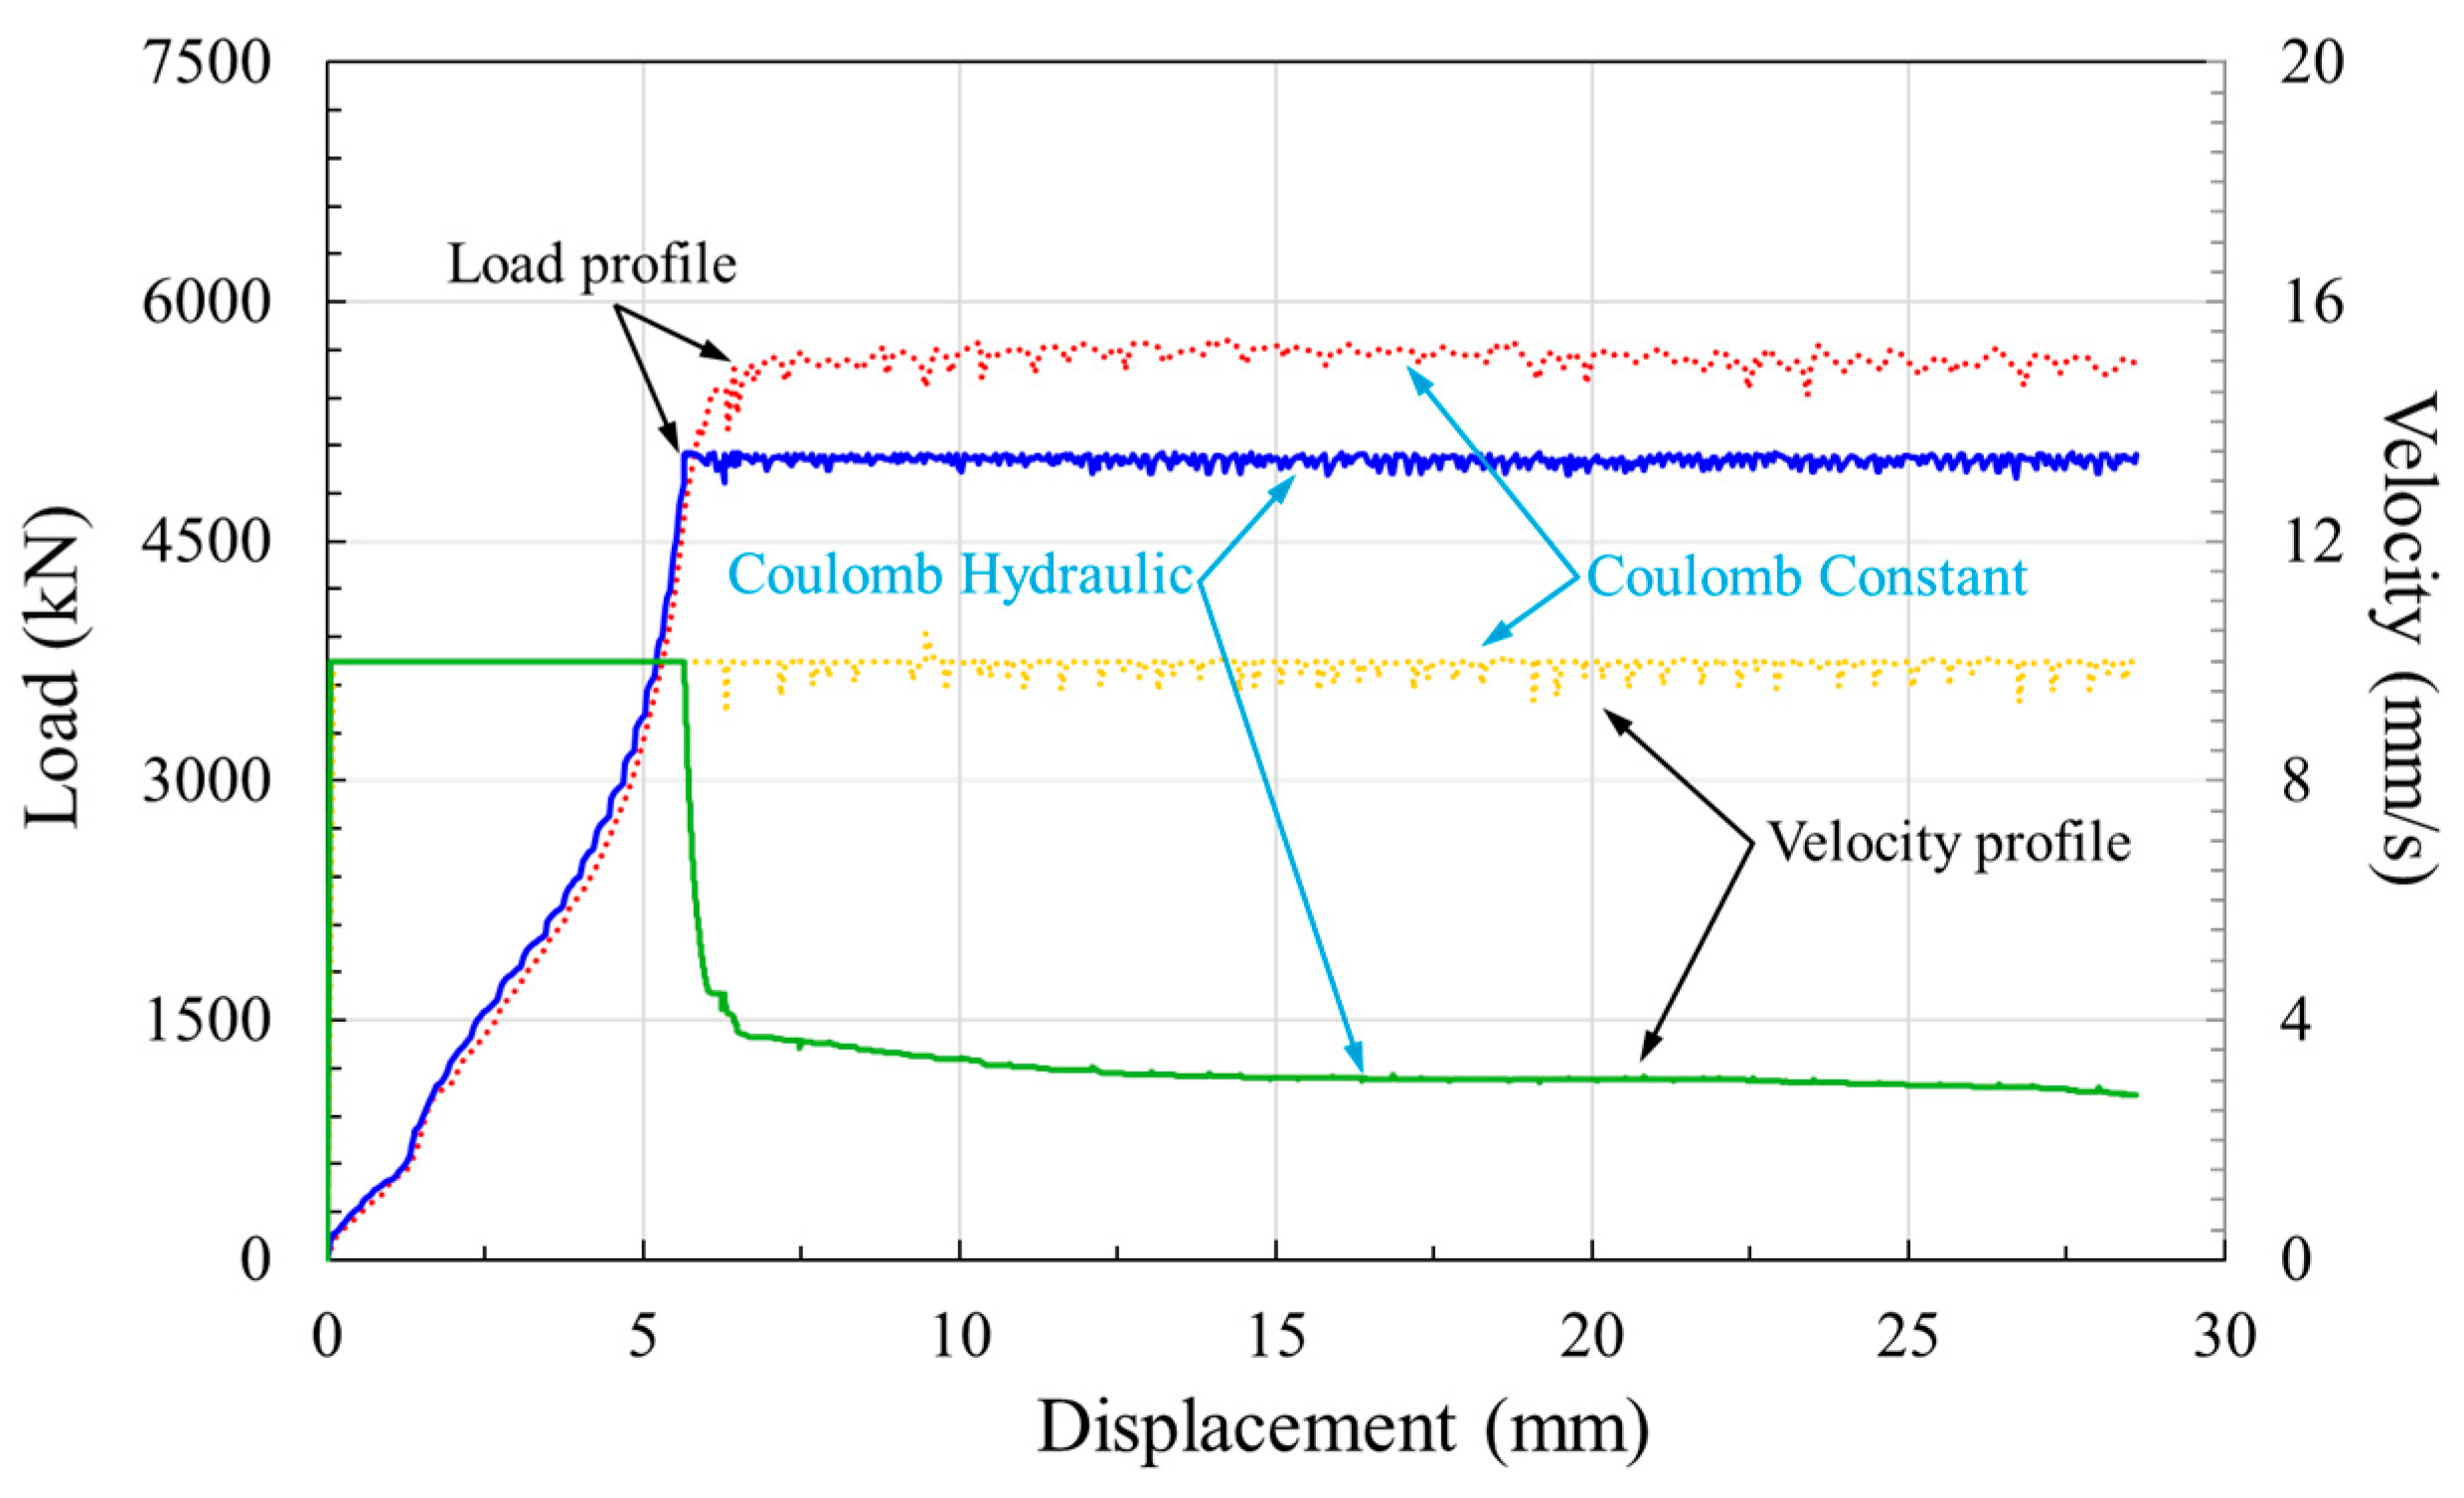
As shown in Figure 10, the constant velocity mode (dotted lines) causes a rapid increase in punch load, surpassing 5000 kN around 4–6 mm of displacement. Since the punch moves at a fixed speed (evident from the flat velocity profiles), the press lacks any adaptive response, which may lead to tool overload or even failure. The load plateaus at a high level, indicating excessive resistance due to the constant input, which is not ideal for industrial forming.
In contrast, the hydraulic mode (solid lines) responds by actively reducing the punch speed as the load nears the 5000 kN threshold. This drop in velocity helps regulate the forming pressure, resulting in a more stable and realistic load curve. The Coulomb hydraulic case shows the lowest steady-state load, demonstrating the benefit of combining adaptive control with pressure-sensitive friction. However, the constant velocity mode leads to higher strain rates and localized heating, especially near the die shoulder and bearing regions, which can enhance DRX nucleation but potentially reduce microstructural uniformity [17,23].
Conversely, the hydraulic press mode leads to more gradual deformation, reducing peak strain rates and moderating temperature rise [16]. This creates a more controlled thermal environment, which is beneficial for managing DRX kinetics and achieving finer, more uniform grain structures. The improved regulation of energy input during extrusion minimizes the likelihood of grain coarsening and enhances predictability in final microstructural outcomes.
Overall, the integration of hydraulic control with a realistic friction model (i.e., Coulomb) provides the most balanced load–displacement response, reflecting both mechanical safety and microstructural precision. This underscores the necessity of simulating machine behavior in conjunction with material response to develop predictive and robust hot extrusion process models [19].

3.2.3. Summary of Insights

To evaluate the reliability of the d D R X predictions under different simulation configurations, a three-tiered validation approach is presented through Figure 11, Figure 12, Figure 13 and Figure 14. These figures collectively offer both quantitative and spatial validation of the microstructural model, effectively bridging the gap between FE simulation and experimental metallurgical observations.
Figure 11 presents a bar chart comparing d D R X predictions at six key sampling points along the extruded billet under four simulation cases:
  • Shear friction with constant velocity;
  • Coulomb friction with constant velocity;
  • Shear friction with hydraulic press control;
  • Coulomb friction with hydraulic press control.
Each case is benchmarked against experimental measurements. The Coulomb–hydraulic model consistently delivers the lowest deviation from experiment, particularly at mid-span points (3 through 5), where strain and temperature gradients are most dynamic. The Shear–constant model, in contrast, shows the greatest error across the board. This can be attributed to its simplistic treatment of friction and lack of velocity regulation, which together lead to excessive strain localization and artificial DRX acceleration. As a result, predicted grain sizes are significantly underestimated (i.e., excessively refined), especially in high deformation regions. The Coulomb–constant case improves accuracy slightly, owing to its pressure-sensitive friction handling. However, the lack of adaptive punch control still permits unrealistic thermal buildup in some areas, limiting its predictive fidelity. Similarly, the Shear–hydraulic case benefits from controlled punch force but is still hindered by its over-simplified friction formulation, which continues to distort local strain predictions. By contrast, the Coulomb–hydraulic configuration combines realistic friction behavior with dynamically regulated punch velocity [19]. This synergy minimizes artificial strain concentration, reduces localized overheating, and better mirrors the real thermomechanical environment of extrusion [23]. Consequently, its predictions align within 5–10% of the experimental grain sizes at all sample points, demonstrating excellent agreement.
To further illustrate the impact of different friction and punch control combinations on DRX behavior, Figure 12 presents full-field contour plots of predicted d D R X for all four simulation cases. These visualizations offer spatial insight into grain size evolution across the deformation zone, particularly near critical interfaces such as the die shoulder, bearing surface, and container wall. The Coulomb–Hydraulic case (leftmost figure) shows a finely graded and uniform DRX field, with smooth transitions between refined and unrecrystallized regions. The contours clearly follow the flow path, with maximum refinement occurring in high-strain zones such as the die exit and material acceleration areas. Importantly, excessive grain refinement is avoided, suggesting a well-balanced deformation and thermal history. In contrast, the Coulomb–Constant case exhibits similar spatial trends but with less refinement control in localized zones. The lack of adaptive punch velocity causes isolated thermal accumulation, particularly near the bearing area, resulting in less uniform DRX progression. The Shear–Hydraulic case, while benefiting from load control, displays exaggerated refinement across broader zones. This is attributed to the constant shear stress assumption, which inflates strain input despite hydraulic moderation. The model overpredicts the degree of recrystallization, leading to a finer-than-realistic grain size field. The Shear–Constant case performs the worst, with almost the entire deformation region appearing over-refined. The interaction of overestimated friction resistance and fixed high punch velocity results in excessive heat generation and unrealistically complete recrystallization. This mismatch highlights the compounded effect of unphysical assumptions on microstructural fidelity. Overall, this figure confirms that the Coulomb–Hydraulic model successfully captures realistic DRX patterns. It balances accurate friction representation and adaptive load control, leading to consistent grain refinement aligned with experimental trends and further validated in Figure 13.
Figure 13 strengthens this conclusion by offering a spatially resolved comparison between experiment and FEM predictions across the billet’s cross-section. On the left, six etched micrographs show the experimentally observed grain structures at marked sample points. On the right, the FEM-predicted d D R X field is overlaid with five sub-coordinates per point (a total of 30 locations), enabling high-resolution validation. This granular mapping confirms that the Coulomb–hydraulic case not only matches the average grain sizes but also captures the intra-zone variability in grain refinement. The predicted values at the five sub-points per sample location lie within a narrow band, reflecting high consistency and spatial uniformity. This is particularly evident near Point 2 and Point 5, which are close to areas of elevated deformation, but not fully recrystallized regions known for microstructural sensitivity. Furthermore, the spatial distribution of predicted grain size contours reveals localized refinement near the die exit and bearing regions, consistent with physical observations in the micrographs. The model also accurately reproduces grain coarsening toward the billet head (Point 6) and base (Point 1), where strain and temperature inputs are lower, and DRX is limited or incomplete. These observations confirm the fidelity of the d D R X model under optimized simulation conditions, not just in terms of average grain size but in its ability to reflect spatial variation, boundary effects, and real thermomechanical transitions across the billet.
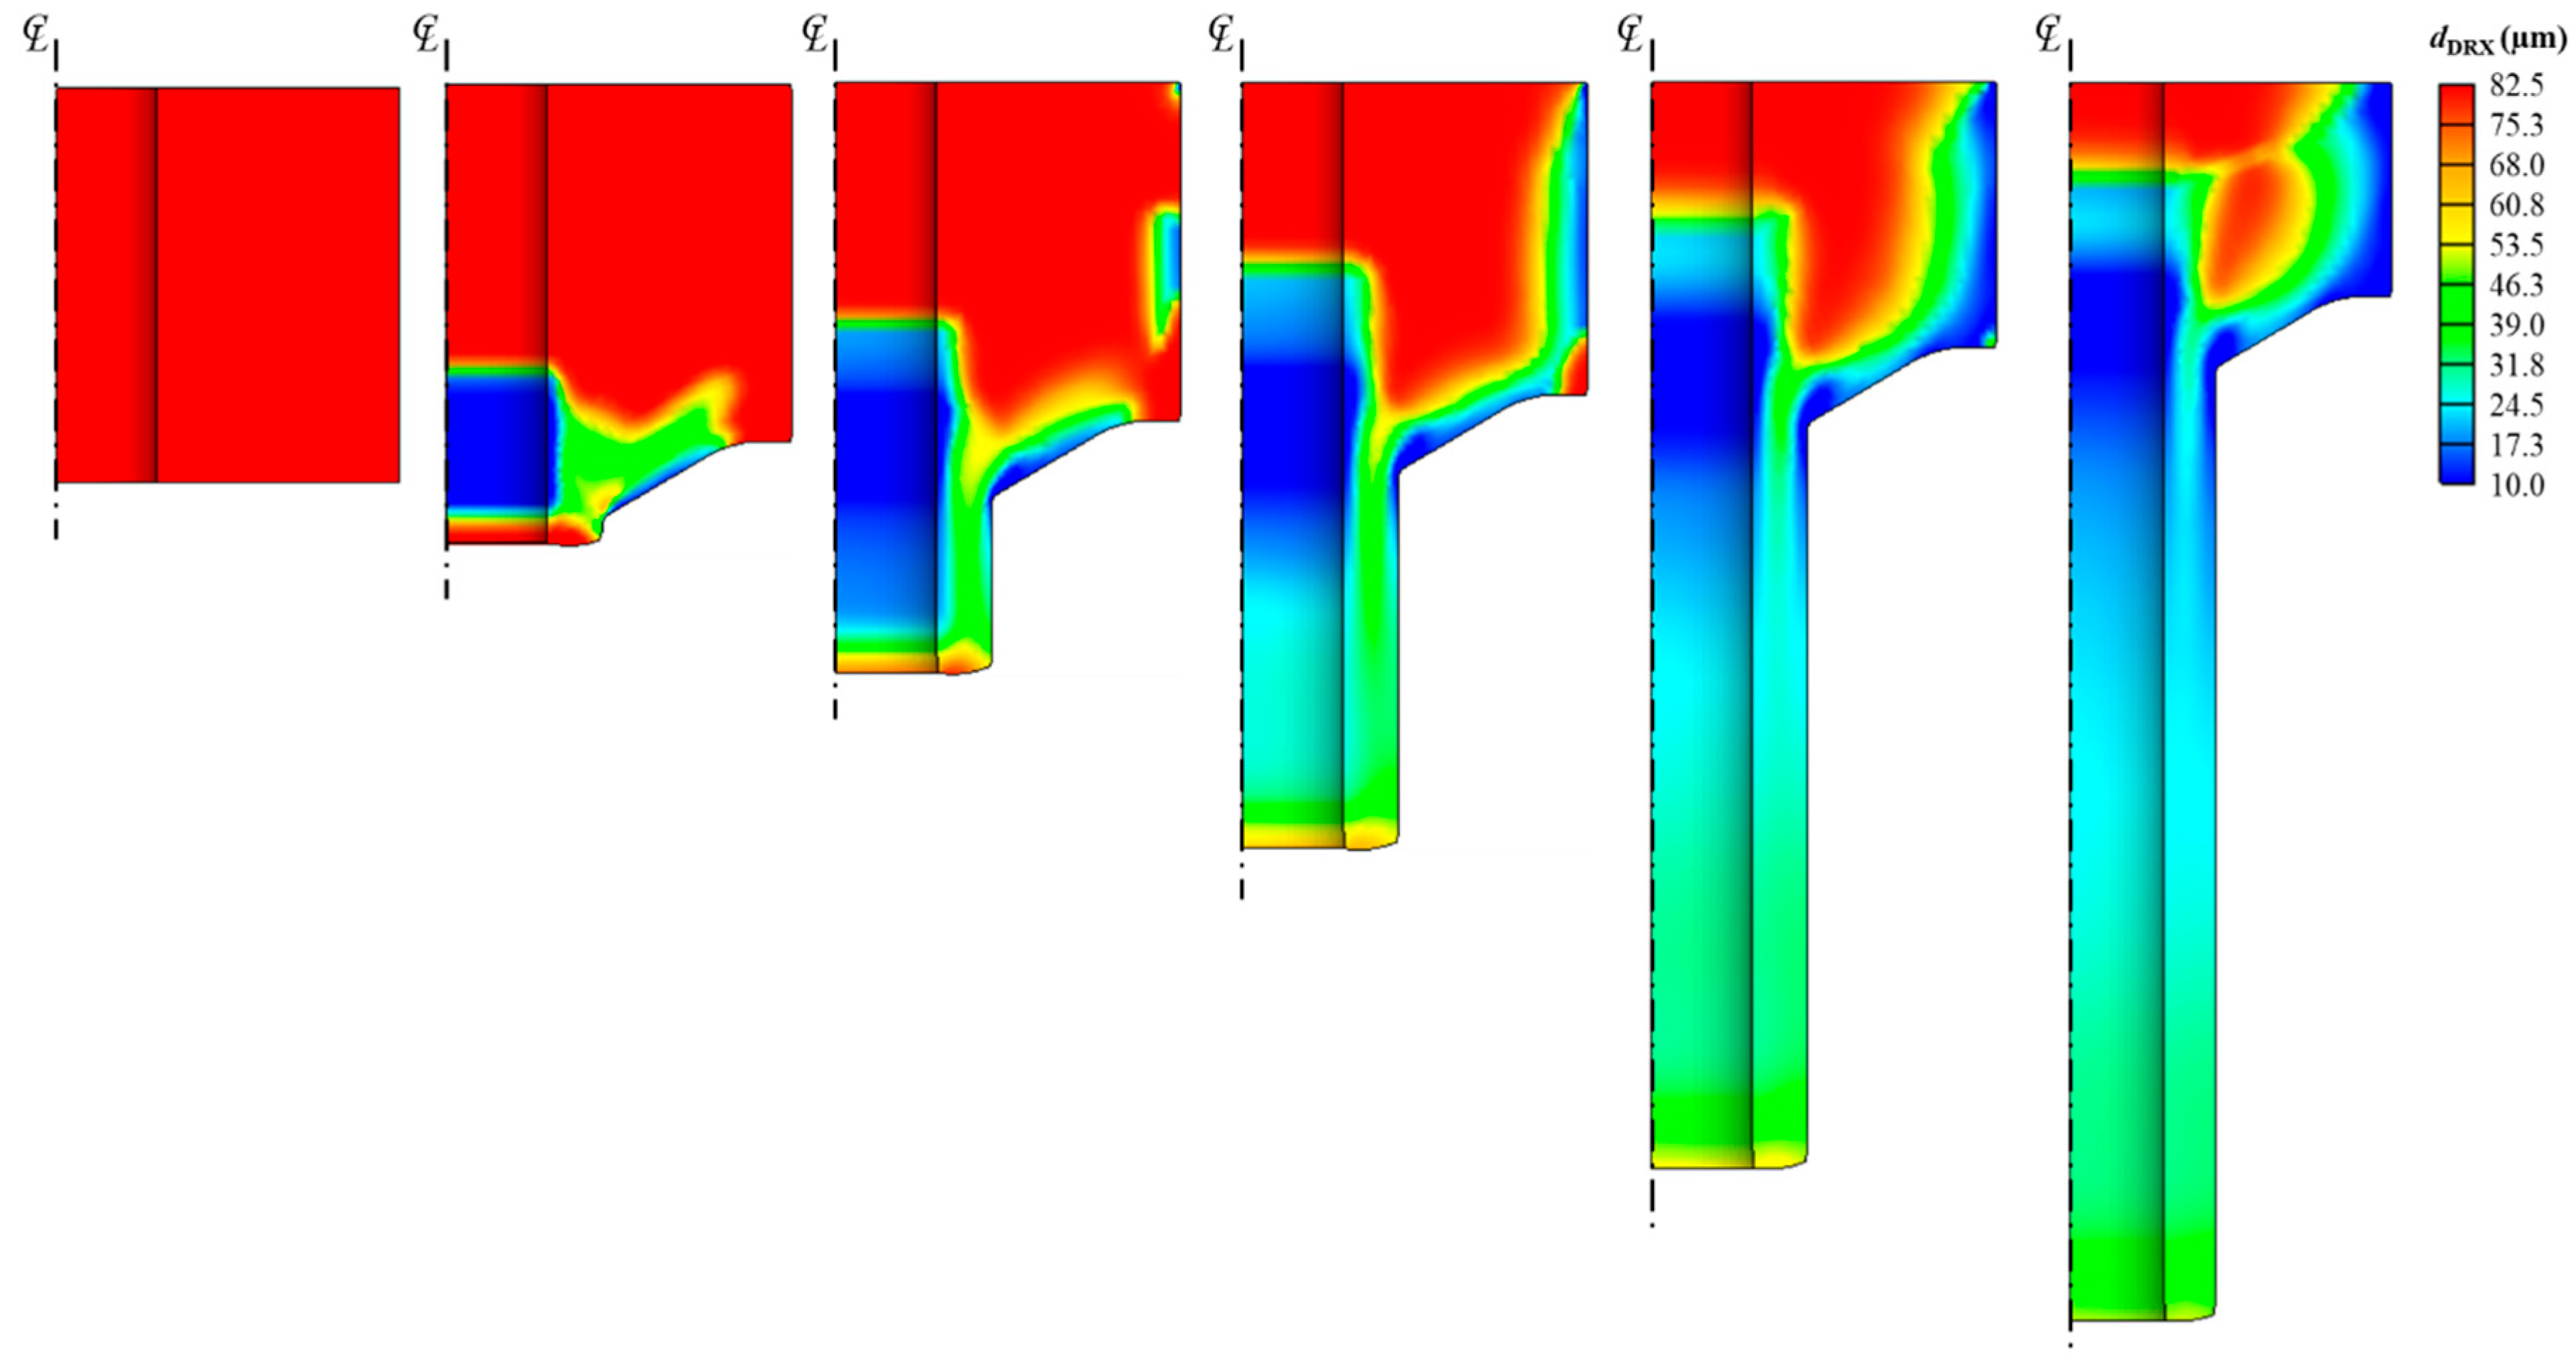
To complement the spatial and pointwise validations shown in Figure 11 through Figure 13, Figure 14 presents the deformation history of the selected best-case scenario, Coulomb friction with hydraulic press control, captured at six sequential time steps leading up to the final configuration depicted in Figure 13. This figure provides temporal insight into the progressive evolution of DRX throughout the hot extrusion process. Early in the simulation, the billet exhibits minimal DRX activity as strain and temperature levels remain below the threshold required for microstructural transformation [1,2]. As deformation proceeds, DRX initiates locally near the die shoulder and bearing surfaces, regions of intense plastic work and heat generation. Over time, the recrystallized zones expand and coalesce, following the natural flow path of the material. The smooth, layer-by-layer progression of grain refinement illustrates the ability of the Coulomb–Hydraulic model to accurately capture both the spatial and temporal characteristics of microstructural evolution. Notably, this gradual development avoids the abrupt over-refinement seen in less physically representative models, owing to the balanced interaction between realistic frictional resistance and adaptive punch control. By visualizing the transition from undeformed to fully refined microstructure, Figure 14 reinforces the earlier findings that this simulation configuration not only yields excellent agreement with experimental grain size data but also reflects the true sequence of physical events during industrial-scale extrusion.
Together, Figure 11, Figure 12, Figure 13 and Figure 14 provide robust, multi-dimensional validation of the proposed FEM–DRX framework. They confirm that incorporating both physically accurate friction modeling and adaptive punch control is essential for capturing the true microstructural response during hot extrusion of P91 steel. The combination of quantitative comparison (Figure 11) and spatially resolved mapping (Figure 13) highlights the model’s ability not only to predict average grain sizes accurately but also to reproduce local variations that are critical for performance-critical applications. This validation framework can be directly extended to other alloys and forming conditions, supporting future process design and optimization efforts in advanced hot forming technologies.
Key insights include:
  • Prediction accuracy: The Coulomb–hydraulic model provides the closest match to experiment, with errors consistently below 10%.
  • Friction model sensitivity: Shear models overpredict deformation, leading to excessively fine grain sizes and poor agreement.
  • Control strategy impact: Hydraulic press control smoothens strain input, moderates thermal gradients, and improves DRX prediction stability.
  • Spatial resolution: The 30-coordinate comparison validates the simulation’s capability to reflect sub-regional variations in grain size, enhancing confidence in microstructural predictions.

4. Conclusions

A fully integrated thermomechanical–microstructural simulation framework was developed and validated to predict DRX behavior during hot extrusion of P91 steel. The study systematically examined the influence of two friction models, Coulomb and shear, and two punch control strategies, constant velocity and hydraulic press mode, on the accuracy of d D R X prediction.
Key findings reveal that the Coulomb friction model, coupled with hydraulic press control, delivers the most accurate representation of deformation conditions, leading to d D R X predictions that closely align with experimental measurements. This combination effectively captures the pressure-dependent nature of tool–workpiece interaction while dynamically regulating strain input and thermal generation, thereby minimizing local overprediction of strain and temperature.
Quantitative analysis showed that the Coulomb–hydraulic configuration yields grain size errors within 10% across all sampling points, outperforming other configurations, particularly the shear-based models which exhibited excessive refinement due to unrealistic deformation inputs. Spatial validation through high-resolution comparison at 30 sub-locations further confirmed the model’s ability to reflect sub-regional grain size gradients, essential for accurate microstructure control.
These results underscore the critical importance of incorporating physically representative friction models and realistic machine behavior into finite element simulations of hot extrusion. The validated framework not only enhances prediction fidelity for DRX-driven microstructure evolution but also provides a robust foundation for process optimization and alloy design in high-temperature metal forming. Future work may extend this methodology to other complex alloys and forming processes, enabling predictive manufacturing and improved component performance across various industrial sectors.

Author Contributions

Conceptualization, M.K.R.; Data curation, M.K.R.; Formal analysis, M.K.R. and Y.H.; Funding acquisition, M.S.J.; Investigation, M.K.R. and Y.H.; Methodology, M.K.R.; Project administration, M.S.J.; Resources, M.K.R. and M.S.J.; Software, M.K.R., Y.H. and M.S.J.; Supervision, M.K.R. and M.S.J.; Validation, M.K.R.; Visualization, M.K.R. and Y.H.; Writing—original draft, M.K.R.; Writing—review and editing, M.K.R. All authors have read and agreed to the published version of the manuscript.

Funding

This work was partly funded by Korea Institute of Energy Technology Evaluation and Planning (KETEP) grant funded by the Korea government (MOTIE) (20214000000520, Human Resource Development Project in Circular Remanufacturing Industry) and Korea Technology and Information Promotion Agency for SMEs (RS-2024-00446241, Smart Manufacturing Innovation R&D) grant funded by the Ministry of SMEs and Startups.

Data Availability Statement

The original contributions presented in this study are included in the article. Further inquiries can be directed to the corresponding author.

Acknowledgments

This work was partly supported by Korea Institute of Energy Technology Evaluation and Planning (KETEP) grant funded by the Korea government (MOTIE) (20214000000520, Human Resource Development Project in Circular Remanufacturing Industry) and Korea Technology and Information Promotion Agency for SMEs (RS-2024-00446241, Smart Manufacturing Innovation R&D) grant funded by the Ministry of SMEs and Startups.

Conflicts of Interest

The authors declare no conflicts of interest.

Appendix A. Quantitative Comparison of Extruded Dimensions
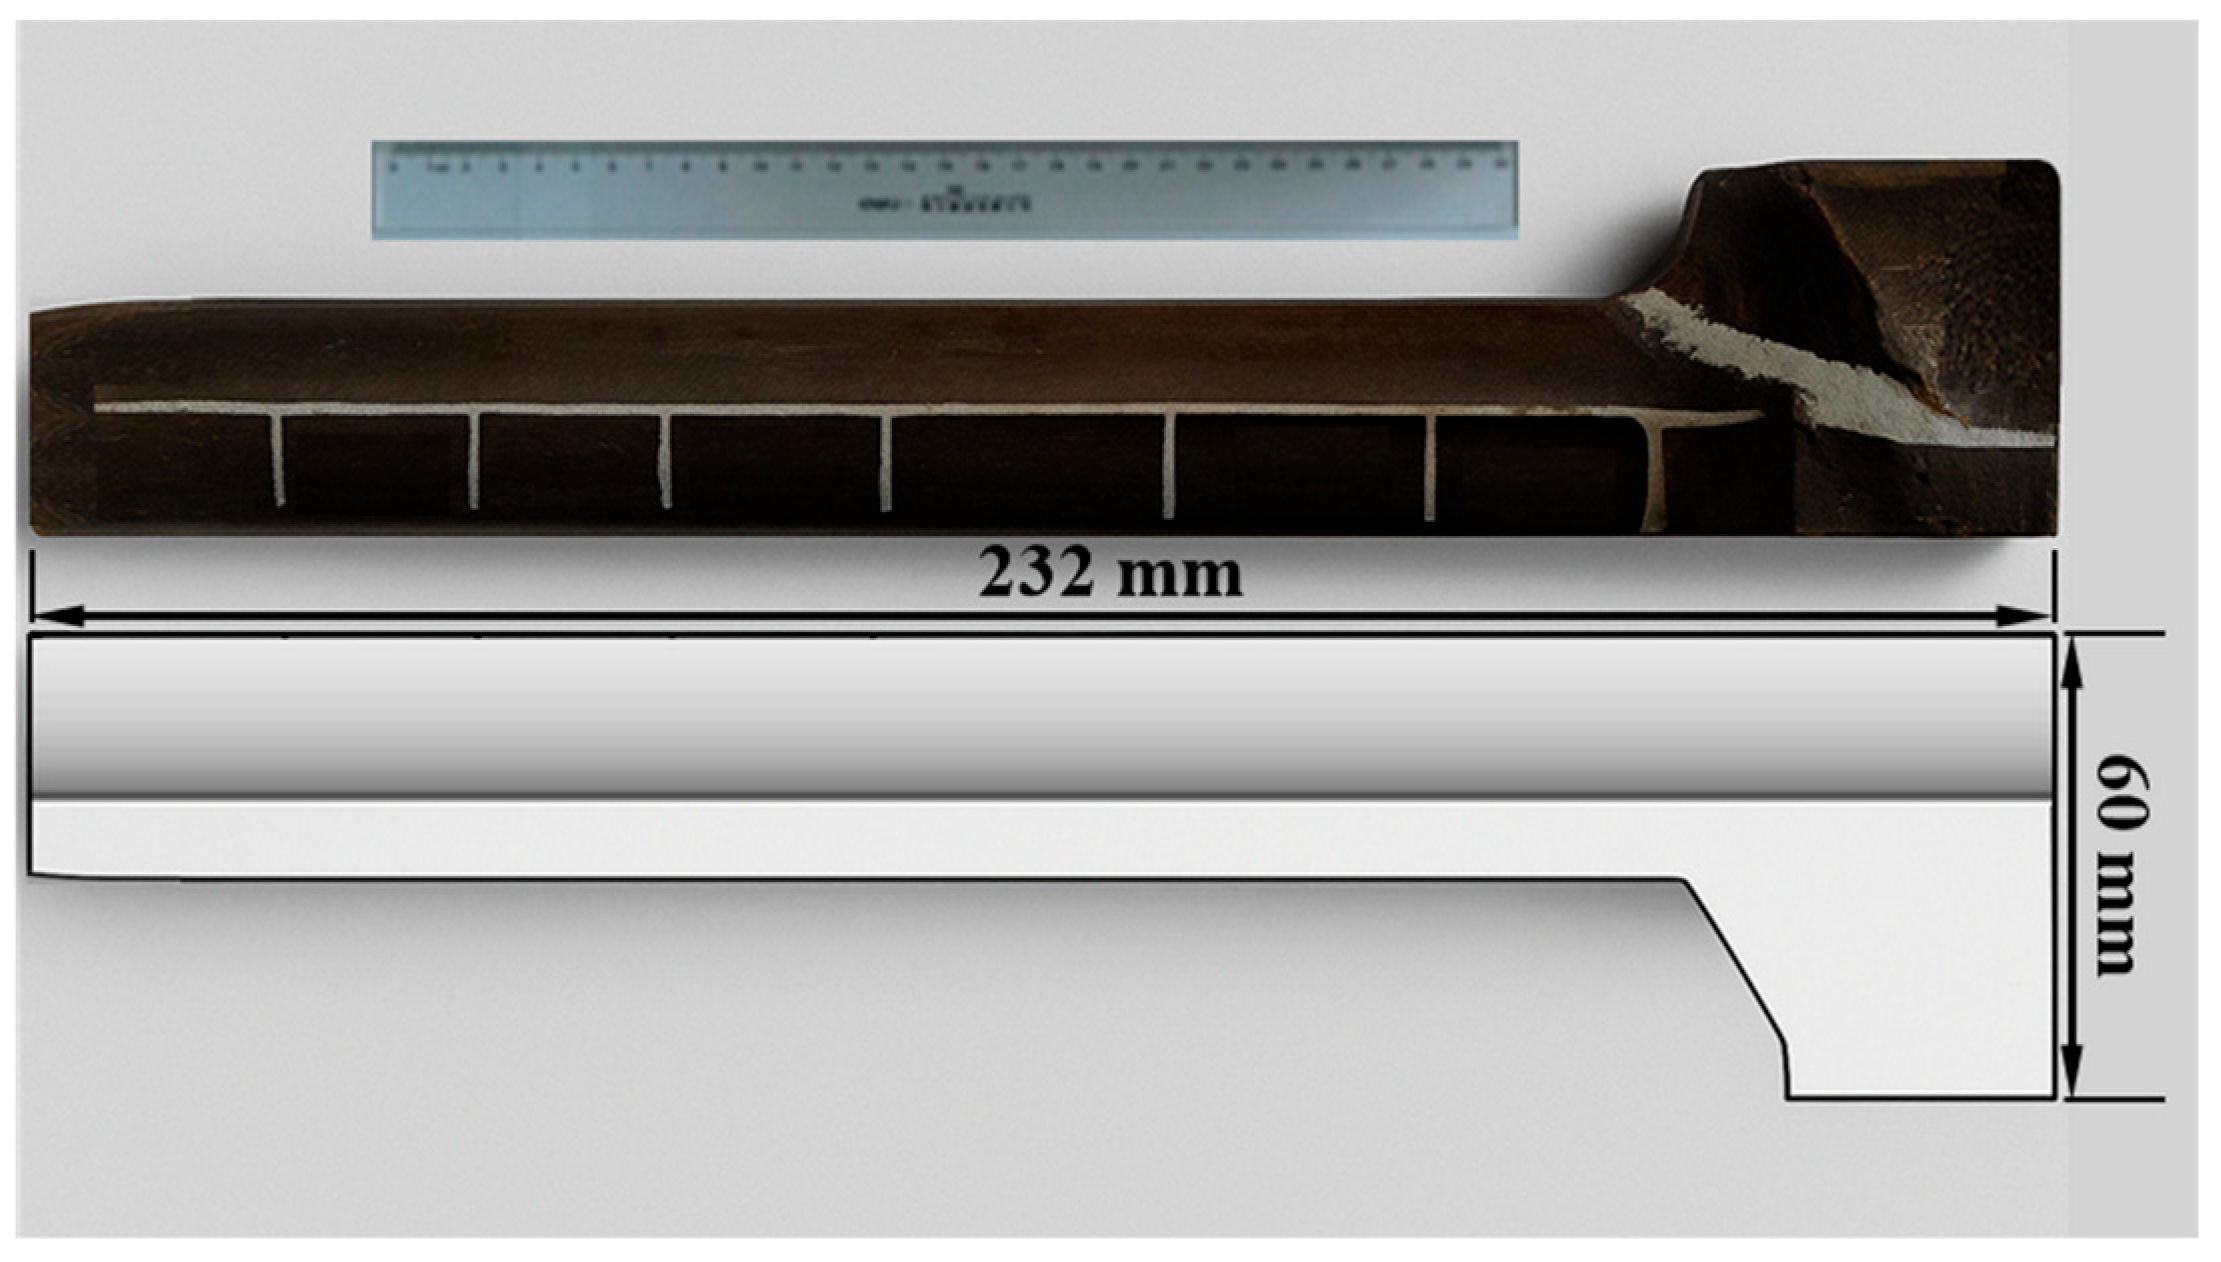
A visual and dimensional comparison between the actual extruded product and its simulated geometry is provided in Figure A1. The physical specimen, sectioned and overlaid with reference grid lines, reveals excellent agreement with the computed profile in terms of both shape and scale. Key dimensions such as the total length (232 mm) and outer diameter (60 mm) align well between experiment and simulation, confirming the accuracy of the geometric predictions. The consistency across these features supports the reliability of the applied boundary conditions and thermo-mechanical modeling. This qualitative validation further reinforces the model’s capability in capturing not only deformation behavior but also the resulting product geometry with sufficient precision for design and process optimization purposes.
Figure A1. Comparison between the actual extruded product (top) and the simulated geometry (bottom). The measured length (232 mm) and outer diameter (60 mm) show good agreement with the computed dimensions, supporting the geometric accuracy of the simulation model.
Metals 15 00887 g0a1

Appendix B. Verification of the Computer-Aided Engineering Models
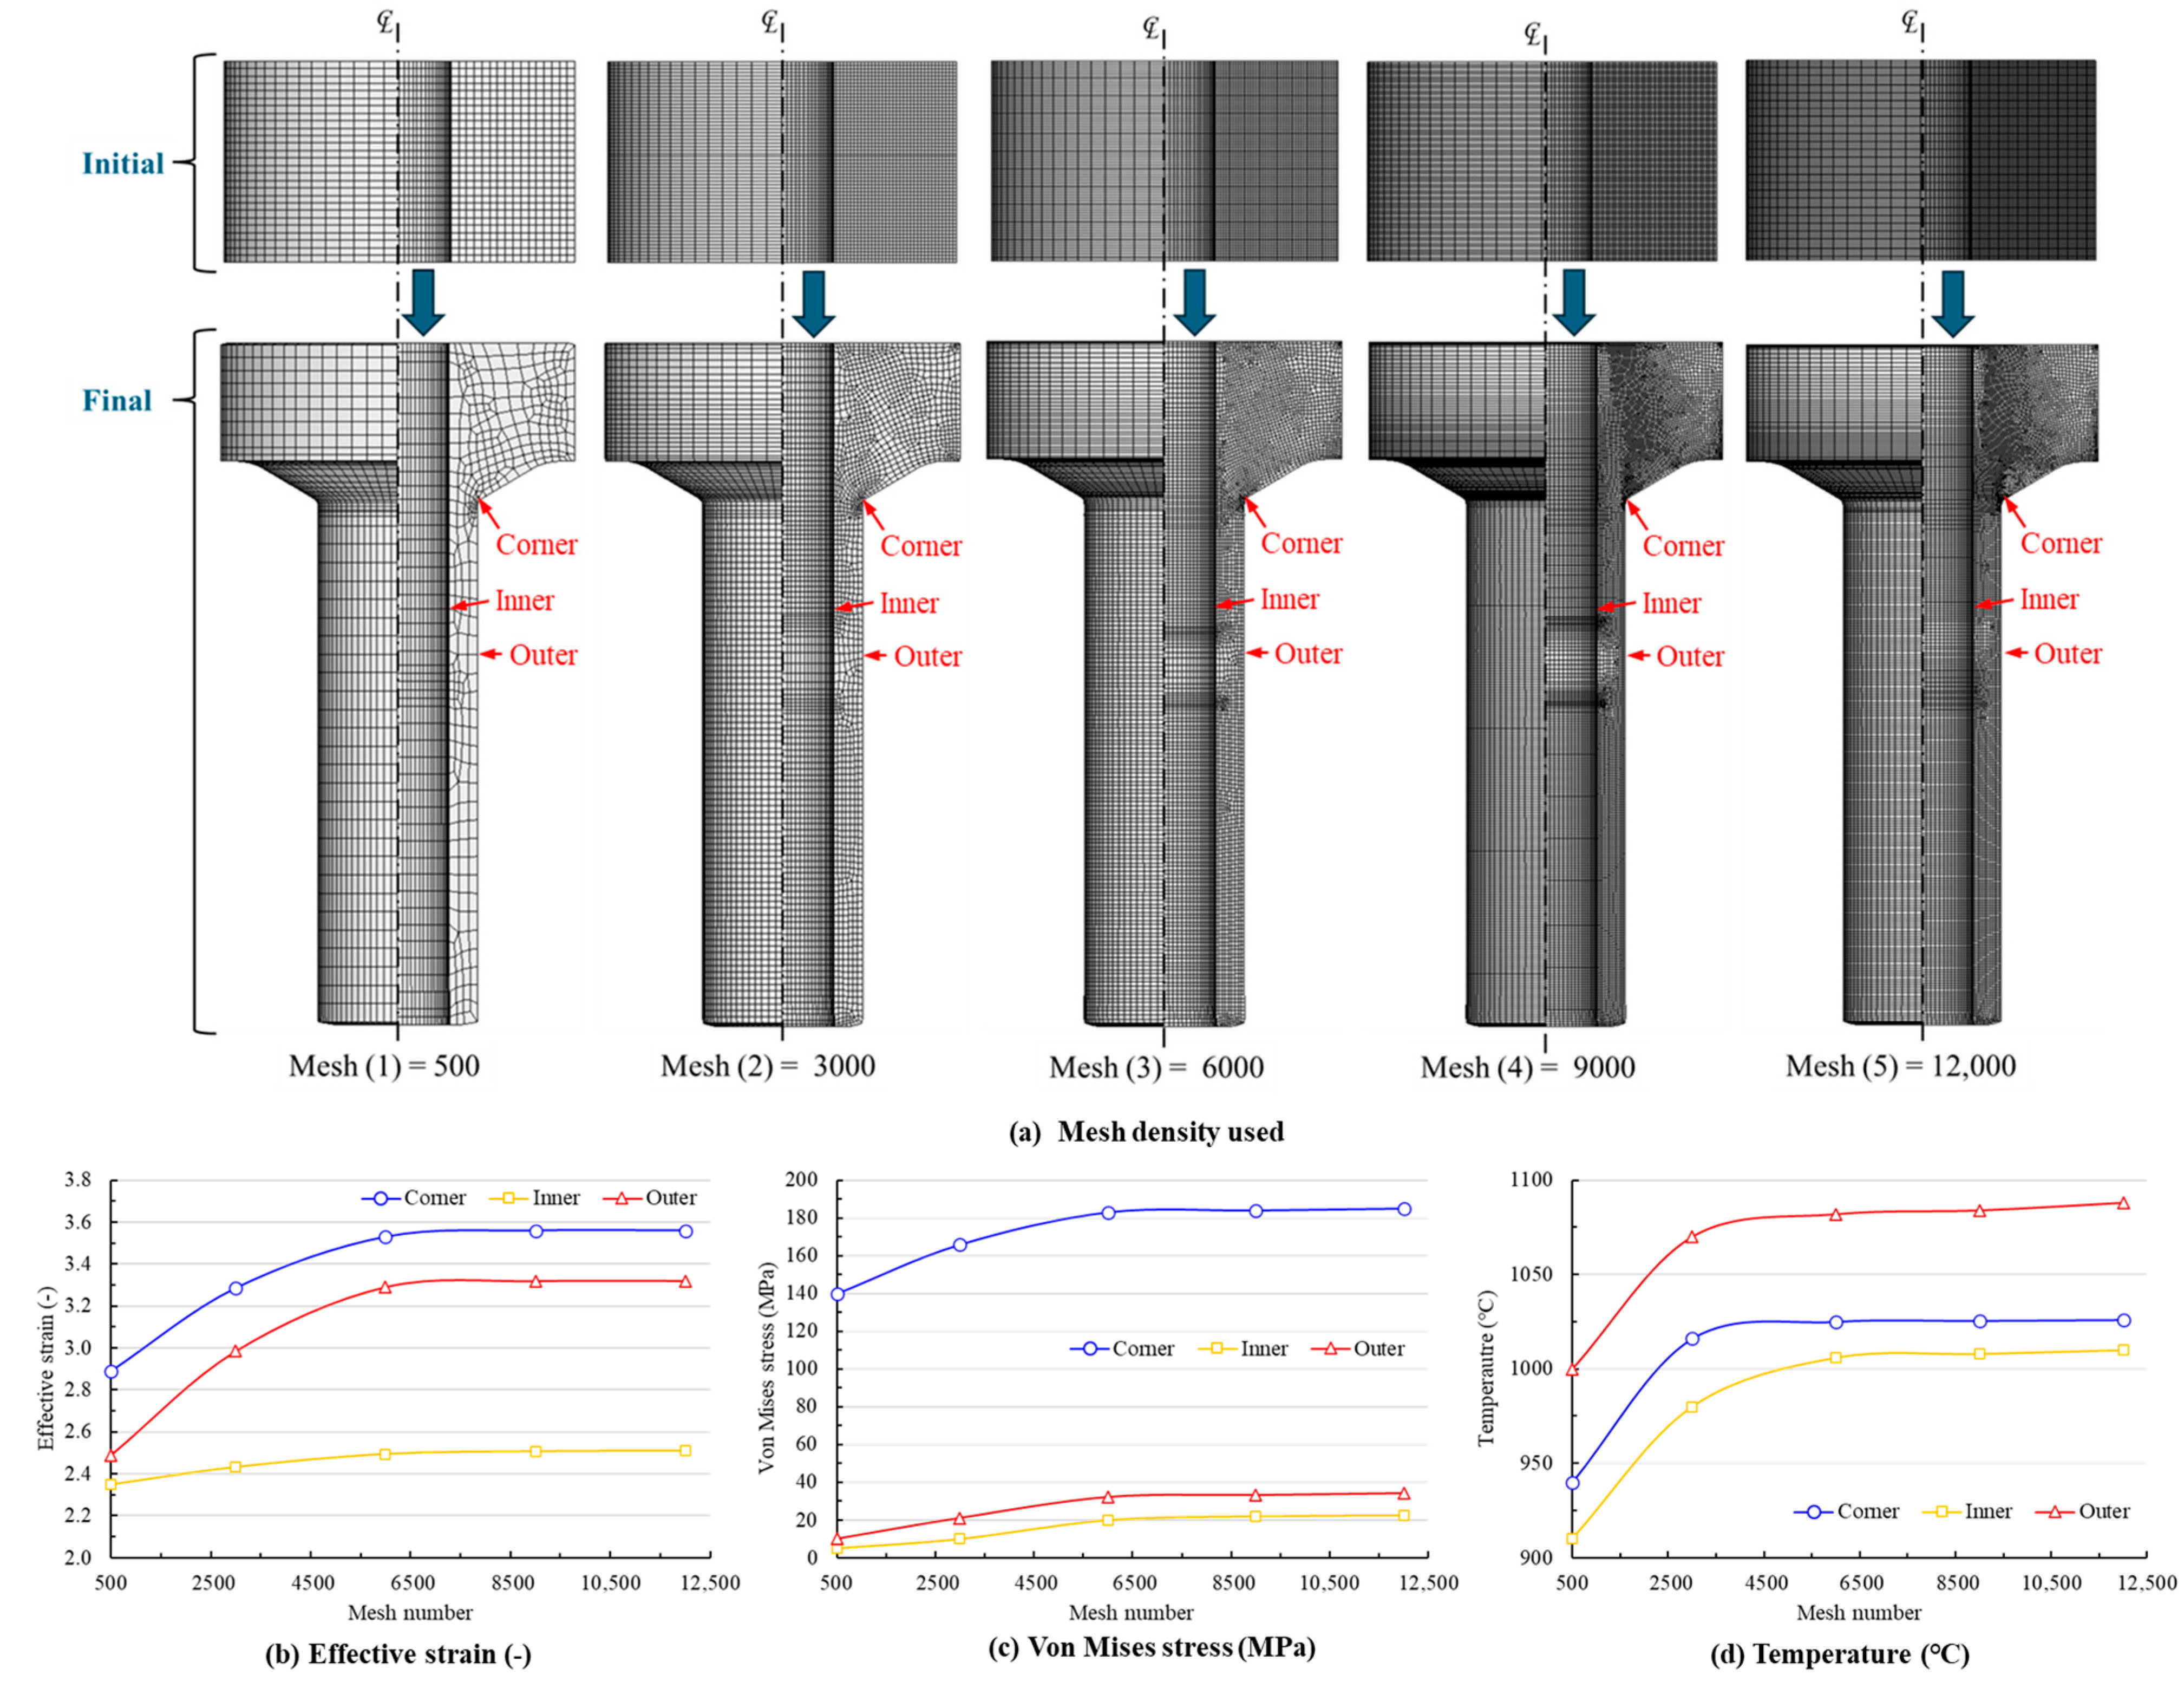
To minimize discretization error, a mesh convergence study was performed using a two-dimensional axisymmetric FEM for the ring specimen. This approach was selected to take advantage of the geometric and loading symmetry, which reduces computational demand while maintaining accurate results. Four-node quadrilateral elements were used with a reduced integration scheme to improve computational efficiency and prevent volumetric locking. An implicit time-stepping scheme was employed to ensure numerical stability.
Five levels of uniform mesh refinement were tested, consisting of approximately 500, 3000, 6000, 9000, and 12,000 elements. Key local variables, such as equivalent effective strain, von Mises stress, and temperature, were evaluated across different mesh densities. These were examined at critical regions, including the high-deformation section (corner) and the inner and outer surfaces of the ring specimen.
To manage mesh distortion during large deformation, an automatic remeshing algorithm was activated, triggered based on internal element quality criteria. This ensured consistent mesh quality throughout the simulation. A representative image of the computational mesh has been included as shown in Figure A2.
The results confirmed that all key variables converged at the 6000-element mesh, which was selected as the optimal configuration, as stated in Section 2.1. This mesh density provided a good compromise between numerical accuracy and computational efficiency.
Figure A2. Mesh convergence verification for hot extrusion simulation: (a) Initial and final mesh configurations for five different mesh densities (500 to 12,000 elements), highlighting three sampling points (corner, inner, and outer) for convergence evaluation; (b) Convergence of effective strain; (c) Convergence of von Mises stress; (d) Convergence of temperature. The results demonstrate that all key parameters stabilized at a mesh size of 6000 elements, which was selected as the optimal configuration. This mesh offered a well-balanced trade-off between numerical accuracy and computational efficiency.
Metals 15 00887 g0a2

References

  1. Razali, M.K.; Chung, S.H.; Irani, M.; Choi, J.M.; Joun, M.S. Characterization of the dynamic recrystallization kinetics using directly flow stress model and Its application to 42CrMo steel. In International Conference on the Technology of Plasticity; Springer Nature: Cham, Switzerland, 2023; pp. 442–454. [Google Scholar] [CrossRef]
  2. Guo, P.; Deng, L.; Wang, X.; Li, J. Modelling of dynamic recrystallization kinetics of 300 M steel at high strain rates during hot deformation. Sci. China Technol. Sci. 2019, 62, 1534–1544. [Google Scholar] [CrossRef]
  3. Razali, M.K.; Heo, Y.; Irani, M.; Chung, S.H.; Joun, M.S. Grain size prediction in SCR420HB hot forging: Combining phenomenological and JMAK models with experimental and numerical analysis. Mater. Today Commun. 2024, 41, 110921. [Google Scholar] [CrossRef]
  4. Liu, Y.; Quan, G.; Yu, Y.; Wu, D. Loading path design for grain refinement in hot forming process of Ti-6Al-2Zr-1Mo-1V Alloy. J. Mater. Eng. Perform. 2024, 34, 1–17. [Google Scholar] [CrossRef]
  5. Du, H.Q.; Li, F.; Wang, Y.; Li, C.; Chen, Z.Y. Modification of grain refinement and texture based on pre-upsetting AZ31 Mg alloy in interactive alternating forward extrusion. Int. J. Adv. Manuf. Technol. 2022, 121, 4805–4815. [Google Scholar] [CrossRef]
  6. Foydl, A.; Segatori, A.; Khalifa, N.B.; Donati, L.; Brosius, A.; Tomesani, L.; Tekkaya, A.E. Grain size evolution simulation in aluminium alloys AA 6082 and AA 7020 during hot forward extrusion process. Mater. Sci. Technol. 2013, 29, 100–110. [Google Scholar] [CrossRef]
  7. Hou, H.; Zhang, L.; Wang, X.; Mei, M.; Zhao, Y. Numerical and experimental research of the effect of friction on cold extrusion internal thread process. J. Braz. Soc. Mech. Sci. Eng. 2024, 46, 515. [Google Scholar] [CrossRef]
  8. Breumier, S.; Adamski, F.; Badreddine, J.; Lévesque, M.; Kermouche, G. Microstructural and mechanical characterization of a shot peening induced rolled edge on direct aged Inconel 718 alloy. Mater. Sci. Eng. A 2021, 816, 141318. [Google Scholar] [CrossRef]
  9. Yu, J.; Zhang, Z.; Wang, Q.; Yin, X.; Cui, J.; Qi, H. Dynamic recrystallization behavior of magnesium alloys with LPSO during hot deformation. J. Alloys Compd. 2017, 704, 382–389. [Google Scholar] [CrossRef]
  10. Mirzadeh, H. Grain refinement of magnesium alloys by dynamic recrystallization (DRX): A review. J. Mater. Res. Technol. 2023, 25, 7050–7077. [Google Scholar] [CrossRef]
  11. Chanda, T.; Zhou, J.; Kowalski, L.; Duszczyk, J. 3D FEM simulation of the thermal events during AA6061 aluminum extrusion. Scr. Mater. 1999, 41, 195–202. [Google Scholar] [CrossRef]
  12. Yeom, J.T.; Kim, J.H.; Hong, J.K.; Park, N.K.; Lee, C.S. Prediction of microstructure evolution in hot backward extrusion of Ti-6Al-4V Alloy. J. Metall. 2012, 1, 989834. [Google Scholar] [CrossRef]
  13. Kugler, G.; Turk, R. Modeling the dynamic recrystallization under multi-stage hot deformation. Acta Mater. 2004, 52, 4659–4668. [Google Scholar] [CrossRef]
  14. Sellars, C.M.; Tegart, W.M. Hot workability. Int. Metall. 1972, 17, 1–24. [Google Scholar] [CrossRef]
  15. Dourandish, S.; Champliaud, H.; Morin, J.B.; Jahazi, M. Numerical simulation and experimental validation of microstructure evolution during the upsetting process of a large size martensitic stainless steel forging. Int. J. Mater. Form. 2024, 17, 38. [Google Scholar] [CrossRef]
  16. Koizumi, T.; Kuroda, M. Grain size effects in aluminum processed by severe plastic deformation. Mater. Sci. Eng. A 2018, 710, 300–308. [Google Scholar] [CrossRef]
  17. Khajezade, A. Prediction of Grain Structure and Texture Evolution After High Temperature Extrusion of Aluminum Alloys. Doctoral Dissertation, University of British Columbia, Vancouver, BC, Canada, 2022. Available online: https://open.library.ubc.ca/soa/cIRcle/collections/ubctheses/24/items/1.0421260 (accessed on 11 October 2022).
  18. Diyoke, G.; Rath, L.; Chafle, R.; Ben Khalifa, N.; Klusemann, B. Numerical simulation of friction extrusion: Process characteristics and material deformation due to friction. Int. J. Mater. Form. 2024, 17, 26. [Google Scholar] [CrossRef]
  19. Bagherpour, E.; Mortezaei, S.; Ebrahimi, R.; Miyamoto, H.; Qods, F. On the production of severely deformed workpieces in large scales: A step towards industrialization. JOM 2019, 71, 4424–4435. [Google Scholar] [CrossRef]
  20. Mahmoodkhani, Y.; Wells, M.A.; Grajales, L.; Poole, W.J.; Parson, N.C. Material flow and grain deformation during extrusion. In Materials Science Forum; Trans Tech Publications Ltd.: Lincoln, NE, USA, 2014; Volume 794, pp. 664–669. [Google Scholar] [CrossRef]
  21. Lee, S.W.; Jo, J.W.; Joun, M.S.; Lee, J.M. Effect of friction conditions on material flow in FE analysis of Al piston forging process. Int. J. Precis. Eng. Manuf. 2019, 20, 1643–1652. [Google Scholar] [CrossRef]
  22. Lin, J.B.; Ma, L.F.; Chen, Y.X.; Wang, C.; Liang, Q.X.; Cui, X.C. Experimental and numerical investigation of the grain size evolvement of AZ31 Mg Alloy during high ratio extrusion. In Materials Science Forum; Trans Tech Publications Ltd.: Lincoln, NE, USA, 2013; Volume 747, pp. 211–216. [Google Scholar] [CrossRef]
  23. Zhang, D.W.; Xu, F.F.; Yu, Z.C.; Lu, K.Y.; Zheng, Z.B.; Zhao, S.D. Coulomb, Tresca and Coulomb-Tresca friction models used in analytical analysis for rolling process of external spline. J. Mater. Process. Technol. 2021, 292, 117059. [Google Scholar] [CrossRef]
  24. Joun, M.S.; Heo, Y.; Kim, N.H.; Kim, N.Y. On lubrication regime changes during forward extrusion, forging, and drawing. Lubricants 2024, 12, 352. [Google Scholar] [CrossRef]
  25. Abd Ghawi, A.A.; Razali, M.K.; Salleh, N.A.M.; Joun, M.S. Coupled elastoplastic FEM analysis of frictional boss forming. Next Res. 2025, 2, 100416. [Google Scholar] [CrossRef]
  26. Avrami, M. Kinetics of phase change. I General theory. J. Chem. Phys. 1939, 7, 1103–1112. [Google Scholar] [CrossRef]
  27. Ruckenstein, E.; Vavanellos, T. Kinetics of solid phase reactions. AIChE J. 1975, 21, 756–763. [Google Scholar] [CrossRef]
  28. Fanfoni, M.; Tomellini, M. The johnson-mehl-avrami-kohnogorov model: A brief review. Il Nuovo C. D 1998, 20, 1171–1182. [Google Scholar] [CrossRef]
  29. Jonas, J.J.; Quelennec, X.; Jiang, L.; Martin, É. The Avrami kinetics of dynamic recrystallization. Acta Mater. 2009, 57, 2748–2756. [Google Scholar] [CrossRef]
  30. Jiang, Y.; Wu, R.; Yuan, C.; Wang, W.; Jiao, W. Prediction and analysis of breakthrough extruding force based on a modified FE-model in large-scale extrusion process. Int. J. Adv. Manuf. Technol. 2019, 104, 3531–3544. [Google Scholar] [CrossRef]
  31. Avrami, M. Kinetics of phase change. II. transformation-time relations for random distribution of nuclei. J. Chem. Phys. 1940, 8, 212–224. [Google Scholar] [CrossRef]
  32. Shercliff, H.R.; Lovatt, A.M. Modelling of microstructure evolution in hot deformation. Philos. Trans. R. Soc. Lond. Ser. A 1999, 357, 1621–1643. [Google Scholar] [CrossRef]
  33. Zhou, W.; Lin, J.; Balint, D.S.; Dean, T.A. Clarification of the effect of temperature and strain rate on workpiece deformation behaviour in metal forming processes. Int. J. Mach. Tools. Manuf. 2021, 171, 103815. [Google Scholar] [CrossRef]
  34. Francy, K.A.; Rao, C.S.; Gopalakrishnaiah, P. Optimization of direct extrusion process parameter on 16MnCr5 and AISI1010 using DEFORM-3D. Procedia Manuf. 2019, 30, 498–505. [Google Scholar] [CrossRef]
  35. Lin, Y.C.; Nong, F.Q.; Chen, X.M.; Chen, D.D.; Chen, M.S. Microstructural evolution and constitutive models to predict hot deformation behaviors of a nickel-based superalloy. Vacuum 2017, 137, 104–114. [Google Scholar] [CrossRef]
  36. Karhausen, K.; Kopp, R. Model for integrated process and microstructure simulation in hot forming. Steel. Res. 1992, 63, 247–256. [Google Scholar] [CrossRef]
  37. Bakhtiani, T.; El-Mounayri, H.; Zhang, J. Numerical simulation of aluminum extrusion using coated die. Mater. Today Proc. 2014, 1, 94–106. [Google Scholar] [CrossRef]
  38. Mittelman, B.; Priel, E.; Navi, N.U. A finite element study of thermo-mechanical fields and their relation to friction conditions in Al1050 ring compression tests. J. Manuf. Mater. Process 2018, 2, 83. [Google Scholar] [CrossRef]
  39. Joun, M.S. Recent advances in metal forming simulation technology for automobile parts by AFDEX. IOP Conf. Ser. Mater. Sci. Eng. 2020, 834, 012016. [Google Scholar] [CrossRef]
  40. Petrik, J.; Ali, S.I.; Feistle, M.; Bambach, M. CrystalMind: A surrogate model for predicting 3D models with recrystallization in open-die hot forging including an optimization framework. Mech. Mater. 2024, 189, 104875. [Google Scholar] [CrossRef]
  41. Moon, H.K.; Lee, J.S.; Yoo, S.J.; Joun, M.S.; Lee, J.K. Hot deformation behavior of bearing steels. J. Eng. Mater. Technol. 2007, 129, 349–355. [Google Scholar] [CrossRef]
  42. Joun, M.S.; Razali, M.K.; Yoo, J.D.; Kim, M.C.; Choi, J.M. Novel extended Cm models of flow stress for accurate mechanical and metallurgical calculations and comparison with traditional flow models. J. Magnes. Alloys. 2022, 10, 2516–2533. [Google Scholar] [CrossRef]
  43. Menapace, C.; Sartori, N.; Pellizzari, M.; Straffelini, G. Hot deformation behavior of four steels: A comparative study. J. Eng. Mater. Technol. 2018, 140, 021006. [Google Scholar] [CrossRef]
  44. Bobrovskij, I.; Khaimovich, A.; Bobrovskij, N.; Travieso-Rodriguez, J.A.; Grechnikov, F. Derivation of the coefficients in the coulomb constant shear friction law from experimental data on the extrusion of a material into V-shaped channels with different convergence angles: New method and algorithm. Metals 2022, 12, 239. [Google Scholar] [CrossRef]
  45. Priel, E.; Mittelman, B.; Trabelsi, N.; Cohen, Y.; Koptiar, Y.; Padan, R. A computational investigation of equal channel angular pressing of molybdenum validated by experiments. J. Mater. Process. Technol. 2019, 264, 469–485. [Google Scholar] [CrossRef]
Figure 1. (a) 1200T extrusion press machine; (b) die assembly; (c) die schematic showing workpiece and glass lubrication setup.
Metals 15 00887 g001
Figure 2. A finite element model of the extrusion process was developed in AFDEX.
Metals 15 00887 g002
Figure 3. Comparison of flow stress curves between experimental data (dashed lines) and calibrated constitutive model (solid lines) for P91 steel under various temperatures and strain rates. The graphs illustrate the material response at strain rates of (a) 0.1 s−1, (b) 0.5 s−1, (c) 1 s−1, (d) 2 s−1, and (e) 5 s−1, each evaluated across five temperatures: 1050 °C, 1100 °C, 1150 °C, 1200 °C, and 1250 °C. The model accurately captures key deformation features such as peak stress and softening behavior, with good agreement observed across all test conditions. Increasing temperature leads to reduced peak stress and flow softening, while higher strain rates result in greater flow resistance, consistent with thermally activated plasticity in hot deformation of P91.
Metals 15 00887 g003
Figure 4. Grain size measurements on extruded billets.
Metals 15 00887 g004
Figure 5. Sampling strategy and comparison of grain size across the extruded billet. Six longitudinal positions were selected for metallographic analysis, with five coordinate measurements taken at each point (totaling 30 data points). The left image shows the physical locations on the billet with corresponding experimentally measured average grain sizes (in µm), while the right image illustrates the simulated grain size distribution derived from the FEM-coupled model.
Metals 15 00887 g005
Figure 6. Interpolation framework for temperature and strain rate-dependent material constants using bilinear mapping adapted from ref. [1].
Metals 15 00887 g006
Figure 7. Flowchart outlining the prediction of d D R X using FE-based optimization and characterization techniques.
Metals 15 00887 g007
Figure 8. Thermomechanical and microstructural field distributions predicted for the hot extrusion of P91 steel using Coulomb and shear friction models: (a) effective strain, (b) effective stress, (c) temperature, and (d) predicted d D R X .
Metals 15 00887 g008
Figure 9. Comparison of predicted d D R X at six sampling points using Coulomb and shear friction models against experimental measurements.
Metals 15 00887 g009
Figure 10. Comparison of punch load–displacement and velocity responses for Coulomb friction under two punch control strategies: constant velocity mode (dotted lines) and hydraulic press mode (solid lines). The hydraulic mode dynamically adjusts punch velocity to maintain load below 5000 kN, resulting in smoother deformation and safer operation. In contrast, the constant mode maintains fixed velocity, causing excessive load buildup beyond 5000 kN and emphasizing the importance of force-regulated control in hot extrusion of P91 steel.
Metals 15 00887 g010
Figure 11. Comparison of predicted d D R X at six sampling points using four simulation configurations (Coulomb-Hydraulic, Coulomb-Constant, Shear-Hydraulic, Shear-Constant) against experimental measurements. The Coulomb-Hydraulic model shows the closest agreement across all points, particularly in mid-span regions (Points 2 to 5), where thermomechanical gradients are highest. This result highlights the combined importance of accurate friction modeling and adaptive punch control in achieving reliable microstructure prediction.
Metals 15 00887 g011
Figure 12. Contour plots of predicted d D R X distribution for four simulation configurations: (a) Coulomb–Hydraulic, (b) Coulomb–Constant, (c) Shear–Hydraulic, (d) Shear–Constant. The Coulomb–Hydraulic model exhibits the most realistic and spatially uniform grain refinement, particularly near the die exit and container wall.
Metals 15 00887 g012
Figure 13. Microstructural validation of d D R X predictions: (left) optical micrographs at six experimental sampling points along the extruded P91 billet, with measured grain sizes annotated; (center) physical billet specimen showing sample locations; (right) FEM-predicted d D R X field using the Coulomb-Hydraulic model, with five coordinate points per sampling location (total of 30). The spatial distribution and grain size gradients predicted by the simulation show strong agreement with the experimental observations, confirming the model’s accuracy in capturing both local and global microstructural evolution.
Metals 15 00887 g013
Figure 14. Evolution of d D R X during hot extrusion under Coulomb–Hydraulic conditions. The sequential deformation steps illustrate the progressive development of recrystallized regions, with d D R X fraction indicated by the color scale. Early stages show minimal recrystallization near the die interface, while further punch displacement intensifies d D R X initiation and propagation, particularly near the die shoulder and bearing zones. The hydraulic control mode promotes gradual strain accumulation, facilitating controlled DRX and improved microstructure uniformity along the extrudate.
Metals 15 00887 g014
Table 1. Thermal properties matrix. Thermal properties of P91 steel adapted from Ref. [38]. Thermal properties of SKD61 tool steel adapted from Ref. [41].
Temperature (°C)Thermal Conductivity [W/(mm °C)]Heat Capacity [Ws/(mm3 °C)]
200.04170.00283
1000.04340.00305
2000.04320.00328
4000.03910.00376
6000.03410.00479
15000.03410.00479
200.01340.00563
2000.01340.00563
8000.01380.00563
9000.01460.00563
10000.01530.00571
11000.01610.00572
12000.01680.00585
13000.01750.00611
Table 2. Conditions at the material–die interface and free boundaries adapted from Ref. [41].
Heat transfer coefficient to ambient from material and dies (W/ m m 2 °C)2.95 × 10 6
Heat radiation coefficient to ambient from material and dies (W/ m m 2 °C4)3.97 × 10 14
Heat transfer coefficient to material from die (W/ m m 2 °C)0.01
Table 3. Flow constant matrix for P91 steel.
T (°C) ε ˙ C 0 C 2 m 0 m 3 T (°C) ε ˙ C 0 C 2 m 0 m 3
10500.0148.3913.010.0930.02611000.01267.95−218.870.8140.189
0.0588.1022.890.049−0.0020.05333.16−238.760.3510.033
0.1101.1027.200.0650.0010.1415.96−305.960.3980.041
0.2114.3630.970.0810.0030.2405.59−281.230.3390.024
0.3121.8433.040.089−0.0040.3434.14−303.960.3570.025
0.4124.2233.680.098−0.0100.4467.07−337.750.4050.034
0.5123.3633.300.110−0.0150.5468.59−343.140.4360.037
0.6121.9632.540.118−0.0190.6497.13−375.920.5020.055
0.7119.6732.230.127−0.0200.7523.40−405.720.5690.075
0.8117.7231.860.127−0.0150.8528.01−412.560.5960.091
0.9115.6931.360.125−0.0050.9545.19−430.460.6270.106
11500.0136.249.910.1020.02512000.01211.34−173.430.8610.220
0.0581.12−2.490.0850.0010.05241.61−179.340.4610.071
0.1321.88−229.610.3710.0390.1304.17−231.150.5070.078
0.2373.08−268.300.3860.0380.2349.95−265.180.5080.069
0.3303.78−194.550.3120.0130.3341.22−251.870.4790.046
0.4180.07−72.780.214−0.0080.4348.53−259.330.5180.040
0.5343.47−240.540.4140.0210.5350.81−265.320.5670.052
0.6344.62−246.470.4540.0370.6377.28−295.740.6720.089
0.7364.58−268.790.4990.0550.7377.36−299.090.7220.113
0.8381.46−286.940.5220.0690.8375.74−299.350.7500.129
0.9386.07−290.130.5060.0710.9366.85−291.700.7420.139
12500.0119.695.350.1320.032
0.05171.08−120.200.3850.033
0.1237.16−176.000.4430.044
0.2217.50−148.110.3550.017
0.3126.02−53.420.219−0.022
0.4191.28−119.810.352−0.013
0.5230.09−161.930.4640.006
0.6216.07−151.790.4820.014
0.7240.58−179.360.5750.043
0.8237.18−177.620.5860.056
0.9253.02−193.950.6270.085
Table 4. Optimized d D R X parameters used as universal constants.
ConstantsOptimized Value
a 15,600
h0.0093
n 0.177
m −0.072
Q (kJ/mol)69.466
Table 5. Optimized d D R X parameters used as a function of ε ˙ and T.
T (°C) ε ˙ ConstantsInitial GuessConstrainOptimized
10500.1a15,0005000 < a < 25,00011,533
h0.0001−0.1 < h < 0.10.00001
n0.1770 < n < 1.00.216
m−0.072−0.5 < m < −0.001−0.086
Q69.46610.0 < Q < 100.062.262
1.0a15,2005000 < a < 25,00018,578
h0.0001−0.1 < h < 0.10.00001
n0.1770 < n < 1.00.215
m−0.072−0.5 < m < −0.001−0.058
Q69.46610.0 < Q < 100.087.082
5.0a15,4005000 < a < 25,00011,496
h0.0001−0.1 < h < 0.10.00001
n0.1770 < n < 1.00.217
m−0.072−0.5 < m < −0.001−0.08
Q69.46610.0 < Q < 100.088.577
11500.1a15,6005000 < a < 25,00016,699
h0.0001−0.1 < h < 0.10.00001
n0.1770 < n < 1.00.222
m−0.072−0.5 < m < −0.001−0.081
Q69.46610.0 < Q < 100.048.689
1.0a15,8005000 < a < 25,00015,440
h0.0001−0.1 < h < 0.10.00001
n0.1770 < n < 1.00.159
m−0.072−0.5 < m < −0.001−0.083
Q69.46610.0 < Q < 100.069.426
5.0a16,0005000 < a < 25,00011,164
h0.0001−0.1 < h < 0.10.00001
n0.1770 < n < 1.00.156
m−0.072−0.5 < m < −0.001−0.06
Q69.46610.0 < Q < 100.049.217
12500.1a16,2005000 < a < 25,00013,322
h0.0001−0.1 < h < 0.10.00001
n0.1770 < n < 1.00.214
m−0.072−0.5 < m < −0.001−0.078
Q69.46610.0 < Q < 100.051.575
1.0a16,6005000 < a < 25,00011,503
h0.0001−0.1 < h < 0.10.00001
n0.1770 < n < 1.00.199
m−0.072−0.5 < m < −0.001−0.083
Q69.46610.0 < Q < 100.049.784
5.0a16,9305000 < a < 25,00021,721
h0.0001−0.1 < h < 0.10.00001
n0.1770 < n < 1.00.209
m−0.072−0.5 < m < −0.001−0.086
Q69.46610.0 < Q < 100.069.411
Disclaimer/Publisher’s Note: The statements, opinions and data contained in all publications are solely those of the individual author(s) and contributor(s) and not of MDPI and/or the editor(s). MDPI and/or the editor(s) disclaim responsibility for any injury to people or property resulting from any ideas, methods, instructions or products referred to in the content.