Abstract
The hydrogen/deuterium permeation behavior of X52MS pipeline steel with three thicknesses was investigated using the gas/liquid phase permeation method by changing the current density and regulating the surface roughness. The permeation curves under different conditions were obtained, the hydrogen/deuterium diffusion coefficients and related important parameters were calculated, and the surface morphology of the hydrogen-filled side was observed using scanning electron microscopy. It is found that the hydrogen diffusion coefficient and diffusion flux increase gradually with an increase in the hydrogen charging current density, while the hydrogen infiltration lag time gradually decreases. With the increase in surface roughness of the specimen, the corrosion degree of the surface after hydrogen penetration decreases, the hydrogen diffusion coefficient gradually decreases, and the penetration time, lag time, and hydrogen concentration on the cathode side gradually increase.
1. Introduction
In recent years, with the large-scale development of natural gas resources, the issue of hydrogen embrittlement in pipeline materials has become increasingly prominent. This is especially true when pipeline materials are exposed to environments that contain H2S, where hydrogen embrittlement can become a primary failure mode. Research indicates that hydrogen atoms can penetrate steel through various pathways, significantly altering its mechanical properties and potentially leading to sudden failures under extreme conditions. Therefore, it is crucial to investigate the migration patterns of hydrogen atoms within materials [1,2]. Additionally, the hydrogen penetration process is influenced by environmental factors such as temperature, pH value, and solution medium, as well as material factors like composition and physicochemical properties. The surface roughness of the material plays a critical role in the mechanisms of hydrogen adsorption and penetration.
Hydrogen corrosion [3,4,5] refers to the phenomenon where, when metal materials work under high-temperature, high-pressure, and hydrogen-containing conditions for a certain period of time, some components inside the metals react with hydrogen, gradually forming high-pressure bubbles. As the hydrogen permeation time extends, these bubbles continue to grow at grain boundaries, and the connection and growth of several adjacent or multiple high-pressure bubbles will lead to stepped cracks inside the materials, resulting in performance degradation or even permanent damage, namely, hydrogen-induced cracking. Tan Sizhi et al. [6] conducted stress corrosion tests on 7N01 aluminum alloy, and the results showed that the corrosion current density of aluminum alloy samples after electrochemical hydrogen charging treatment increased by 1–2 orders of magnitude compared with before hydrogen charging. Based on the weak bond theory, hydrogen reduces the bonding force between metal atoms, making it easier for chemical bonds to break and promoting more alloying elements or matrix atoms to participate in the corrosion reaction of aluminum alloy, thus significantly accelerating the corrosion rate [7]. Kim et al. [8] showed that austenitic stainless steel alloyed with both carbon and nitrogen exhibits better resistance to hydrogen embrittlement than that alloyed with a single element. On the surface layer of the sample, grain boundaries are key positions for crack initiation, and C-N bonds form an energy barrier through strong chemical bond interactions, which effectively hinders the further propagation of cracks.
A series of studies has been conducted to address the issues of hydrogen sensitivity and adaptation in natural gas pipelines. As shown in Figure 1 H. Wan et al. [9] investigated the effects of O2 and CO content in pure hydrogen gas on the hydrogen embrittlement sensitivity of X52 pipeline steel using slow-strain rate testing. They found that as the content of these gases increased, the sensitivity to hydrogen embrittlement decreased. The fundamental reason for this reduction was the competitive adsorption of H2 by O2 and CO on the metal surface. Fe Fan et al. [10] conducted slow-strain rate tensile and fatigue crack propagation tests on X60 pipeline steel in service under hydrogen environments. They discovered that at a total pressure of 6.4 MPa and a hydrogen ratio of 5%, the hydrogen embrittlement sensitivity was extremely low, exhibiting ductile fracture characteristics. When the stress intensity factor exceeds a specific critical value, the propagation mode of fatigue cracks undergoes a significant transition. When the stress intensity factor is below this critical value, the crack propagation process is mainly controlled by the plastic deformation at the crack tip, and its fracture behavior exhibits typical ductile fracture characteristics; however, when the stress intensity factor crosses this critical value, the crack propagation mode transforms into a mixed fracture form that simultaneously includes the characteristics of brittle fracture and ductile fracture. R. Wei et al. [11] compared the mechanical properties of an L245 seamless steel pipe in air and hydrogen environments. They found that compared to air, the plasticity of the pipeline steel in hydrogen environments decreased. The fracture mode of notched specimens was a combination of quasi-ductile fracture at the notch edge and central fracture, indicating a certain degree of hydrogen embrittlement sensitivity. In an environment of 4 MPa hydrogen and 0.01% water, the addition of 0.01% oxygen reduced hydrogen embrittlement sensitivity, while the addition of 0.01% CO2 significantly increased it, as shown in Figure 2. Wu Xiaogqi and colleagues [12] investigated the effect of in situ small punch compression rates on the hydrogen embrittlement sensitivity of X65 pipeline steel. They found that specimens exposed to 4 MPa hydrogen exhibited a clear quasi-decomposition fracture surface, indicating significant hydrogen embrittlement. Under low-compression rate conditions, hydrogen diffusion followed dislocation movement, with dislocations carrying hydrogen gas clusters to the crack tip, leading to significant hydrogen embrittlement.
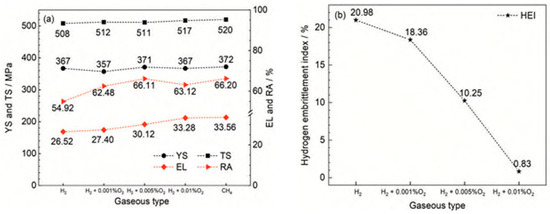
Figure 1.
Tensile data (a) and HEI (b) of X52 pipeline steel in H2 atmospheres with different oxygen contents Reprinted with permission from ref. [9]. H. Wan, H. Ming, J. Wang, et al./2025.
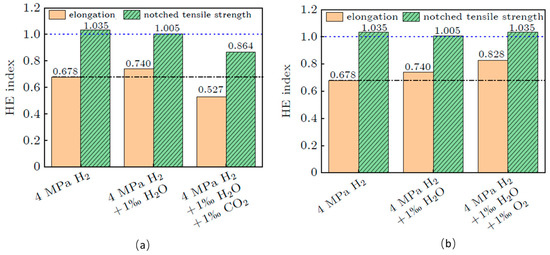
Figure 2.
Effect of different environments on the hydrogen embrittlement susceptibility of L245 pipeline steel in a 4 MPa H2 environment Reprinted with permission from ref. [11]. R. Wei, Z. Yang, Y. Chen, et al./2025. (a) Impact of CO2 on the hydrogen embrittlement sensitivity of L245 pipeline steel in hydrogen environment; (b) Impact of O2 on the hydrogen embrittlement sensitivity of L245 pipeline steel in hydrogen environment.
This paper investigates the hydrogen and deuterium permeation behavior of X52MS pipeline steel under various conditions using both liquid-phase and gas-phase permeation methods and calculates the diffusion-related parameters for hydrogen and deuterium. Additionally, by combining microscopic characterization with permeation tests, it analyzes how current density and surface roughness influence the hydrogen/deuterium adsorption and permeation processes in the corrosion zone. The aim is to uncover the microscopic mechanisms of the interaction between pipeline steel and hydrogen/deuterium, providing a research foundation for improving the hydrogen corrosion issues of X52MS pipeline steel.
2. Test Materials and Methods
2.1. Test Materials
The hot-rolled plates of X52MS pipeline steel, with three thicknesses of 10, 7.1, and 6.3 mm, were taken from the actual production line of the factory for this study. The chemical composition is shown in Table 1. The parameters of rolling include the temperatures of discharging at 1180 °C, rough rolling at 1000 °C, finishing rolling at 860 °C, and coiling at 580 °C.

Table 1.
Chemical composition of X52MS pipeline steel (wt. %).
2.2. Test Method
2.2.1. Liquid Phase Method: Hydrogen Permeation
Using double electrolytic cell technology, the hydrogen diffusion coefficient of pipeline steel is measured through electrochemical methods, and the hydrogen permeation behavior during the corrosion process is analyzed. As shown in Figure 3, the electrolytic cell adopts a sealed H-type design, with an inner diameter of 42 mm for the cell body, and the middle channel has an inner diameter of 15 mm and an outer diameter of 30 mm. The device consists of an electrolytic hydrogen charging chamber and a hydrogen diffusion chamber, employing two-electrode systems and three-electrode systems, respectively. The specimen serves as the common working electrode for both electrolytic cells. The experimental method strictly follows GB/T 30074-2013; Method for measuring hydrogen permeation (absorption and migration) in metals using electrochemical techniques. General Administration of Quality Supervision, Inspection and Quarantine of the People’s Republic of China: Beijing, China; Standardization Administration of the People’s Republic of China: Beijing, China, 2014 [13]. To investigate the effect of surface roughness on the hydrogen permeation behavior of pipeline steel, three steel plates with different thicknesses are first sanded using sandpaper of different grits to obtain specimens with varying surface roughness, each 1 mm thick. Specimens used to study the effect of current density on the hydrogen permeation behavior of pipeline steel are uniformly polished to a mirror finish, with a thickness of 1.2 mm, and both specimens have a diameter of Φ40. After grinding, all specimens are rinsed with distilled water, cleaned with alcohol, dried, and then placed in a room-temperature constant-temperature drying oven for later use. The Super View W3 white light interferometer is used to observe the three-dimensional morphology of specimens with varying roughness and measure their roughness.
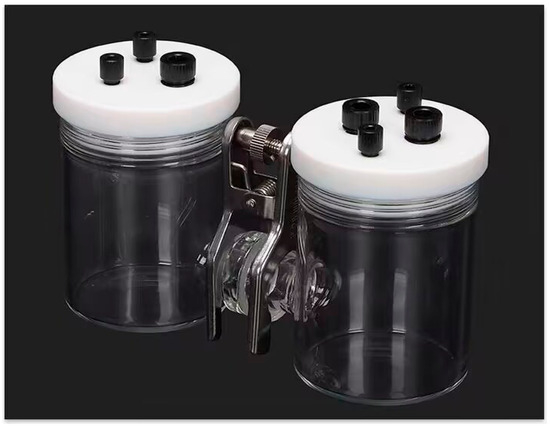
Figure 3.
Sealed H-type electrolytic cell.
Before conducting the electrochemical hydrogen permeation test, to prevent the specimen from dissolving or passivating due to contact with the metal on the side of the hydrogen diffusion chamber, a pre-treatment of nickel plating is necessary. This treatment inhibits surface oxidation and effectively reduces interference from the oxidation current in the hydrogen diffusion chamber, ensuring the accuracy of the hydrogen diffusion coefficient measurement and minimizing the background current. The electrochemical nickel plating method is used [14,15,16], with the specimen serving as the cathode and a 100 mm × 30 mm strip of nickel foam serving as the anode. A Watts bath is used as the electrolyte [17,18,19], with its composition detailed in Table 2. The pH value of the plating solution is controlled within the range of 4.5 to 5.4, and the current density is set at 10 mA/cm2. The nickel plating process lasts 90 s. After plating, the specimen is washed with distilled water to remove any residual plating solution and then cleaned with alcohol. The specimen is dried and placed in a drying oven for later use.

Table 2.
Nickel plating solution ratio.
The specimen is fixed between the electrolysis hydrogen charging chamber and the hydrogen diffusion chamber and sealed tightly with silicone gaskets, and crocodile clips are used to prevent liquid leakage and ensure the accuracy of the experimental data. Using the Wuhan Kestrel CS2350MH dual-potentiostat electrochemical workstation (Wuhan, China), Channel 1 is used to supply a stable and constant potential to the hydrogen diffusion chamber, while Channel 2 provides a stable and constant current to the electrolysis hydrogen charging chamber. The nickel-coated side of the specimen faces the hydrogen diffusion chamber, where a platinum electrode serves as the counter electrode, a calomel electrode serves as the reference electrode, and the specimen serves as the working electrode. The solution in the hydrogen diffusion chamber is 0.2 mol/L NaOH. The uncoated side of the specimen faces the electrolytic hydrogen charging chamber, where a platinum electrode acts as the anode, and the specimen acts as the cathode. The electrolytic hydrogen charging chamber contains a 0.5 mol/L H2SO4 + 0.5 g/L CN4N2S solution, which acts as a poison to inhibit the formation of hydrogen gas from hydrogen atoms [20,21,22]. The experiment is conducted at room temperature.
The determination of the hydrogen diffusion coefficient consists of two stages: background current elimination and hydrogen diffusion. The specific processes and data are as follows:
Background current elimination stage: A constant potential of +300 mV is applied to one side of the hydrogen diffusion chamber to polarize the specimen. The residual diffusible hydrogen in the specimen reaches the anode surface and is ionized into an anode current. When the current density stabilizes and is lower than 1 μA/cm2, it indicates that the hydrogen in the specimen and solution has been completely eliminated [23,24,25].
Hydrogen diffusion stage: A constant current is applied to the electrolytic hydrogen charging chamber, and the hydrogen permeation curve is recorded. The experiment is completed when the current density–time curve in the hydrogen diffusion chamber stabilizes.
Relevant settings: To study the effect of current density on the hydrogen permeation behavior of pipeline steel, the current densities are set at 0.5, 1, 2, and 5 mA/cm2; to study the effect of surface roughness, the current density is set at 20 mA/cm2.
The hydrogen diffusion coefficient, D, of computational metal materials is usually obtained using the time lag method [2], and the hydrogen diffusion-related parameters are obtained from Formulas (1)–(4) [26,27,28]:
In the formula, t0—the corresponding time when the electrolysis of water begins to produce H+ in the hydrogen charging room, s;
t1—I/I∞ = 0.63 corresponds to the time, s;
L—Thickness of the specimen, cm;
I∞—Hydrogen permeation steady-state current density, µA/cm2;
F—Faraday constant, F = 96,485 C/mol;
A—The effective contact area between the specimen and the solution, cm2.
2.2.2. Gas Phase Method: Deuterium Permeation
Wire cutting is used to prepare specimens of the hot-rolled pipeline steel plates, with the specimens being circular discs Φ12 × 0.65 mm in size. To study the deuterium permeation behavior of three different thicknesses of test steel, the specimens are polished to a mirror finish. They are then ground using sandpaper of varying grits to achieve different surface roughness levels. After preparation, the specimens are ultrasonically cleaned twice, with each round lasting 5 min, and then stored in a constant-temperature drying oven for later use.
Figure 4 shows the deuterium permeation test setup and its pneumatic connection. The system uses a mechanical pump to create a vacuum upstream, with a precision pressure gauge monitoring the gas pressure. Pure deuterium gas is supplied from a cylinder to another storage cylinder, which then provides deuterium gas. An external molecular pump works downstream in conjunction with a mechanical pump to create a vacuum. A quadrupole mass spectrometer measures the ion current signal of the gas that has permeated through the specimen. A vacuum coupling radius (VCR) seal permeation fixture, which clamps the specimen, separates the upstream and downstream sections, maintaining a deuterium gas pressure of 3 bar. When the specimen is at a higher temperature, it can deform or rupture due to the pressure from the permeation fixture, compromising its airtightness. To avoid this, the experimental temperature should not be too high; therefore, this study focuses on the effect of surface roughness on deuterium permeation at 350 °C.
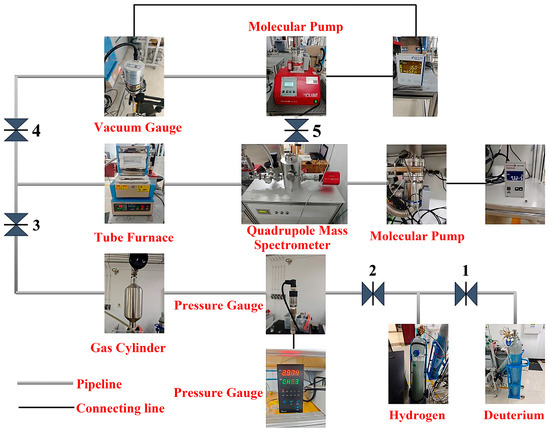
Figure 4.
Deuterium permeation test device and gas path connection diagram.
The one-way diffusion process of deuterium occurs when there is a concentration gradient of deuterium on both sides of the specimen. Deuterium from the high-concentration side diffuses through the gas–solid interface into the specimen and then moves to the low-concentration side within the specimen, forming a concentration gradient. It eventually desorbs and releases into the gas phase on the other side. Before equilibrium diffusion, the permeation flux, Jt, at any time, t, can be determined using the analytical solution of Fick’s second law for time t [29]:
In the formula above, C0 is the fixed deuterium concentration on the surface of the infiltration end. At any time, t, the ratio of Jt to the equilibrium permeation flux, J∞, is expressed as follows:
When the ratio of Jt to J∞ is 0.617, the corresponding penetration time tL is expressed as follows [30]:
In the formula, tL represents the lag time. Therefore, if tL is measured, D can be calculated using Equation (7). In the experiment, the deuterium permeation flux is directly read from the leak detector and multiplied by a conversion factor to obtain the result. There is a linear relationship between the ion current intensity, I, and the deuterium gas leakage rate, L, through the specimen. Before the experiment, the ion current signal and leakage rate are calibrated using a standard leak hole (leakage rate of 3.35 Pa·m3/s), resulting in the relationship between the ion current intensity, I, and the leakage rate, L:
According to Equation (8), the leakage rate of deuterium gas corresponding to different ion flow intensities can be calculated. Therefore, the flux–time curve of deuterium permeation can be drawn according to the ion flow intensity–time curve. Three sets of valid data were obtained from all experiments and comprehensively analyzed, and finally, a more appropriate curve was selected for use.
3. Experimental Results and Discussion
3.1. Surface Morphology of the Coating
Before hydrogen permeation, the anode side must undergo nickel plating. Y. Sheng [31] found that the nickel-plated samples could reduce the background current to 0.17 μA/cm2 in about 400 s, while the samples without nickel plating remained at 2.88 μA/cm2. The longer the electroplating time, the faster the background current decreases; when the electroplating time exceeds 5 min, the background current can drop to a very low value [32]. Figure 5 shows the microscopic morphology and energy dispersive spectroscopy (EDS) results of the nickel plating layer under a 2000× scanning electron microscope. The plating layer exhibits high coverage, with uniform particle distribution, and the nickel content exceeds 90%, as shown in Table 3, which aligns with the high coverage observed in the scanning electron microscope. Notably, O and Fe elements are detected in the plating layer, which is attributed to the oxidation of the specimen surface.
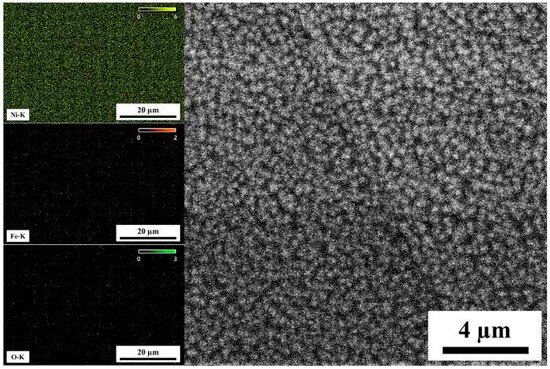
Figure 5.
SEM and EDS of Ni coating.

Table 3.
Elemental composition of EDS coating.
3.2. Hydrogen Permeation Behavior of Pipeline Steel Under Different Current Densities
An electrochemical workstation is used to apply a constant current to the hydrogen charging chamber, initiating the electrolysis of water to produce H+. Initially, the current density remains below 1 µA/cm2 and shows a decreasing trend. This is because the hydrogen generated during the electrochemical reaction at the beginning of the hydrogen filling side of the adsorption process on the surface of the specimen preferentially fills the hydrogen traps that exist inside the specimen and does not pass through the specimen into the hydrogen diffusion chamber. As a result, the hydrogen diffusion chamber side of the basic current signal can not be detected. As time progresses, hydrogen atoms continuously penetrate the specimen and enter the hydrogen traps, an oxidation reaction occurs in the hydrogen diffusion chamber, and a reduction reaction occurs in the hydrogen charging chamber, which generates a current. The current density gradually increases over time. When the current density on the anode side of the specimen stabilizes, it indicates that the hydrogen atoms have reached saturation.
Figure 6 illustrates the hydrogen permeation curves and steady-state current relationships of three different thicknesses of test steel at room temperature. As shown in Figure 6a,c,e, during the initial phase of the hydrogen permeation experiment, the anode current density is below 1 µA/cm2. After a certain period, the anode current begins to increase with the hydrogen charging time, and the rate of change of the anode current gradually decreases, eventually stabilizing at a value of I∞. The time required for hydrogen atoms to penetrate and reach a steady-state current decreases as the hydrogen charging current density increases. The penetration time and time to reach steady-state current for three thicknesses of pipeline steel under different hydrogen charging current densities are detailed in Table 4. Among these, the corresponding penetration times for 10 mm test steel at hydrogen charging current densities of 0.5, 1, 2, and 5 mA/cm2 are 1002, 786, 443, and 296 s, respectively, and the times to reach a steady-state current are 2785, 2590, 2280, and 2010 s, respectively. The corresponding penetration times for 7.1 mm test steel are 856, 702, 421, and 143 s, respectively, and the times to reach a steady-state current are 3975, 3035, 1805, and 1755 s, respectively. The corresponding penetration times for the 6.3 mm test steel are 1046, 983, 676, and 157 s, respectively, and the times to reach a steady-state current are 4640, 2890, 4125, and 3385 s, respectively. Figure 6b,d,f show the steady-state hydrogen permeation current density. For the same test steel, as the current density increases, the anode current reaches a stable value of I∞. The increase in hydrogen charging current density leads to a higher concentration of hydrogen atoms on the hydrogen side. Due to the increased chemical gradient, according to Fick’s first law, the diffusion flux for the same test steel also increases. Consequently, more hydrogen atoms reach the hydrogen diffusion side within a unit of time, leading to an increase in the I∞ value. It is evident that under different current density conditions, the penetration time for the 7.1 mm test steel is the shortest, followed by the 10 mm specimen steel, and the penetration time is the longest for the 6.3 mm test steel.
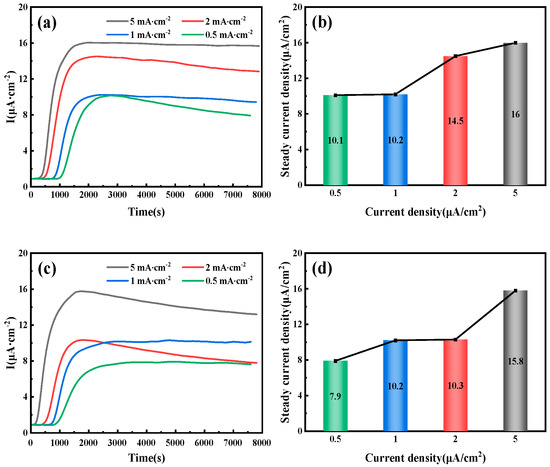
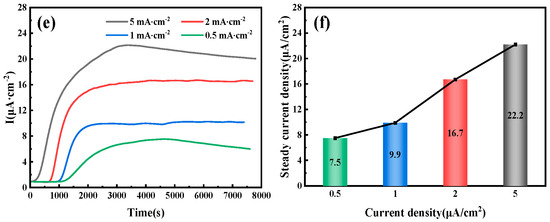
Figure 6.
Hydrogen permeation curves and steady-state current density of pipeline steels with different thicknesses: (a,b) 10 mm; (c,d) 7.1 mm; (e,f) 6.3 mm.

Table 4.
Steady-state current density of three pipeline steels with varying thicknesses.
Hydrogen diffusion refers to the movement of hydrogen atoms along the gaps in an ideal crystal lattice. However, in actual steel, hydrogen traps (such as dislocations and inclusions) can capture hydrogen atoms through physical or chemical adsorption, significantly altering their diffusion characteristics. When the current density is low, the number of hydrogen atoms released is limited, leading to insufficient penetration of hydrogen atoms into the steel. As a result, hydrogen traps cannot quickly reach saturation, resulting in a significant increase in the delay time of hydrogen diffusion. Additionally, because diffused hydrogen atoms are preferentially captured by irreversible traps, the hydrogen concentration gradient in the steel is reduced, further exacerbating the lag effect of the diffusion process. This also results in a lower anode saturation current value, which appears as a decrease in the apparent hydrogen diffusion coefficient. When the current density reaches a certain threshold, the number of hydrogen atoms diffusing through the lattice gaps far exceeds the trapping capacity of the traps, stabilizing the hydrogen diffusion process. At this point, the apparent hydrogen diffusion coefficient no longer changes significantly with the increase in current density.
By fitting and calculating the hydrogen permeation curves at different current densities on the hydrogen charging side, we can obtain the hydrogen permeation parameters for three types of test steels, as shown in Figure 7, Figure 8 and Figure 9. These figures illustrate the relationship between the hydrogen charging current density and the relevant parameters for the three thicknesses of the test steels. It is evident that the trends are consistent across all three types of steel. Specifically, the hydrogen diffusion coefficient and flux increase gradually with the rise in hydrogen charging current density, while the hydrogen permeation lag time decreases progressively. When the hydrogen charging current density is 0.5 mA/cm2, the hydrogen diffusion coefficients of the 10 mm, 7.1 mm, and 6.3 mm test steels stabilize at 1.55 × 10⁻⁶, 1.63 × 10⁻⁶, and 1.15 × 10⁻⁶ cm2/s, respectively. The hydrogen diffusion lag times are 1546, 1469, and 2086 s, respectively, and the hydrogen diffusion fluxes are 5.96 × 10⁻¹¹, 4.61 × 10⁻¹¹, and 4.43 × 10⁻¹¹ mol·cm−2/s, respectively. The hydrogen concentrations on the cathode side are 4.61 × 10⁻⁵, 3.38 × 10⁻⁵, and 4.62 × 10⁻⁵ mol·cm−3, respectively. When the hydrogen charging current density increases to 5 mA/cm2, the hydrogen diffusion coefficients of the test steels increase to 3.17 × 10⁻⁶, 4.15 × 10⁻⁶, and 2.36 × 10⁻⁶ cm2/s, respectively. The lag times decrease to 758, 579, and 1017 s, respectively, and the hydrogen diffusion fluxes increase to 9.42 × 10⁻¹¹, 9.25 × 10⁻¹¹, and 13 × 10−11 mol·cm−2/s, respectively. The hydrogen concentration on the cathode side changes to 3.57 × 10⁻⁵, 2.68 × 10⁻⁵, and 6.61 × 10⁻⁵ mol cm−3, respectively. Overall, among the three types of test steels, the 7.1 mm steel exhibits the highest hydrogen diffusion coefficient and the shortest hydrogen absorption lag time at various current densities; in contrast, the 6.3 mm steel shows the opposite characteristics. As the hydrogen charging current density increases, the concentration of hydrogen atoms in the hydrogen charging chamber rises, leading to a greater concentration difference between the two electrolytic cells. Consequently, more hydrogen atoms pass through the specimen per unit time, increasing the hydrogen diffusion flux. The rate of this increase corresponds to the rate at which the stable current value, I∞, at the anode rises. The trend in hydrogen concentration on the cathode side is influenced by the product of the steady-state current value’s (I∞) rise rate and the rate at which the lag time shortens. When this product is greater than 1, the hydrogen concentration on the cathode side increases; otherwise, it decreases. The results indicate that the 6.3 mm steel exhibits better resistance to hydrogen, while the 7.1 mm steel performs worse.
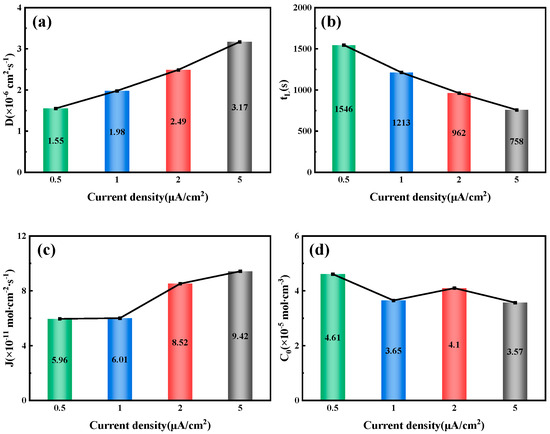
Figure 7.
Related parameters of 10 mm test steel under different current density conditions: (a) Hydrogen diffusion coefficient; (b) Hydrogen permeation lag time; (c) Hydrogen diffusion flux; (d) Hydrogen concentration on the cathode side.
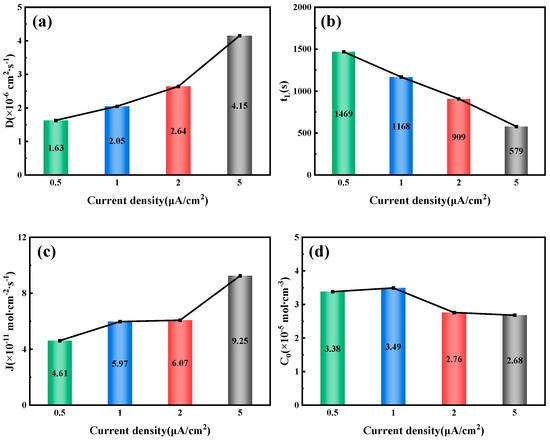
Figure 8.
Related parameters of 7.1 mm test steel under different current density conditions: (a) Hydrogen diffusion coefficient; (b) Hydrogen permeation lag time; (c) Hydrogen diffusion flux; (d) Hydrogen concentration on the cathode side.
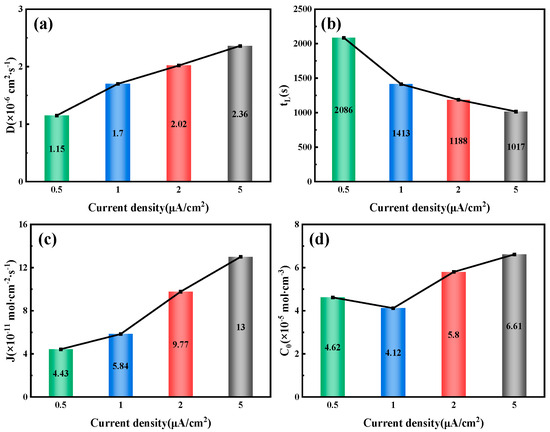
Figure 9.
Related parameters of 6.3 mm test steel under different current density conditions: (a) Hydrogen diffusion coefficient; (b) Hydrogen permeation lag time; (c) Hydrogen diffusion flux; (d) Hydrogen concentration on the cathode side.
3.3. Hydrogen Permeation Behavior of Pipeline Steel Under Different Surface Roughness Conditions
Figure 10a–d show the three-dimensional surface morphology of the 10 mm test steel with different roughness. This morphology is measured using the Ra (arithmetic mean deviation of the profile). Ra refers to the arithmetic mean of the absolute values of the distances from each point on the measured surface profile curve to a reference midline (profile midline), where the profile curve is compared against this midline. The Ra is determined using a white light interferometer, with values of 0.026, 0.245, 0.566, and 0.76 μm. As the roughness increases, more red areas appear on the specimen surface, forming a ridge-like pattern. Figure 10e,f present the hydrogen permeation curves and steady-state current density under different surface Ra conditions. Figure 10e shows the relationship between current density and time after a hydrogen charging current of 20 mA/cm2 is applied to the cathode of the test steel. At this point, hydrogen evolution begins in the hydrogen charging chamber, and the hydrogen permeation curves within the first 30 s are in the initial stage of hydrogen charging, during which the anode barely detects any change in current. As time progresses, the anode current gradually increases and eventually stabilizes. It is observed that the hydrogen penetration time decreases as the surface Ra increases. When the Ra is 0.026 μm, the penetration time is 65 s, whereas when the Ra is 0.76 μm, it is only 34 s. The hydrogen permeation curve shows an increase in the time required to reach the steady-state current from the start of hydrogen charging. For specimens with roughness values of 0.026, 0.245, 0.566, and 0.76 μm, the times to reach the steady-state current are 492, 1193, 982, and 1435 s, respectively. As the hydrogen permeation current increases, the slope of the curve gradually decreases, indicating that the hydrogen permeation rate decreases as the specimen roughness increases. Figure 10f shows that in this set of experimental data, the steady-state current density of hydrogen permeation first decreases and then increases with the increase in the specimen surface roughness. Under steady-state diffusion conditions, the minimum steady-state current density of hydrogen permeation for a specimen with a roughness of 0.245 μm is 7.2 µA/cm2. It can be concluded that a higher Ra value shortens the hydrogen penetration time but reduces the hydrogen permeation rate.
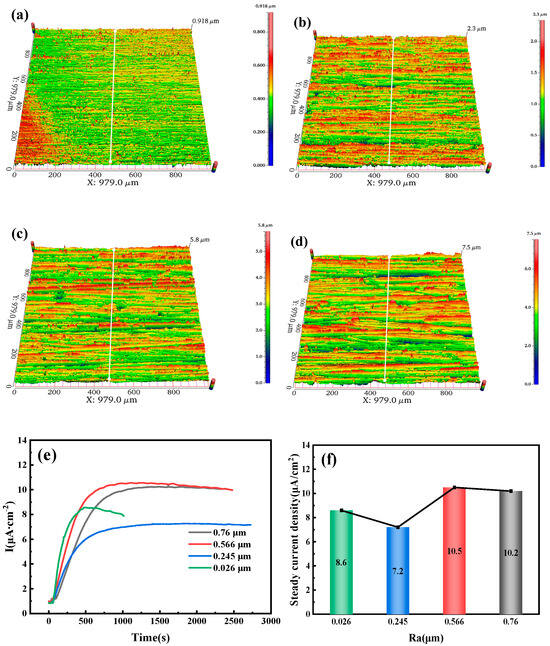
Figure 10.
Three-dimensional surface morphology of test steel with different roughness values: (a) 0.026 µm; (b) 0.245 µm; (c) 0.566 µm; (d) 0.76 µm. (e) Hydrogen diffusion behavior; (f) Steady-state current density.
Figure 11a–d show the three-dimensional morphology of the 7.1 mm test steel, with four specimens having roughness values of 0.048, 0.162, 0.474, and 1.535 μm, respectively. As the roughness increases, the red areas on the surface also expand. When the roughness reaches 1.535 μm, a layered ridge-like appearance with a certain angle in the horizontal direction is observed. Figure 11e,f show the hydrogen permeation curves and steady-state current density of the test steel. Figure 11e indicates that during the initial hydrogen charging phase, the anode quickly detects the oxidation current for the 7.1 mm test steel, taking only a few seconds to do so. The time from the start of hydrogen charging to reaching a steady-state current first decreases and then increases. For roughness values of 0.048, 0.162, 0.474, and 1.535 μm, the times to reach a steady-state current are 202, 164, 179, and 506 s, respectively, indicating that the time to reach steady-state current increases as the Ra increases. Figure 11f shows that as the surface roughness of the specimen increases, the steady-state current density of hydrogen permeation first increases and then decreases. Under steady-state diffusion conditions, the steady-state current density of hydrogen permeation is highest at a roughness value of 0.474 μm, corresponding to a current density of 115.1 µA/cm2, and is lowest at a roughness value of 0.048 μm, corresponding to a current density of 82.4 µA/cm2.
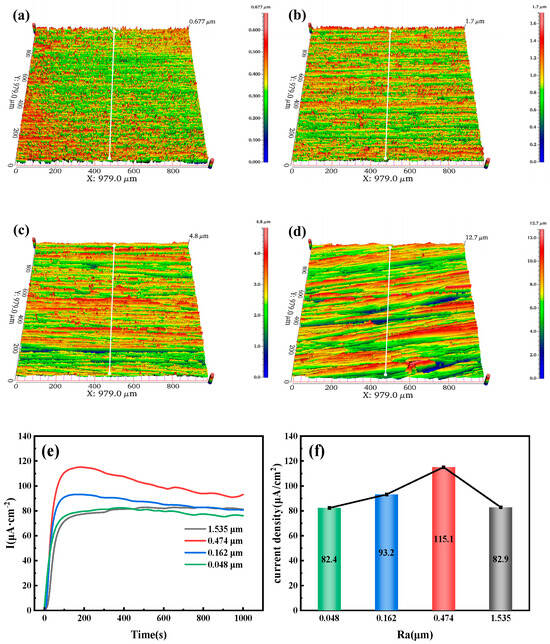
Figure 11.
Three-dimensional surface morphology of test steel with different roughness values: (a) 0.048 µm; (b) 0.162 µm; (c) 0.474 µm; (d) 1.535 µm. (e) Hydrogen diffusion behavior; (f) Steady-state current density.
Figure 12a–d show the three-dimensional morphology of the 6.3 mm test steel, with Ra values of 0.051, 0.238, 0.576, and 0.976 μm. As the surface roughness increases, the red areas on the surface gradually expand. However, when the roughness is 0.576 or 0.238 μm, the red areas partially decrease. Figure 12e,f present the hydrogen permeation curves and steady-state current density of the test steel. Figure 12e indicates that the hydrogen atom penetration time decreases as the surface roughness increases. At a roughness of 0.051 μm, the penetration time is 78 s, while at a roughness of 0.976 μm, the penetration time is only 18 s. Additionally, the time required for hydrogen permeation to reach a steady state from the start of hydrogen charging increases with the increase in roughness. For roughness values of 0.051, 0.238, 0.576, and 0.976 μm, the times to reach a steady-state current are 606, 642, 897, and 996 s, respectively. Figure 12f shows that the steady-state current density of hydrogen permeation first increases and then decreases as the surface roughness of the specimen increases. Under steady-state diffusion conditions, the maximum steady-state current density of hydrogen permeation is 11.8 µA/cm2 at a roughness of 0.283 μm, and the minimum steady-state current density is 8 µA/cm2 at a roughness of 0.051 μm.
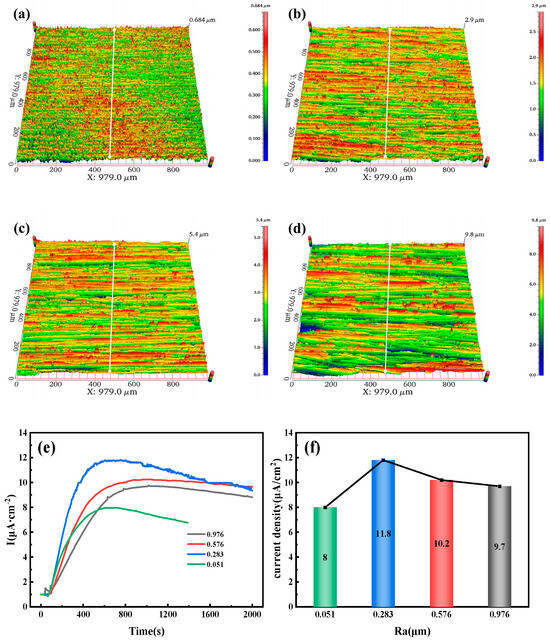
Figure 12.
Three-dimensional surface morphology of test steel with different roughness values: (a) 0.051 µm; (b) 0.293 µm; (c) 0.576 µm; (d) 0.976 µm. (e) Hydrogen diffusion behavior; (f) Steady-state current density.
To further investigate the impact of different roughness levels on hydrogen permeation in the specimens, the hydrogen permeation curves are fitted and calculated to determine the relationship between surface roughness and hydrogen permeation parameters, as shown in Figure 13, Figure 14 and Figure 15. Figure 13 shows that for a 10 mm steel specimen, as the surface roughness increases, the hydrogen diffusion coefficient decreases from 11.6 × 10⁻⁶ cm2/s−1 at an Ra value of 0.026 μm to 3.78 × 10⁻⁶ cm2/s−1 at a roughness value of 0.76 μm, which is halved. Surface roughness can inhibit the hydrogen diffusion process to some extent, primarily due to the influence of surface microstructure characteristics, internal defect density, grain size, and the density of hydrogen capture sites [6]. Conversely, as the surface roughness of the specimen increases, both the lag time of hydrogen permeation and the hydrogen concentration at the cathode side increase. At an Ra value of 0.026 μm, the lag time is only 138 s, while at an Ra value of 0.76 μm, the lag time increases to 424 s. The hydrogen concentration at the cathode side rises from 4.25 × 10⁻⁵ mol/cm−3 at an Ra value of 0.026 μm to 15.6 × 10⁻⁵ mol/cm−3 at an Ra value of 0.76 μm, representing a 2.67-fold increase. It is worth noting that the variation law of the hydrogen diffusion flux and the steady-state current density of hydrogen permeation correspond to each other. When the Ra value is 0.245 μm, the hydrogen diffusion flux is the smallest at 4.25 × 10⁻¹¹ mol·cm−2 s−1; when the Ra value is 0.566 μm, the hydrogen diffusion flux reaches a maximum at 6.17 × 10⁻¹¹ mol·cm−2 s−1.
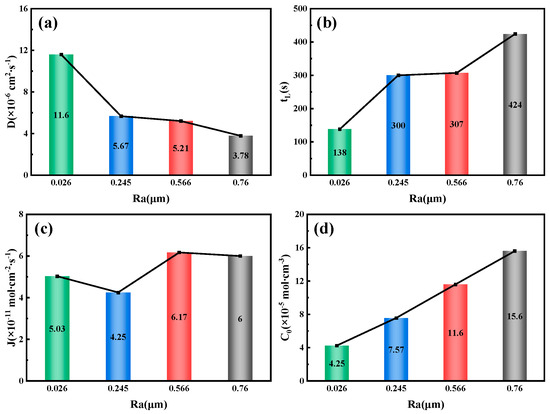
Figure 13.
Related parameters of 10 mm test steel under different roughness conditions. (a) Hydrogen diffusion coefficient; (b) Hydrogen permeation lag time; (c) Hydrogen diffusion flux; (d) Hydrogen concentration on the cathode side.
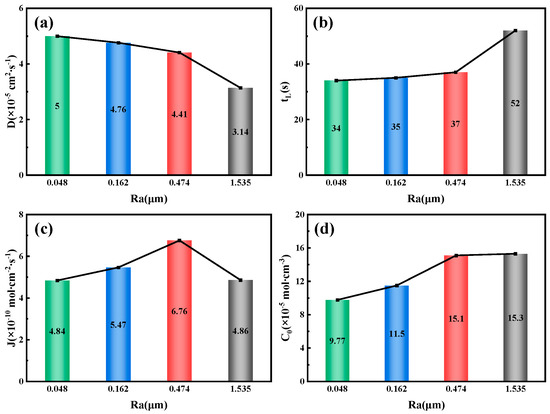
Figure 14.
Related parameters of 7.1 mm test steel under different roughness conditions (a) Hydrogen diffusion coefficient; (b) Hydrogen permeation lag time; (c) Hydrogen diffusion flux; (d) Hydrogen concentration on the cathode side.
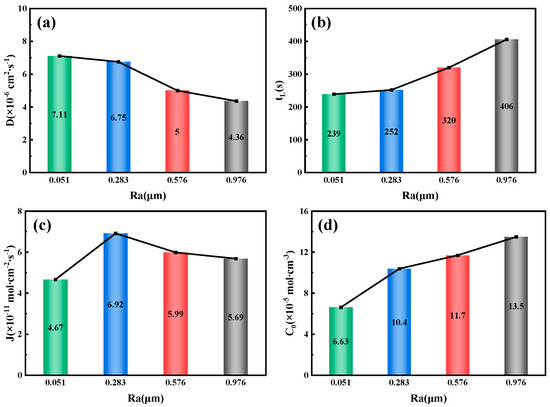
Figure 15.
Related parameters of 6.3 mm test steel under different roughness conditions. (a) Hydrogen diffusion coefficient; (b) Hydrogen permeation lag time; (c) Hydrogen diffusion flux; (d) Hydrogen concentration on the cathode side.
Figure 14 illustrates the relationship between the surface roughness of the 7.1 mm test steel and the parameters related to hydrogen permeation. As the surface roughness increases, the hydrogen diffusion coefficient decreases gradually, from 5 × 10⁻⁵ cm2/s−1 at an Ra value of 0.048 μm to 3.14 × 10⁻⁵ cm2/s−1 at an Ra value of 1.535 μm. Conversely, the lag time for hydrogen permeation and the hydrogen concentration on the cathode side both increase with the surface roughness. The lag time increases from 34 s at an Ra value of 0.048 μm to 52 s at an Ra value of 1.535 μm; the hydrogen concentration on the cathode side rises from 9.77 × 10⁻⁵ mol/cm−3 at an Ra value of 0.048 μm to 15.3 × 10⁻⁵ mol/cm−3 at an Ra value of 1.535 μm. Similarly, the changes in the hydrogen diffusion flux and the hydrogen permeation current density follow a similar pattern, peaking at 6.67 × 10⁻¹⁰ mol/cm−2/s−1 at an Ra value of 0.474 μm.
Figure 15 illustrates the relationship between the surface roughness of the 6.3 mm test steel and the parameters related to hydrogen permeation. The results show that the hydrogen diffusion coefficient decreases as the surface roughness increases, from 7.11 × 10⁻⁶ cm2/s−1 at an Ra value of 0.051 μm to 4.36 × 10⁻⁶ cm2/s−1 at an Ra value of 0.976 μm. Conversely, as the specimen’s surface roughness increases, both the hydrogen permeation lag time and the hydrogen concentration on the cathode side increase. At an Ra value of 0.051 μm, the lag time is 239 s, while at an Ra value of 0.976 μm, it increases to 406 s. The hydrogen concentration on the cathode side also doubles, from 6.63 × 10⁻⁵ mol/cm−3 at an Ra value of 0.051 μm to 13.5 × 10⁻⁵ mol/cm−3 at an Ra value of 0.976 μm. The variation in the hydrogen diffusion flux follows the same pattern as the change in the hydrogen permeation current density, reaching a maximum of 6.92 × 10⁻¹¹ mol/cm−2/s−1 at an Ra value of 0.283 μm.
The results indicate that as the surface roughness of the specimens increases, the hydrogen diffusion coefficients of the three test steels gradually decrease. Meanwhile, the penetration time, lag time, and hydrogen concentration on the cathode side all increase. This suggests that surface roughness has a certain inhibitory effect on the hydrogen diffusion process, with a stronger inhibitory effect as the surface roughness increases. When the surface roughness is high, the specimen surface exhibits more unevenness and microscopic defects, which can impede the penetration of hydrogen atoms. More obstacles and torturous paths increase the difficulty of hydrogen permeation. After hydrogen atoms enter these traps, they are temporarily captured or adsorbed, making it difficult for them to continue to penetrate into the specimen’s depth. The “mountains and valleys” regions of rough surfaces cause hydrogen atoms to accumulate, which hinders further diffusion into the material’s interior, thus inhibiting hydrogen permeation to a certain extent.
In a gaseous environment, for pipeline steel, the rough surface provides more active sites for hydrogen adsorption due to the increase in microscopic peaks and valleys, significantly promoting the dissociative adsorption of hydrogen molecules (H2→2H), increasing the concentration of hydrogen atoms on the surface, and accelerating the penetration of hydrogen into the matrix [33]. In a liquid phase environment, however, the rough surface promotes the recombination of hydrogen atoms (2H→H2), which instead reduces the hydrogen permeation flux. Within a certain range, an increase in surface roughness causes more unevenness and microscopic defects on the sample surface, which makes hydrogen atoms encounter more obstacles and torturous paths during the penetration process, thereby increasing the difficulty of hydrogen penetration. Once hydrogen atoms enter these traps, they are temporarily captured or adsorbed, making it difficult for them to continue penetrating deeper into the sample. The “valley” areas on rough surfaces cause hydrogen atoms to accumulate and make it difficult for them to continue diffusing into the material, thereby inhibiting the penetration of hydrogen to some extent.
Compared to 10 mm and 6.3 mm steel, the hydrogen permeation steady-state current density, hydrogen diffusion coefficient, and hydrogen diffusion flux of the 7.1 mm steel are all one order of magnitude higher. Additionally, the hydrogen atom penetration time and lag time of 7.1 mm steel are significantly shorter compared to those of 10 mm and 6.3 mm steel, indicating that 7.1 mm steel has the poorest hydrogen resistance. For the other two steel thicknesses, a comparison between 10 mm steel with an Ra value of 0.566 μm and 6.3 mm steel with an Ra value of 0.576 μm shows that the latter has a lower hydrogen diffusion coefficient and hydrogen diffusion flux, as well as longer hydrogen atom penetration time and lag time, even when the Ra value is below 0.1 μm. It can be preliminarily concluded that the 6.3 mm-thick steel has the best hydrogen resistance among the three thicknesses, followed by the 10 mm-thick steel, and the 7.1 mm-thick steel has the worst hydrogen resistance.
To intuitively analyze hydrogen penetration behavior, the surface morphology is characterized microscopically. Figure 16 shows the surface morphology and EDS analysis of inclusions after hydrogen penetration tests on 10 mm test steel with varying roughness. The figure indicates that when the Ra value is 0.026 μm, the entire effective contact area of the specimen develops corrosion pits after hydrogen penetration, forming a certain step height relative to the specimen surface. These pits contain numerous hydrogen-induced cracks, mostly at grain boundaries. The reasons for this are as follows: (1) At grain boundaries, the atomic arrangement is irregular, with many defects, such as vacancies and dislocations, which make it easier for hydrogen atoms to accumulate, forming localized high-hydrogen concentration areas. (2) Grain boundaries have higher energy, making the adsorption energy of hydrogen atoms lower, thus facilitating their adsorption and gradual accumulation at these boundaries. (3) When hydrogen atoms accumulate to a certain concentration at grain boundaries, they create hydrogen pressure, leading to changes in the local stress field and a decrease in the bonding force at grain boundaries [7,34,35]. (4) Uneven deformation during processing can lead to residual stresses within the material, which interact with hydrogen, thereby increasing the sensitivity of crack formation at grain boundaries. When the Ra value is 0.245 μm, numerous small corrosion pits and hydrogen-induced cracks form on the specimen surface, with inclusions serving as crack sources, leading to the development of longer and deeper hydrogen-induced cracks. When the Ra value is 0.566 μm, many corrosion pits also appear on the specimen surface, with hydrogen-induced cracks forming around inclusions. Figure 16e,f show the EDS analysis of the inclusions in the yellow boxes of Figure 16b,c, respectively. This figure reveals that all inclusions are Al2O3, which are regions where hydrogen atoms tend to accumulate. In the hydrogen permeation test, hydrogen ions generated by the hydrogen charging chamber accumulate at the tips of Al2O3 inclusions, forming hydrogen molecules [3,4,5,6]. Due to their large size, these hydrogen molecules cannot diffuse between grain boundaries. As hydrogen atoms continue to diffuse, they create significant hydrogen pressure. When this pressure exceeds the tensile strength of the steel, cracks begin to form at this location and extend along the defect [7,34,35]. Therefore, the presence of large Al2O3 inclusions in the steel is a key factor in the formation of cracks. When the Ra value increases to 0.76 μm, numerous small corrosion pits and hydrogen-induced cracks form on the specimen surface, with no large-scale hydrogen-induced cracks observed. Overall, these hydrogen damage patterns are predominantly characterized by cracks, with rare hydrogen bubble formation. This is due to the high concentration of atomic hydrogen within the material. When the hydrogen atom concentration exceeds the critical threshold, it rapidly recombines into hydrogen molecules and escapes from the material surface, forming localized high pressure that directly damages the internal lattice structure and surface integrity of the material, resulting in these corrosion patterns [3,4,5,6].
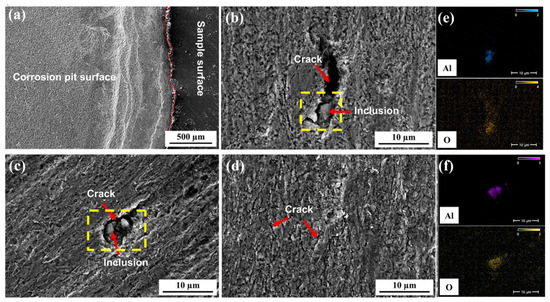
Figure 16.
Surface morphology and EDS of 10 mm test specimens after hydrogen permeation test: (a) 0.026 µm; (b) 0.245 µm; (c) 0.566 µm; (d) 0.76 µm; (e,f) Alumina inclusion.
Figure 17 shows the surface morphology of the 7.1 mm test steel after hydrogen penetration at different Ra values. It is evident that when the Ra value of the specimen is 0.048 μm or 0.162 μm, corrosion pits have formed across the entire effective area of the specimen after hydrogen penetration, creating a step height on the specimen surface. The step height is higher at an Ra value of 0.048 μm, and numerous hydrogen-induced cracks are present in the corrosion pits. When the Ra value of the specimen is 0.474 μm, longer and deeper hydrogen-induced cracks appear on the specimen surface. As the surface roughness increases to 1.535 μm, dense and smaller corrosion pits appear on the specimen surface, with hydrogen-induced cracks forming around inclusions.
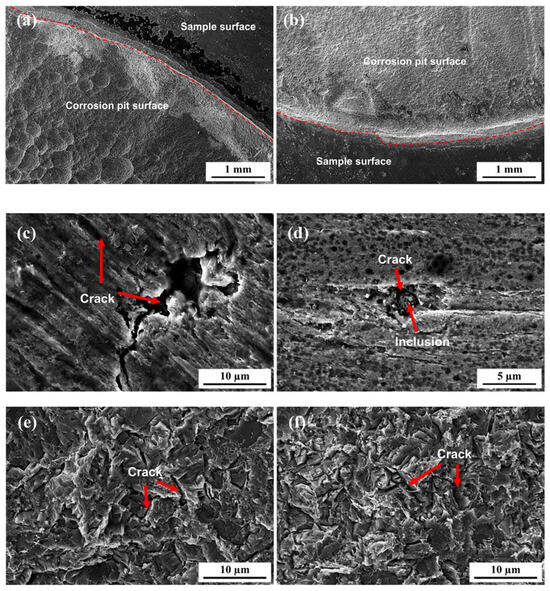
Figure 17.
Surface morphology of 7.1 mm test specimens after hydrogen permeation: (a) 0.048 µm; (b) 0.162 µm; (c) 0.474 µm; (d) 1.535 µm. (e,f) Localized enlarged view of the corrosion pit surface in a and b.
Figure 18 shows the surface morphology of the 6.3 mm test steel after hydrogen penetration at different Ra values. When the Ra value of the specimen surface is 0.051 μm, numerous small corrosion pits and larger pits formed by merging these smaller ones appear on the surface, along with longer and deeper hydrogen-induced cracks. At an Ra value of 0.238 μm, many hydrogen-induced cracks, resulting from the expansion and merging of small secondary cracks, appear on the surface, and hydrogen-induced cracks also form around inclusions. At an Ra value of 0.576 μm, numerous shallow corrosion pits and cracks are observed on the surface. When the surface roughness increases to 0.976 μm, only point corrosion occurs on the surface, with almost no significant changes in the macroscopic morphology, indicating an enhanced resistance to hydrogen.
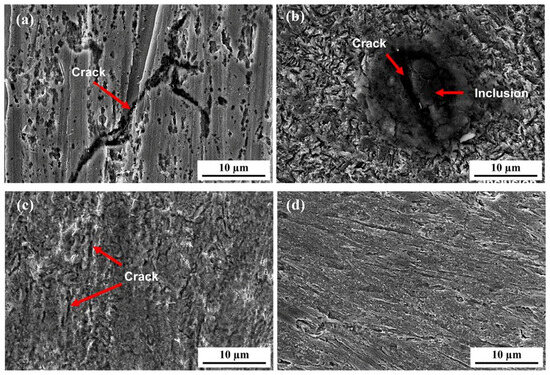
Figure 18.
Surface morphology of 6.3 mm test specimens after hydrogen permeation: (a) 0.051 µm; (b) 0.283 µm; (c) 0.576 µm; (d) 0.976 µm.
The results described above indicate that for the three types of test steels, as the Ra value of the specimen’s surface increases, the degree of corrosion on the surface after hydrogen penetration decreases. This is because a higher Ra value leads to more hydrogen adsorption at surface defects, reducing the amount of hydrogen that penetrates the specimen and lowering the hydrogen diffusion coefficient. Therefore, the surface roughness of the specimen has a certain inhibitory effect on hydrogen diffusion, with a stronger inhibitory effect as the surface roughness increases. The morphology of the hydrogen-filled side shows that the 7.1 mm test steel exhibits the most severe hydrogen corrosion. When the Ra value is 0.162 μm, large corrosion pits form across the entire area, creating a step height relative to the specimen surface. When the Ra value increases to 0.474 μm, significant hydrogen-induced cracks appear. In contrast, the 6.3 mm test steel shows the least hydrogen corrosion. At an Ra value of 0.051 μm, only partial hydrogen-induced cracks are observed. As the Ra value increases, the number of cracks gradually decreases, and at an Ra value of 0.976 μm, only pitting corrosion is observed. This indicates that the 6.3 mm test steel has the best resistance to hydrogen, while the 7.1 mm test steel has the poorest resistance.
3.4. Deuterium Permeation Behavior of Pipeline Steel with Different Thicknesses
Figure 19d shows the ion flow intensity–time curves of deuterium penetration tests on three types of test steel at 350 °C. The results indicate that the ion flow intensity of the three test steels during the deuterium penetration process shows a consistent trend over time. Initially, no ion flow signal is observed as deuterium molecules adsorb onto the surface and gradually penetrate into the specimen. As deuterium atoms are continuously absorbed by defects, they do not penetrate the specimen. After some time, deuterium atoms diffuse through the interstitial positions and recombine into deuterium molecules upon reaching the metal surface, leading to the appearance of ion flow signals [7,34,35]. These signals become more pronounced as the deuterium penetration time increases. When the penetration process reaches equilibrium, the concentration of deuterium atoms in the traps reaches a saturation level. At this point, deuterium atoms continue to diffuse between the traps, maintaining a dynamic equilibrium where the number of deuterium atoms in the traps remains constant. Consequently, newly penetrated deuterium atoms migrate through lattice diffusion to the surface of the specimen’s exudation end and undergo desorption and release. As shown in the figure, the ion flow signals of 10 mm, 7.1 mm, and 6.3 mm test steel began to appear at 103, 46, and 315 s after deuterium charging, respectively. The ion flow intensity stabilizes at 740, 688, and 1314 s in 10 mm, 7.1 mm, and 6.3 mm test steel after deuterium charging, respectively. The 7.1 mm test steel shows the smallest rate of change in ion flow intensity during the deuterium penetration process, as well as the longest time for the appearance of ion flow signals and the stabilization of the ion intensity. In contrast, the 6.3 mm test steel exhibits better deuterium resistance at 350 °C. Subsequently, the permeation flux is calculated by multiplying the ion flow intensity by a coefficient and then integrating it, as shown in Figure 19a–c. It is evident that after 1000 s of deuterium charging, the deuterium flow through the 7.1 mm test steel is the highest, while the deuterium flow through the 6.3 mm test steel is the lowest.
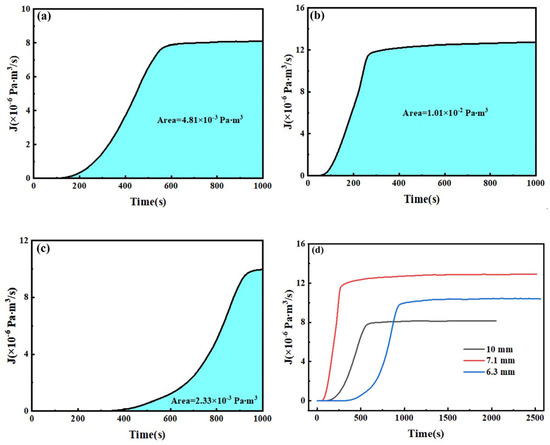
Figure 19.
Ion current intensity–time curves and deuterium flux for three specimens during permeation at 350 °C. (a) 10 mm, (b) 7.1 mm, (c) 6.3 mm, (d) the ion flow intensity–time curves.
According to Figure 19a, the lag times for deuterium penetration in three types of test steel at 350 °C can be calculated, and the diffusion coefficient, D, can be determined using Equation (7). The parameters related to deuterium penetration are listed in Table 5. It is observed that the lag times for the 10 mm, 7.1 mm, and 6.3 mm test steels are 448, 220, and 834 s, respectively, and the diffusion coefficient of the three test steels is 15.7 × 10⁻¹¹, 32.0 × 10⁻¹¹, and 8.4 × 10⁻¹¹ m2/s−1, respectively. This indicates that the 7.1 mm test steel has the shortest penetration and lag time, as well as the highest diffusion coefficient. The 6.3 mm test steel has the longest penetration and lag time, as well as the lowest diffusion coefficient, which is one order of magnitude lower than those of the 10 mm and 7.1 mm test steels.

Table 5.
Parameters of deuterium permeation.
3.5. Deuterium Permeation Behavior of Pipeline Steel Under Different Surface Roughness Conditions
To further investigate the impact of surface roughness on deuterium penetration, a 6.3 mm steel specimen with the best anti-deuterium performance is selected for the deuterium penetration test. Figure 20 shows the three-dimensional morphology of the surface at different Ra values, while Figure 21 presents the ion flow intensity–time curve and the deuterium penetration flux–time curve. The trends in the penetration flux and ion flow intensity over time are consistent. As shown in the figures, the ion flow signals begin to appear in specimens with Ra values of 0.038, 0.101, 0.238, and 0.398 µm after deuterium charging for 46, 62, 41, and 82 s, respectively. The ion flow intensity stabilizes at 688, 973, 1899, and 2054 s, respectively. Thus, as the surface roughness of the specimens increases, the steady-state ion flow intensity during deuterium penetration gradually decreases, indicating a gradual decline in the steady-state deuterium penetration flux. The longer it takes for the ion flow signal and intensity to stabilize, the more significant the inhibitory effect of roughness on deuterium penetration.
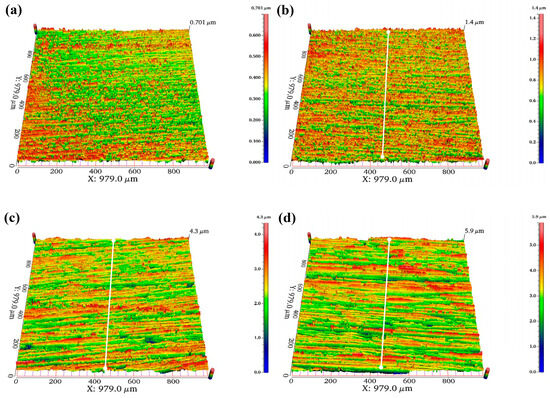
Figure 20.
Surface morphology of 6.3 mm test specimens: (a) 0.038 µm; (b) 0.101 µm; (c) 0.238 µm; (d) 0.398 µm.
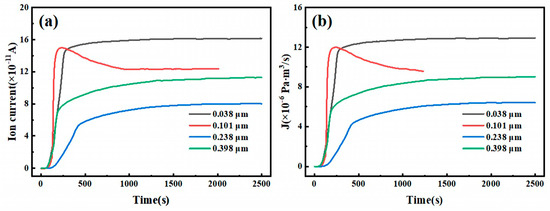
Figure 21.
(a) Ion current intensity–time curves and (b) deuterium permeation flux–time curves of test specimens.
Similarly, based on the figures above, the lag time for deuterium penetration at different Ra values of 6.3 mm test steel at 350 °C can be calculated, and the diffusion coefficient, D, can be determined. Table 6 lists the parameters related to deuterium penetration. The calculation results show that as the surface roughness of the specimen increases, the lag time for deuterium penetration first decreases and then increases, while the deuterium penetration coefficient initially increases and then decreases. When the Ra value is 0.101 µm, the lag time is as short as 139 s, and the deuterium penetration coefficient is as high as 5.1 × 10⁻¹⁰ m2 s−1. However, when the Ra value exceeds 0.101 µm, the lag time increases with increasing surface roughness, and the deuterium penetration coefficient decreases with increasing surface roughness, indicating that roughness has a certain inhibitory effect on deuterium penetration. As shown in the figure, after 1000 s of deuterium injection, all 6.3 mm test steels reached equilibrium. Similarly, the deuterium penetration flux over time is integrated, and the results are shown in Figure 22. As the surface roughness of the specimen increases, the deuterium flow through the specimen gradually decreases after 1000 s of deuterium injection, from 1.01 × 10⁻² Pa·m3 at an Ra value of 0.038 µm to 3.56 × 10⁻³ Pa·m3 at an Ra value of 0.398 µm.

Table 6.
Deuterium permeation-related parameters of 6.3 mm test steels at 350 °C.
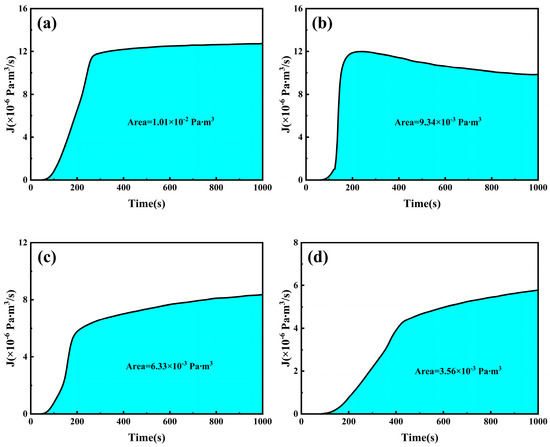
Figure 22.
Deuterium permeation flux of specimens with different surface roughness values: (a) 0.038 µm; (b) 0.101 µm; (c) 0.238 µm; (d) 0.398 µm.
4. Conclusions
- (1)
- As the hydrogen charging current density increases, both the penetration time and the time to reach a steady-state current decrease gradually. The 7.1 mm test steel has the shortest penetration time, while the 6.3 mm test steel has the longest penetration time. For the 6.3 mm steel, at a current density of 0.5 mA/cm2, the penetration time is 1046 s, and it takes 4640 s to reach a steady-state current. The hydrogen diffusion coefficient and diffusion flux of the three types of test steels all increase with the hydrogen charging current density, while the hydrogen diffusion lag time decreases.
- (2)
- As the surface roughness of the specimen increases, the degree of corrosion on the surface after hydrogen penetration decreases, and the hydrogen diffusion coefficient gradually decreases. The penetration time, lag time, and hydrogen concentration on the cathode side all increase, indicating that the increase in surface roughness leads to an increase in hydrogen traps on the sample surface. Once hydrogen atoms enter these traps, they are temporarily captured or adsorbed, making it difficult for them to continue penetrating deeper into the sample and thereby inhibiting the penetration of hydrogen to a certain extent. After hydrogen penetration, numerous hydrogen-induced cracks and corrosion pits appear on the surface. Large-sized inclusions, such as aluminum oxide, can serve as crack sources. The 6.3 mm test steel exhibits good hydrogen resistance. When the surface roughness is 0.576 μm, many shallow corrosion pits and cracks appear. When the surface roughness increases to 0.976 μm, only pit corrosion occurs on the specimen surface.
- (3)
- At 350 °C, the ion flow intensity of the 6.3 mm steel specimen shows the smallest rate of change and the longest time for the ion flow signal and ion intensity to stabilize, with a maximum lag time of 834 s. The deuterium diffusion coefficient is the lowest at 8.44 × 10⁻¹¹ m2·s−1, which is one order of magnitude lower than that of the 10 mm and 7.1 mm specimens. As the surface roughness of the specimens increases, the steady-state ion flow intensity and deuterium permeation flux all gradually decrease, and the required time for the ion flow signal and ion flow intensity to stabilize also increases, indicating that surface roughness exerts a certain inhibiting effect on deuterium permeation.
- (4)
- Based on the research results of this paper, future studies will further use the Hydrogen Microprint Technique (HMT) to conduct in-depth explorations of hydrogen diffusion behavior in hydrogen pipeline steels [36]. By preparing a silver bromide-sensitive layer on the surface of specimens after electrochemical hydrogen charging, the displacement reaction between hydrogen atoms and Ag+ to generate silver particles will be utilized to visually characterize the diffusion paths of hydrogen at grain boundaries, phase interfaces, and defect sites. The focus will be on analyzing the correlation between hydrogen diffusion trajectories and the distribution of corrosion products at different stages of corrosion. Combined with electrochemical impedance spectroscopy and corrosion current density data, the influence mechanism of hydrogen diffusion on corrosion rate will be revealed, and the initiation and propagation laws of hydrogen-induced cracking will be clarified. This will provide microscale experimental evidence for optimizing the hydrogen corrosion resistance of pipeline steels and make up for the deficiency of macroscopic electrochemical tests in analyzing hydrogen migration mechanisms.
Author Contributions
Methodology and software, N.L.; writing—original draft preparation and writing—review and editing, K.J.; investigation and data curation, J.R.; conceptualization and data curation, J.S.; visualization and supervision, X.L.; data curation and funding acquisition, X.T. All authors have read and agreed to the published version of the manuscript.
Funding
This research received no external funding.
Data Availability Statement
The original contributions presented in this study are included in the article. Further inquiries can be directed to the corresponding author.
Conflicts of Interest
Author Ning Liu was employed by the company Hunan Valin Lianyuan Iron and Steel Co., Ltd. The remaining authors declare that the research was conducted in the absence of any commercial or financial relationships that could be construed as a potential conflict of interest.
Nomenclature
| Abbreviation/Symbol | Full Name/Definition | Unit |
| AF | Acicular Ferrite | |
| PF | Polygonal Ferrite | |
| HE | Hydrogen Embrittlement | |
| HIC | Hydrogen Induced Cracking | |
| SSC | Sulfide Stress Cracking | |
| Ra | Surface Roughness (Arithmetic Mean Deviation) | μm |
| D | Hydrogen/Deuterium Diffusion Coefficient | m2·s−1 |
| J | Hydrogen/Deuterium Diffusion Flux | mol·cm−2·s−1 |
| tL | Lag Time | s |
| I∞ | Steady-State Current Density | μ A |
| F | Faraday Constant | C/mol |
| L | Specimen Thickness | mm |
| A | Effective Contact Area | cm2 |
| C0 | Hydrogen Concentration on Cathode Side | mol·cm−3 |
| Jt | Instantaneous Permeation Flux | |
| J∞ | Steady-State Permeation Flux | |
| H2 | Hydrogen Gas | |
| D2 | Deuterium Gas | |
| NaOH | Sodium Hydroxide | mol/L |
| H2SO4 | Sulfuric Acid | mol/L |
| CN4N2S | Thiourea (Poisoning Agent) | g/L |
| SEM | Scanning Electron Microscopy | |
| EDS | Energy Dispersive Spectroscopy |
References
- Jia, X. Research Progress on Hydrogen Embrittlement Behavior of Hydrogenated Natural Gas Transmission Pipelines in Hong Kong. Corros. Prot. 2024, 45, 88–96. [Google Scholar]
- Robertson, I.M.; Sofronis, P.; Nagao, A.; Martin, M.L.; Wang, S.; Gross, D.W.; Nygren, K.E. Hydrogen Embrittlement Understood. Metall. Mater. Trans. A 2015, 46, 2324–2340. [Google Scholar] [CrossRef]
- Zhang, Z.; Wu, Y. Study on hydrogen corrosion behavior of hydrogenation reactor. Inn. Mong. Petrochem. Ind. 2021, 47, 21–24. [Google Scholar]
- Wang, R.; Kang, Y.; Wang, C. Influence of high-temperature hydrogen corrosion on coal gasification plant. Nitrogen Fertil. Technol. 2022, 43, 37–38+45. [Google Scholar]
- Yu, N.; Li, X. Discussion on hazards and countermeasures of boiler hydrogen corrosion. Petrochem. Ind. Appl. 2022, 41, 110–113. [Google Scholar]
- Tan, S.; Luo, B.; Bai, Z.; Wang, S.; Jiang, G. Study on stress corrosion behavior of 7N01 aluminum alloy. Chin. J. Rare Met. 2021, 45, 1162–1170. [Google Scholar]
- He, P.; Zhao, S.; Li, W. Research progress on fatigue damage of pre-charged hydrogen metals. J. Tongji Univ. 2024, 52, 1118–1125. [Google Scholar]
- Kim, K.S.; Kang, J.H.; Kim, S.J. Effect of C–N Interaction on Hydrogen Embrittlement of 15Cr–15Mn–4Ni-Based Austenitic Stainless Steels. Metall. Mater. Trans. A 2021, 52, 4161–4169. [Google Scholar] [CrossRef]
- Wan, H.; Ming, H.; Wang, J.; Hang, E.-H. Study on the effect of O2 and CO doping in H2 on the hydrogen embrittlement sensitivity of X52 pipeline steel. Chin. J. Corros. Prot. 2025, 45, 371–380. [Google Scholar]
- Fe, F.; Wei, R.; Yang, Z.; Feng, M.; Wang, X. Study on hydrogen embrittlement and fatigue properties of X60 pipeline steel in service under hydrogen environment. Mater. Prot. 2025, 58, 147–154. [Google Scholar]
- Wei, R.; Yang, Z.; Chen, Y.; Wang, D.; Wang, J.; Hu, X.; Wang, X. Influence of gas phase impurities on the hydrogen embrittlement sensitivity of L245 pipeline steel in a hydrogen-rich environment. Mech. Pract. 2025, 47, 118–130. [Google Scholar]
- Wu, X.; Wan, H.; Ming, H.; Wang, J.; Ke, W.; Han, E.-H. Influence of in-situ small punch compression rate on hydrogen embrittlement sensitivity of X65 pipeline steel. J. Mater. Res. 2025, 39, 92–102. [Google Scholar]
- GB/T 30074-2013; Method of Measurement of Hydrogen Permeation and Determination of Hydrogen Uptake and Transport in Metals by an Electrochemical Technique. General Administration of Quality Supervision, Inspection and Quarantine of the People’s Republic of China: Beijing, China; Standardization Administration of the People’s Republic of China: Beijing, China, 2014.
- Shen, M.; Yan, C.; Tian, Z.; Wu, C.; Zhou, L.; Zhang, S. Study on hydrogen diffusion behavior of X90 pipeline steel. Electr. Weld. Mach. 2025, 55, 82–88. [Google Scholar]
- Wu, Y. Study on Mechanical Properties of X70 Pipeline Steel in Hydrogen Environment; Yanshan University: Qinhuangdao, China, 2023. [Google Scholar]
- Wu, M. Study on the Effects of Temperature, Pressure and Stress on Corrosion Behavior and Cathodic Protection of X70 Pipeline Steel; Tianjin University: Tianjin, China, 2021. [Google Scholar]
- Chen, K.; Du, Y.; Xu, H.; Lv, L.; Dang, G.; Wang, Y.; Zheng, S. Study on hydrogen permeation behavior and hydrogen embrittlement sensitivity of X80 pipeline steel. J. Chin. Soc. Corros. Prot. 2025, 45, 388–396. [Google Scholar]
- Dai, T.; Zhao, J.; Ge, Z.; Du, Z. First-principles and experimental study on hydrogen atom diffusion behavior in α-iron. Chem. Mach. 2024, 51, 848–853. [Google Scholar]
- Zhou, M. Study on Hydrogen Barrier Coatings Prepared by Electroplating Technology and Their Properties; North China Electric Power University: Beijing, China, 2024. [Google Scholar] [CrossRef]
- Yang, L.; Mi, Z.; Cheng, T.; Cheng, T.; Su, H.; Li, S.; Zhang, G. Microstructure, properties and hydrogen interaction behavior of new steel for high-pressure hydrogen storage vessels. Met. Funct. Mater. 2025, 32, 1–8. [Google Scholar]
- Zhang, H.; Sun, X.; Sun, Y.; Zheng, L. Hydrogen embrittlement behavior of solution-treated 304 austenitic stainless steel. Forg. Stamp. Technol. 2024, 49, 189–201. [Google Scholar]
- Zheng, W.; Wang, Y.; Yu, Y.; Feng, D.; Yu, Z.; Wang, W.; Yan, D.; Yang, J. Effect of hydrogen-induced solid-state phase transformation on mechanical properties of AlCoCrFeNi2.1 eutectic high-entropy alloy. J. Mater. Eng. 2025, 53, 152–159. [Google Scholar]
- Zhao, J.; Xu, G.; Zhang, H.; Xu, G.; Zhang, H.; Li, J.; Lv, R.; Wang, J.; Yan, D. Study on coupling effect of hydrogen embrittlement and corrosion in X80 hydrogen-blended natural gas pipeline. J. Chin. Soc. Corros. Prot. 2025, 45, 407–415. [Google Scholar]
- Liu, L.; Li, J.; Wang, S.; Bao, M. Effects of H2S/CO2 partial pressure ratio and immersion time on structure and properties of corrosion product film of P110SS steel. Mater. Prot. 2020, 53, 30–40. [Google Scholar]
- Meng, F.; Wang, L.; Hong, Z.; Wang, P.; Liu, C.; Liu, Z.; Cao, Q.; Gong, B.; Wang, Y.; Zhang, L.; et al. Control of electrochemical parameters for hydrogen permeation of CLF-1 steel. Fusion Eng. Des. 2024, 163, 108530. [Google Scholar] [CrossRef]
- Liu, T.; Wei, B.; Fu, A.; Su, H.; Chen, T.; Wang, C.; Wang, S. Study on gaseous hydrogen damage of X80 pipeline steel in hydrogen-blended environment. J. Chin. Soc. Corros. Prot. 2025, 45, 423–430. [Google Scholar]
- Chen, Y.; Gong, Z.; Zhang, T.; Xie, J.; Wang, S.; Xu, Y. Design and research on hydrogen diffusion test of Ti/Al dissimilar metal FSW joints. Electr. Weld. Mach. 2022, 52, 99–104. [Google Scholar]
- Liu, F. Preparation and Properties of Silicon-Based Nanosheet Hydrogen Storage Composites; North University of China: Taiyuan, China, 2022. [Google Scholar]
- Nakamura, H.; Isobe, K.; Nakamichi, M.; Yamanishi, T. Evaluation of deuterium permeation reduction factor of various coatings deposited on ferritic/martensitic steels for development of tritium permeation barrier. Fusion Eng. Des. 2010, 85, 1531–1536. [Google Scholar] [CrossRef]
- Fan, D.; Lu, G.; Zhang, G.; Bao, J.; Yang, F.; Xiang, X.; Chen, C. Study on diffusion and penetration of deuterium and tritium in RAFM steel. Acta Metall. Sin. 2018, 54, 519–526. [Google Scholar]
- Sheng, Y. Study on the Effect of Pipeline Steel Surface State on Its Hydrogen Permeation Performance; Chongqing University of Science and Technology: Chongqing, China, 2023. [Google Scholar] [CrossRef]
- Hu, L. Study on Properties of Catalytic Coating for Hydrogen Permeation Sensor; Hunan University: Changsha, China, 2011. [Google Scholar]
- Campari, A.; Konert, F.; Sobol, O.; Alvaro, A. A comparison of vintage and modern X65 pipeline steel using hollow specimen technique for in-situ hydrogen testing. Eng. Fail. Anal. 2024, 163, 108530. [Google Scholar] [CrossRef]
- Li, X.; Huang, W.; Wu, X.; Zhang, J.; Wang, Y.; Akiyama, E.; Hou, D. Effect of hydrogen charging time on hydrogen blister and hydrogen-induced cracking of pure iron. Corros. Sci. 2021, 181, 109200. [Google Scholar] [CrossRef]
- Xie, D.; Wang, Z.; Sun, J.; Li, J.; Ma, E.; Shan, Z.-W. In situ study of the initiation of hydrogen bubbles at the aluminium metal/oxide interface. Nat. Mater. 2015, 14, 899–903. [Google Scholar] [CrossRef]
- Thomas, A.; Szpunar, J.A. Investigation of hydrogen diffusion and accumulation in X70 pipeline steel. Int. J. Hydrogen Energy 2020, 45, 2390–2404. [Google Scholar] [CrossRef]
Disclaimer/Publisher’s Note: The statements, opinions and data contained in all publications are solely those of the individual author(s) and contributor(s) and not of MDPI and/or the editor(s). MDPI and/or the editor(s) disclaim responsibility for any injury to people or property resulting from any ideas, methods, instructions or products referred to in the content. |
© 2025 by the authors. Licensee MDPI, Basel, Switzerland. This article is an open access article distributed under the terms and conditions of the Creative Commons Attribution (CC BY) license (https://creativecommons.org/licenses/by/4.0/).