Article

Dispersion of TiB2 Particles in Al–Ni–Sc–Zr System Under Rapid Solidification

1
AVIC Chengdu Aircraft Industrial (Group) Co., Ltd., Chengdu 610073, China
2
School of Materials Science & Engineering, Shanghai Jiao Tong University, Shanghai 200240, China
3
SJTU Paris Elite Institute of Technology, Shanghai Jiao Tong University, Shanghai 200240, China
*
Author to whom correspondence should be addressed.
These authors contributed equally to this work.
Metals 2025, 15(8), 872; https://doi.org/10.3390/met15080872 (registering DOI)
Submission received: 17 June 2025 / Revised: 31 July 2025 / Accepted: 1 August 2025 / Published: 4 August 2025

Abstract

The dispersion behavior of ceramic particles in aluminum alloys during rapid solidification critically affects the resulting microstructure and mechanical performance. In this study, we investigated the nucleation and growth of Al3(Sc,Zr) on TiB2 surfaces in a 2TiB2/Al–8Ni–0.6Sc–0.1Zr alloy, fabricated via wedge-shaped copper mold casting and laser surface remelting. Thermodynamic calculations were employed to optimize alloy composition, ensuring sufficient nucleation driving force under rapid solidification conditions. The results show that the formation of Al3(Sc,Zr)/TiB2 composite interfaces is highly dependent on cooling rate and plays a pivotal role in promoting uniform TiB2 dispersion. At an optimal cooling rate (~1200 °C/s), Al3(Sc,Zr) nucleates heterogeneously on TiB2, forming core–shell structures and enhancing particle engulfment into the α-Al matrix. Orientation relationship analysis reveals a preferred (111)α-Al//(0001)TiB2 alignment in Sc/Zr-containing samples. A classical nucleation model quantitatively explains the observed trends and reveals the critical cooling-rate window for composite interface formation. This work provides a mechanistic foundation for designing high-performance aluminum-based composites with uniformly dispersed reinforcements for additive manufacturing applications.

1. Introduction

Ceramic particles such as TiB2, TiC, Al2O3, and Y2O3 are instrumental in refining the solidification microstructure of aluminum alloys [1,2]. Compared to the individual addition of M elements or ceramic particles, the simultaneous incorporation of both (e.g., Sc and Zr as M elements, and TiB2 as the ceramic phase) offers three distinct advantages. First, TiB2 exhibits high chemical stability in liquid Al, and its high volume fraction ensures an adequate number of nucleation sites to promote the columnar-to-equiaxed grain transition during rapid solidification. Second, the formation of intermediate Al3(Sc,Zr) phases significantly enhances the nucleation potency of TiB2 particles, potentially reducing the lattice mismatch at the TiB2/α-Al interface from 4.22% to as low as 1% [3,4]. Third, TiB2 promotes the precipitation of Al3(Sc,Zr) by lowering its nucleation barrier and incubation time, thereby enhancing the grain refinement efficiency of Sc/Zr under rapid solidification conditions. Additionally, the low-mismatch TiB2/α-Al interface facilitates the incorporation of TiB2 particles into the growing α-Al grains, thereby mitigating their agglomeration at grain boundaries. If the heterogeneous nucleation rate of Al3(Sc,Zr) is sufficiently high while its growth is effectively suppressed, these intermetallics may uniformly encapsulate TiB2 particles. The nucleation and growth behavior of Al3(Sc,Zr) is strongly influenced by the concentrations of Sc and Zr, as well as the applied cooling rate [5,6].
In this study, the Al–Ni system was chosen as the base alloy due to its widely recognized potential for enhancing mechanical properties over a wide temperature range [7]. Al-Ni alloys, particularly those containing high Ni content, derive significant strengthening from the in situ formation of stable Al3Ni intermetallic phases during solidification [8]. This endows them with promising room-temperature strength and, critically, good elevated-temperature properties, making them attractive candidates for structural applications demanding thermal stability, such as components in aerospace or automotive sectors [9,10]. However, a significant challenge hindering the wider utilization of these alloys, especially in near-net-shape manufacturing processes like laser powder bed fusion (LPBF), is their inherent solidification behavior under rapid cooling conditions. Rapid solidification of Al-Ni alloys often results in the development of highly directional, coarse columnar grain structures [11]. This pronounced columnar grain growth leads to marked anisotropy in mechanical properties, meaning the material’s performance (e.g., strength, ductility) varies significantly depending on the direction relative to the solidification direction. Such anisotropy is undesirable as it can compromise the structural integrity and reliability of fabricated parts [12,13]. Consequently, for effectively controlling the solidification microstructure to suppress columnar growth and promote a more uniform, equiaxed grain morphology remains a critical research gap for realizing the full potential of high-performance Al-Ni based alloys in advanced manufacturing. Building upon our prior work in a 5TiB2/Al-4.5Mg-0.7Sc-0.2Zr model system [14], where precise cooling-rate control (~1000 °C/s) enabled the formation of a coherent 10–30 nm Al3(Sc,Zr) 3DC interphase at TiB2/α-Al interfaces, reducing lattice mismatch to <1%, the present study extends this interfacial design strategy to Al-Ni alloys. The established principle that critical cooling rates govern the transition between strained 2DCs and coherent 3DCs directly informs our investigation of TiB2/Al3(Sc,Zr) nucleation kinetics in the Al-8Ni matrix. Specifically, we probe whether Ni’s influence on liquidus depression and atomic diffusion modifies the optimal cooling window (previously~1000 °C/s for Al-Mg) needed to achieve low-misfit multi-structural interfaces under rapid solidification.
This study investigated the heterogeneous nucleation and growth of Al3(Sc,Zr) at the TiB2 interface under rapid solidification conditions and evaluated the effect of the Al3(Sc,Zr)/TiB2 composite interface on TiB2 particle dispersion. Based on the Al–Ni system, a model alloy (2TiB2/Al–8Ni–0.6Sc–0.1Zr) was designed through thermodynamic calculations to facilitate the formation of such composite interfaces. Subsequently, both 2TiB2/Al–8Ni–0.6Sc–0.1Zr and 2TiB2/Al–8Ni alloys were fabricated via wedge-shaped copper mold casting and laser surface remelting to examine the nucleation and growth kinetics of Al3(Sc,Zr) on TiB2 surfaces in the 2TiB2/Al–8Ni–0.6Sc–0.1Zr system. Finally, the mechanism by which the Al3(Sc,Zr)/TiB2 interface promotes TiB2 dispersion was systematically analyzed.

2. Materials Design

Figure 1 shows the Al-rich end of the Al–xSc–yZr system, where the ratio of Sc to Zr is fixed at 3:1. All compositions in this work are given in mass fractions unless otherwise stated. The contour lines demonstrate the driving force for Al3(Sc,Zr) precipitation from the undercooled melt. Under equilibrium solidification conditions, the precipitation of the Al3(Sc,Zr) phase must occur before the formation of α-Al (660 °C), which requires the total content of Sc and Zr to exceed 0.03 wt.%. Under rapid solidification, however, the solute trapping effect [14,15,16] markedly increases the solubility of Sc and Zr in the α-Al matrix, thereby necessitating a higher overall concentration of these elements for Al3(Sc,Zr) precipitation. A key prerequisite for achieving uniform encapsulation of each TiB2 particle by Al3(Sc,Zr) is an elevated heterogeneous nucleation rate of the intermetallic phase on the TiB2 substrate. According to classical nucleation theory [5], the intrinsic factors governing the nucleation rate of Al3(Sc,Zr) include the volumetric driving force, interfacial energy, and solute diffusivity. Among these, the driving force is the primary controlling factor when varying the Sc and Zr concentrations in the melt. Specifically, when the total Sc and Zr content increases from 0.3 wt.% to 0.9 wt.%, the nucleation driving force for Al3(Sc,Zr) in a supersaturated Al–Sc–Zr melt (undercooled to 800 °C) increases sevenfold from 500 J/mol to 3500 J/mol, as depicted in Figure 1. Therefore, under rapid solidification conditions, a practical and efficient strategy for ensuring the formation of sufficient Al3(Sc,Zr) to encapsulate TiB2 particles is to increase the Sc and Zr content in the melt.
Another essential prerequisite for the encapsulation of TiB2 particles by Al3(Sc,Zr) is the complete dissolution of Sc and Zr atoms in the melt prior to solidification. If not achieved, these atoms will preferentially precipitate onto existing Al3(Sc,Zr) particles, consuming the available Sc and Zr in the melt and leading to the formation of coarse primary Al3(Sc,Zr) phases. Therefore, for a given alloy composition, the casting temperature of the melt must exceed the melting point of the Al3(Sc,Zr) phase. In conventional casting processes, to minimize elemental evaporation and burn-off, the casting temperature is typically limited to temperatures below 1000 °C. This study adheres to this limitation to guide the selection of Sc and Zr content. Given the high mechanical performance of LPBF Al–Ni-Sc-Zr alloys [17], the 2TiB2/Al–8Ni–Sc–Zr system is selected to investigate the proposed strategy for enhancing performance. High-throughput calculations of nucleation driving force and solidification path (based on the Scheil model) were conducted to determine the optimal Sc and Zr concentrations. These calculations were performed using CALPHAD (CALculation of PHAse Diagram) method in conjunction with a thermodynamic database of the Al–Ni–Sc–Zr–Ti–B system established by this work (see Section 3). The liquid phase and the relevant MB2 (M = Ti, Sc, Zr) compounds were set as active, while the competing L12 variants, including Al3(Sc,Zr), Al3(Zr,Sc), Al75Sc16Zr9 (τ1), and Al75Sc10Zr15 (τ2), were suppressed, thereby yielding the nucleation driving force envelope for the L12 phases (Figure 2a). For the specific melt, only Zr-stabilized L12-Al3Sc was treated as dormant to match the observed precipitation of Al3(Sc,Zr) phases on TiB2 particles [14]. Figure 2a illustrates the nucleation driving forces of the L12 phases from supersaturated melts at 600 °C, whereas Figure 2b presents a contour map of their dissolution temperatures. Unlike the Al–Mg database used in prior work [14], this database explicitly parameterizes the strong Ni–Sc and Ni–Zr interactions critical to the Al-8Ni matrix. The calculated liquidus projection (Figure 2a) and 600 °C isothermal section (Figure 2b) reveal that Ni (i) expands the nucleation temperature window for L12-Al3(Sc,Zr) by approximately 15 °C (890–905 °C vs. 733–890 °C in Al–Mg), extending the integration bounds in Equations (4) and (5); and (ii) reduces the maximum thermodynamic driving force (ΔGᵥ) for nucleation by ~12% at equivalent undercoolings, thereby directly impacting the nucleation-rate integrals defined in Section 4. These quantitative distinctions—inaccessible with Mg-system databases—directly perturb nucleation kinetics and necessitate model recalibration for Ni-dominated alloys.
Although adding equal amounts of Sc and Zr most effectively enhances the precipitation driving force of the Al3(Sc,Zr) phase, this strategy also substantially raises its melting temperature with increasing solute content. For instance, when both Sc and Zr are set at 0.4 wt.%, the melting point of Al3(Sc,Zr) increases to approximately 1010 °C (Figure 2b), which exceeds the practical limits of conventional aluminum alloy processing. Moreover, at equal Sc and Zr concentrations, multiple Al3(Sc,Zr) sub-phases, such as Al75Sc10Zr15 (τ2) and Al75Sc16Zr9 (τ1), are likely to form in the melt, complicating phase identification and analysis. To balance the requirements of maintaining a sufficiently high precipitation driving force, controlling the melt casting temperature, and minimizing compositional complexity, this study adopts a target composition of 0.6 wt.% Sc and 0.1 wt.% Zr.

3. Materials and Methods

3.1. Materials Fabrication

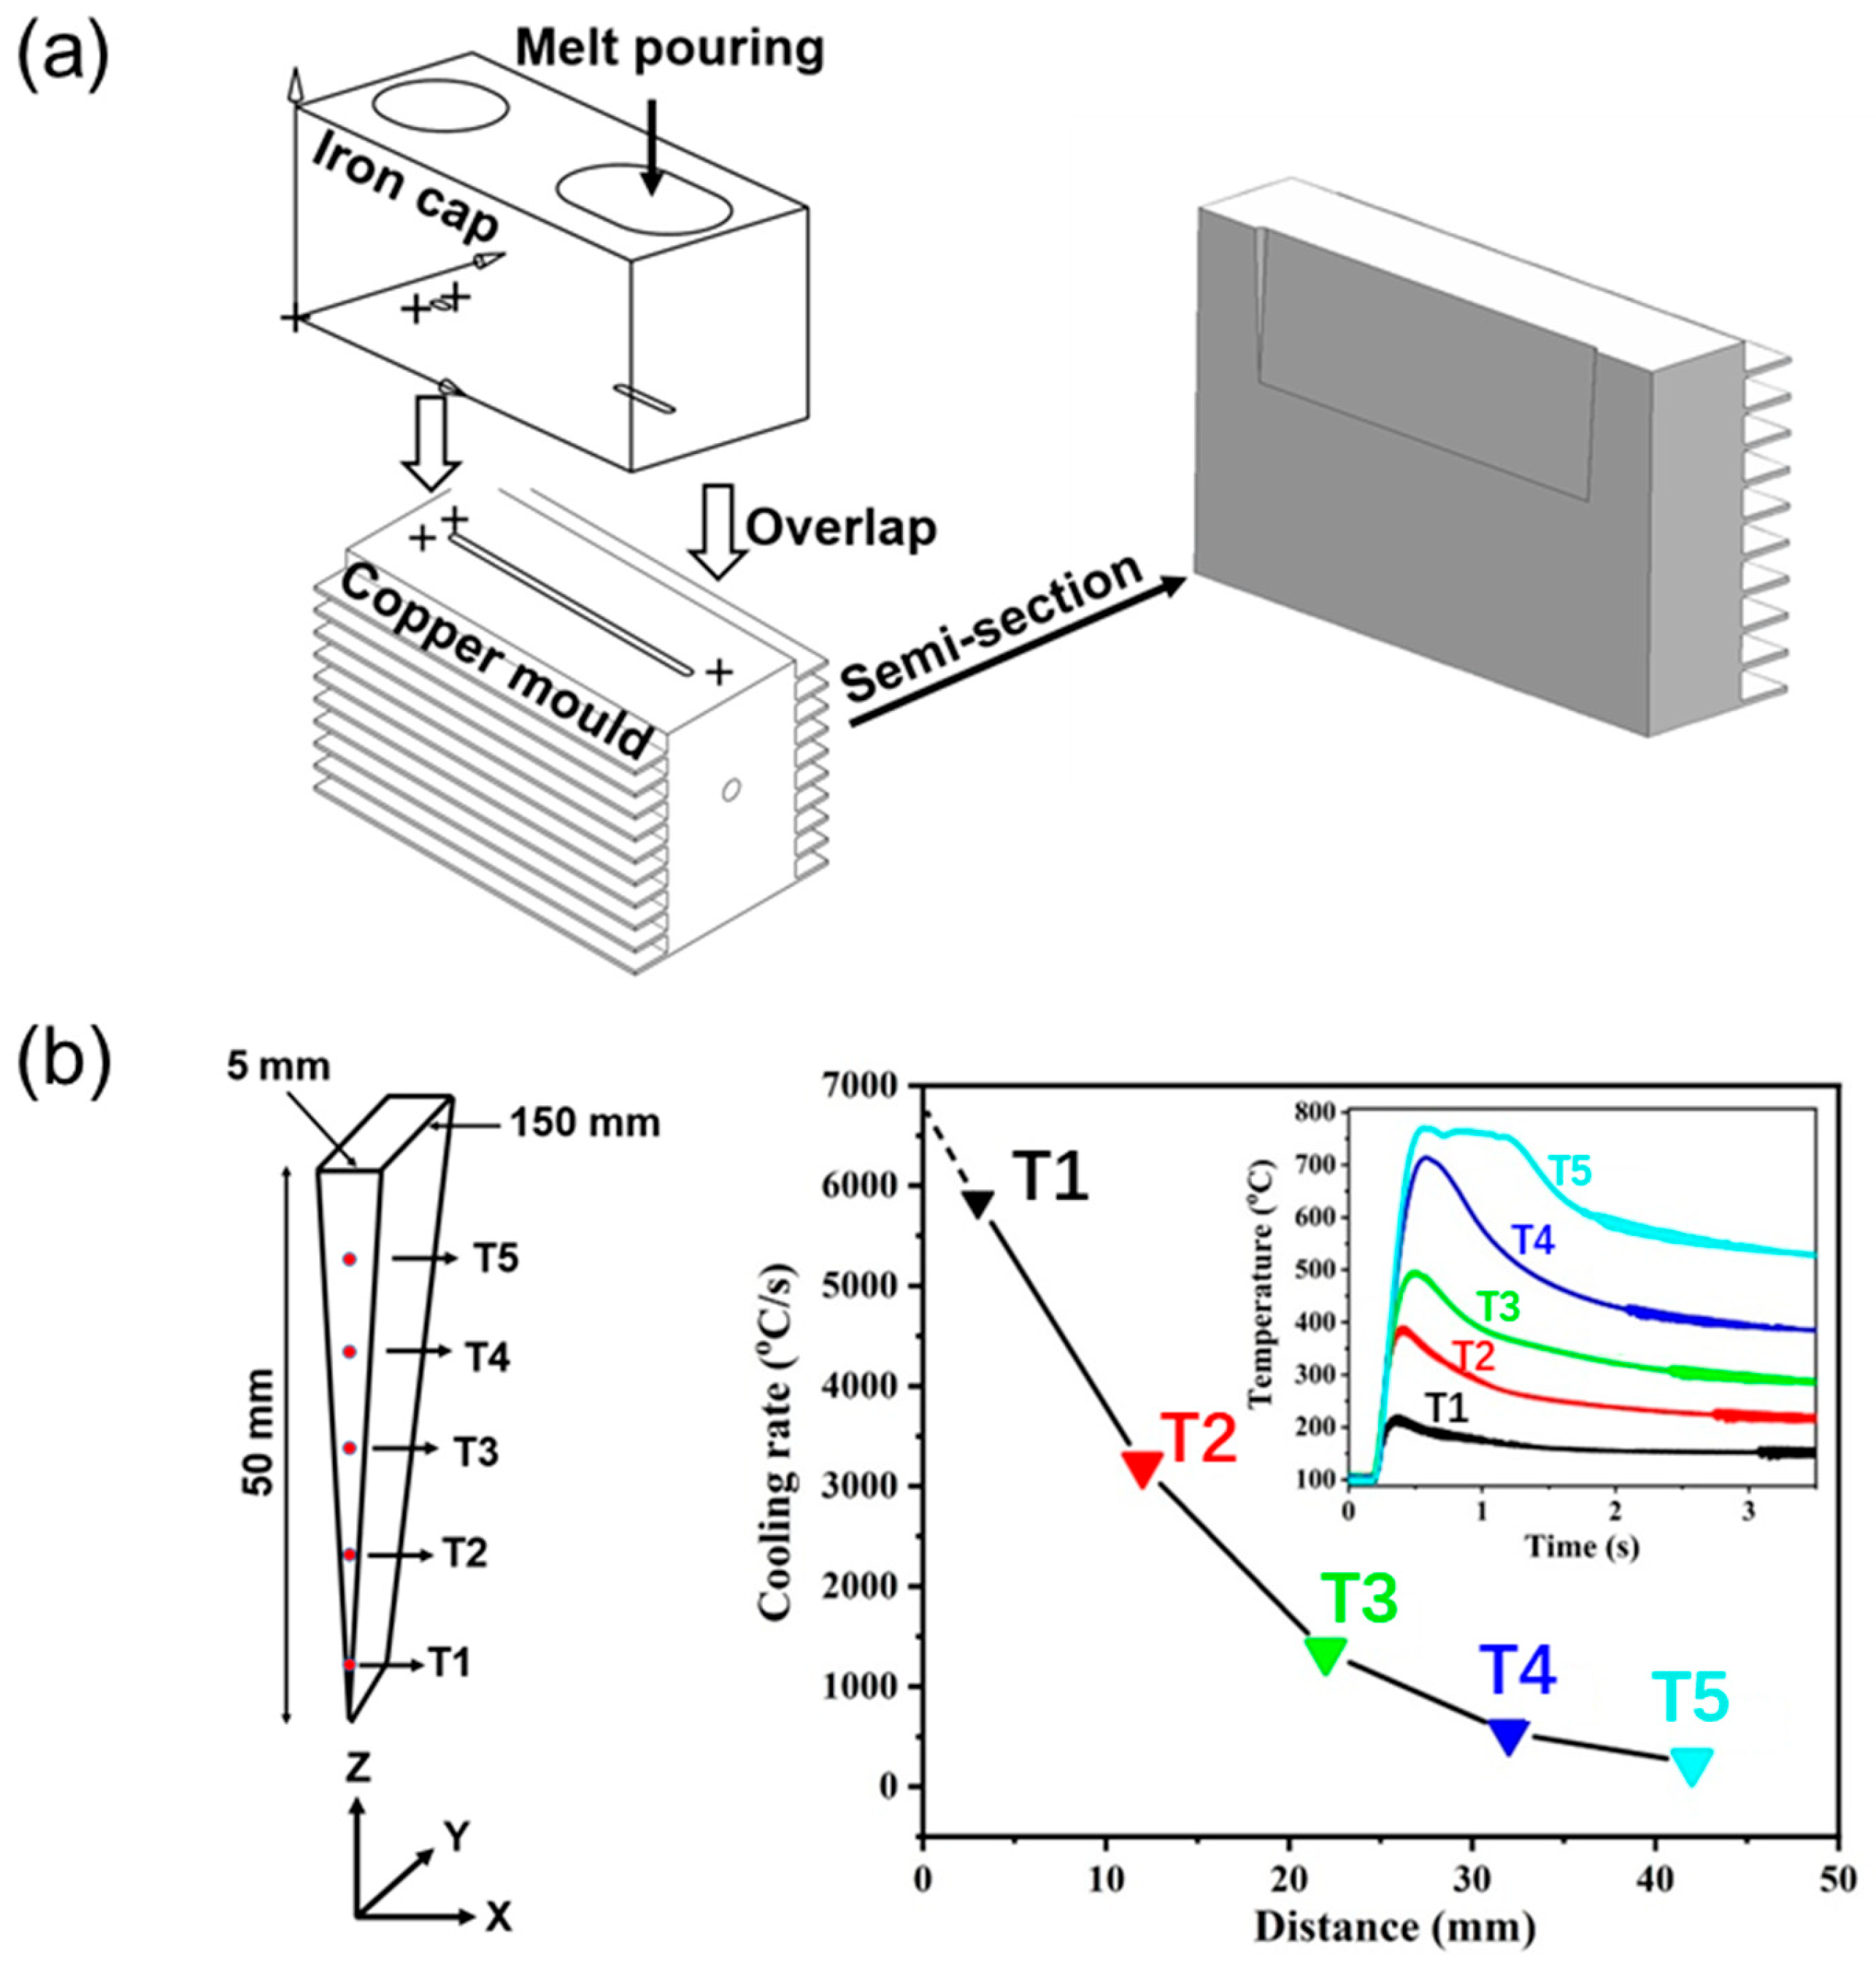
A 2TiB2/Al–8Ni–0.6Sc–0.1Zr ingot was fabricated in a custom-designed wedge-shaped copper mold (Figure 3a). To measure the cooling rates at different positions within the wedge-shaped copper mold, K-type thermocouples were placed at the center of each section at heights of 42 mm, 32 mm, 22 mm, 12 mm, and 2 mm, as shown in Figure 3b. Data were collected at a frequency of 50 Hz. The measured cooling rates were then fitted to reflect the continuous variation of cooling rates across all regions. The raw materials included high-purity aluminum (>99.999%), an Al–10Ni master alloy, and an Al–11.8TiB2 master alloy [17,18]. The preparation process was as follows: (1) The raw materials were weighed and thoroughly dried; (2) a graphite crucible was used for melting; (3) the crucible was internally cleaned, preheated, and coated with boron nitride; (4) the crucible was charged with high-purity aluminium (base layer), Al–10 Ni master alloy, Al–11.8 TiB2 master alloy, Al–2 wt % Sc master alloy and Al–10 wt % Zr master alloy; the charge was pre-mixed to ensure macroscopic homogeneity; (5) the furnace was heated to 970 °C and held for 10 min to guarantee complete dissolution of all master alloys and to eliminate undissolved Sc/Zr-rich phases. After full melting, the melt was mechanically stirred with a graphite rod and skimmed; (6) a fluxing agent (Foseco) was added to the melt surface, followed by refining with a graphite bell jar for 3 min, maintaining the melt at 750 °C; (7) the crucible was transferred to a vacuum furnace preheated to 760 °C, where vacuum degassing was conducted for 10 min. Simultaneously, the copper and graphite molds were preheated to 150 °C; (8) after degassing, residual slag was removed. When the melt temperature stabilized at 740 ± 5 °C, it was poured into the wedge mold, and the remaining melt was cast into a cylindrical graphite mold (30 mm in diameter). The ingots were allowed to cool naturally after complete solidification. The chemical composition of the resulting 2TiB2/Al–8Ni–0.6Sc–0.1Zr alloy was analyzed using an iCAP 6300 inductively coupled plasma optical emission spectrometer (ICP-OES) from Thermo Fisher Scientific (Waltham, MA, USA). The analysis was conducted with a detection limit of 0.1 mg/kg and an upper limit of 20%. The results are summarized in Table 1.
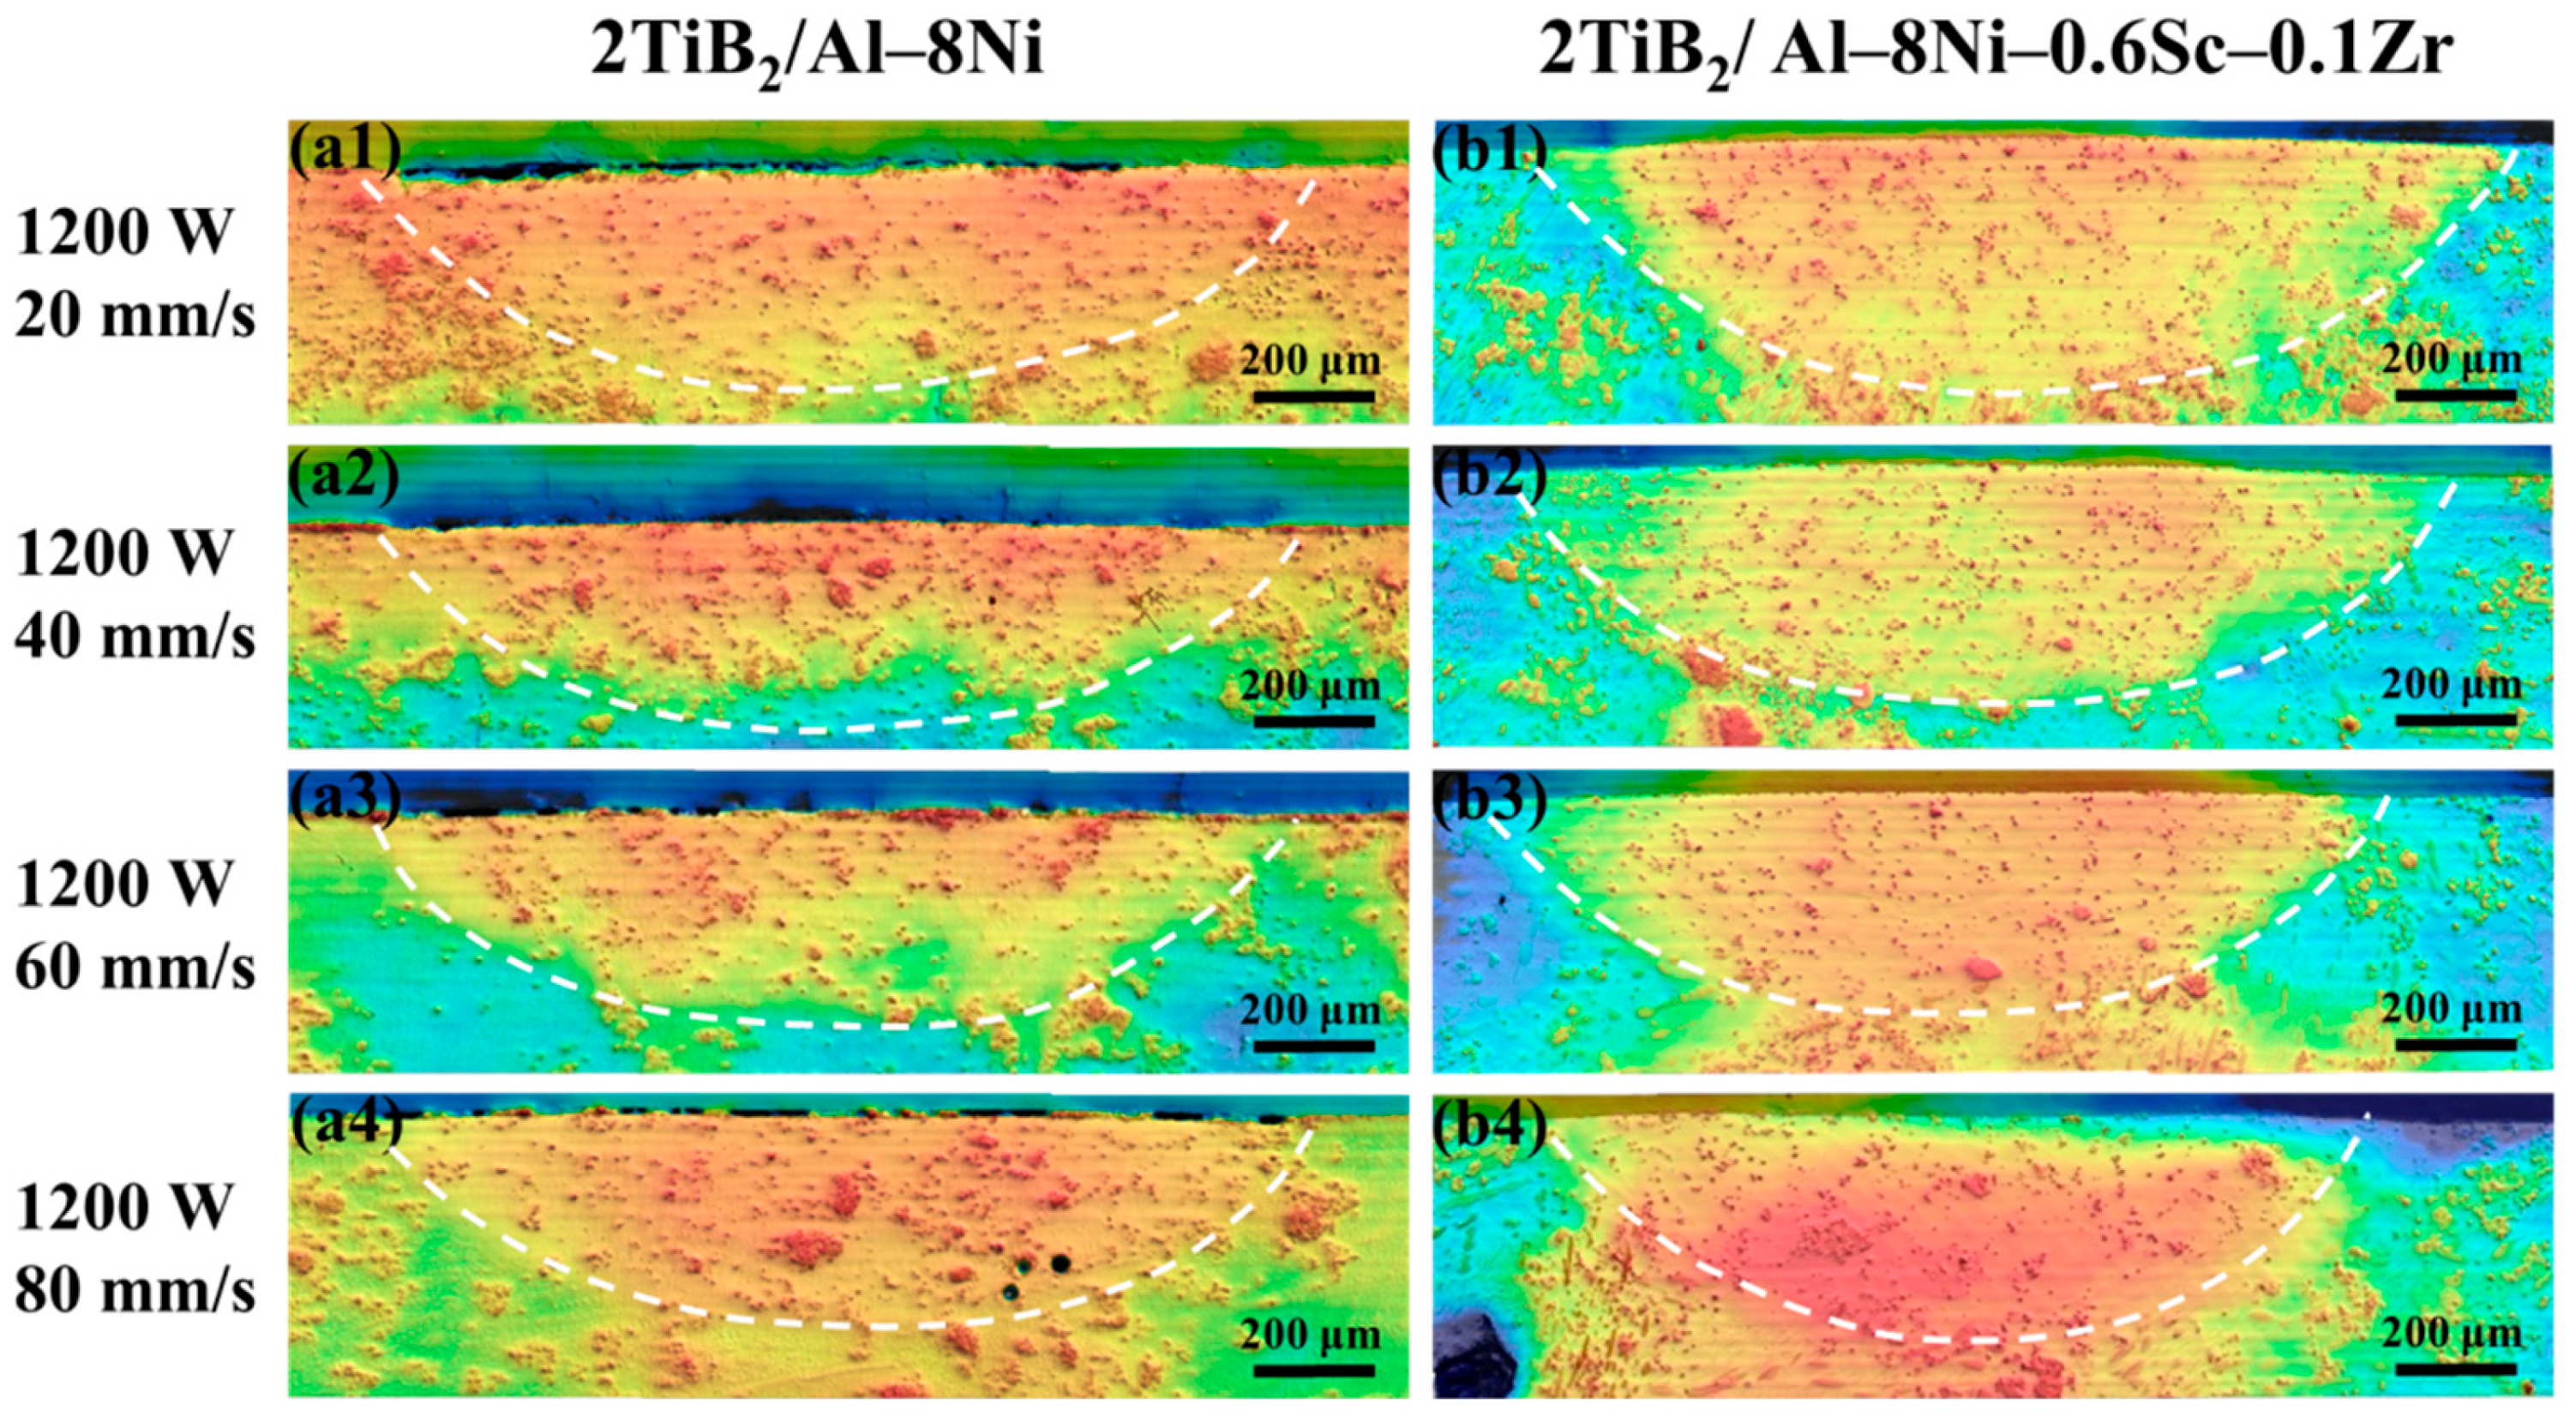
The cylindrical ingots were machined into substrates with a diameter of 30 mm and a thickness of 1 cm for subsequent laser-directed energy deposition (L-DED) single-track remelting experiments. The laser power was fixed at 1200 W, and the scanning speeds were set to 20, 40, 60, and 80 mm/s. All experiments were conducted in an argon-shielded atmosphere.

3.2. Characterization Methods

A TESCAN MAIA3 scanning electron microscope (SEM, Brno, Czech Republic) was used to observe the microstructures. Depending on the specific requirements, secondary electron (SE) and backscattered electron (BSE) modes were employed. Energy-dispersive X-ray spectroscopy (EDS), electron backscatter diffraction (EBSD), and transmission Kikuchi diffraction (TKD) were used to determine elemental distributions and crystallographic features. Samples for SEM were prepared using standard metallographic polishing procedures. EBSD samples underwent additional surface preparation via ion polishing using a Leica EM TIC 3X triple ion beam system with the following settings: 5 kV, 10.5°, 20 min; 4.5 kV, 4.5°, 45 min; 3.5 kV, 4.5°, 15 min. TKD specimens were prepared as thin films using focused ion beam (FIB) milling. SEM imaging was conducted at an accelerating voltage of 10–20 kV and a working distance of 5–10 mm, while EBSD and TKD were performed at 20 kV and a working distance of 15–20 mm. EBSD/TKD data were processed using AZtecCrystal 2.1 software (Oxford, UK). Surface morphologies were also reconstructed in 3D using a VK-X3000 laser scanning confocal microscope (LSCM).

3.3. Thermodynamic Calculation

Phase equilibria and solidification paths for the Al–Ni–Sc–Zr–Ti–B system were calculated using the Pandat2023 software (CompuTherm LLC, USA) [19,20], employing a high-throughput approach. The thermodynamic data were derived from binary and ternary subsystems, including Al–Ni [21], Al–Sc [22], Ni–Sc [23,24], Al–Zr [25], Ni–Zr [26], Sc–B [27], Ni–Al–B [28], Al–Sc–Zr [29], Al–Ni–Sc [30,31], Al–Ni–Zr [32], and Al–Ti–B [33].

4. Results

4.1. Microstructure of Wedge-Cast Samples

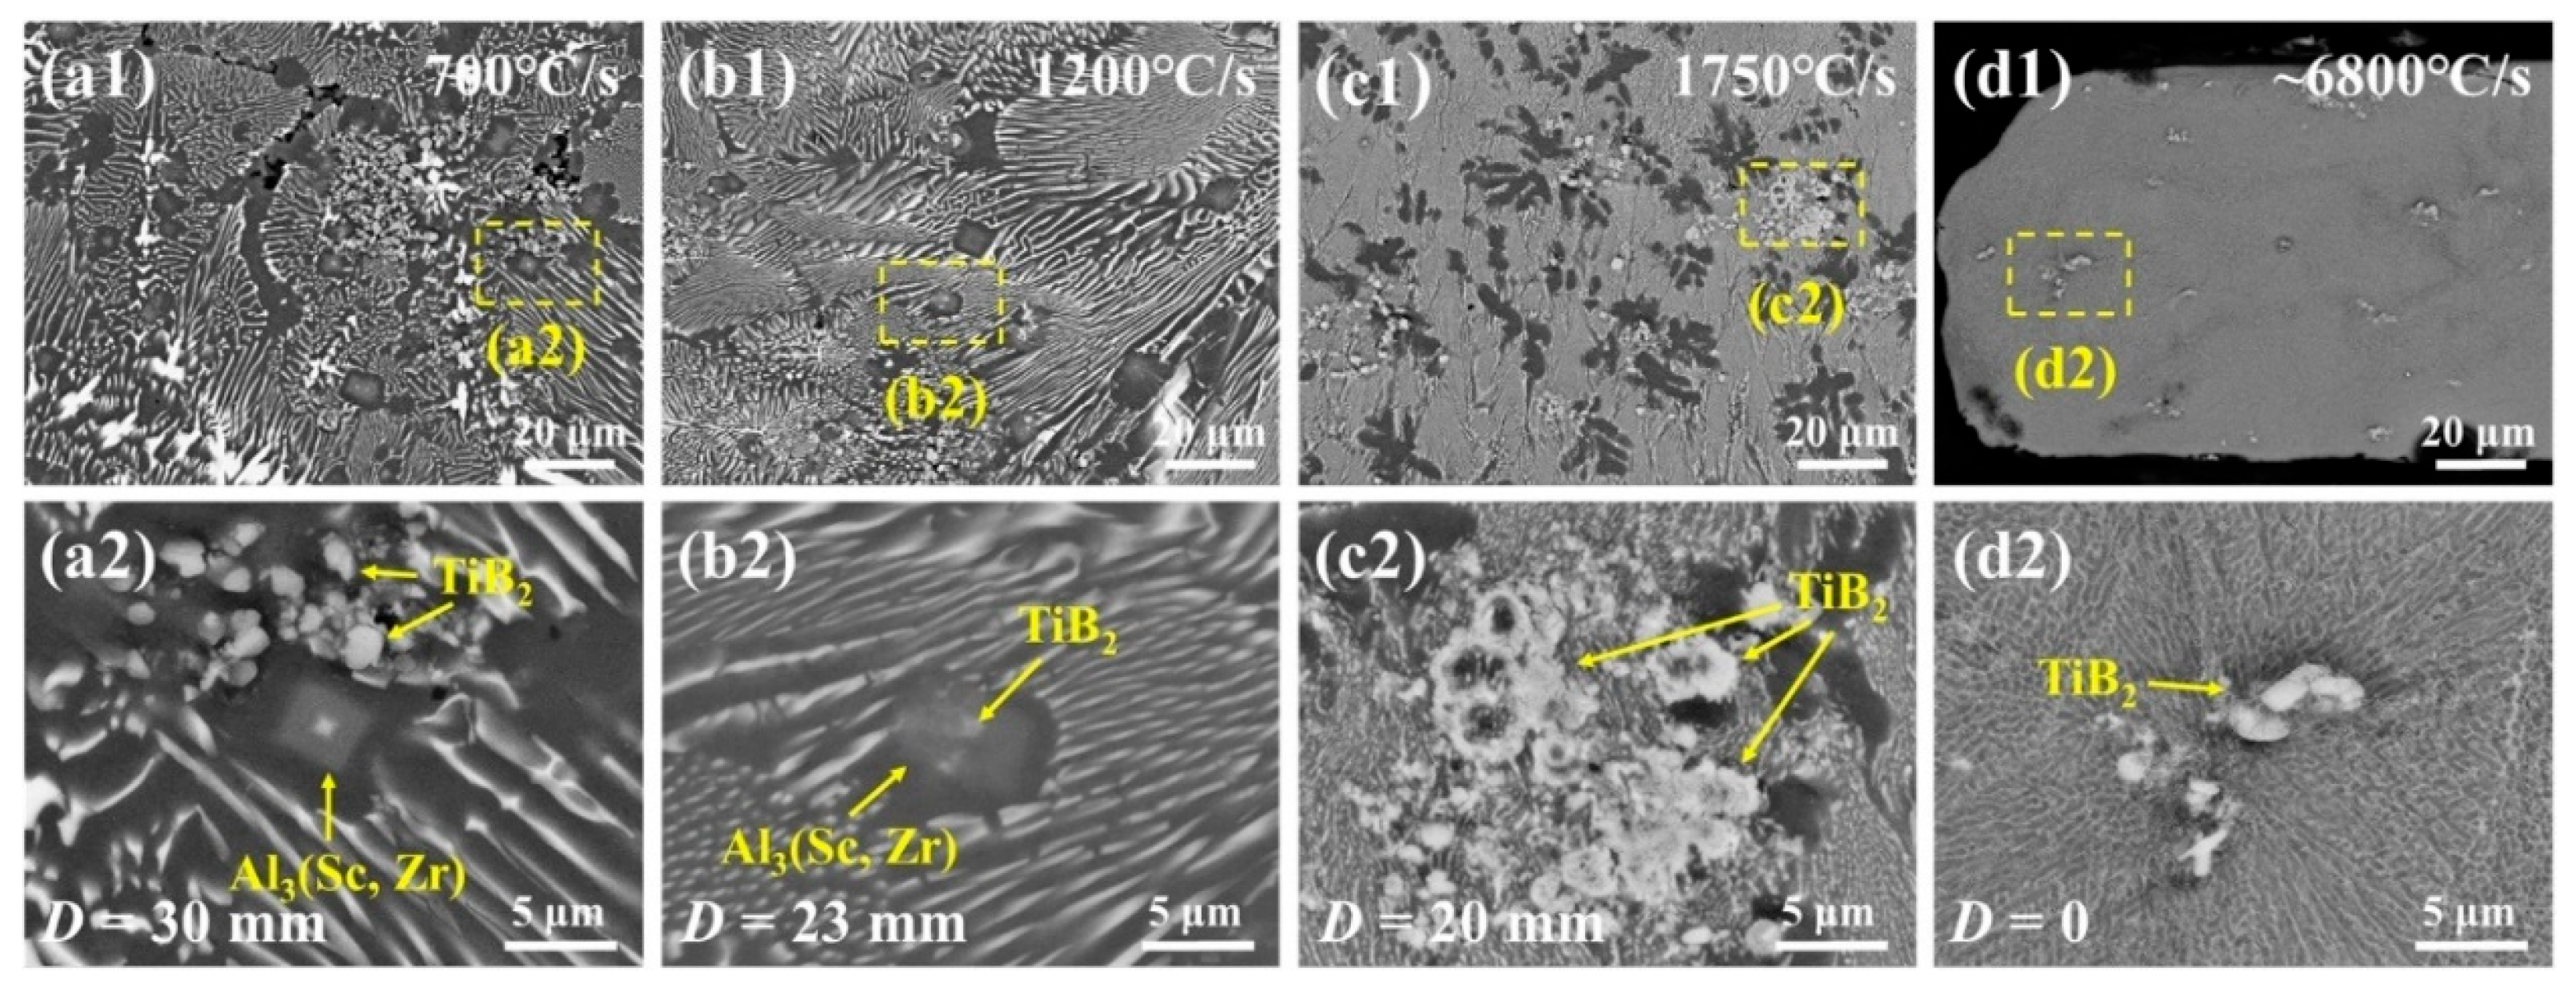
Figure 4 illustrates the distribution of TiB2 particles and the morphology of Al3(Sc,Zr) in different regions of the 2TiB2/Al–8Ni–0.6Sc–0.1Zr sample fabricated using the wedge-shaped copper mold. Elemental mapping results for the regions at D = 30 mm and D = 23 mm are shown in Figure 5. In the D = 30 mm region (cooling rate ≈ 700 °C/s), square-shaped primary phases are observed. EDS mapping (Figure 5) confirms that these are Al3(Sc,Zr) phases, surrounded by clusters of TiB2 particles. In contrast, in the D = 23 mm region (cooling rate ≈ 1200 °C/s), these primary Al3(Sc,Zr) phases disappear and are replaced by numerous core–shell structured particles. The core is identified as TiB2 and the shell as Al3(Sc,Zr) (Figure 5e–h), suggesting that Al3(Sc,Zr) nucleated and grew on the TiB2 surface. TiB2 particles in this region exhibit improved dispersion. At D = 20 mm (cooling rate ≈ 1750 °C/s), no core–shell structures are observed, and TiB2 agglomeration becomes more pronounced. However, in the D = 0 mm region (cooling rate ≈ 6800 °C/s), the extent of TiB2 agglomeration is reduced compared to that at D = 20 mm. Further increasing the cooling rate, primary Al3Ni disappears, and the microstructure evolves into a fully eutectic structure at ~1200 °C s−1 (Figure 4(b1,b2)); further increases in the cooling rate yield a slightly hypoeutectic morphology (Figure 4(c1,c2)), confirming the suppression of primary intermetallic formation. This is because, under rapid solidification, Al-8Ni gradually enters the eutectic coupling zone or even the hypereutectic zone due to competition between the growth kinetics of each phase [34,35].

4.2. Microstructure of Laser-Remelted Samples

Figure 6 presents LSCM images of the melt pool morphologies in the 2TiB2/Al–8Ni and 2TiB2/Al–8Ni–0.6Sc–0.1Zr alloys subjected to laser surface remelting under a constant laser power of 1200 W and varying scanning speeds (20, 40, 60, and 80 mm/s). The 2TiB2/Al–8Ni samples are labeled A1–A4 and the 2TiB2/Al–8Ni–0.6Sc–0.1Zr samples B1–B4. In both alloys, the scanning speed determines the average cooling rate during melt pool solidification. At a given scanning speed, the TiB2 particles in the B-series samples exhibit significantly improved dispersion compared to those in the A-series. Notably, TiB2 dispersion in sample B2 (40 mm/s) is optimal, consistent with the trend observed in the wedge-cast samples. The cooling-rate range of the L-DED process (102–104 °C/s [14]) is comparable to that of the wedge mold.
Figure 7(a1) shows a HAADF image of a TiB2 particle near the bottom of the melt pool in sample B2. The corresponding HRTEM image (Figure 7(a2)) and its FFT (Figure 7(a3)) confirm that the phase coating the TiB2 particle is Al3(Sc,Zr). In Figure 7(b1–b3) and 7(c1–c3), HAADF and elemental maps of Sc and Zr are shown for TiB2 particles in samples B2 and B4, respectively. The Al3(Sc,Zr) coating thickness is ~20 nm in B2 and ~3 nm in B4, indicating that higher cooling rates (B4: 80 mm/s) reduce the growth of the Al3(Sc,Zr) shell.

4.3. Orientation Relationship Between TiB2 and α-Al

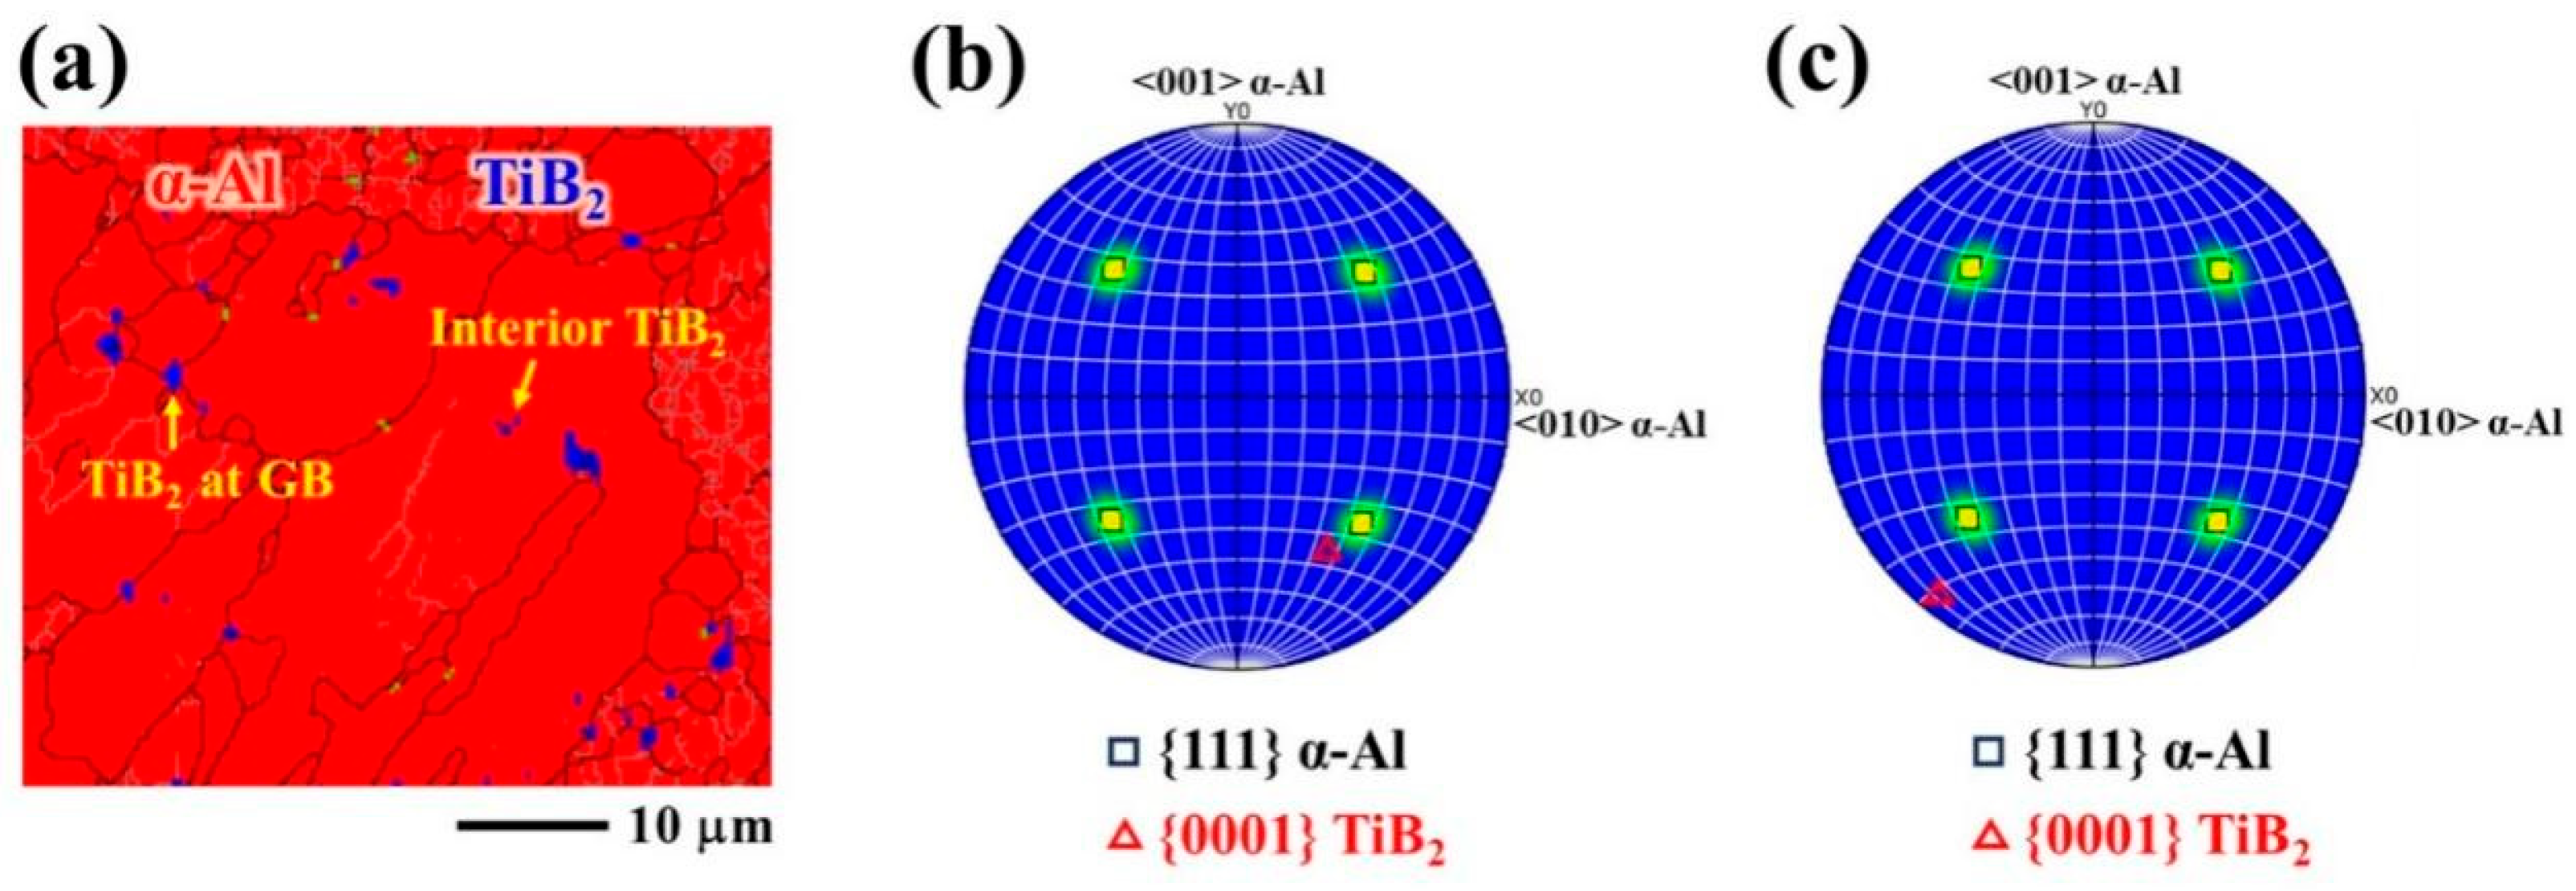
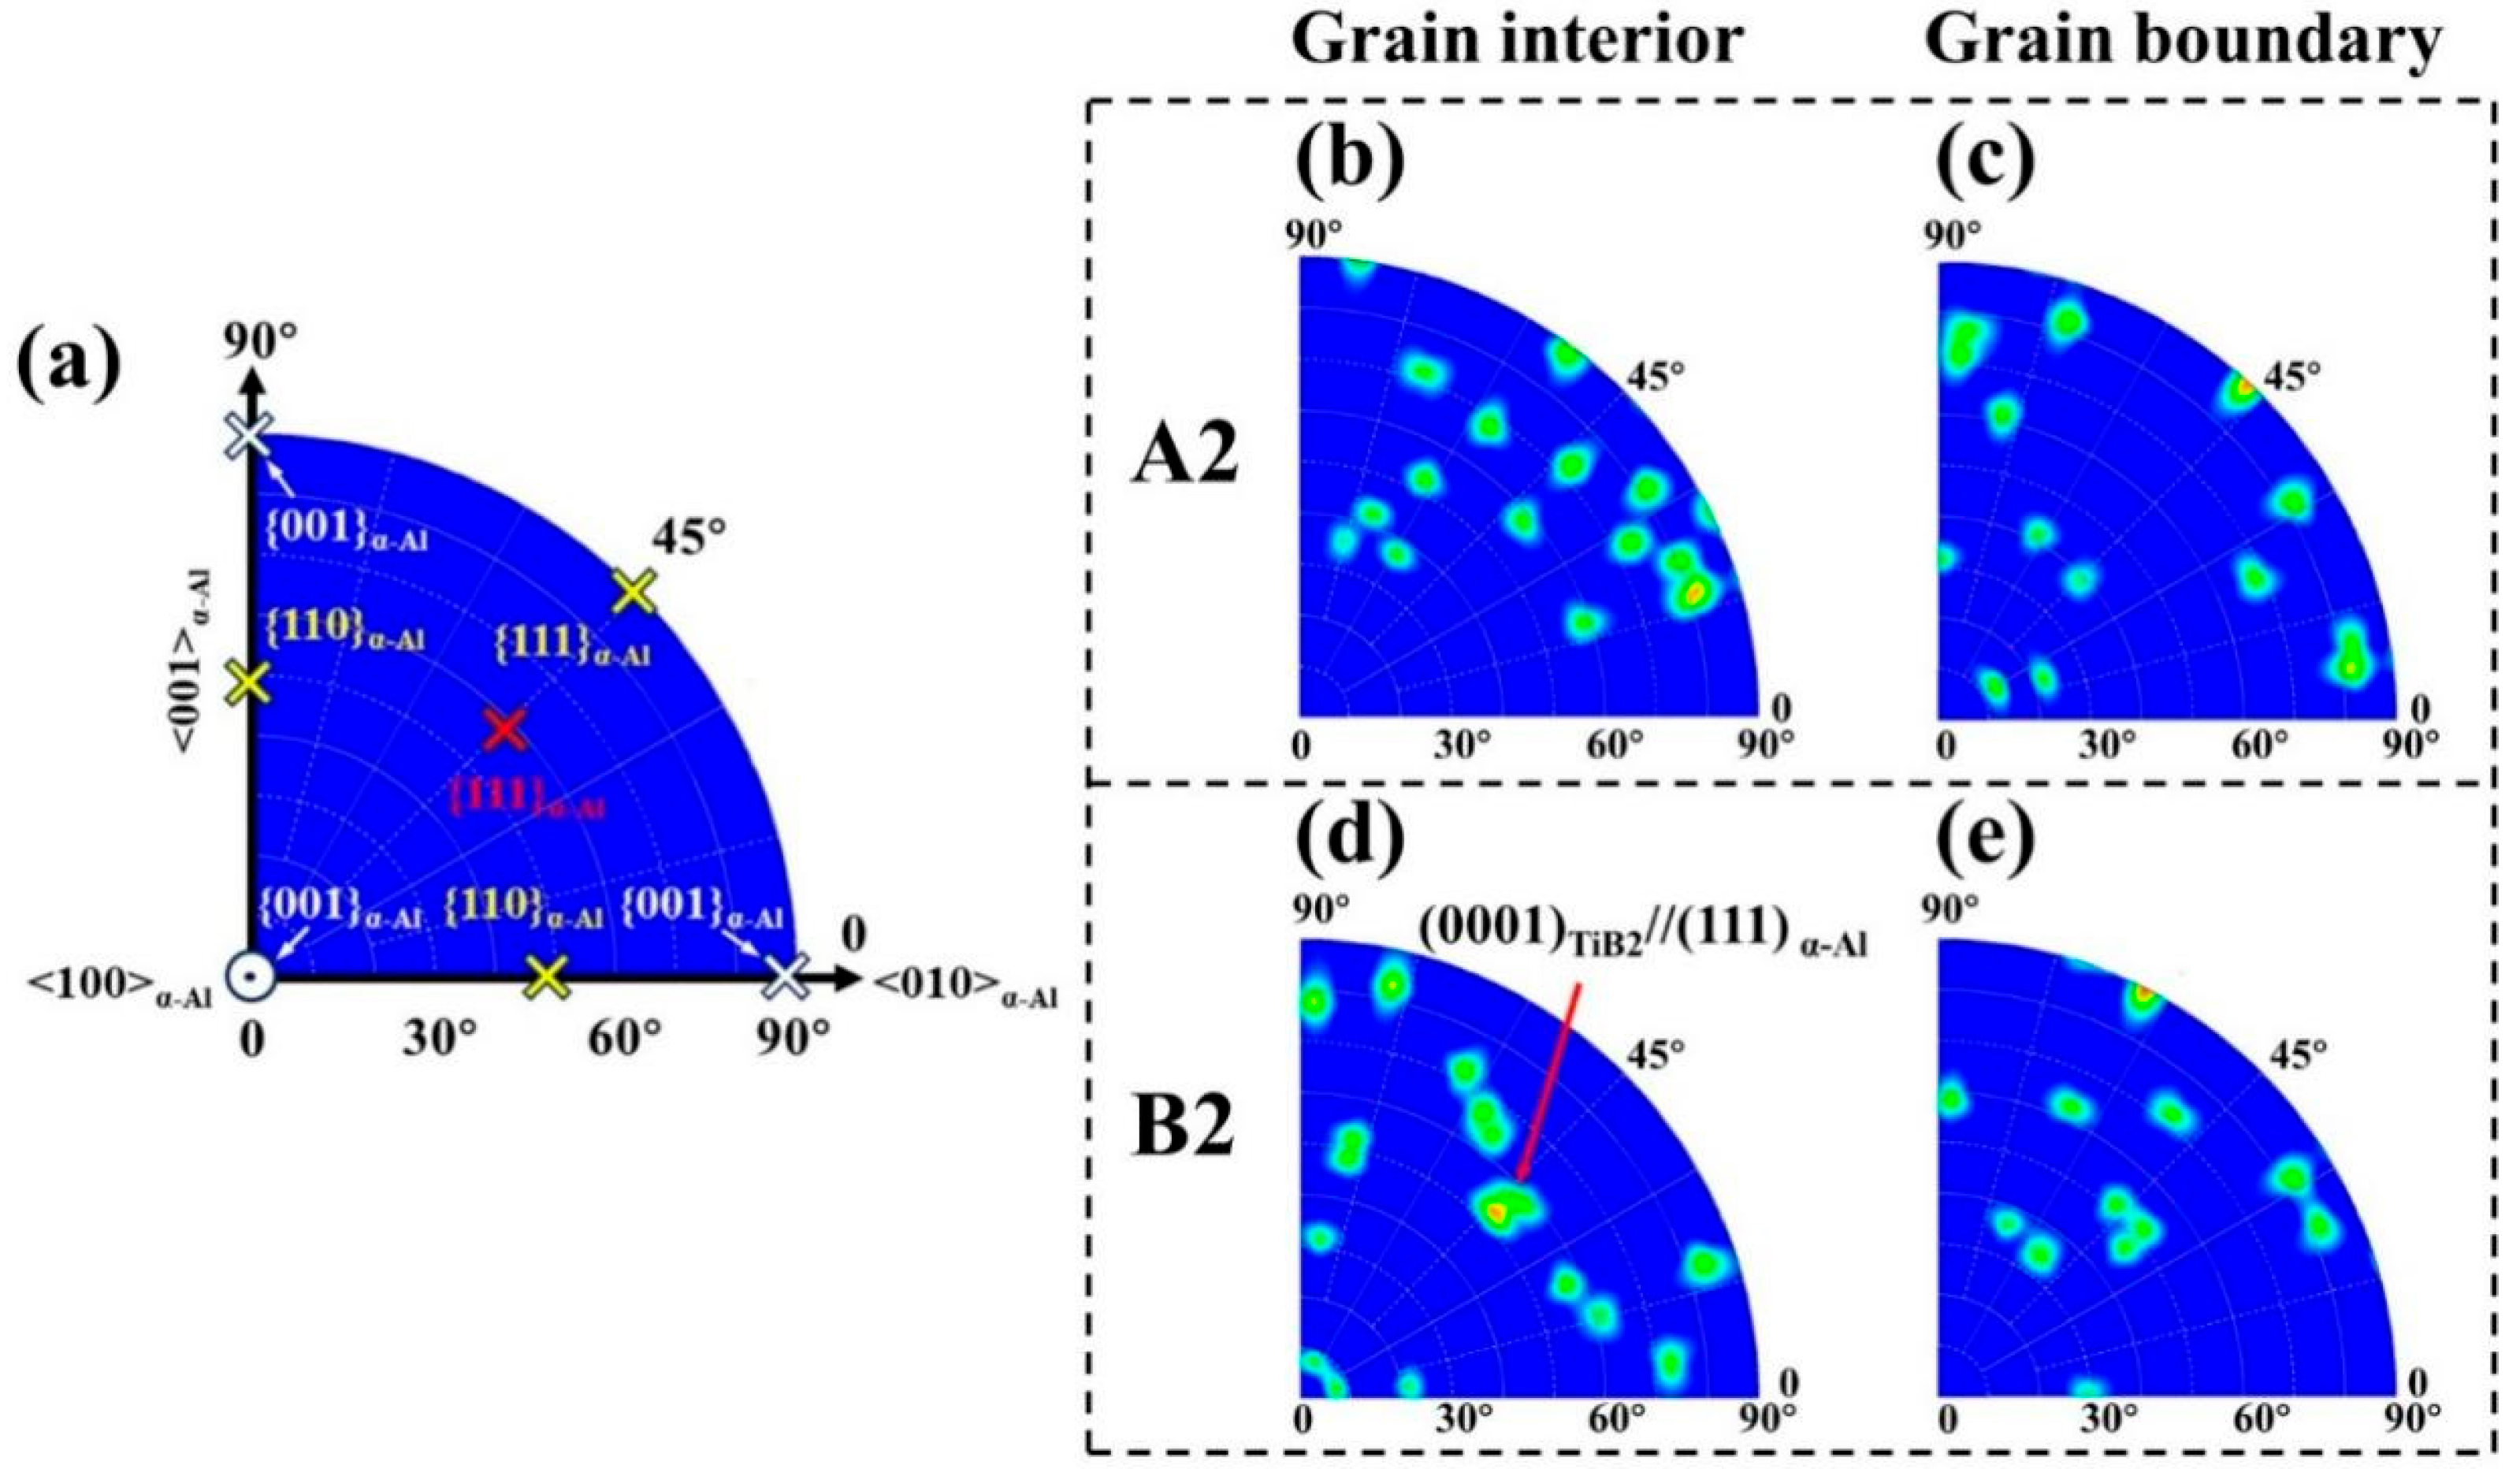
Segregation of Sc/Zr at the TiB2/α-Al interface enhances lattice matching and facilitates specific orientation relationships (ORs). To validate this, EBSD analysis was conducted on the melt pool regions of samples A2 and B2. Twenty TiB2 particles from within the grains and twenty from the grain boundaries were selected in each sample to analyze their orientation relationships with neighboring α-Al. Figure 8 shows one representative TiB2–α-Al orientation relationship from the grain interior and one from a grain boundary in sample B2. Equal-area projections of the {001}α-Al plane are used to mark the poles of the {0001}TiB2 planes.
Due to the fourfold symmetry of α-Al along the <001> axis, the {0001}TiB2 poles are projected into the first quadrant. Figure 9a indicates ideal ORs: (111)α-Al//(0001)TiB2 (red cross), (110)α-Al//(0001)TiB2 (yellow cross), and (001)α-Al//(0001)TiB2 (white cross). Figure 9b–e present the density distributions of these projections for samples A2 and B2. In sample A2, no reproducible ORs are observed between TiB2 and α-Al, regardless of location. In contrast, sample B2 shows a preferential OR of (111)α-Al//(0001)TiB2, particularly for TiB2 particles within grains. Other parallel close-packed plane relationships are not observed. Based on the EBSD analysis of forty TiB2 particles in B2, the (111)α-Al//(0001)TiB2 interface emerges as the preferred orientation.

5. Discussion

5.1. Nucleation and Growth of Al3(Sc,Zr) on TiB2 Surfaces

To elucidate the formation of Al3(Sc,Zr)/TiB2 composite interfaces and their dependence on cooling rate, classical heterogeneous nucleation theory [36,37] was applied. The nucleation and growth of Al3(Sc,Zr) on TiB2 particles were evaluated using this framework with the following parameters:
-
Interfacial energy between Al3(Sc,Zr) and liquid Al (γ)
Direct measurements of γ are unavailable. However, since Al3(Sc,Zr) acts as a potential nucleation site for α-Al, its interfacial energy can be estimated based on values reported for α-Al/liquid Al (0.093–0.158 J/m2) [38,39]. Given the structural similarity between D022–Al3Ti and L12–Al3(Sc,Zr), the Al3Ti/liquid Al interfacial energy is also relevant. DFT studies by Wearing et al. [40] showed that the difference in γ between Al3Ti/liquid Al and α-Al/liquid Al is <0.35 J/m2 (estimated at 0.31 J/m2). Hence, the γ value used here is set at 0.43 J/m2.
-
Volumetric Gibbs free energy change (ΔGᵥ)
ΔGᵥ is typically approximated using the relationship ΔGᵥ = ΔHₘ(Tₘ–T)/Tₘ, where ΔHₘ is the latent heat of fusion and Tₘ is the melting point. However, for Al3(Sc,Zr), which nucleates from a multicomponent melt, this is not valid. Instead, ΔGᵥ corresponds to the maximum thermodynamic driving force for forming Al3(Sc,Zr) nuclei from clusters of Al, Sc, and Zr atoms. The driving force curve for the 2TiB2/Al–8Ni–0.6Sc–0.1Zr system is shown in Figure 10.
-
Wetting angle (θ)
Al3(Sc,Zr) preferentially nucleates on the (0001) plane of TiB2. The value is set as 30° [14].
-
Nucleation site density (N)
Assuming each (0001) surface of a TiB2 particle provides a single nucleation site, and given that there are two such surfaces per particle, N is calculated as:
N = 2 f w Ti B 2 ρ L ρ Ti B 2 V Ti B 2
where f w Ti B 2 is the TiB2 mass fraction (0.02), ρ L and ρ Ti B 2 are the densities of liquid Al and TiB2, respectively; V Ti B 2 is the average TiB2 particle volume, estimated using a particle diameter of 800 nm [14].
-
Diffusion coefficient (D)
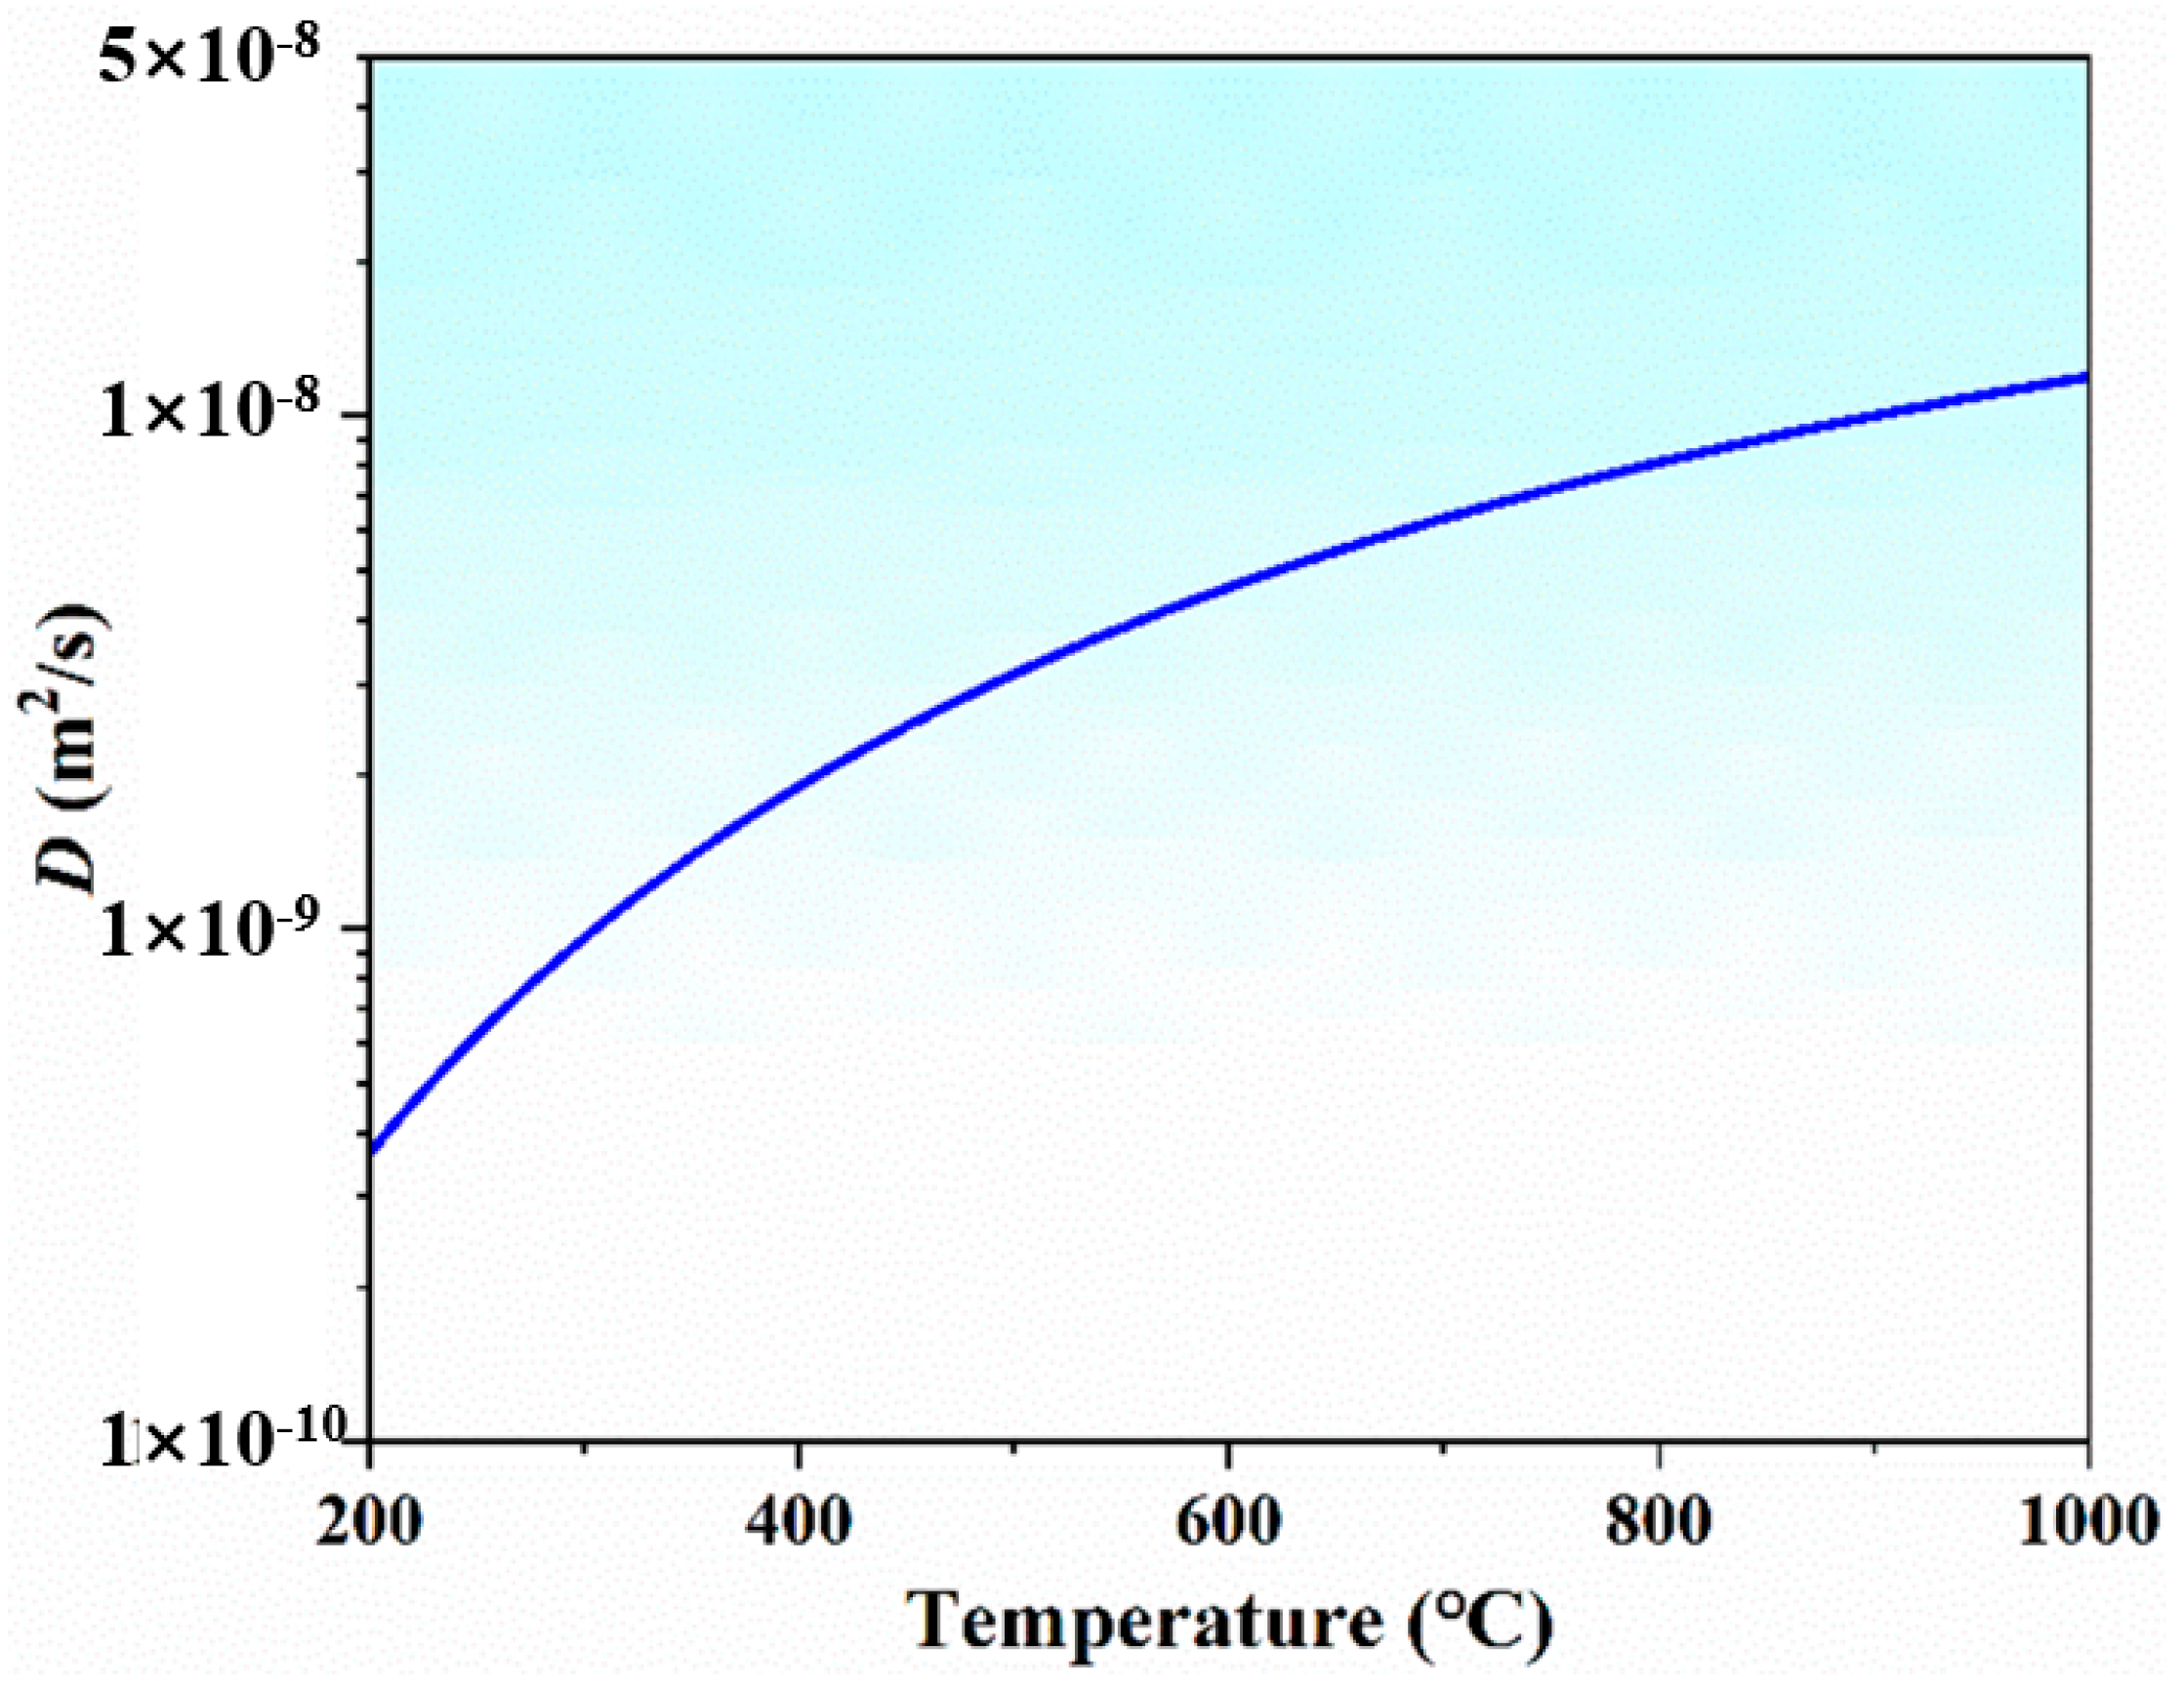
Based on the CALPHAD approach, the diffusion coefficient of an element in the liquid phase can be described using atomic mobility parameters. The mobility parameters for the Al–Sc liquid phase were obtained from Ref. [41]. According to the TEM-EDS mappings of Sc and Zr around the TiB2 particle at 850 °C/s (Figure 7), the Al3(Sc,Zr) precipitated from the liquid is Sc-rich and contains a small amount of Zr atoms. Therefore, the diffusion coefficients DL used in our nucleation analysis is assigned to the trace diffusion coefficient of Sc in the Al–8Ni–0.6Sc–0.1Zr melt. In this study, the DL as a function of temperature were calculated based on thermodynamic and mobility parameters for the Al–Ni–Sc–Zr–Ti–B system using the CALPHAD method, as illustrated in Figure 11.
-
Interfacial concentration ( x L , eff )
xL,eff is the effective interfacial concentration at the solidification front, reflecting the number of Al3(Sc,Zr) clusters that can form at this location. This term refers to the molar volume of Al3(Sc,Zr) clusters near the solidification front. Prior to casting, all Sc and Zr atoms are fully dissolved in the melt; therefore, the molar volume is assumed to correspond to the total molar fraction of Al3(Sc,Zr) clusters precipitated from the melt. According to equilibrium phase diagram calculations at 600 °C, the corresponding value in the 2TiB2/Al–8Ni–0.6Sc–0.1Zr melt was calculated to be 1.7 wt% (Sc + Zr).
-
Incubation time
According to Klein et al. [42], the effective incubation time for nucleation is given by
τ = 16 × k × f θ 1 cos θ × 1 a 2 × x l , e f f × γ S / L × T D L × G v 2
where θ is the wetting angle, γS/L is the interface energy between the solid and liquid, and ΔGv is the driving force for precipitation.
Table 2 summarizes the key parameters used in the heterogeneous nucleation model. In addition to the parameters described in items (1)–(7), the table additionally includes the average molar mass of the Al3Sc phase ( W m , A l 3 Sc ), the interfacial atomic spacing (a), and the density of the Al3Sc phase ( ρ A l 3 Sc ). Moreover, the Gibbs free energy per unit volume of Al3(Sc,Zr) and the diffusion coefficient D of Sc in the Al–8Ni–0.6Sc–0.1Zr melt are presented in Figure 10 and Figure 11, respectively. Since the first atomic layer of the Al3(Sc,Zr) crystal consists of pure Al3Sc, the value of a is calculated using the following equation:
a = W m ,   A l 3 Sc N A × ρ A l 3 Sc
where M is the molar mass of Al3Sc, ρ is its density, and NA is Avogadro’s number.
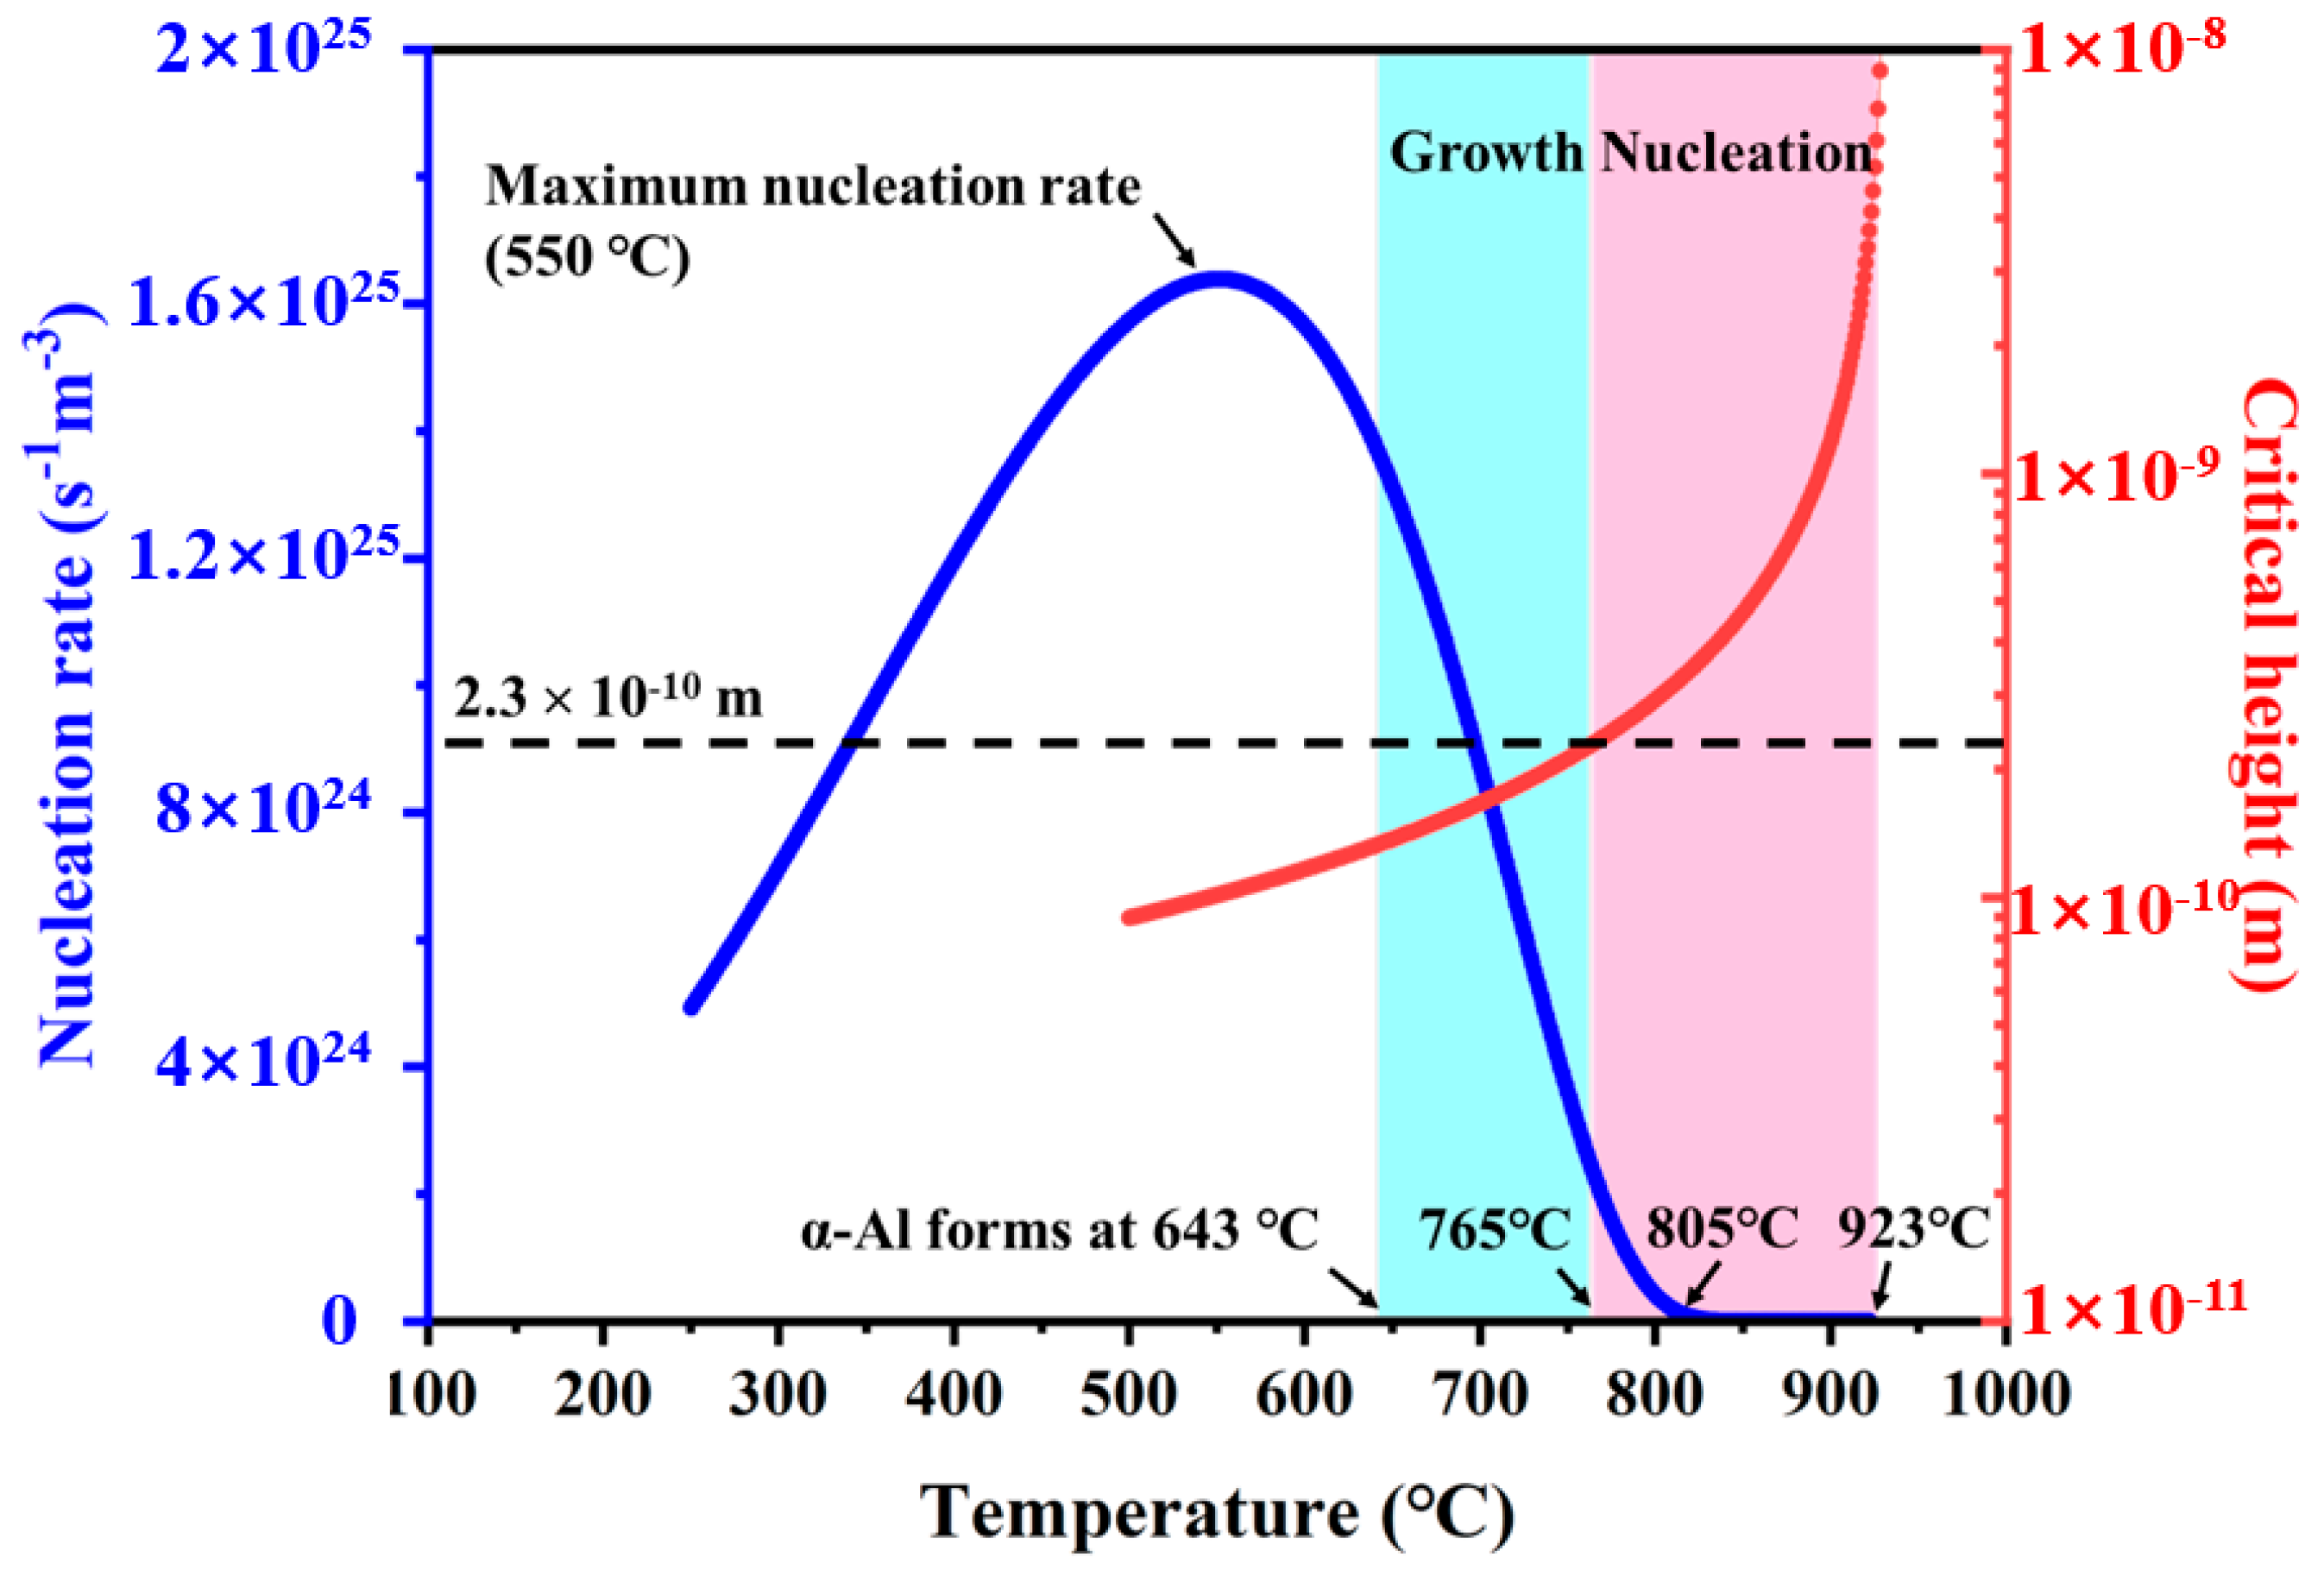
Figure 12 presents the temperature-dependent curves of the nucleation rate and the critical height of cap-shaped Al3(Sc,Zr) nuclei. When the temperature drops below 805 °C, the nucleation rate of Al3(Sc,Zr) increases significantly, reaching a peak at 550 °C. As the temperature decreases further, the diffusion of Sc and Zr in the undercooled liquid becomes limited, leading to a reduction in the nucleation rate of Al3(Sc,Zr). However, when the temperature is substantially higher than 550 °C, the nucleation of Al3(Sc,Zr) ceases. This phenomenon can be attributed to three main factors. First, due to solute trapping effects, the rapidly solidified α-Al grains formed at 643 °C inhibit the precipitation of Al3(Sc,Zr). Second, the (111) plane of Al3Sc, which is an atomically close-packed plane, is parallel to the (0001) plane of TiB2. When the critical height of the cap-shaped nucleus is smaller than the interplanar spacing of Al3Sc (2.3 × 10⁻¹⁰ m), Sc and Zr atoms stack directly onto the existing Al3(Sc,Zr) crystal surface, preventing the formation of a three-dimensional nucleus. The intersection point between the green solid line and the black dashed line in the figure indicates that the critical temperature for the termination of Al3(Sc,Zr) nucleation is 765 °C. Third, prior to reaching 765 °C, once the number of Al3(Sc,Zr) nuclei reaches a critical level, the precipitation mode of the primary Al3(Sc,Zr) phase shifts from nucleation-controlled to growth-controlled. Therefore, in the 2TiB2/Al–8Ni–0.6Sc–0.1Zr melt, the nucleation of Al3(Sc,Zr) occurs within the temperature range of 765–923 °C and terminates at 643 °C.
The extent of Al3(Sc,Zr) coverage on TiB2 surfaces is strongly correlated with the nucleation number density of Al3(Sc,Zr) generated during rapid solidification. Given the abundance of TiB2 particles in the melt serving as effective nucleation sites, it is assumed that Al3(Sc,Zr) crystals nucleate upon undercooling of the liquid. The number density of Al3(Sc,Zr) nucleation cores can be calculated using the following expression:
N n c = T L T c J × d T T ˙
where J denotes the nucleation rate, and Tc represents the critical temperature (ranging from 765 to 923 °C) at which Al3(Sc,Zr) transitions from nucleation to growth. Additionally, the mole fraction of Al3(Sc,Zr) formed via heterogeneous nucleation can be estimated using the following expression:
f n c = 1 n t T L T c J × n * × d T T ˙
where nt denotes the total number of atoms that constitute the Al3(Sc,Zr) phase under equilibrium conditions, whereas n represents the number of atoms in a critical Al3(Sc,Zr) nucleus at a given temperature. The value of nt can be determined as follows:
n t = N A × f t w W m ,   A l 3 Sc × ρ L
where f t w denotes the total mass fraction of Al3(Sc,Zr) in the 2TiB2/Al–8Ni–0.6Sc–0.1Zr system after equilibrium solidification, as determined by thermodynamic calculations. The critical nucleus size, n⁎, can be calculated using the following expression:
n * = 32 π 3 a 3 × ( γ S / L Δ G V ) 3 × f ( θ )
Equations (4) and (5) show that, under a fixed cooling rate, Tc governs both J and n. However, the exact value of Tc remains unknown. Accordingly, Tc is treated as an independent variable in the following analysis.
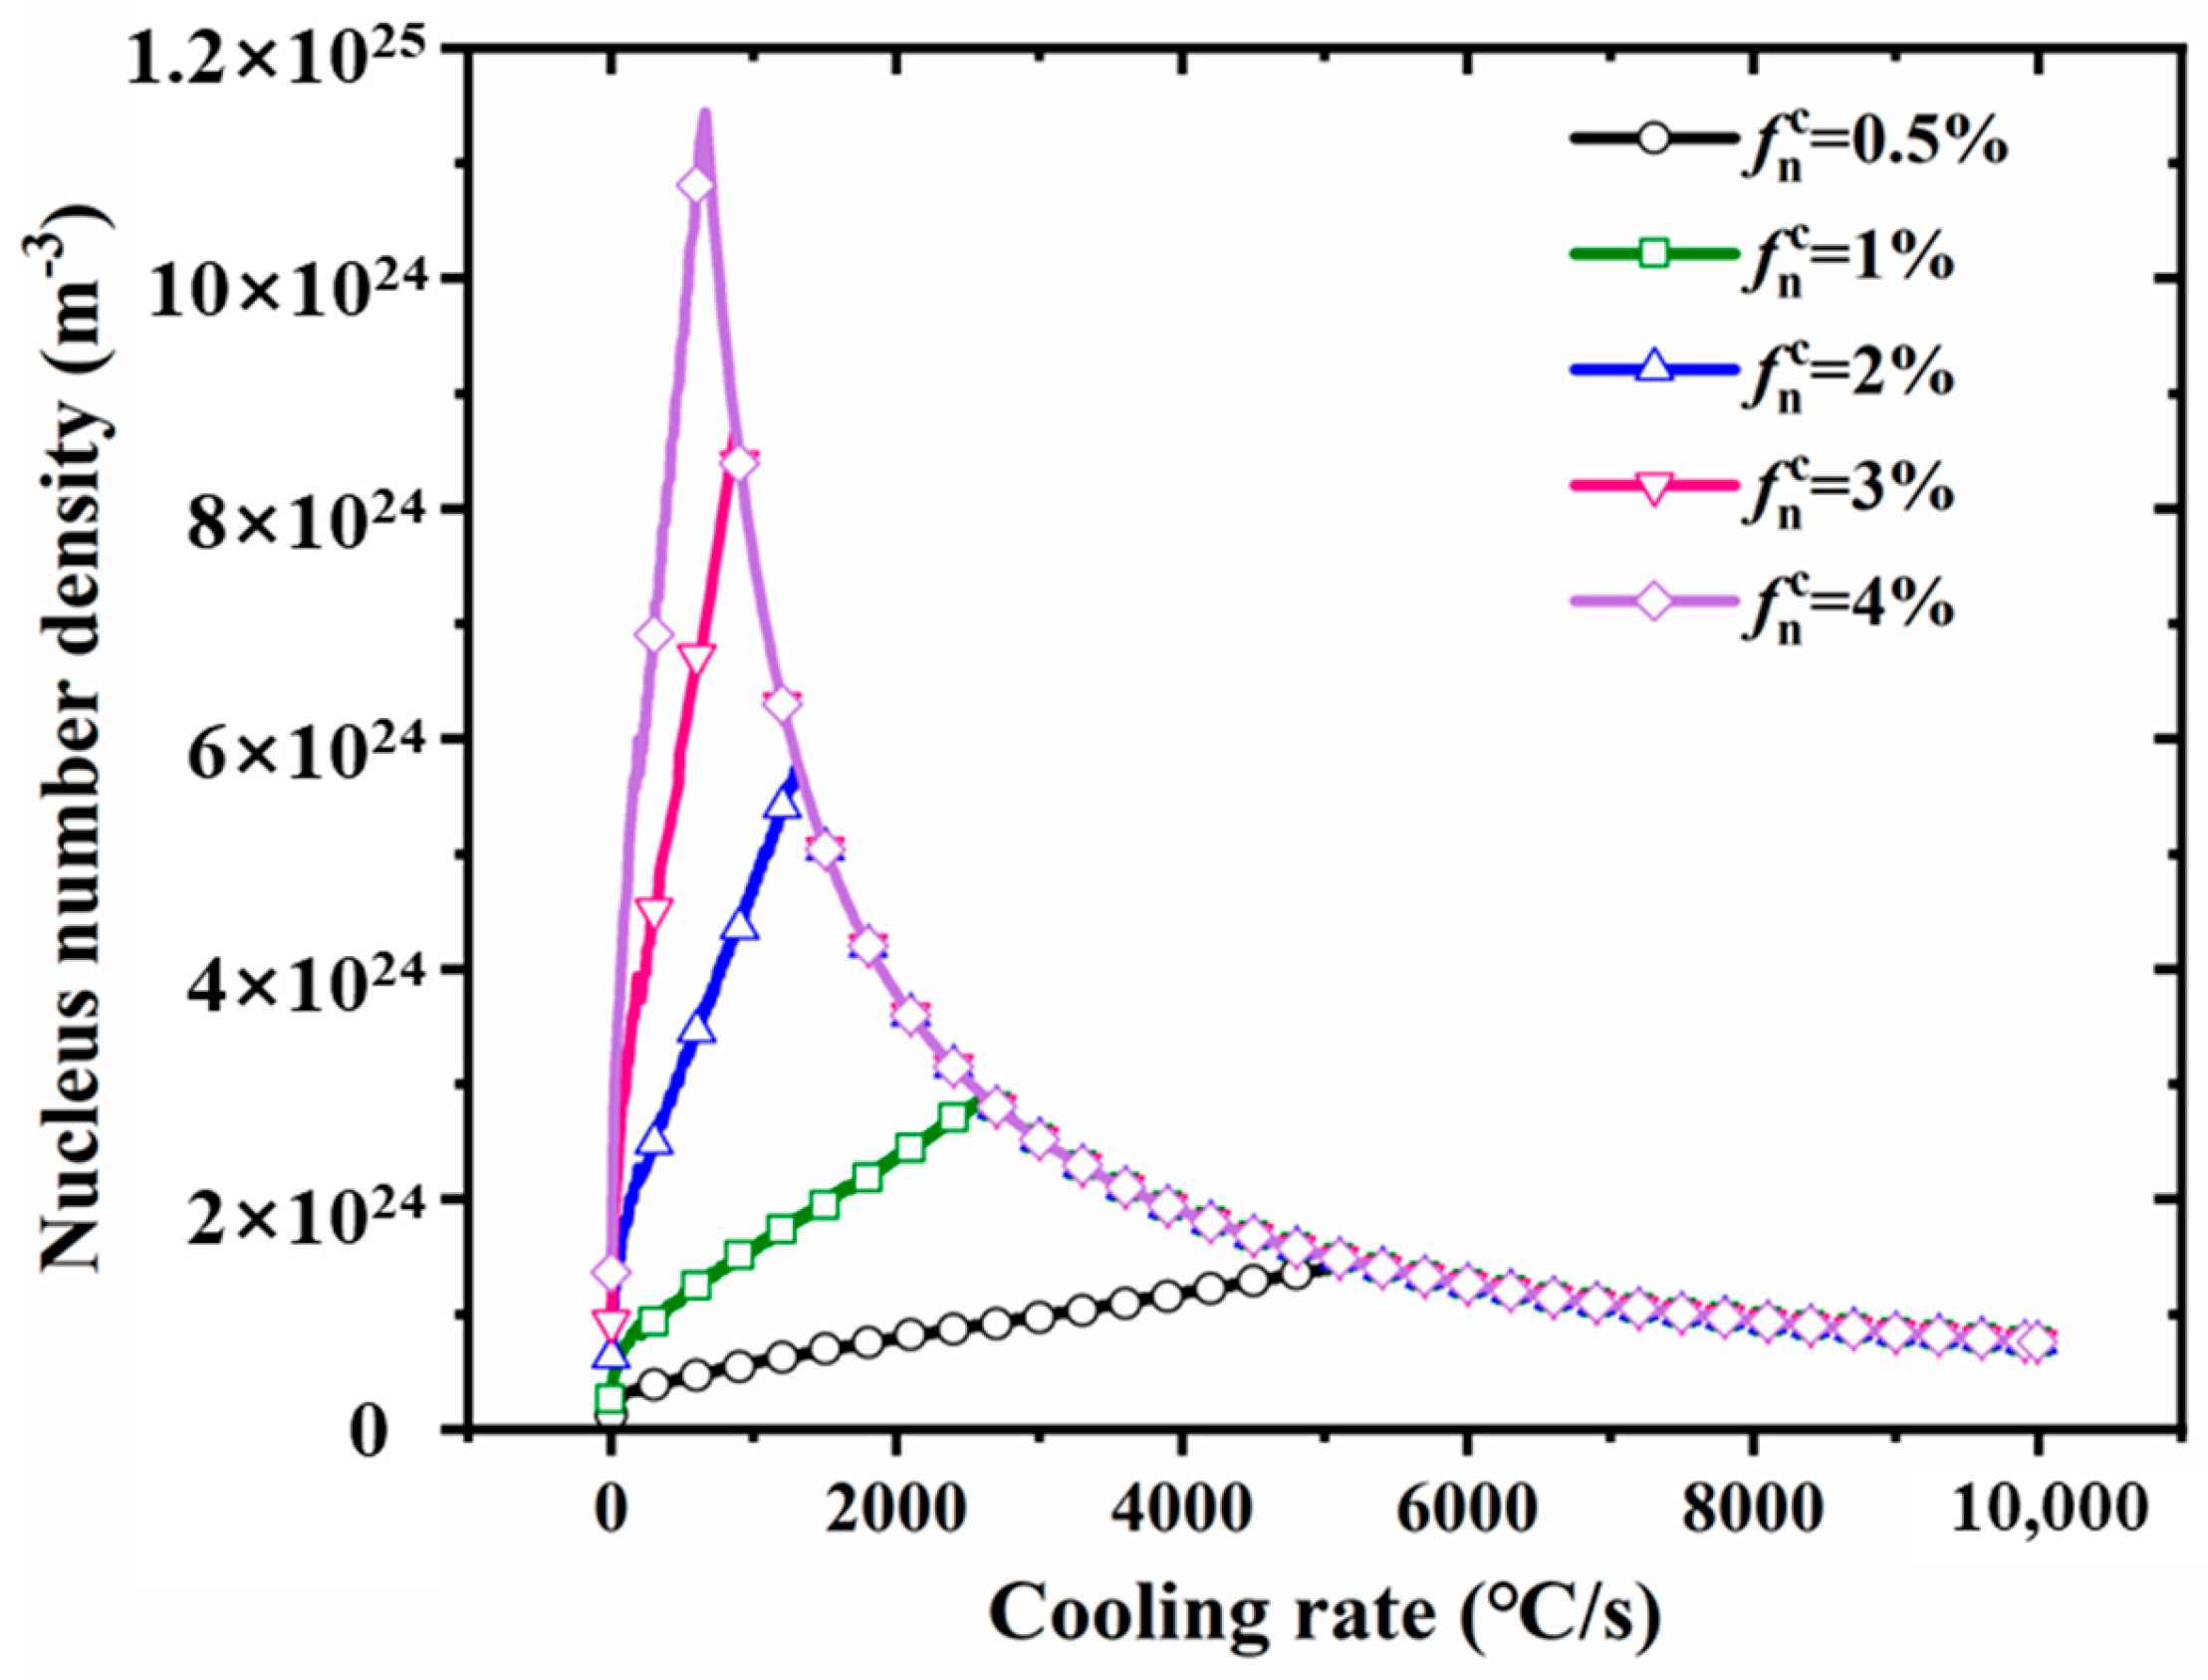
Figure 13 presents the variation curve of N c n with respect to the cooling rate. If the transition of Al3(Sc,Zr) from nucleation to growth does not occur before the liquid phase cools to 765 °C, the nucleation number density decreases monotonically with increasing cooling rate. This scenario defines the upper limit of the achievable nucleation number density. Assuming the transition from nucleation to growth occurs at Tc > 765 °C, the nucleation number density initially increases to a maximum with increasing cooling rate, and then gradually decreases and converges toward the upper limit. The intrinsic cause of this initial increase in nucleation number density is the reduction in the critical nucleus size with increasing cooling rate. Given that the coverage of Al3(Sc,Zr) on TiB2 surfaces reaches a maximum at a cooling rate of 1200 °C/s (as shown in Figure 4 and Figure 5), the actual value of f n c for the nucleation-to-growth transition of Al3(Sc,Zr) is expected to be approximately 2%.
Once nucleation is complete, Al3(Sc,Zr) precipitates on the TiB2 surface and proceeds to the growth stage. In the 2TiB2/Al–8Ni–0.6Sc–0.1Zr system, a cooling rate of 1200 °C/s defines the threshold for forming a three-dimensional Al3(Sc,Zr) coating on TiB2 surfaces (Figure 5e). Above this threshold, the growth of Al3(Sc,Zr) is significantly suppressed (Figure 7c). In a study of the 5TiB2/Al–4.5Mg–0.7Sc–0.2Zr system [14], at a cooling rate of 6800 °C/s, the thickness of Al3(Sc,Zr) decreases to approximately 1 nm, corresponding to a two-dimensional atomic layer. Below the 1200 °C/s threshold, the growth window of Al3(Sc,Zr) extends, resulting in a rapid increase in total thickness.
In summary, the precipitation sequence of Al3(Sc,Zr) on TiB2 for the 2TiB2/Al–8Ni–0.6Sc–0.1Zr system can be divided into three stages.
-
Stage I (805–923 °C, low undercooling): Al3(Sc,Zr) nucleation is negligible; Sc/Zr atoms segregate onto the (0001) TiB2 surface and construct a two-dimensional cluster (2DC) whose lattice must expand to achieve edge-to-edge matching with TiB2. The resulting elastic strain suppresses subsequent α-Al nucleation.
-
Stage II (765–805 °C): the 2DC transforms into three-dimensional cap-shaped embryos (3DC) whose formation rate rises explosively (Figure 7b). These 3DC embryos spread over the TiB2 surface to form a continuous shell; the process is most complete near 1200 °C/s (Figure 4b). Once the shell exceeds a critical thickness, lattice mismatch at the Al3(Sc,Zr)/TiB2 interface is fully relaxed, enabling coherent matching with α-Al.
-
Stage III (≤765 °C): nucleation of new 3DC embryos ceases because their critical height falls below one atomic layer, and growth of the existing Al3(Sc,Zr) shell dominates. For cooling rates ≤850 °C/s, the planar shell becomes morphologically unstable and evolves into seaweed/dendritic Al3(Sc,Zr) (Figure 5a).

5.2. Effect of Composite Interface on TiB2 Dispersion

Particle dispersion during solidification is governed by the interaction between particles and the advancing solid–liquid interface [43,44,45,46,47,48]. Ignoring gravity and convection, three forces are considered:
(1)
Interfacial tension (FI): Dominates when the particle–interface gap is <0.2–0.4 nm [43]:
F I = 2 π R P Δ γ a 0 a 0 + d P / S n α ,   n = 2 7
where Rp is the particle radius; Δγ denotes the change in interfacial energy upon particle engulfment by the interface; ao is the atomic spacing; dp/s is the distance between the particle and the solidification front; and α is the interface shape factor. Given that the interfacial tension decays rapidly with increasing dp/s, n is assigned a value of 7.
(2)
van der Waals force (Fᵥ): Dominates for gaps >0.4 nm: [43,44]:
F V = A 6 R p α a 0 + h p / s 2
where A is the Hamaker constant for the Al–TiB2 system.
(3)
Viscous drag (FD): The viscous force originates from the relative motion between the liquid phase and the particles displaced by the advancing solidification front. According to Stokes’ law, the viscous force is proportional to both the solidification rate and the viscosity of the liquid, and can be expressed as [43]:
F D = 6 π η V R P h P / S α 2
where η is melt viscosity and V is particle velocity.
When the gap between the particle and the solidification front exceeds 0.4 nm, the condition required for particle engulfment is F D > F V . When the gap narrows to 0.2–0.4 nm, the condition for engulfment becomes F D > F I . When the repulsive and attractive forces reach equilibrium, an expression for the steady-state growth velocity can be derived. The corresponding critical velocities for these two cases are given as follows:
V c V = A 432 π η a 0 R P α
V c I = 0.057 a 0 Δ γ 3 η R P α
Given that F I is generally on the order of 106 times greater than F V , it significantly outweighs the latter in magnitude.
The influence of the Al3(Sc,Zr)/TiB2 composite interface on particle engulfment is manifested through the variation in Δ γ . For uncoated TiB2 particles, Δ γ can be described as follows:
Δ γ = γ Ti B 2 / α - Al ( γ Ti B 2 / L - Al + γ α - Al / L - Al )
Upon coating of TiB2 particles with Al3(Sc,Zr), the Δ γ is altered as follows:
Δ γ = γ Ti B 2 / A l 3 ( Sc , Zr ) / α - Al ( γ Ti B 2 / A l 3 ( Sc , Zr ) / L - Al + γ α - Al / L - Al )
where γ Ti B 2 / α - Al is the interfacial energy between TiB2 and α-Al; γ Ti B 2 / L - Al is the interfacial energy between TiB2 and liquid Al; γ α - Al / L - Al is the interfacial energy between α-Al and liquid Al; γ Ti B 2 / A l 3 ( Sc , Zr ) / α - Al is the interfacial energy at the junction of TiB2, Al3(Sc,Zr), and α-Al; γ Ti B 2 / A l 3 ( Sc , Zr ) / α - Al is the interfacial energy at the junction of TiB2, Al3(Sc,Zr), and liquid Al.
Table 3 lists the values of the above interfacial energies, which are obtained from Ref. [14].
For TiB2 particles not coated with Al3(Sc,Zr), the system interfacial energy after engulfment is 0.172 J/m2. For TiB2 particles coated with Al3(Sc,Zr), the corresponding Δ γ is −0.448 J/m2. The positive Δ γ value indicates that uncoated TiB2 particles tend to be pushed away by the solidification front and accumulate at grain boundaries, a phenomenon commonly observed in conventional casting [49] and also reported in L-PBF processes [20]. For particles to be engulfed by the solidification front, the solidification velocity must exceed V c I . The negative value of Δ γ implies that, once the gap between the particle and the solidification front decreases to 0.2–0.4 nm, the Al3(Sc,Zr)-coated TiB2 particles spontaneously enter the solid phase. In this case, the solidification velocity required for particle engulfment only needs to exceed V c V , which is lower than V c I .
Under different cooling rates, the engulfment behavior of TiB2 particles by the solid/liquid interface varies significantly. At relatively low cooling rates, an overgrown Al3(Sc,Zr) phase is observed around the TiB2 particles. When the cooling rate increases to approximately 1200 °C/s, Al3(Sc,Zr) precipitates on the surface of TiB2 particles, resulting in a reduced critical velocity for particle engulfment, V c V . Consequently, the dispersion of TiB2 particles is significantly improved (Figure 6). However, as the cooling rate further increases, the critical engulfment velocity rises back to V c I , and the precipitation of Al3(Sc,Zr) on TiB2 surfaces is suppressed, leading to the agglomeration of TiB2 particles. When the cooling rate continues to increase beyond this point, the growth velocity of α-Al exceeds V c I , causing TiB2 particles to be uniformly distributed within the α-Al matrix regardless of the presence of Al3(Sc,Zr) precipitates on their surfaces (Figure 4(d1)–(d2)). The Al3(Sc,Zr)/TiB2 composite interface facilitates the dispersion of TiB2 particles by reducing the interfacial barrier and lowering the critical engulfment velocity, enabling good dispersion of TiB2 particles at cooling rates around 1200 °C/s (Figure 5e).

6. Conclusions

The heterogeneous nucleation and growth of Al3(Sc,Zr) on TiB2 surfaces under high cooling rates in the 2TiB2/Al–Ni–Sc–Zr system were investigated through experiments and a nucleation model. The effect of the Al3(Sc,Zr)/TiB2 composite interface on TiB2 particle dispersion was also assessed. The main conclusions are as follows:
(1)
The volumetric driving force for Al3(Sc,Zr) precipitation, governed by the Sc and Zr contents in the melt, plays a critical role in determining the heterogeneous nucleation rate. Based on thermodynamic analysis, the Sc and Zr contents were set to 0.6 wt.% and 0.1 wt.%, respectively, balancing sufficient nucleation driving force, melt temperature control, and model simplicity.
(2)
The formation of the Al3(Sc,Zr)/TiB2 composite interface depends on the cooling rate and strongly influences TiB2 dispersion. In wedge-cast samples, TiB2 agglomeration occurred at 700 °C/s, with primary Al3(Sc,Zr) forming around clusters. At 1200 °C/s, Al3(Sc,Zr) precipitated on TiB2 surfaces, forming core–shell structures and improving particle dispersion. At 1750 °C/s, these structures disappeared, and agglomeration reappeared.
(3)
In laser surface–remelted 2TiB2/Al–8Ni samples, TiB2 particles showed severe agglomeration and lacked a consistent orientation with the α-Al matrix. In contrast, the addition of Sc and Zr in the 2TiB2/Al–8Ni–0.6Sc–0.1Zr alloy significantly improved dispersion. Dispersion first increased and then decreased with rising scanning speed. A reproducible orientation relationship of (111) α-Al//(0001) TiB2 was observed.
(4)
The formation of the Al3(Sc,Zr)/TiB2 interface is closely linked to Al3(Sc,Zr) nucleation under rapid solidification. Classical nucleation theory indicates that the highest nucleation density occurs near 1200 °C/s, at which the composite interface forms most effectively, thereby promoting uniform TiB2 dispersion.

Author Contributions

Conceptualization, Y.L.; methodology, X.F. and L.H.; software, L.H.; validation, X.F., L.H., and Y.L.; formal analysis, X.F. and L.H.; investigation, X.F. and L.H.; resources, P.R. and Y.L.; data curation, Y.L.; writing—original draft preparation, X.F. and L.H.; writing—review and editing, P.R. and Y.L.; visualization, L.H. and P.R.; supervision, Y.L.; project administration, P.R. and Y.L.; funding acquisition: Y.L. All authors have read and agreed to the published version of the manuscript.

Funding

This research was funded by the R&D project of AVIC Chengdu Aircraft Industrial (Group) Co., Ltd. (grant number: JY-23-A33-0026).

Data Availability Statement

The data are available from the corresponding author on reasonable request.

Conflicts of Interest

Author Xin Fang and Peng Rong were employed by the company AVIC Chengdu Aircraft Industrial (Group) Co., Ltd. The remaining authors declare that the research was conducted in the absence of any commercial or financial relationships that could be construed as a potential conflict of interest.

References

  1. Murty, B.S.; Kori, S.A.; Chakraborty, M. Grain refinement of aluminium and its alloys by heterogeneous nucleation and alloying. Int. Mater. Rev. 2002, 47, 3–29. [Google Scholar] [CrossRef]
  2. Martin, J.H.; Yahata, B.D.; Hundley, J.M.; Mayer, J.A.; Schaedler, T.A.; Pollock, T.M. 3D printing of high-strength aluminium alloys. Nature 2017, 549, 365–369. [Google Scholar] [CrossRef] [PubMed]
  3. Fan, Z.; Wang, Y.; Zhang, Y.; Qin, T.; Zhou, X.R.; Thompson, G.E.; Pennycook, T.; Hashimoto, T. Grain refining mechanism in the Al/Al–Ti–B system. Acta Mater. 2015, 84, 292–304. [Google Scholar] [CrossRef]
  4. Liu, Y.; Zhang, C.C.; Zhang, X.Y.; Huang, Y.C. Understanding grain refinement of Sc addition in a Zr containing Al-Zn-Mg-Cu aluminum alloy from experiments and first-principles. Intermetallics 2020, 123, 106823. [Google Scholar] [CrossRef]
  5. Opprecht, M.; Garandet, J.P.; Roux, G.; Flament, C. An understanding of duplex microstructures encountered during high strength aluminium alloy laser beam melting processing. Acta Mater. 2021, 215, 117204. [Google Scholar] [CrossRef]
  6. Jiang, A.; Wang, X. Dendritic and seaweed growth of proeutectic scandium tri-aluminide in hypereutectic Al-Sc undercooled melt. Acta Mater. 2020, 200, 56–65. [Google Scholar] [CrossRef]
  7. Dai, J.; Wang, Q.; Yang, C.; Chen, H.; Luo, G.; Li, H.; Sun, G.; Wang, H.; Chen, Z. Effects of sintering temperature on microstructure and mechanical properties of Al–Ni–Sc–Zr alloy fabricated by powder metallurgy. Mater. Charact. 2025, 221, 114772. [Google Scholar] [CrossRef]
  8. Belov, N.A.; Alabin, A.N.; Eskin, D.G. Improving the properties of cold-rolled Al–6%Ni sheets by alloying and heat treatment. Scr. Mater. 2004, 50, 89–94. [Google Scholar] [CrossRef]
  9. Boussinot, G.; Döring, M.; Hemes, S.; Stryzhyboroda, O.; Apel, M.; Schmidt, M. Laser powder bed fusion of eutectic Al–Ni alloys: Experimental and phase-field studies. Mater. Des. 2021, 198, 109299. [Google Scholar] [CrossRef]
  10. Deng, J.; Chen, C.; Liu, X.; Li, Y.; Zhou, K.; Guo, S. A high-strength heat-resistant Al−5.7Ni eutectic alloy with spherical Al3Ni nano-particles by selective laser melting. Scr. Mater. 2021, 203, 114031. [Google Scholar] [CrossRef]
  11. Dhal, A.; Thapliyal, S.; Agrawal, P.; Rpy, A.; Sharma, A.; Mishra, R.S.; Faierson, E. Multimodal and multiscale strengthening mechanisms in Al-Ni-Zr-Ti-Mn alloy processed by laser powder bed fusion additive manufacturing. Mater. Des. 2024, 237, 112602. [Google Scholar] [CrossRef]
  12. Ding, R.; Deng, J.; Liu, X.; Wu, Y.; Geng, Z.; Li, D.; Zhang, T.; Chen, C.; Zhou, K. Enhanced mechanical properties and thermal stability in additively manufactured Al-Ni alloy by Sc addition. J. Alloys Compd. 2023, 934, 167894. [Google Scholar] [CrossRef]
  13. Chen, Z.; Lu, C.; Cheng, Y.; Zhu, X.; Wei, T.; Wang, C.; Jia, Q. Manipulating the fine grain nucleation in Sc/Zr-modified Al alloys through a novel process strategy of laser powder bed fusion. Scr. Mater. 2025, 261, 116606. [Google Scholar] [CrossRef]
  14. Li, Y.; Wang, Y.; Hu, L.; Chen, T.; Ji, G.; Chen, H.; Wang, H.; Wang, H.; Chen, Z. Nanoscale engineering of low-misfit TiB2/Al3(Sc,Zr)/α-Al multi-interface to improve strength-ductility synergy for direct energy deposited aluminum alloy. Addit. Manuf. 2024, 79, 103913. [Google Scholar] [CrossRef]
  15. Lohar, A.K.; Mondal, B.N.; Panigrahi, S.C. Influence of cooling rate on the microstructure and ageing behavior of as-cast Al–Sc–Zr alloy. J. Mater. Process. Technol. 2010, 210, 2135–2141. [Google Scholar] [CrossRef]
  16. Taendl, J.; Orthacker, A.; Amenitsch, H.; Kothleitner, G.; Poletti, C. Influence of the degree of scandium supersaturation on the precipitation kinetics of rapidly solidified Al-Mg-Sc-Zr alloys. Acta Mater. 2016, 117, 43–50. [Google Scholar] [CrossRef]
  17. Li, X.P.; Ji, G.; Chen, Z.; Addad, A.; Wu, Y.; Wang, H.W.; Vleugels, J.; Van Humbeeck, J.; Kruth, J.P. Selective laser melting of nano-TiB2 decorated AlSi10Mg alloy with high fracture strength and ductility. Acta Mater. 2017, 129, 183–193. [Google Scholar] [CrossRef]
  18. Chen, M.; Li, X.; Ji, G.; Wu, Y.; Chen, Z.; Baekelant, W.; Vanmeensel, K.; Wang, H.; Kruth, J.-P. Novel composite powders with uniform TiB2 nano-particle distribution for 3D printing. Appl. Sci.-Basel 2017, 7, 250. [Google Scholar] [CrossRef]
  19. Cao, W.; Chen, S.L.; Zhang, F.; Wu, K.; Yang, Y.; Chang, Y.A.; Schmid-Fetzer, R.; Oates, W.A. PANDAT software with PanEngine, PanOptimizer and PanPrecipitation for multi-component phase diagram calculation and materials property simulation. Calphad 2009, 33, 328–342. [Google Scholar] [CrossRef]
  20. Zhao, Y.-Z.; Zhao, Y.-H.; Li, Q.; Chen, S.-L.; Zhang, J.-Y.; Chou, K.-C. Effects of step size and cut-off limit of residual liquid amount on solidification simulation of Al-Mg-Zn system with Scheil model. Intermetallics 2009, 17, 491–495. [Google Scholar] [CrossRef]
  21. Yang, W.; Wang, P.; Huang, X.; Zhang, S. Thermodynamic analysis of the Al–Ni system. Intermetallics 2022, 149, 107647. [Google Scholar] [CrossRef]
  22. Bo, H.; Liu, L.B.; Jin, Z.P. Thermodynamic analysis of Al–Sc, Cu–Sc and Al–Cu–Sc system. J. Alloys Compd. 2010, 490, 318–325. [Google Scholar] [CrossRef]
  23. Shevchenko, M.A.; Ivanov, M.I.; Berezutskii, V.V.; Kudin, V.G.; Sudavtsova, V.S. Thermodynamic properties of alloys of the Ni–Sc and Ni–Y systems. Russ. J. Phys. Chem. A 2014, 88, 897–902. [Google Scholar]
  24. Kardellass, S.; Servant, C.; Selhaoui, N.; Iddaoudi, A.; Ait Amar, M.; Bouirden, L. Thermodynamic description of the Ni–Sc system. Calphad 2013, 42, 59–65. [Google Scholar] [CrossRef]
  25. Wang, T.; Jin, Z.P.; Zhao, J.C. Thermodynamic assessment of the Al-Zr binary system. J. Phase Equilib. Diff. 2001, 22, 544–551. [Google Scholar] [CrossRef]
  26. Wang, N.; Li, C.; Du, Z.; Wang, F. Experimental study and thermodynamic re-assessment of the Ni–Zr system. Calphad 2007, 31, 413–421. [Google Scholar] [CrossRef]
  27. Liu, X.J.; Wang, S.L.; Wang, C.P. Thermodynamic assessments of the Sc–M (M: Ag, B and Th) systems. J. Alloys Compd. 2009, 469, 186–192. [Google Scholar] [CrossRef]
  28. Campbell, C.E.; Kattner, U.R. A thermodynamic assessment of the Ni-Al-B system. J. Phase Equilib. Diff. 1999, 20, 485–496. [Google Scholar] [CrossRef]
  29. Bo, H.; Liu, L.B.; Hu, J.L.; Jin, Z.P. Experimental study and thermodynamic modeling of the Al-Sc-Zr system. Comput. Mater. Sci. 2017, 133, 82–92. [Google Scholar] [CrossRef]
  30. He, J.Q.; Fan, L.; Liu, H.S.; Peng, H.L.; Jin, Z.P. Experimental investigation of phase equilibria in the Al–Ni–Sc system. J. Mater. Sci. 2019, 54, 10516–10528. [Google Scholar] [CrossRef]
  31. Miao, H.; Zhang, L.; Liu, L.; Deng, Z.; Wang, H.; Masset, P.J. Experimental investigation and thermodynamic optimization of the Al–Ni–Sc ternary system. Calphad 2022, 76, 102397. [Google Scholar] [CrossRef]
  32. Witusiewicz, V.T.; Sommer, F. Thermodynamics of liquid Al–Ni–Zr and Al–Cu–Ni–Zr alloys. J. Alloys Compd. 1999, 289, 152–167. [Google Scholar] [CrossRef]
  33. Witusiewicz, V.T.; Bondar, A.A.; Hecht, U.; Zollinger, J.; Artyukh, L.V.; Velikanova, T.Y. The Al–B–Nb–Ti system V. Thermodynamic description of the ternary system Al–B–Ti. J. Alloys Compd. 2009, 474, 86–104. [Google Scholar] [CrossRef]
  34. Hu, L.; Li, Y.; Luo, G.; Shi, Q.; Wang, Y.; Ma, S.; Cui, Y.; Wang, H.; Chen, Z. Understanding cellular structure formation in rapidly solidified Al–Ni alloys by constructing solidification microstructure selection maps. Addit. Manuf. 2023, 73, 103671. [Google Scholar] [CrossRef]
  35. Luo, G.; Chen, H.; Li, Y.; Yang, C.; Hu, L.; Ma, S.; Wang, H.; Chen, Z.; Wu, Y.; Wang, M.; et al. Improved elevated-temperature strength and thermal stability of additive manufactured Al–Ni–Sc–Zr alloys reinforced by cellular structures. Addit. Manuf. 2024, 90, 104313. [Google Scholar]
  36. Shao, G.; Tsakiropoulos, P. Prediction of phase selection in rapid solidification using time dependent nucleation theory. Acta Metall. Mater. 1994, 42, 2937–2942. [Google Scholar] [CrossRef]
  37. Turnbull, D.; Fisher, J.C. Rate of nucleation in condensed systems. J. Chem. Phys. 1949, 17, 71–73. [Google Scholar] [CrossRef]
  38. Turnbull, D. Formation of crystal nuclei in liquid metals. J. Appl. Phys. 1950, 21, 1022–1028. [Google Scholar] [CrossRef]
  39. Eustathopoulos, N.; Coudurier, L.; Joud, J.C.; Desré, P. Tension interfaciale solide-liquide des systémes Al-Sn, Al-In et Al-Sn-In. J. Cryst. Growth 1976, 33, 105–115. [Google Scholar] [CrossRef]
  40. Wearing, D.; Horsfield, A.P.; Xu, W.; Lee, P.D. Which wets TiB2 inoculant particles: Al or Al3Ti? J. Alloys Compd. 2016, 664, 460–468. [Google Scholar] [CrossRef]
  41. Lu, Z.; Tang, Y.; Zhang, L. Atomic mobility in liquid and fcc Al–Si–Mg–RE (RE = Ce, Sc) alloys and its application to the simulation of solidification processes in RE-containing A357 alloys. Int. J. Mater. Res. 2017, 108, 465–476. [Google Scholar] [CrossRef]
  42. Klein, S.; Herlach, D.M. Crystal nucleation in undercooled melts of PdZr2. J. Appl. Phys. 2013, 114, 183510. [Google Scholar] [CrossRef]
  43. Shangguan, D.; Ahuja, S.; Stefanescu, D.M. An analytical model for the interaction between an insoluble particle and an advancing solid/liquid interface. Metall. Trans. A 1992, 23, 669–680. [Google Scholar] [CrossRef]
  44. Shi, R.; Meier, J.M.; Luo, A.A. Controlling particle/metal interactions in metal matrix composites during solidification: The role of melt viscosity and cooling rate. Metall. Mater. Trans. A 2019, 50, 3736–3747. [Google Scholar] [CrossRef]
  45. Liu, Y.; Han, Q. Interaction between nucleant particles and a solid-liquid interface in Al-4.5Cu alloy. Acta Mater. 2021, 213, 116956. [Google Scholar] [CrossRef]
  46. Youssef, Y.M.; Dashwood, R.J.; Lee, P.D. Effect of clustering on particle pushing and solidification behaviour in TiB2 reinforced aluminium PMMCs. Compos. Part A Appl. S. 2005, 36, 747–763. [Google Scholar] [CrossRef]
  47. Xu, J.Q.; Chen, L.Y.; Choi, H.; Li, X.C. Theoretical study and pathways for nanoparticle capture during solidification of metal melt. J. Phys. Condens. Matter 2012, 24, 255304. [Google Scholar] [CrossRef]
  48. Pötschke, J.; Rogge, V. On the behaviour of foreign particles at an advancing solid-liquid interface. J. Cryst. Growth 1989, 94, 726–738. [Google Scholar] [CrossRef]
  49. Li, Y.; Hu, B.; Liu, B.; Nie, A.; Gu, Q.; Wang, J.; Li, Q. Insight into Si poisoning on grain refinement of Al-Si/Al-5Ti-B system. Acta Mater. 2020, 187, 51–65. [Google Scholar] [CrossRef]
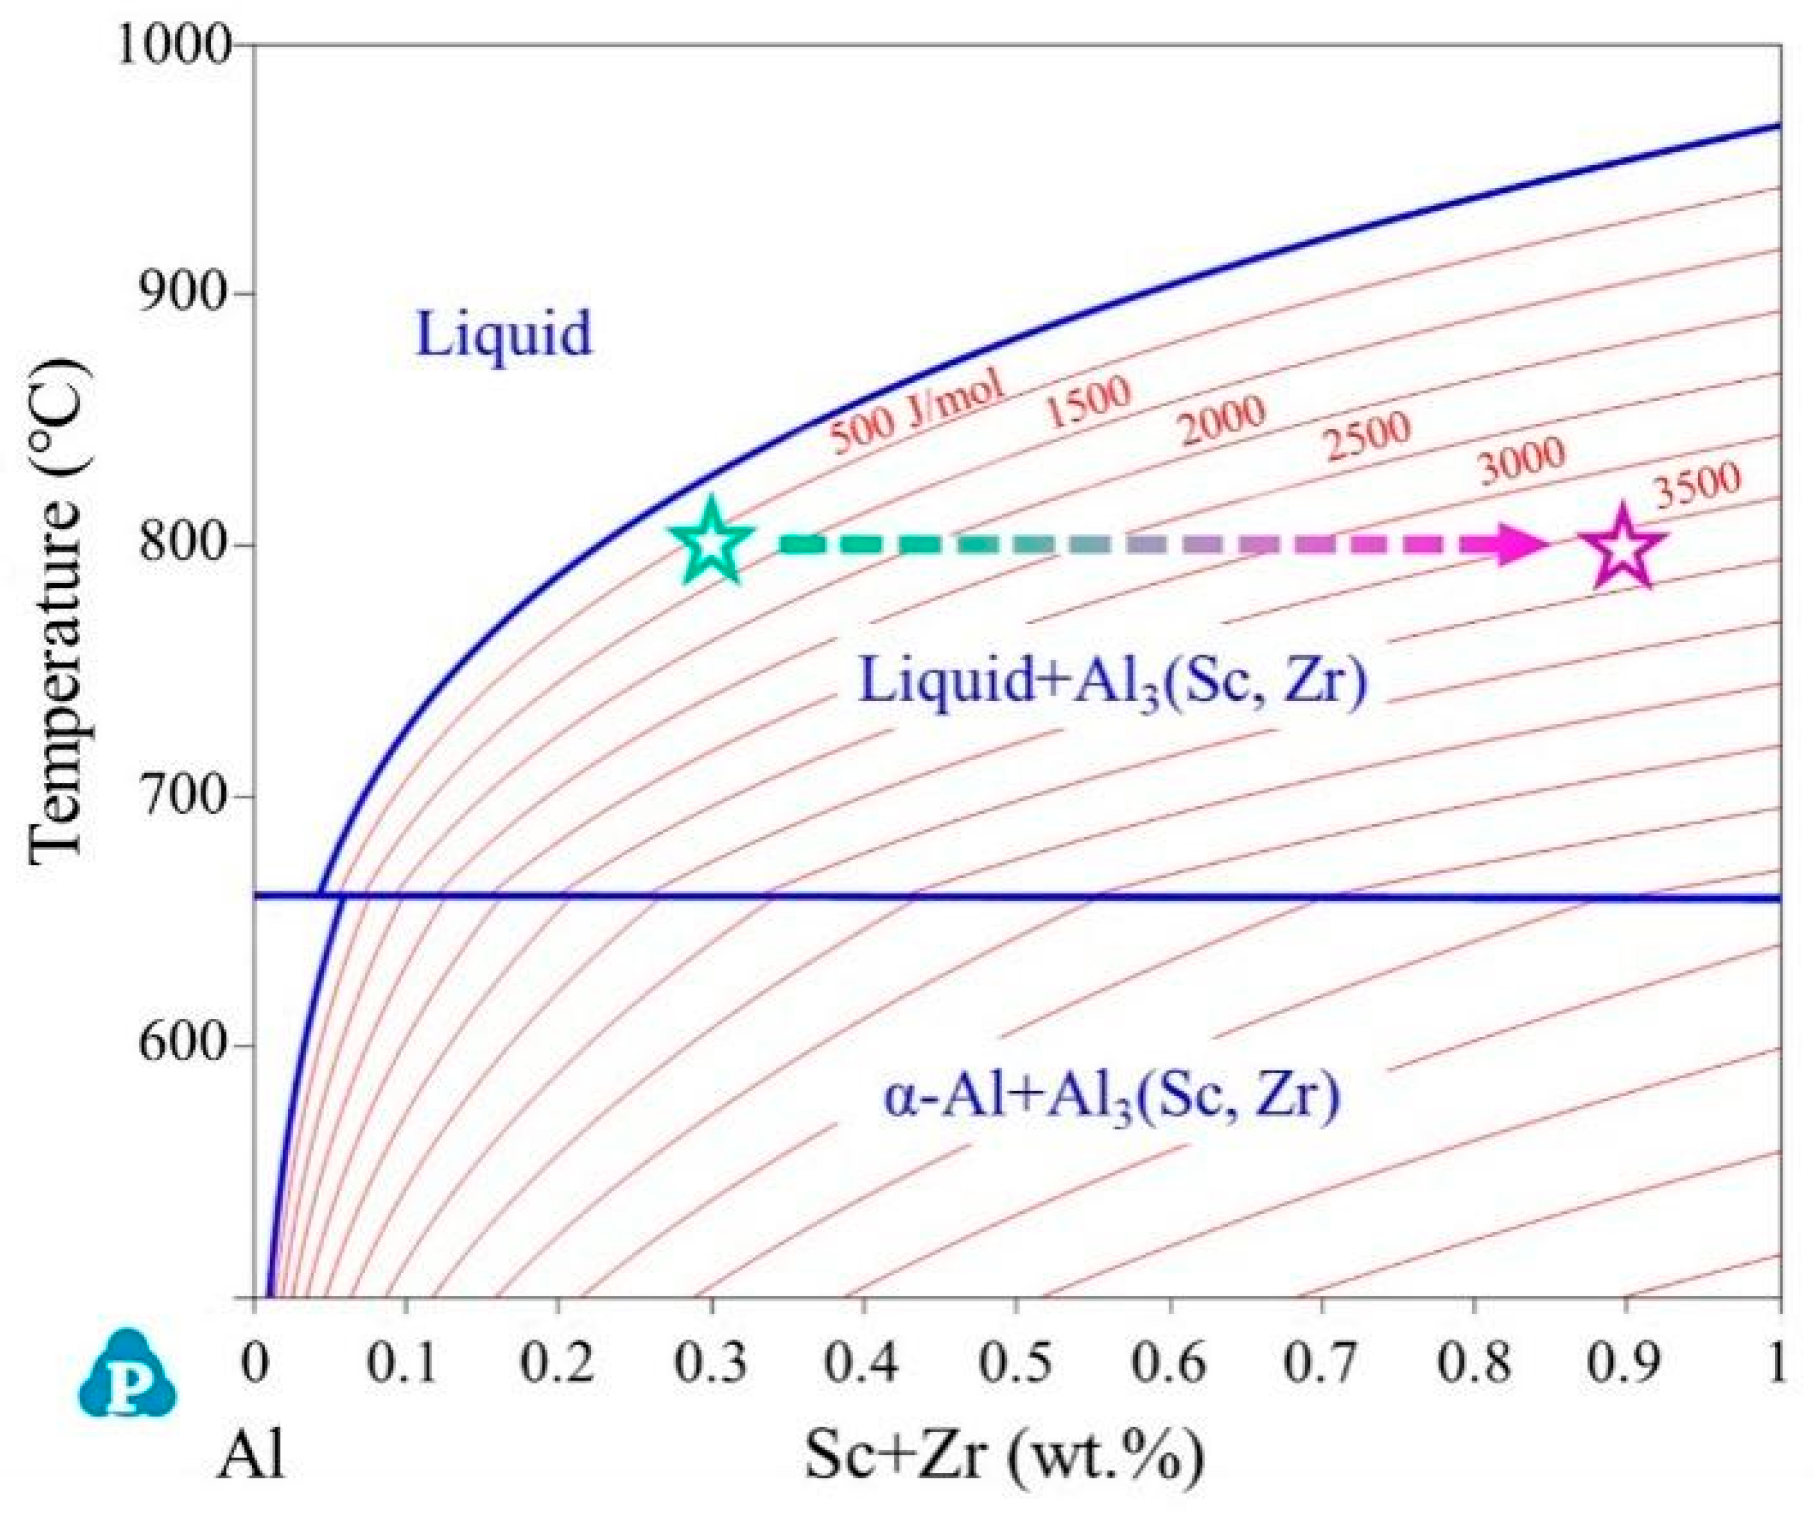
Figure 1. Isopleth section at the Al-rich corner of the Al–xSc–yZr system with x:y = 3:1. The red lines are contours for the driving forces of Al3(Sc,Zr), where stars denote compositions in which the combined content of Sc and Zr increases from 0.3 wt.% to 0.9 wt.%.
Metals 15 00872 g001
Figure 2. Thermodynamic calculations for the 2TiB2/Al–8Ni–xSc–yZr system: (a) Driving forces for L12 phase precipitation at 600 °C; (b) Dissolution temperature contours for Al3(Sc,Zr). The star indicates the selected Sc and Zr concentrations.
Metals 15 00872 g002
Figure 3. (a) Schematic of the wedge-shaped copper mold; (b) Average cooling rates at positions T1–T5 in wedge-shaped copper mold (Adapted from Ref. [14]). The inset shows the temperature–time curves of the positions T1–T5 in the mold chamber during solidification process.
Metals 15 00872 g003
Figure 4. Morphologies and distribution maps of TiB2 and Al3(Sc,Zr) in different regions of 2TiB2/Al–8Ni–0.6Sc–0.1Zr sample prepared by wedge-shaped copper mold: (a1,a2) D = 30 mm; (b1,b2) D = 23 mm; (c1,c2) D = 20 mm; (d1,d2) D = 0.
Metals 15 00872 g004
Figure 5. Elemental mappings of the regions at D = 30 mm (af) and D = 23 mm (gl) in 2TiB2/Al–8Ni–0.6Sc–0.1Zr sample prepared by wedge-shaped copper mold.
Metals 15 00872 g005
Figure 6. Laser scanning confocal microscopy images of melt pool morphologies in the 2TiB2/Al–8Ni (a1a4) and 2TiB2/Al–8Ni–0.6Sc–0.1Zr (b1b4) samples fabricated by laser surface remelting under a constant laser power of 225 W and different laser scanning speeds: (a1,b1) 20 mm/s; (a2,b2) 40 mm/s; (a3,b3) 60 mm/s; (a4,b4) 80 mm/s. Color mapping is employed to represent the degree of surface protrusion relative to the section plane, with warmer hues indicating elevated regions and cooler hues denoting recessed areas.
Metals 15 00872 g006
Figure 7. Characterization of TiB2 particles in samples B2 and B4: (a1) HAADF image; (a2) HRTEM image; (a3) FFT pattern. HAADF images and Sc/Zr mappings for samples B2 (b1b3) and B4 (c1c3).
Metals 15 00872 g007
Figure 8. Orientation relationships (ORs) between TiB2 and α-Al in sample B2: (a) Phase map; (b) {001}α-Al projections with TiB2 poles in grain interior; (c) {001}α-Al projections with TiB2 poles at grain boundaries (GB).
Metals 15 00872 g008
Figure 9. (a) The first quadrant of the {001} α-Al equal-area projection displays the density contours of the {0001} TiB2 poles, overlaid with ideal TiB2/α-Al orientation relationships: (111)α-Al//(0001)TiB2 (red cross), (110)α-Al//(0001)TiB2 (yellow cross), (001)α-Al//(0001)TiB2 (white cross). {001}α-Al projections for A2 and B2 samples: (b,c) A2; (d,e) B2. TiB2 particles are from grain interiors (b,d) and grain boundaries (c,e).
Metals 15 00872 g009
Figure 10. Driving force of L12-Al3(Sc,Zr) in the 2TiB2/Al–8Ni–0.6Sc–0.1Zr melt.
Metals 15 00872 g010
Figure 11. Diffusion coefficient of Sc in the Al–8Ni–0.6Sc–0.1Zr melt.
Metals 15 00872 g011
Figure 12. Temperature-dependent curves of the Al3(Sc,Zr) nucleation rate and the critical height of the spherical-crown Al3(Sc,Zr) embryo.
Metals 15 00872 g012
Figure 13. Variation of the available number density of Al3(Sc,Zr) nuclei with the cooling rate.
Metals 15 00872 g013
Table 1. Chemical composition of the 2TiB2/Al–8Ni–0.6Sc–0.1Zr alloy (wt.%).
AlloyNiScZrTiBAl
2TiB2/Al–8Ni–0.6Sc–0.1Zr8.40 ± 0.320.57 ± 0.060.13 ± 0.021.55 ± 0.090.69 ± 0.06Bal.
Table 2. Model parameters used for the calculations in the heterogeneous nucleation model.
ParameterValueUnitParameterValueUnit
TL932°C x L , e f f 0.017
γS/L0.43J⸱m−3 W m , A l 3 S c 31.5g/mol
θ30° ρ L 2.61 × 10³kg⸱m−3
N5.0 × 1017 ρ A l 3 S c 3.02 × 10³kg⸱m−3
a2.6 × 10−10m ρ T i B 2 4.49 × 10³kg⸱m−3
Table 3. Summary of interface energies used for calculation during particle engulfment process.
InterfaceSymbolEnergy (J/m2)
α-Al/L-Al γ α - Al / L - Al 0.158
TiB2/α-Al γ Ti B 2 / α - Al 2.72
TiB2/L-Al γ Ti B 2 / L - Al 2.39
Al3(Sc,Zr)/L-Al γ A l 3 ( Sc , Zr ) / L - Al 4.3
Al3(Sc,Zr)/α-Al γ A l 3 ( Sc , Zr ) / α - Al 0.14
Al3(Sc,Zr)/TiB2 γ A l 3 ( Sc , Zr ) / Ti B 2 2.02
Disclaimer/Publisher’s Note: The statements, opinions and data contained in all publications are solely those of the individual author(s) and contributor(s) and not of MDPI and/or the editor(s). MDPI and/or the editor(s) disclaim responsibility for any injury to people or property resulting from any ideas, methods, instructions or products referred to in the content.