Article

Massive Fluctuations in the Derivatives of Pair Distribution Function Minima and Maxima During the Glass Transition

by
Michael I. Ojovan
1,*,
Anh Khoa Augustin Lu
2,3,4 and
Dmitri V. Louzguine-Luzgin
4,5
1
School of Chemical, Materials and Biological Engineering, The University of Sheffield, Sheffield S1 3JD, UK
2
Department of Materials Engineering, The University of Tokyo, 7-3-1 Hongo, Bunkyo, Tokyo 113-8656, Japan
3
Research Center for Materials Nanoarchitectonics (MANA), National Institute for Materials Science (NIMS), Tsukuba 305-0044, Japan
4
MathAM-OIL, National Institute of Advanced Industrial Science and Technology (AIST), Sendai 980-8577, Japan
5
Advanced Institute for Materials Research (WPI-AIMR), Tohoku University, Sendai 980-8577, Japan
*
Author to whom correspondence should be addressed.
Metals 2025, 15(8), 869; https://doi.org/10.3390/met15080869
Submission received: 12 June 2025 / Revised: 20 July 2025 / Accepted: 30 July 2025 / Published: 2 August 2025

Abstract

Parametric changes in the first coordination shell (FCS) of a vitreous metallic Pd42.5Cu30Ni7.5P20 alloy are analysed, aiming to confirm the identification of the glass transition temperature (Tg) via processing of XRD patterns utilising radial and pair distribution functions (RDFs and PDFs) and their evolution with temperature. The Wendt–Abraham empirical criterion of glass transition and its modifications are confirmed in line with previous works, which utilised the kink of the temperature dependences of the minima and maxima of both the PDF and the maxima of the structure factor S(q). Massive fluctuations are, however, identified near the Tg of the derivatives of the minima and maxima of the PDF and maxima of S(q), which adds value to understanding the glass transition in the system as a true second-order-like phase transformation in the non-equilibrium system of atoms.

1. Introduction

Glass transition is a generic phenomenon characteristic of amorphous materials ranging from pure elements and oxides to complex polymeric and biological molecules that exhibit solid-like behaviour below the glass transition temperature (Tg, i.e., in the vitreous state and liquid-like state above it) [1,2]. Most often, Tg is determined using differential scanning calorimetry (DSC), which shows a well-seen kink in the temperature dependence of the heat flow evolution of the system at Tg [3,4], although other techniques to determine it are in use that are similar to DSC, i.e., simple (thermal mechanical analysis, TMA) and differential thermal analysis (DTA [5]), which employs various heating and cooling (thermal) cycles. Furthermore, dynamic mechanical analysis is used, in which mechanical stress is applied to the sample, and the resultant strain is measured (dynamic mechanical analysis, DMA, [6]), including specific heat measurements, thermomechanical analysis, thermal expansion measurements [7,8], micro-heat transfer measurement, isothermal compressibility, and heat capacity determination [9]. Structural rearrangements in the non-equilibrium system of species (atoms and molecules) forming a glass are not yet well understood despite numerous works related to glass-forming systems, including bulk metallic glasses [10]. Wendt and Abraham were the first to observe that Tg can be detected by analysing the temperature behaviour of the maxima and minima of radial and pair (normalised according to the average atomic number density variation with the interatomic distance) distribution functions (RDFs and PDFs, respectively), which result from the processing of X-ray or neutron-scattering spectra, as well as from computer experiments using molecular dynamic (MD) simulation [11,12]. They proposed an empirical criterion for finding Tg from the ratio RWA = PDFmin/PDFmax = 0.14 [13]. We showed that the experimentally found criterion RWA = 0.14 is explained in terms of percolation in a system of broken bonds in amorphous materials termed configurons [14]. Indeed, it is known that the rigidity threshold of an elastic percolating network is identical to the percolation threshold [15]; therefore, we can find the critical temperature Tg when the solid-like behaviour changes to a liquid-like behaviour, assigning it to the temperature when percolation via broken bonds occurs [16]. The fraction of broken bonds (configurons) ϕ(T) as a growing function of temperature equals ϕ ( T ) = P D F m i n / P D F m a x ; therefore, the temperature of glass transition in amorphous materials is indeed in line with the Wendt–Abraham empirical rule provided by the following equation: ϕ ( T ) = θ c . For metallic systems, θ c = 0.15 ± 0.01 , which is equal to the universal Scher–Zallen critical density in 3-D space: θc = 0.15 ± 0.01 [17,18]. The presence of kinks in the glass transition was later confirmed by directly analysing the temperature dependences of structural factors S(q), where q is the scattering vector [19].
The presence of kinks at Tg in the temperature dependences of radial and pair distribution functions (RDFs and PDFs) and the structure factor (S(q)) means that their first derivatives experience a jump, which may be useful to more easily detect the glass transition. Moreover, the second derivatives of RDFs, PDFs, and S(q) have a diverging character at Tg, which could facilitate identification. We aim to analyse these features, which, although being present in the temperature behaviours of RDF, PDF, and S(q), were found to not be amenable for practical usage due to the character of the glass transition, which, being a second-order phase transformation, is accompanied by large and increasing amplitude fluctuations near Tg.

2. Theoretical Considerations
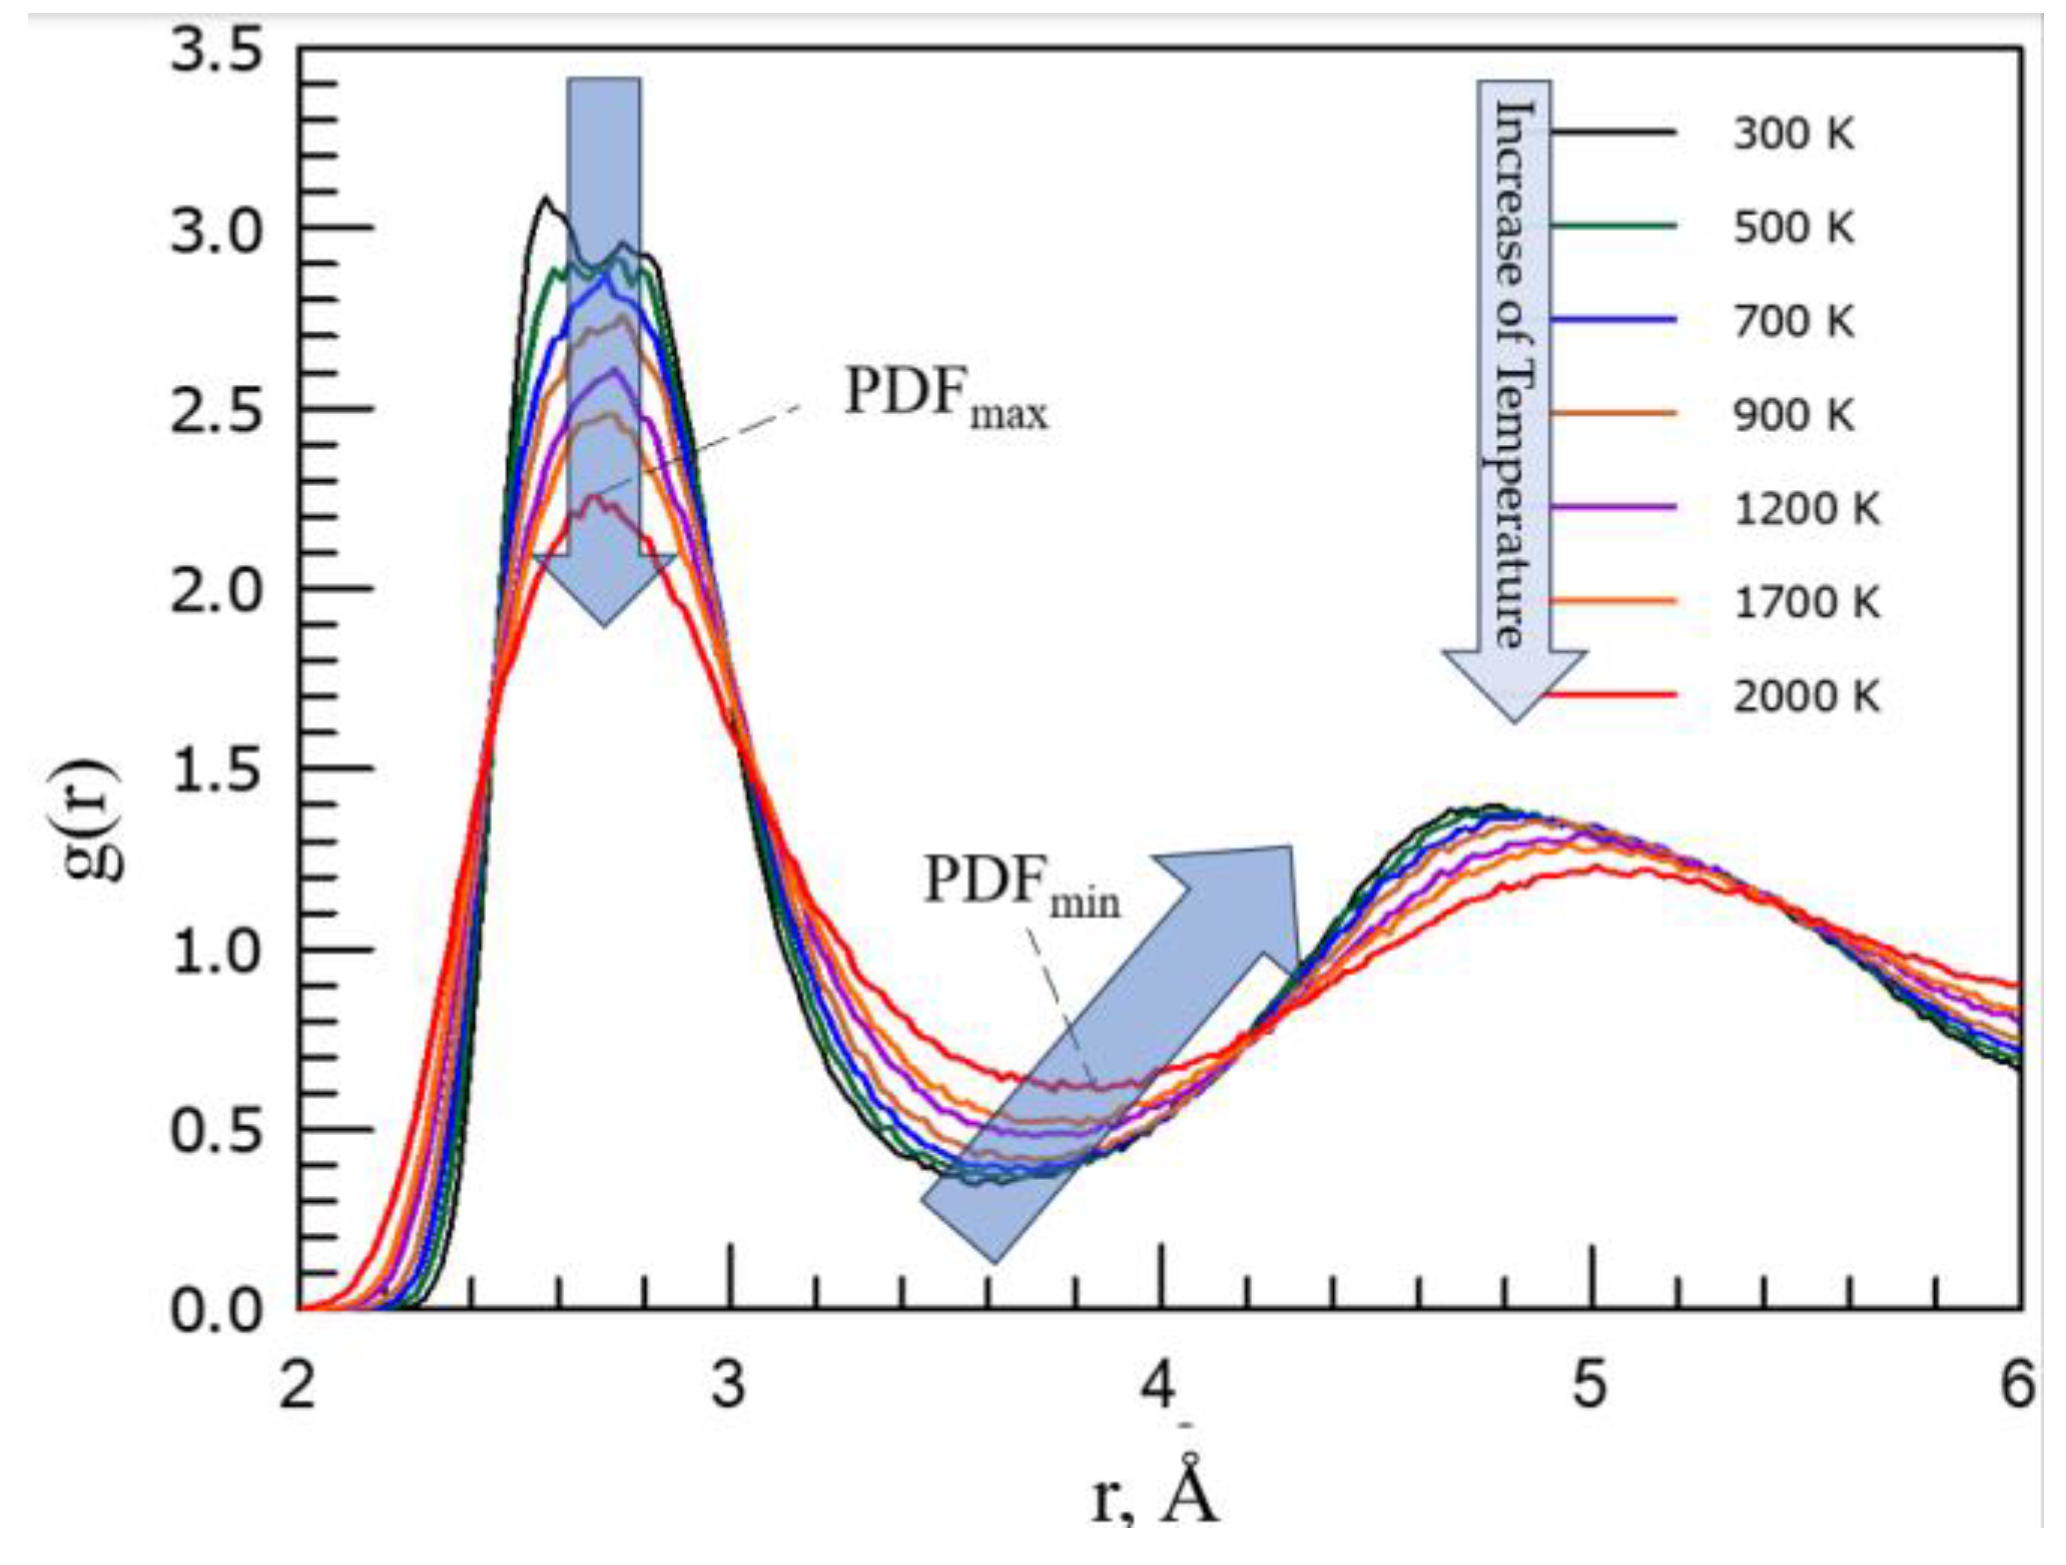
The pair distribution function, denoted as g(r), provides the probability of finding a particle at the distance R from another particle, i.e., it is the probability of finding two particles i and j at a particular separation r = |ri − rj| in the system. In contrast, the structure factor S(q) found from measurements in scattering experiments is essentially the Fourier transform of the PDF (also denoted as g(r)), being related to each other via the following:
g r = 1 + 1 2 π 2 r ρ 0 0 q S q 1 sin q r d q ,
where ρ0 is the average density and q is the scattering vector. PDF(r) and S(q) provide structural and thermodynamic information about the system [14,19,20,21]. If there is more than one atom type present, such as in the case of metallic alloys or oxide glasses, then PDF(r) is typically split into several terms, one for each pair of atomic specie types: e.g., in the case of two species α and β, the partial pair distribution function that characterises correlations between atoms of type α and β is PDFαβ(r) = gαβ(r), provided by the following [22]:
g α β r = 1 + 1 2 π 2 r ρ 0 0 q S α β q 1 sin q r d q ,
where Sαβ(q) is the Faber–Ziman partial structure factor, which, similarly to monoatomic systems, follows the rule Sαβ(q)1 for all α and β. The functions PDFαβ(r) serve as measures of the probabilities of finding a β atom at a distance r from an α atom and calculating the partial coordination numbers nβα which determine the average number of β atoms in a spherical shell around an α atom by integrating partial radial distribution functions.
Typical investigations analyse the behaviour of the first sharp diffraction peak (FSDP) of the structure factor S(q) [19,20,21,22], which reveal features in the reciprocal space, whilst the most prominent and intuitively straightforward features in the real space are provided by peaks of RDF and PDF [13,14,19,20,23,24,25]. The forms of PDF(r) are hence used to understand changes that occur in glasses and melts on temperature variations including structural modifications at the glass transition. The maximum of PDF(r) is positioned at the most probable radii where atoms reside, whereas the minimum of PDF(r) is related to bond distances. The PDFmin(r) is positioned at the end of the first coordination shell (FCS) and corresponds to bonds connecting atoms which, e.g., was illustrated by data for H2O that produces a negative peak at the OH bond distance [26]. The PDF(r) has a peak at a mean inter-particle distance and converges with the increase in distance r oscillating to unit g(r→∞) = 1 (Figure 1).
From experiments for both monoatomic [20] and multiatomic systems [14,23,24,26,27] (as Figure 1 demonstrates), it is known that upon an increase in temperature, the maximum of PDF(r) of amorphous materials (PDFmax) decreases its amplitude while the first PDF(r) minimum (PDFmin) is
(i)
Increasing its amplitude;
(ii)
Shifting its position to larger values.
The shift of the position of PDFmin reflects [14]
(iii)
The formation of configurons (broken chemical bonds);
(iv)
Enlarging the size of the first coordination shell (FCS).
The position of PDFmin is giving the radius of FCS, which increases with the increase in temperature, i.e., this is characterising the thermal expansion of materials due to the increase in temperature.
The experiment is explicitly showing the maximal amplitude of structure factor S(q1), where q1 is the position of the scattering vector where the maximum occurs, with changes in temperature exhibiting a kink as follows:
S q 1 = S 0 s g T   at   T < T g   and S q 1 = S 0 s g T g s l ( T T g )   at   T > T g
The difference in behaviour of the structure factor below and above the Tg is illustrated by Figure 2a.
The coefficient of proportionality (s) for liquids (melts) is always larger compared to solids (glasses): sl > sg. Due to this, from (3) we see that the temperature derivative of the structure factor exhibits a stepwise change at Tg:
S ( q 1 ) / T = s g   at   T < T g   and S ( q 1 ) / T = s l   at   T > T g
The second derivative of the structure factor thus has a singularity at the glass transition:
2 S ( q 1 ) / T 2 = δ ( T T g )
Because steps and deltas can be readily detected from available data, it would be useful to attempt to use (3) and (4) in detecting the glass transition.
The experiment also explicitly shows that the PDFmin follows the same character of temperature dependence near the glass transition exhibiting at Tg a kink:
P D F m i n = P 0 + f g T   at   T < T g   and P D F m i n = P 0 + f g T g + f l ( T T g )   at   T > T g
The coefficient of proportionality fl in (6) obeys the rule fl > fg as seen explicitly from Figure 2b. From (6), we see that the temperature differential of the pair distribution function exhibits a stepwise change at Tg:
P D F m i n / T = f g   at   T < T g   and P D F m i n / T = f l   at   T > T g
The second derivative of the minimum of the FSDM thus also has a singularity at the glass transition:
2 P D F m i n / T 2 = δ ( T T g )
The utilisation of (5) and (8) along with the Wendt–Abraham empirical criterion would hence be a powerful tool in detecting the glass transition in amorphous materials, making the detection of Tg much easier and obvious in practice compared to analyses of dependences of S(q) and PDF(r) with temperature. Based on these ideas, we attempted to process data on vitrifying the metallic alloy Pd-Cu-Ni-P, for which data are available for a confident analysis. As it can be explicitly seen from Figure 2 both in the case of polyatomic (Figure 2a, Equation (1) case) and monoatomic (Figure 2b, Equation (1) case) systems, the linear dependencies occur, which change their slope at the inflection point. This is a generically known fact for all glass-forming systems and serves as the basis of test protocols aiming to identify the calorimetric glass transition [3,4,5,6,9]. It means that Equations (4), (5), (7) and (8) are mathematically valid expressions if the linear dependencies are firstly found and then processed by applying these equations. Our task in this work was to check whether the same results have been obtained if we directly process experimental data without first determining the two linear dependencies below and above the Tg. Two outcomes are then possible. The first expected result is confirming the same results and is for the case when fluctuations (noises) are not growing when approaching the infection point. The second one is a complete failure and is expected when the fluctuations become massive upon approaching the infection point; this is the situation that is typical for phase transformations and hence would indicate a phase change on passing the Tg.

3. Experimental Results

The glass formation process of the Pd42.5Cu30Ni7.5P20 alloy was studied in situ in the previous works [28,29]. In the present work, these data were processed using Equations (4), (5), (7) and (8), aiming to check whether the temperature derivative obeys the expected dependences following these equations. There was not much attention paid to the jumps of derivatives of PDFmin in the literature apart from [14,23,24,25], e.g., the step (jump) at Tg = 794 ± 10 K of Cu was found to be as high as (fl − fg) = 96 ppm (see Figure 4 of [25]). We also accounted that although following the laws of second-order phase transformations, the glass transition has a dual nature and is kinetically controlled due to relaxation phenomena that occur in parallel to structural rearrangements [30,31].
Figure 3 shows the following: (a) the temperature dependence of the RDF minima of the Pd42.5Cu30Ni7.5P20 alloy, confirming via kinks observed that the vitrification occurs at Tg ≈ 300 °C via minima of PDFs; and (b) the Wendt–Abraham criterion, which used the PDF’s minima to the PDF’s maxima ratios.
It is worth comparing data obtained with earlier works by Mattern et al. [19], who analysed the temperature dependences of structure factor S(q1), which followed dependences (4) and (5), with Figure 4 demonstrating the temperature dependence of the structure factor of the Pd42.5Cu30Ni7.5P20 alloy and hence confirming its behaviour being fully in line with previous findings by Mattern et al. in [19].
Figure 4. Variation in the first maximum and minimum of the structure factor S(q) with temperature.
Metals 15 00869 g004
Figure 5 shows the temperature dependences of the first and second derivatives of the maximal value of the structure factor S(q1) in our case after processing our (D.V.L.-L. et al.) previous data taken from references [28,29].
While the expected behaviour of −| S ( q 1 ) / T | as shown in grey colour in Figure 5a is a stepwise function (the Heaviside step function) at Tg, the experimental data of the first derivative of the structure factor show an extremely noisy behaviour at it. Then, instead of the expected delta function as follows from (5) and shown in grey colour in Figure 5b, the experimental data of the second derivative demonstrate a completely noisy and uncontrolled spread including both positive and negative values. Thus, instead of the expected Heavyside step function and delta function at Tg, we observed massive fluctuations for experimental data. Similarly to the above, strongly fluctuating data were obtained for ∂PDF/∂T and 2PDF/∂T2 at Tg, which is now expectedly appropriate, as the PDF(r) and S(q) are interrelated via Equations (1) and (2).

4. Discussion

The results obtained conform to previous data on the Wendt–Abraham empirical criterion of the vitrification of melts while being cooled fast enough [13] and its modification for the first minimum of PDF(r), denoted as PDFmin [14], which through this provides proofs of configuron formation and the expansion of the FCS, e.g., see Table 1 of [23]. The glass transition temperature found agrees with data previously known—see, e.g., Figure 2a—although there is some spread of experimental points near the inflection point. Figure 2b with more recent results from [25] also shows high deviations from the idealised linear approximation near the inflection point, which identifies the Tg. In the meantime, the attempts to use the stepwise temperature dependence of ∂S/∂T and the diverging character of ∂2S/∂T2 at Tg have clearly failed. The reason behind this is in the characteristics of the glass transition and massive fluctuations of both ∂S/∂T and ∂2S/∂T2 instead of the idealised dependences via Equations (4), (5), (7) and (8), which are also shown in Figure 5 by grey coloured lines.
The glass transition expresses itself at the calorimetric glass transition temperature [3,32,33,34] as a second-order phase transformation with all its attributes following the Ehrenfest classification of phase transformations [35,36,37]. Namely, it is a continuous transformation with continuous thermodynamic functions such as Gibbs free energy G(T,P), entropy S(T,P), volume V(T,P), and discontinuities in response functions (susceptibilities) such as heat capacity, compressibility, and the thermal expansion coefficient, and all these are always seen during the glass transition [3,32,33,34,38]. Due to this, the International Union of Pure and Applied Chemistry (IUPAC) defines the glass transition as a second-order transition in which a supercooled melt yields, on cooling, a glassy structure, so that below the glass transition temperature, the physical properties vary in a manner similar to those of the crystalline phase [39].
The theoretical analysis of phase transitions is well known, e.g., in the first-order phase, transitions such as crystallisation of the correlation length (e.g., the size of the new phase) remains finite, while for continuous phase transitions the correlation length diverges when approaching the phase transition. The configuron percolation theory (CPT) of glass transition [16,22,40] gives for the correlation length a diverging dependence at temperatures approaching Tg:
ξ ( T ) ξ 0 T T g ν
where ξ0 has the order of interatomic distance, the critical exponent ν in three-dimensional space is ν = 0.88, and ξ(T) diverges at Tg, in contrast to the structural coherence length that characterises the exponential decay of atomic pair distribution function oscillations beyond the first peak, which increases with decreasing temperature and freezes at the glass transition [41]. The amorphous material near the glass transition is dynamically inhomogeneous on length scales smaller than ξ(T), while at temperatures far from the Tg, the correlation length becomes small, and the amorphous material is homogeneous. Fluctuations in the system of disordered species (atoms or molecules) become correlated over all distances, and that forces the whole system to be in a unique phase, which is critical at the phase transition [36,37,42,43].
The phenomenon of increasing fluctuations in the vicinity of a phase transition is best demonstrated with the critical opalescence phenomena and is already known to be present for glass transition [44,45]. Therefore, the massive fluctuations in approaching the glass transition temperature evidently seen in Figure 5 should not be surprising while interpreting the glass transition as a true second-order phase transformation, although it occurs in a non-equilibrium system of atoms and molecules constituting the amorphous material. It is now recognised that in addition to equilibrium phase transitions [36,45], non-equilibrium phase transitions are rather common across a wide range of scientific disciplines [46,47,48,49], manifesting in a rich variety of both static and dynamic patterns including ergodicity breaking; the Mpemba [50,51,52,53], Bokov [44], and Kovacs effects [54,55]; and the asymmetry of heating–cooling [56,57]. It is worth noting that the classification of glass transition as a second-order transition in Ehrenfest terms remains debated within the scientific community. Most physicists and materials scientists agree that it does not meet the criteria for a second-order equilibrium transition, mainly due to its non-equilibrium nature and time dependence. In this respect, the extension of the analysis of glass transition to that belonging to phase transformations in non-equilibrium systems is assisting in unveiling its nature and dual, both kinetic and thermodynamic, character [30,40].
Thus, the fluctuations (inherent noises) encountered upon analysing the glass transition in the Pd-Cu-Ni-P alloy (a very fragile metallic glass with a fragility index m = 60 [58,59]) are well expected within the theory of second-order (or second-order-like) phase transformations and once observed can be considered as an additional argument in favour of the effects associated with a true phase transformation. Moreover, there are some reasons to believe that fragility can be related to the properties of the resulting glass [60]. The proposed delta-like or step-wise behaviour in structural derivatives (7) and (8) cannot be directly revealed from experiments, namely due the intrinsic noises/fluctuations that are always associated with second-order transitions.
While the glass transition is traditionally viewed as a kinetic freezing process, strong evidence from modern studies supports its interpretation as a true phase transition [38,61] or a topological phase transition [62]. Unveiling the structural mechanisms behind the glass transition then enables practical utilisation in various applications [63,64,65,66]. The Wendt–Abraham empirical criterion [13] and its analogues [14,27] enable the identification of the glass transition temperature Tg. However, why is the glass transition interval quite wide? We know that glass is not uniform: it has densely packed and loosely packed regions [67]. It can be assumed that the glass transition of these regions occurs at slightly different temperatures, which gives the glass transition interval. Moreover, two relaxation processes competing with each other related to the different diffusion coefficients of the alloying elements were observed [68].

5. Conclusions

The Wendt–Abraham empirical law of glass transition is confirmed as valid for the Pd-Cu-Ni-P metallic glass-forming alloy, which conforms to previous works. Attempts to process derivatives of the pair distribution function and structure factor failed because of massive fluctuations on approaching the glass transition, which confirms the concept of glass transition as a second-order-like phase transformation in the non-equilibrium system of atoms following the Ehrenfest classification scheme. Consequently, the observed massive fluctuations have a generic character for amorphous systems at the glass transition.

Author Contributions

Conceptualization, M.I.O. and D.V.L.-L.; methodology, M.I.O.; software, A.K.A.L.; validation, D.V.L.-L. and A.K.A.L.; writing—original draft preparation, M.I.O., D.V.L.-L. and A.K.A.L.; writing—review and editing, M.I.O., D.V.L.-L. and A.K.A.L.; funding acquisition, A.K.A.L. All authors have read and agreed to the published version of the manuscript.

Funding

This study was partly supported by JSPS KAKENHI under Grant No. 24K01284.

Data Availability Statement

The original contributions presented in this study are included in the article. Further inquiries can be directed to the corresponding author.

Conflicts of Interest

The authors declare no conflicts of interest.

Abbreviations

The following abbreviations are used in this manuscript:
CPTConfiguron percolation theory
FCSFirst coordination shell
FSDMFirst sharp diffraction minimum
DMADynamic mechanical analysis,
DTADifferential thermal analysis
PDFPair distribution function
RDFRadial distribution function
TMAThermal mechanical analysis

References

  1. Kauzmann, W. The nature of the glassy state and the behavior of liquids at low temperatures. Chem. Rev. 1948, 43, 219–256. [Google Scholar] [CrossRef]
  2. Martinez, L.-M.; Angell, C.A. A thermodynamic connection to the fragility of glass-forming liquids. Nature 2001, 410, 663–667. [Google Scholar] [CrossRef]
  3. Zheng, Q.; Zhang, Y.; Montazerian, M.; Gulbiten, O.; Mauro, J.C.; Zanotto, E.D.; Yue, Y. Understanding glass through differential scanning calorimetry. Chem. Rev. 2019, 119, 7848–7939. [Google Scholar] [CrossRef]
  4. ASTM E1356-08; Standard Test Method for Assignment of the Glass Transition Temperatures by Differential Scanning Calorimetry. American Society of Testing and Materials: Philadelphia, PA, USA, 2014. Available online: https://www.astm.org/e1356-08r14.html (accessed on 29 July 2025).
  5. ASTM E794-06; Standard Test Method for Melting and Crystallization Temperatures by Thermal Analysis. American Society of Testing and Materials: Philadelphia, PA, USA, 2018. Available online: https://www.astm.org/e0794-06r18.html (accessed on 29 July 2025).
  6. ASTM E1640-13; Standard Test Method for Assignment of the Glass Transition Temperature by Dynamic Mechanical Analysis. American Society of Testing and Materials: Philadelphia, PA, USA, 2018.
  7. Kato, H.; Yavari, A.R.; Le Moulec, A.; Inoue, A.; Nishiyama, N.; Lupu, N.; Matsubara, E.; Botta, W.J.; Vaughan, G.; Di Michiel, M.; et al. Excess free volume in metallic glasses measured by X-ray diffraction. Acta Mater. 2005, 53, 1611. [Google Scholar] [CrossRef]
  8. Chen, H.-S.; Inoue, A. Relationship between thermal expansion coefficient and glass transition temperature in metallic glasses. Scr. Mater. 2008, 58, 1106–1109. [Google Scholar] [CrossRef]
  9. Glass Transition Temperature. Omnexus. Available online: https://www.specialchem.com/plastics/guide/glass-transition-temperature (accessed on 16 July 2025).
  10. Suryanarayana, C.; Inoue, A. Bulk metallic Glasses, 2nd ed.; CRC Press: Boca Raton, FL, USA, 2017; p. 520. [Google Scholar]
  11. Louzguine-Luzgin, D.V.; Belosludov, R.V.; Ojovan, M.I. Room-temperature pressure-induced phase separation in glassy alloys. Mater. Today Commun. 2024, 40, 109453. [Google Scholar] [CrossRef]
  12. Louzguine-Luzgin, D.V. Crystallization of metallic glasses and supercooled liquids. Materials 2024, 17, 3573. [Google Scholar] [CrossRef] [PubMed]
  13. Wendt, H.H.; Abraham, F.F. Empirical criterion for the glass transition region based on monte carlo simulations. Phys. Rev. Lett. 1978, 41, 1244–1246. [Google Scholar] [CrossRef]
  14. Ojovan, M.I.; Louzguine-Luzgin, D.V. Revealing structural changes at glass transition via radial distribution functions. J. Phys. Chem. B 2020, 124, 3186–3194. [Google Scholar] [CrossRef]
  15. Kantor, Y.; Webman, I. Elastic properties of random percolating systems. Phys. Rev. Lett. 1984, 52, 1891–1894. [Google Scholar] [CrossRef]
  16. Ojovan, M.I. Glass formation in amorphous SiO2 as a percolation phase transition in a system of network defects. J. Exp. Theor. Phys. Lett. 2004, 79, 632–634. [Google Scholar] [CrossRef]
  17. Scher, H.; Zallen, R. Critical Density in Percolation Processes. J. Chem. Phys. 1970, 53, 3759–3761. [Google Scholar] [CrossRef]
  18. Isichenko, M.B. Percolation, Statistical Topography, and Transport in Random Media. Rev. Mod. Phys. 1992, 64, 961–1043. [Google Scholar] [CrossRef]
  19. Mattern, N.; Hermann, H.; Roth, S.; Sakowski, J.; Macht, M.-P.; Jovari, P.; Jiang, J. Structural behavior of Pd40Cu30Ni10P20 bulk metallic glass below and above the glass transition. Appl. Phys. Lett. 2003, 82, 2589–2591. [Google Scholar] [CrossRef]
  20. Hansen, J.-P.; McDonald, I.R. Theory of Simple Liquids, 3rd ed.; Academic Press: Cambridge, MA, USA, 2006; pp. 78–108. [Google Scholar] [CrossRef]
  21. Kitamura, T. Liquid Glass Transition. A Unified Theory from the Two Band Model; Elsevier: Amsterdam, The Netherlands, 2013. [Google Scholar] [CrossRef]
  22. Fischer, H.E.; Barnes, A.C.; Salmon, P.S. Neutron and X-ray Diffraction Studies of Liquids and Glasses. Rep. Prog. Phys. 2006, 69, 233–299. [Google Scholar] [CrossRef]
  23. Ojovan, M.I. The Modified Random Network (MRN) Model within the Configuron Percolation Theory (CPT) of Glass Transition. Ceramics 2021, 4, 121–134. [Google Scholar] [CrossRef]
  24. Ojovan, M.I.; Tournier, R.F. On structural rearrangements near the glass transition temperature in amorphous silica. Materials 2021, 14, 19. [Google Scholar] [CrossRef]
  25. Ojovan, M.I.; Louzguine-Luzgin, D.V. On Structural Rearrangements during the Vitrification of Molten Copper. Materials 2022, 15, 1313. [Google Scholar] [CrossRef]
  26. Soper, A.K. The Radial Distribution Functions of Water as Derived from Radiation Total Scattering Experiments: Is There Anything We Can Say for Sure? ISRN Phys. Chem. 2013, 2013, 279463. [Google Scholar] [CrossRef]
  27. Stoch, P.; Krakowiak, I. Thermal properties of Sr-containing iron-phosphate glasses experimental and theoretical approach. J. Therm. Anal. Calorim. 2025. [Google Scholar] [CrossRef]
  28. Georgarakis, K.; Louzguine-Luzgin, D.V.; Antonowicz, J.; Vaughan, G.; Yavari, A.R.; Egami, T.; Inoue, A. Variations in atomic structural features of a supercooled Pd–Ni–Cu–P glass forming liquid during in situ vitrification. Acta Mater. 2011, 59, 708–716. [Google Scholar] [CrossRef]
  29. Louzguine-Luzgin, D.V.; Belosludov, R.A.; Yavari, R.; Georgarakis, K.; Vaughan, G.; Kawazoe, Y.; Egami, T.; Inoue, A. Structural basis for supercooled liquid fragility established by synchrotron-radiation method and computer simulation. J. Appl. Phys. 2011, 110, 043519. [Google Scholar] [CrossRef]
  30. Sanditov, D.S.; Ojovan, M.I. Relaxation aspects of the liquid—Glass transition. Phys. Uspekhi 2019, 62, 111–130. [Google Scholar] [CrossRef]
  31. Gallino, I.; Busch, R. Thermodynamic and kinetic Aspects of the Glass Transition. In Physical Metallurgy of Bulk Metallic Glass-Forming Liquids; Springer Series in Materials Science; Springer: Berlin/Heidelberg, Germany, 2024; Volume 341. [Google Scholar]
  32. Yue, Y.-Z. Characteristic temperatures of enthalpy relaxation in glass. J. Non-Cryst. Solids 2008, 354, 1112–1118. [Google Scholar] [CrossRef]
  33. Varshneya, A.K. Fundamentals of Inorganic Glasses; Society of Glass Technology: Sheffield, UK, 2006. [Google Scholar]
  34. Zarzycki, J. Glasses and the Vitreous State; Cambridge University Press: Cambridge, UK, 1982. [Google Scholar]
  35. Ehrenfest, P. Phasenumwandlungen im Ueblichen und Erweiterten Sinn, Classifiziert nach den Entsprechenden SINGULARITAETEN des Thermodynamischen Potentiales; N. V. Noord-Hollandsche Uitgevers Maatschappij: Amsterdam, The Netherlands, 1933. [Google Scholar]
  36. Landau, L.D.; Lifshitz, E.M. Course of Theoretical Physics Volume 5: Statistical Physics Part 1; Elsevier: Amsterdam, The Netherlands, 2012. [Google Scholar]
  37. Stanley, H.E. Introduction to Phase Transitions and Critical Phenomena; International Series of Monographs on Physics; Oxford University Press: Oxford, UK, 1987. [Google Scholar]
  38. Albert, S.; Bauer, T.H.; Michl, M.; Biroli, G.; Bouchaud, J.-P.; Loidl, A.; Lunkenheimer, P.; Tourbot, R.; Wiertel-Gasquet, C.; Ladieu, F. Fifth-order susceptibility unveils growth of thermodynamic amorphous order in glass-formers. Science 2016, 352, 1308−1311. [Google Scholar] [CrossRef] [PubMed]
  39. IUPAC. Compendium of Chemical Terminology; Royal Society of Chemistry: Cambridge, UK, 1997; Volume 66, p. 583. [Google Scholar]
  40. Ojovan, M. Glass formation., Chapter 3.1. In Encyclopedia of Glass Science, Technology, History, and Culture; Richet, P., Conradt, R., Takada, A., Dyon, J., Eds.; Wiley: Hoboken, NJ, USA, 2021; Volume 1568, pp. 249–259. [Google Scholar]
  41. Egami, T.; Ryu, C.W. Origin of medium-range atomic correlation in simple liquids: Density wave theory. AIP Adv. 2023, 13, 085308. [Google Scholar] [CrossRef]
  42. Patashinsky, A.Z.; Pokrovsky, V.L. Fluctuation Theory of Phase Transition; Nauka: Moscow, Russia, 1982; p. 382. [Google Scholar]
  43. Kuhner, C.L. Phase Transitions and Critical Phenomena. Statistical Physics Seminar SS2023. Seminar Talk Summary for the Seminar of Statistical Physics Held by Prof. Wolschin; Department of Physics, Heidelberg University: Heidelberg, Germany, 2023; Volume 25. [Google Scholar]
  44. Bokov, N.A. Non-equilibrium fluctuations as a plausible reason of the light scattering intensity peak in the glass transition region. J. Non-Cryst. Solids 2008, 354, 1119–1122. [Google Scholar] [CrossRef]
  45. Goldenfeld, N. Lectures on Phase Transitions and the Renormalization Group; CRC Press: Boca Raton, FL, USA, 2018. [Google Scholar]
  46. Haken, H. Synergetics: An Introduction: Nonequilibrium Phase Transitions and Self-Organization in Physics; Chemistry and Biology Springer: Berlin, Germany, 2004. [Google Scholar]
  47. Henkel, M.; Pleimling, M. Non-Equilibrium Phase Transitions: Volume 2: Ageing and Dynamical Scaling Far from Equilibrium; Springer Science & Business Media: Dordrecht, The Netherlands, 2011. [Google Scholar]
  48. Vadakkayil, N.; Esposito, M.; Meibohm, J. Critical fluctuations at a finite-time dynamical phase transition. Phys. Re. E 2024, 110, 064156. [Google Scholar] [CrossRef]
  49. Bray, A.J. Theory of phase-ordering kinetics. Adv. Phys. 2002, 51, 481. [Google Scholar] [CrossRef]
  50. Lu, Z.; Raz, O. Nonequilibrium thermodynamics of the Markovian Mpemba effect and its inverse. Proc. Natl. Acad. Sci. USA 2017, 114, 5083. [Google Scholar] [CrossRef]
  51. Vadakkayil, N.; Das, S.K. Should a hotter paramagnet transform quicker to a ferromagnet? Monte Carlo simulation results for Ising model. Phys. Chem. Chem. Phys. 2021, 23, 11186. [Google Scholar] [CrossRef]
  52. Tournier, R.F.; Ojovan, M.I. Building and Breaking Bonds by Homogenous Nucleation in Glass-Forming Melts Leading to Transitions in Three Liquid States. Materials 2021, 14, 2287. [Google Scholar] [CrossRef]
  53. Holtzman, R.; Raz, O. Landau theory for the Mpemba effect through phase transitions. Commun. Phys. 2022, 5, 280. [Google Scholar] [CrossRef]
  54. Kovacs, A.J.; Aklonis, J.J.; Hutchinson, J.M.; Ramos, A.R. Isobaric volume and enthalpy recovery of glasses. II. A transparent multiparameter theory. J. Polym. Sci. Polym. Phys. 1979, 17, 1097. [Google Scholar] [CrossRef]
  55. Bertin, E.; Bouchaud, J.; Drouffe, J.; Godreche, C. The Kovacs effect in model glasses. J. Phys. A 2003, 36, 10701. [Google Scholar] [CrossRef]
  56. Meibohm, J.; Forastiere, D.; Adeleke-Larodo, T.; Proesmans, K. Relaxation-speed crossover in anharmonic potentials. Phys. Rev. E 2021, 104, L032105. [Google Scholar] [CrossRef] [PubMed]
  57. Ibáñez, M.; Dieball, C.; Lasanta, A.; Godec, A.; Rica, R.A. Heating and cooling are fundamentally asymmetric and evolve along distinct pathways. Nat. Phys. 2024, 20, 135. [Google Scholar] [CrossRef]
  58. Fan, G.J.; Löffler, J.F.; Wunderlich, R.K.; Fecht, H.J. Thermodynamics, enthalpy relaxation and fragility of the bulk metallic glass-forming liquid Pd43Ni10Cu27P20. Acta Mater. 2004, 52, 667. [Google Scholar] [CrossRef]
  59. Mauro, N.A.; Blodgett, M.; Johnson, M.L.; Vogt, A.J.; Kelton, K.F. A structural signature of liquid fragility. Nat. Commun. 2014, 5, 4616. [Google Scholar] [CrossRef]
  60. Scopigno, T.; Ruocco, G.; Sette, F.; Monaco, G. Is the fragility of a liquid embedded in the properties of its glass? Science 2003, 302, 849–852. [Google Scholar] [CrossRef]
  61. Tanaka, H.; Kawasaki, T.; Shintani, H.; Watanabe, K. Critical-like behaviour of glass-forming liquids. Nat. Mater. 2010, 9, 324–331. [Google Scholar] [CrossRef]
  62. Vasin, M.G. Glass transition as a topological phase transition. Phys. Rev. E 2022, 106, 044124. [Google Scholar] [CrossRef]
  63. Ojovan, M.I. The Flow of Glasses and Glass–Liquid Transition under Electron Irradiation. Int. J. Mol. Sci. 2023, 24, 12120. [Google Scholar] [CrossRef]
  64. Rusinowicz, M.; Sao-Joao, S.; Bourguignon, M.; Rosales-Sosa, G.; Kato, Y.; Volpi, F.; Barthel, E.; Kermouche, G. Electric charges as an apparent governing parameter for electron induced stress relaxation in amorphous silica micropillars. Scr. Mater. 2025, 261, 116628. [Google Scholar] [CrossRef]
  65. Bruns, S.; Kang, S.-G.; Choi, I.S.; Durst, K. The role of electron-beam irradiation on small-scale deformation: Challenges and benefits in in situ SEM indentation tests. MRS Bull. 2025, 50, 735–748. [Google Scholar] [CrossRef]
  66. Ulitin, N.V.; Shadrina, G.R.; Anisimova, V.I.; Rodionov, I.S.; Baldinov, A.A.; Lyulinskaya, Y.L.; Tereshchenko, K.A.; Shiyan, D.A. Interpretation of the Structure–Glass Transition Temperature Relationship for Organic Homopolymers with the Use of Increment, Random Forest, and Density Functional Theory Methods. J. Struct. Chem. 2025, 66, 1095–1109. [Google Scholar] [CrossRef]
  67. Qiao, J.C.; Wang, Q.; Pelletier, J.M.; Kato, H.; Casalini, R.; Crespo, D.; Pineda, E.; Yao, Y.; Yang, Y. Structural heterogeneities and mechanical behavior of amorphous alloys. Prog. Mater. Sci. 2019, 104, 250–329. [Google Scholar] [CrossRef]
  68. Louzguine-Luzgin, D.V.; Seki, I.; Yamamoto, T.; Kawaji, H.; Suryanarayana, C.; Inoue, A. Double-stage glass transition in a metallic glass. Phys. Rev. B 2010, 81, 144202. [Google Scholar] [CrossRef]
Figure 1. Pair distribution function PDF = g(r) of amorphous Ti2Ni (Ti67Ni33) alloy obtained via molecular dynamic (MD) simulation at a cooling rate of ≈1012 K/s (Adapted with permission from [14]. Copyright 2020 American Chemical Society).
Metals 15 00869 g001
Figure 2. Variation with temperature of structural factor S(q) and pair distribution function PDF(r) on crossing the glass transition temperature: (a) the first maximum of the structure factor S(q)max and its shifting position q1 reflecting the thermal expansion of Pd40Cu30Ni10P20 bulk metallic glass (Reprinted with permission from Ref. [19], AIP Publishing); (b) the values of the pair distribution function first minimum PDFmin of Cu following the method proposed in (Adapted from Ref. [14]) and ratios of PDFmin/PDFmax after the Wendt–Abraham criterion (Adapted from Ref. [13]) as a function of temperature, where the inset shows the definitions of parameters used with PDF(r) given for three temperatures, T = 2500, 1400, and 300 K, respectively. Reproduced with permission from Ref. [25], MDPI.
Metals 15 00869 g002
Figure 3. Variation with temperature of (a) minima of PDFs; (b) ratios of minima to maxima of PDF following Wendt–Abraham (Adapted from Ref. [13]). The glass transition temperature is identified as Tg ≈ 300 °C.
Metals 15 00869 g003
Figure 5. Variation with temperature of (a) the temperature derivatives of the first maximum value of the structure factor −|S(q1)/T| and (b) the second temperature derivative −|2S(q1)T2|. The idealised stepwise (in (a)) and delta-function-wise (in (b)) behaviours expected without account of fluctuations are shown by grey colour. The glass transition temperature was previously identified as Tg ≈ 300 °C.
Metals 15 00869 g005
Disclaimer/Publisher’s Note: The statements, opinions and data contained in all publications are solely those of the individual author(s) and contributor(s) and not of MDPI and/or the editor(s). MDPI and/or the editor(s) disclaim responsibility for any injury to people or property resulting from any ideas, methods, instructions or products referred to in the content.

