Article

Deposition Process and Interface Performance of Aluminum–Steel Joints Prepared Using CMT Technology

1
Gansu Electric Apparatus Research Institute, No. 6-6, Changkai Road, Qinzhou District, Tianshui 741000, China
2
State Key Laboratory of Advanced Processing and Recycling of Non-Forrous Metal, Lanzhou University of Technology, Lanzhou 730050, China
3
Gansu Province Special Equipment Inspection and Testing Institute, Lanzhou 730050, China
*
Authors to whom correspondence should be addressed.
Metals 2025, 15(8), 844; https://doi.org/10.3390/met15080844
Submission received: 12 June 2025 / Revised: 16 July 2025 / Accepted: 24 July 2025 / Published: 29 July 2025

Abstract

The anode assembly, as a key component in the electrolytic aluminum process, is composed of steel claws and aluminum guide rods. The connection quality between the steel claws and guide rods directly affects the current conduction efficiency, energy consumption, and operational stability of equipment. Achieving high-quality joining between the aluminum alloy and steel has become a key process in the preparation of the anode assembly. To join the guide rods and steel claws, this work uses Cold Metal Transfer (CMT) technology to clad aluminum on the steel surface and employs machine vision to detect surface forming defects in the cladding layer. The influence of different currents on the interfacial microstructure and mechanical properties of aluminum alloy cladding on the steel surface was investigated. The results show that increasing the cladding current leads to an increase in the width of the fusion line and grain size and the formation of layered Fe2Al5 intermetallic compounds (IMCs) at the interface. As the current increases from 90 A to 110 A, the thickness of the Al-Fe IMC layer increases from 1.46 μm to 2.06 μm. When the current reaches 110 A, the thickness of the interfacial brittle phase is the largest, at 2 ± 0.5 μm. The interfacial region where aluminum and steel are fused has the highest hardness, and the tensile strength first increases and then decreases with the current. The highest tensile strength is 120.45 MPa at 100 A. All the fracture surfaces exhibit a brittle fracture.

1. Introduction

Aluminum, a lightweight metal material with high strength and excellent corrosion resistance, has become one of the most widely used metal materials in the world, ranking second in metal material consumption [1,2,3]. At present, the industry mainly uses electrolysis to produce aluminum. This process not only needs to be carried out at high temperatures, but also consumes huge amounts of electricity [4]. This places extremely high demands on the anode guide rod assembly, a key component in the electrolytic cell. The anode guide rod assembly consists of an aluminum guide rod and a steel claw [5,6]. In the preparation process of the anode aluminum guide rod assembly, the welding of aluminum and steel has become a core technical problem that needs to be solved urgently. Due to the significant differences in the physical properties, such as thermal conductivity and linear expansion coefficient, between aluminum and steel, large residual stress and thermal deformation are easily generated during the welding process, which leads to the occurrence of welding cracks [7].
To join the aluminum and steel, many novel methods were developed, such as laser welding, arc welding, and stir friction welding [8,9,10], as well as diffusion welding [11,12] and ultrasonic spot welding [13,14]. Xia et al. [15] used laser brazing to achieve the connection of 6061-T6 aluminum alloy and dual-phase steel DP590. It was found that the cross-type dual laser beam was beneficial to reduce the thickness of the IMC at the interface, making the interface morphology uniform, and the tensile strength could reach up to 196 MPa. Rest et al. [16] used stir friction welding technology to connect aluminum and steel dissimilar metal materials. They reported that the IMC layer composed of FeAl3 and Fe2Al5 phases with a thickness of 2.5 μm was formed at interface. The fracture mainly occurred in the matrix. Rui et al. [17] showed that applying a magnetic field during aluminum–steel TIG welding can significantly improve the microstructure of the joint. The thickness of the IMCs was reduced from 5 μm to 3 μm. The distribution of second phases such as Al3FeSi was optimized, and the formation of coarse Al grains and the Al-Si eutectic phase were effectively inhibited. Shi et al. [18]. conducted diffusion welding tests on 5A02 aluminum alloy and SUS304 steel. When the welding time was 60 min, a high-quality joint was obtained with a tensile shear strength of 101.3 MPa. Chen et al. [19] showed that when Al5754 and galvanized steel were ultrasonically welded, the interface was mainly composed of an Al-Zn eutectic phase and a small amount of IMCs (Fe2Al5 and FeAl3). According to the fracture morphology analysis, the cracks preferentially initiated in the interface reaction layer, forming an interface fracture. Zhang et al. [20] achieved crack-free dissimilar joints between aluminum and galvanized steel using CMT welding–brazing technology. Fe-Al intermetallic compounds (IMCs) were formed at the steel/weld interface, and the thickness and composition of the IMCs were found to depend on the welding heat input. Similarly, Cao et al. [21] optimized the heat input in the CMT welding–brazing process to a range of 100~200 J/mm, significantly reducing the degradation of the heat-affected zone (HAZ) and reducing the thickness of the IMC layer. Peng et al. [22] used the Cold Metal Transfer (CMT) process to connect AA5052 aluminum alloy and galvanized low-carbon steel. The interface reaction layer was composed of a continuously distributed layered Fe2(Al,Si)5 phase and a dispersed needle/rod-shaped Fe (Al,Si)3 phase. In the tensile test, two fracture modes, brittle and ductile, occurred, and the maximum load that could be sustained was 196 N/mm. Romankov et al. [23] used a solid-state aluminizing technology based on a vibration grinding process to prepare an aluminum composite coating with high adhesion on a steel substrate, completely eliminating the formation of Al-Fe compounds. Xu et al. [24] used the double-wire CMT process to achieve the dissimilar material connection between stainless steel and aluminum alloy. A multi-layer IMC structure was formed in the interface area. A continuously distributed Fe2Al5 layer was formed on the steel side, and an Fe3Al2Si4 layer was generated near the aluminum side. Dispersed Fe4Al13 phase particles were distributed between the two-phase layers. The total thickness of the IMC layer was measured to be in the range of 2–4 μm. Mechanical property tests showed that the maximum tensile strength of the joint was 96 MPa.
In the electrolytic process, cracking often occurs in the aluminum–steel interface area. The main reason is the formation of IMCs at the interface [25,26]. When IMCs grow excessively at the interface, they will significantly weaken the joint performance, resulting in a decrease in connection strength and an increase in cracking tendency [27,28,29,30]. Compared to traditional welding methods, CMT technology can effectively reduce heat input [31,32,33], thereby inhibiting the excessive growth of IMCs and ensuring the effective connection of the joint. This study uses CMT technology combined with industrial robots to achieve layer-by-layer stacking of aluminum materials and combines machine vision systems to identify and detect defects generated during the stacking process, providing a new solution to produce anode guide rod groups. In addition, this study also analyzes the organizational properties of the aluminum–steel transition interface to provide a theoretical basis for process optimization.

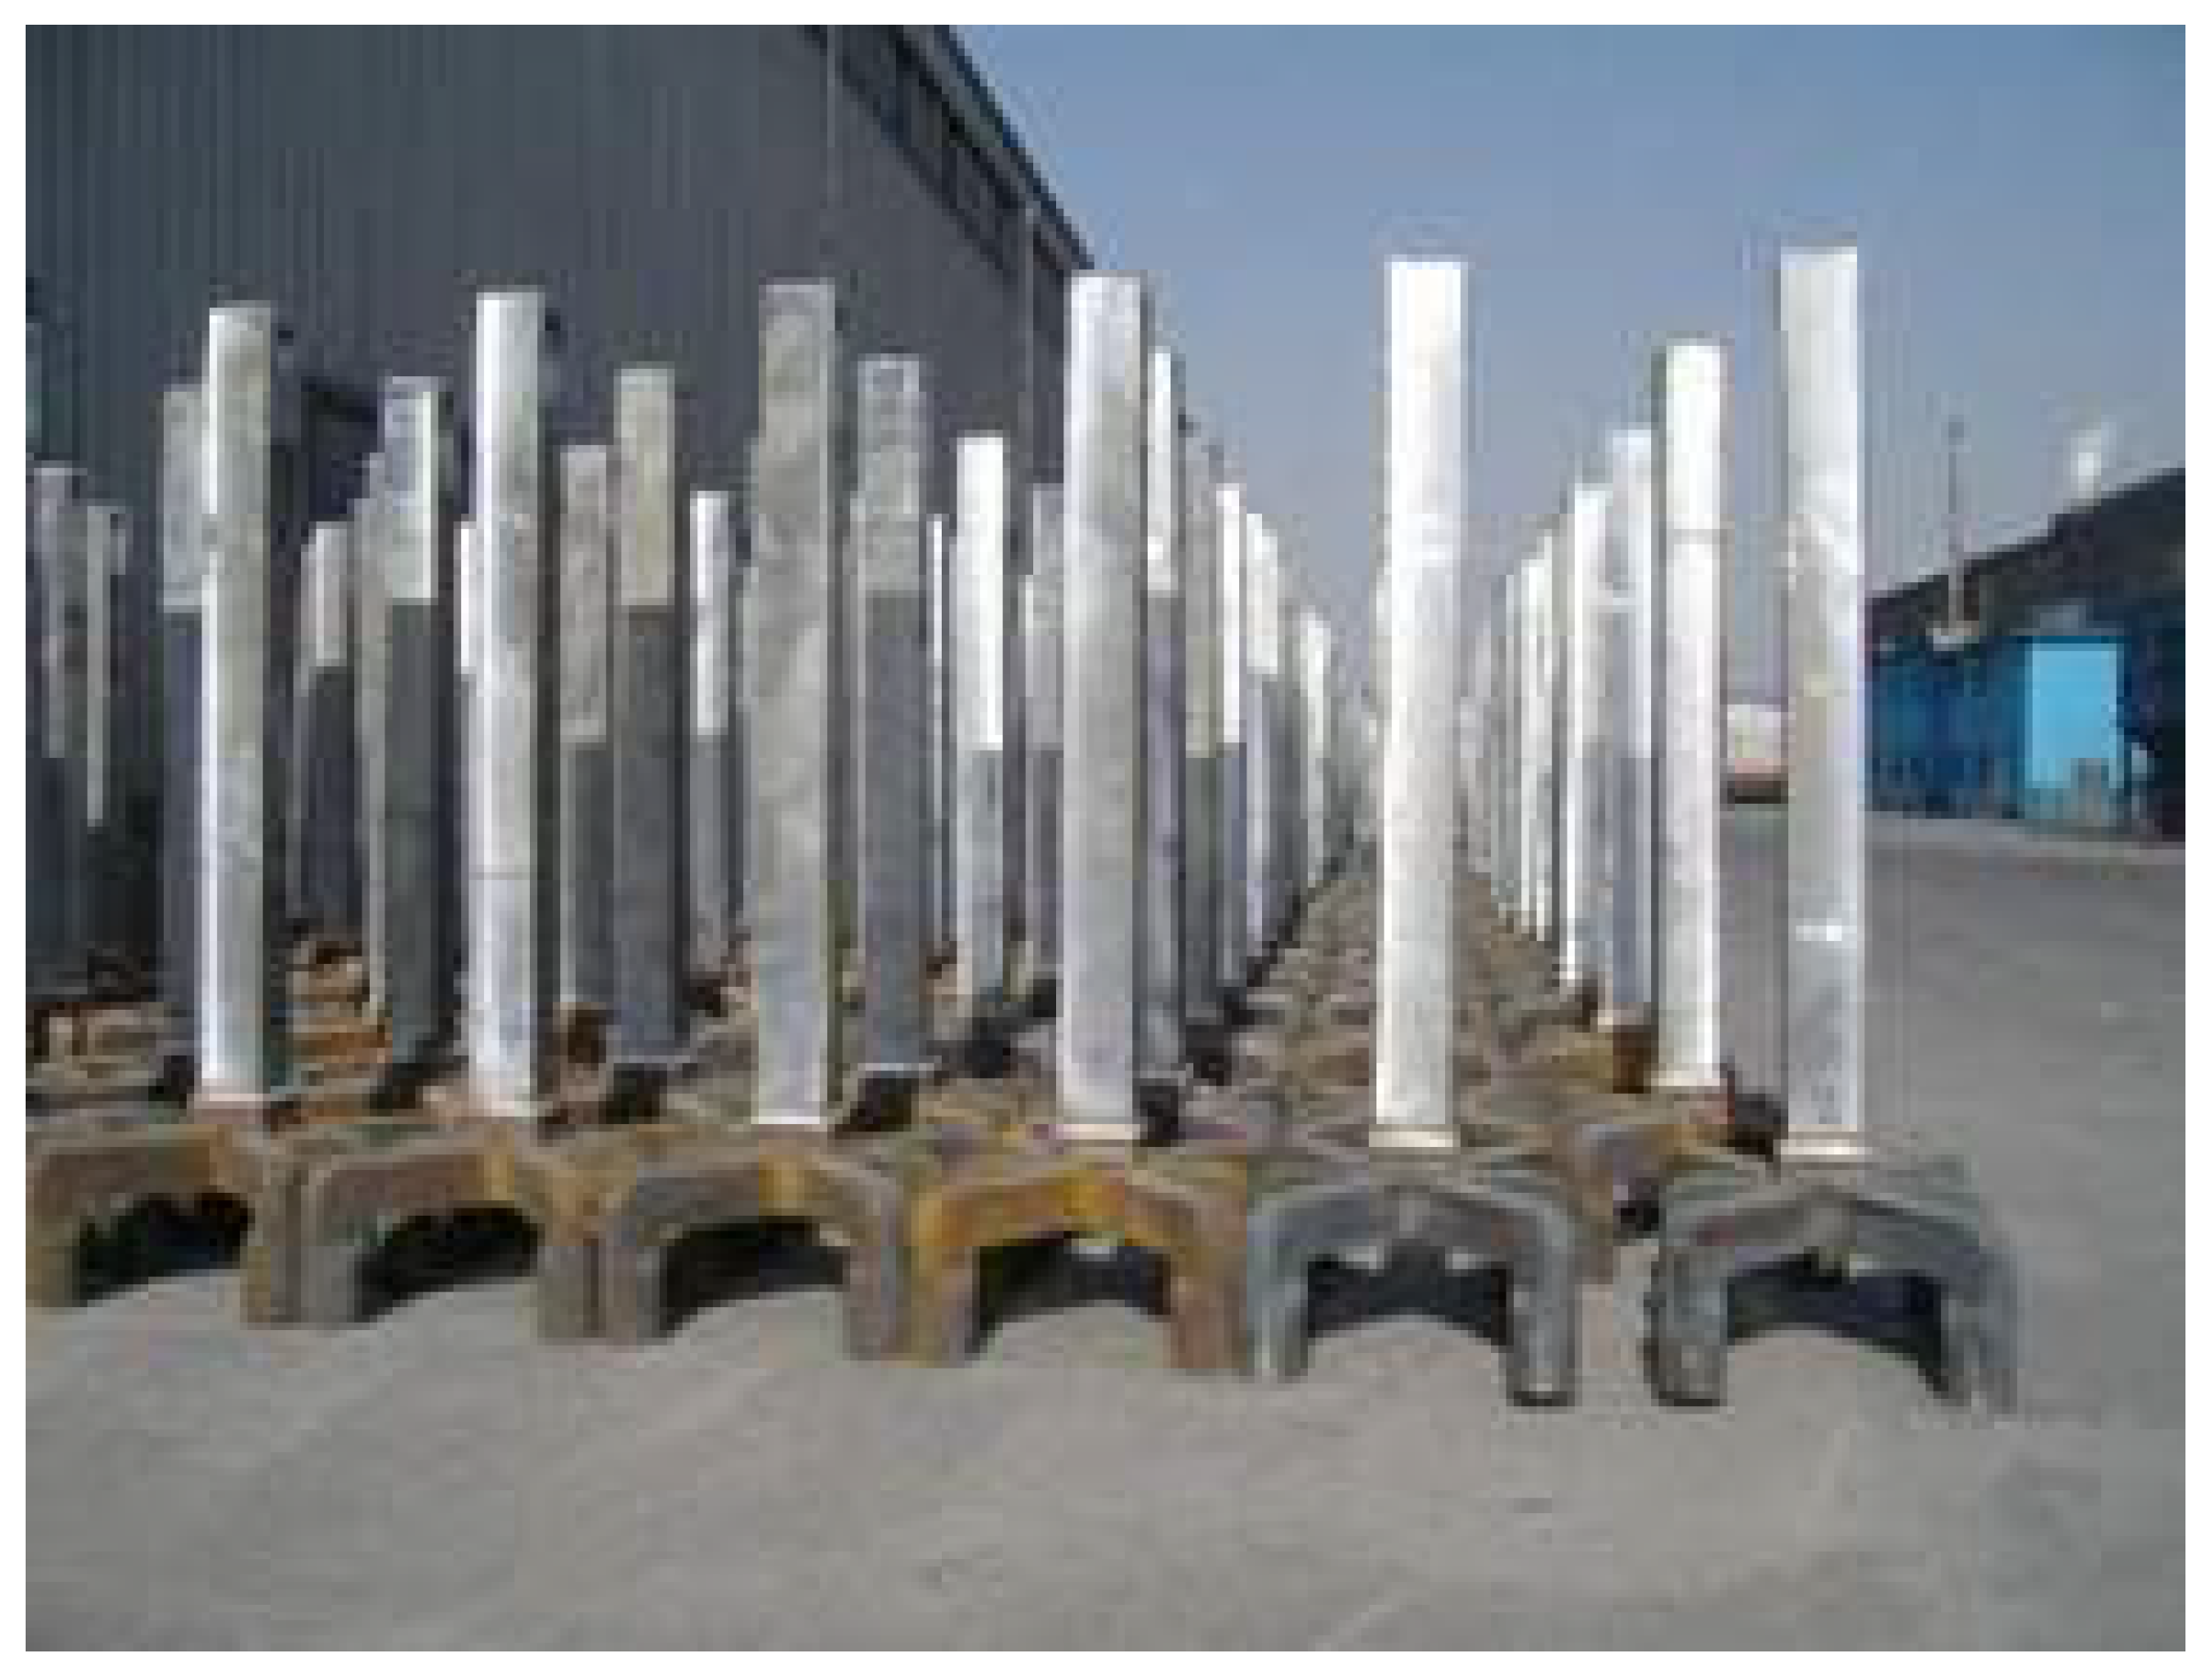
2. Anode Steel Claw Aluminum Deposition and Forming Control

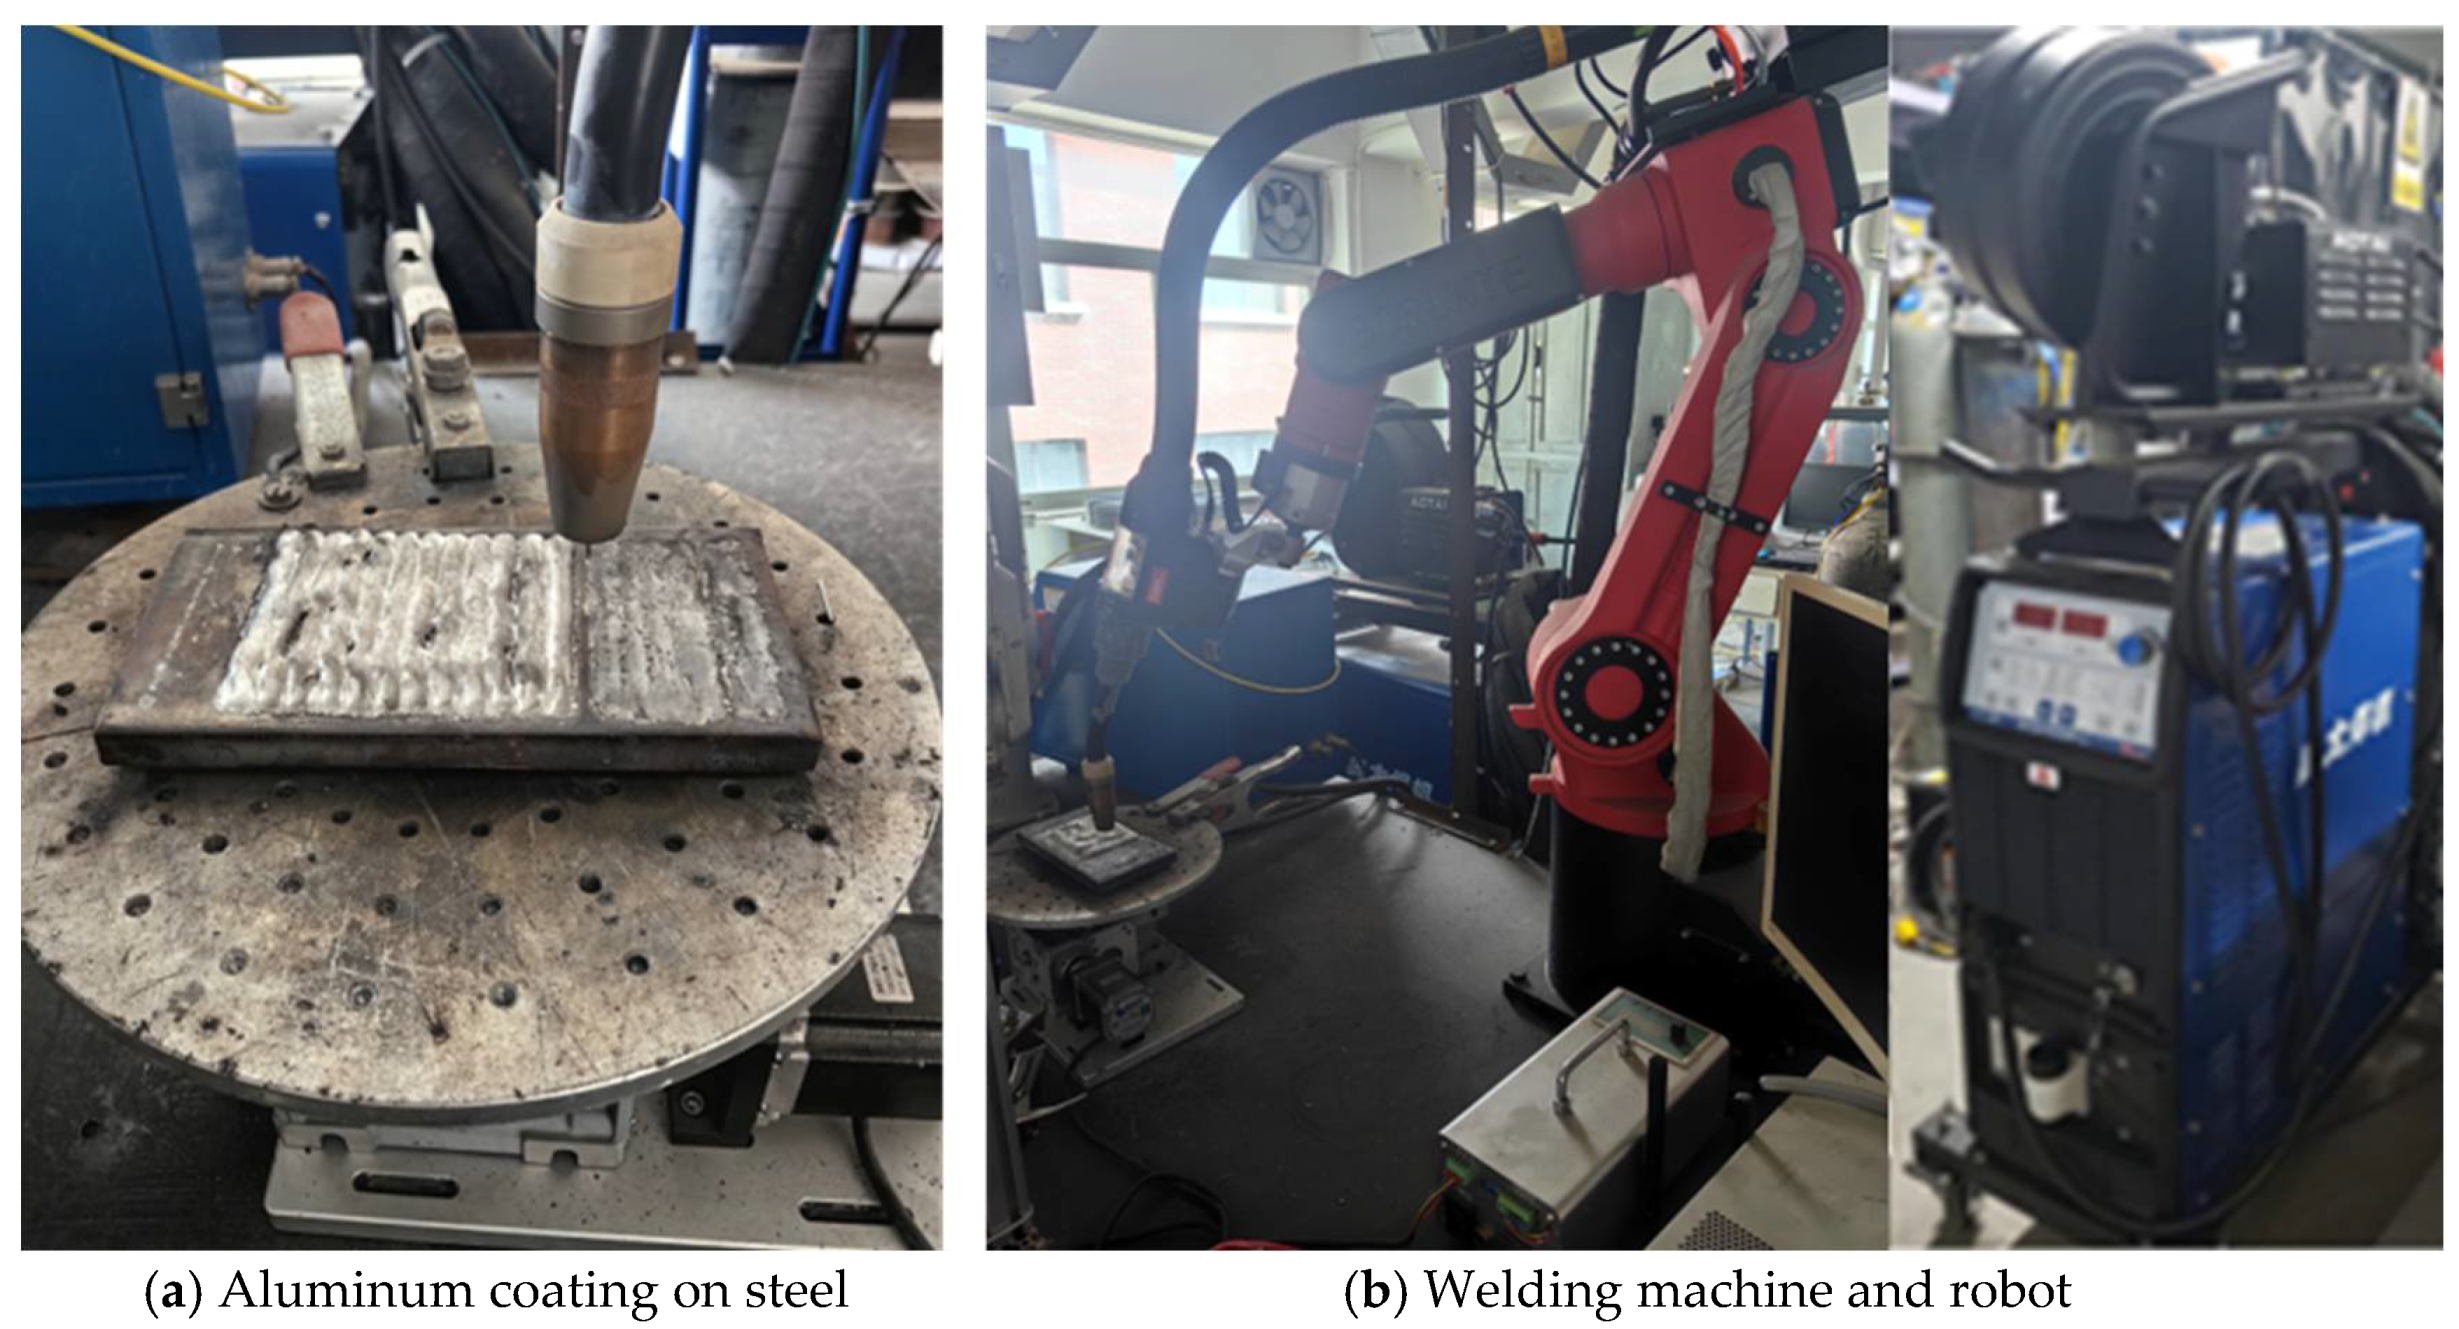
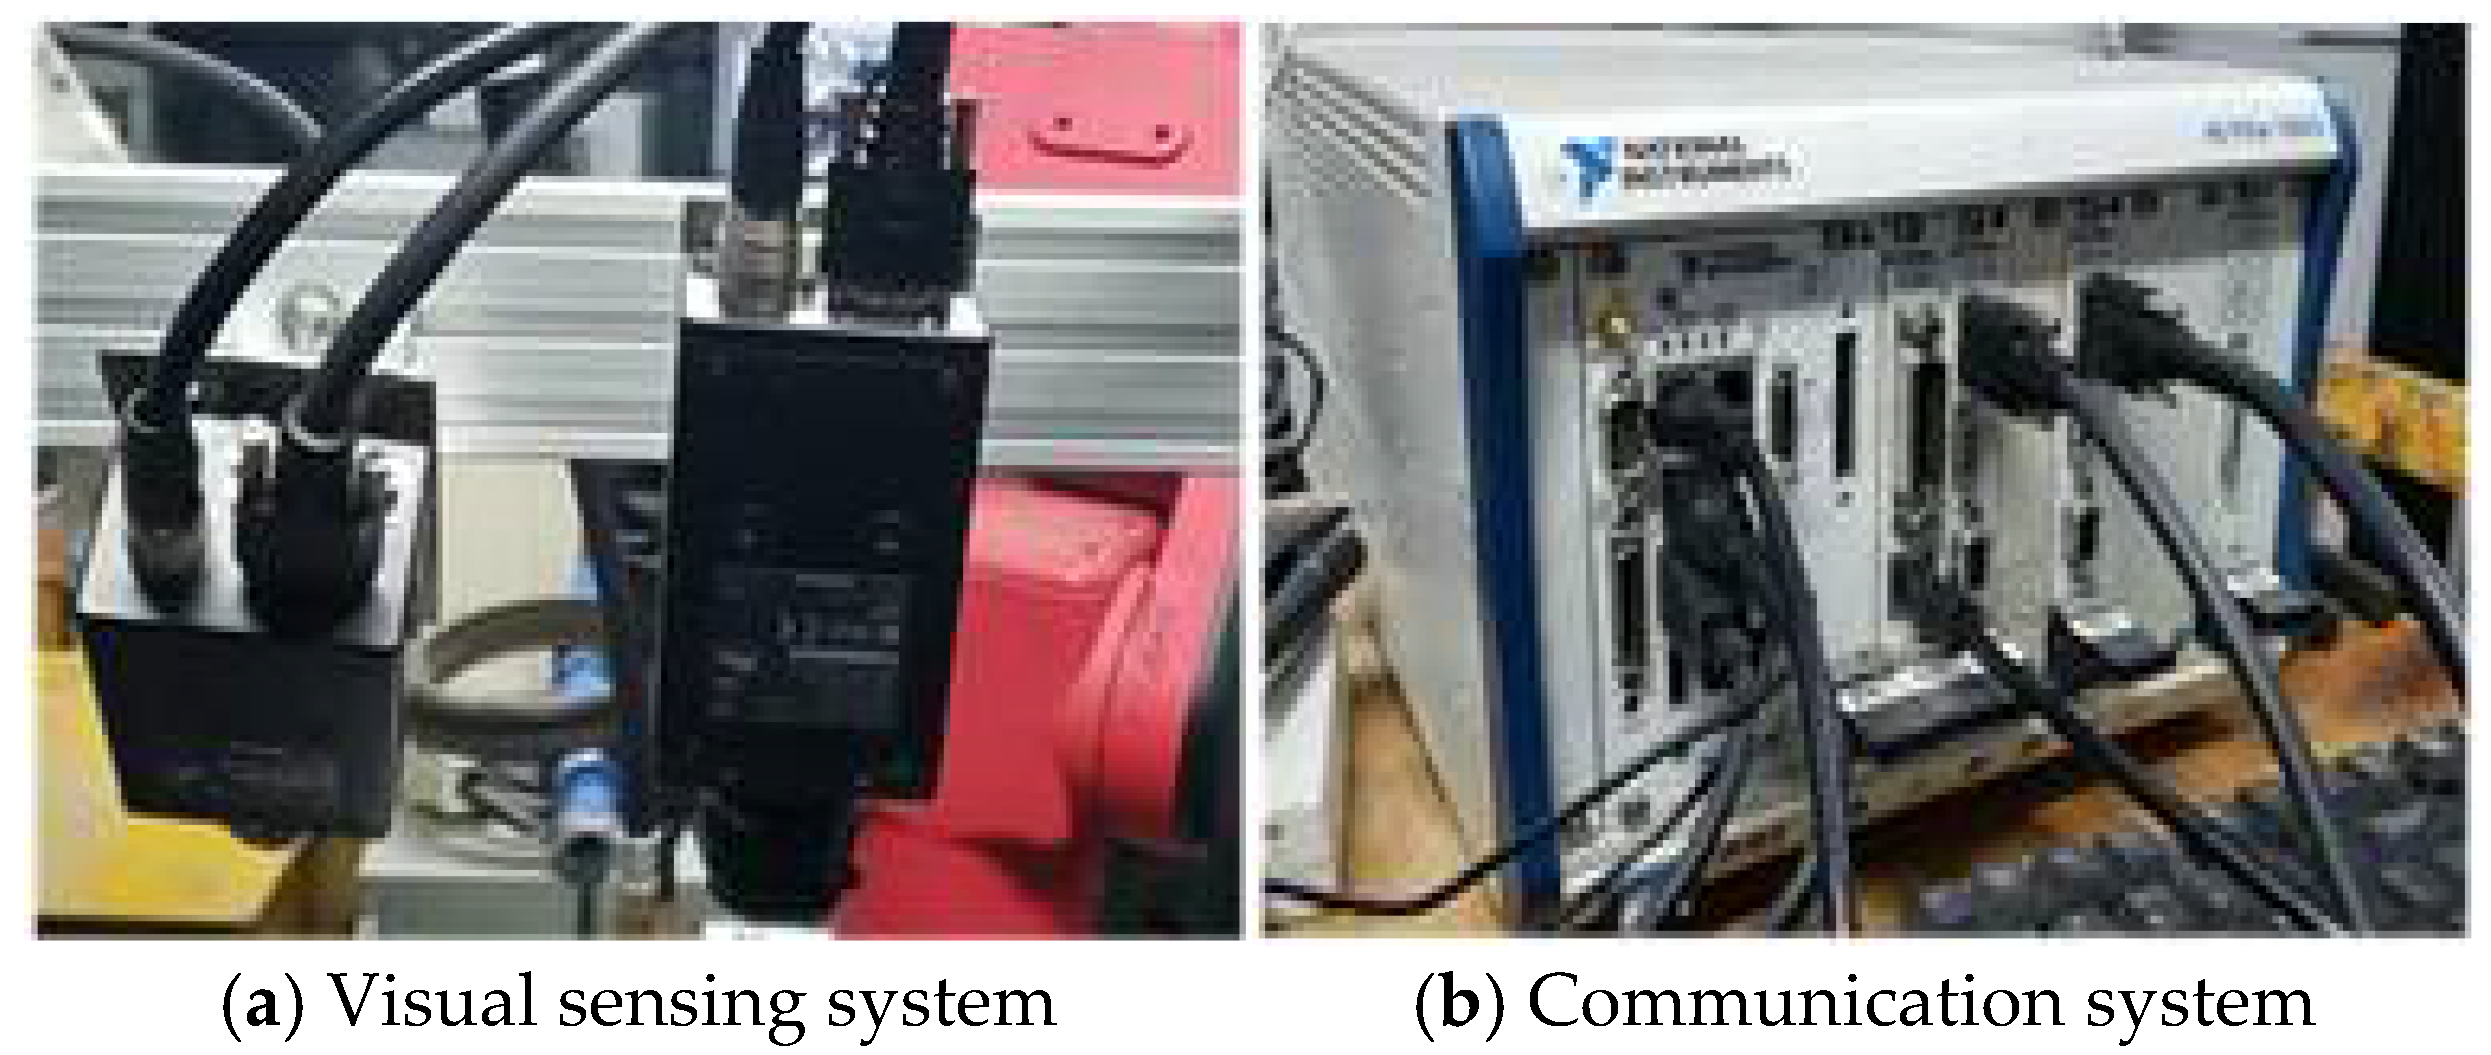
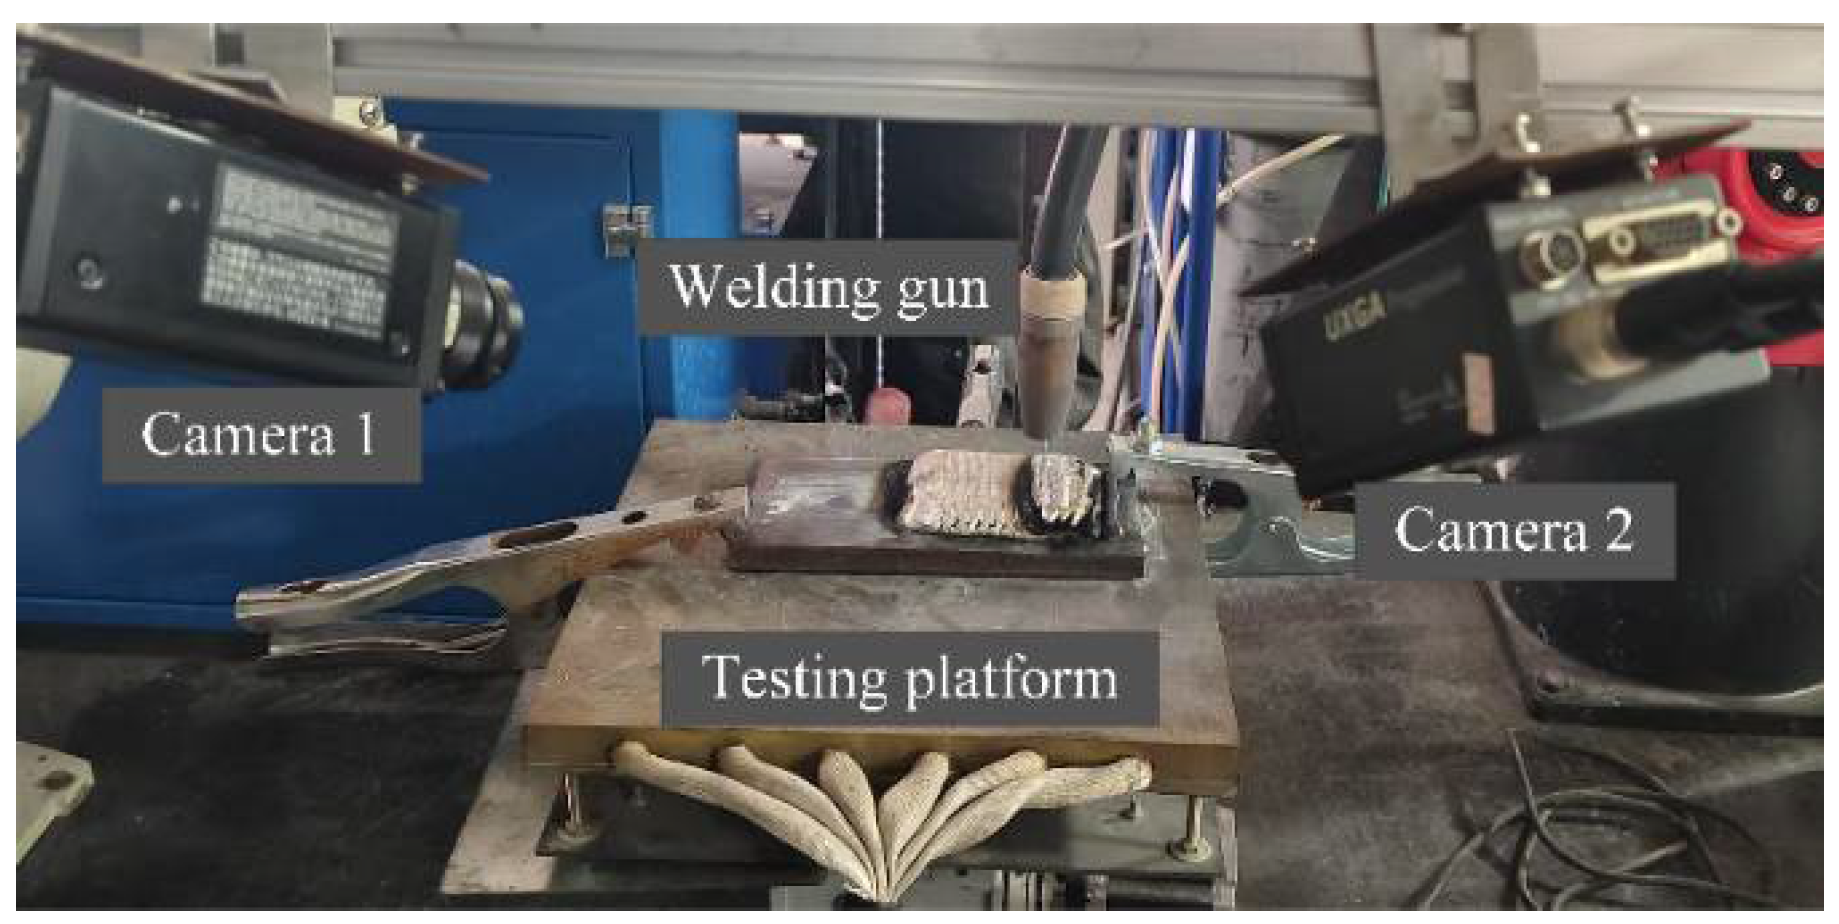
2.1. Experimental System

Figure 1 shows the CMT cladding test system, which integrates welding path and arc control, enhancing control accuracy and ensuring the stability and efficiency of additive manufacturing. In this experiment, Q235 steel was used as the substrate material for the cladding test, with dimensions of 100 mm × 200 mm × 20 mm. The filler material used was ER5356 aluminum–magnesium welding wire with a diameter of 1.2 mm. To achieve better cladding of aluminum on steel, it is essential to fully understand the physical and chemical properties of both the base material and the welding wire. The main chemical compositions are listed in Table 1 and Table 2, respectively. During the cladding process, the welding voltage was maintained at 18.2 V and the welding speed at 2.5 mm/s, while the welding current was set to 90 A, 100 A, and 110 A, respectively.
This study builds a surface defect detection system for weld-deposited layers based on machine vision. The surface morphology was captured using a 2-megapixel Sony XCL-U1000C industrial camera manufactured by Sony Corporation, Japan. The NI PXIe-1062Q chassis, PXIe-1435 image acquisition card, and PXIe-8135 controller, manufactured by National Instruments (USA), are used to realize image acquisition, processing, and defect recognition. The processing results are converted into robot control signals through the PXI-8232 module manufactured by National Instruments (USA), thereby enabling the precise transmission of coordinates. Figure 2a shows the visual sensing system, and Figure 2b shows the communication system.
The integrated system demonstrates strong potential for industrial application. It enables real-time defect detection, precise compensation, and autonomous adjustment, thereby significantly improving welding quality and reducing labor costs. In addition, the vision system features good modularity, allowing for convenient integration into existing robotic welding production lines with relatively low system modification costs.

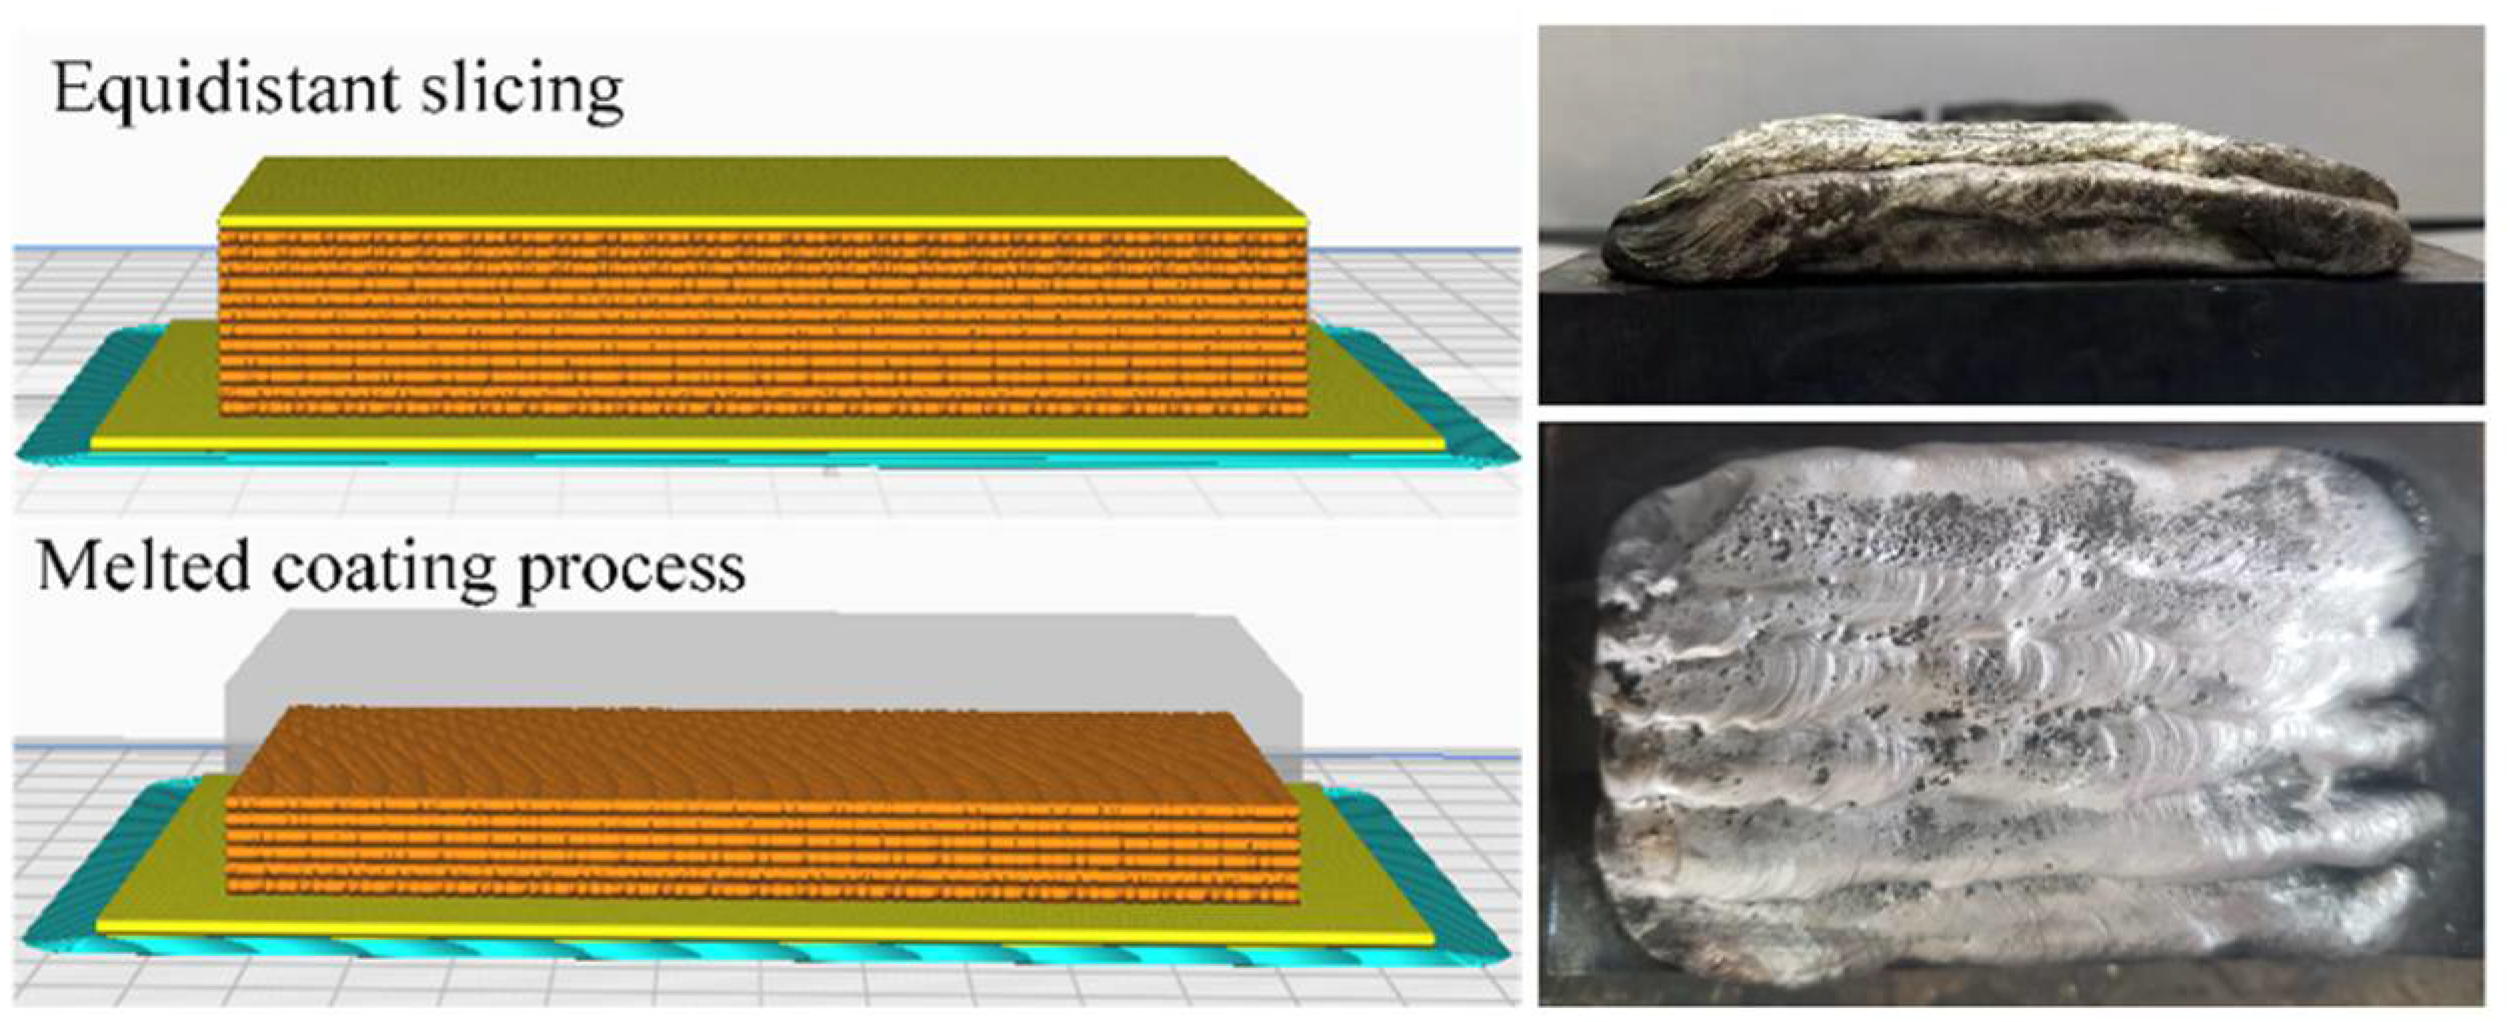
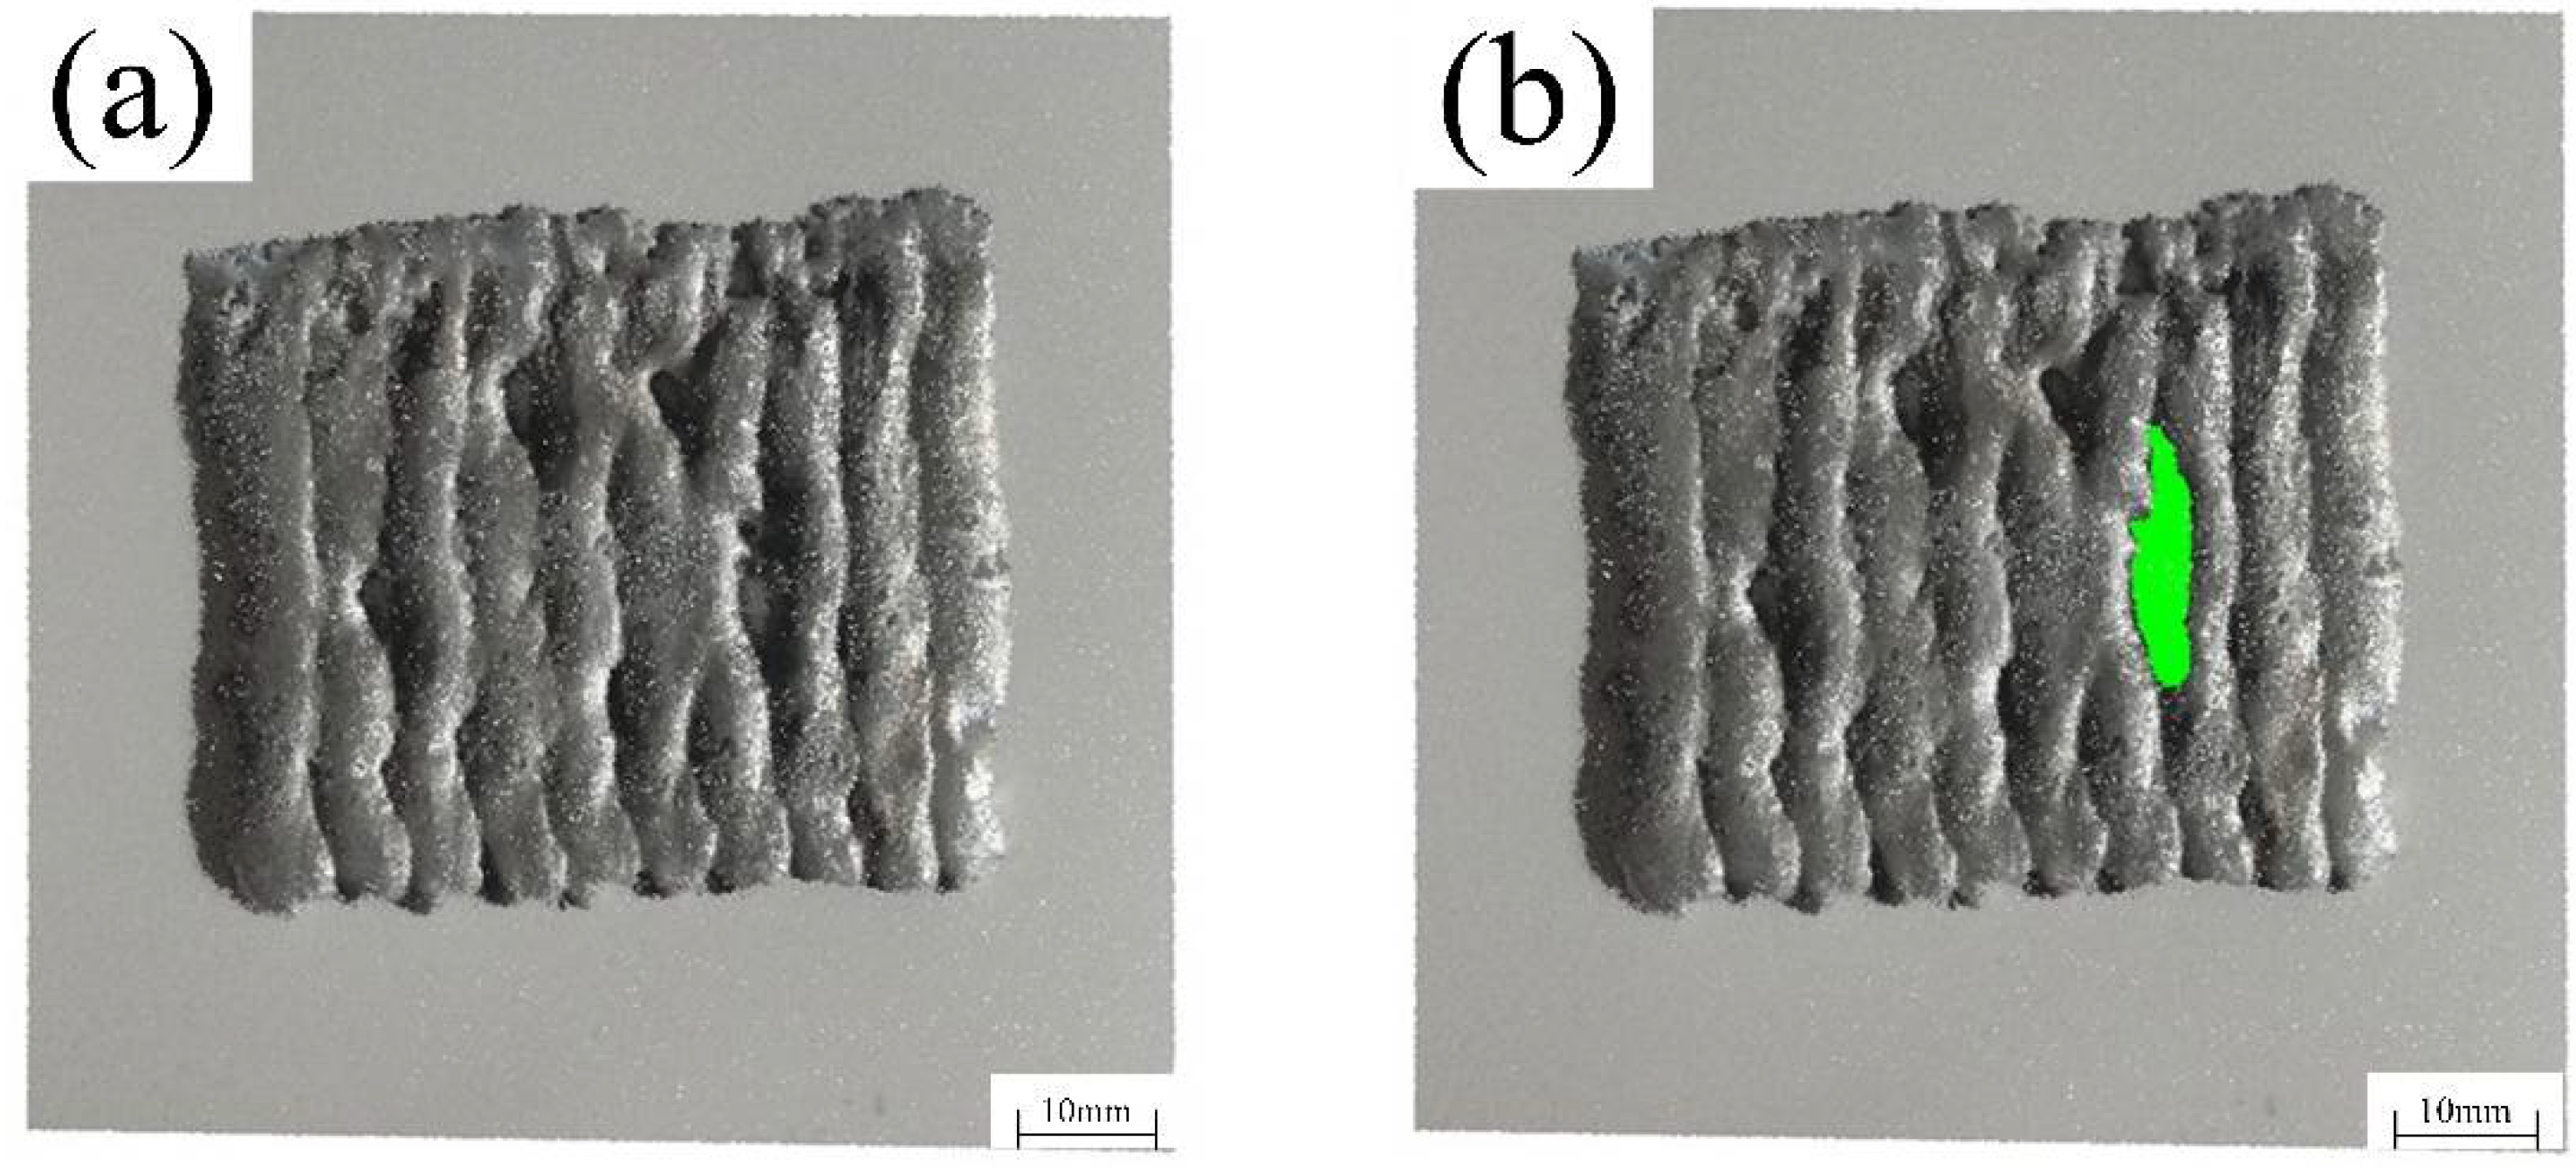
2.2. Steel Surface Cladding and Defect Detection

Figure 3 shows two different slicing strategies and welding path design methods. The upper figure is “equidistant slicing”, which means that slicing is performed at a fixed interval along the height direction during the additive manufacturing process to form a uniform interlayer thickness. The lower figure is the “melted coating process”, which shows that under the condition of maintaining stable welding process parameters (current 100 A, speed 5 mm/s), the continuous reciprocating weld bead laying method effectively solves the problems of overheating at the arc starting end and insufficient fusion at the arc ending end in the traditional unidirectional path.
After each layer of cladding is completed, the welding gun moves to the standby point to trigger the industrial camera. After the image processing system detects the defect, it uses binocular vision to perform three-dimensional reconstruction to obtain geometric information such as defect position, shape, and size, providing a basis for repair.
The defect detection of the cladding layer adopts the PatMax algorithm, which uses geometric feature matching technology to achieve high-precision target recognition through edge and corner feature vectors. Compared to traditional grayscale matching, this algorithm has stronger robustness to irregular shapes, partial occlusion, and complex backgrounds. Its detection process is shown in Figure 4.
In the matching stage, the surface of the cladding layer is scanned and detected at multiple scales, and the edge and corner features are extracted and matched with the template. Finally, an image with the defect location, the center coordinate point of the defect area, and the matching confidence score is output. Figure 5 shows the recognition result of the cladding layer defect detection. These defects often exhibit unusual characteristics, including porosity, lack of fusion, and uneven metal buildup.

2.3. Defect Compensation

After the surface defects of the cladding layer are detected, a parallel-structure binocular vision system is used to perform three-dimensional reconstruction of the cladding layer to obtain high-precision point cloud data to provide a geometric basis for defect compensation. Figure 6 shows the experimental arrangement of the parallel-structure binocular vision system.
Through correction and stereo matching, combined with the internal parameters of the camera, two-dimensional pixels are mapped to three-dimensional space to generate point cloud data. However, due to changes in the illumination and noise generated by the sensor, the accuracy of defect area extraction will be reduced, which will in turn affect the deposition path. Therefore, denoising is required to remove outliers and improve data quality. In addition, redundant points in the original point cloud will increase the computational burden, so it is necessary to first extract the region of interest (ROI) to improve recognition efficiency and robustness [34,35,36]. Based on the ROI area, the segment segmentation algorithm is used to extract defect features. Figure 7a shows the three-dimensional point cloud of the deposition layer after denoising, and Figure 7b shows the extracted defect point cloud result.
The defect centerline is analyzed and key feature points such as the starting point, end point, and inflection point are extracted to characterize the geometric features of the deposition path. The Modbus TCP/IP communication protocol is used to realize data interaction between the host computer and the robot. The coordinates of the feature points are converted to the robot base coordinate system to drive the end effector to move precisely along the deposition path. Figure 8a shows the morphology of the deposition layer after defect compensation and Figure 8b shows the cross-sectional morphology of the aluminum–steel joint, with a smooth interface and sufficient metallurgical bonding.
The samples were cut into 15 mm × 15 mm metallographic specimens using an electrical discharge wire cutting machine, with one side being aluminum–magnesium alloy and the other side Q235 steel. The specimens were then polished using a polishing agent to ensure a scratch-free cross-section. According to the GB/T 3246.1—2012 standard [37], a mixture of hydrofluoric acid (ρ1.15 g/mL), hydrochloric acid (ρ1.19 g/mL), nitric acid (ρ1.40 g/mL), and distilled water in a volume ratio of 1:1.5:2.5:95 was used for 3–6 s of grain boundary etching, followed by observation of the grain morphology using an optical microscope.To analyze the elemental distribution of intermetallic compounds on the alloy surface and the diffusion behavior of Al-Fe atoms at the aluminum–steel interface, point scanning and line scanning were conducted using a scanning electron microscope (SEM) equipped with an energy-dispersive spectrometer (EDS). Additionally, the phase composition and changes in the alloy were determined using an X-ray diffractometer. The average thickness of the intermetallic compounds (IMCs) in the cladding zone under different currents was measured using ImageJ software (https://imagej.net/software/imagej/ accessed on 10 June 2025) developed by the National Institutes of Health (USA).
The mechanical properties of the specimens under different cladding currents were evaluated using the XGLX-T3 nanoindenter manufactured by Shanghai Optical Instrument Factory (Shanghai, China). The maximum load was set to 8 mN, with both loading and unloading rates set to 0.8 mN/s and a 5 s holding time. Moreover, tensile tests were conducted at a loading speed of 0.5 mm/min using the WDW300J electronic universal testing machine manufactured by Jinan Shidai Shijin Testing Machine Co., Ltd. (Jinan, China), and the fracture morphology after tensile testing was observed using a scanning electron microscope. To ensure the reliability of the data, each sample was tested at least three times for both nanoindentation and tensile tests under each set of parameters.

3. Microstructure and Mechanical Property Analysis

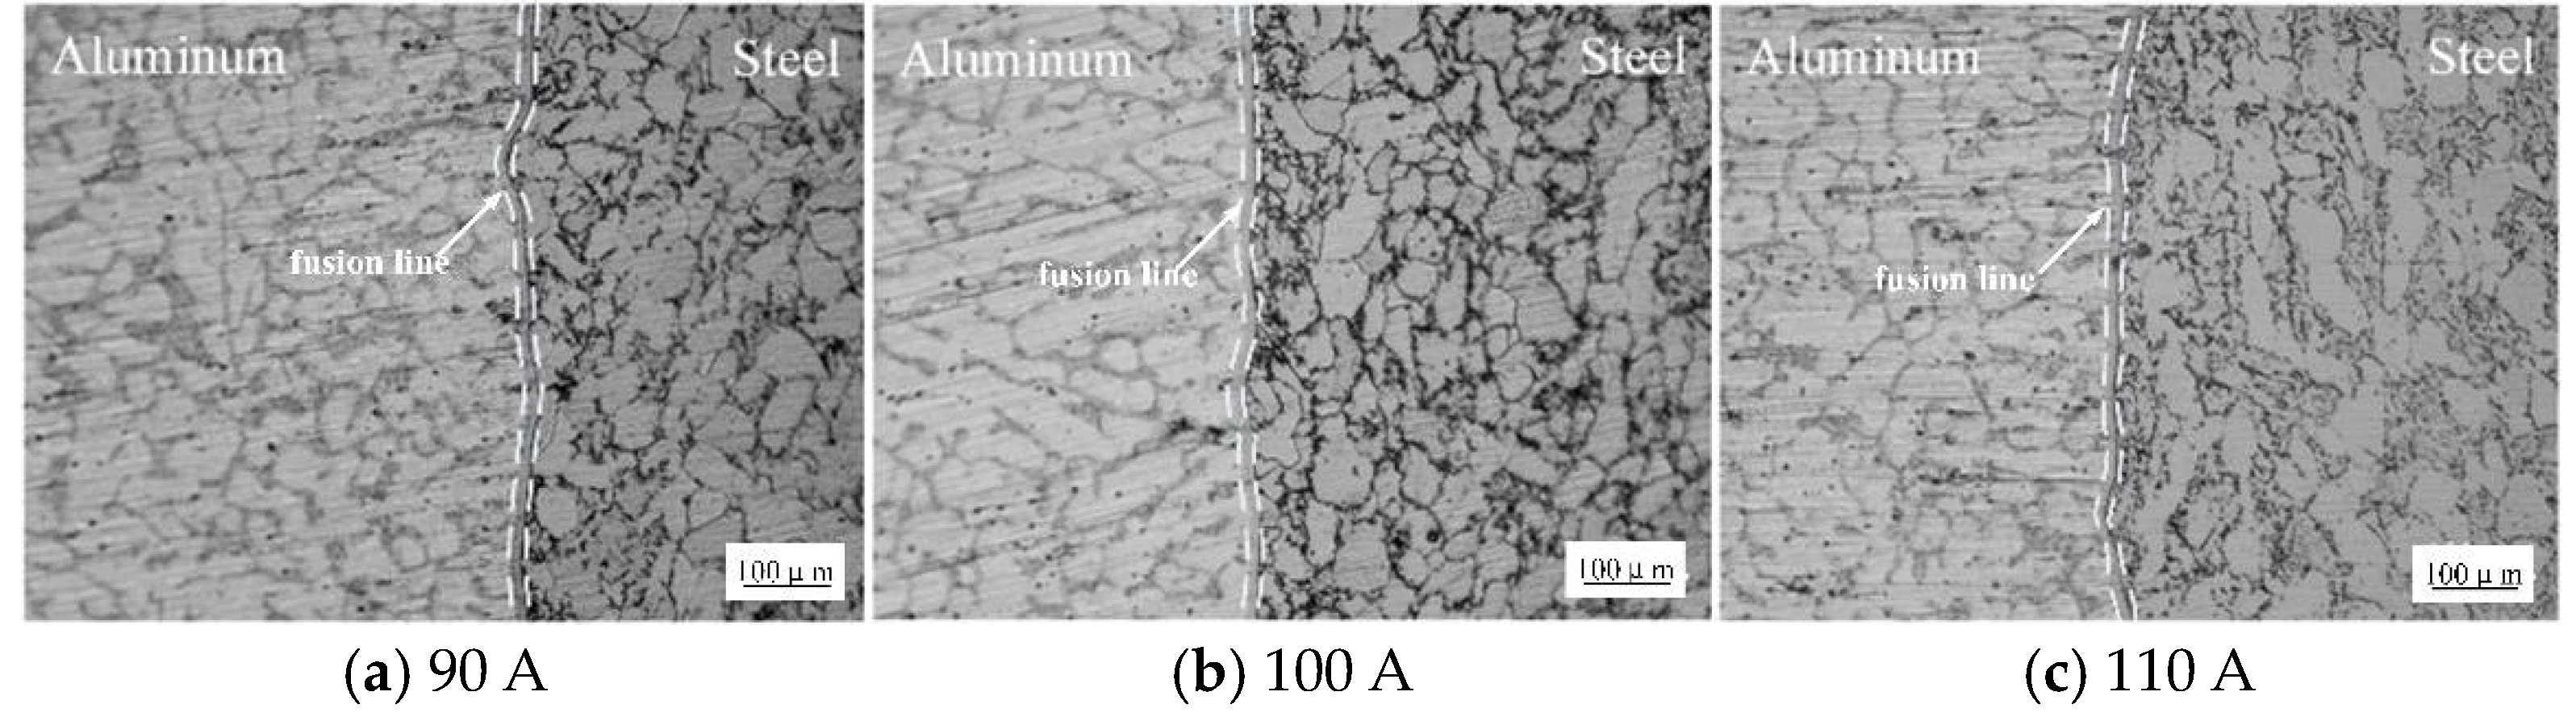
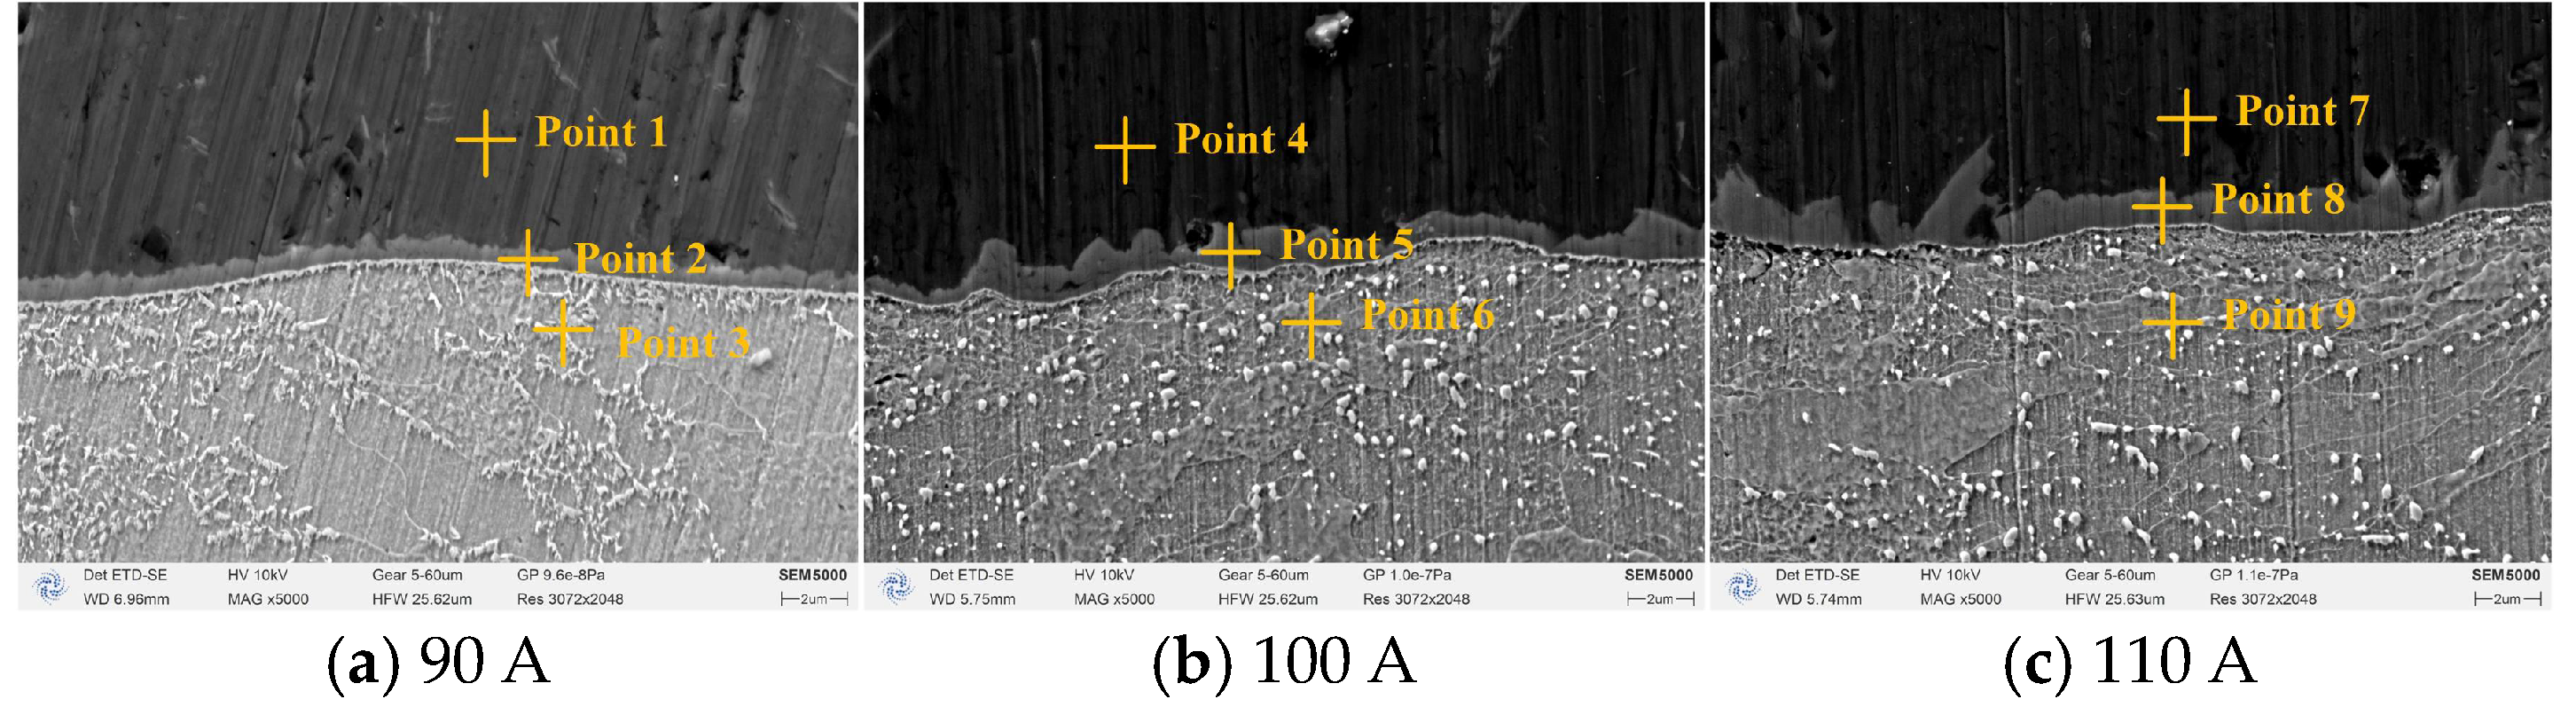
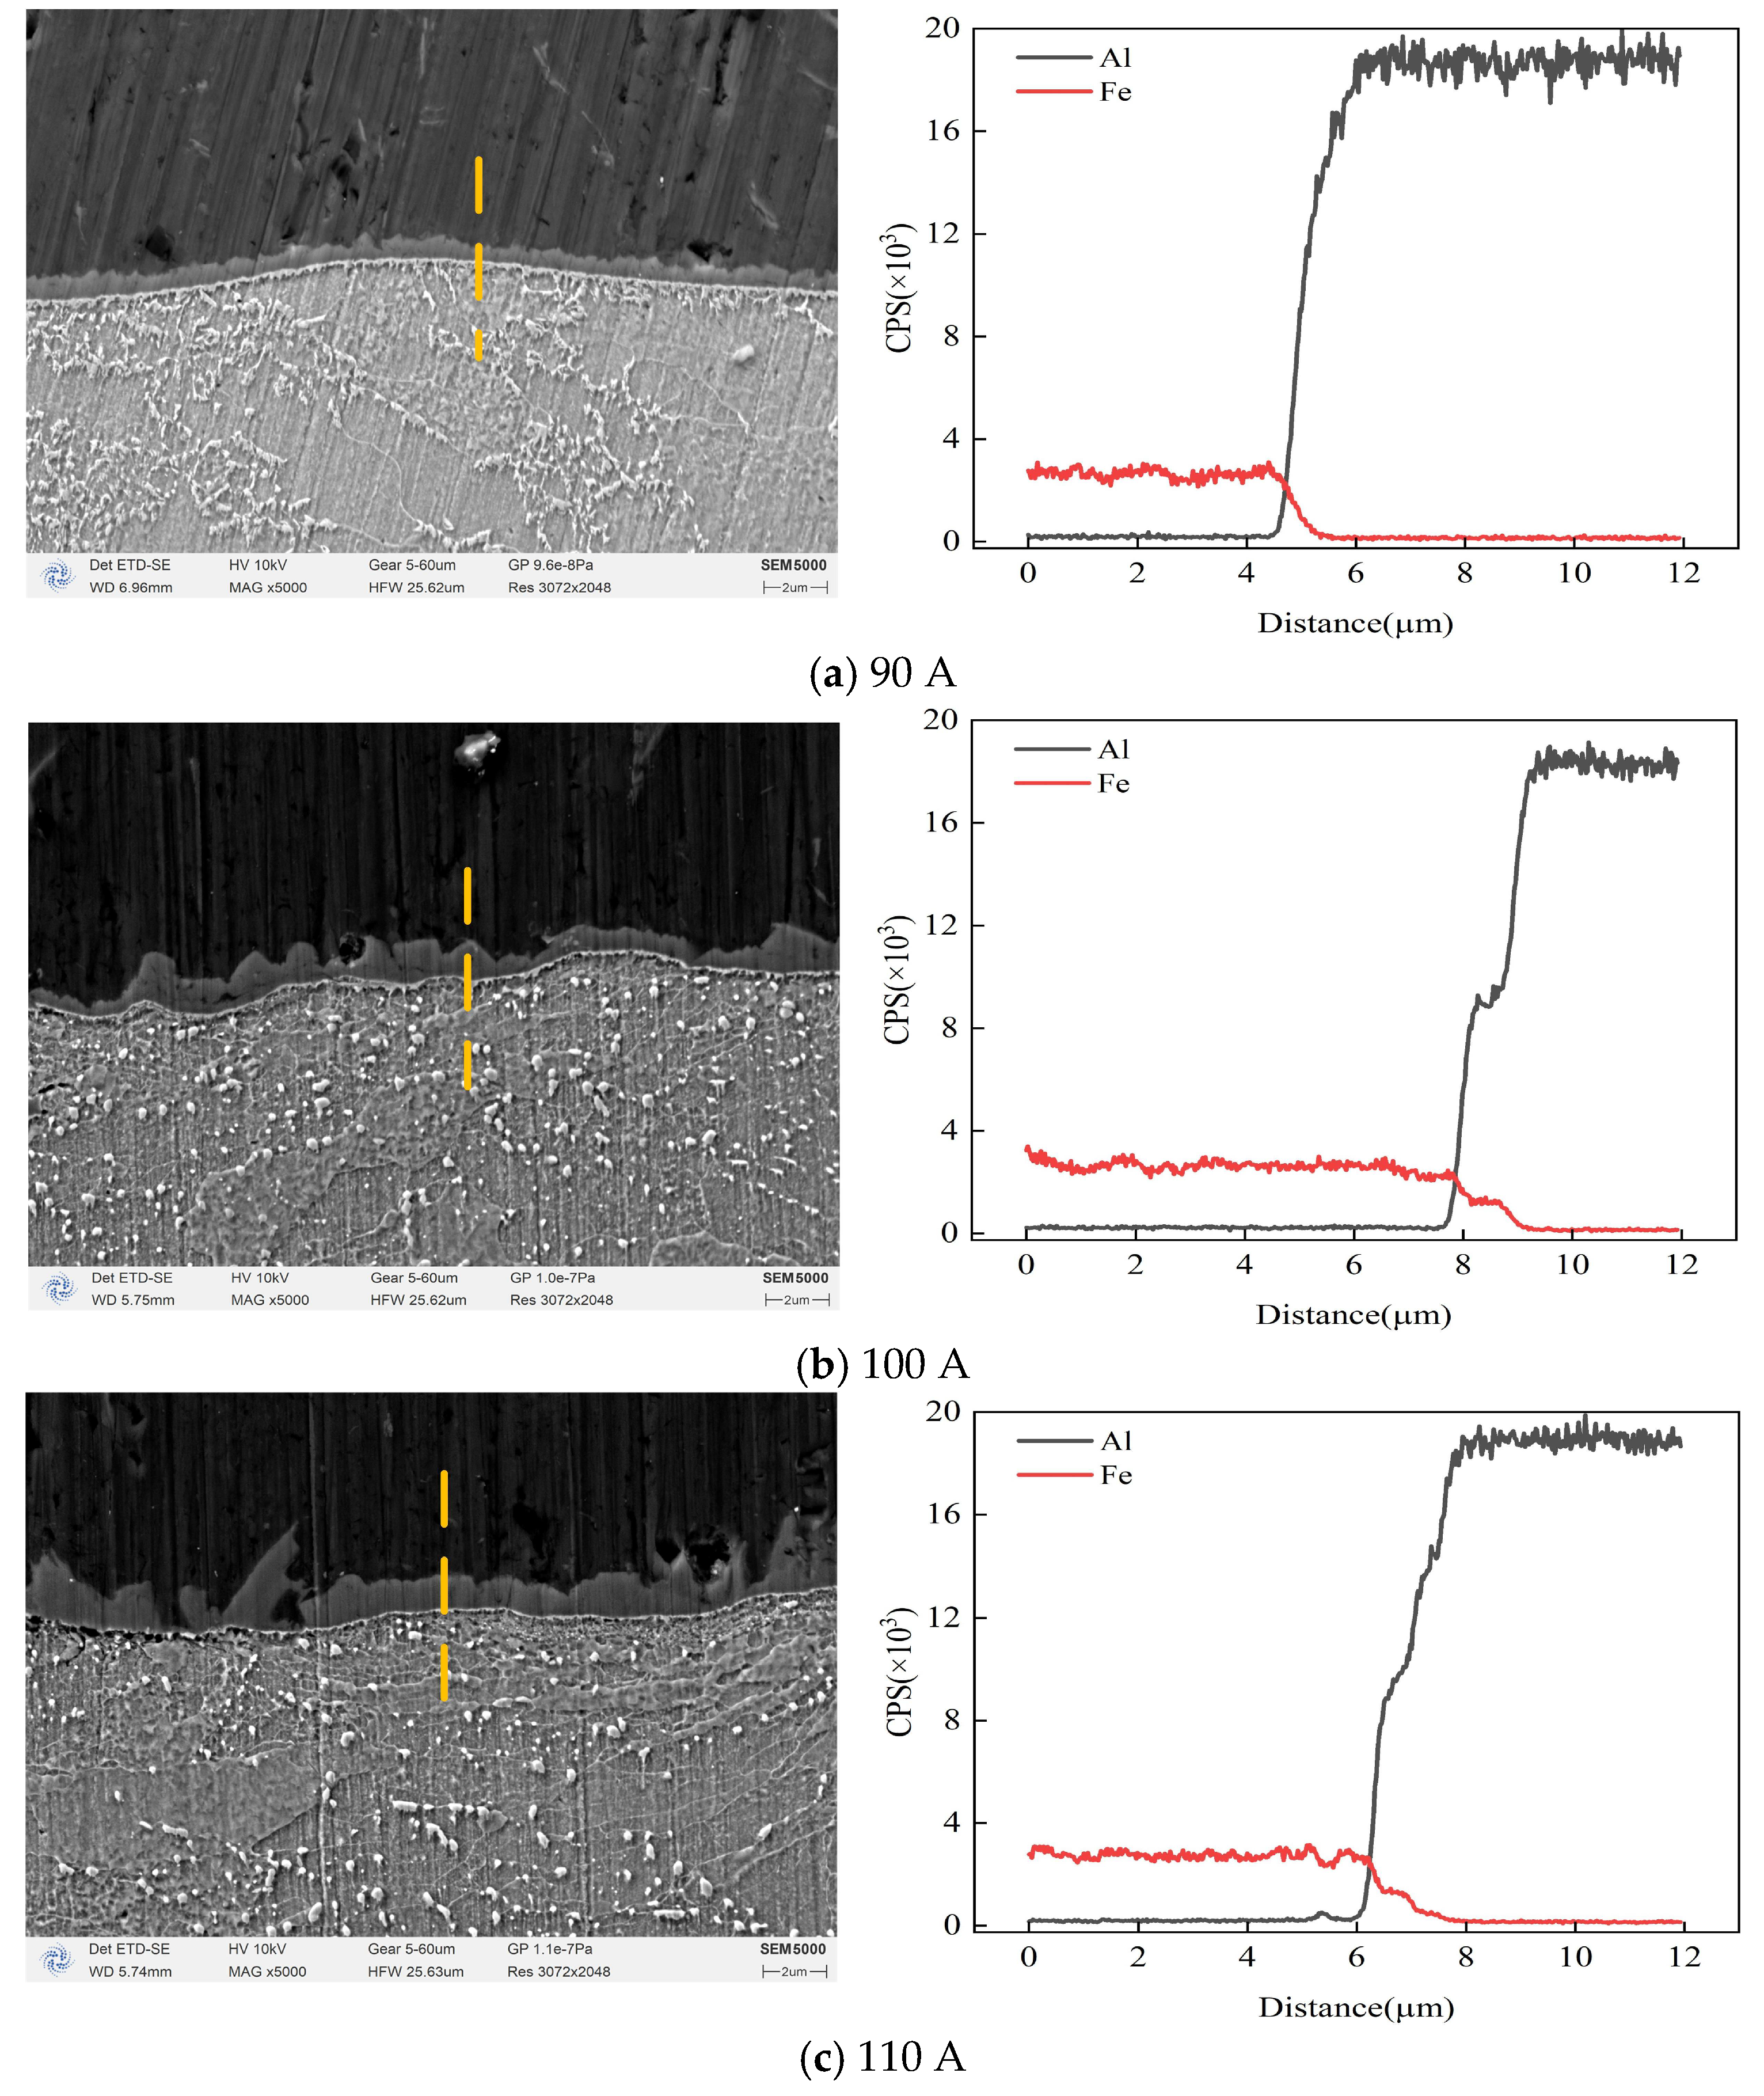
3.1. Microstructure Analysis

To explore the effect of deposition current on the microstructure of the aluminum–steel transition interface, three groups of deposition current parameters of 90 A, 100 A, and 110 A were selected for comparative study. Figure 9 shows the microstructure of the aluminum–steel joint under different deposition currents.
As can be seen from Figure 9, the increase in deposition current leads to significant changes in the grain morphology and size on both sides of the fusion line. On the aluminum side, the grains are columnar crystals that grow vertically to the substrate, and the grain size increases with the increase in current. On the steel side, when the current increases to 100 A, the grain size increases significantly, and when the current further increases to 110 A, the grain morphology on the steel side gradually changes from equiaxed crystals to columnar crystals. In addition, the width of the fusion line also tends to increase with the increase in deposition current.
X-ray diffraction was used to analyze the phase composition of the aluminum–steel interface. The results are shown in Figure 10. By observing the types and distribution of diffraction peaks in the figure, it can be found that the interface area is composed of an α (Al) phase and a small amount of β (Al3Mg2) phase. According to the thermodynamic equilibrium characteristics of the Al-Mg alloy phase diagram, at about 450°C, the maximum solubility of Mg in Al is about 4 wt.%; when the magnesium content exceeds its solid solubility limit of 4% in aluminum, the excess magnesium element will precipitate in the form of a β phase. The aluminum–magnesium welding wire used in this article contains about 5% Mg element. Therefore, there will be residual Mg element in the deposition process to form a second-phase precipitation. In addition, due to the presence of the steel matrix, an FeAl3 phase is also detected in the diffraction spectrum, indicating that IMCs are formed at the interface, and the diffraction peak intensity increases with the increase in the deposition current.
The heat input during the deposition process comes from the CMT arc energy, which directly affects the thickness and phase composition of IMCs and thus determines the joint performance. As can be seen from Figure 11, within the selected parameter range, IMCs are formed at the interface, and as the current increases, the thickness of the IMCs increases and the morphology of the FeAl3 phase close to the aluminum side changes from a flat continuous state to a discrete block and grows toward the aluminum weld. When the deposition current is 90 A, the interface close to the aluminum side is mainly composed of wavy FeAl3 phases. As the deposition current increases, the IMCs become more uneven; when the deposition current is 110 A, as shown in Figure 11c, the FeAl3 phase begins to transform into the Fe2Al5 phase, so the structure at the interface is a mixture of FeAl3 and Fe2Al5 phases, and cracks extending along the interface appear at the interface.
Table 3 shows the EDS point scanning results of the aluminum–steel joint area under different deposition currents. The experimental results show that when the deposition current is 90 A, the Fe atomic content of the IMCs is 18.85%, the Al atomic content is 81.85%, and the most likely IMC to be formed is FeAl3. When the deposition current is 100 A, the Fe atomic content of the IMCs is 23.73%, the Al atomic content is 76.27%, and the most likely IMC to be formed is FeAl3. When the deposition current is 110 A, the Fe atomic content of the IMCs is 27.18%, the Al atomic content is 72.82%, and the most likely IMC to be formed is the Fe2Al5 phase.
In order to study the diffusion behavior of Al-Fe atoms at the aluminum–steel interface, the interface area was analyzed by EDS line scanning, as shown in Figure 12. The results show that with the increase in the deposition current, the thickness of IMCs gradually increases, and there are obvious interval differences in the distribution of Al-Fe elements. The content of Al in the steel parent metal area has always remained at a low level, which is mainly due to two factors. First, there is a large difference in melting temperature between aluminum and steel, which limits the diffusion of aluminum atoms. Second, the difference in the radius of Al-Fe atoms further hinders the diffusion of Al atoms in the steel matrix.
In the IMC area, the content of Fe elements decreases significantly, while the content of Al elements increases rapidly. This is because during the brazing process, the molten aluminum alloy spreads on the steel surface and reacts to form IMCs such as FeAl3 and Fe2Al5, resulting in the consumption of Fe elements. After entering the Al parent metal area, the content of Fe elements no longer continues to decrease, but shows a fluctuating trend.
Combined with ImageJ software, the average thickness of IMCs in the line scan of the cladding area under different currents was measured, and the measurement results are shown in Figure 13. With the increase in the cladding current, the thicknesses of IMCs showed a significant increasing trend, and the average thickness of the IMCs increased from the initial 1.46 μm to 2.06 μm. This trend of change shows that with the increase in welding heat input, the diffusion of atoms at the interface is enhanced, thereby increasing the thickness of IMCs. This measurement result is mutually confirmed by the results of XRD phase analysis. With the increase in the cladding current, the intensity of the FeAl3 diffraction peak in the XRD spectrum increases, that is, the thickness of IMCs increases.

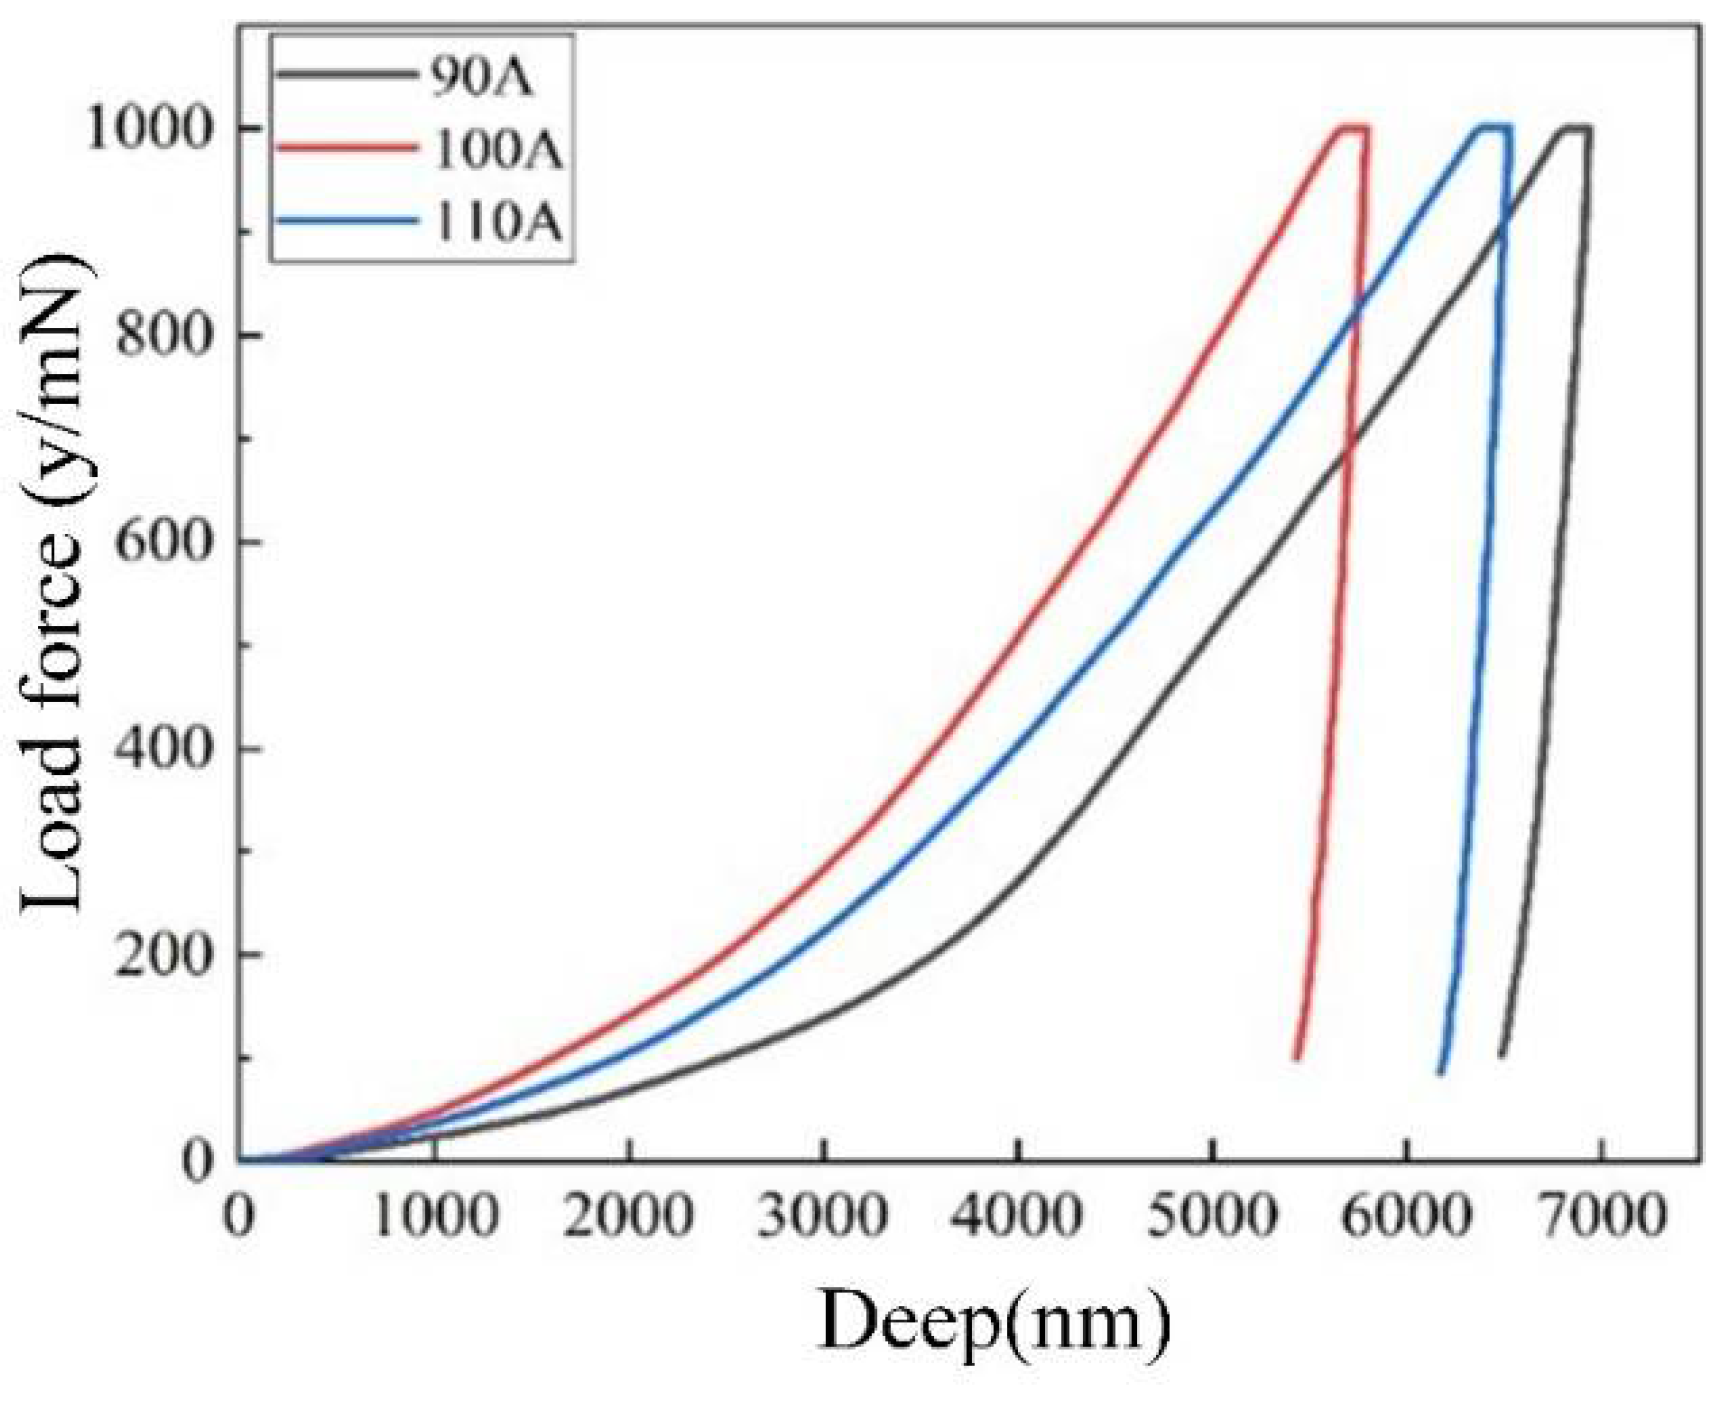
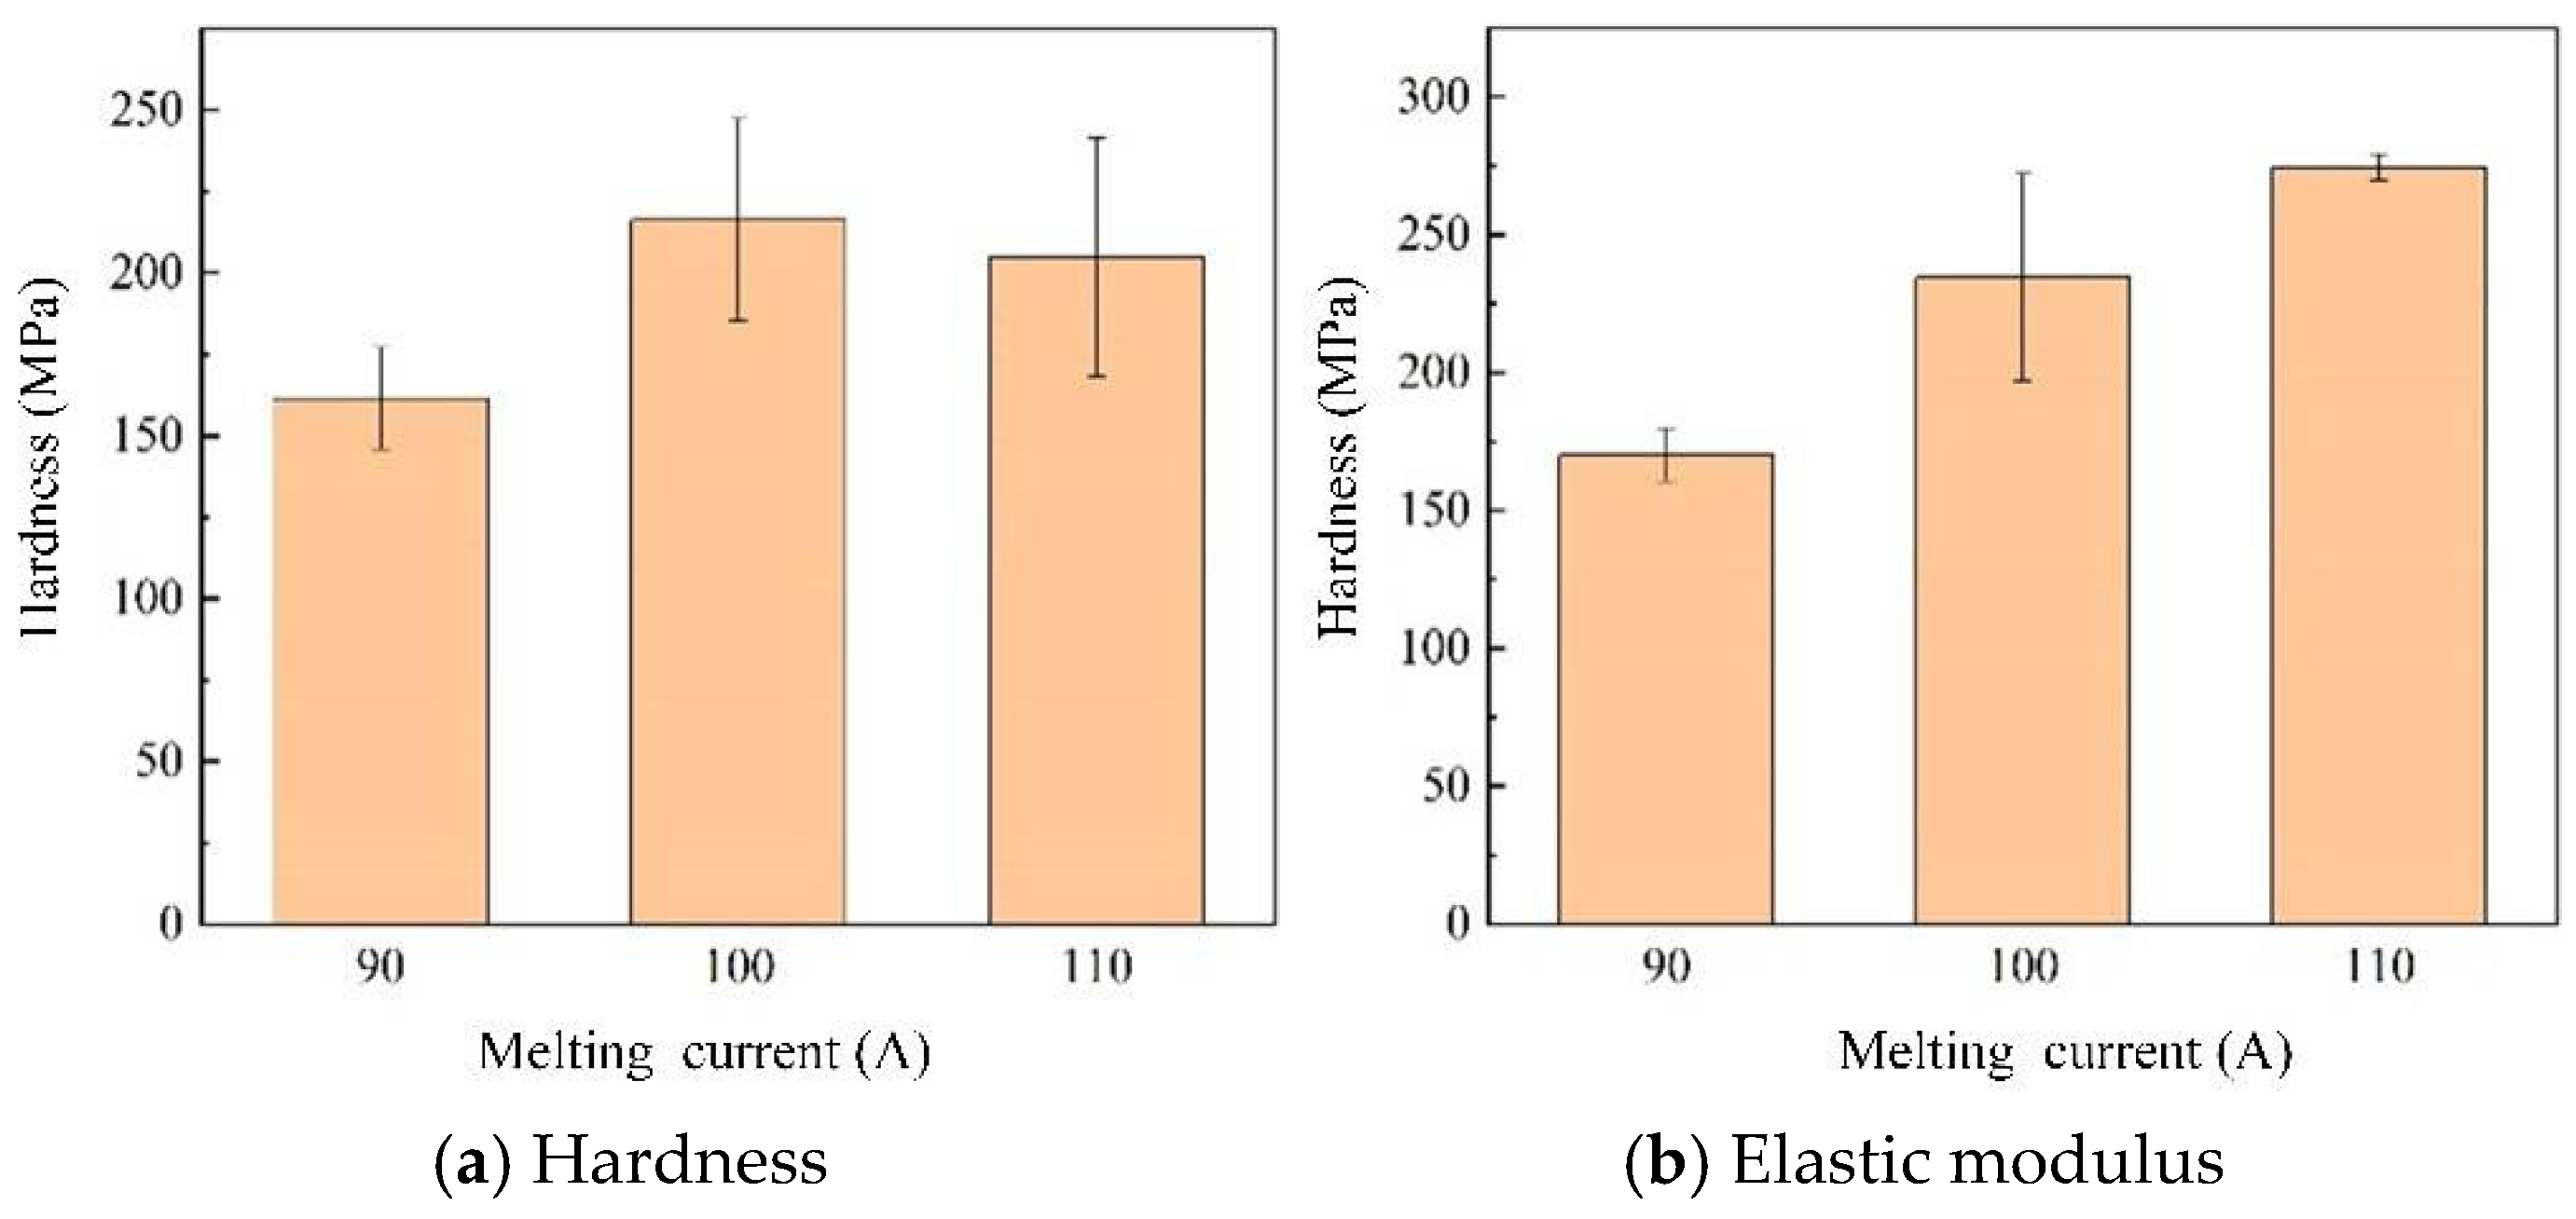
3.2. Nanoindentation Analysis

Under an indentation load of 1000 mN, the nanoindentation load–displacement curves of the aluminum–steel interface under different deposition currents are shown in Figure 14. Comparative analysis shows that there are obvious differences in the slopes of the displacement–load curves of each sample in the loading and unloading stages, which reflects the differences in the microstructure.
During the nanoindentation test, the real-time collected load–displacement curve fully records the mechanical behavior characteristics of the material during the indentation process. The curve can be used to calculate the hardness and elastic modulus [37]. The calculation results are shown in Table 4.
Figure 15 shows the change trend of the hardness and elastic modulus of the aluminum–steel interface under different deposition currents. With the increase in deposition current, the hardness of the sample increases first and then decreases. The hardness is largest at a 100 A deposition current, which is 216.29 MPa, while the elastic modulus increases with the increase in the deposition current. The elastic modulus is the smallest at a 90 A deposition current, which is 170.12 GPa, and the elastic modulus is the largest at a 110 A deposition current, which is 274.49 GPa.

3.3. Tensile Performance Analysis

Figure 16 shows the stress–strain curves at the aluminum–steel interface under different deposition currents. All samples showed typical brittle fracture characteristics. After reaching the maximum stress, the curve dropped rapidly, without an obvious plastic deformation stage, and the tensile strength showed a trend of first increasing and then decreasing with the change in deposition current, reaching a peak of 120.45 MPa at 100 A, a minimum of 101.21 MPa at 90 A, and dropping to 110.22 MPa at 110 A.
This rule is related to the regulation of the deposition current by the interface bonding quality and microstructure. At 90 A, insufficient heat input leads to a low molten pool temperature, insufficient metallurgical bonding at the interface, and weakened interface strength. As the current increases, appropriate heat input promotes full interface fusion, reduces defects such as pores, and significantly improves bonding strength. At 110 A, excessive heat input causes the interface to form excessively thick brittle IMCs, while inducing thermal stress concentration and microcracks, ultimately leading to a decrease in strength.
The fracture morphology of the tensile specimens under different deposition currents was analyzed by scanning electron microscopy to study the fracture mechanism of the joint. Figure 17 shows the fracture morphology under different deposition currents. Figure 17a shows the fracture morphology characteristics at a 90 A current. The fracture surface is relatively flat, showing brittle fracture characteristics, and there are a small number of pores on the surface. As can be seen from Figure 17b, the fracture surface shows river patterns and other features. River patterns are typical morphological features of cleavage fracture, which are formed by cracks extending along specific crystallographic planes, causing the material to fail due to brittle fracture.
The fracture morphology when the current is 100 A is shown in Figure 17c. The surface shows rough and irregular texture characteristics, showing brittle fracture. This morphology is related to cleavage fracture or intracrystalline fracture, indicating that the material has weak plastic deformation ability during the fracture process and that the crack extension path is complex. In Figure 17d, dimples were observed in local areas, indicating that there was a certain amount of plastic deformation in the local area, and the fracture mechanism tended to transform to ductile fracture. Due to the small number of dimples and their sparse distribution, the contribution to the overall plastic deformation was limited, so the elongation of the sample was not significantly improved.
When the current was 110 A, the fracture morphology showed a “scale-like” appearance with cleavage steps, as shown in Figure 17e,f, indicating that brittle fracture dominated. This morphology was attributed to the formation of brittle IMCs (such as FeAl3, Fe2Al5, etc.) at the interface, which weakened the interface bonding, became the crack source, and promoted its extension along the interface. In addition, the brittle phase in the material will weaken the overall toughness and induce cleavage fracture. When the crack propagates along the cleavage plane, it deflects at the grain boundary to form a cleavage step, which further confirms the brittle fracture.
By using Cold Metal Transfer (CMT) technology combined with an industrial robotic system, aluminum was deposited layer-by-layer onto the surface of the anode steel claw, effectively achieving precise control of the welding heat input, and significantly reducing the thickness of the intermetallic compound layer and the risk of embrittlement of the interface structure. During the cladding process, the welding process is monitored and defects detected in real time by a machine vision system to ensure the forming quality and process stability. Finally, an aluminum cladding layer with good interface bonding, dense structure, and uniform forming is obtained. Figure 18 is a physical picture of the anode steel claw obtained in actual production. Its surface cladding layer has good forming quality, regular geometric contours, no obvious spatter or welding defects, and fully meets the performance requirements of the anode guide rod group in terms of its strength and durability during the electrolytic aluminum production process.

4. Results Discussion

This study focuses on the effect of deposition current on the formation mechanism of FeAl3 and Fe2Al5 intermetallic compounds (IMCs) at the aluminum–steel interface. Understanding the growth mechanisms of FeAl3 and Fe2Al5 phases and how to control the formation of IMCs through process parameters is of great significance for improving the mechanical performance of Al–steel joints. This section discusses the formation and growth processes of the IMC layers.
At relatively low deposition currents, as shown in Figure 19a, insufficient arc energy leads to a smaller molten pool and limited thermal activation, which restricts atomic diffusion across the interface. As a result, a discontinuous and thin FeAl3 layer is formed. With increasing current, the heat input reaches an optimal level, significantly promoting the diffusion of Al and Fe atoms. Under these conditions, the FeAl3 layer becomes continuous and uniform, with its thickness increasing to approximately 1.75 μm. This phase preferentially grows along the crystallographic c-axis due to the high vacancy concentration in this direction, which provides a thermodynamically favorable diffusion path for Al atoms [38]. Al atoms diffuse into the steel substrate, where FeAl3 nucleates at the interface and grows anisotropically along the c-axis [39].
However, when the deposition current becomes too high, as shown in Figure 19c, excessive heat input significantly accelerates the interfacial reaction kinetics, promoting the transformation of FeAl3 into Fe2Al5 and causing the IMC layer to grow rapidly and irregularly. The morphology of the layer becomes uneven, and local overgrowth induces stress concentration, leading to increased joint brittleness. This may be attributed to the relatively low peak temperatures and rapid cooling rates associated with the CMT process, which kinetically favor the stable formation of Fe2Al5.
Moreover, Fe2Al5 has a lower Gibbs free energy and is more stable under moderate diffusion conditions [40]. In contrast to the multiphase formation pathway proposed by [41], our results demonstrate that by precisely controlling the heat input through current regulation in the CMT process, a selective phase transformation from FeAl3 to Fe2Al5 can be achieved. Deposition current plays a critical role in the formation of intermetallic compounds [42,43]. The optimal current (100 A) strikes a balance between promoting adequate interfacial reactions for FeAl3 formation and suppressing excessive Fe2Al5 growth, thereby achieving the optimal mechanical performance of the Al–steel joint.
In future research, multi-layer and multi-pass aluminum cladding strategies under robotic CMT conditions will be further explored to improve the uniformity of the bonding interface. In addition, in situ monitoring technologies such as infrared thermography and real-time spectroscopy will be integrated into the vision-based control system to enhance the accuracy of process feedback and adaptive compensation capabilities.

5. Conclusions

This study, based on a binocular vision system, achieved 3D reconstruction of the weld layer, enabling precise defect detection. By integrating robot-controlled path compensation and adjusting the welding current to regulate heat input, high-quality components meeting the required standards were successfully produced.
(1)
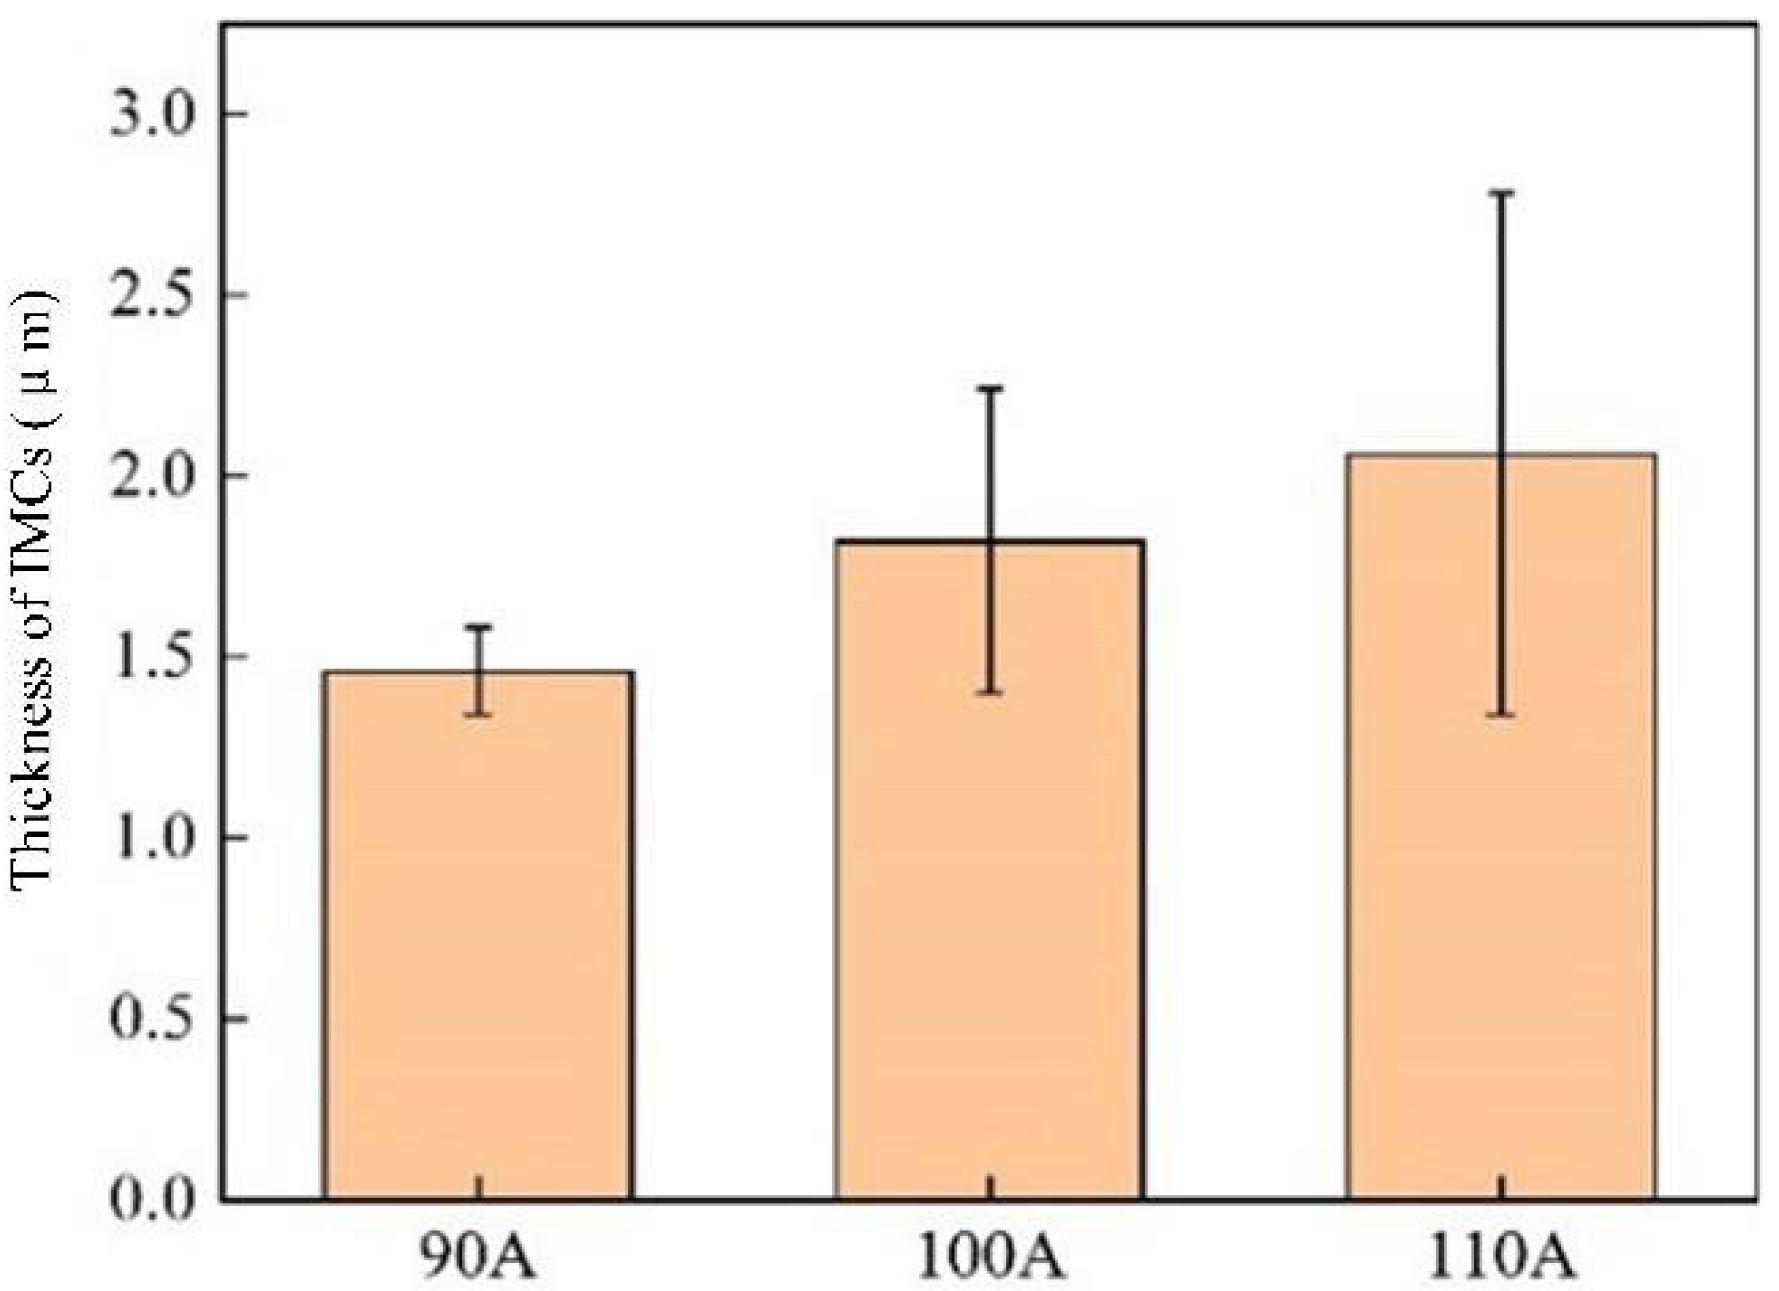
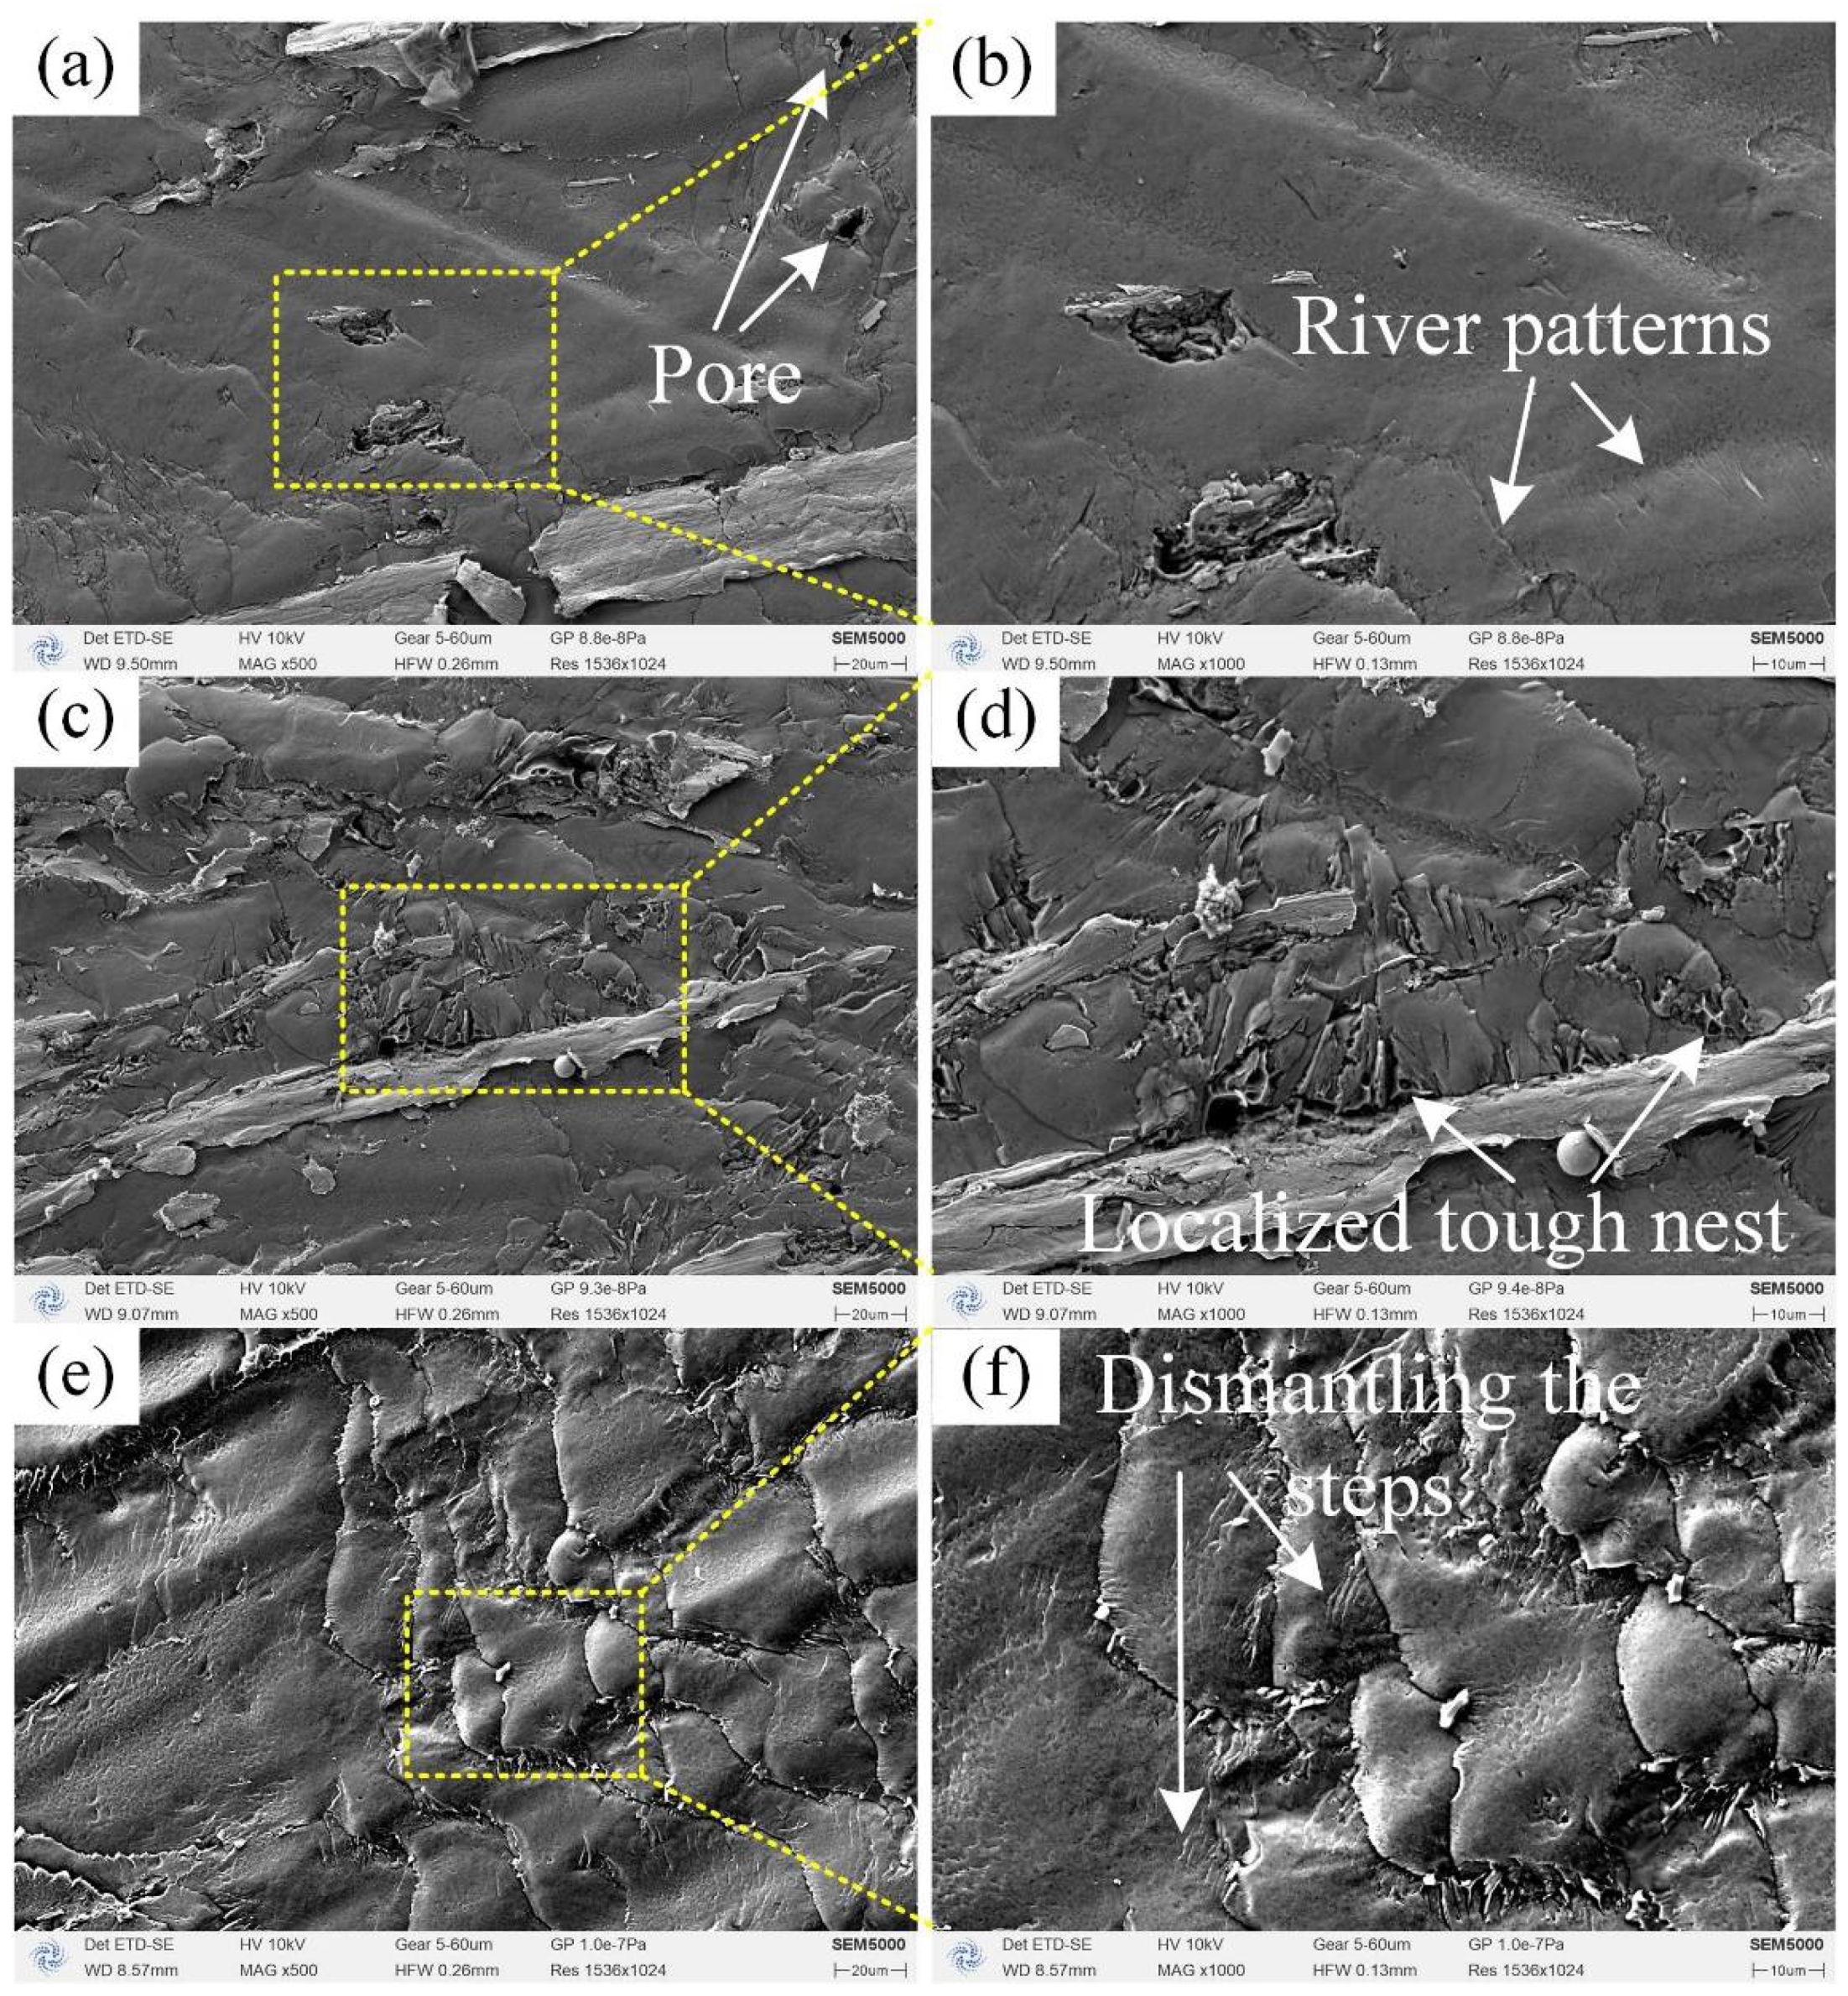
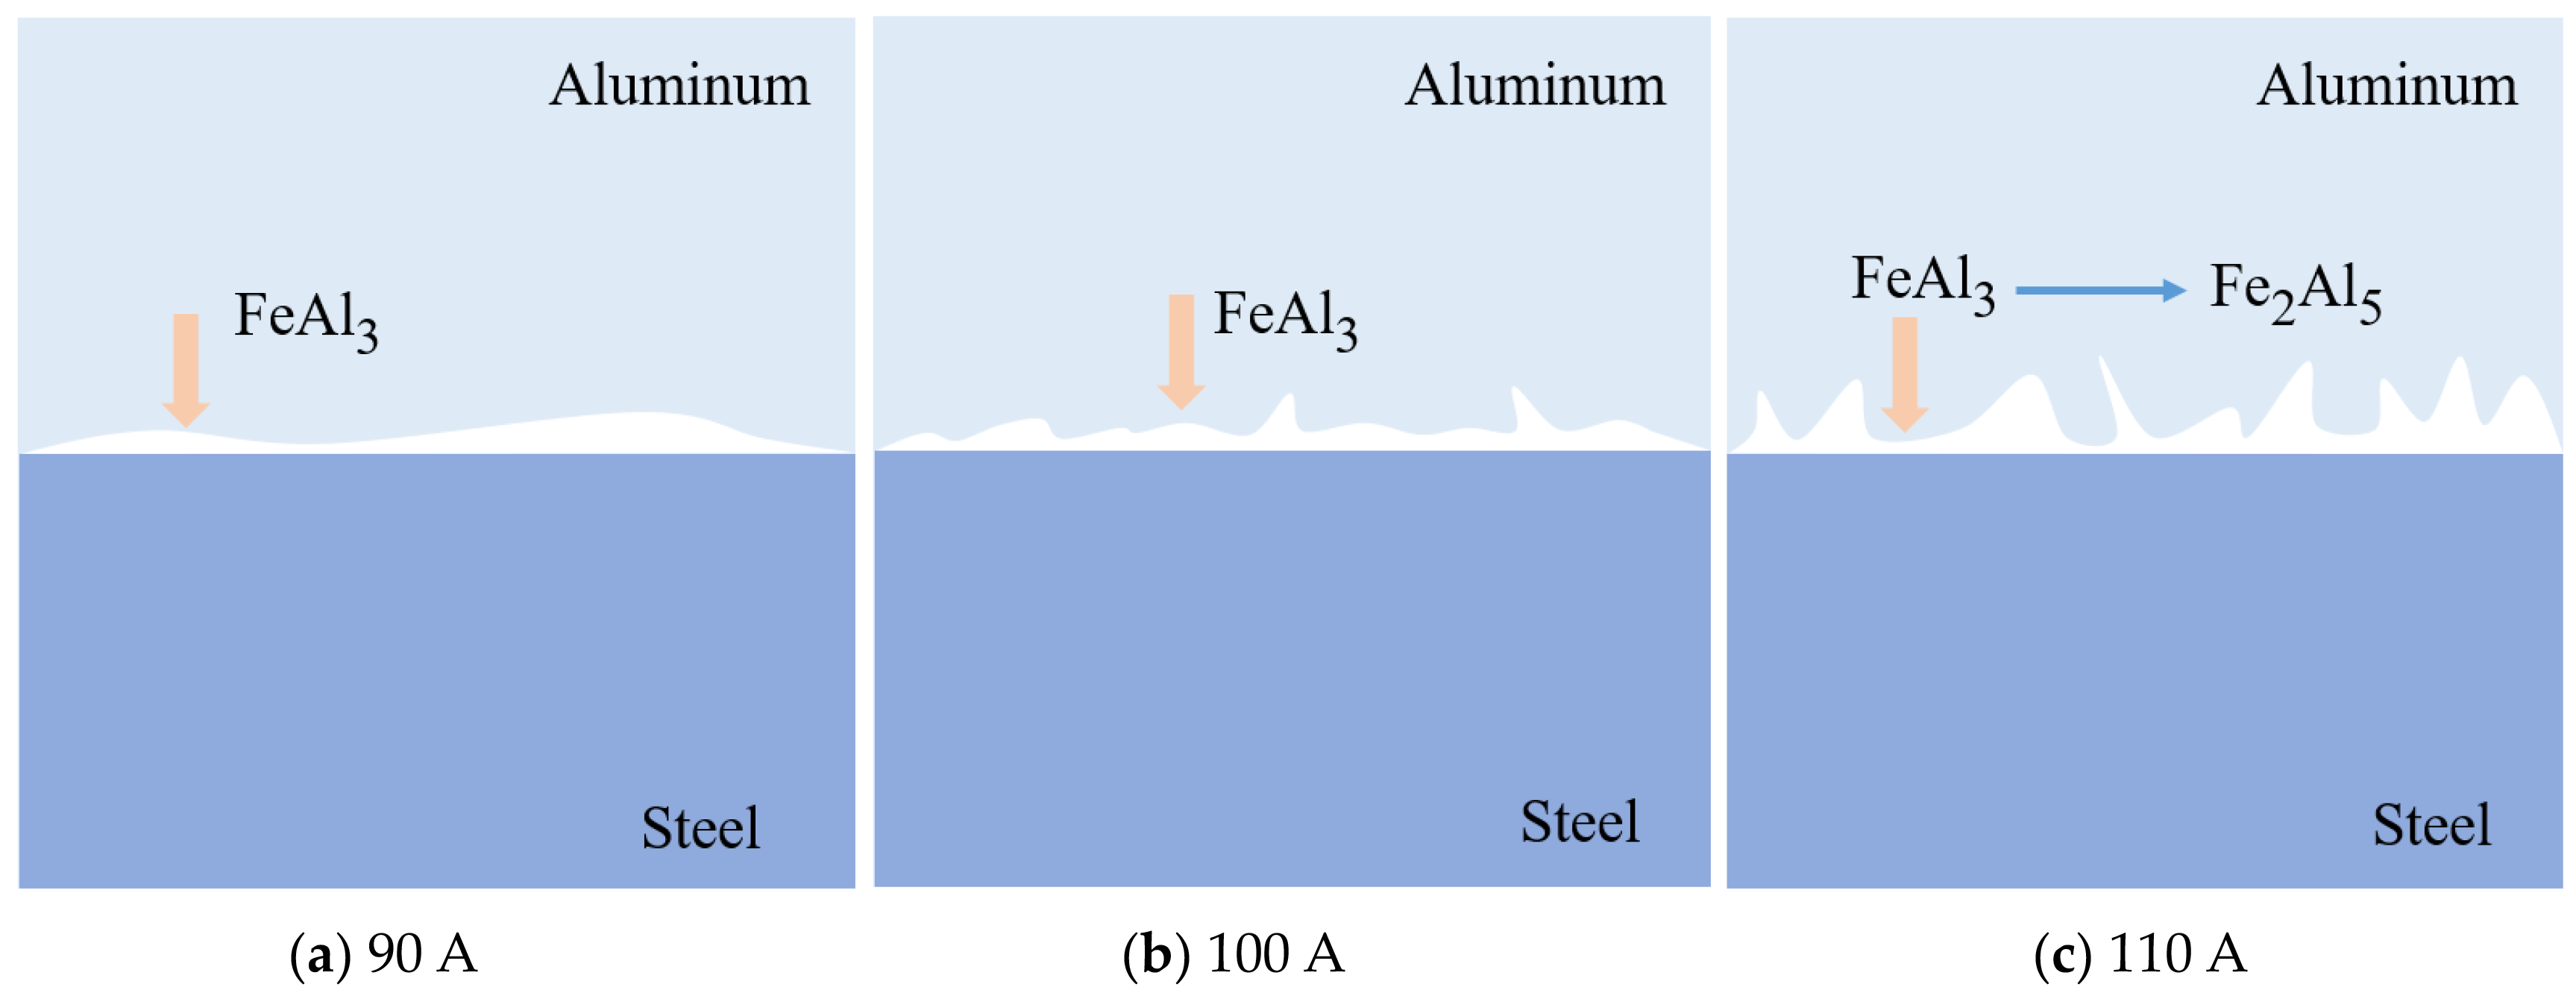
Microstructural analysis showed that with increasing deposition current, grain size near the fusion line increased, and the thickness of the interfacial layer grew. The thicknesses of intermetallic compounds (IMCs) increased with current, and the brittle Fe2Al5 phase began to appear at 110 A, confirming that welding current has a significant impact on IMC growth at the interface.
(2)
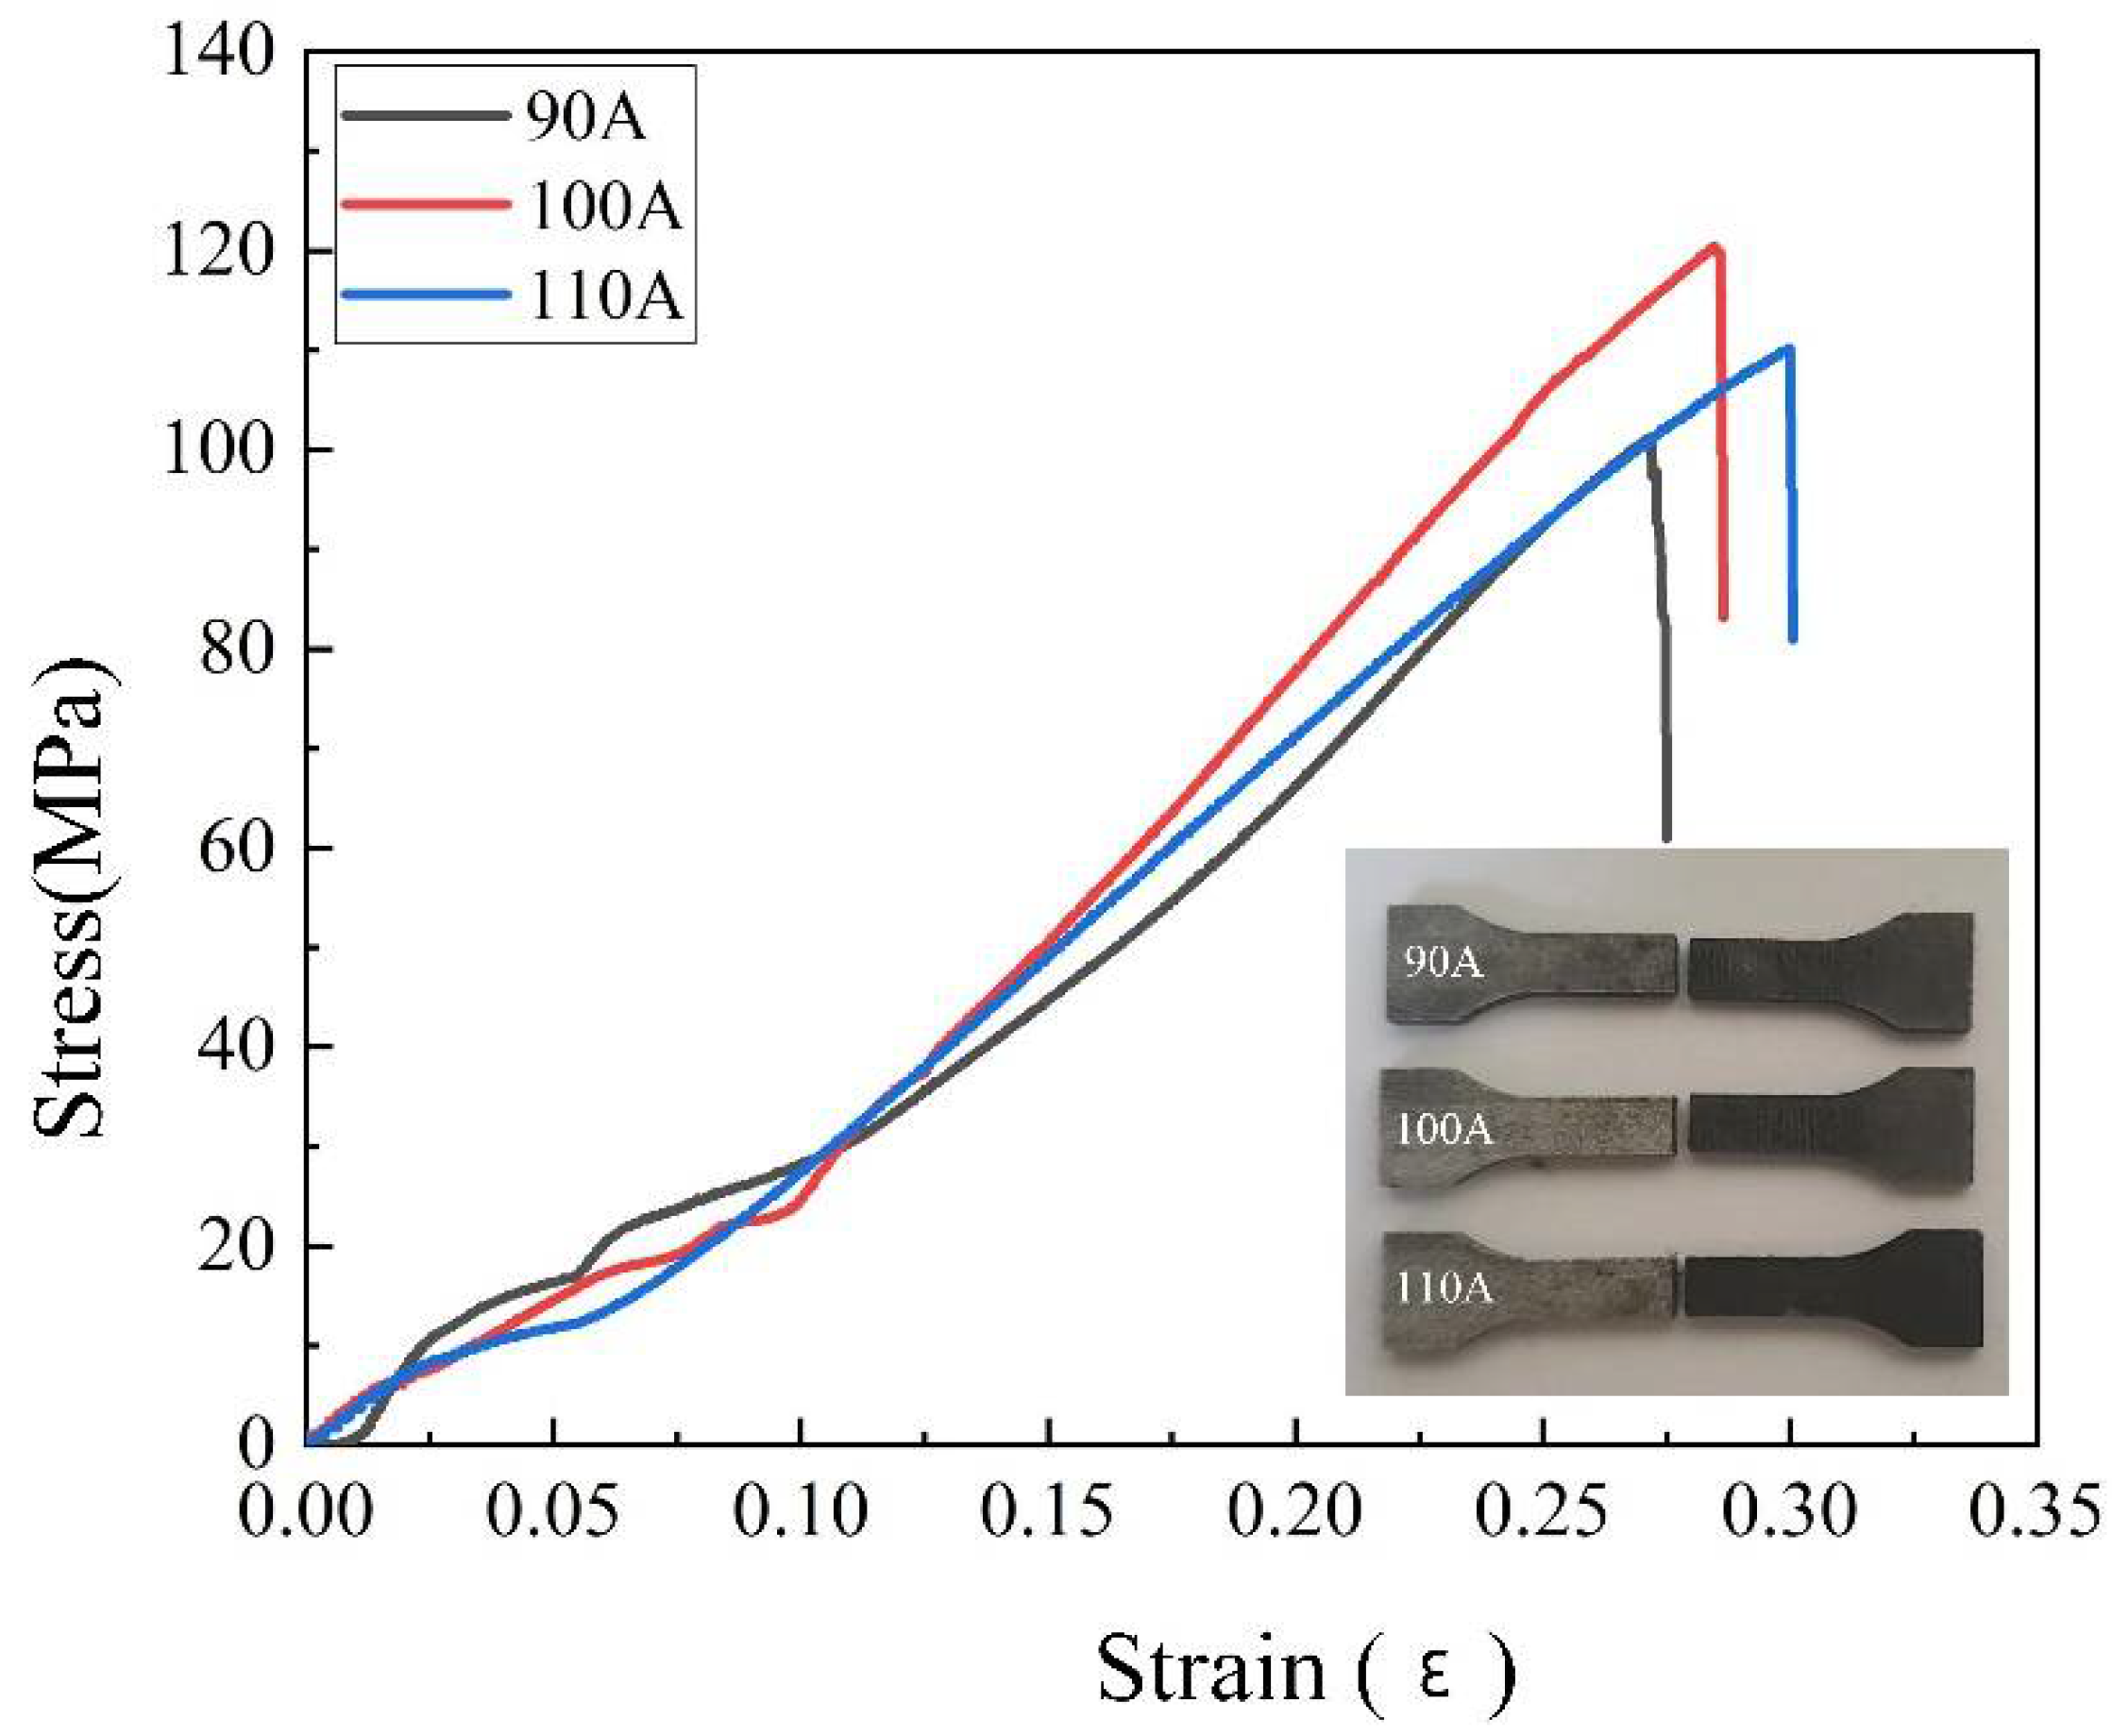
Mechanical testing revealed that the joint strength peaked at 100 A (120.45 MPa) and decreased at both lower and higher currents. The fusion zone exhibited the highest hardness, and all specimens showed brittle fracture characteristics.

Author Contributions

Conceptualization, J.Z. (Jie Zhang) and J.H.; Methodology, P.Z.; Software, J.Z. (Jie Zhang) and H.D.; Validation, J.H.; Formal analysis, J.Z. (Jie Zhang), X.W., and J.H.; Investigation, Y.Z. and J.Z. (Jipeng Zhao); Resources, J.Z. (Jie Zhang) and J.H.; Data curation, H.D., X.W., J.Z. (Jipeng Zhao), and D.F.; Writing—original draft, J.Z. (Jie Zhang) and H.D.; Writing—review and editing, Y.Z., P.Z., and D.F.; Supervision, J.H.; Project administration, J.H. All authors have read and agreed to the published version of the manuscript.

Funding

This research was funded by the National Natural Science Foundation of China, grant number [52165045].

Data Availability Statement

The original contributions presented in the study are included in the article, further inquiries can be directed to the corresponding authors.

Acknowledgments

The authors are grateful for the financial support provided by National Natural Science Foundation of China (Grant No. 52165045).

Conflicts of Interest

The authors declare that they have no known competing financial interests or personal relationships that could have appeared to influence the work reported in this paper.

References

  1. Wang, J.; Li, J.; Zhang, J.L. Analysis of aluminum resource supply and demand situation in China from a global perspective. China Min. Mag. 2024, 33, 54–62. [Google Scholar]
  2. Zhang, X.; Hu, X.; Zhao, J.; Chen, C.; He, G.; Zhang, L. The study of thermal-electrical coupling numerical simulation of aluminum electrolytic cell anode assembly and parameter optimization of steel claws. Results Eng. 2025, 26, 104738. [Google Scholar] [CrossRef]
  3. Zhang, Y.; Zou, N.; Xu, J.; Wang, M.; Wang, X. Numerical Simulations and Experimental Studies for Optimization of Anode Assembly in Aluminum Reduction Cell Using Cast Iron for Anode Fixation Thimble. J. Sustain. Metall. 2024, 10, 2668–2695. [Google Scholar] [CrossRef]
  4. Wu, J.; Xie, P.; Hao, W.; Lu, D.; Qi, Y.; Mi, Y. Ionic liquids as electrolytes in aluminum electrolysis. Front. Chem. 2022, 10, 1014893. [Google Scholar] [CrossRef] [PubMed]
  5. Feng, X.; Mao, H.; Liu, C. The Control System of Friction Welding Machine for 5000kN Large Electrolytic Aluminum Prebaked Anode Conductor. J. Phys. Conf. Seri. 2021, 1748, 052016. [Google Scholar] [CrossRef]
  6. Han, J.; Feng, B.; Chen, Z.; Liang, Z.; Chen, Y.; Liang, X. Simulation and Application of a New Type of Energy-Saving Steel Claw for Aluminum Electrolysis Cells. Sustainability 2024, 16, 8061. [Google Scholar] [CrossRef]
  7. Liu, J.; Wu, B.; Wang, Z. Microstructure and mechanical properties of aluminum-steel dissimilar metal welded using arc and friction stir hybrid welding. Mater. Des. 2023, 225, 111520. [Google Scholar] [CrossRef]
  8. Li, P.; Chen, S.; Dong, H.; Ji, H.; Li, Y.; Guo, X.; Yang, G.; Zhang, X.; Han, X. Interfacial microstructure and mechanical properties of dissimilar aluminum/steel joint fabricated via refilled friction stir spot welding. J. Manuf. Process. 2020, 49, 385–396. [Google Scholar] [CrossRef]
  9. Nandan, G.; Kumar, G.; Arora, K.S.; Kumar, A. MIG and CMT brazing of aluminum alloys and steel: A review. Mater. Today Proc. 2022, 56, 481–488. [Google Scholar] [CrossRef]
  10. Das, A.; Bang, H.S. Laser and Gas Metal Arc Based Dissimilar Joining of Automotive Aluminium Alloys and Steel Sheets—A Review. J. Weld. Join. 2018, 36, 1–11. [Google Scholar] [CrossRef]
  11. Acarer, M.; Demir, B. An investigation of mechanical and metallurgical properties of explosive welded aluminum–dual phase steel. Mater. Lett. 2008, 62, 4158–4160. [Google Scholar] [CrossRef]
  12. Liu, P.; Li, Y.; Wang, J.; Geng, H. Microstructure in interface zone of diffusion-bonded joint of Mg/Al dissimilar materials. Trans. China Weld. Inst. 2004, 5–8. [Google Scholar]
  13. Macwan, A.; Mirza, F.A.; Bhole, S.D.; Chen, D.L. Similar and Dissimilar Ultrasonic Spot Welding of 5754 Aluminum Alloy for Automotive Applications. Mater. Sci. Forum 2016, 877, 561–568. [Google Scholar] [CrossRef]
  14. Macwan, A.; Kumar, A.; Chen, D.L. Ultrasonic spot welded 6111-T4 aluminum alloy to galvanized high-strength low-alloy steel: Microstructure and mechanical properties. Mater. Des. 2017, 113, 284–296. [Google Scholar] [CrossRef]
  15. Xia, H.; Tao, W.; Li, L.; Tan, C.; Zhang, K.; Ma, N. Effect of laser beam models on la ser welding-brazing Al to steel. Opt. Laser Technol. 2020, 122, 105845. [Google Scholar] [CrossRef]
  16. van der Rest, C.; Jacques, P.J.; Simar, A. On the joining of steel and aluminium by means of a new friction melt bonding process. Scr. Mater. 2014, 77, 25–28. [Google Scholar] [CrossRef]
  17. Li, R.; Yuan, X.J.; Zhang, H.B. Effect of axial magnetic field on TIG welding–brazing of AA6061 aluminum alloy to HSLA350 steel. J. Mater. Res. Technol. 2021, 12, 882–893. [Google Scholar] [CrossRef]
  18. Shi, H.; Qiao, S.; Qiu, R.; Zhang, X.; Yu, H. Effect of Welding Time on the Joining Phenomena of Diffusion Welded Joint between Aluminum Alloy and Stainless Steel. Mater. Manuf. Process. 2012, 27, 1366–1369. [Google Scholar] [CrossRef]
  19. Patel, V.K.; Bhole, S.D.; Chen, D.L. Ultrasonic spot welding of aluminum to high-strength low-alloy steel: Microstructure, tensile and fatigue properties. Metall. Mater. Trans. A 2014, 45, 2055–2066. [Google Scholar] [CrossRef]
  20. Zhang, H.; Feng, J.; He, P.; Hackl, H. Interfacial microstructure and mechanical properties of aluminium–zinc-coated steel joints made by a modified metal inert gas welding–brazing process. Mater. Charact. 2007, 58, 588–592. [Google Scholar] [CrossRef]
  21. Cao, R.; Yu, G.; Chen, J.; Wang, P. Cold metal transfer joining aluminum alloys-to-galvanized mild steel. J. Mater. Process. Technol. 2013, 213, 1753–1763. [Google Scholar] [CrossRef]
  22. Peng, M.; Liu, H.; Liang, Y.; Xu, W.; Zhao, Y.; Chen, S.; Weng, J.; Yang, J. CMT welding-brazing of al/steel dissimilar materials using cycle-step mode. J. Mater. Res. Technol. 2022, 18, 1267–1280. [Google Scholar] [CrossRef]
  23. Romankov, S.; Park, Y.; Semin, V.; Komarov, S.; Serikkanov, A.; Louzguine-Luzgin, D.V. Solid-state aluminizing process for high-adhesion composite coatings: Synergistic effects of plastic flow, atomic mixing and interaction on structure and properties. Surf. Coat. Technol. 2024, 489, 131099. [Google Scholar] [CrossRef]
  24. Xu, W.; He, H.; Yi, Y.; Wang, H.; Yu, C.; Fang, W. Dissimilar joining of stainless steel and aluminum using twin-wire CMT. Weld. World 2021, 65, 1541–1551. [Google Scholar] [CrossRef]
  25. Zhang, S.; Li, S.; Meng, X. Effect of intermetallic compound on the corrosion behaviour of resistance spot welding joints between 5182 aluminium alloy and galvanized DP780 dual-phase steel. Mater. Res. Express 2023, 10, 026515. [Google Scholar] [CrossRef]
  26. Shi, Y.; Li, J.; Zhang, G.; Huang, J.; Gu, Y. Corrosion behavior of aluminum-steel weld-brazing joint. J. Mater. Eng. Perform. 2016, 25, 1916–1923. [Google Scholar] [CrossRef]
  27. Atabaki, M.M.; Nikodinovski, M.; Chenier, P.; Ma, J.; Harooni, M.; Kovacevic, R. Welding of aluminum alloys to steels: An overview. J. Manuf. Sci. Prod. 2014, 14, 59–78. [Google Scholar] [CrossRef]
  28. Dong, P. Quantitative weld quality acceptance criteria: An enabler for structural lightweighting and additive manufacturing. Weld. J. 2020, 99, 39S–51S. [Google Scholar] [CrossRef]
  29. Wu, S.; Dong, P. Modeling of distributed defects and a proposed fatigue interaction criterion for additively manufactured metal parts. Int. J. Press. Vessel. Pip. 2023, 206, 105048. [Google Scholar] [CrossRef]
  30. Wu, S.; Cheng, J.; Dong, P.; Zhang, Y.; Zhang, L. Defect Interactions and Effects on Fatigue Behaviors of Additively Manufactured Parts. In Proceedings of the Pressure Vessels and Piping Conference, Atlanta, GA, USA, 16–21 July 2023; Volume 87486, p. V005T06A002. [Google Scholar]
  31. Feng, J.; Zhang, H.; He, P. The CMT short-circuiting metal transfer process and its use in thin aluminium sheets welding. Mater. Des. 2009, 30, 1850–1852. [Google Scholar] [CrossRef]
  32. Selvi, S.; Vishvaksenan, A.; Rajasekar, E. Cold metal transfer (CMT) technology—An overview. Def. Technol. 2018, 14, 28–44. [Google Scholar] [CrossRef]
  33. Hu, Y.; Chen, F.; Cao, S.; Fan, Y.; Xie, R. Preparation and Characterization of CMT Wire Arc Additive Manufac-turing Al-5%Mg Alloy Depositions Through Assisted Longitudinal Magnetic Field. J. Manuf. Process. 2023, 101, 576–588. [Google Scholar] [CrossRef]
  34. Guo, W.; Huang, X.; Qi, B.; Ren, X.; Chen, H.; Chen, X. Vision-guided path planning and joint configuration optimization for robot grinding of spatial surface weld beads via point cloud. Adv. Eng. Inform. 2024, 61, 102465. [Google Scholar] [CrossRef]
  35. Xiao, J.L.; Fan, J.S.; Liu, Y.F.; Li, B.L.; Nie, J.G. Region of interest (ROI) extraction and crack detection for UAV-based bridge inspection using point cloud segmentation and 3D-to-2D projection. Autom. Constr. 2024, 158, 105226. [Google Scholar] [CrossRef]
  36. Zhang, Y.; Geng, Y.; Tian, X.; Sun, Y.; Xu, X. A novel weld seam extraction method with semantic segmentation and point cloud feature for irregular structure workpieces. Robot. Comput. Integr. Manuf. 2025, 95, 102987. [Google Scholar] [CrossRef]
  37. GB/T 3246.1-2024; National Technical Committee for Standardization of Nonferrous Metals (SAC/TC 243). Inspection Methods for Microstructure of Wrought Aluminium and Aluminium Alloys—Part 1: Microscopic Examination Method. Standards Press of China: Beijing, China, 2024.
  38. Xu, D.; Harvey, T.; Begiristain, E.; Domínguez, C.; Sánchez-Abella, L.; Browne, M.; Cook, R.B. Measuring the elastic modulus of soft biomaterials using nanoindentation. J. Mech. Behav. Biomed. Mater. 2022, 133, 105329. [Google Scholar] [CrossRef] [PubMed]
  39. Yu, X.; Huang, J.; Yang, T.; Fan, D. The growth behavior for intermetallic compounds at the interface of aluminum-steel weld joint. Materials 2022, 15, 3563. [Google Scholar] [CrossRef] [PubMed]
  40. Chen, N.; Wang, M.; Wang, H.; Wan, Z.; Blair, E.C. Microstructural and mechanical evolution of Al/steel interface with Fe2Al5 growth in resistance spot welding of aluminum to steel. J. Manuf. Process. 2018, 34, 424–434. [Google Scholar] [CrossRef]
  41. Huang, S.; Yu, H.; Lou, M.; Xu, L.; Lu, R.; Li, Z.; Li, Y. Effect of Ti interlayers on microstructure and mechanical properties of laser spiral fusion welded steel/aluminum lap joints. J. Mater. Res. Technol. 2025, 35, 1752–1763. [Google Scholar] [CrossRef]
  42. Wang, H.; Yang, F.; Zhang, Z.; Liu, L. Bonding mechanism of Al/steel interface formed by laser-TIG welding assisted riveting technology. Mater. Today Commun. 2020, 25, 101487. [Google Scholar] [CrossRef]
  43. Li, Q.; Yang, S.; Hu, B.; Xue, S. Laser welding of aluminum/steel dissimilar metals and control of intermetallic compounds: A review. Int. J. Adv. Manuf. Technol. 2025, 137, 4283–4308. [Google Scholar] [CrossRef]
Figure 1. CMT welding experimental system.
Metals 15 00844 g001
Figure 2. Collection and communication system.
Metals 15 00844 g002
Figure 3. Schematic diagram of cladding formation.
Metals 15 00844 g003
Figure 4. Defect detection process of weld deposit layer.
Metals 15 00844 g004
Figure 5. Defect identification results of weld-deposited layer.
Metals 15 00844 g005
Figure 6. Camera structure during the test.
Metals 15 00844 g006
Figure 7. Point cloud processing of cladding layer: (a) 3D point cloud of weld-deposited layer; (b) defect point cloud extraction.
Metals 15 00844 g007
Figure 8. (a) Surface morphology of cladding layer after defect compensation; (b) aluminum–steel cross-section.
Metals 15 00844 g008
Figure 9. Microstructure of aluminum–steel joint under different deposition currents.
Metals 15 00844 g009
Figure 10. XRD analysis results of aluminum–steel interface under different deposition currents.
Metals 15 00844 g010
Figure 11. Microstructure of aluminum–steel joints under different deposition currents observed by scanning electron microscopy.
Metals 15 00844 g011
Figure 12. Offline scanning results of different deposition currents.
Metals 15 00844 g012
Figure 13. Interface layer thickness.
Metals 15 00844 g013
Figure 14. Nanoindentation load–displacement curves of aluminum–steel interface under different deposition currents.
Metals 15 00844 g014
Figure 15. Variation trend of aluminum–steel interface hardness and elastic modulus under different deposition currents.
Metals 15 00844 g015
Figure 16. Stress–strain curves of samples under different deposition currents.
Metals 15 00844 g016
Figure 17. Scanning electron microscopy (SEM) images (500×) showing crack surface morphologies under different deposition conditions: (a) surface morphology at a welding current of 90 A; (b) enlarged view of the selected area in (a); (c) surface morphology at a welding current of 100 A; (d) enlarged view of the selected area in (c); (e) surface morphology at a welding current of 110 A; (f) enlarged view of the selected area in (e). Please refer to the attachment for more detailed information.
Metals 15 00844 g017
Figure 18. Final anode steel claw.
Metals 15 00844 g018
Figure 19. Schematic diagram of the formation and growth of the Al-Fe IMC layer (a) 90A; (b) 100A; (c) 110A.
Metals 15 00844 g019
Table 1. Chemical composition table of Q235 steel plate (wt.%).
ElementsCMnSiSPFe
Content≤0.22≤1.4≤0.35≤0.050≤0.045Remainder
Table 2. Chemical composition table of ER5356 welding wire (wt.%).
ElementsMgFeCuMnSiCrZnTiAl
Content5.50.400.100.200.250.200.100.20Remainder
Table 3. EDS scan results of calibration points (At%).
PointFeAlMg
11.8798.130
218.8581.150
399.400.570.03
401000
523.7376.270
699.350.580.07
70.0399.970
827.1872.820
998.971.010.02
Table 4. Hardness and elastic modulus of the intermediate layer at the aluminum–steel interface.
Welding Current (A)Hardness (MPa)Elastic Modulus Er (GPa)
90161.57170.12
100216.29234.63
110204.77274.49
Disclaimer/Publisher’s Note: The statements, opinions and data contained in all publications are solely those of the individual author(s) and contributor(s) and not of MDPI and/or the editor(s). MDPI and/or the editor(s) disclaim responsibility for any injury to people or property resulting from any ideas, methods, instructions or products referred to in the content.

