Article

A Recycling-Oriented Approach to Rare Earth Element Recovery Using Low-Cost Agricultural Waste

by
Nicole Ferreira
1,2,3,
Daniela S. Tavares
1,3,*,
Inês Baptista
3,
Thainara Viana
1,3,
Jéssica Jacinto
1,3,
Thiago S. C. Silva
3,
Eduarda Pereira
1,3 and
Bruno Henriques
1,3,*
1
LAQV-REQUIMTE—Associated Laboratory for Green Chemistry, Department of Chemistry, University of Aveiro, 3810-193 Aveiro, Portugal
2
CICECO—Aveiro Institute of Materials, Department of Chemistry, University of Aveiro, 3810-193 Aveiro, Portugal
3
Department of Chemistry, University of Aveiro, 3810-193 Aveiro, Portugal
*
Authors to whom correspondence should be addressed.
Metals 2025, 15(8), 842; https://doi.org/10.3390/met15080842
Submission received: 4 June 2025 / Revised: 18 July 2025 / Accepted: 24 July 2025 / Published: 28 July 2025

Abstract

The exponential increase in electronic waste (e-waste) from end-of-life electrical and electronic equipment presents a growing environmental challenge. E-waste contains high concentrations of rare earth elements (REEs), which are classified as critical raw materials (CRMs). Their removal and recovery from contaminated systems not only mitigate pollution but also support resource sustainability within a circular economy framework. The present study proposed the use of hazelnut shells as a biosorbent to reduce water contamination and recover REEs. The sorption capabilities of this lignocellulosic material were assessed and optimized using the response surface methodology (RSM) combined with a Box–Behnken Design (three factors, three levels). Factors such as pH (4 to 8), salinity (0 to 30), and biosorbent dose (0.25 to 0.75 g/L) were evaluated in a complex mixture containing 9 REEs (Y, La, Ce, Pr, Nd, Eu, Gd, Tb and Dy; equimolar concentration of 1 µmol/L). Salinity was found to be the factor with greater significance for REEs sorption efficiency, followed by water pH and biosorbent dose. At a pH of 7, salinity of 0, biosorbent dose of 0.75 g/L, and a contact time of 48 h, optimal conditions were observed, achieving removals of 100% for Gd and Eu and between 81 and 99% for other REEs. Optimized conditions were also predicted to maximize the REEs concentration in the biosorbent, which allowed us to obtain values (total REEs content of 2.69 mg/g) higher than those in some ores. These results underscore the high potential of this agricultural waste with no relevant commercial value to improve water quality while providing an alternative source of elements of interest for reuse (circular economy).

1. Introduction

The United Nations recognizes water as the core of sustainable development, given its essential role in human survival, food, and energy production. However, only 1% of the earth’s water is available for human consumption and use, which is not equitably distributed and causes socioeconomic problems [1,2]. More than 2 billion people suffer from severe water scarcity and lack access to safely managed drinking water supplies [3]. In addition, it is estimated that over 80% of the world’s wastewater enters waterways untreated [4]. As a universal solvent, water is easily contaminated with toxic substances, either inorganic, organic, or other contaminants [5,6].
Agriculture, mining, and the transformation industry are common anthropogenic sources of water contaminants. Recently, the high obsolescence rate in the technological sector has generated one of the fastest growing waste streams, e-waste [7,8].
E-waste composition is very diverse and differs among products across several categories, but it is known to contain more than 1000 different substances [9,10], making e-waste management a priority. Although new models for the disposal of this waste are being developed, e-waste is a rich source of elements such as gold, silver, copper, lithium, cobalt, platinum group elements, and rare earth elements (REEs), which can be recovered and brought back into the production cycle [8].
The European Commission [11,12] classify REEs as critical raw materials (CRMs) because these elements have a high supply risk (>95% of the global resources have been provided solely by China), and their demand is growing due to their use in electronic devices, industry, and alternative energy production. Rare earth elements represent a group of 17 elements comprising the lanthanide series, plus yttrium (Y) and scandium (Sc). The REEs group can be considered a multi-applicable group due to their diverse chemical, electrical, metallurgical, magnetic, optical, and catalytic properties [13,14], being the so-called “seed of technology” [15].
To date, mine production is the primary source of REEs, which are the main cause of serious environmental problems [16]. The recovery and recycling of REEs from e-waste and other industrial wastewaters [17,18] can respond to supply risk with a cheaper and unexplored supply source while reducing environmental problems and slowing the depletion of natural resources [14]. Currently, only 1% of REEs are recycled [11], mainly due to lack of incentives [19]. Separation and pre-concentration of REEs have been previously evaluated using multiple methods such as liquid–liquid [20] and solid–liquid extraction [21], precipitation [22], ion exchange [23], and biosorption [24].
Biosorption is a promising biotechnological approach used to extract and recover REEs from aquatic systems. This method has been described as efficient and inexpensive, with several biosorbents being tested, namely, fungi, bacteria [25], plant and animal residues [26,27], and agricultural residues [28]. Among biosorbents, nutshells have many advantages over other fruit, barks, and peels, since they are non-perishable, high in polysaccharides, have large porosity, have no commercial value, and are widely available [29]. Over 5.36 million metric tons of tree nuts were produced worldwide in the period 2021/2022, and by 2023/2024, global production of tree nuts had increased slightly, reaching about 5.69 million metric tons [30]. Nut processing generates a large amount of by-products, with the shells representing the greater portion of the nut (almost 67%) [31]. These characteristics have created an interest in using nutshells as a cost-effective sorbent for the removal of elements from contaminated waters. Dias et al. (2021) [32] demonstrated the high efficiency of hazelnut shells in removing heavy metals like mercury and lead from mineral water.
The present study aimed to evaluate the removal of REEs from complex mixtures and different relevant scenarios using hazelnut shells and to optimize the removal conditions. The response surface methodology (RSM), aligned with the Box–Behnken design, was used to assess the significance of three factors that are pivotal for biosorption (pH, salinity, and biosorbent dose) in three different levels (pH 4 to pH 8; salinity 0 to salinity 30; and 0.25 to 0.75 g/L). The objective was to promote the application of nutshells (valorization of this waste) as a sustainable water remediation methodology and, simultaneously, as a secondary source of CRMs for the technological industry.

2. Materials and Methods

2.1. Chemicals

All chemicals used in the experiment were of analytical reagent grade and used without further purification. The certified standard solutions of the rare earth elements (yttrium (Y), lanthanum (La), cerium (Ce), praseodymium (Pr), neodymium (Nd), europium (Eu), gadolinium (Gd), terbium (Tb), and dysprosium (Dy)) (1000 mg/L, in HNO3 1.4–7%) were acquired from Inorganic Ventures (Christiansburg, VA, USA), Alfa Aesar (Haverhill, MA, USA), PlasmaCAL (SCP science, Quebec, QC, Canada), and Sigma Aldrich (St. Louis, MO, USA). Nitric acid (HNO3 65%) and sodium hydroxide (NaOH) (>99%) were purchased from Merck. Prior to use, all glassware was acid-washed with HNO3 25% for 24 h and then rinsed with ultrapure water.

2.2. Biosorbent Preparation

Hazelnut shells used as sorbent in the experiments were mechanically grounded and sieved to obtain particles with sizes between 1 and 2 mm. The material was washed abundantly with tap water at a temperature of 373.15 K and then dried in a muffle at 308.15 K for 48 h.

2.3. Biosorbent Characterization

Characterization of the hazelnut shells was performed before and after contact with the metal solution. Fourier transform infrared spectroscopy-attenuated total reflectance (FTIR-ATR) was performed using a Bruker Optic Tensor 27 Attenuated Total Reflectance spectrometer (Billerica, MA, USA). The spectra were recorded with a resolution of 4 cm−1 and 256 scans. Samples were analyzed directly after baseline correction, and spectra were recorded between 600 and 4000 cm−1. Scanning electron microscopy (SEM) in a Hitachi TM4000 Plus voltage of 15 kV (Hitachi, Tokyo, Japan) was used to evaluate the microstructure. The sample preparation was performed by glueing the hazelnut shells powder onto a carbon-taped aluminum sample holder.

2.4. Design of the Sorption Experiments

The ability of hazelnut shells to remove REEs from water was evaluated by contacting 0.25, 0.50, and 0.75 g/L of the biosorbent in an aqueous solution containing a mixture of REEs (Y, La, Ce, Pr, Nd, Eu, Gd, Tb, and Dy (1 µmol/L)) for determined periods of time under isothermal conditions (295 ± 1 K). All sorption experiments were carried out in Schott Duran® flasks (Wertheim, Germany) of 0.5 L, under magnetic stirring (450 rpm) at room temperature (295.15 K) for a maximum of 168 h. The working solutions were prepared by adding a volume of the commercial stock solution of each REEs to 0.5 L of ultrapure water (salinity 0) or in a solution of seawater with a salinity of 15 or 30 to evaluate the effect of the ionic strength (seawater composition can be seen in Supplementary Material Table S1). The aqueous solution with a salinity of 15 was obtained by diluting seawater in ultrapure water. Experiments were run at three pH levels, 4, 6, and 8, to study the effect of pH on the sorption process. The pH adjustments were performed using solutions of HNO3 (1 mol/L) or NaOH (1 mol/L). Different hazelnut shell masses were added to the multi-element spiked solutions, which was considered the starting point of the kinetic experiment. Sample collection was performed at the following increasing contact times: 0, 1, 6, 24, 48, 72, 96, and 168 h. The samples were acidified to pH < 2 with HNO3 65% and stored at 277.15 K for further quantification.

2.5. Quantification of REEs

The quantification of REEs (Y, La, Ce, Pr, Nd, Eu, Gd, Tb, and Dy) in solution was performed by Inductively Coupled Plasma Mass Spectrometry (ICP-MS), with a Thermo ICP-MS X Series (Waltham, MA, USA) equipped with a Burgener nebulizer. The concentrations were determined using a calibration curve, established with five standards ranging between 0.1 and 100 μg/L, prepared by dilution of the commercial certified stock solution in acid solution (HNO3 2% v/v). The lowest standard was considered the limit of quantification of this method, and only calibration curves with correlation coefficients higher than 0.999 were considered acceptable.

2.6. Data Analysis

The average amount of REEs sorbed by hazelnut shells per unit mass, ( q , mg/g), at time t was calculated by global mass balance, as follows:
q = C 0 C t × V m
where V is the solution volume (L), m is the mass of hazelnut shells (g), C 0 is the initial concentration of REEs in solution (µg/L), and C t is the concentration of REE in solution at time t.
The removal efficiency (Removal, %) of REEs by the biosorbent was calculated as follows:
R e m o v a l   % = ( C 0 C t ) C 0 × 100
The repeatability was assessed by the coefficient of variation (CV) as follows:
C V = s x ¯ × 100

2.7. Response Surface Methodology

Response surface methodology (RSM) is a statistical tool used to evaluate and represent the relationship between independent factors and the target response. This methodology uses empirical models to explain and predict the behaviour of the particular response based on fitting linear, quadratic polynomial functions and other models to the experimental results [33]. Generally, the optimization is performed in the following three main steps: (i) running the designed experiments; (ii) obtaining the estimated coefficients and the mathematical model; and (iii) plotting response curves and determining optimal conditions [34].
In this work, a three-factor, three-level (−1; 0; +1) Box–Behnken design was used to assess their influence on the removal (%) and uptake (mg/g) of REEs (Table 1). Repeated observations at the central point were used to estimate the experimental error. The 15 experiments generated by the Box–Behnken design are shown in Table 2.

2.8. Statistical Analysis

A quadratic equation model according to the following Equation (4) was used for predicting and optimizing the response [33,35]:
Y = β 0 + i = 1 k β i X i + i = 1 k β i i X i 2 + i < j k β i j X i X j
where Y refers to the response variable studied, i.e., REEs removal or uptake, β 0 is a constant coefficient, β i , β i i , and β i j are the different interaction coefficients of the model, and X i , X j ,…, X k are the codified independent variables related to the factors calculated by the equation represented bellow:
X k = x k x 0 x k
where X k is the codified value of the independent variable x k , x 0 is the variable value at its center point, and x k is the step change between levels for the k variable. These codified variables allow their comparison in a common basis.
Data treatment was performed using the software Design-Expert (version 13, StatEase statistics made easy, Minneapolis, MN, USA). Analysis of variance (ANOVA) was used to assess the significance of the factors and the interactions between process variables and response. The quality of fit of the polynomial model was expressed by the coefficient of determination R2, and statistical significance was checked by the F-test. The residual error, pure error, and lack-of-fit were calculated from the repeated measurements.

3. Results and Discussion

3.1. Removal Percentage of Rare Earth Elements by Hazelnut Shells

The results of the removal (%) of Y, La, Ce, Pr, Nd, Eu, Gd, Tb, and Dy by hazelnut shells at 24, 48, and 72 h are presented in Table 3. The highest removals were obtained in experiment 15 (pH 6, salinity 0, and biosorbent dose of 0.75 g/L) at 72 h. More than 93% of each element was removed from the mixture. Reducing the time to 24 h reduced the removal of all elements, although values remained greater than 80%. High element removals (75–91%) were also achieved in experiments 8 (pH 4, salinity 0, and biosorbent dose 0.5 g/L) and 11 (pH 8, salinity 0, and biosorbent dose 0.5 g/L) at 72 h. These results show that the hazelnut shells have a high capacity to simultaneously remove REEs at different pH levels (4, 6, and 8) with a salinity of 0 and using 0.5–0.75 mg/L of biosorbent.
Hazelnut shells have been previously used to remove other elements from water (as Cu, Pb, Cd, Cr, Zn, and Hg) [36,37,38], and some parameters, such as pH and sorbent dose, have been assessed, although individually [32]. It is known that pH affects the protonation of functional groups in the biomass and, thus, can influence the uptake of elements by the biosorbent. When the pH is too acidic, the concentration of protons in the solution increases and, consequently, there will be competition with cations for active sites on the surface of biosorbents. On the other hand, for pH values that are too basic, metal cations tend to precipitate, given the high concentration of hydroxyl anions in the solution. It should be noted that the effect of pH on removal efficiency is dependent on the contaminant to be sorbed and the functional groups of the biosorbent, in particular their point of zero charge (PZC). The point of zero charge is defined by the conditions of the solution for which the surface density of positive charges (cations) equals that of negative charges (anions) [39]. Demirbaş et al. (2008) [40] studied the PZC of hazelnut shells in a pH range from 2 to 10 and observed that the biosorbent had no isoelectric point and had a negative zeta potential value at all pH values studied. These findings were also reported by Al-Ajji and Al-Ghouti (2021) [41].
In contrast to the present work, most of the studies use simplified conditions, such as distilled or deionized water as the contaminated water matrix, which do not consider the possible effect of ionic strength and dissolved organics on the complexation of metals in the solution and, consequently, on the competition for sorption sites. In general, the tests are carried out in individual systems, not considering the possible competition among elements present in multi-element systems [42]. Results show that higher removal percentages (%) are obtained with no salinity, which indicates that hazelnut shells do not present a good performance when the environment shows competition with salt ions.
To evaluate the normal dispersion and model repeatability, the Box–Behnken design (BBD) involves conducting central point replicates, in which all factors are set to their central values (Figure 1).
The repeatability of the central point results was assessed using the coefficient of variation (CV), with the highest variation being approximately 20% for Nd at 72 h, indicating that the repeatability of the model is acceptable.

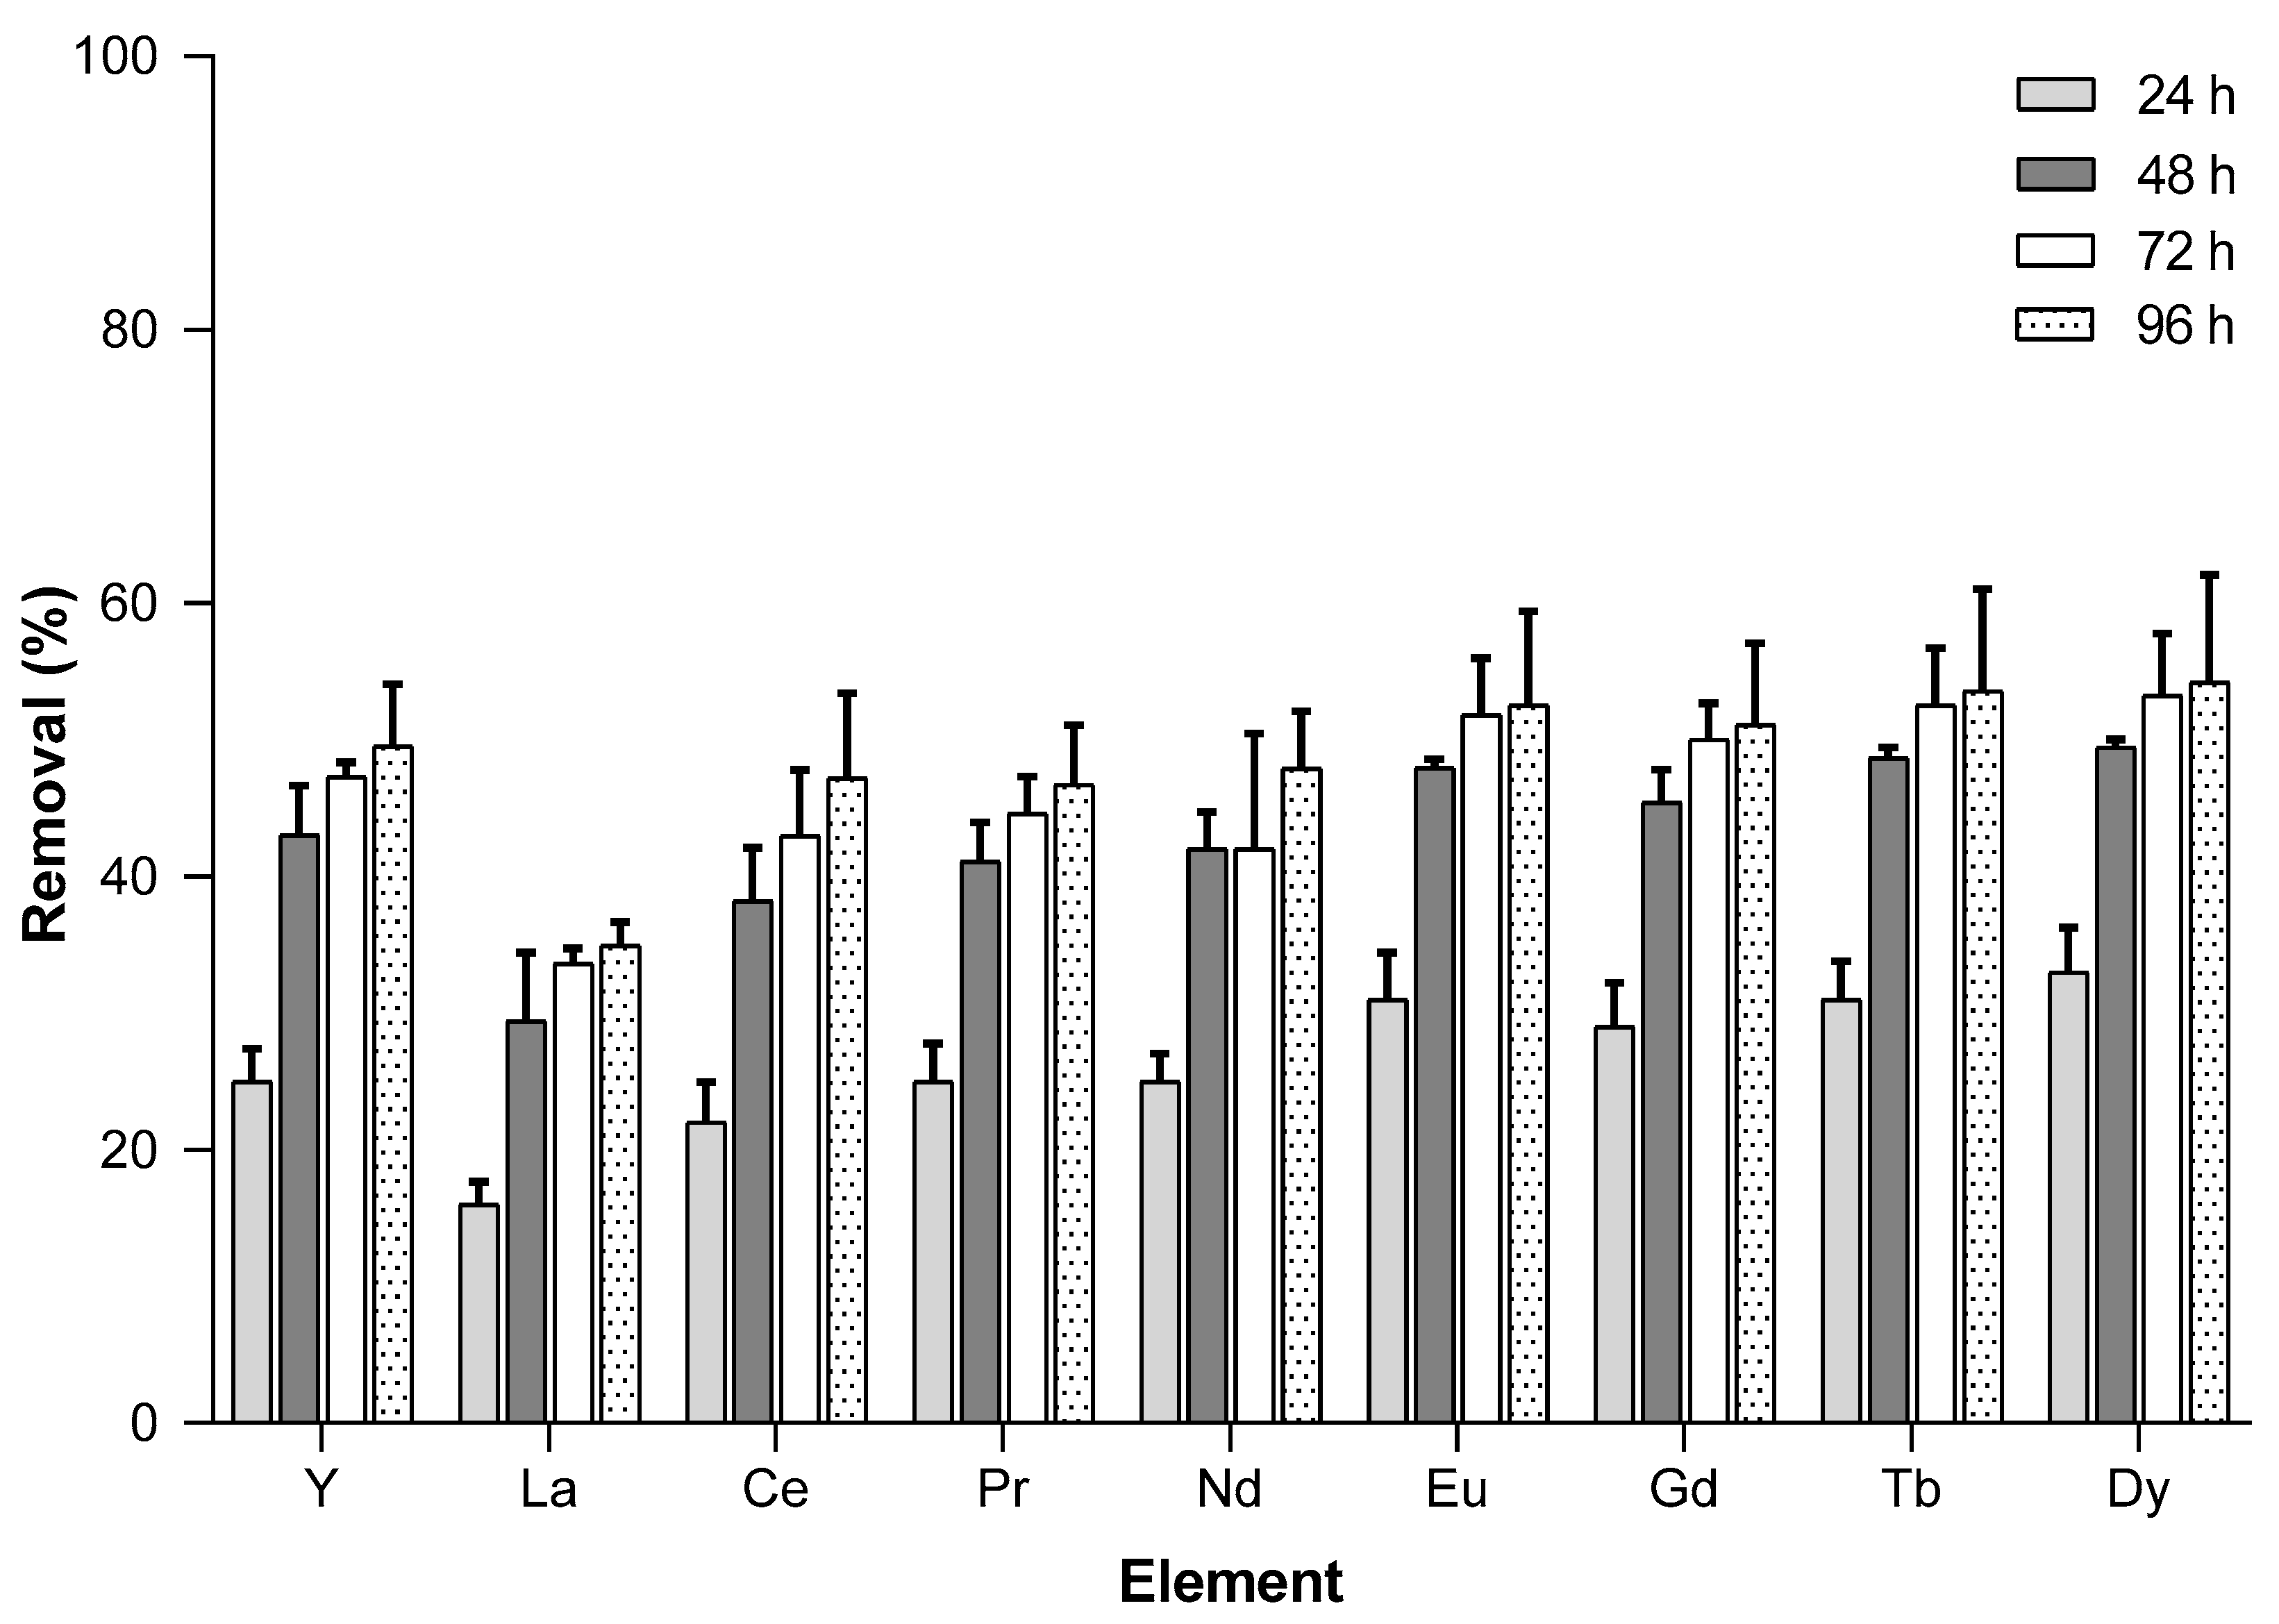
3.2. Time Exposure Impact

Assessing the efficacy of the sorption process primarily depends on the contact time between the biosorbent and the REEs-enriched solution. Decreasing the contact time can be beneficial for practical industrial purposes, as it can potentially reduce cost [43]. The selection of the contact time depends on the main objective of the application. Non-parametric statistical tests (Friedman test with Dunn’s multiple comparisons test) indicated that, for all REEs, except Ce and Nd, time extensions from 24 h to 48 h were significant for the removal efficiencies (p-values < 0.05) (Table 4). Time extension from 24 h to 72 or 96 h was also significant for all REEs removal (p-values < 0.05). Extending the contact time from 48 h to 72 h was not significant for the removal response.
Based on these results, 48 h appears to be the maximum contact time, as further contact times showed no significant differences in the removal (%) of the elements.

3.3. Response Surface Models and Statistical Analysis

To evaluate which factors (linear, quadratic, and interaction) significantly influenced the removal of REEs by hazelnut shells, ANOVA (p-values < 0.05) was used (Table 5). The values in underlined red color correspond to a negative impact, meaning that the response (removal (%)) will decrease if that factor increases. The values in a bold green color correspond to a positive impact, meaning that if the factor increases, the removal (%) also increases. The black values represent factors that are not significant (p-value ≥ 0.05).
It is possible to observe that the most significant factor is salinity with a negative impact, which means that, when salinity increases, the removal percentage (%) of REEs decreases. The second most significant factor is pH with a positive impact; thus, when pH increases, the removal percentage (%) increases as well. The hazelnut shell mass is the least significant factor among the three studied, but when significant, it has a positive impact.
Before the application of any sorbent in the real world, it is necessary to evaluate its performance in complex mixtures and scenarios with different salinity, pH, and temperature (key parameters that influence the sorbent’s efficiency). Salinity is an interesting parameter since it can decrease the electrostatic forces between sorbent and sorbate due to competition among cations present in the solution [44]. This factor could explain the decrease in the removal percentage (%) observed in the present study, when salinity was at the highest value (salinity 30) compared to ultrapure water (salinity 0). The abundance of cations such as Ca2+, Mg2+, and Na+ may inhibit metal’s sorption [32].
The relationship between independent variables and the response was drawn by second-order polynomial equations. For a robust model, only variables with p-values < 0.05 (Table 6) were considered in the reduced model. The validity of the model fit is verified with the closeness between the coefficient of determination (R2) and the adjusted coefficient of determination (adjusted R2); this closeness should be less than 0.2, which was the case in all cases examined in this work.

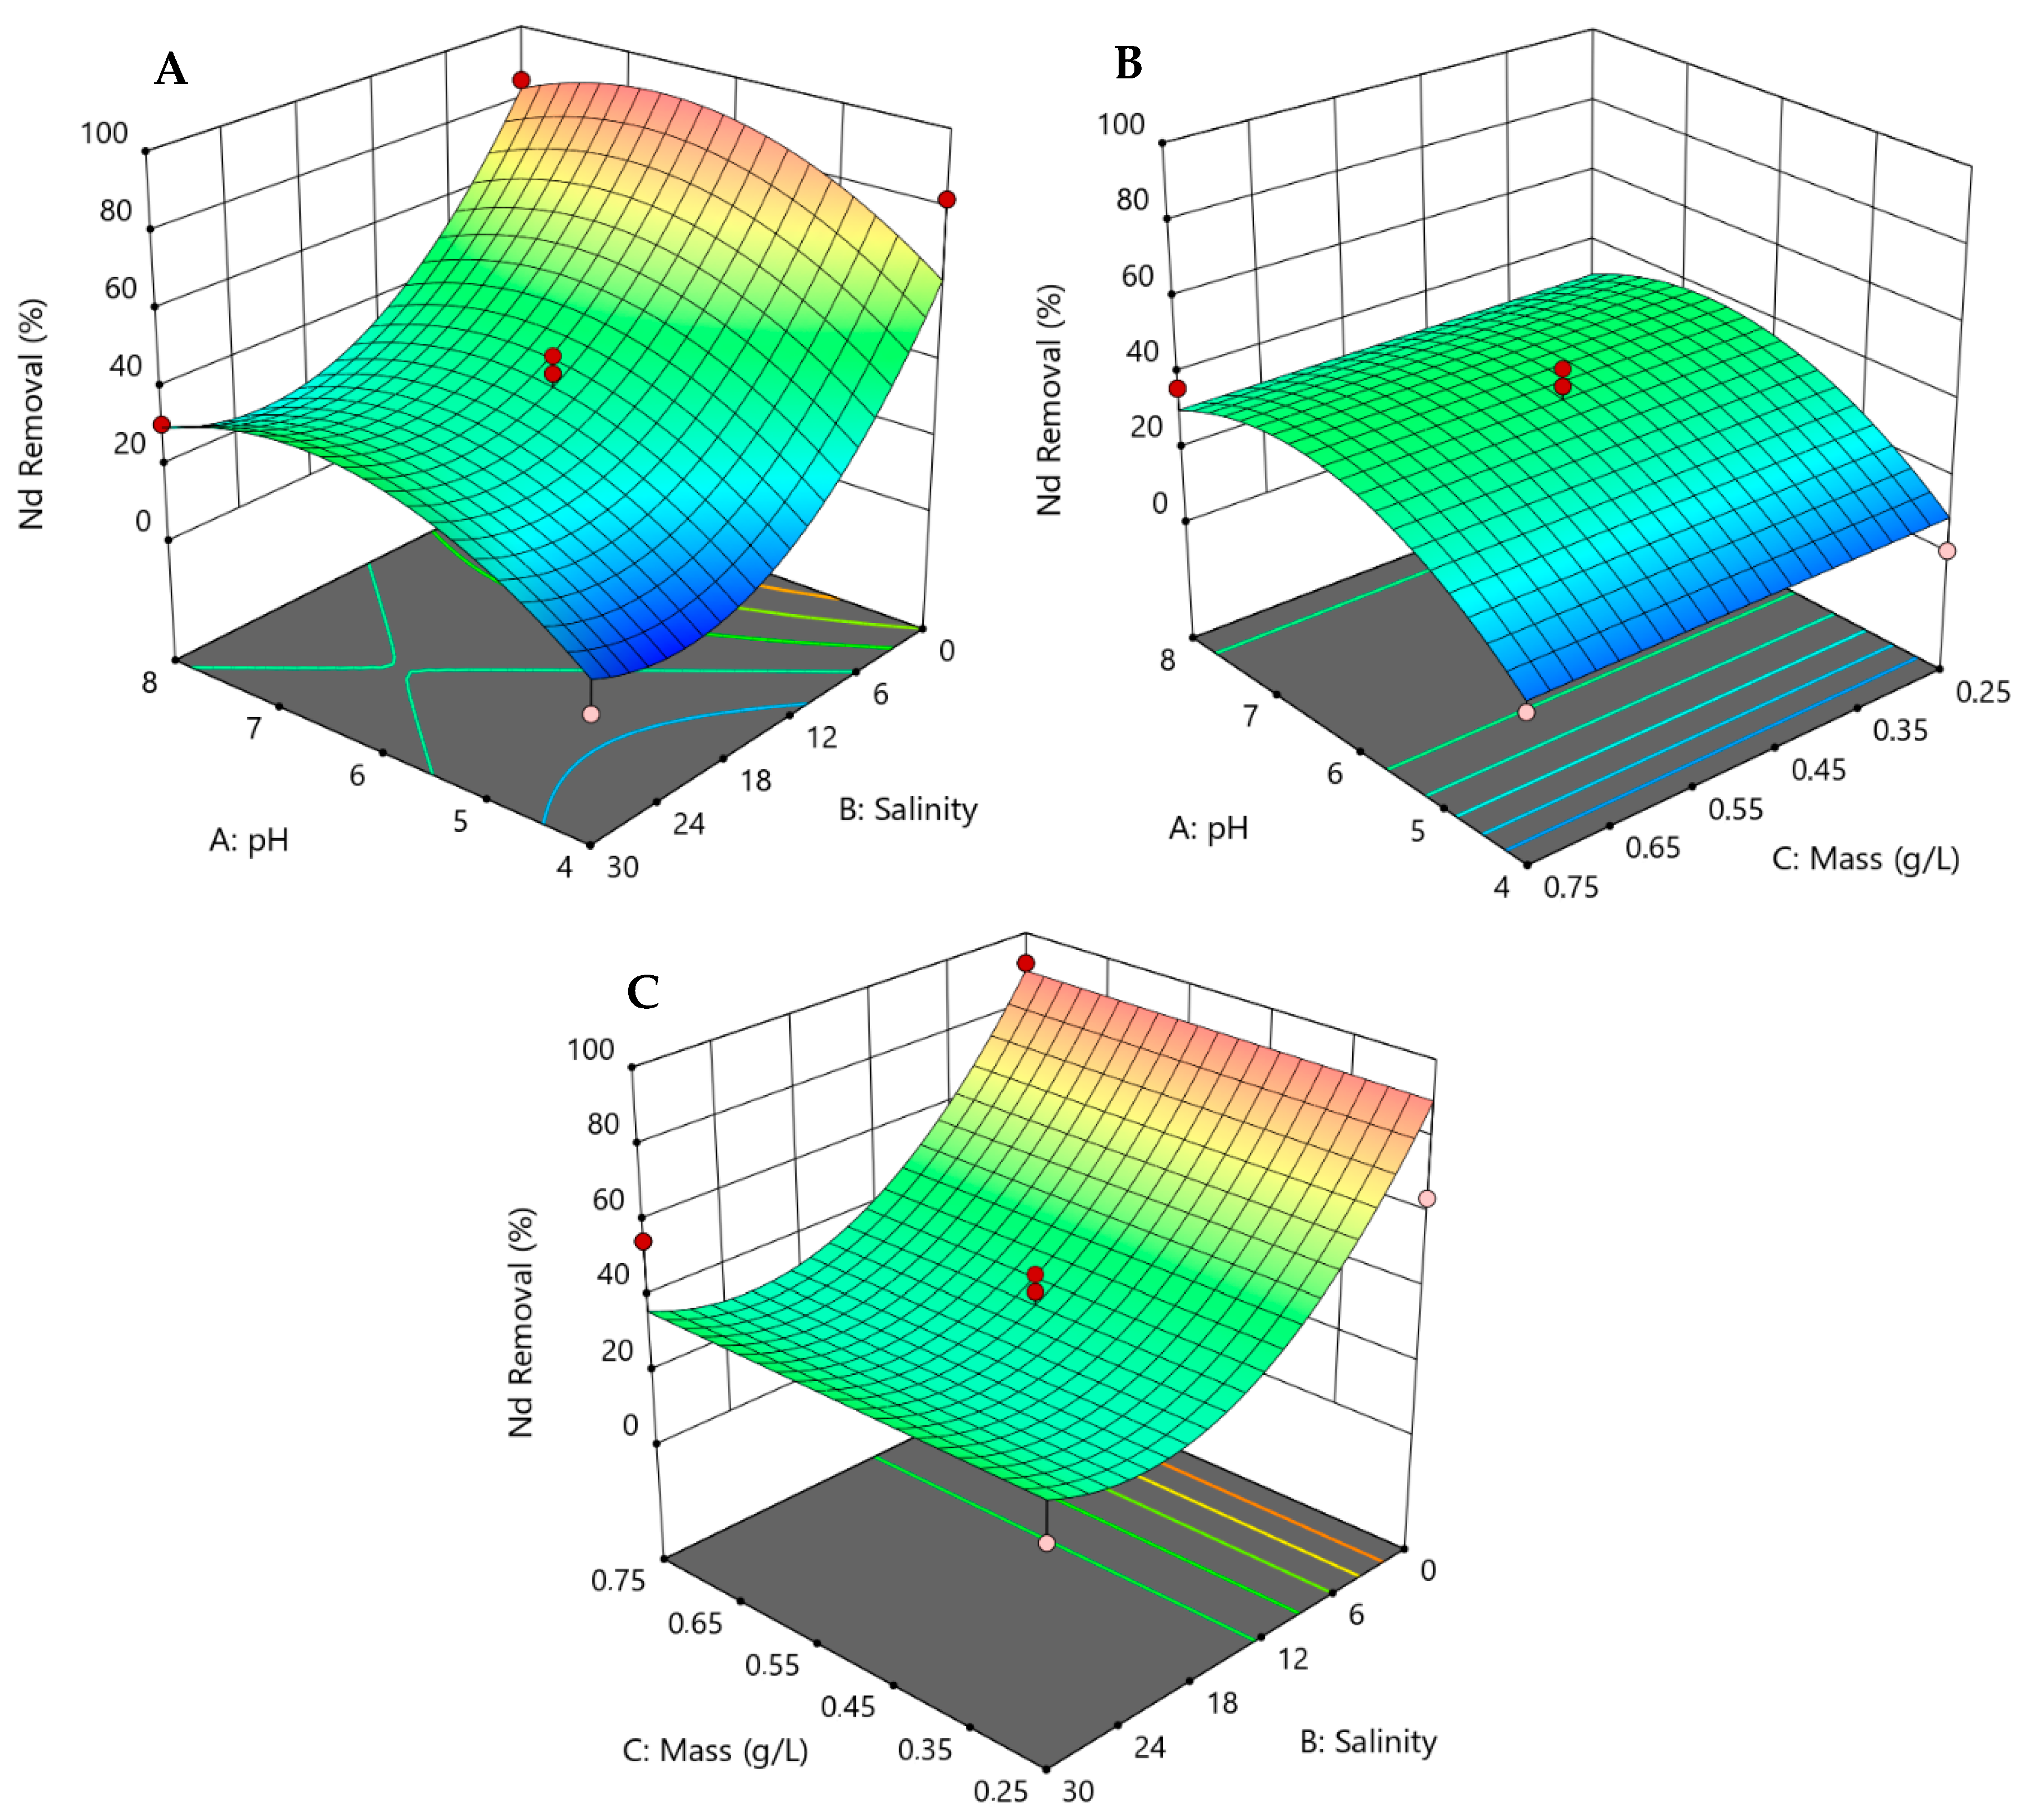
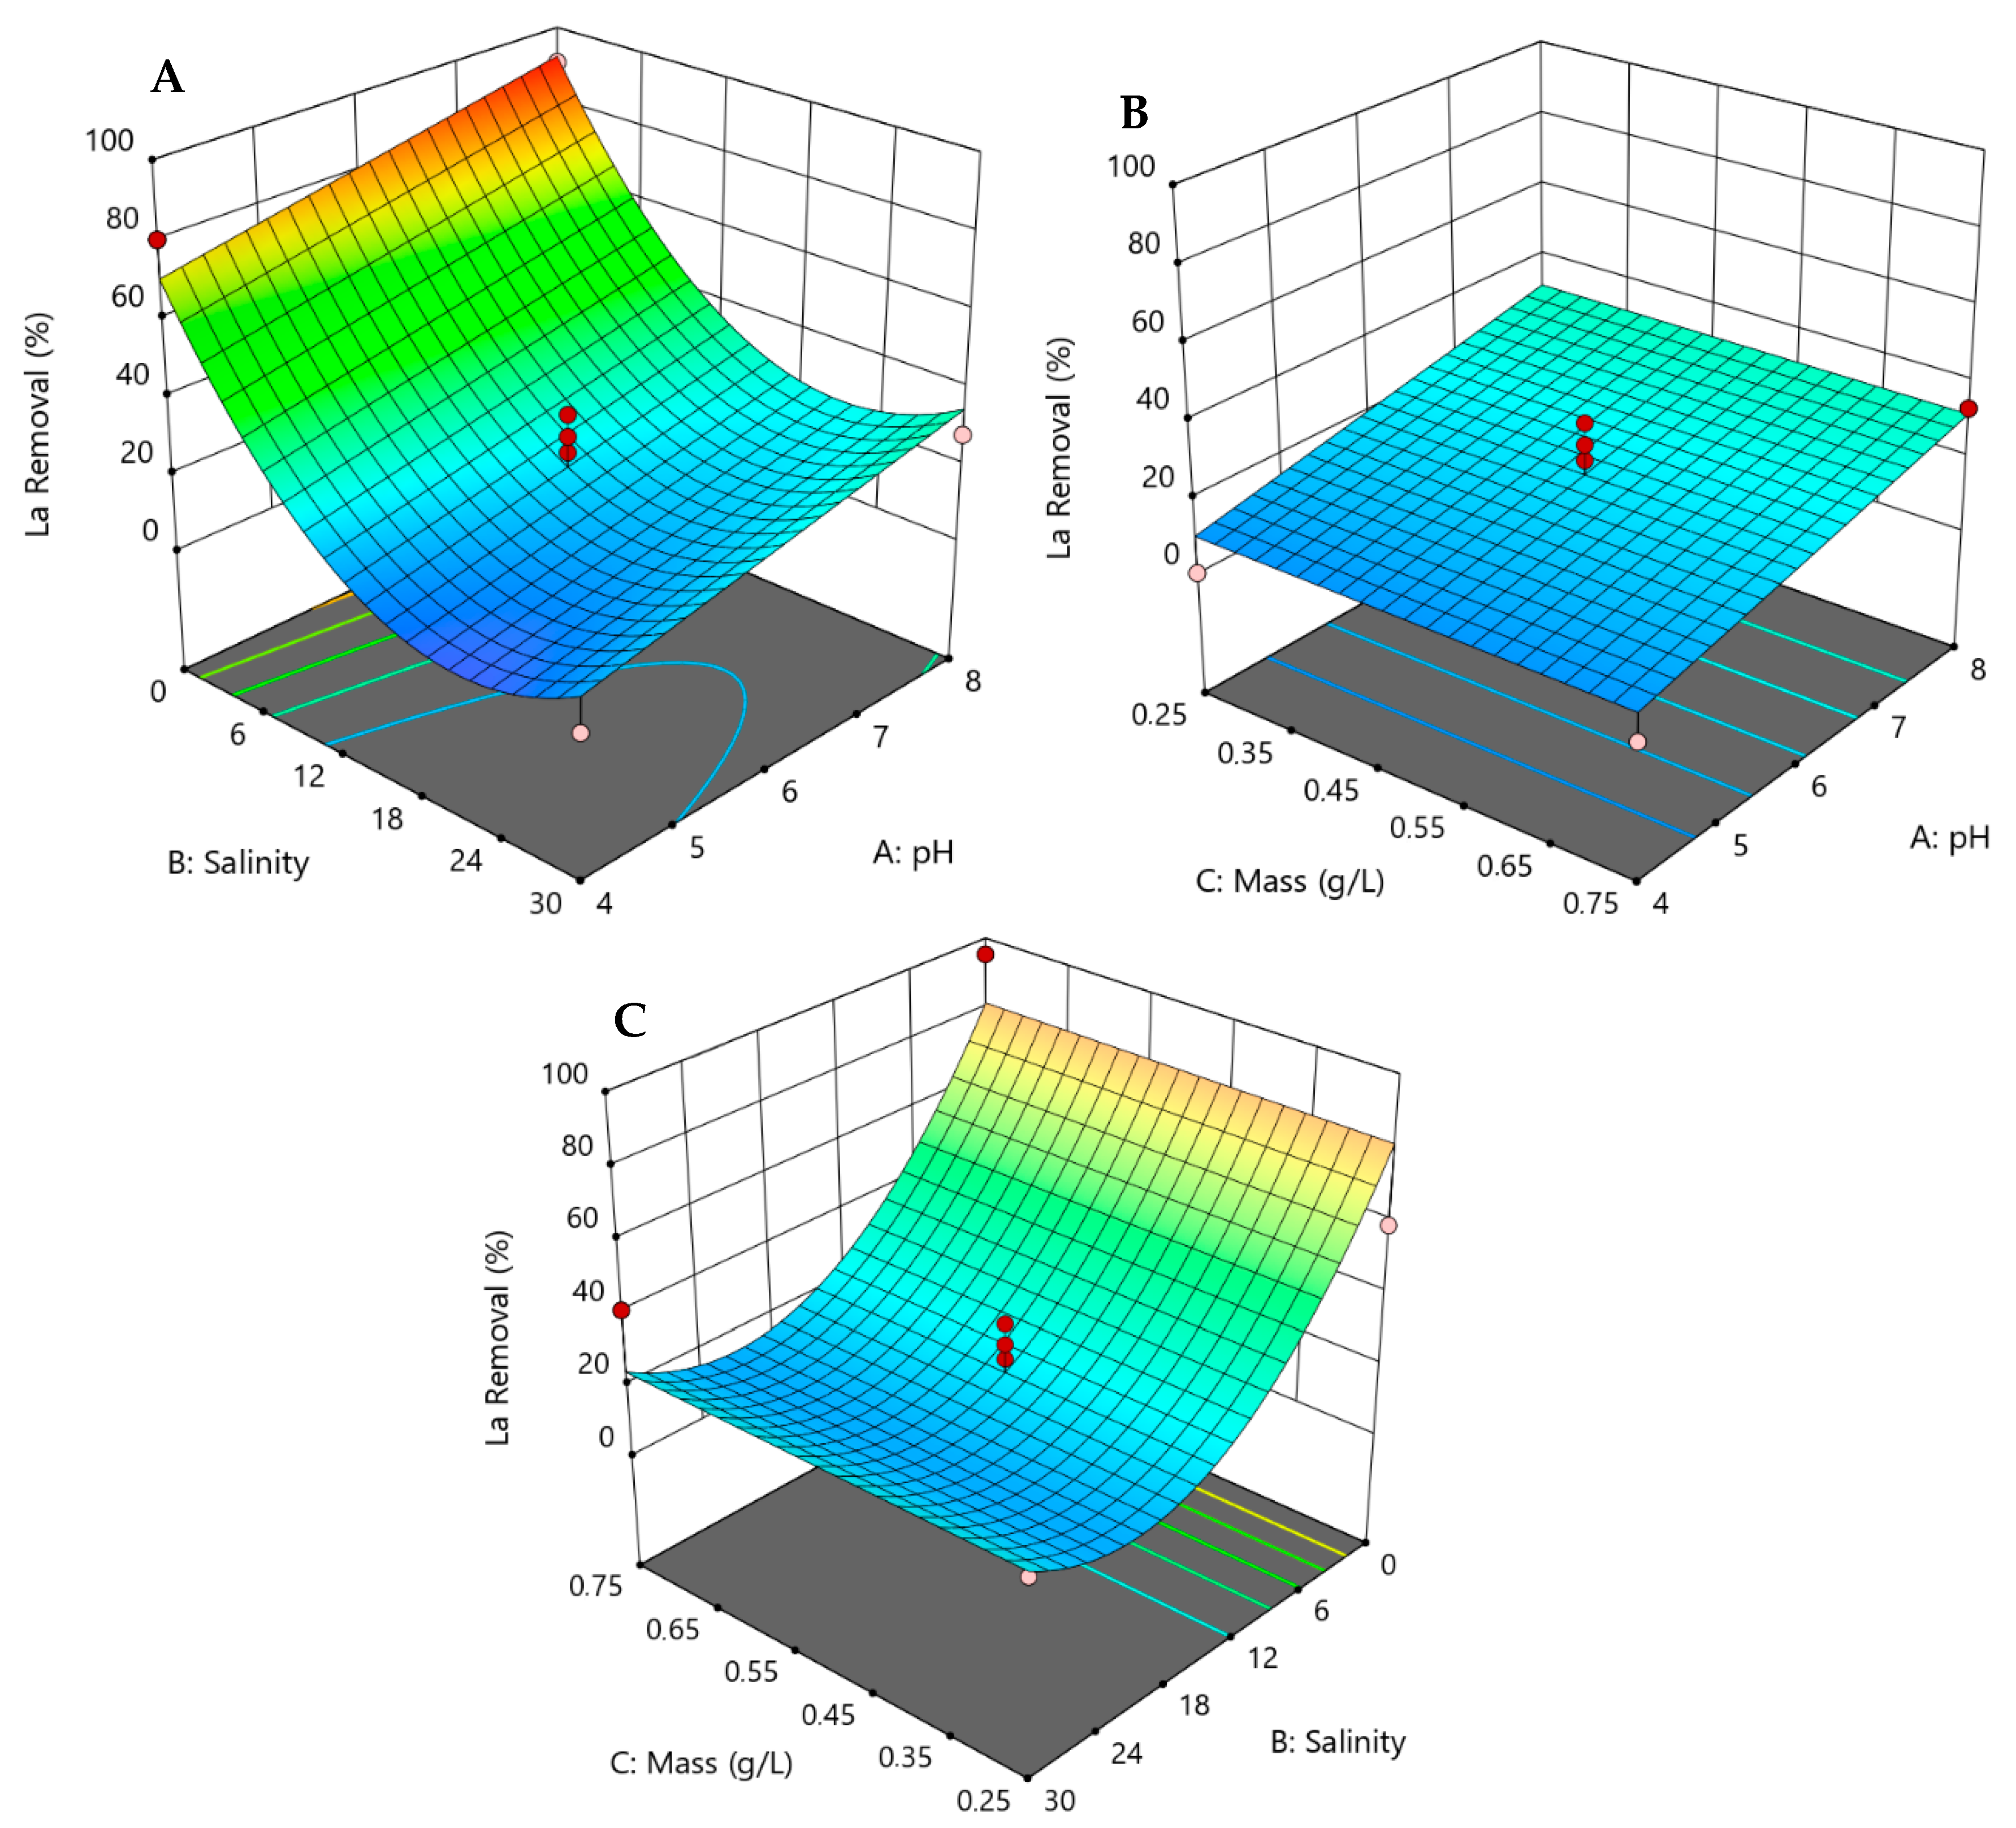
3.4. 3D Responses for the Removal of REEs by Hazelnut Shells

For easy visual understanding of the interactions of the three factors on the response (removal (%)) of REEs by the hazelnut shells, 3D response surface plots based on the second-order polynomial equations presented in Table 6 were created.
Figure 2, Figure 3 and Figure 4 show the 3D response surfaces for the removal of REEs obtained by plotting two factors and keeping one factor constant. Figure 2A, Figure 3A and Figure 4A show the interactive effects of pH and salinity on the removal of Nd, La, and Y, respectively, while keeping the biosorbent dose constant (0.50 g/L). The fixation of the biosorbent dose is related to the statistical analysis (not significant, p-value ≥ 0.05) for some of the models that describe the removal. For Nd, it can be seen that, for 48 h (Figure 2A), the decrease in salinity has a positive impact on the removal process. Regarding pH factor, it is possible to see that the central value (pH 6) gives the highest response when combined with the lower salinity. Most of the REEs studied in this work had 3D surfaces similar to the ones presented for Nd. For La (Figure 3A), higher removal (%) is obtained with higher values of pH and when in contact with lower salinities. Yttrium (Figure 4A) shows a similar behavior to La; however, for the highest salinity value (salinity 30), the removal (%) along the studied pH varied less than 20%. For Y, the behavior was different. For the highest salinity (30), the removal (%) along the studied pH range varied from 0 to 40% (the removal will be higher for higher pH values). The same is observed when the pH is constant at 4; the removal (%) along the studied salinity range varied from 0 to 60%. The highest removal occurs at the lowest salinity, aligned with the highest pH value.
The interactive effects of pH and biosorbent dose on the removal of Nd, La, and Y, while keeping the salinity constant (salinity 15), can be seen in Figure 2B, Figure 3B, and Figure 4B, respectively. The 3D surface of Nd (Figure 2B) shows that, only for pH levels between 5 and 7, in all mass ranges studied, the removal (%) is higher (near 40%). For La (Figure 3B), the 3D surface also shows that biosorbent dose does not have significant influence on the response, since the removal (%) is enhanced when the pH increases, independently of the mass used. Yttrium (Figure 4B) shows the positive effect on removal efficiency when increasing both biosorbent dose and pH, where the removal response increases from 0 to almost 60%.
Figure 2C, Figure 3C and Figure 4C show the interactive effects of biosorbent dose and salinity on the removal of Nd, La, and Y, respectively, while the pH is fixed at the central point (pH 6). Neodymium and La have similar 3D surfaces, where it is possible to observe that the biosorbent dose has no significant influence on the response (removal (%)). On the other hand, the decrease in salinity (from 30 to 0) increases the removal response by three to four times. The 3D surface for Y shows a minor influence of the biosorbent dose, where the response increases c.a. 20%.

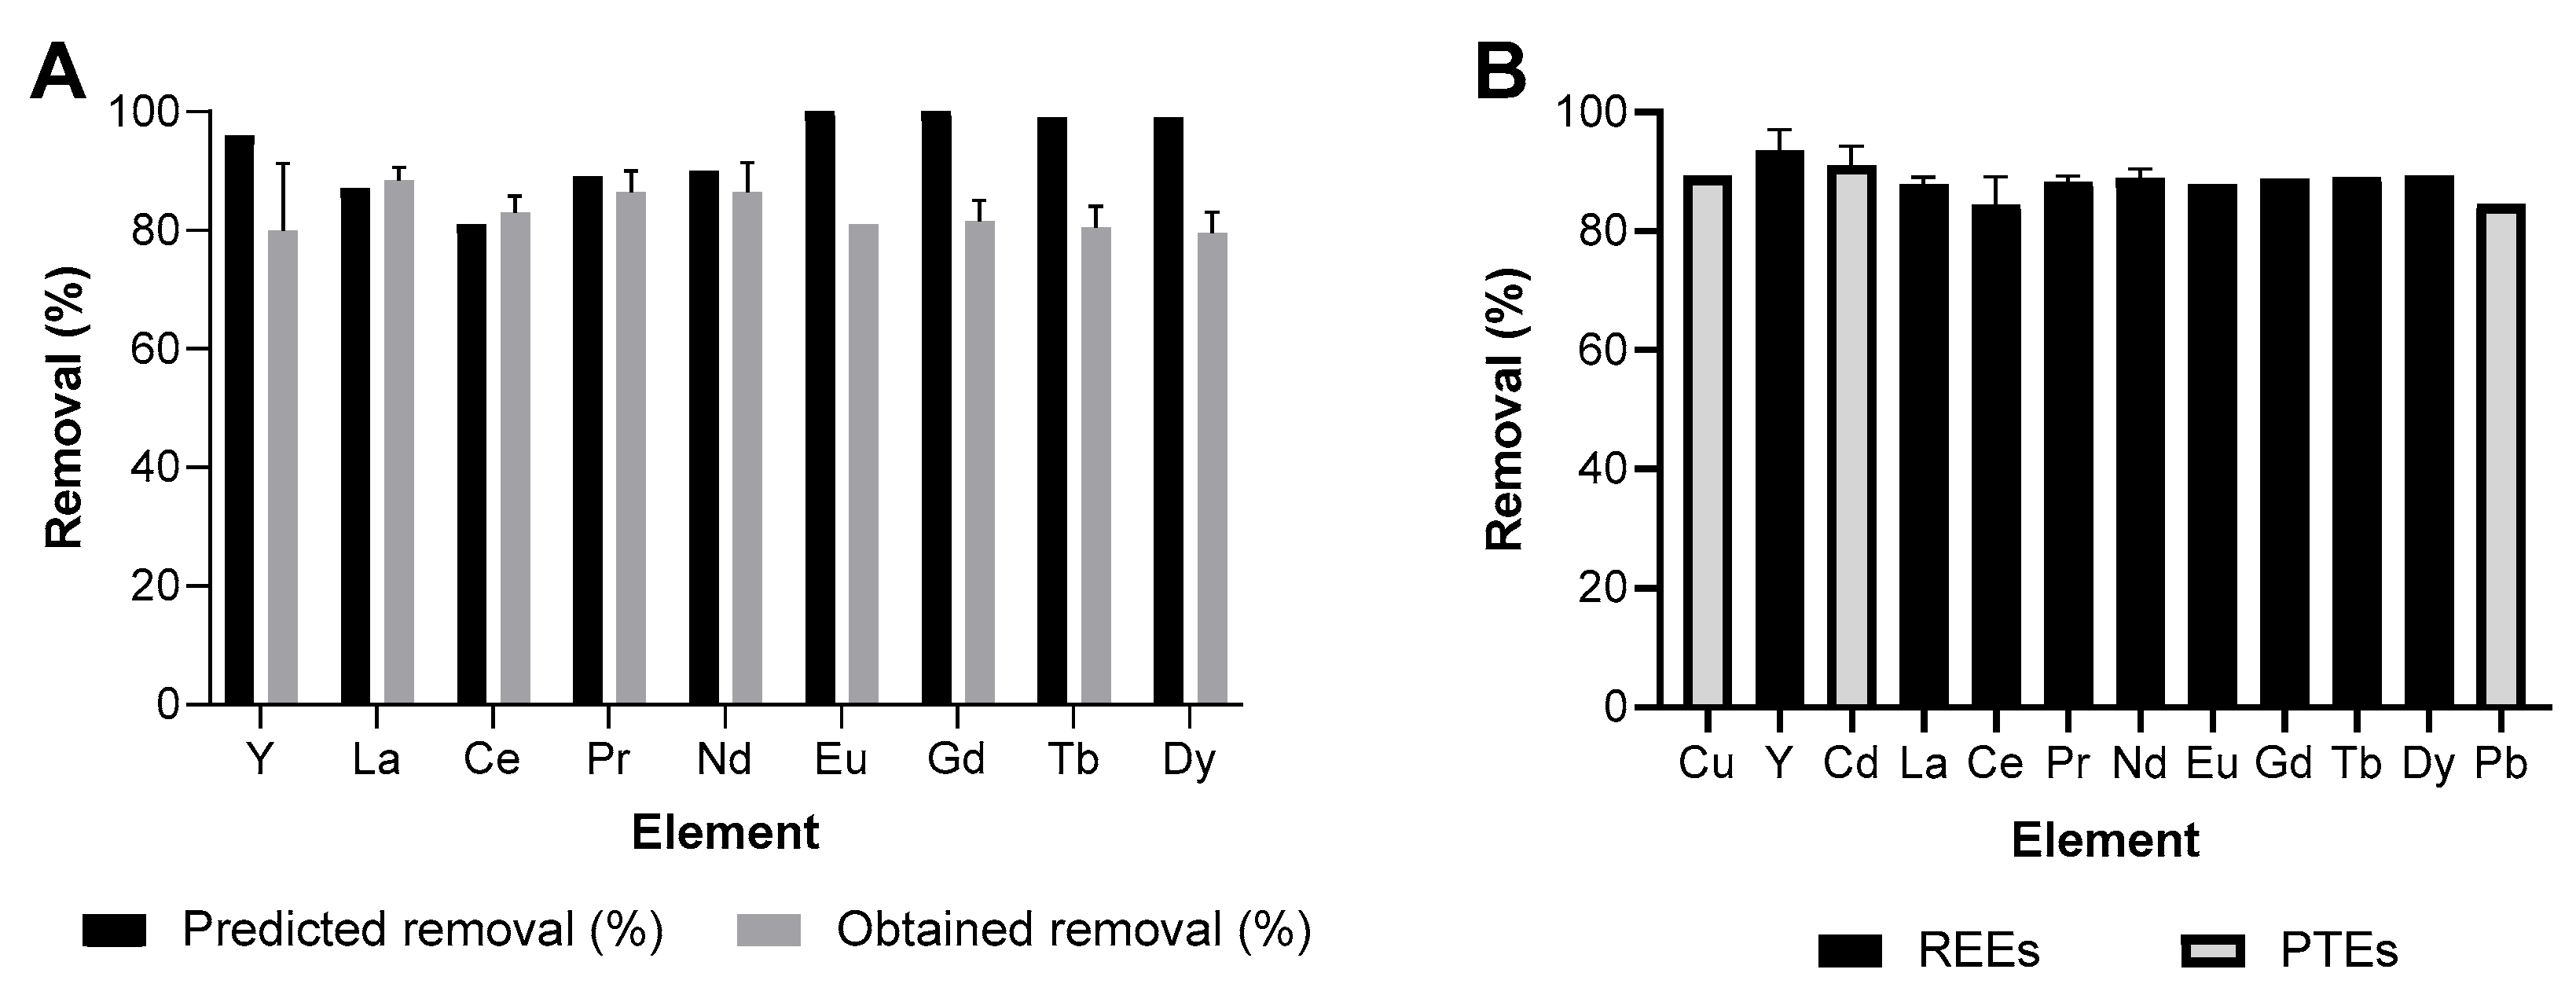
3.5. Optimization of Operational Parameters Affecting REEs Removal by Response Surface Methodology

Optimization studies on the use of biosorbents to remove some REEs, such as Pr, La, and Ce have been reported in the literature using crab shells and orange peels [45] and brown alga C. indica by CS2 [46], in which the response studied was the uptake by those biosorbents. The DoE helped localize the levels of the factors that contributed to the maximum Pr biosorption of 57.8 mg/g for crab shells (pH = 5.0, biomass dose = 2.5 g/L, initial Pr concentration = 250 mg/L, temperature = 50 °C, contact time = 35 min) and 49.9 mg/g for orange peels (pH 5.0, biomass dose = 2.0 g/L, initial Pr concentration = 200 mg/L, temperature = 50 °C, contact time = 50 min). For C. indica, maximum La biosorption of 179 mg/g was obtained at the following levels: pH 5.2, biomass dose = 0.5 g/L, initial La concentration = 250 mg/L, temperature = 55 °C; for Ce, the conditions were pH 5.0, biomass dose = 0.7 g/L, initial Ce concentration = 227 mg/L, and temperature = 55 °C, with a maximum biosorption of 168 mg/g. To the best of our knowledge, no optimization study was carried out with hazelnut shells.
The values of the optimized variables for the removal of REEs by hazelnut shells are presented in Table 7. Not surprisingly, since these elements have similar chemical properties, the conditions that maximize removal are the same for all REEs (pH 7.0, salinity 0, and biosorbent dose of 0.75 g/L). With these experimental conditions, it was possible to reach virtually 100% removal of Gd and Eu and more than 80% of the remaining REEs. These efficiencies are higher than those reported by Fabre et al. (2021) [47] on the removal of Nd by marine macroalgae (71 and 77% with Ulva sp. and Gracilaria sp., respectively, at 72 h) and by Ferreira et al. [43] on the removal of Dy by the same macroalgae (59 and 83% for Ulva sp. and Gracilaria sp., respectively, at 96 h). Raji et al. (2018) [48] also reported a removal efficiency of 99% for Dy using multi-walled carbon nanotube (MWCNT), but in a mono-elementary solution. In this sense, the results of the present study highlight the use of hazelnut shells as a great option to remove REEs from contaminated solutions.
After the water treatment process, it is important to recover the REEs from the enriched hazelnut shells, which can be performed using diluted acid solutions or by calcining the biomass [49]. In this sense, it is also of interest to optimize the concentration of REEs in the biosorbent (uptake). Table 7 shows that, by using the best removal conditions, the highest uptake was verified for Dy (0.22 mg/g), with a total accumulation of REEs of 1.52 mg/g. By optimizing the uptake (pH 7.0, salinity 0, and biosorbent dose of 0.25 g/L), it is possible to obtain a total accumulation of REEs of 2.69 mg/g (highest value for Gd, 0.38 mg/g). This REEs content in hazelnut shells is higher than those in common ores [50], showing that it may be a secondary source of these elements, which are currently classified as critical raw materials.

3.6. Hazelnut Shell Removal of Rare Earth Elements Under Optimal Operational Conditions in Presence and Absence of Potentially Toxic Elements

To validate the optimal conditions predicted by the models (Table 7), the removal of REEs was experimentally evaluated using those optimal operating conditions. Overall, the removal performance showed a good agreement between the predicted and obtained values, with some variation observed for the medium and heavy REEs (Eu, Gd, Tb, and Dy (Figure 5A)).
The effect of competing ions on the removal of REEs was also evaluated using the same optimal operating conditions. The results showed no loss of efficiency for REEs removal when in a more complex solution in the presence of potentially toxic elements (PTEs). Yet, no selectivity was observed, as the hazelnut shell was able to remove 89% of Cu, 93% of Cd, and 84% of Pb (Figure 5B).
In comparison with the literature, few studies have evaluated the capacity of hazelnut shells or any nutshell to remove REEs with or without competing ions (Supplementary Material Table S2). Some studies evaluated the removal of PTEs in mono- and multi-element solutions [51,52], yet with no selectivity observed.
As global nut production continues to grow, the associated generation of nutshell waste correspondingly increases. More than 1195 t of hazelnut shells are produced annually [53]. These results show the importance of studying the capacity of agricultural food to reduce waste disposal and add value to nutshells.

3.7. Hazelnut Shell Characterization

FTIR spectroscopy was used to identify the main functional groups present on the hazelnut shells’ surface before and after exposure to REEs solutions and REEs + PTEs solution (Figure 6A). The hazelnut shells showed common peaks associated with the main polymers present in most nutshells, which are cellulose, hemicellulose, and lignin [53]. The broad absorption band observed between 3000 and 3500 cm−1 corresponds to the O–H stretching vibrations, indicative of hydroxyl groups present in lignin, cellulose, and hemicellulose [54]. The bands observed between 1020 and 1035 cm−1, along with the peak near 1370 cm−1, are associated with C–O stretching vibrations of alcohols, carboxylic acids, and esters, as well as C–H bending of alkenes, respectively, which are functional groups typically found in cellulose and hemicellulose [55]. The peak around 1735 cm−1 is attributed to the stretching vibrations of C=O bonds present in the acetyl and ester groups of hemicellulose and lignin [55]. A characteristic absorption band at 1607 cm−1 corresponds to the C=C stretching vibrations of aromatic rings, which is a distinctive feature of the structure of lignin [55]. Moreover, there is a noticeable decrease in the sharpness of the peaks near 2850 cm−1 after exposure, which can be attributed to CH and CH2 stretching vibrations of methyl and methylene groups [54].
SEM images were obtained at the same scale (Figure 6B–D), allowing the comparison of surface structures in the hazelnut shells before and after exposure. The surface of hazelnut shells exhibited a pronounced porous structure. The exposure to REEs and REEs + PTEs did not lead to any morphological alterations.

4. Conclusions

The present study proposed the valorization of food waste, generated in large quantities every year, as a biosorbent to decontaminate water and allow the recovery of elements of interest such as REEs. Results demonstrated the high capability of hazelnut shells in removing REEs from multi-contaminated solutions. Response surface methodology allied with the Box–Behnken design selected for the present study allowed the identification of the factors that are significant and that most contribute to removal efficiency. Optimized conditions predicted by the developed model equations allow for removal efficiencies between 80% and 100%, which is very promising from the perspective of industrial application. Water salinity was the factor with the greatest impact on removal, with higher salinities decreasing removal (%). In the opposite direction, the biosorbent dose was the factor with the lowest significance. The factors evaluated in this work are common to biosorption studies and are easy to control. The large range of conditions considered here provides a better understanding of the expected results, allowing for reduced periods of time and lower resource demand for experimental trials. The sorption capacity of hazelnut shells did not decrease in the presence of PTEs. This work highlights the importance of the study of agricultural waste as a sorbent to reduce residues of the agricultural industry, promoting the removal and recovery of technologically critical elements, aiming at a circular economic process.

Supplementary Materials

The following supporting information can be downloaded at: https://www.mdpi.com/article/10.3390/met15080842/s1, Table S1: Elemental composition of seawater; Table S2: Comparison of nutshell for potentially toxic elements and rare earth elements recovery. References [32,40,42,51,52,56,57,58,59] are cited in the supplementary materials.

Author Contributions

Conceptualization, E.P. and B.H.; methodology, E.P., D.S.T. and B.H.; validation, N.F., D.S.T., T.V., J.J., T.S.C.S. and B.H.; formal analysis, D.S.T., I.B., T.V., J.J., T.S.C.S. and B.H.; investigation, N.F., J.J., D.S.T. and I.B.; writing—original draft preparation, N.F., D.S.T. and B.H.; writing—review and editing, N.F., T.V., D.S.T. and B.H.; supervision, E.P., D.S.T. and B.H.; project administration, E.P. and B.H.; funding acquisition, E.P. and B.H. All authors have read and agreed to the published version of the manuscript.

Funding

This work received financial support from the European Union (FEDER funds through the Operational Competitiveness Program (COMPETE2020) and from PT national funds (FCT/MCTES, Fundação para a Ciência e Tecnologia and Ministério da Ciência, Tecnologia e Ensino Superior) through the projects UID/50006—Laboratório Associado para a Química Verde—Tecnologias e Processos Limpos.

Data Availability Statement

The original contributions presented in this study are included in the article/Supplementary Material. Further inquiries can be directed to the corresponding authors.

Acknowledgments

Nicole Ferreira, Thainara Viana, and Jéssica Jacinto acknowledge FCT/MCTES (Fundação para a Ciência e Tecnologia and Ministério da Ciência, Tecnologia e Ensino Superior) and ESF (European Social Fund) through NORTE 2020 (Programa Operacional Região Norte) for their PhD grant ref. 2022.13017.BD (https://doi.org/10.54499/2022.13017.BD), 2022.13015.BD (https://doi.org/10.54499/2022.13015.BD), and UI/BD/151290/2021, respectively.

Conflicts of Interest

The authors declare that they have no conflicts of interest.

References

  1. Blanco, M.; Monteserín, C.; Angulo, A.; Pérez-Márquez, A.; Maudes, J.; Murillo, N.; Aranzabe, E.; Ruiz-Rubio, L.; Vilas, J.L. TiO2-Doped Electrospun Nanofibrous Membrane for Photocatalytic Water Treatment. Polymers 2019, 11, 747. [Google Scholar] [CrossRef]
  2. Tsani, S.; Koundouri, P.; Akinsete, E. Resource management and sustainable development: A review of the European water policies in accordance with the United Nations’ Sustainable Development Goals. Environ. Sci. Policy 2020, 114, 570–579. [Google Scholar] [CrossRef]
  3. UNESCO. The United Nations World Water Development Report 2024—Water for Prosperity and Development; UNESCO: Paris, France, 2024. [Google Scholar] [CrossRef]
  4. UNESCO. The United Nations World Water Development Report 2023: Partnerships and Cooperation for Water; UNESCO: Paris, France, 2023. [Google Scholar]
  5. Tiwari, J.; Ankit; Sweta; Kumar, S.; Korstad, J.; Bauddh, K. Ecorestoration of Polluted Aquatic Ecosystems Through Rhizofiltration. In Phytomanagement of Polluted Sites; Elsevier: Amsterdam, The Netherlands, 2019; pp. 179–201. [Google Scholar] [CrossRef]
  6. Sarkar, S.; Gill, S.S.; Das Gupta, G.; Kumar Verma, S. Water toxicants: A comprehension on their health concerns, detection, and remediation. Environ. Sci. Pollut. Res. 2022, 29, 53934–53953. [Google Scholar] [CrossRef]
  7. Baldé, A.C.P.; Kuehr, R.; Yamamoto, T.; Mcdonald, R.; Angelo, E.D.; Althaf, S.; Bel, G.; Deubzer, O.; Fernandez-cubillo, E.; Forti, V.; et al. Global E-Waste Monitor 2024; Geneva/Bonn: Brisbane, QLD, Australia, 2024; Available online: https://ewastemonitor.info/wp-content/uploads/2024/12/GEM_2024_EN_11_NOV-web.pdf (accessed on 23 July 2025).
  8. Xavier, L.H.; Giese, E.C.; Ribeiro-Duthie, A.C.; Lins, F.A.F. Sustainability and the circular economy: A theoretical approach focused on e-waste urban mining. Resour. Policy 2021, 74, 101467. [Google Scholar] [CrossRef]
  9. The E-Waste Coalition. A New Circular Vision for Electronics Time for a Global Reboot; The E-Waste Coalition: East Falmouth, MA, USA, 2019; Available online: www.weforum.org (accessed on 1 February 2025).
  10. Chakraborty, S.C.; Qamruzzaman, M.; Zaman, M.W.U.; Alam, M.M.; Hossain, M.D.; Pramanik, B.K.; Nguyen, L.N.; Nghiem, L.D.; Ahmed, M.F.; Zhou, J.L.; et al. Metals in e-waste: Occurrence, fate, impacts and remediation technologies. Process Saf. Environ. Prot. 2022, 162, 230–252. [Google Scholar] [CrossRef]
  11. European Commission. Study on the Critical Raw Materials for the EU; European Commission: Brussels, Belgium, 2023. [Google Scholar] [CrossRef]
  12. European Commission. Critical Raw Materials for the EU, Report of the Ad-Hoc Working Group on Defining Critical Raw Materials; European Commission: Brussels, Belgium, 2010. [Google Scholar]
  13. Wall, F. Rare Earth Elements. In Encyclopedia of Geology; Elsevier: Amsterdam, The Netherlands, 2021; pp. 680–693. [Google Scholar] [CrossRef]
  14. Dagwar, P.P.; Iqbal, S.S.; Dutta, D. Sustainable recovery of rare Earth elements from industrial waste: A path to circular economy and environmental health. Waste Manag. Bull. 2025, 3, 373–390. [Google Scholar] [CrossRef]
  15. Mudali, U.K.; Patil, M.; Saravanabhavan, R.; Saraswat, V.K. Review on E-waste Recycling: Part II—Technologies for Recovery of Rare Earth Metals. Trans. Indian Natl. Acad. Eng. 2021, 6, 613–631. [Google Scholar] [CrossRef]
  16. Rautela, R.; Arya, S.; Vishwakarma, S.; Lee, J.; Kim, K.-H.; Kumar, S. E-waste management and its effects on the environment and human health. Sci. Total Environ. 2021, 773, 145623. [Google Scholar] [CrossRef] [PubMed]
  17. El Ouardi, Y.; Virolainen, S.; Massima Mouele, E.S.; Laatikainen, M.; Repo, E.; Laatikainen, K. The recent progress of ion exchange for the separation of rare earths from secondary resources—A review. Hydrometallurgy 2023, 218, 106047. [Google Scholar] [CrossRef]
  18. Patil, A.B.; Struis, R.P.W.J.; Ludwig, C. Opportunities in Critical Rare Earth Metal Recycling Value Chains for Economic Growth with Sustainable Technological Innovations. Circ. Econ. Sustain. 2022, 3, 1127–1140. [Google Scholar] [CrossRef]
  19. Binnemans, K.; Jones, P.T.; Blanpain, B.; Van Gerven, T.; Yang, Y.; Walton, A.; Buchert, M. Recycling of rare earths: A critical review. J. Clean. Prod. 2013, 51, 1–22. [Google Scholar] [CrossRef]
  20. Anupan, A.; Imyim, A.; Fuangswasdi, S. Selective separation of neodymium(III) using dual function DEHPA-menthol deep eutectic solvent. J. Mol. Liq. 2025, 432, 127760. [Google Scholar] [CrossRef]
  21. Yurramendi, L.; Gijsemans, L.; Forte, F.; Aldana, J.L.; del Río, C.; Binnemans, K. Enhancing rare-earth recovery from lamp phosphor waste. Hydrometallurgy 2019, 187, 38–44. [Google Scholar] [CrossRef]
  22. Silva, R.G.; Morais, C.A.; Oliveira, É.D. Selective precipitation of rare earth from non-purified and purified sulfate liquors using sodium sulfate and disodium hydrogen phosphate. Miner. Eng. 2019, 134, 402–416. [Google Scholar] [CrossRef]
  23. Thakkar, J.; Wissler, B.; Dudenas, N.; Yin, X.; Vailhe, M.; Bricker, J.; Zhang, X. Recovery of Critical Rare-Earth Elements Using ETS-10 Titanosilicate. Ind. Eng. Chem. Res. 2019, 58, 11121–11126. [Google Scholar] [CrossRef]
  24. Giese, E.C. Biosorption as green technology for the recovery and separation of rare earth elements. World J. Microbiol. Biotechnol. 2020, 36, 52. [Google Scholar] [CrossRef]
  25. Beni, A.A.; Esmaeili, A. Biosorption, an efficient method for removing heavy metals from industrial effluents: A Review. Environ. Technol. Innov. 2020, 17, 100503. [Google Scholar] [CrossRef]
  26. Devi, A.P.; Mishra, P.M. Biosorption of dysprosium (III) using raw and surface-modified bark powder of Mangifera indica: Isotherm, kinetic and thermodynamic studies. Environ. Sci. Pollut. Res. 2019, 26, 6545–6556. [Google Scholar] [CrossRef] [PubMed]
  27. Swain, K.K.; Mishra, P.M.; Devi, A.P. Biosorption of praseodymium (III) using Terminalia arjuna bark powder in batch systems: Isotherm and kinetic studies. Water Sci. Technol. 2018, 77, 727–738. [Google Scholar] [CrossRef] [PubMed]
  28. Liu, L.; Rao, Y.; Tian, C.; Huang, T.; Lu, J.; Zhang, M.; Han, M. Adsorption Performance of La(III) and Y(III) on Orange Peel: Impact of Experimental Variables, Isotherms, and Kinetics. Adsorpt. Sci. Technol. 2021, 2021. [Google Scholar] [CrossRef]
  29. Yaashikaa, P.R.; Kumar, P.S.; Saravanan, A.; Vo, D.-V.N. Advances in biosorbents for removal of environmental pollutants: A review on pretreatment, removal mechanism and future outlook. J. Hazard. Mater. 2021, 420, 126596. [Google Scholar] [CrossRef] [PubMed]
  30. Shahbandeh, M. Nuts: Global Production 2023/24, Statista. 2025. Available online: https://www.statista.com/statistics/1030933/tree-nut-global-production/ (accessed on 23 May 2025).
  31. Khir, R.; Pan, Z. (Eds.) Walnuts. In Integrated Processing Technologies for Food and Agricultural By-Products; Elsevier: Amsterdam, The Netherlands, 2019; pp. 391–411. [Google Scholar] [CrossRef]
  32. Dias, M.; Pinto, J.; Henriques, B.; Figueira, P.; Fabre, E.; Tavares, D.; Vale, C.; Pereira, E. Nutshells as Efficient Biosorbents to Remove Cadmium, Lead, and Mercury from Contaminated Solutions. Int. J. Environ. Res. Public Health 2021, 18, 1580. [Google Scholar] [CrossRef]
  33. Witek-Krowiak, A.; Chojnacka, K.; Podstawczyk, D.; Dawiec, A.; Pokomeda, K. Application of response surface methodology and artificial neural network methods in modelling and optimization of biosorption process. Bioresour. Technol. 2014, 160, 150–160. [Google Scholar] [CrossRef]
  34. Sahu, J.N.; Acharya, J.; Meikap, B.C. Response surface modeling and optimization of chromium(VI) removal from aqueous solution using Tamarind wood activated carbon in batch process. J. Hazard. Mater. 2009, 172, 818–825. [Google Scholar] [CrossRef]
  35. Ferreira, S.L.C.; Bruns, R.E.; Ferreira, H.S.; Matos, G.D.; David, J.M.; Brandão, G.C.; da Silva, E.G.P.; Portugal, L.A.; dos Reis, P.S.; Souza, A.S.; et al. Box-Behnken design: An alternative for the optimization of analytical methods. Anal. Chim. Acta 2007, 597, 179–186. [Google Scholar] [CrossRef] [PubMed]
  36. Turan, A.Z.; Turan, M. Removal of Heavy Metals and Dyes from Wastewaters by Raw and Activated Carbon Hazelnut Shells. In Topics in Applied Physics; Ünlü, H., Horing, N.J.M., Eds.; Springer: Berlin/Heidelberg, Germany, 2022; pp. 907–933. [Google Scholar] [CrossRef]
  37. Fatahi, A.; Ziarati, P.; Jafarpour, A.; Cruz-Rodriguez, L. Heavy Metal Removal from Edible Leafy Vegetable by Low Cost Novel Adsorbents: Hazelnut Shell. Cit. J. Sci. Discov. 2020, 4, 20039. [Google Scholar] [CrossRef]
  38. Figueira, P.; Henriques, B.; Teixeira, F.; Afonso, N.; Pinto, J.; Tavares, D.; Vale, C.; Pereira, E. Potentialities of Agro-Based Wastes to Remove Cd, Hg, Pb, and As from Contaminated Waters. Water Air Soil Pollut. 2022, 233, 78. [Google Scholar] [CrossRef]
  39. Rey, C.; Combes, C.; Drouet, C.; Grossin, D.; Bertrand, G.; Soulié, J. 1.11 Bioactive Calcium Phosphate Compounds: Physical Chemistry. In Comprehensive Biomaterials II; Elsevier: Amsterdam, The Netherlands, 2017; pp. 244–290. [Google Scholar] [CrossRef]
  40. Demirbaş, Ö.; Karadağ, A.; Alkan, M.; Doğan, M. Removal of copper ions from aqueous solutions by hazelnut shell. J. Hazard. Mater. 2008, 153, 677–684. [Google Scholar] [CrossRef]
  41. Al-Ajji, M.A.; Al-Ghouti, M.A. Novel insights into the nanoadsorption mechanisms of crystal violet using nano-hazelnut shell from aqueous solution. J. Water Process Eng. 2021, 44, 102354. [Google Scholar] [CrossRef]
  42. Aggelopoulos, C.A.; Moschopoulou, E.; Klepetsanis, P.G.; Tsakiroglou, C.D. Valorization of fruit wastes (pistachio shells) as adsorbent for the removal of Zn from aqueous solutions under adverse acidic conditions. Desalin. Water Treat. 2017, 74, 174–183. [Google Scholar] [CrossRef]
  43. Ferreira, N.; Fabre, E.; Henriques, B.; Viana, T.; Costa, M.; Pinto, J.; Tavares, D.; Carvalho, L.; Pinheiro-Torres, J.; Pereira, E. Response surface approach to optimize the removal of the critical raw material dysprosium from water through living seaweeds. J. Environ. Manag. 2021, 300, 113697. [Google Scholar] [CrossRef]
  44. Fomina, M.; Gadd, G.M. Biosorption: Current perspectives on concept, definition and application. Bioresour. Technol. 2014, 160, 3–14. [Google Scholar] [CrossRef]
  45. Varshini C, J.S.; Das, D.; Das, N. Optimization of parameters for praseodymium(III) biosorption onto biowaste materials using response surface methodology: Equilibrium, kinetic and regeneration studies. Ecol. Eng. 2015, 81, 321–327. [Google Scholar] [CrossRef]
  46. Keshtkar, A.R.; Moosavian, M.A.; Sohbatzadeh, H.; Mofras, M. La(III) and Ce(III) biosorption on sulfur functionalized marine brown algae Cystoseira indica by xanthation method: Response surface methodology, isotherm and kinetic study. Groundw. Sustain. Dev. 2019, 8, 144–155. [Google Scholar] [CrossRef]
  47. Fabre, E.; Henriques, B.; Viana, T.; Pinto, J.; Costa, M.; Ferreira, N.; Tavares, D.; Vale, C.; Pinheiro-Torres, J.; Pereira, E. Optimization of Nd(III) removal from water by Ulva sp. and Gracilaria sp. through Response Surface Methodology. J. Environ. Chem. Eng. 2021, 9, 105946. [Google Scholar] [CrossRef]
  48. Raji, M.; Abolghasemi, H.; Safdari, J.; Kargari, A. Response Surface Optimization of Dysprosium Extraction Using an Emulsion Liquid Membrane Integrated with Multi-Walled Carbon Nanotubes. Chem. Eng. Technol. 2018, 41, 1857–1870. [Google Scholar] [CrossRef]
  49. He, C.; Salih, K.A.M.; Wei, Y.; Mira, H.; Abdel-Rahman, A.A.H.; Elwakeel, K.Z.; Hamza, M.F.; Guibal, E. Efficient Recovery of Rare Earth Elements (Pr(III) and Tm(III)) From Mining Residues Using a New Phosphorylated Hydrogel (Algal Biomass/PEI). Metals 2021, 11, 294. [Google Scholar] [CrossRef]
  50. Xiqiang, L.; Hui, Z.; Yong, T.; Yunlong, L. REE Geochemical Characteristic of Apatite: Implications for Ore Genesis of the Zhijin Phosphorite. Minerals 2020, 10, 1012. [Google Scholar] [CrossRef]
  51. Figueira, P.; Vale, C.; Pereira, E. Factors influencing sorption of trace elements in contaminated waters onto ground nut shells. J. Environ. Manag. 2022, 308, 114618. [Google Scholar] [CrossRef]
  52. Maina, I.W.; Obuseng, V.; Nareetsile, F. Use of Moringa oleifera (Moringa) Seed Pods and Sclerocarya birrea (Morula) Nut Shells for Removal of Heavy Metals from Wastewater and Borehole Water. J. Chem. 2016, 2016, 9312952. [Google Scholar] [CrossRef]
  53. McNeill, D.C.; Pal, A.K.; Nath, D.; Rodriguez-Uribe, A.; Mohanty, A.K.; Pilla, S.; Gregori, S.; Dick, P.; Misra, M. Upcycling of ligno-cellulosic nutshells waste biomass in biodegradable plastic-based biocomposites uses—A comprehensive review. Compos. Part C Open Access 2024, 14, 100478. [Google Scholar] [CrossRef]
  54. Şencan, A.; Karaboyacı, M.; Kılıç, M. Determination of lead(II) sorption capacity of hazelnut shell and activated carbon obtained from hazelnut shell activated with ZnCl2. Environ. Sci. Pollut. Res. 2015, 22, 3238–3248. [Google Scholar] [CrossRef] [PubMed]
  55. Gozaydin, G.; Yuksel, A. Valorization of hazelnut shell waste in hot compressed water. Fuel Process. Technol. 2017, 166, 96–106. [Google Scholar] [CrossRef]
  56. da Silva Bruckmann, F.; Piazzi Fuhr, A.C.F.; Silva Oliveira, M.L.; Oliveira Silva, L.F.; Knani, S.; Graba, B.; Dotto, G.L. Recovery and concentration of Eu and Dy from real leachate using wastes as adsorbents: Standard adsorption study and fixed bed operation. Sep. Purif. Technol. 2025, 373, 133596. [Google Scholar] [CrossRef]
  57. Gallardo, K.; Castillo, R.; Mancilla, N.; Remonsellez, F. Biosorption of Rare-Earth Elements from Aqueous Solutions Using Walnut Shell. Front. Chem. Eng. 2020, 2, 4. [Google Scholar] [CrossRef]
  58. Jamali, H.A.; Mahvi, A.H.; Nazmara, S. Removal of cadmium from aqueous solutions by Hazel nut shell. World Appl. Sci. J. 2009, 2, 16–20. [Google Scholar]
  59. Pehlivan, E.; Altun, T.; Cetin, S.; Iqbal Bhanger, M. Lead sorption by waste biomass of hazelnut and almond shell. J. Hazard. Mater. 2009, 167, 1203–1208. [Google Scholar] [CrossRef]
Figure 1. Mean bars on the central point of the BBD for the removal efficiency (%) of REEs in the mixture using the hazelnut shells (pH 6, salinity 15 g/L, and sorbent dose of 0.50 g/L). Each bar corresponds to the obtained times of exposure of 24, 48, 72, and 96 h. Error bars show the standard deviation between the replicates (n = 3).
Metals 15 00842 g001
Figure 2. Three-dimensional response surfaces for the reduced model, considering the 3 factors for the removal of Nd from the REEs mixture by hazelnut shells at 48 h of exposure. (A) Interactive effects of pH and salinity, keeping the sorbent dosage constant; (B) Interactive effects of pH and sorbent dosage, keeping the salinity constant; (C) Interactive effects of salinity and sorbent dosage, keeping the pH constant. The bluest area represents the lowest removal, while the redest area represents the highest removal.
Metals 15 00842 g002
Figure 3. Three-dimensional response surfaces for the reduced model, considering the 3 factors for the removal of La from the REEs mixture by hazelnut shells at 48 h of exposure. (A) Interactive effects of pH and salinity, keeping the sorbent dosage constant; (B) Interactive effects of pH and sorbent dosage, keeping the salinity constant; (C) Interactive effects of salinity and sorbent dosage, keeping the pH constant. The bluest area represents the lowest removal, while the redest area represents the highest removal.
Metals 15 00842 g003
Figure 4. Three-dimensional response surfaces for the reduced model, considering the 3 factors for the removal of Y from the REEs mixture by hazelnut shells at 48 h of exposure. (A) Interactive effects of pH and salinity, keeping the sorbent dosage constant; (B) Interactive effects of pH and sorbent dosage, keeping the salinity constant; (C) Interactive effects of salinity and sorbent dosage, keeping the pH constant. The bluest area represents the lowest removal, while the redest area represents the highest removal.
Metals 15 00842 g004
Figure 5. Removal (%) of REEs under (A) optimal operation conditions, comparing predicted values by the model and obtained values; (B) competing environment in the presence of PTEs.
Metals 15 00842 g005
Figure 6. (A) FTIR spectra of hazelnut shell before (black line) and after REE (red line) and REE + PTEs (blue line) exposure; (B) SEM analysis of hazelnut shell before exposure; (C) SEM analysis after hazelnut exposure to REE solution; and (D) SEM analysis after exposure to REE + PTEs solution.
Metals 15 00842 g006
Table 1. Experimental conditions for three different factors studied and the three level conditions for the removal of REEs from water using hazelnut shells as a biosorbent.
VariableLevel
−10+1
pH468
Salinity (g/L)01530
Hazelnut shell dose (g/L)0.250.500.75
Table 2. Description of the experimental conditions according to the Box–Behnken design. Fixed conditions: temperature of 295.15 K, stirring velocity of 450 rpm, and volume of 0.5 L, along with 168 h of exposure.
ExperimentpHSalinity (g/L)Hazelnut Shell Dose (g/L)
14150.25
24150.75
36300.75
44300.50
58300.50
68150.25
76150.50
8400.50
96150.50
10600.25
11800.50
126150.50
136300.25
148150.75
15600.75
Table 3. Removal (%) of REEs (Y, La, Ce, Pr, Nd, Eu, Gd, Tb, and Dy) from a mixture by hazelnut shells, under the experimental conditions presented in Table 2 for 24, 48, and 72 h.
Experiment
123456789101112131415
Removal (%)Y24 h043933114226227467825133987
48 h055364030467044548739215391
72 h056444936467548619148296495
La24 h01303168146917488417211782
48 h034142822358029599125233395
72 h035133633358534669133335096
Ce24 h04414176187123487824191689
48 h045332821428238628634263493
72 h046453633428738688748365294
Pr24 h04455175227226487727211788
48 h065553020448240628539273692
72 h056453832448742688547375494
Nd24 h05456185237226517627231886
48 h065503122458241648541263692
72 h066643834458732688348365593
Eu24 h05526217277134517333262186
48 h286173422498147648248344199
72 h087164234508649718657445893
Gd24 h03473219257031487630202387
48 h076073523488045618543284292
72 h066874336488448688753385894
Tb24 h045142510286633487333222786
48 h066163825507748618448324691
72 h067064536508151668857436193
Dy24 h064932712296335467334223285
48 h076153928497450588449314990
72 h087054737497952648858416393
Table 4. Friedman test with Dunn’s multiple comparisons test applied to REEs in the mixture for exposure times of 24, 48, 72, and 96 h. Significant values are shown as underlined bold values.
Friedman Test with Dunn’s Multiple Comparisons Test (p-Value ≤ 0.05)
Element24 h vs. 48 h24 h vs. 72 h24 h vs. 96 h48 h vs. 72 h48 h vs. 96 h72 h vs. 96 h
Y0.04330.0002<0.00010.94380.0973>0.9999
La0.02810.0003<0.0001>0.99990.3374>0.9999
Ce0.39600.0006<0.00010.24180.0533>0.9999
Pr0.04330.0008<0.0001>0.99990.0973>0.9999
Nd0.20340.0019<0.00010.82540.1177>0.9999
Eu0.02250.0003<0.0001>0.99990.4626>0.9999
Gd0.0433<0.0001<0.00010.53810.2034>0.9999
Tb0.0225<0.0001<0.00010.71880.3374>0.9999
Dy0.04330.0001<0.00010.71880.0655>0.9999
Table 5. Factors with the corresponding p-value for 48 h of contact. Bold green values mean positive significance, and underlined red values mean negative significance.
p-Value for Quadratic Model
pHSalinityHN MasspH2Salinity2HN Mass2pH-SalinitypH-HN MassSalinity-HN Mass
48 hNd0.04960.00140.06590.03280.00900.23480.28810.72540.9332
Gd0.03750.00210.04110.02940.00960.16920.37440.61390.9762
Eu0.05030.00180.04400.01400.00850.23260.30250.56240.7491
La0.03690.00070.07510.15680.00280.36790.55530.70310.4612
Dy0.01620.00310.03990.02220.01880.17080.32100.52670.9328
Tb0.02450.00290.04770.02210.01470.17260.31930.52430.9792
Pr0.06970.00170.06350.04080.00800.23100.39420.67620.9440
Y0.00660.00150.02210.06710.01310.17700.46270.41520.8326
Ce0.06790.00170.08010.05360.00760.30510.43120.72170.8979
Table 6. Reduced equations with significant factors and the respective coefficient of determination (R2) and adjusted coefficient of determination (adjusted R2) for each REE in the mixture.
Reduced EquationNº of EquationR2Adjusted R2
%   R e m o v a l   o f   Y = 2.77 + 8.15 × p H 4.42 × s a l i n i t y + 47.8 × m a s s + 9.66 × 10 2 × s a l i n i t y 2 Equation (6)0.86150.8061
%   R e m o v a l   o f   L a = 48.9 + 5.42 × p H 6.17 × s a l i n i t y + 1.42 × 10 1 × s a l i n i t y 2 Equation (7)0.86730.8311
%   R e m o v a l   o f   C e = 80.8 5.69 × s a l i n i t y + 1.30 × 10 1 × s a l i n i t y 2 Equation (8)0.71500.6675
%   R e m o v a l   o f   P r = 86.8 + 53.6 × p H 5.29 × s a l i n i t y 4.06 × p H 2 + 1.19 × 10 1 × s a l i n i t y 2 Equation (9)0.83870.7742
%   R e m o v a l   o f   N d = 97.8 + 57.1 × p H 5.22 × s a l i n i t y 4.31 × p H 2 + 1.15 × 10 1 × s a l i n i t y 2 Equation (10)0.84400.7817
%   R e m o v a l   o f   E u = 149 + 68.2 × p H 4.94 × s a l i n i t y + 42.5 × m a s s 5.26 × p H 2 + 1.12 × 10 1 × s a l i n i t y 2 Equation (11)0.90630.8542
%   R e m o v a l   o f   G d = 124 + 57.7 × p H 4.93 × s a l i n i t y + 44.4 × m a s s 4.33 × p H 2 + 1.12 × 10 1 × s a l i n i t y 2 Equation (12)0.89780.8410
%   R e m o v a l   o f   T b = 142 + 63.1 × p H 4.48 × s a l i n i t y + 42.4 × m a s s 4.72 × p H 2 + 1.00 × 10 1 × s a l i n i t y 2 Equation (13)0.88700.8242
%   R e m o v a l   o f   D y = 144 + 62.2 × p H 4.17 × s a l i n i t y + 43.8 × m a s s 4.60 × p H 2 + 9.20 × 10 2 × s a l i n i t y 2 Equation (14)0.88790.8256
Table 7. Optimal condition values for the maximum removal (%) and uptake (mg/g) of REEs from the mixture at 48 h of exposure.
Optimal Condition for Removal (%)
pHSalinitySorbent Dose (g/L)Removal (%)Uptake (mg/g)Total Uptake (mg/g)
Y7.000.75960.1031.52
La870.187
Ce810.103
Pr890.192
Nd900.141
Eu1000.205
Gd1000.194
Tb990.180
Dy990.220
Optimal Condition for Uptake (mg/g)
pHSalinitySorbent dose (g/L)Removal (%)Uptake (mg/g)Total Uptake (mg/g)
Y7.000.25720.170
La870.304
Ce810.170
Pr890.324
Nd900.3122.69
Eu810.360
Gd790.383
Tb780.302
Dy770.363
Disclaimer/Publisher’s Note: The statements, opinions and data contained in all publications are solely those of the individual author(s) and contributor(s) and not of MDPI and/or the editor(s). MDPI and/or the editor(s) disclaim responsibility for any injury to people or property resulting from any ideas, methods, instructions or products referred to in the content.

