Article

Effect of Pre-Hoop Expansion Deformation on High-Temperature Mechanical Properties of Zirconium Plate at 400 °C

State Key Laboratory for Advanced Metals and Materials, University of Science and Technology Beijing, 30 Xueyuan Road, Haidian District, Beijing 100083, China
*
Author to whom correspondence should be addressed.
Metals 2025, 15(8), 827; https://doi.org/10.3390/met15080827
Submission received: 24 May 2025 / Revised: 9 July 2025 / Accepted: 18 July 2025 / Published: 23 July 2025

Abstract

The role of pre-hoop expansion deformation on high-temperature mechanical properties of zirconium at 400 °C was investigated. The results showed that with the increase in the pre-strain, the yield strength and ultimate strength increased while the elongation decreased, all in a linear way. The creep life had a significant decrease as the creep stress exceeded 276 MPa. The fatigue–creep results indicated that as the stress ratio was less than 0.7, the deformation process was dominated by fatigue (the fatigue–creep life first increased and then decreased), while as the stress ratio was higher than 0.7, the deformation process was dominated by creep (the fatigue–creep life decreased monotonically). The dwell time had a negative effect on the fatigue–creep life. The stress field simulation results indicated that there existed a compressive stress zone, a stress transition zone, and a tensile stress zone around the pre-hoop expansion deformation zone. The compressive stress was beneficial while the tensile stress was harmful for the high-temperature mechanical properties of the zirconium plate.

1. Introduction

In order to overcome the dual challenges of the global energy crisis and transition, nuclear energy has been developed rapidly due to its high energy density, stable power supply capacity, and low carbon emissions [1,2,3]. As a mature and stable nuclear reactor, the pressurized water reactor (PWR) has been widely used all over the world. However, in the large-scale application of PWR, the safe operation lifespan is still a common concern. The safe operation lifespan of PWR often depends on the mechanical properties of component materials [4,5,6]. Thus, it is very necessary to evaluate the mechanical properties of component materials.
Zirconium plates are common component materials in PWR. For example, they are made into spacer grids with circular hole structures to fix the fuel rods and ensure the spacing between them [7,8]. Thus, there are usually some mechanical interactions between the zirconium plate and the fuel rods [9,10,11,12,13]. The expansion and micro vibrations of fuel rods due to the high-temperature environment and high-speed circulating cooling water will force the zirconium plates to undergo hoop expansion deformation [14,15,16,17]. The hoop expansion deformation of zirconium plates inevitably affects their mechanical properties and in severe cases, may even damage the integrity of the spacer grids, threatening the safe operation of nuclear power plants. Therefore, it is necessary to study the effect of pre-hoop expansion deformation on the mechanical properties of zirconium plate.
Regarding the study of the influence of pre-deformation on mechanical properties of zirconium alloys, the commonly used pre-deformation methods are pre-tension deformation, pre-compression deformation, and pre-extrusion deformation. Snowden and Stathers carried out pre-bending deformation on a Zircaloy-2 alloy plate and studied the effect of the pre-bending deformation on the fatigue properties of the Zircaloy-2 alloy plate at 240 °C [18]. The research results show that pre-bending deformation can produce numerous twins, which weakens the fatigue properties of the Zircaloy-2 alloy plate. Wang et al. conducted pre-tensile deformation on Zr-4 alloys and studied the effect of pretension deformation on the tensile properties of Zr-4 alloys at 350 °C [19]. The results indicated that the fragmentation of coarse grains and the formation of sub-grains led to an increase in the high-temperature strength of Zr-4 alloys. Sklenicka et al. studied the effect of pre-compression deformation and pre-extrusion deformation by ECAP (equal channel angular pressing) on the creep property of an Zr-2.5Nb alloy at 350 °C [20], and found that pre-compression was beneficial for the creep lifetime of zirconium alloys because of the removal of processing defects and the homogeneity of the microstructure, while pre-extrusion deformation weakened the creep lifetime due to an increase of the proportion of high-angle grain boundaries.
At present, there is no research about the effect of the pre-hoop expansion deformation on the high-temperature mechanical properties of zirconium plate. In order to carry out this research, a novel zirconium plate specimen was prepared by compressing a metal cylinder inserted into the central hole of the zirconium sample. Meanwhile, because the operating temperature range of zirconium components in PWR is from 290 °C to 400 °C, 400 °C was selected as the experiment temperature in this paper. This work filled a research gap in this field and provided new ideas and methods related to the research of zirconium alloys, which will promote material design and optimization of zirconium alloys in nuclear power applications.

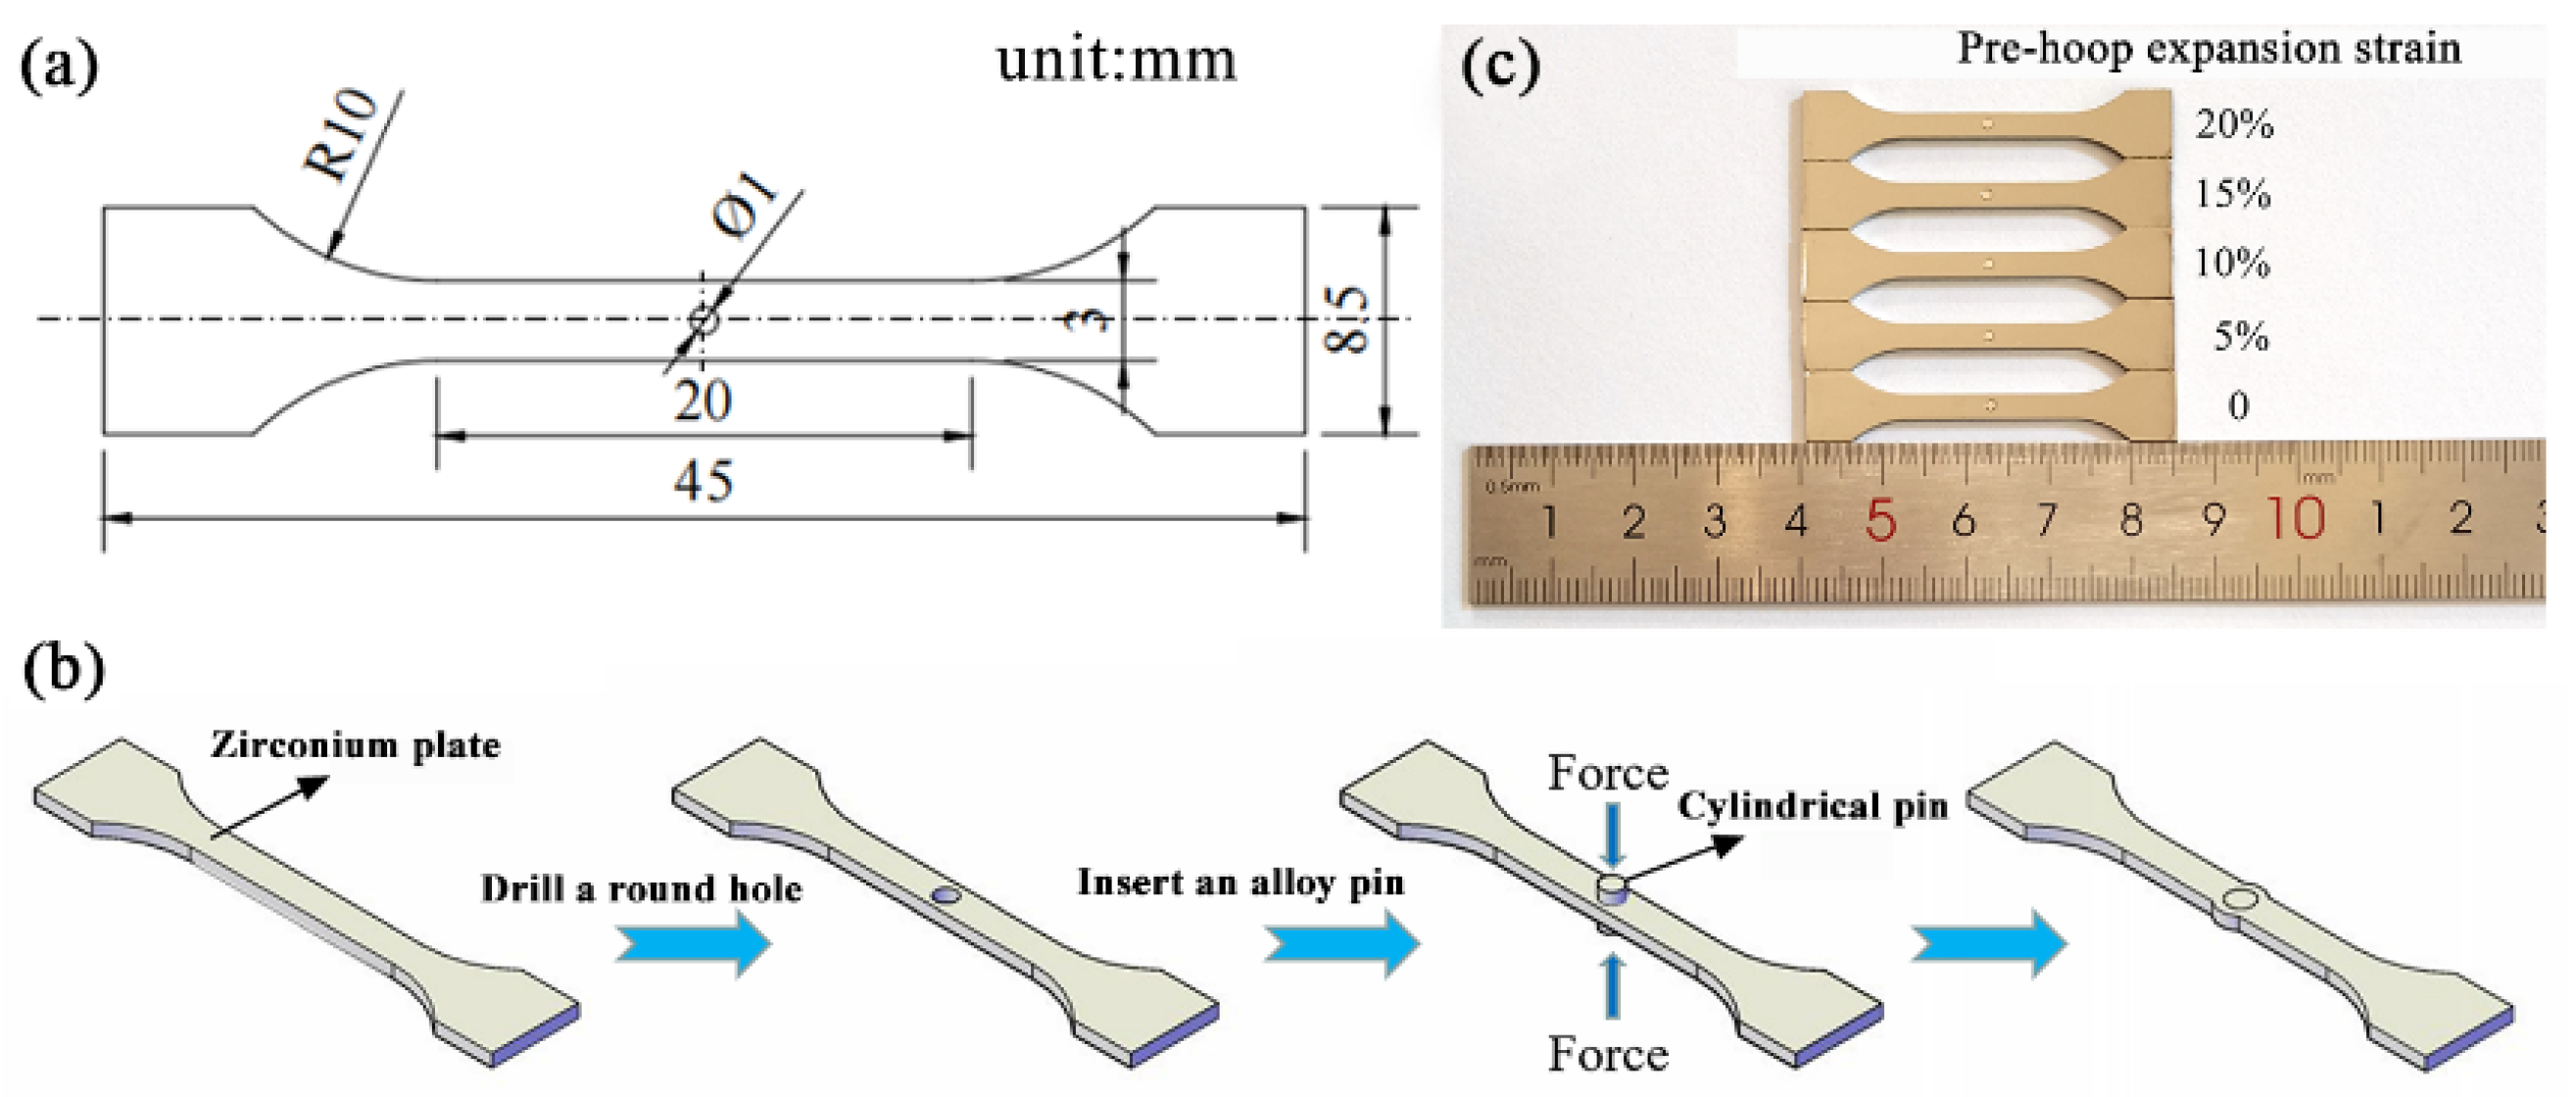
2. Materials and Methods

Commercial zirconium with 99.78 wt% zirconium, 0.18 wt% iron, and 0.04 wt% other elements were used as experimental materials. The zirconium plates are supplied by China National Nuclear Baotitanium-Zirconium Industry Co., Ltd. (Baoji, China). Finite element numerical simulation was conducted using the ABAQUS software, with the version ABAQUS/CAE 2017. Sample dimensions are illustrated in Figure 1a. The cylindrical stainless-steel inserts were prepared, 1 mm in diameter and 1.25, 1.46, 1.62, and 1.79 in length. These inserts were specifically designed to exceed the thickness of the zirconium plates. The experimental procedure involved individually placing these steel cylinders into the central apertures of the zirconium plates, followed by compressive loading until the cylinder height matched the plate thickness. This methodology enabled the production of zirconium samples with predetermined levels of hoop expansion strain. A schematic representation of this specimen preparation technique is provided in Figure 1b. The surfaces of the cylinder and the inner wall of the circular hole in this article are polished with a roughness of 0.8 μm, so the influence of roughness on the experimental results can be ignored. The compression deformation rate of the cylinder is set to be 10−5 s−1, and the upper surface and lower surface of the stainless-steel cylinder were parallel to each other to ensure the same amplitude deformation of the stainless-steel cylinder. The compressive strain rate is calculated based on the compression deformation rate of the cylinder. Given the precise dimensional matching between the central circular aperture of the zirconium plate and the stainless-steel cylindrical component, the hoop expansion deformation of both materials can be regarded as equivalent. The initial circumferential strain of the zirconium plate may be determined through Formula (1), which is derived from the height of the stainless-steel cylinders combined with the principle of volumetric conservation [21,22,23,24].
εpre = ln (2πri′/2πri) = ln (hi/hi′)1/2
Here, ri and hi are the initial radius and height of the stainless-steel cylinder and ri′ and hi′ are the values after compressive deformation, where ri = 0.5 mm and hi′ = 1.2 mm.
The computational results obtained from Equation (1) demonstrate that corresponding to the hi values of 1.25, 1.46, 1.62, and 1.79 mm, the induced hoop pre-strain in the zirconium plate reached 5%, 10%, 15%, and 20%, sequentially.
The microstructure was observed by EBSD technology, with the accelerating voltage of 20 kV. The high-temperature mechanical properties (tensile, creep, and creep–fatigue properties) of specimens at 400 °C were conducted utilizing an electro-hydraulic servo testing apparatus manufactured by Shimadzu Corporation. The tension speed was 0.05 mm/min. The creep stresses were 226 MPa, 256 MPa, 276 MPa, 286 MPa, and 296 MPa. The creep–fatigue test adopted trapezoidal wave loading, and the loading wave is shown in Figure 2. The maximum cyclic stress of creep–fatigue test was 276 MPa; the stress ratios were 0.1, 0.3, 0.5, 0.6, 0.7, 0.8, and 0.9; the dwell times (Δt) were 0 s, 5 s, 20 s, and 60 s; and the loading rate and unloading rate were both 500 N/s. Microstructural characterization was performed employing Shimadzu’s SS-550 SEM system, with the electron beam accelerated at 15 kV.

3. Results

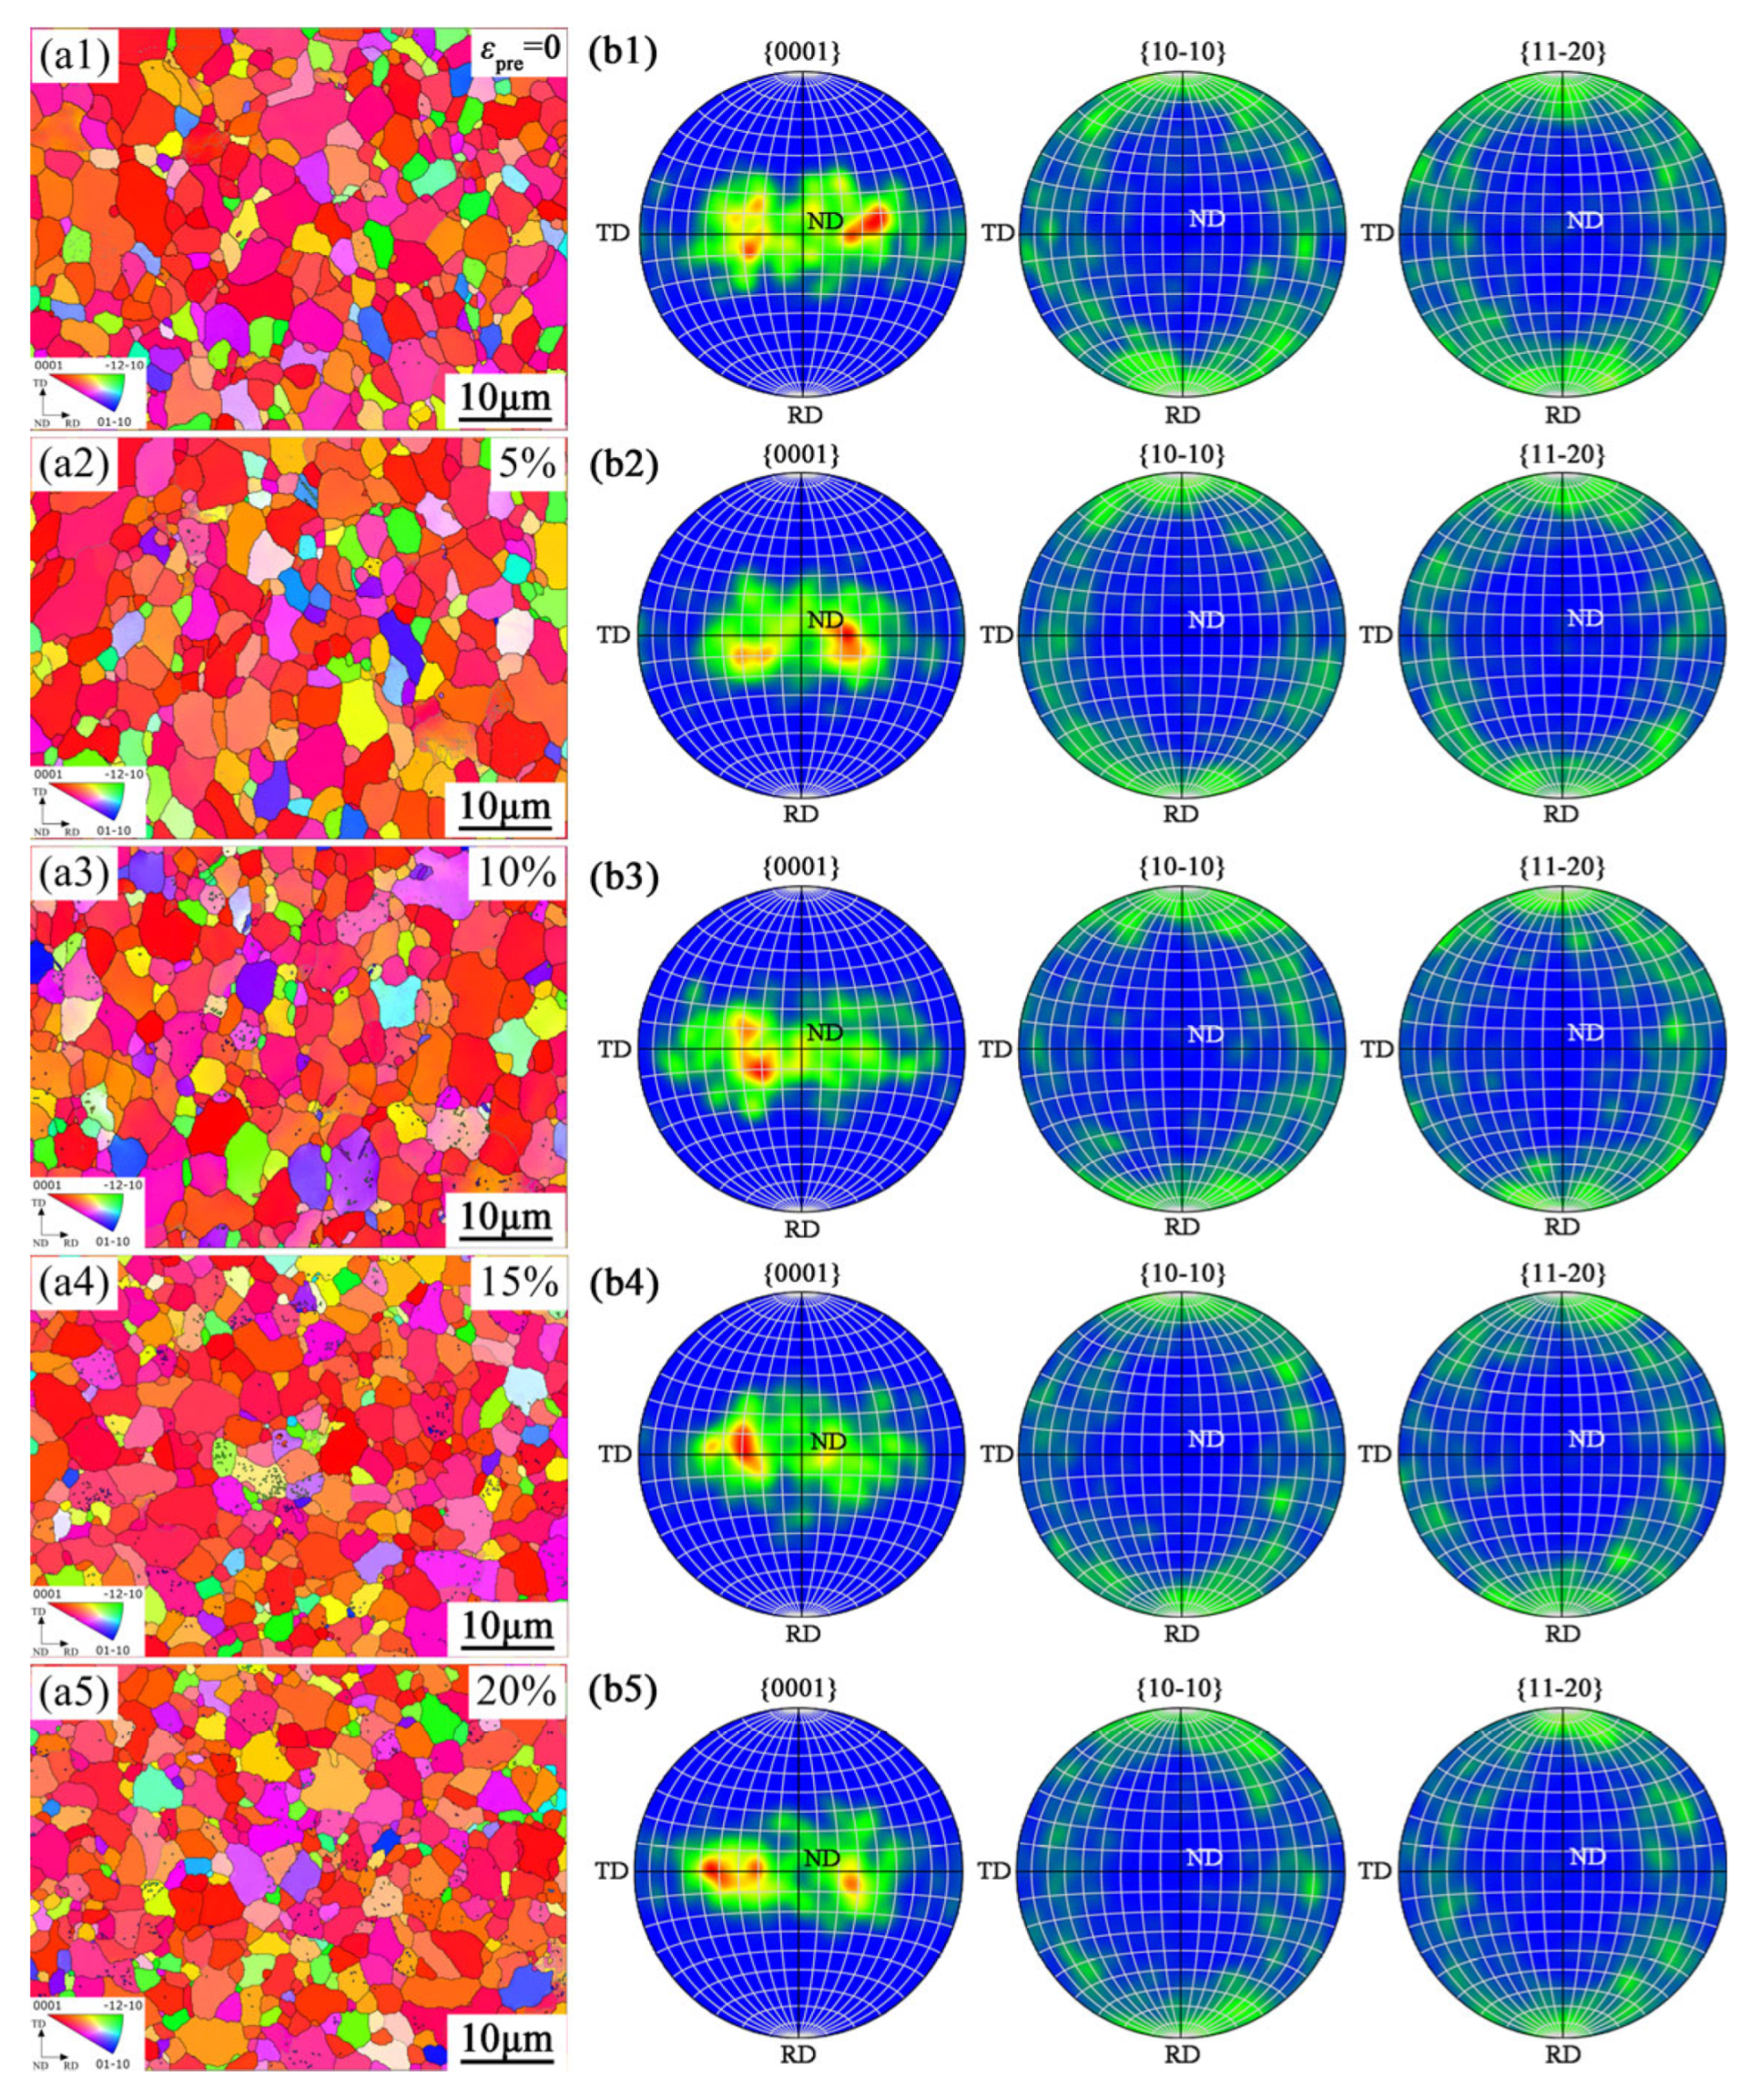
3.1. Microstructure After Different Pre-Hoop Expansion Deformations

Figure 3(a1–a5,b1–b5) are IPF (inverse pole figure) maps and PF (pole figure) maps of the microstructure near the central hole of zirconium specimens with different pre-hoop expansion deformations, respectively. It can be obtained from Figure 3(a1–a5) that the material exhibits an equiaxed grain structure, where the average grain diameter measures approximately 5 μm, and with the increase in the pre-strain, the grains undergo slight deformation and fragmentation. Figure 3(a1–a5) also show that with the pre-strain in-creasing, the grain orientation in the microstructure display no significant change. Figure 3(b1–b5) illustrate that the intensity of most {0001} crystal planes is focused at the ND pole; at the same time, the intensity of some {10-10} and {11-20} crystal planes is dis-tributed near the RD pole of the specimen.

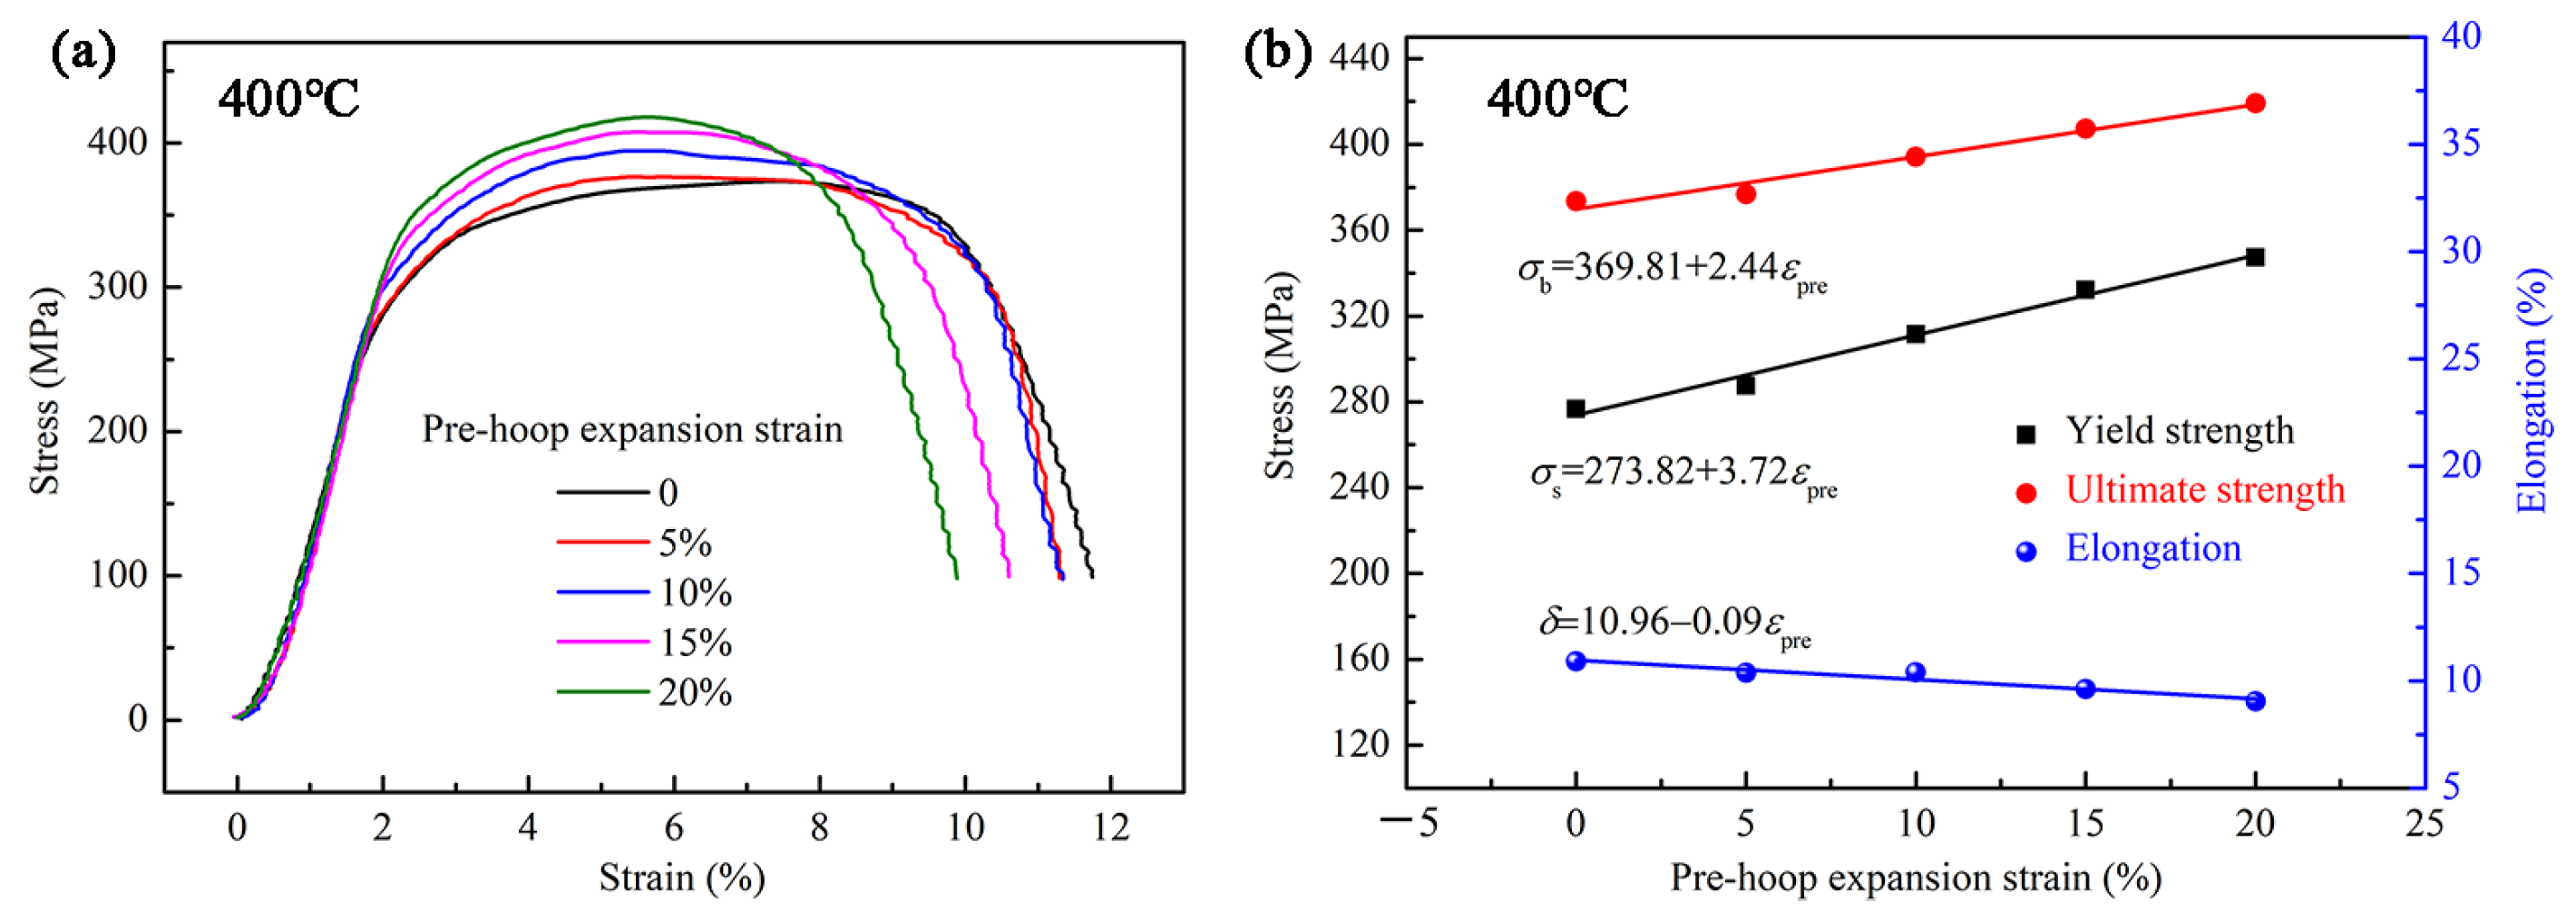
3.2. Tensile Properties Underwent Different Pre-Hoop Expansion Deformations

Figure 4a shows the tensile curves of samples underwent different pre-hoop expansion deformations at 400 °C. The results show that with the increase in the pre-strain, the yield strength and the ultimate strength increase while the elongation decreases. Based on the data of tensile properties in Figure 4a, it can be obtained that after different pre-hoop expansion deformations from 0 to 20%, the yield strength goes up from 276.62 MPa to 347.42 MPa, linearly, and the ultimate strength goes up from 373.46 MPa to 419.14 MPa, linearly, while the elongation goes down from 10.90% to 9.03%, linearly. The variations in the yield strength (σs), the ultimate strength (σb), and the elongation (δ) with the increase of the pre-strain are shown in Figure 4b. The correlation between the pre-strain and tensile properties can be quantitatively described as follows:
σs = 273.82 + 3.72εpre (R2 = 0.99)
σb = 369.81 + 2.44εpre (R2 = 0.96)
δ = 10.96 0.09εpre (R2 = 0.91)
The research of Yang et al. [25] and Wang et al. [26] showed that the increase in pre-deformation led to an increase in strength and a decrease in elongation of zirconium alloys, but no significant linear relationship was found.

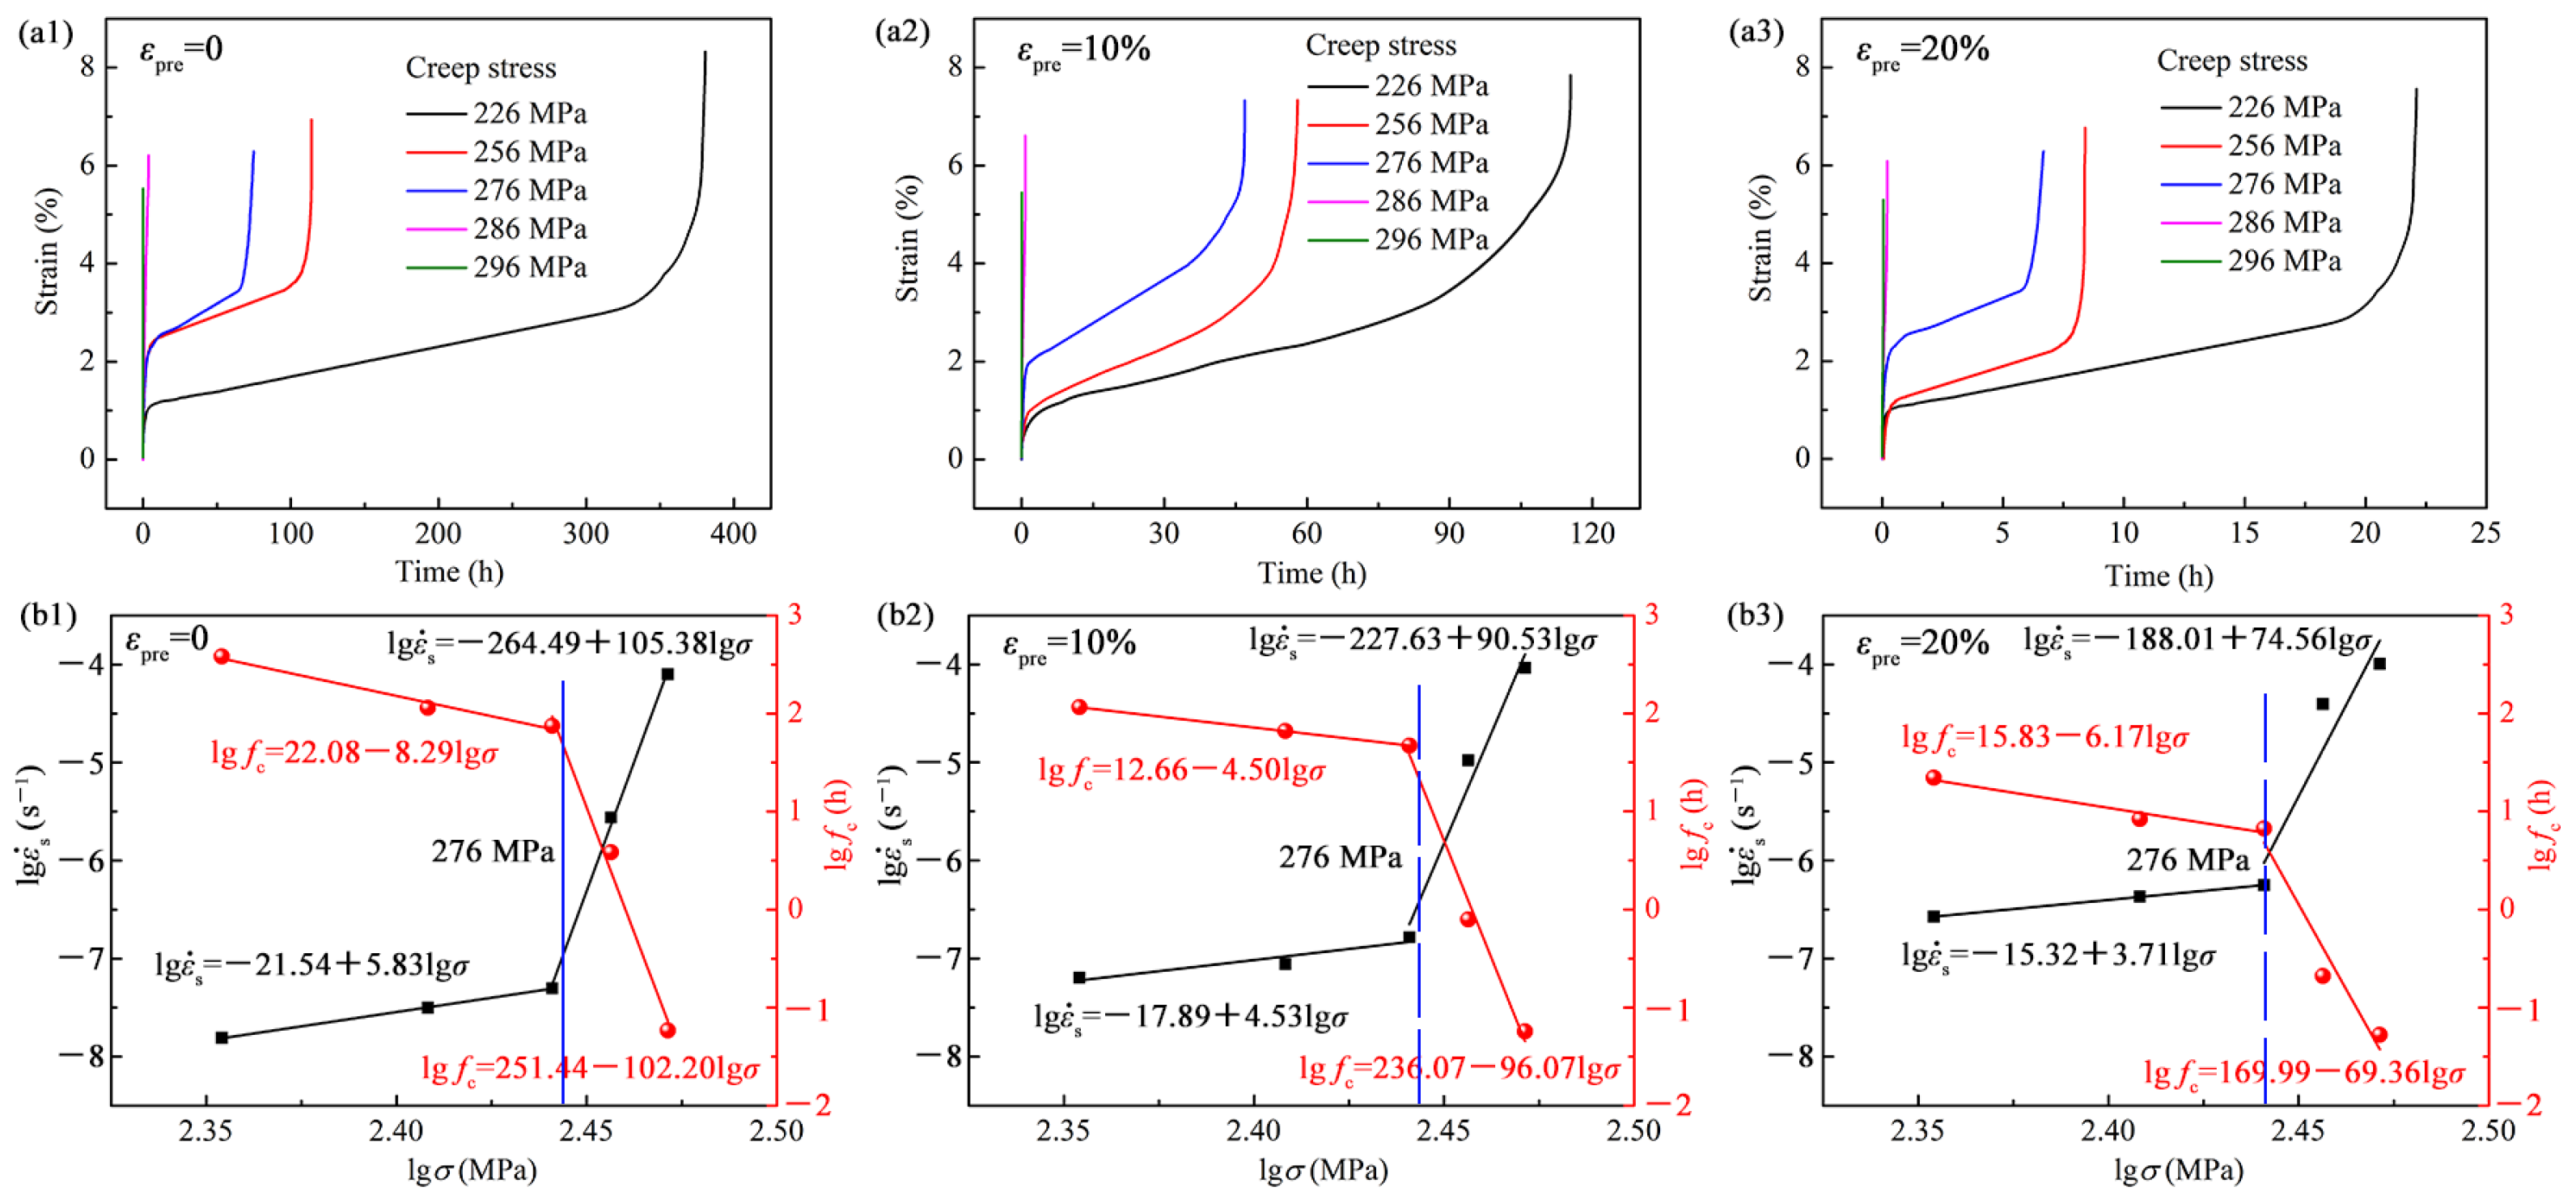
3.3. Creep Properties After Pre-Hoop Expansion Deformations

According to the analysis of tensile properties, 276 MPa is about the yield strength of zirconium plate at 400 °C. Therefore, 276 MPa is used as the threshold of creep stress levels and two stress levels greater than 276 MPa (226 MPa and 256 MPa) and two stress levels less than 276 MPa (286 MPa and 296 MPa) are selected as creep stresses. Figure 5(a1–a3) and (b1–b3) are the creep curves and properties under the creep stress of 226 MPa, 276 MPa, and 296 MPa at 400 °C, respectively. The data of creep properties are listed in Table 1. It can be seen from Figure 5 and Table 1 that when the creep stress is less than or equal to 276 MPa, with the increase in the pre-strain, the steady creep rate (έs) increases while the creep life (fc) decreases. When the creep stress is larger than 276 MPa, the creep life decreases dramatically, with fast, steady creep rates.
Figure 6(a1–a3,b1–b3) are the role of the creep stress on the creep curves and the creep properties with the pre-hoop expansion strain of 0, 10%, and 20% at 400 °C, respectively. Figure 6(a1–a3) show that with the increase in the creep stress, the steady creep rate increases while the creep life decreases. When the creep stress exceeds 276 MPa, the creep properties dramatically deteriorate. It can be seen from Figure 6(b1–b3) that when the creep stress is less than 276 MPa, the logarithms of steady creep rate and the creep life both exhibit linear relationships with the logarithm of the creep stress, while when the creep stress is greater than 276 MPa, these logarithmic curves exhibit different linear relationships. The linear relationships between the logarithm of creep life and the logarithm of the creep stress can be used as the predictive equations for creep life, as shown in Equations (5)–(10).
lgfc = 22.08 − 8.29lgσ (εpre = 0, 226 MPa ≤ σ < 276 MPa) (R2 = 0.97)
lgfc = 251.44 − 102.20lgσ (εpre = 0, 276 MPa ≤ σ < 296 MPa) (R2 = 0.98)
lgfc = 12.66 − 4.50lgσ (εpre = 10%, 226 MPa ≤ σ < 276 MPa) (R2 = 0.99)
lgfc = 236.07 − 96.07lgσ (εpre = 10%, 276 MPa ≤ σ < 296 MPa) (R2 = 0.97)
lgfc = 15.83 − 6.17lgσ (εpre = 20%, 226 MPa ≤ σ < 276 MPa) (R2 = 0.92)
lgfc = 169.99 − 69.36lgσ (εpre = 20%, 276 MPa ≤ σ < 296 MPa) (R2 = 0.89)

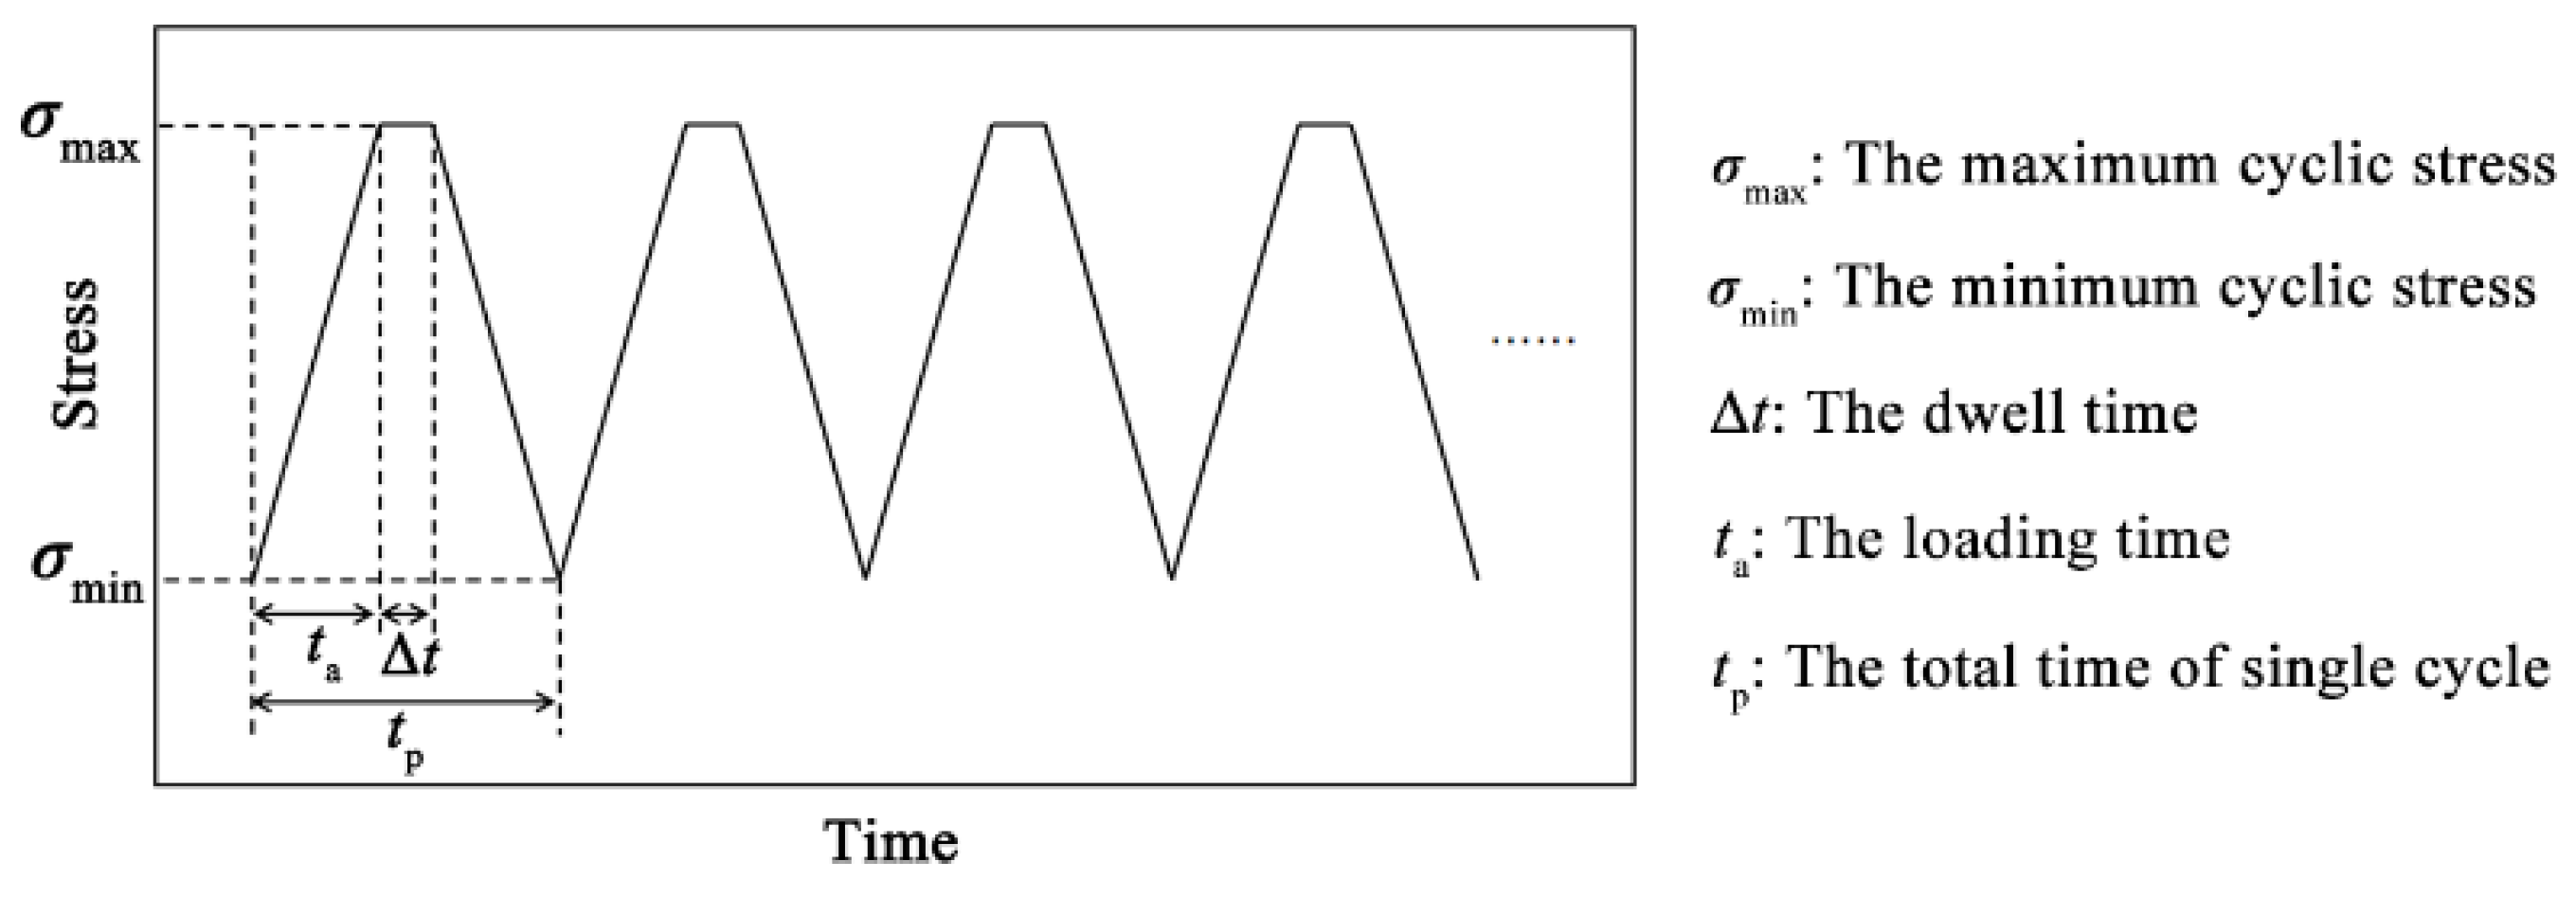
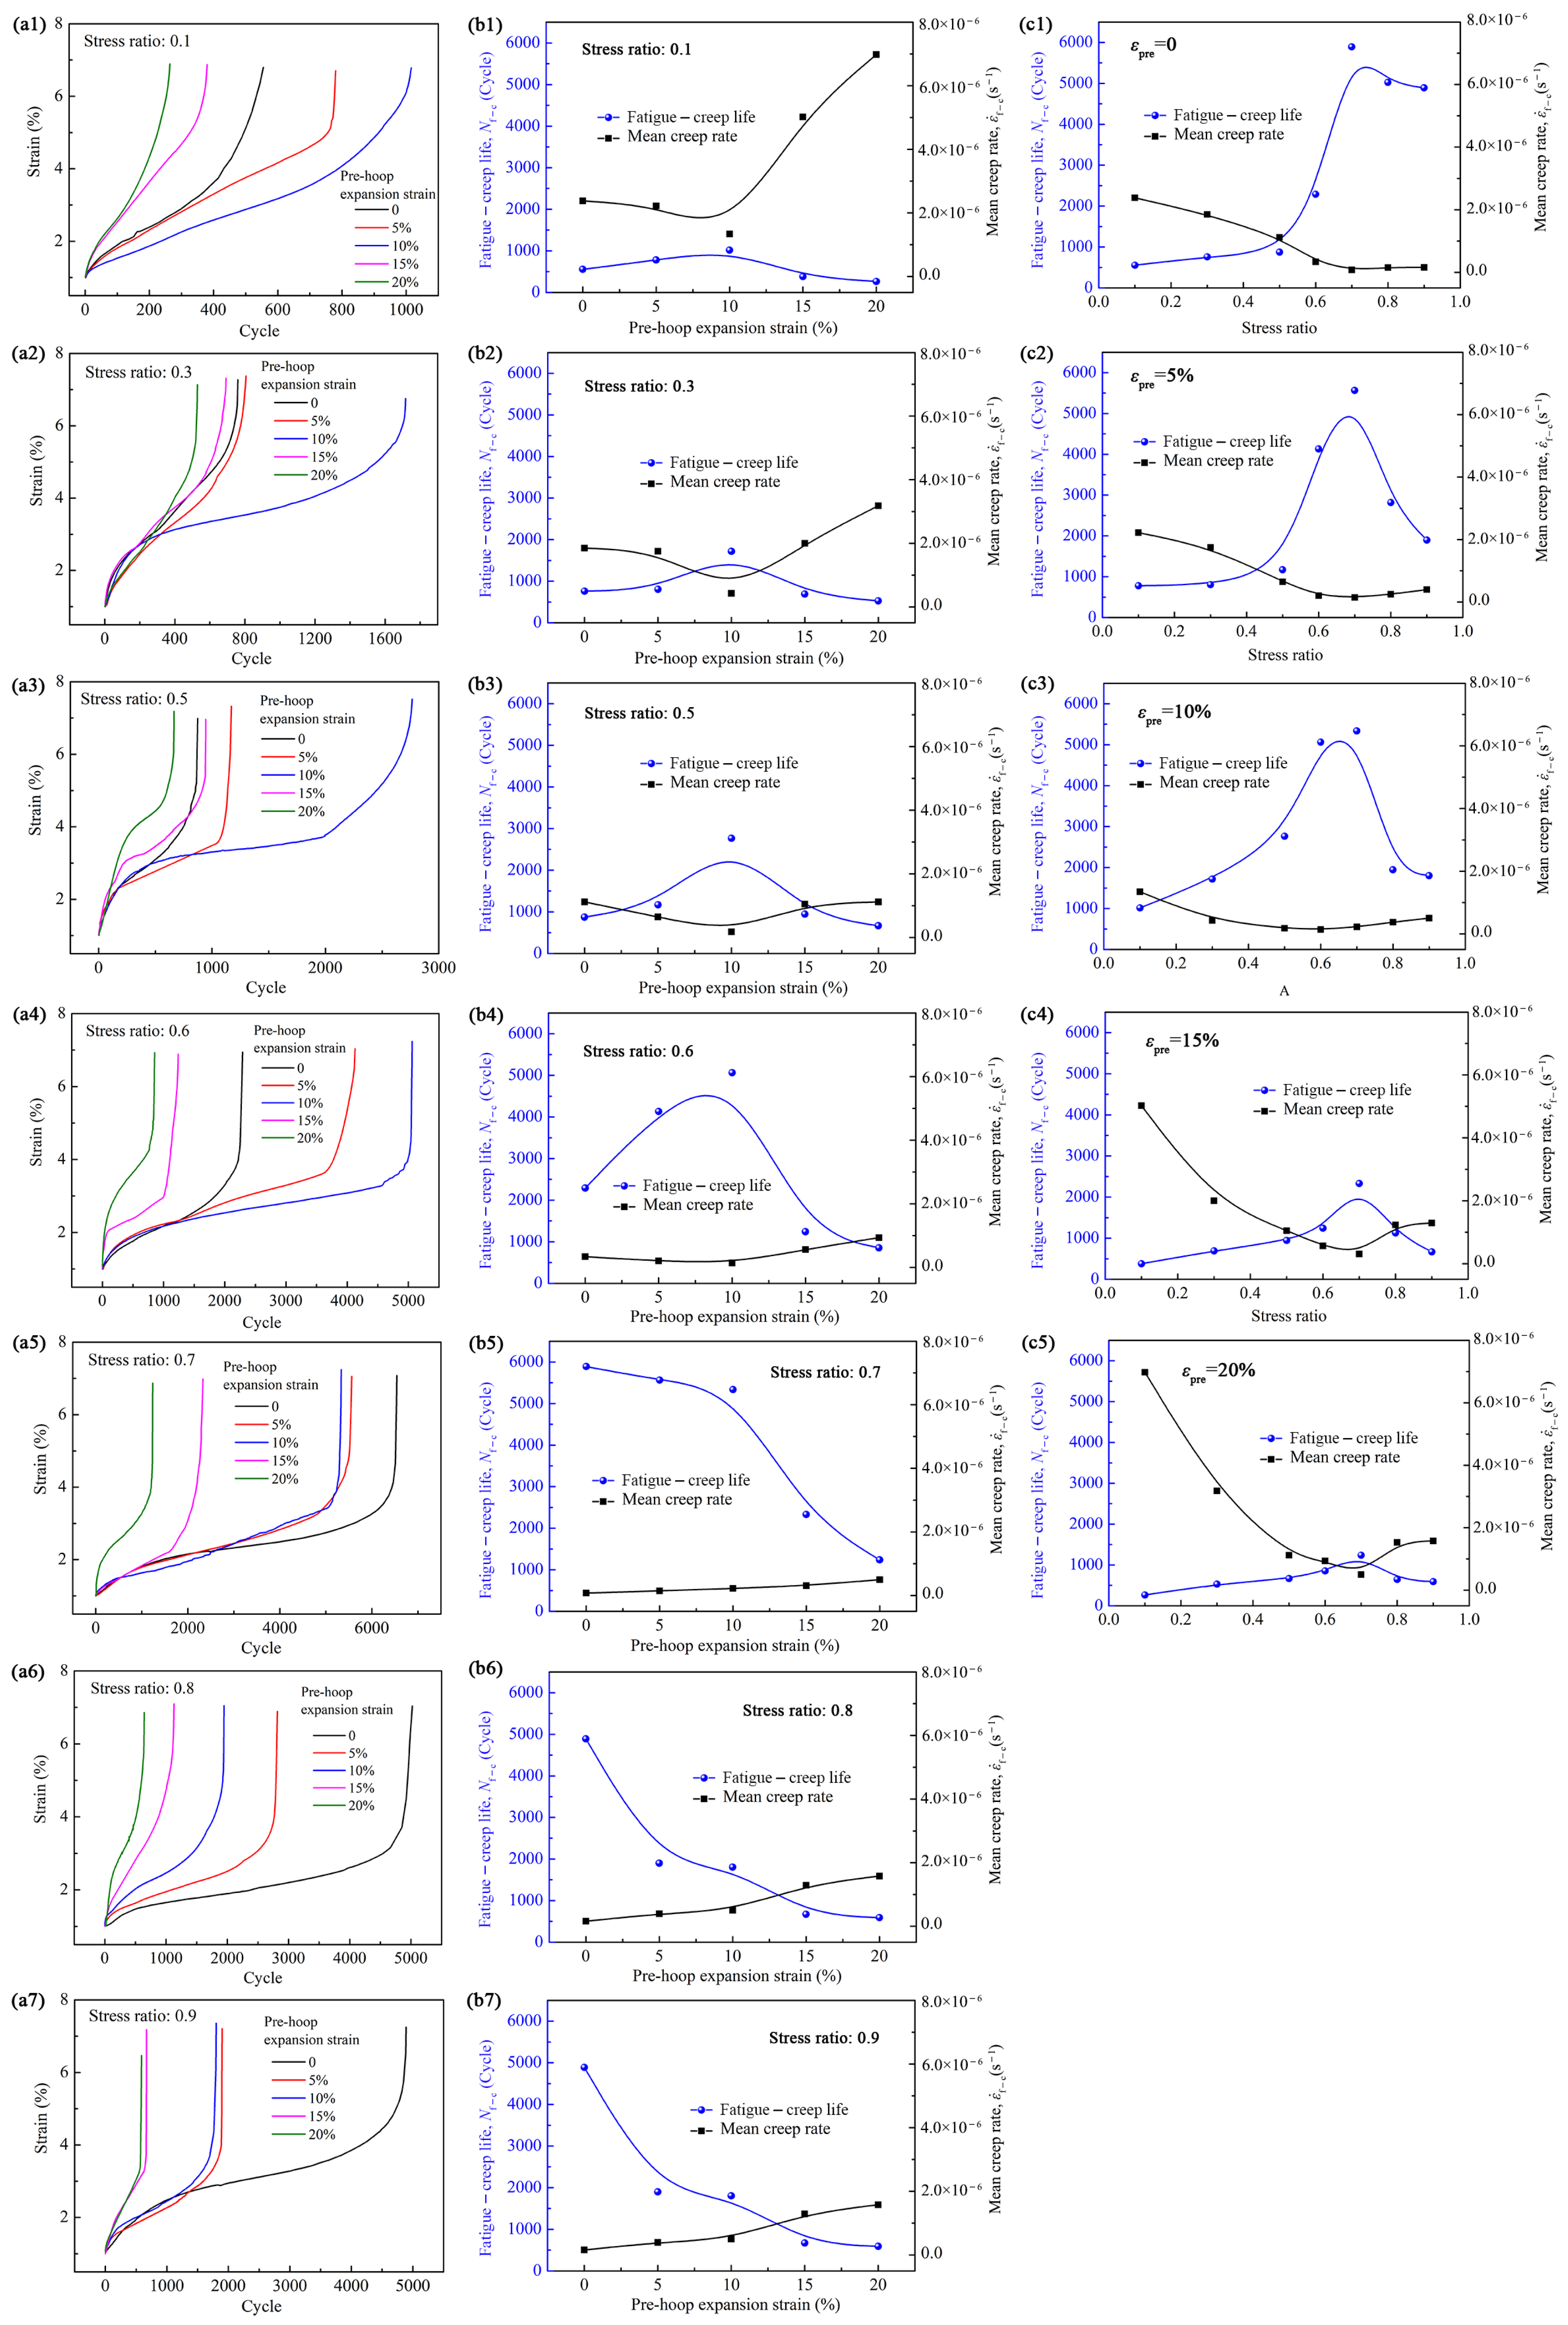
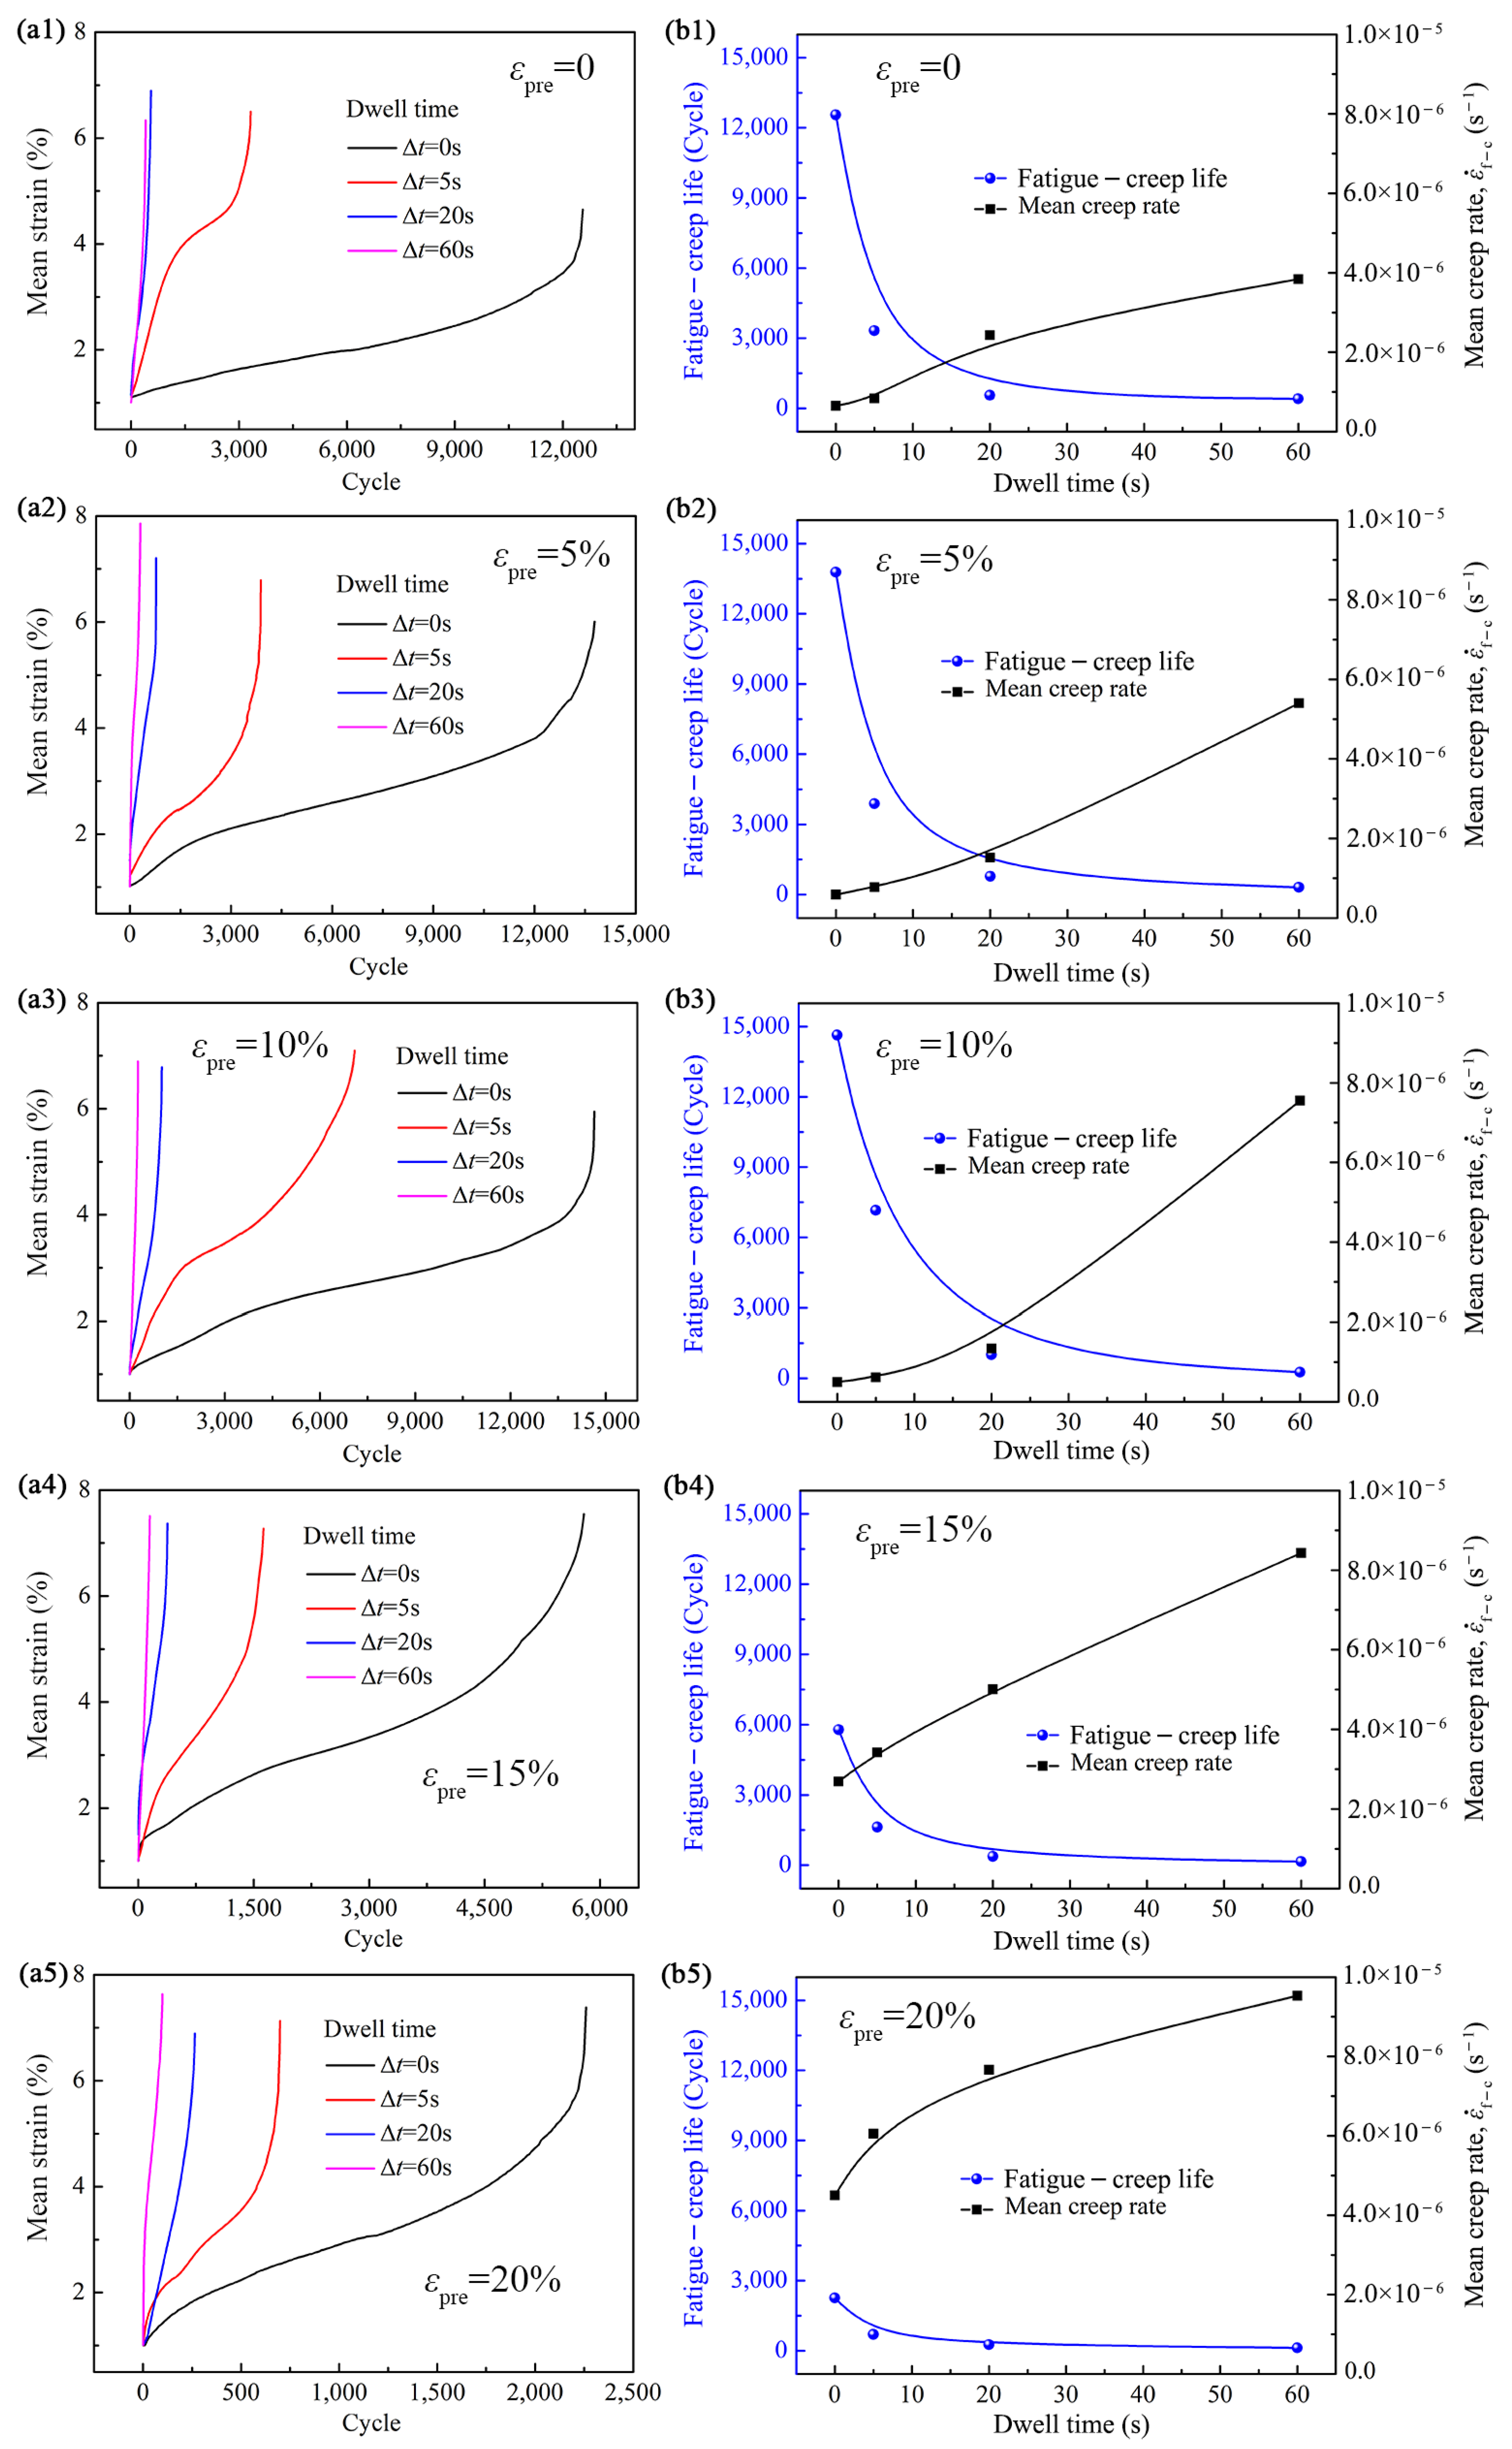
3.4. Fatigue–Creep Properties After Different Pre-Hoop Expansion Deformations

Figure 7(a1–a7) are the fatigue–creep curves after different pre-hoop expansion deformations under different stress ratios when the maximum cyclic stress is 276 MPa and the dwell time is 20 s at 400 °C. When the stress ratio approaches 0.1, deformation tends to be controlled by fatigue, while when the stress ratio approaches 0.9, deformation tends to be controlled by creep. Therefore, the stress ratio range is selected from 0.1 to 0.9. Here, the fatigue–creep curves refer to the variation curves of the mean strain with the number of the cycles. The mean strain is the average of the maximum strain and the minimum strain within a single cycle. The data of fatigue–creep properties determined from Figure 7(a1–a7) are listed in Table 2. Based on the data in Table 2, the role of the pre-hoop expansion deformation and the stress ratio on the fatigue–creep properties are obtained and shown in Figure 7(b1–b7) and Figure 7(c1–c5), respectively. Figure 7(b1–b7) show that when the stress ratio is less than 0.7, the fatigue–creep life (the cycle number of sample fracture) first increases, and then decreases when the pre-strain exceeds 10%. When the stress ratio is greater than or equal to 0.7, the cycle life decreases monotonically. It can be obtained from Figure 7(c1–c5) that with the stress ratio increase, the cycle life first increases, and then decreases when the stress ratio exceeds 0.7. The variations in mean creep rate with the pre-strain or the stress ratio are opposite to that of the fatigue–creep life.
A scatter plot is obtained using the logarithm of mean creep rate (lnέf-c) and the logarithm of creep life (Nf-c), as shown in Figure 8. It can be seen that the logarithm of creep life varies linearly with the logarithm of mean creep rate. The linear equation is obtained as shown in Equation (11), which can be used to predict the fatigue–creep life.
lnNf-c = −4.31 − 1.37lnέf-c (R2 = 0.95)
Figure 9(a1–a5,b1–b5) are the effect of the dwell time on the fatigue–creep curves and the fatigue–creep properties of zirconium plate under the maximum cyclic stress of 276 MPa and the stress ratio of 0.1 at 400 °C. It can be seen that with the increase in the dwell time, the cycle life decreases while the mean creep rate increases monotonically. This is because as the holding time increases, the time for the highest cyclic load within a single cycle increases and the strain within a single cycle increases, leading to an increase in creep rate and a decrease in creep life. The fatigue–creep data with different pre-hoop expansion strains under different dwell times are listed in Table 3.
According to the data in Table 3, prediction equations for fatigue–creep life with different dwell time (Δt) can be obtained. Different pre-hoop expansion strains correspond to different prediction equations, as shown in Equations (12)–(16). Equations (12)–(16) show linear relationships between fatigue–creep life and the effective dwell time which is equal to the dwell time (Δt) divided by the total time of a single cycle (tp, in this paper, tp = Δt + 2). Similar prediction equations of fatigue–creep life have been reported by Long et al. [27].
Nf-c = −12846.87(Δt/tp) + 12533.44 (εpre = 0) (R2 = 0.99)
Nf-c = −14064.96(Δt/tp) + 13799.99 (εpre = 5%) (R2 = 0.99)
Nf-c = −14557.11(Δt/tp) + 15199.69 (εpre = 10%) (R2 = 0.92)
Nf-c = −5873.92(Δt/tp) + 5793.26 (εpre = 15%) (R2 = 0.99)
Nf-c = −2204.70(Δt/tp) + 2262.91 (εpre = 20%) (R2 = 0.99)
According to the data in Table 3, the variation in fatigue–creep properties with the pre-hoop expansion strain when the dwell time is 0 s, i.e., in the case of pure fatigue deformation, can also be obtained, as shown in Figure 10. It can be seen that with the pre-strain increase, the fatigue–creep life first increases, and then decreases as the pre-strain exceeds 10%.

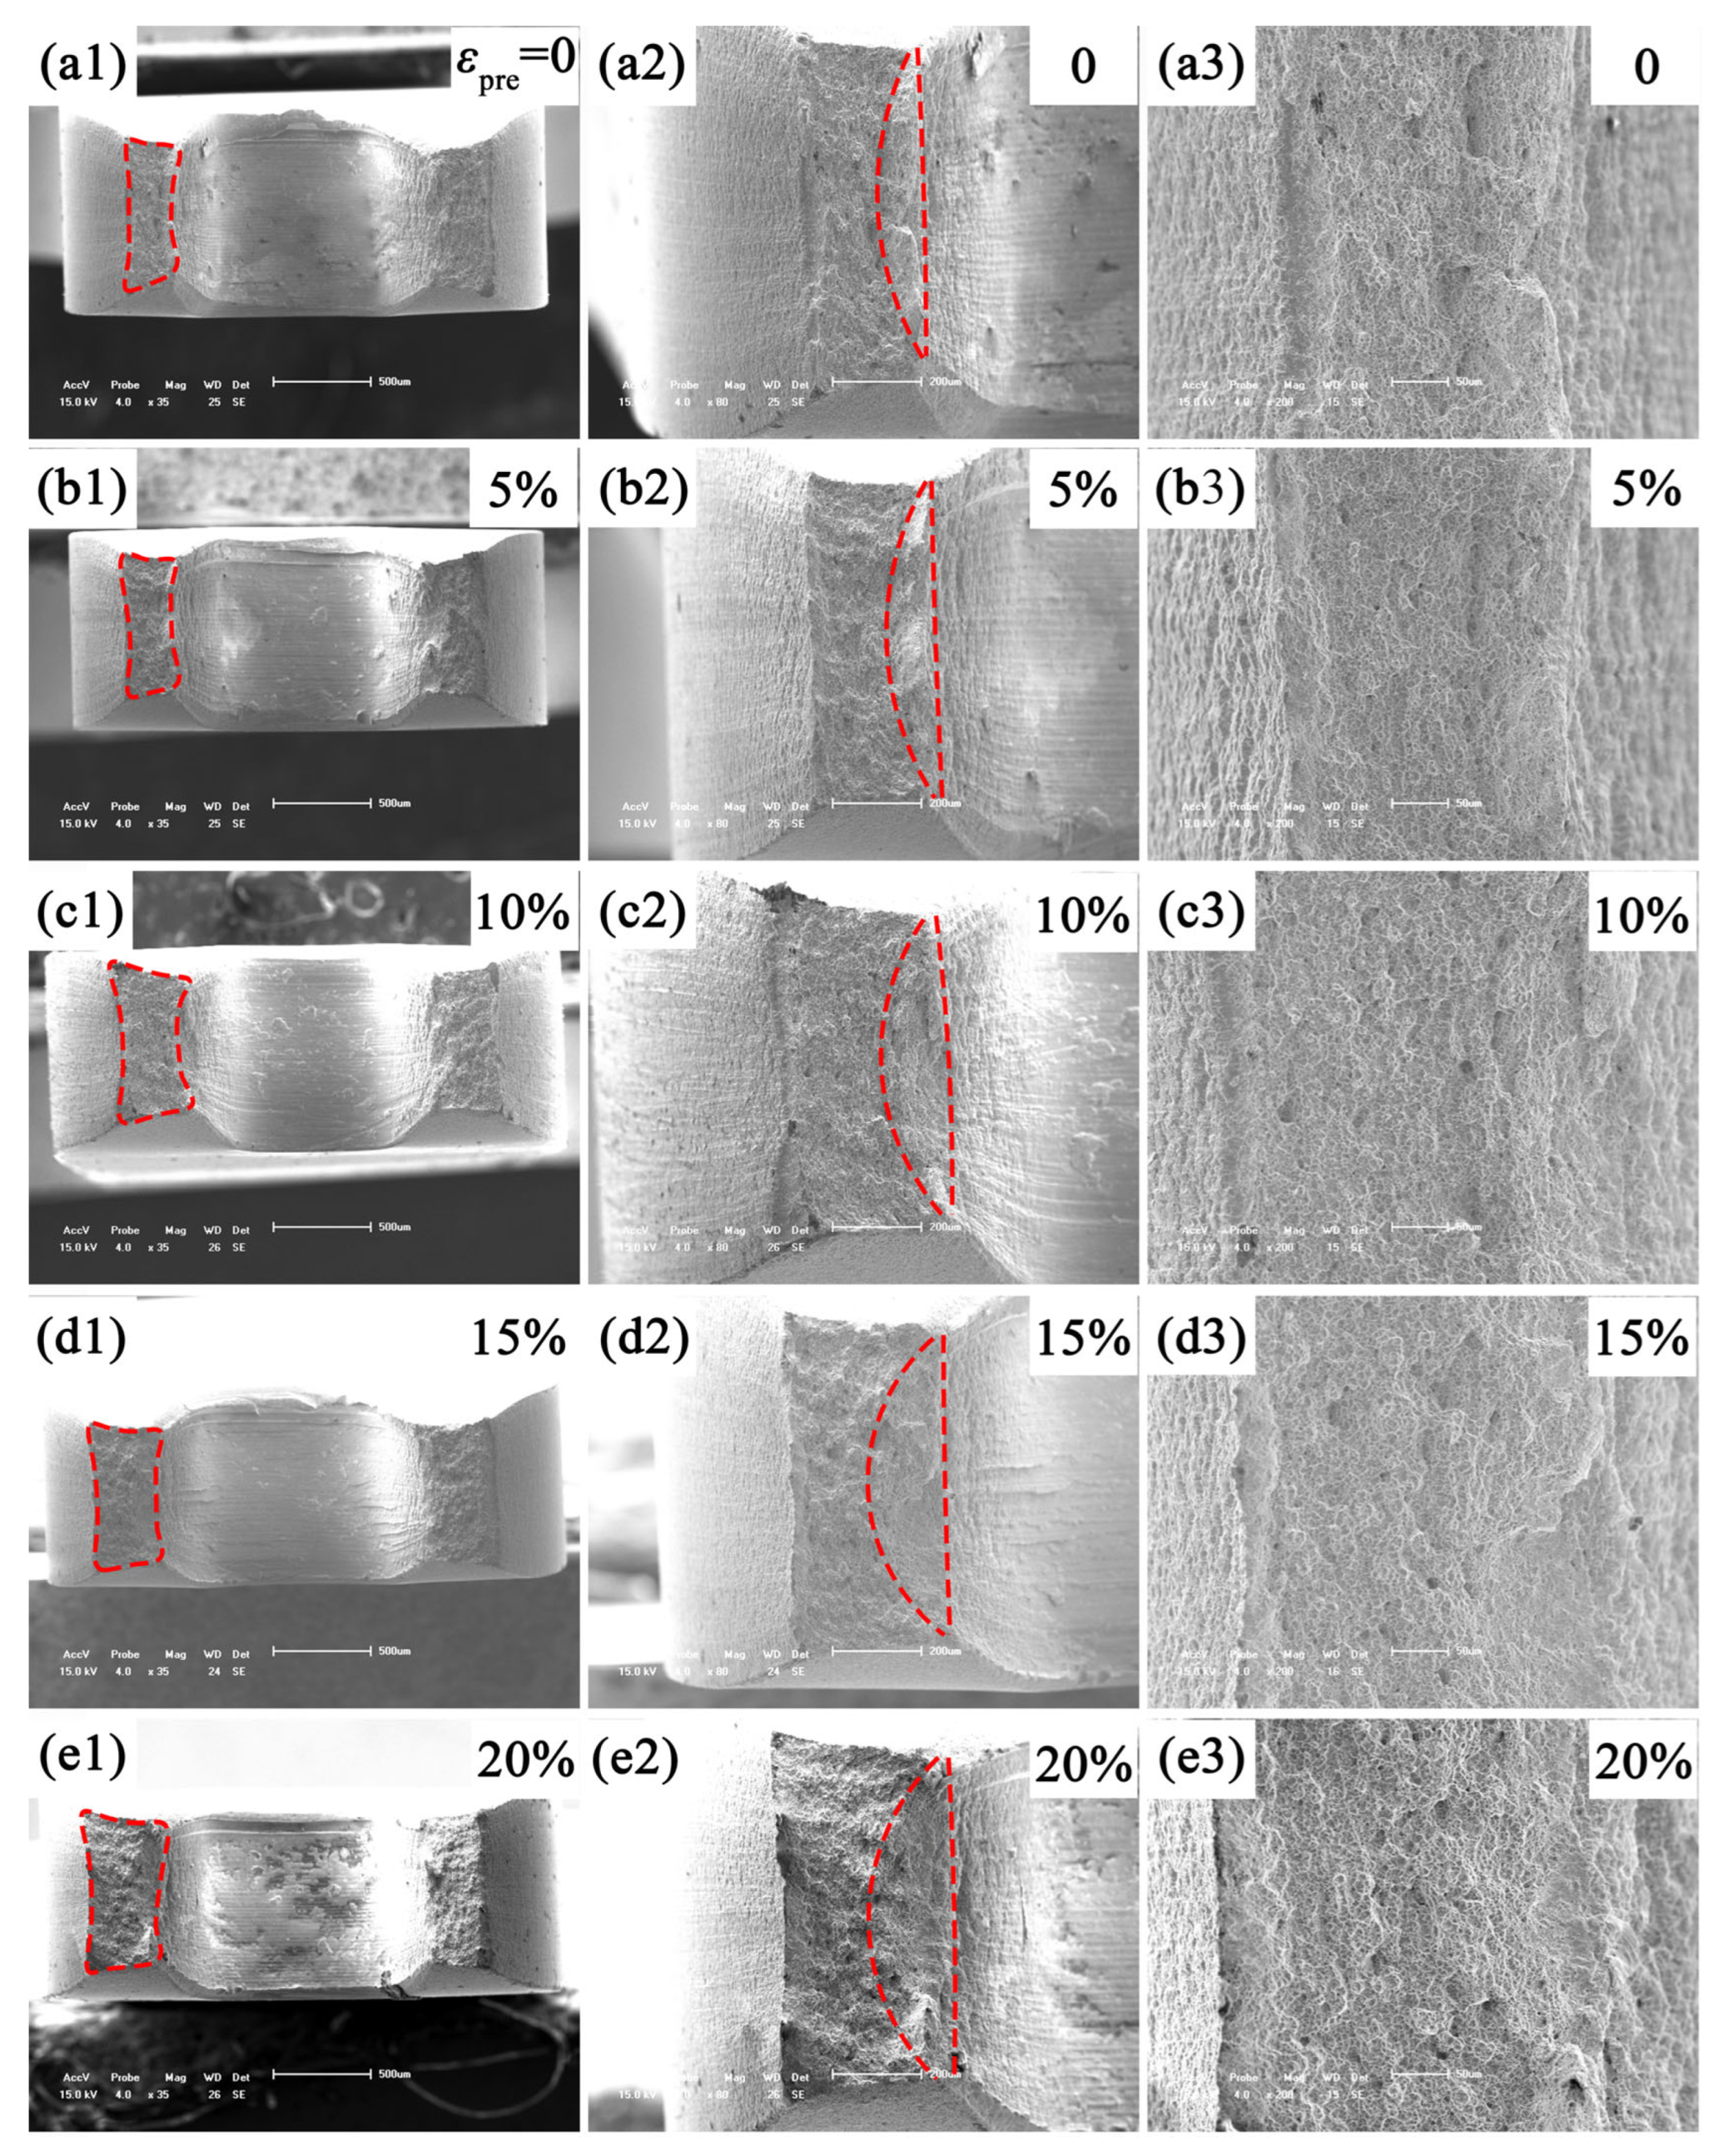
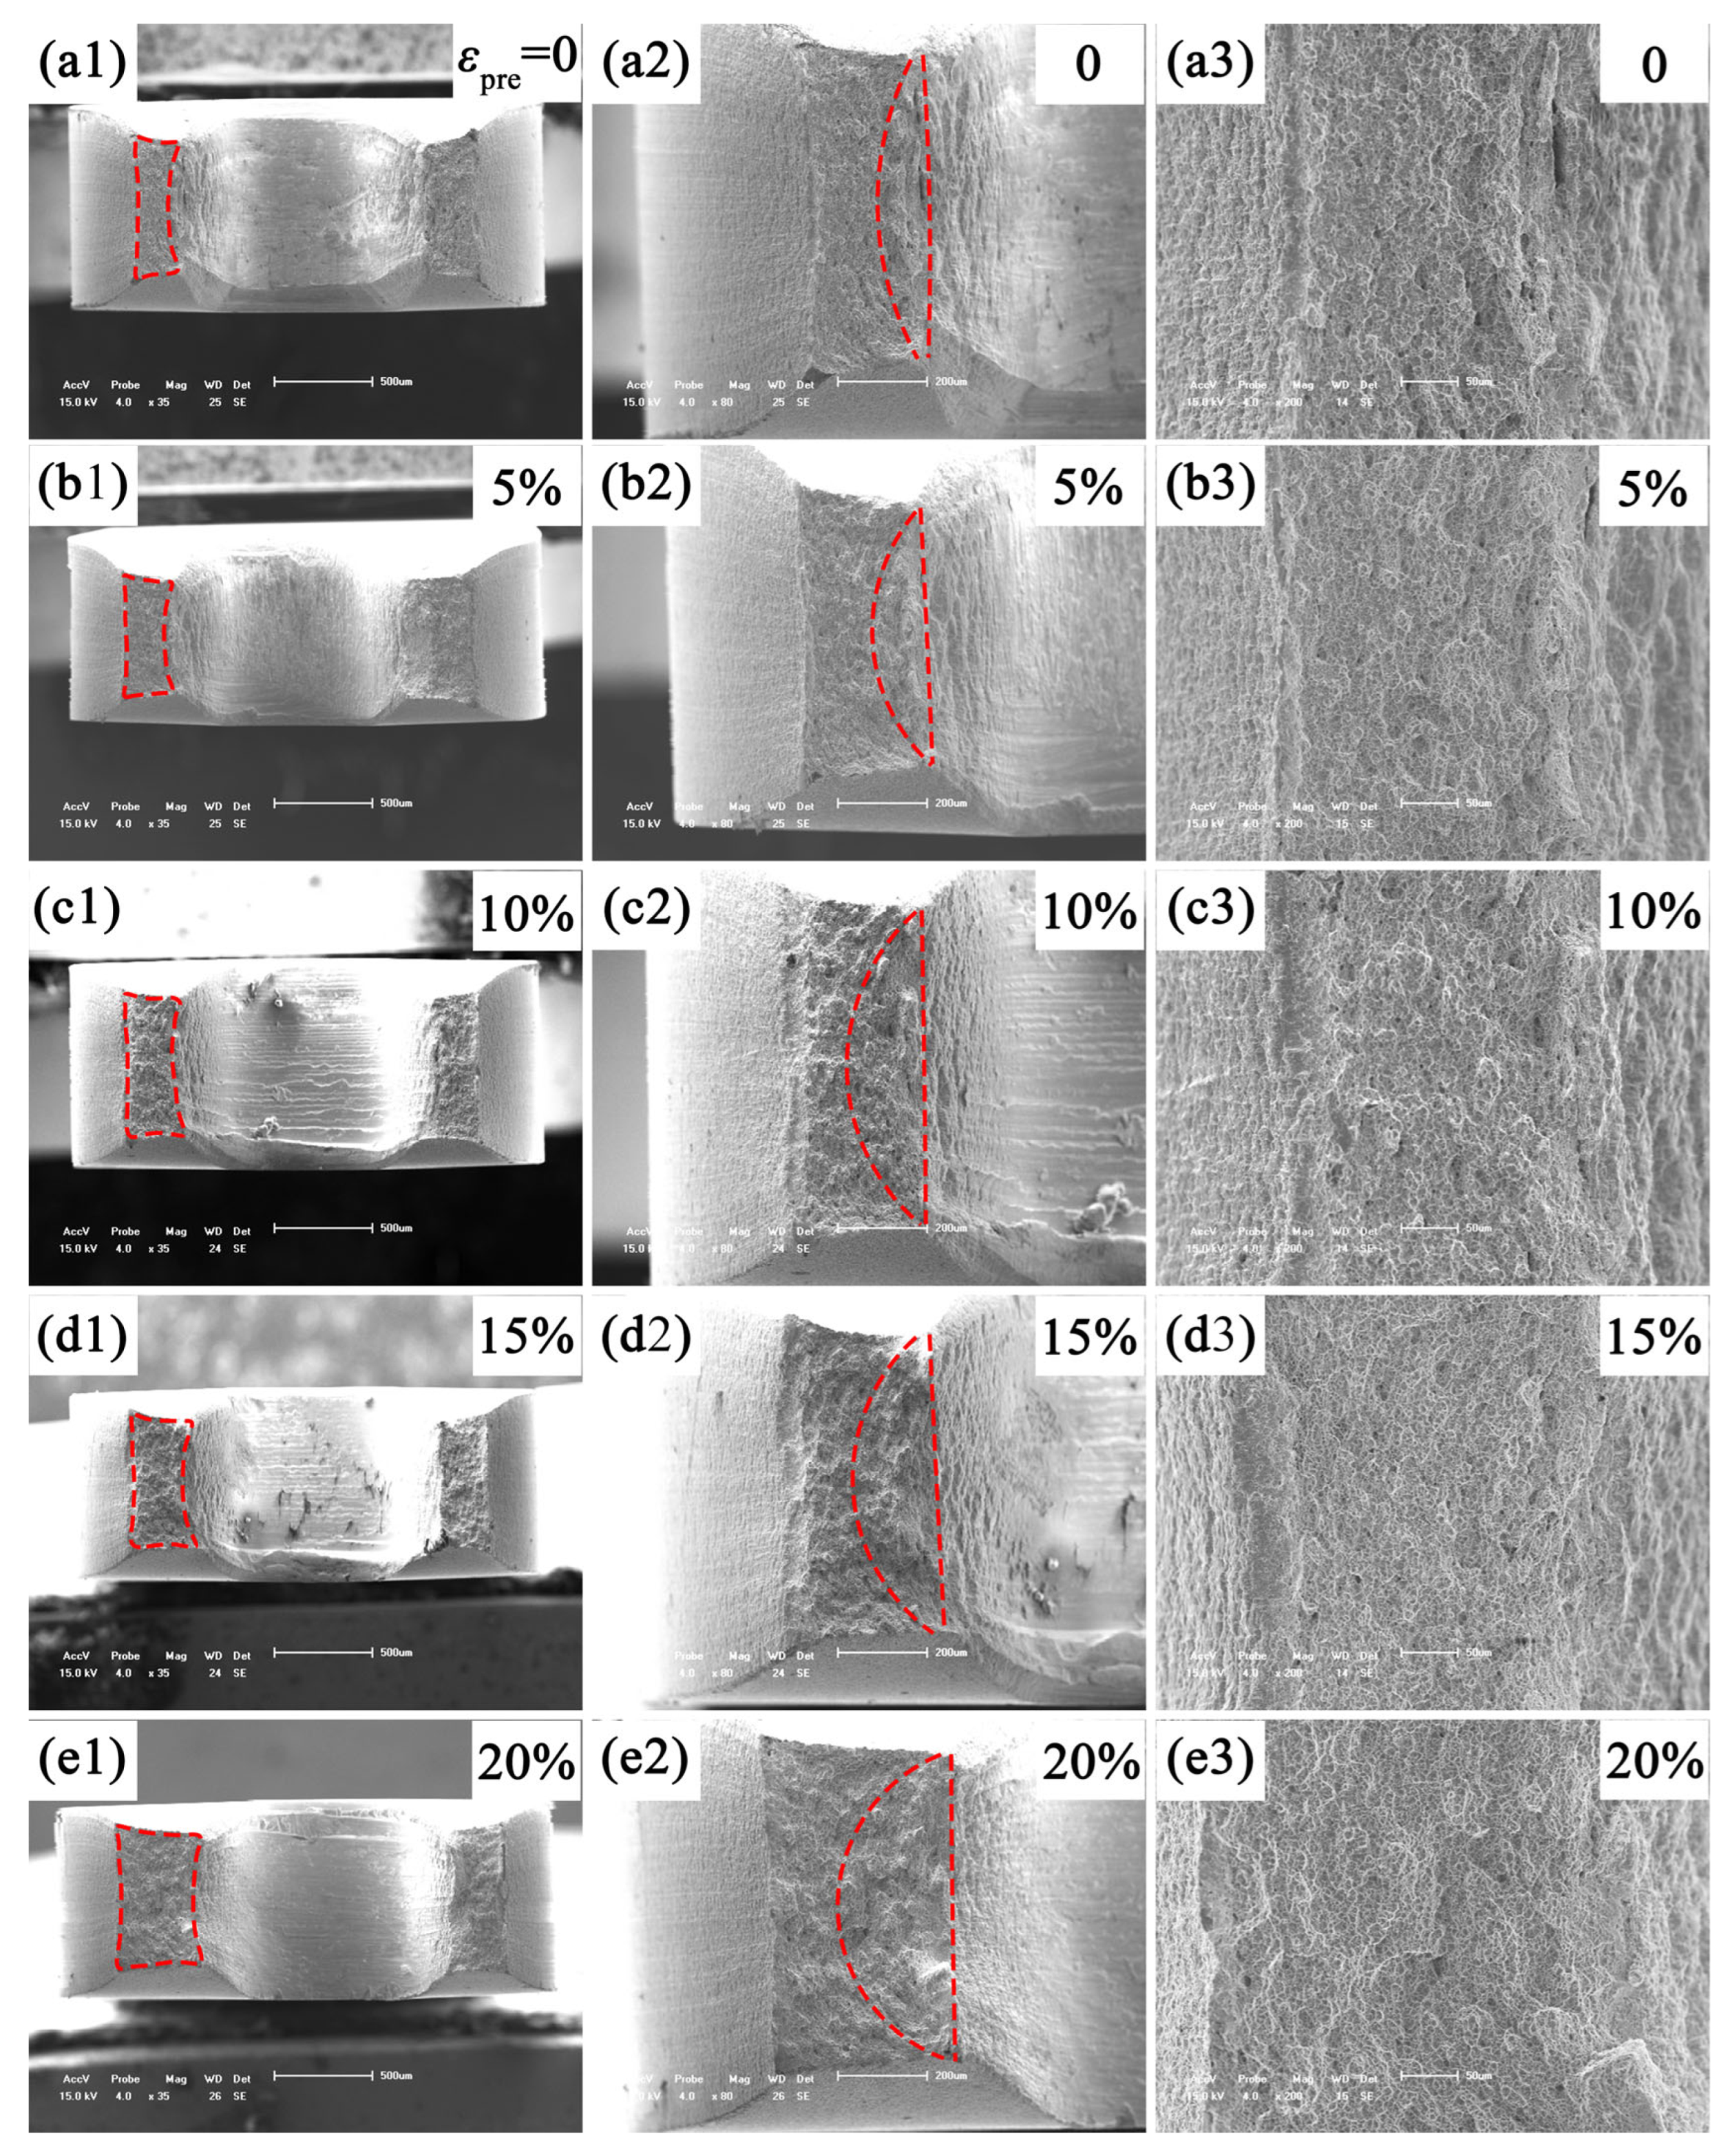
3.5. Fracture Surfaces Observation

Figure 11 shows the tensile fracture surfaces of zirconium plates with different pre-hoop expansion strains at 400 °C. It can be seen from Figure 11(a1–e1) that, with the pre-strain increase, the area of the fracture surface increases, indicating that the necking degree of the specimen is suppressed, as marked in red dashed line regions. As the pre-hoop expansion strain is 0, 5%, 10%, 15%, and 20%, the reduction in area of the tensile fracture surface are 60.2%, 57.8%, 42.4%, 35.3%, and 20.4%, respectively. Figure 11(a2–e2) show that with the pre-strain increasing, the region of crack initiation and propagation decreases, as shown in red dashed lines, where the crack propagates beyond this region, the crack propagation rate dramatically increases, and the specimen quickly fractures. It can be seen that, from Figure 11(a3–e3), with the pre-strain increase, the fracture surface becomes flatter, and the dimple depth becomes shallower, indicating that the plasticity of the specimen decreases.
Figure 12 shows the creep fracture surfaces of zirconium plates with different pre-hoop expansion strains under the creep stress of 276 MPa at 400 °C. From Figure 12(a1–e1), it can be seen with the pre-strain increase, the necking degree of the specimen is suppressed, as indicated in red line regions. As the pre-hoop expansion strain is 0, 5%, 10%, 15%, and 20%, the reduction in area of the creep fracture surface are 80.5%, 74.3%, 61.8%, 53.6%, and 40.8%, respectively. Figure 12(a2–e2) show that with the pre-strain increasing, the region of crack initiation and propagation increases, as marked by red dashed lines. From Figure 12(a3–e3), with the pre-strain increase, the dimples on the fracture surface increase, indicating the creep deformation becomes more severe.
Figure 13 and Figure 14 are the fatigue–creep fracture surfaces of zirconium plates under the stress ratio of 0.1 and 0.7 at 400 °C, respectively. The maximum cyclic stress is 276 MPa and the dwell time is 20 s. Compared with tensile and creep fractures, it can be obtained that when the stress ratio is 0.1, the fatigue–creep fractures are similar to the tensile fractures, except that the region of crack initiation and propagation first decreases and then increases. When the stress ratio is 0.7, the fatigue–creep fractures are similar to the creep fractures.

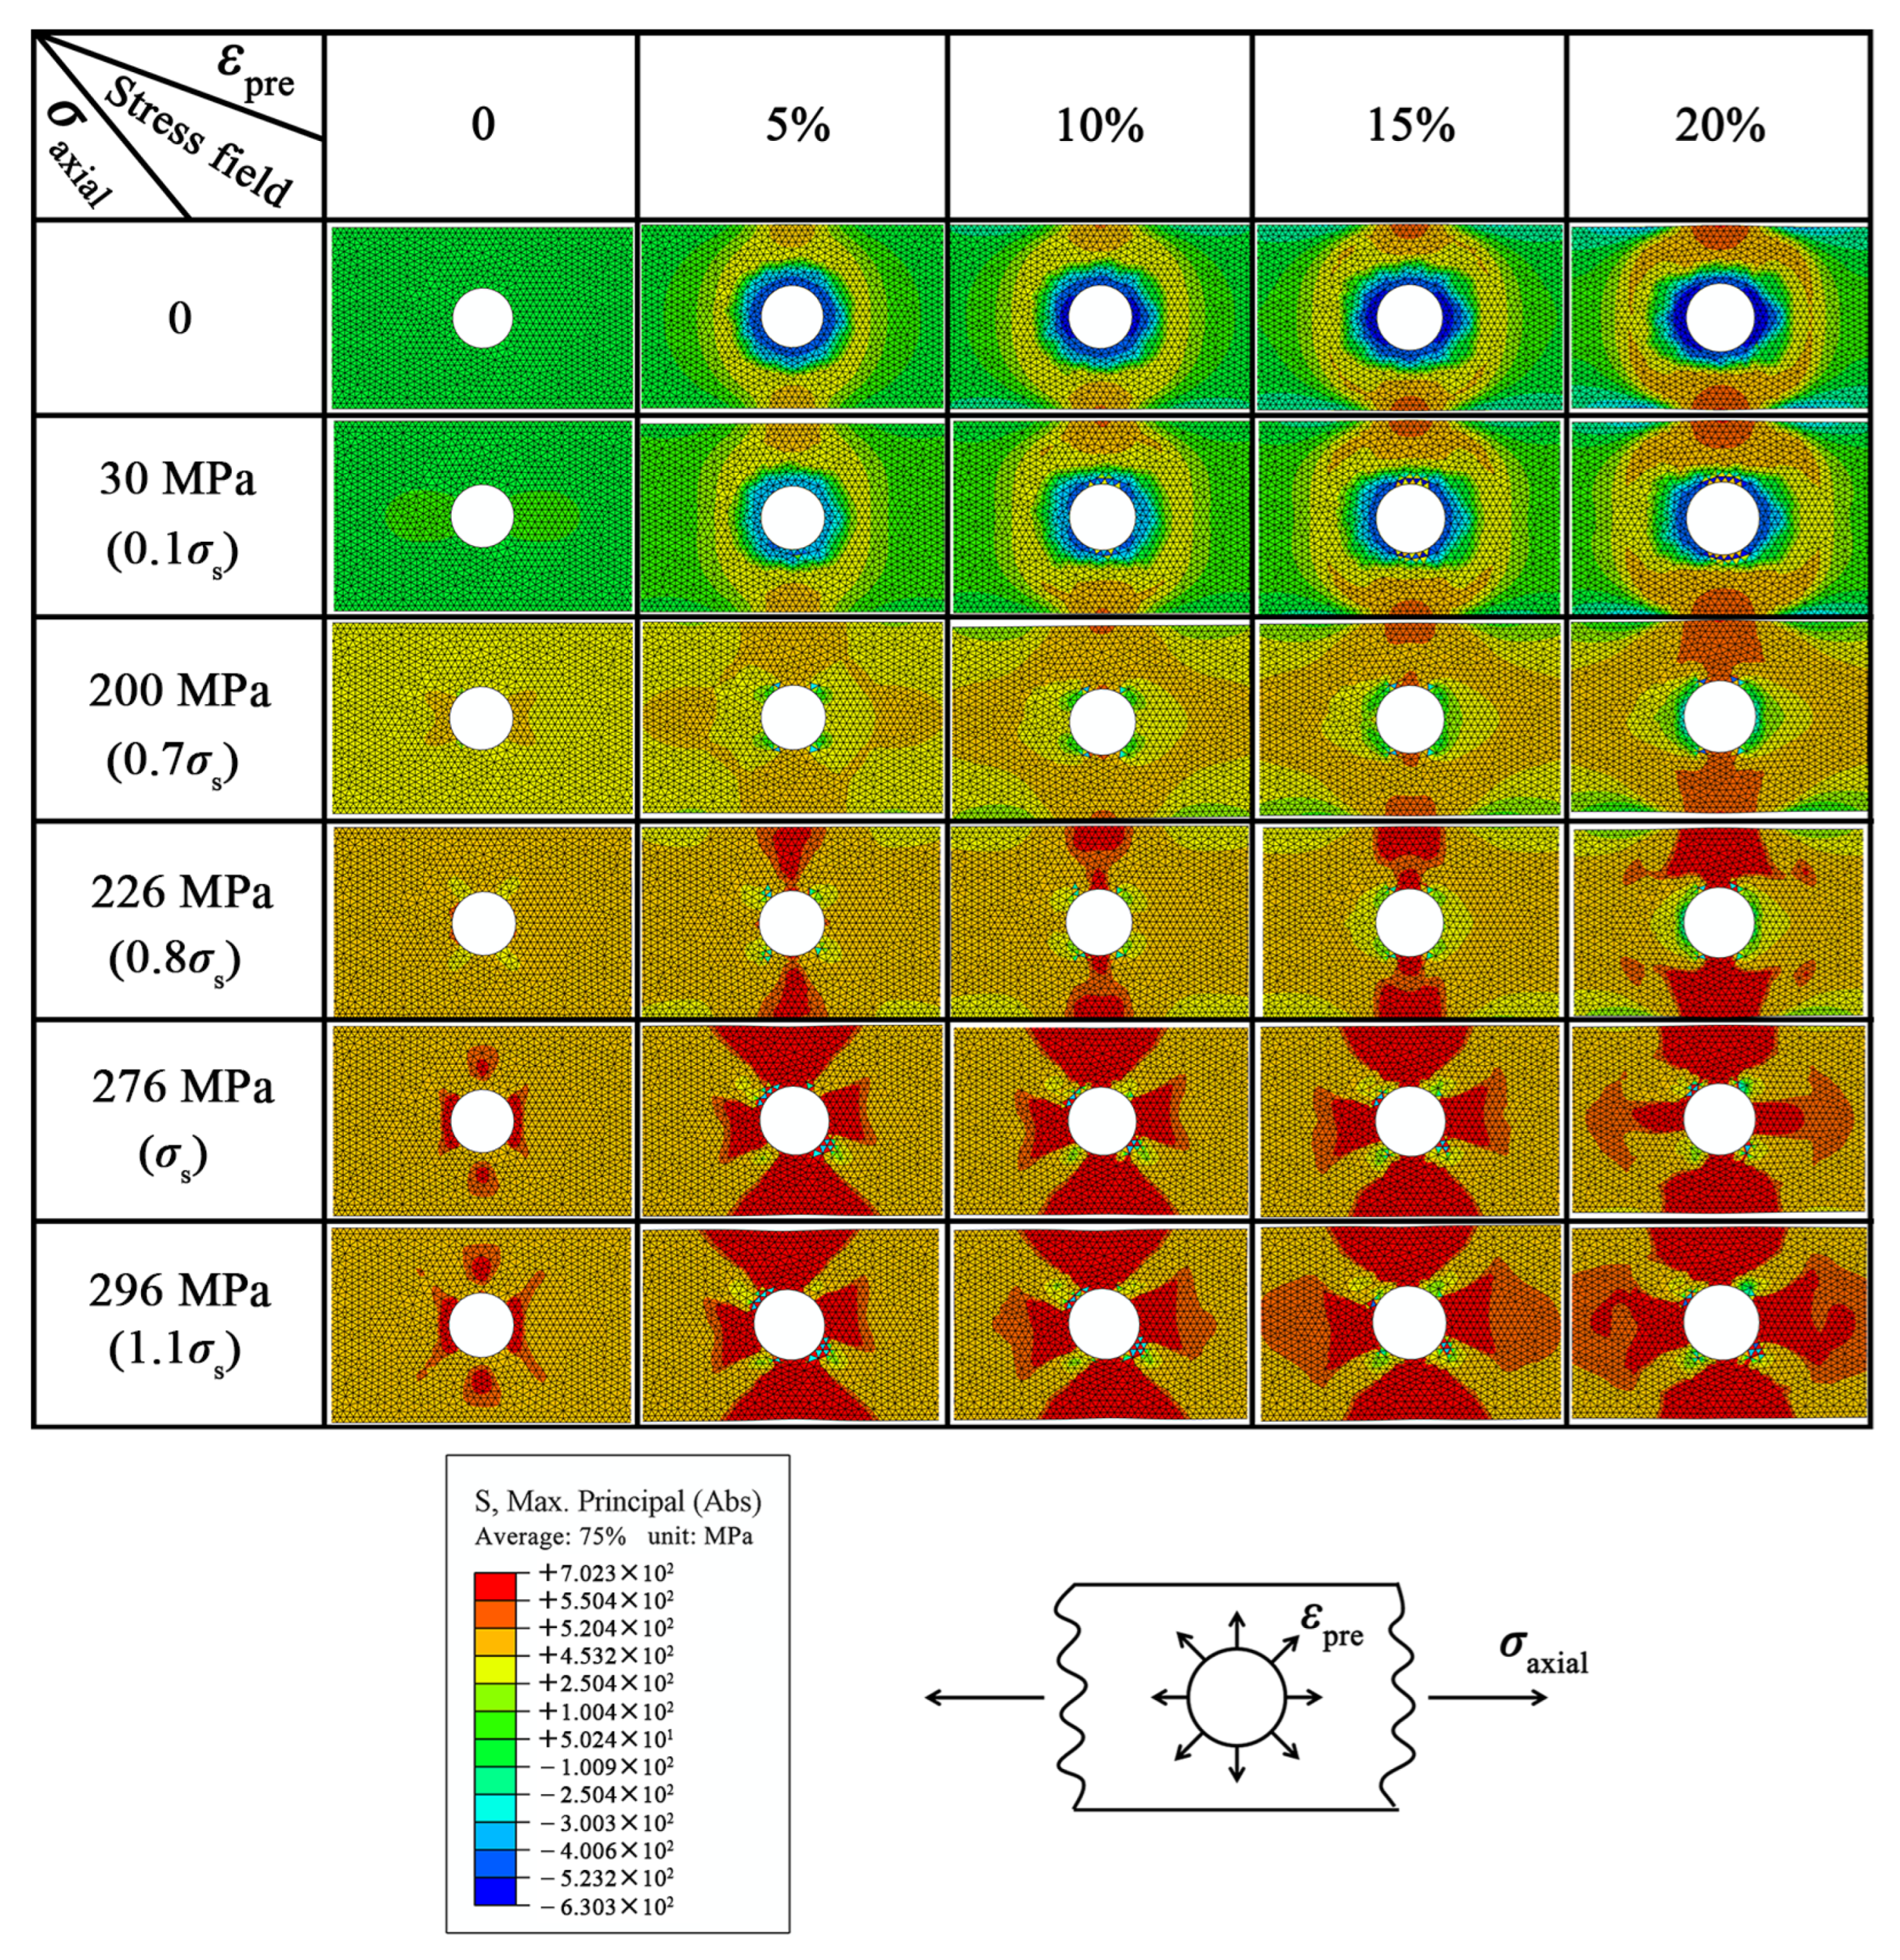
3.6. The Stress Field Distributions Around the Center-Hole of Samples with Different Pre-Hoop Expansion Strains and Axial Stresses

The stress field distributions around the central hole of specimens with different pre-hoop expansion strains (εpre) at different applied axial stresses (σaxial) at 400 °C are simulated, and the results are shown in Figure 15. The zirconium alloy used in the finite element simulation has an elastic modulus of 97.3 GPa and a Poisson’s ratio of 0.33 at 400 degrees Celsius, and the plastic parameters are a series of points on the true stress–strain curve. The initial conditions for simulation are that the displacement of the circular hole and the specimen is 0, and the load condition is the stress applied to the two clamping ends. It can be seen that, at the applied axial stress of 0 MPa (σaxial = 0), with the pre-hoop expansion strain increase, the stress field distribution around the central hole gradually changes from a stress-free state (εpre = 0) to a compressive stress state (cold color stress zone), with a stress transition zone (green stress zone) and a tensile stress zone (warm color stress zone). With the pre-hoop expansion strain increase, the degree of the compressive stress at the center-hole root and the tensile stress at the specimen edges gradually increase. As the pre-hoop expansion strain is 5%, 10%, 15%, and 20%, the compressive stress (σroot) is about −463 MPa, −513 MPa, −553 MPa, and −582 MPa, respectively, while the tensile stress (σedges) is about 427 MPa, 473 MPa, 514 MPa, and 566 MPa, respectively, both showing good linear variations with the pre-hoop expansion strain increase. The linear relationships are shown in Equations (17) and (18). In addition, it is worth noting that as the pre-hoop expansion strain exceeds 10%, the tensile stress at the specimen edges significantly increases (the color of the stress zone changes from orange to red).
σroot = −425.5 − 7.94εpre (R2 = 0.98)
σedges = 380.5 + 9.16εpre (R2 = 0.99)
At the applied axial stress of 30 MPa (about 0.1σs), the stress field distributions around the central hole are similar to that of σaxial = 0, but the compressive stress is less than that of σaxial = 0 due to the tensile stress concentration.
At the applied axial stress of 200 MPa (about 0.7σs), the compressive stress is transformed into tensile stress under the action of the stress concentration, and with the pre-hoop expansion strain increase, the tensile stress around the central hole converges with the tensile stress at the specimen edges, which further increases the tensile stress in the narrow width direction of the specimen. Here, the narrow width direction refers to the direction of the minimum section width of the specimen and is perpendicular to the axial direction.
For the finite width sheet specimen with a central hole, the stress concentration factor (Kt) at the center-hole root in the narrow width direction can be obtained from Equation (19) [28].
Kt = 0.284 + 2/(1 − d/W) − 0.600(1 − d/W) + 1.32(1 − d/W)2
Here d is the diameter of the center-hole (unit: mm) and W is the width of the specimen (unit: mm). In this paper, W is 3 mm.
When the pre-hoop expansion strain is 0, 5%, 10%, 15%, and 20% and the diameter of the central hole (d) is 1 mm, 1.05 mm, 1.10 mm, 1.16 mm, and 1.22 mm. According to Equation (19), the stress concentration factor (Kt) is 3.47, 3.53, 5.59, 3.67, and 3.76., i.e., with the pre-hoop expansion strain increase, the stress concentration factor at the central hole in the narrow width direction increases slightly. Thus, the tensile stress at the specimen edges caused by the pre-hoop expansion deformation plays an important role in the increase in the tensile stress in the narrow width direction of specimens.
When the applied axial stress is 226 MPa (about 0.8σs), with the pre-hoop expansion strain increase, the degree of the tensile stress in the narrow width direction of the specimen increases. When the applied axial stress increases to 276 MPa (about σs), significant tensile stress appears in the axial direction of the specimen, and with the pre-hoop expansion strain increases, the axial stress gradually increases. When the applied axial stress continues to increase to 296 MPa (about 1.1σs), with the pre-hoop expansion strain increasing, the axial stress gradually increases more significantly.

4. Discussion

4.1. The Role of the Pre-Hoop Expansion Deformation on the Tensile Properties at 400 °C

The high-temperature tensile results in Figure 4 show that with the pre-hoop expansion strain increase, the yield strength and the ultimate strength increase linearly, while the elongation decreases linearly. During this expansion deformation, the grain fragmentation takes place. Grain fragmentation leads to a decrease in grain size, which improves the strength of zirconium plates at 400 °C. As the pre-hoop expansion increases, there is no significant grain orientation change. As is well known, pre-deformation usually increases the yield strength and the ultimate strength and decreases the plasticity. However, regarding the linear variations in the tensile properties, we speculate that it is related to the stress distribution of specimen. The pre-hoop expansion deformation can introduce a compressive stress zone at the central hole root. For metal materials, compressive stress is usually beneficial for the mechanical properties [29,30]. According to the stress field simulation results, with the pre-hoop expansion strain increase, the compressive stress at the center-hole root increases linearly, which has a synchronous change with the increase in the yield strength and the ultimate strength. Thus, the compressive stress at the central hole root can be considered as the main reason for the linear variations in the tensile strengths and the elongation with the pre-hoop expansion strain, respectively.
In addition, the compressive stress introduced by the pre-hoop expansion deformation can also suppress the initiation and propagation of cracks, reducing the region of crack initiation and propagation, as can be seen from the fracture surfaces in Figure 11(a2–e2).

4.2. The Role of the Pre-Hoop Expansion Deformation on the Creep Properties of Zirconium Plates at 400 °C

The high-temperature creep results in Figure 5 indicate that with the pre-hoop expansion strain increase, creep life decreases, especially as the creep stress exceeds 276 MPa. Based on the results of the stress filed simulation in Figure 15, the tensile stress in the narrow width direction of the specimen gradually increases. This increasing tensile stress in the narrow width direction can be considered as the reason for the increase in the creep rate and the decrease in the creep life. A portion of the tensile stress in the narrow width direction of the specimen is harmful for creep properties. This negative effect of the pre-hoop expansion deformation on creep properties can also be seen from the fracture surfaces in Figure 12(a2–e2), which show that with the pre-hoop expansion strain increase, the region of creep crack initiation and propagation increases, indicating an increase in the creep rate.
When the creep stress is higher than 276 MPa, not only the tensile stress in the narrow width direction, but also the tensile stress in the axial direction appears, which results in the dramatic decrease in the creep life.

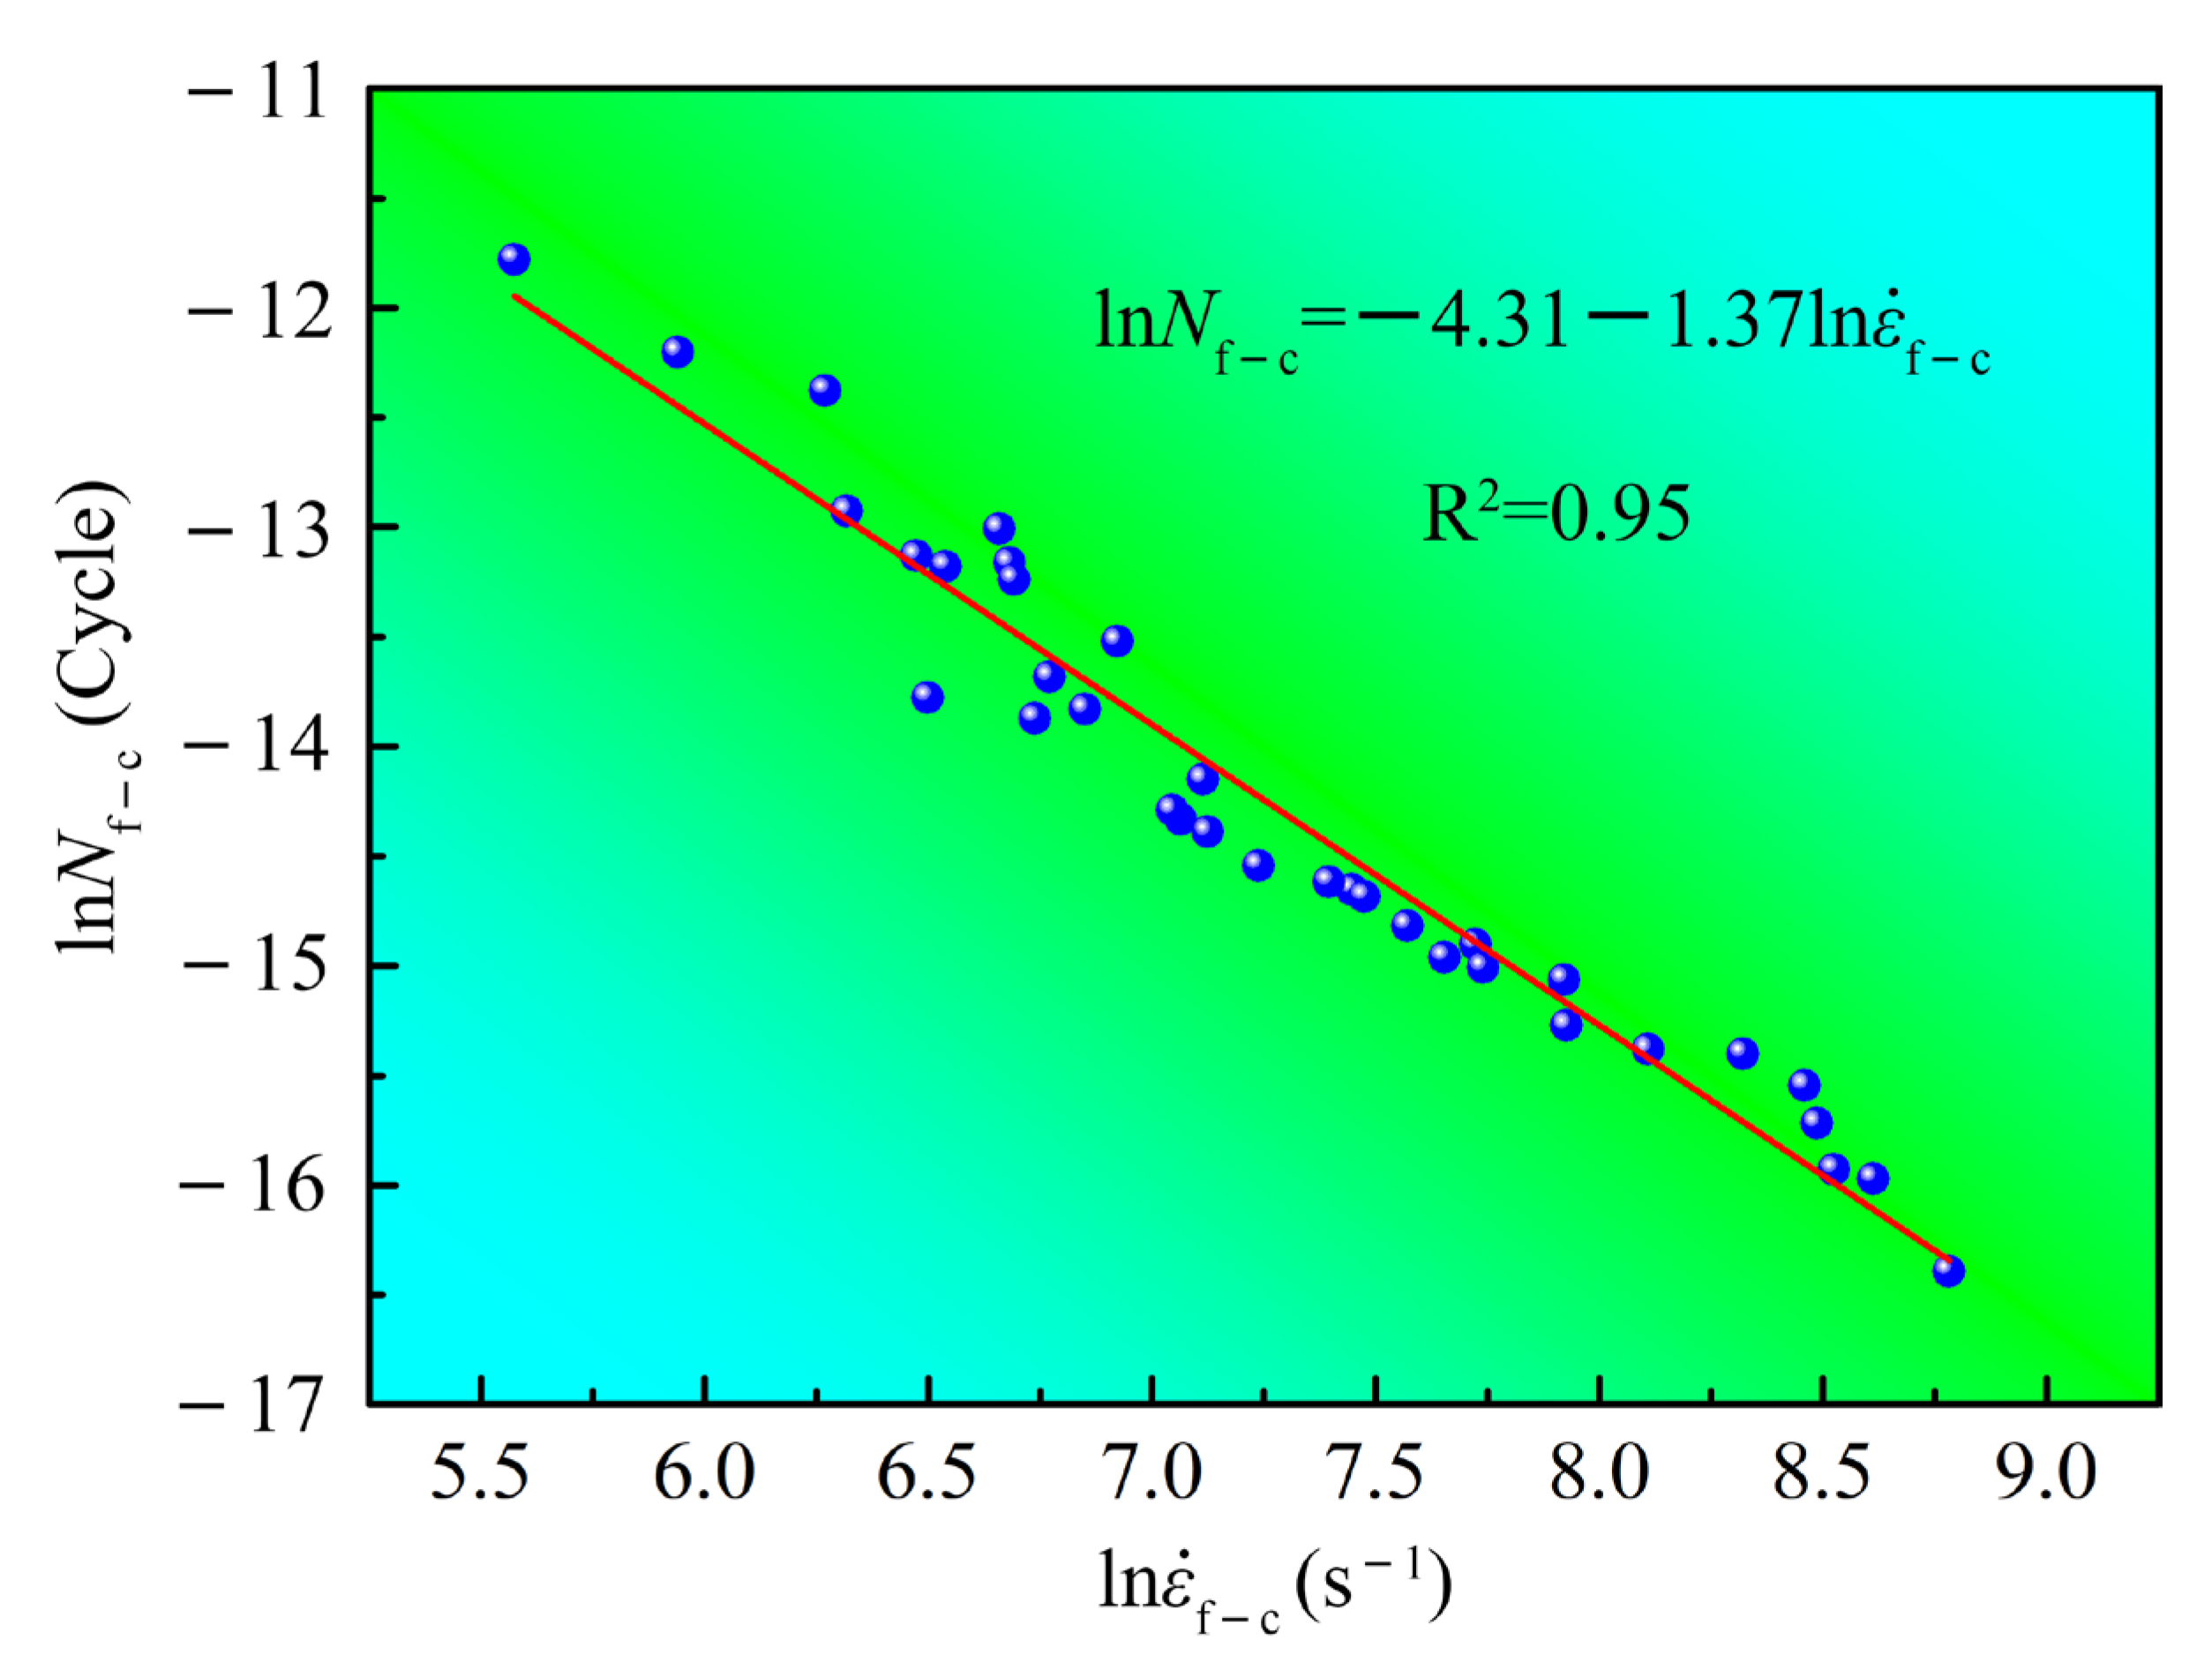
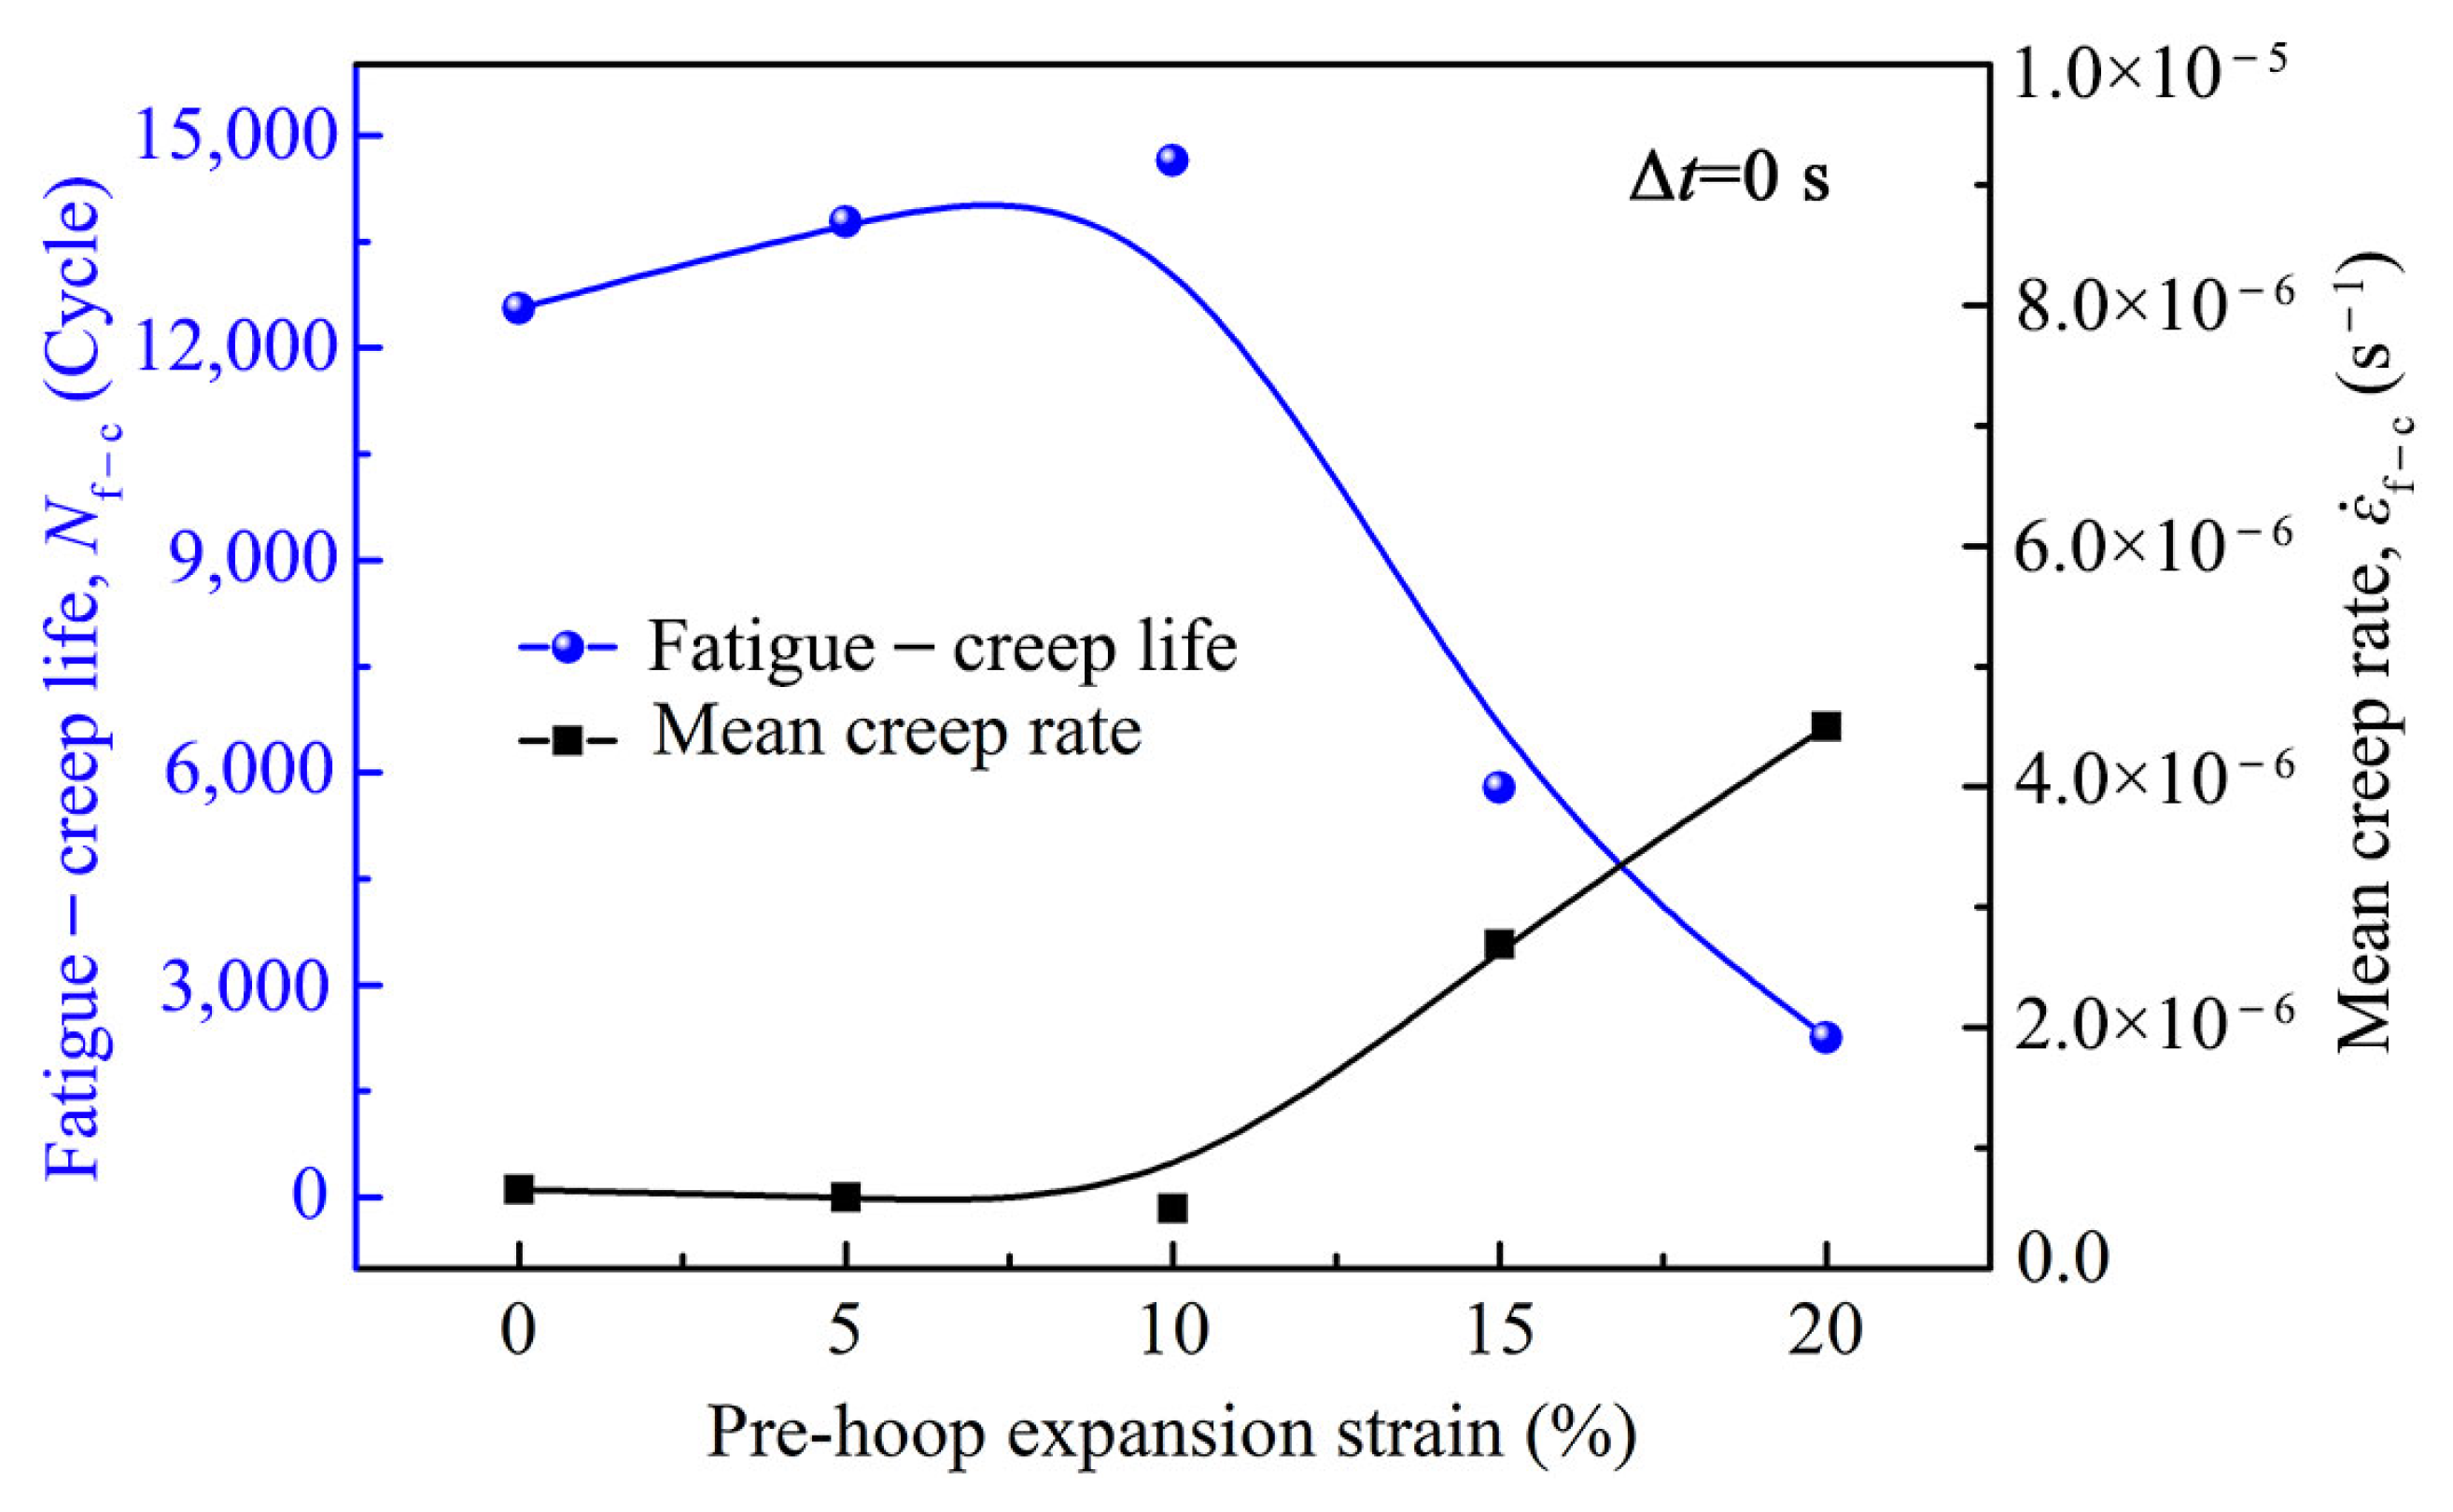
4.3. The Role of the Pre-Hoop Expansion Deformation on the Fatigue–Creep Properties at 400 °C

The fatigue–creep results in Figure 7(b1–b7) show that with the pre-hoop expansion strain increase, when the stress ratio was less than 0.7, the fatigue–creep life first increased and then decreased. Meanwhile, when the stress ratio was higher than 0.7, the fatigue–creep life decreased monotonically.
From Figure 11, Figure 12, Figure 13 and Figure 14, as the stress ratio is 0.1, the fatigue–creep fractures are similar to the tensile fractures, while as the stress ratio is 0.7, the fatigue–creep fractures are similar to the creep fractures. It can be inferred that when the stress ratio is less than 0.7, the fatigue–creep deformation may be related to the tensile deformation, while when the stress ratio is higher than 0.7, the fatigue–creep deformation may be related to the creep deformation. That is, with the stress ratio increasing, the influence of fatigue on the fatigue–creep deformation decreases while the influence of creep increases gradually [31,32].
For the fatigue–creep deformation with the stress ratio less than 0.7, when the pre-hoop expansion strain is less than 10%, with the increase in the pre-hoop expansion strain, the fatigue–creep life increases. This may be related to the strengthening effect due to the compressive stress at the root of the central hole, just like the influence of the compressive stress on the tensile strength. Meanwhile, when the pre-hoop expansion strain is higher than 10%, with the increase in the pre-hoop expansion strain, the fatigue–creep life decreases. This may be related with the tensile stress at the specimen edges, as shown in Figure 15. The significant tensile stress at the specimen edges will impact the homogeneity of fatigue–creep deformation, which leads to a decrease in fatigue–creep life [33].
Based on above analysis, it can be concluded that the compressive stress at the center-hole root is beneficial for the mechanical properties, while the tensile stress at the specimen edges is harmful for the mechanical properties. For fatigue–creep properties, there is a competitive relationship between the compressive stress and the tensile stress, and when certain conditions are met, one of them dominates, leading to an increase or decrease in the fatigue–creep property.

5. Conclusions

  • The high-temperature tensile results indicated that with the hoop expansion strain increase, the yield strength and ultimate strength increased linearly, while the elongation decreased linearly.
  • The creep results indicated that with the pre-hoop expansion strain increase, the creep life decreased, especially as the creep stress exceeded 276 MPa.
  • The fatigue–creep results implied that as the stress ratio was less than 0.7, the fatigue–creep deformation process was dominated by fatigue, and with the pre-hoop expansion strain increase, the fatigue–creep life first increased, and then decreased as the pre-hoop expansion strain exceeded 10%. Meanwhile, as the stress ratio was higher than 0.7, the fatigue–creep deformation process was dominated by creep, and with the pre-hoop expansion strain increase, the fatigue–creep life decreased monotonically.
  • The stress field simulation indicated that after the pre-hoop expansion deformation, there appeared a compressive stress zone at the root of the central hole, a tensile stress zone at the edges, and a stress transition zone in the middle. The compressive stress was beneficial for high-temperature mechanical properties, while the tensile stress was harmful for the high-temperature mechanical properties of zirconium plates.
  • The fracture surface results showed that with the pre-hoop expansion deformation increase, the necking degree on the fracture surface gradually decreased. When the stress ratio was 0.1, the fatigue–creep fractures were similar to the tensile fractures, while when the stress ratio was 0.7, the fatigue–creep fractures were similar to the creep fractures.
  • The variation equations of high-temperature tensile properties with the pre-hoop expansion strain were obtained. Some life prediction equations for creep deformation and fatigue–creep deformation were also obtained.

Author Contributions

Conceptualization, X.S.; methodology, H.Q. and L.Y.; software, H.Q. and L.Y.; validation, H.Q. and L.Y.; formal analysis, X.S. and H.Q.; investigation, H.Q.; resources, X.S. and L.Y.; data curation, H.Q. and L.Y.; writing—original draft preparation, H.Q.; writing—review and editing, X.S. and L.Y.; visualization, H.Q.; supervision, X.S. and L.Y.; project administration, X.S.; funding acquisition, X.S. All authors have read and agreed to the published version of the manuscript.

Funding

This research was funded by National Key Research and Development Program of China, grant number No. 2023YFB3710401 and No. 2023YFB3710403.

Data Availability Statement

The original contributions presented in this study are included in the article. Further inquiries can be directed to the corresponding author.

Acknowledgments

The authors gratefully acknowledge technical support from Shimadzu (China) Co., Ltd. (Beijing, China).

Conflicts of Interest

The authors declare that they have no known competing financial interest or personal relationships that could have appeared to influence the work reported in this paper.

References

  1. Kozlovskiy, A.L.; Borgekov, D.B.; Zdorovets, M.V.; Kenzhina, I.E.; Shlimas, D.I. Study of radiation damage kinetics in dispersed nuclear fuel on zirconium dioxide doped with cerium dioxide. J. Compos. Sci. 2023, 7, 277. [Google Scholar] [CrossRef]
  2. Suman, S.; Khan, M.K.; Pathak, M.; Singh, R.N. Effects of hydrogen on thermal creep behaviour of Zircaloy fuel cladding. J. Nucl. Mater. 2018, 498, 20–32. [Google Scholar] [CrossRef]
  3. Zhang, Z.Y.; Li, J.; Liu, K.; Wang, J.; Jian, S.J.; Xu, C.; Wang, H.; Wang, L.X.; Zhu, X.L.; Okulov, A.; et al. Diffusion bonding, brazing and resistance welding of zirconium alloys: A review. J. Mater. Res. Technol. 2003, 26, 395–416. [Google Scholar] [CrossRef]
  4. Durdovic, M.; Turcanu, C.; Sala, R.; Geysmans, R.; López-Asensio, S.; Gonçalves, L. The outlooks of nuclear energy in society: Unraveling public attitudes in the context of climate and energy security challenges. Prog. Nucl. Energy 2024, 174, 105286. [Google Scholar] [CrossRef]
  5. Zhang, T.F.; Sun, Q.Z.; Xiao, W.; Luo, C.X.; Liu, X.J. A review on emerging mixed-spectrum nuclear reactors for safety and sustainability of nuclear energy systems. Renew. Sustain. Energy Rev. 2024, 202, 114666. [Google Scholar] [CrossRef]
  6. Rehm, T.E. Advanced nuclear energy: The safest and most renewable clean energy. Curr. Opin. Chen. Eng. 2023, 39, 100878. [Google Scholar] [CrossRef]
  7. Kurata, M.; Barrachin, M.; Haste, T.; Steinbrueck, M. Phenomenology of BWR fuel assembly degradation. J. Nucl. Mater. 2018, 500, 119–140. [Google Scholar] [CrossRef]
  8. Adamson, R.B.; Coleman, C.E.; Griffiths, M. Irradiation creep and growth of zirconium alloys: A critical review. J. Nucl. Mater. 2019, 521, 167–244. [Google Scholar] [CrossRef]
  9. Yoo, Y.; Kim, J.; Park, J.; Kim, H. Development of nuclear fuel assembly finite element model for mechanical integrity evaluation. Nucl. Eng. Des. 2023, 413, 112523. [Google Scholar] [CrossRef]
  10. Zeng, X.K.; Zhang, C.H.; Zhu, W.G.; Zhu, M.L.; Wang, Y.M.; Zhang, X. Quantitative characterization of short fatigue crack and grain boundary interaction behavior in zirconium. Int. J. Fatigue 2022, 161, 106894. [Google Scholar] [CrossRef]
  11. Jeong, D.H.; Kim, J.H. Fatigue characteristics of laser welded Zircaloy thin sheet. Int. J. Mod. Phys. Conf. Ser. 2012, 6, 367–372. [Google Scholar] [CrossRef]
  12. Gusev, M.; Danilov, V. Creep inverse problem of the power reactor fuel assembly elements contact interaction. Appl. Mech. Mater. 2015, 698, 643–648. [Google Scholar] [CrossRef]
  13. Patra, A.; Tomé, C.N. Finite element simulation of gap opening between cladding tube and spacer grid in a fuel rod assembly using crystallographic models of irradiation growth and creep. Nucl. Eng. Des. 2017, 315, 155–169. [Google Scholar] [CrossRef]
  14. Liu, H.D.; Chen, D.Q.; Hu, L.; Yuan, D.W.; Gao, H. Numerical investigations on flow-indeced vibration of fuel rods with spacer grids subjected to turbulent flow. Nucl. Eng. Des. 2017, 325, 68–77. [Google Scholar] [CrossRef]
  15. Liu, P.L.; Li, F.; Chen, B.S.; Zhang, S. Theoretical investigations on flow-induced vibration of fuel rods with spacer grids in axial flow. Ann. Nucl. Energy 2019, 133, 916–923. [Google Scholar] [CrossRef]
  16. Ihn, N. An investigation of structural strength of PWR fuel assembly spacer grid with fuel rod clad. Ann. Nucl. Energy 2024, 195, 110124. [Google Scholar] [CrossRef]
  17. Nagase, F. An experimental study related to axial constraint of fuel rod under LOCA conditions. Ann. Nucl. Energy 2022, 171, 109052. [Google Scholar] [CrossRef]
  18. Snowden, K.U.; Stathers, P.A. The fatigue behavior of α-zirconium and Zircaloy-2 in the temperature range 20 to 700 °C. J. Nucl. Mater. 1977, 67, 215–228. [Google Scholar] [CrossRef]
  19. Wang, X.; Cao, J.X.; Huang, X.; Wang, M.J.; Li, J. Effect of pre-deformation tensile property of zirconium alloy. Chin. J. Rare Met. 2013, 37, 857–862. Available online: https://kns.cnki.net/kcms2/article/abstract?v=5ykJdPmCibKlx7kyGvXLYVJlk1oivCK00vCUEW-OS4mEEYsDytUc-Gn3qZllsv3GAelQwhSKixBYfInWaQmeHAsjSb9LGXEnIsTGKT0F4Nw3Zo4qM2rbcuT0AfQ7QQzjUu_LC2l_RMvCmDme8aaoFoFOEbfI6DgJmrLjWgrd3QM1MHrkHjv5xQ==&uniplatform=NZKPT&language=CHS (accessed on 17 July 2025).
  20. Sklenicka, V.; Dvorak, J.; Kral, P.; Betekhtin, V.I.; Kadomtsev, A.G.; Narykova, M.V.; Dobatkin, S.V.; Kucharova, K.; Kvapilova, M. Influence of prior pressurization treatment on creep behaviour of an ultrafine-grained Zr-2.5% Nb alloy. Mater. Sci. Eng. A 2021, 820, 141570. [Google Scholar] [CrossRef]
  21. Zhao, Z.; Kunii, D.; Abe, T.; Yang, H.L.; Kano, S.; Matsukawa, Y.; Abe, H. Mechanical properties of Zircaloy-4 cladding tube by advanced expansion due to compression (A-EDC) test. Mater. Trans. 2017, 58, 46–51. [Google Scholar] [CrossRef]
  22. Zhao, Z.S.; Kunii, D.; Abe, T.; Yang, H.L.; Shen, J.J.; Shinohara, Y.; Kano, S.; Matsukawa, Y.; Satoh, Y.; Abe, H. A comparative study of hydride-induced embrittlement of Zircaloy-4 fuel cladding tubes in the longitudinal and hoop directions. J. Nucl. Sci. Technol. 2017, 54, 490–499. [Google Scholar] [CrossRef]
  23. Abe, H.; Abe, T.; Kishita, S.; Kano, S.; Li, Y.F.; Yang, H.L.; Tawara, K.; Matsukawa, Y.; Satoh, Y. Development of advanced expansion due to compression (A-EDC) test method for safety evaluation of degraded nuclear fuel cladding materials. J. Nucl. Sci. Technol. 2015, 52, 1232–1239. [Google Scholar] [CrossRef]
  24. Zhang, Y.; Qi, H.D.; Song, X.P. Expansion deformation behavior of zirconium alloy cladding with different hydrogen concentrations. J. Nucl. Mater. 2021, 554, 153082. [Google Scholar] [CrossRef]
  25. Wang, H.; Zhou, D.W.; Yan, Y.R.L.; Liu, J.S.; Gao, B. Effect of pre-straining and subsequent annealing on microstructure and mechanical property of Zr-Sn-Nb-Fe zirconium alloy. Met. Mater. Int. 2022, 28, 603–617. [Google Scholar] [CrossRef]
  26. Yang, Z.N.; Xiao, Y.Y.; Zhang, F.C.; Yan, Z.G. Effect of cold rolling on microstructure and mechanical properties of pure Zr. Mater. Sci. Eng. A 2012, 556, 728–733. [Google Scholar] [CrossRef]
  27. Yu, L.; Song, X.P.; You, L.; Jiao, Z.H.; Yu, H.C. Effect of dwell time on creep-fatigue life of a high-Nb TiAl alloy at 750 °C. Scripta Mater. 2015, 109, 61–63. [Google Scholar] [CrossRef]
  28. Pilkey, W.D.; Pilkey, D.F. Peterson’s Stress Concentration Factors, 4th ed.; John Wiley & Sons, Inc.: Hoboken, NJ, USA, 2008; pp. 270–272. [Google Scholar] [CrossRef]
  29. Guo, J.; Fu, H.Y.; Pan, B.; Kang, R.K. Recent process of residual stress measurement methods: A review. Chin. J. Aeronaut. 2021, 34, 54–78. [Google Scholar] [CrossRef]
  30. Liu, M.; Zheng, Q.; Wang, X.; Xu, C.L. Characterization of distribution of residual stress in shot-peened layer of nickel-based single crystal superalloy DD6 by nanoindentation technique. Mech. Mater. 2022, 164, 104143. [Google Scholar] [CrossRef]
  31. Qi, H.D.; Song, X.P. Effect of pre-hoop expansion deformation on the tensile and fatigue properties of zirconium plate. J. Mater. Res. Technol. 2015, 35, 3073–3086. [Google Scholar] [CrossRef]
  32. Zhu, J.C.; Xie, J.J.; Wang, J.; Xia, X.L.; Lin, Z.D.; Qian, G.A.; Zhao, A.G. Low-cycle and dwell fatigue properties for a near alpha titanium alloy Ti-6Al-3Nb-2Zr-1Mo. J. Mater. Res. Technol. 2024, 29, 2204–2215. [Google Scholar] [CrossRef]
  33. Zhang, W.Y.; Fan, J.K.; Fan, P.P.; Zhao, R.Z.; Li, B.B.; Jiang, P.; Xue, X.Y.; Liao, Z.Q.; Kou, H.C.; Li, J.S. Investigation of micro-mechanisms for facet formation during dwell fatigue in Ti6321 alloy with equiaxed microstructure. Int.J. Fatigue 2025, 190, 108587. [Google Scholar] [CrossRef]
Figure 1. The dimension of tensile specimens (a), the preparation process of the pre-hoop expansion deformation (b), and the actual photo of specimens for tension (c).
Metals 15 00827 g001
Figure 2. Loading wave for fatigue–creep tests.
Metals 15 00827 g002
Figure 3. The microstructure around the center-hole of zirconium plate specimens with different pre-hoop expansion deformations. (a1a5) IPF maps. (b1b5) PF maps.
Metals 15 00827 g003
Figure 4. Tensile curves (a) and the tensile properties (b) after pre-hoop expansion strains at 400 °C.
Metals 15 00827 g004
Figure 5. Creep curves (a1a3) and the creep properties (b1b3) with different pre-hoop expansion strains under the creep stress of 226 MPa, 276 MPa, and 296 MPa, respectively, at 400 °C.
Metals 15 00827 g005
Figure 6. Effect of creep stress on the creep curves (a) and the creep properties (b) with the pre-hoop expansion strain of 0, 10%, and 20% at 400 °C.
Metals 15 00827 g006
Figure 7. Fatigue–creep curves of specimens after different pre-hoop expansion deformations under different stress ratios (a1a7), the effect of the pre-hoop expansion deformation on the fatigue–creep properties (b1b7), and the effect of the stress ratio on the fatigue–creep properties (c1c5).
Metals 15 00827 g007
Figure 8. The variation in the logarithm of creep life with the logarithm of mean creep rate at 400 °C.
Metals 15 00827 g008
Figure 9. The effect of the dwell time on the fatigue–creep curves (a1a5) and the fatigue–creep properties (b1b5) under the maximum cyclic stress of 276 MPa and the stress ratio of 0.1 at 400 °C.
Metals 15 00827 g009
Figure 10. The variation in fatigue–creep properties with the pre-hoop expansion strain when the dwell time is 0 s under the maximum cyclic stress of 276 MPa and the stress ratio of 0.1 at 400 °C.
Metals 15 00827 g010
Figure 11. Tensile fracture surfaces of zirconium plates with different pre-hoop expansion strains at 400 °C. (a1a3) εpre = 0; (b1b3) 5%, (c1c3) 10%, (d1–d3) 15%, (e1e3) 20%.
Metals 15 00827 g011
Figure 12. Creep fracture surfaces of zirconium plates with different pre-hoop expansion strains under the stress of 276 MPa at 400 °C. (a1a3) εpre = 0; (b1b3) 5%, (c1c3) 10%, (d1d3) 15%, (e1e3) 20%.
Metals 15 00827 g012
Figure 13. Fracture surfaces after fatigue–creep deformation under the stress ratio of 0.1, the maximum cyclic stress of 276 MPa and the dwell time of 20 s at 400 °C. (a1a3) εpre = 0; (b1b3) 5%, (c1c3) 10%, (d1d3) 15%, (e1e3) 20%.
Metals 15 00827 g013
Figure 14. Fracture surfaces after fatigue–creep deformation under the stress ratio of 0.7, the maximum cyclic stress of 276 MPa and the dwell time of 20 s at 400 °C. (a1a3) εpre = 0; (b1b3) 5%, (c1c3) 10%, (d1d3) 15%, (e1e3) 20%.
Metals 15 00827 g014
Figure 15. The stress distribution around the central hole of zirconium plates at different axial stresses at 400 °C.
Metals 15 00827 g015
Table 1. The data of creep properties of zirconium plates with different pre-hoop expansion strains under different creep stresses at 400 °C.
Creep Stress
(MPa)
Creep PropertiesPre-Hoop Expansion Strain
05%10%15%20%
226Steady creep rate (s−1)1.55 × 10−83.15 × 10−87.76 × 10−81.33 × 10−72.66 × 10⁻⁷
Creep life (h)380.69186.61115.4256.0622.09
256Steady creep rate (s−1)3.14 × 10−88.83 × 10−88.82 × 10−82.23 × 10−74.28 × 10⁻⁷
Creep life (h)113.9666.0466.0630.738.38
276Steady creep rate (s−1)4.97 × 10−81.40 × 10−71.65 × 10−73.00 × 10−75.56 × 10⁻⁷
Creep life (h)74.8655.4246.8925.716.68
286Steady creep rate (s−1)2.75 × 10−65.37 × 10−61.05 × 10−52.01 × 10−53.95 × 10⁻⁵
Creep life (h)3.841.930.7920.510.21
296Steady creep rate (s−1)7.77 × 10−58.78 × 10−59.09 × 10−59.35 × 10−51.04 × 10⁻⁴
Creep life (h)0.060.060.060.060.05
Table 2. The fatigue–creep data of specimens with different pre-hoop expansion strains under different stress ratios when the maximum cyclic stress is 276 MPa and the dwell time is 20 s at 400 °C.
Stress RatioFatigue–Creep PropertiesPre-Hoop Expansion Strain
05%10%15%20%
0.1Mean Creep rate (s−1)2.38 × 10−62.22 × 10−61.34 × 10−65.02 × 10−66.98 × 10⁻⁶
Cycle life (Cycle)5557801016380264
0.3Mean creep rate (s−1)1.85 × 10−61.75 × 10−64.25 × 10−72.00 × 10−63.18 × 10⁻⁶
Cycle life (Cycle)7608061717692529
0.5Mean creep rate (s−1)1.12 × 10−66.46 × 10−71.79 × 10−71.05 × 10−61.12 × 10⁻⁶
Cycle life (Cycle)87311702766945665
0.6Mean creep rate (s−1)3.39 × 10−72.05 × 10−71.39 × 10−75.65 × 10−79.37 × 10⁻⁷
Cycle life (Cycle)2290413050621241853
0.7Mean creep rate (s−1)7.64 × 10−81.44 × 10−72.22 × 10−73.09 × 10−74.97 × 10⁻⁷
Cycle life (Cycle)58905562533423291238
0.8Mean creep rate (s−1)1.53 × 10−72.46 × 10−73.74 × 10−71.23 × 10−61.53 × 10⁻⁶
Cycle life (Cycle)5022281819461130642
0.9Mean creep rate (s−1)1.60 × 10−73.95 × 10−75.02 × 10−71.29 × 10−61.58 × 10⁻⁶
Cycle life (Cycle)489018981803670589
Table 3. The fatigue–creep data of specimens with different pre-hoop expansion strains under different dwell times when the maximum cyclic stress is 276 MPa and the stress ratio is 0.1 at 400 °C.
Dwell TimeFatigue–Creep PropertiesPre-Hoop Expansion Strain
05%10%15%20%
0Mean Creep rate (s−1)6.52 × 10−75.91 × 10−74.98 × 10−72.69 × 10−64.50 × 10⁻⁶
Cycle life (Cycle)12560137801464057902260
5 sMean creep rate (s−1)8.37 × 10−77.77 × 10−76.11 × 10−73.42 × 10−66.05 × 10⁻⁶
Cycle life (Cycle)3325388471581627698
20 sMean creep rate (s−1)2.43 × 10−61.52 × 10−61.34 × 10−65.01 × 10−67.66 × 10⁻⁶
Cycle life (Cycle)5557801016380264
60 sMean creep rate (s−1)3.84 × 10−65.40 × 10−67.55 × 10−68.43 × 10−69.53 × 10⁻⁶
Cycle life (Cycle)406312264156117
Disclaimer/Publisher’s Note: The statements, opinions and data contained in all publications are solely those of the individual author(s) and contributor(s) and not of MDPI and/or the editor(s). MDPI and/or the editor(s) disclaim responsibility for any injury to people or property resulting from any ideas, methods, instructions or products referred to in the content.

