Article

The Influence of Electrostatic Separation Parameters on the Recovery of Metals from Pre-Crushed PCBs

by
Antonio Manuel Lopez-Paneque
1,2,
Victoria Humildad Gallardo García-Orta
3,
Jose Maria Gallardo
1,
Ranier Enrique Sepúlveda-Ferrer
1 and
Ernesto Chicardi
1,*
1
Departamento de Ingeniería y Ciencia de los Materiales y del Transporte, Escuela Técnica Superior de Ingeniería, Universidad de Sevilla, Camino de los Descubrimientos, s/n, 41092 Sevilla, Spain
2
Asociación de Investigación y Cooperación Industrial de Andalucía—AICIA, Camino de los Descubrimientos, s/n, 41092 Sevilla, Spain
3
Atlantic Copper, S.L.U., Francisco Montenegro Avenue, 21001 Huelva, Spain
*
Author to whom correspondence should be addressed.
Metals 2025, 15(8), 826; https://doi.org/10.3390/met15080826
Submission received: 23 June 2025 / Revised: 16 July 2025 / Accepted: 22 July 2025 / Published: 23 July 2025

Abstract

Electrostatic separation is a promising technology for the recovery of valuable metals from electronic waste, particularly from printed circuit boards (PCBs). This study explores the application of electrostatic separation for the selective recovery of metallic and non-metallic fractions from crushed PCBs (PCBs). The process exploits the differences in electrical properties between conductive metals and non-conductive polymers and ceramics, facilitating their separation through applied electric fields. The raw materials were pre-treated via mechanical comminution using shredders and hammer mills to achieve an optimal particle size distribution (<3 mm), which enhances separation efficiency. Ferrous materials were removed prior to electrostatic separation to improve process selectivity. Key operational parameters, including particle size, charge accumulation, environmental conditions, and separation efficiency, were systematically analysed. The results demonstrate that electrostatic separation effectively recovers high-value metals such as copper and gold while minimizing material losses. Additionally, the process contributes to the sustainability of e-waste recycling by enabling the recovery of non-metallic fractions for potential secondary applications. This work underscores the significance of electrostatic separation as a viable technique for e-waste management and highlights optimization strategies for enhancing its performance in large-scale recycling operations.

1. Introduction

Electrostatic separation is an advanced material recovery technique widely recognized for its efficiency in separating particles based on their electrical properties. The process leverages electrostatic forces generated by electric fields to manipulate and segregate materials that exhibit different conductive and dielectric behaviours. Particles are charged either through contact electrification (triboelectricity), electrostatic induction, or direct exposure to an electric field. This charge allows the particles to be influenced by the applied field, enabling the separation of conductive materials, such as metals, from non-conductive ones, such as polymers and ceramics [1,2]. The versatility of this technique makes it suitable for a wide range of applications, including recycling, mineral processing, and waste management.
One of the key advantages of electrostatic separation lies in its ability to handle finely divided materials with high precision. This is especially important when dealing with heterogeneous mixtures where conventional mechanical separation methods may fail. Conditions such as particle size, moisture content, environmental humidity, temperature, and surface contamination significantly affect the performance of the process. Maintaining consistent operating conditions is crucial to ensure the reliability and efficiency of the separation [3]. Moreover, the low energy requirements of this method compared to other separation technologies make it an economically viable and environmentally friendly option for large-scale operations [4].
In recent years, electrostatic separation has gained significant attention for its application in recycling electronic waste (e-waste). E-waste, particularly from printed circuit boards (PCBs), presents a unique challenge due to its complex composition. PCBs contain a mixture of metals, polymers, and ceramics, often embedded in intricate layers, making the recovery of valuable materials a challenging task. Particularly, aluminium (Al) is present in heat sinks attached to processors, power transistors, and some capacitors [5]. Gold (Au) can be found in high-quality contacts and connections, commonly used in pins, connectors, edge plating on boards, and thin layers in electronic chips, because of its excellent conductivity and resistance to corrosion. Silver (Ag) is used also in electrical contacts and connections and, in smaller amounts, in solder and high-quality metallic coatings, due to its high electrical conductivity. In turn, copper (Cu) makes up the majority of the conductive material in PCBs, used for tracks that connect electronic components, for cables and coils within components like inductors and transformers. Nickel (Ni) is used as an intermediate layer in connections and metal coatings, typically beneath gold or silver layers to improve adhesion and prevent corrosion, and also in magnetic components such as inductor or transformer cores. Palladium (Pd) is found in the contacts of switches, relays, and connectors, usually in small quantities, together with ceramic capacitors, especially in multilayer ceramic capacitors (MLCCs). Platinum (Pt) is rare in PCBs but may be found in specialized sensors or electrical contacts, such as in medical or telecommunications equipment. Silicon (Si) is the base material for semiconductors, present in integrated circuits, microprocessors, and other electronic devices, and is found in the form of silicon wafers inside integrated circuits. Tin (Sn) is widely used in solder to connect components to the board. It may also form part of alloys with lead (in older devices) or lead-free alloys in modern electronics. Finally, iron (Fe) is found primarily in magnetic cores of inductors and transformers, screws, metal supports, and other structural elements. Therefore, noble metals such as Ag, Au, and Pd are particularly valuable in PCBs due to their high conductivity and resistance to corrosion, and other common metals like Al, Cu, Ni, and Sn are abundant and essential for the basic functionality of the board. This diversity makes PCBs a critical source for metal recycling and recovery from electronic waste. Most of those metals are present in significant quantities and/or are of high economic value [6,7].
However, these metals are often intertwined with non-metallic materials, necessitating advanced separation techniques for effective recovery. Thus, the process of electrostatic separation begins with the mechanical pre-treatment of e-waste. Crushing and grinding are essential steps to reduce the size of the material and liberate the metallic and non-metallic components [8]. The particle size achieved during this stage plays a critical role in the success of the electrostatic separation process, as smaller particles are more likely to exhibit distinct conductive and dielectric properties, and the electrostatic charge effect is enhanced by the higher surface area to volume ratio [9]. Once reduced to an appropriate size, the material is subjected to an electric field, where the differential charging behaviour of the particles allows for their segregation.
The application of electrostatic separation to PCBs offers several advantages. It enables the efficient recovery of high-value metals such as copper and gold while minimizing the loss of these materials to waste streams [10,11]. Additionally, the separation of non-metallic fractions, including glass fibres and resins, contributes to a cleaner recycling process. These non-metallic fractions, often considered as waste, can also find secondary applications, further enhancing the sustainability of the process.
This method has found utility in various industries, from recycling plants to mineral beneficiation processes. In the context of electronic waste, the application of electrostatic separation addresses critical environmental and economic challenges. By recovering valuable metals from e-waste, this technique reduces the dependency on primary mineral resources and, consequently, the environmental impact due to the mining [10]. Moreover, it pushes toward the circular economy by reintroducing recovered materials into the production cycle. The importance of such recycling practices is recognized by international regulatory frameworks such as the European Union’s Waste Electrical and Electronic Equipment (WEEE) Directive 2012/19/EU, which establishes requirements for the collection, treatment, and recovery of e-waste to promote environmental protection and resource efficiency [12].
This study delves into the application of electrostatic separation for recovering metals from crushed PCBs. It provides a comprehensive analysis of the underlying principles, operational conditions, and material behaviour during the process. Furthermore, it highlights the potential of this technology to enhance the efficiency of e-waste recycling and underscores the challenges associated with its practical implementation. By focusing on the optimization of separation parameters and the integration of pre-treatment techniques, this work aims to contribute to the development of a sustainable framework for managing electronic waste.

2. Materials and Methods

2.1. Raw Materials and Output Flow Rates

The raw materials selected for this work were obtained from printed circuit boards (PCBs). They were previously crushed consecutively by shredder and hammer mills (both designed by Mayper S.L., Vilamarxant, Spain) down to less than 3 mm. As stated before, particle size is a critical parameter. Firstly, the smaller the particle, the more likely that elements of different electrostatic behaviour will be separated. Secondly, smaller particles have a higher surface area to volume ratio, which enhances the separation effect of the electrostatic charge, since electrostatic charge happens on the surface of the particle. Researchers and manufacturers of drum electrostatic separation equipment have found the ideal particle size to be under 2 mm and optimal around 0.8 mm [13,14]. Once crushed, the particles were mixed up thoroughly to ensure maximum homogeneity of the samples. Subsequently, to remove ferrous materials, the crushed PCBs were consecutively treated by two ferrite and neodymium drum magnetic separators (Drago Electronica, Martorell, Spain). Afterward, the electrostatic separation procedure was carried out in an electrostatic separator (designed by Vanest, Xi’an, China). The equipment consisted of a vibrating feeding chamber, a rotating conductive drum, a group of four electrodes, three collectors, and two deflector blades. The vibrating feeding chamber released a flow of material to the rotating conductive drum, where it was exposed to an electrostatic field induced by the electrodes. Conductive particles would release any electrostatic charge through the drum and freely fall on a first collector. However, non-conductive particles would experience an attraction force toward the drum and are only released and fall on a second collector once they reach the second half of the drum, were the brush is located. A third collector can be placed in between to capture particles with mixed behaviour. The deflector blades can be used to further adjust the collector’s inlet area if needed. A schematic diagram of the operation of a drum electrostatic separator is shown in Figure 1, courtesy of Hamos company® (Bavaria, Germany).
To study the optimal conditions for the maximum separation of the conductive fraction (CF), non-conductive fraction (NCF), and mixed fraction (MIX) in the electrostatic separator, the following process parameters were modified: (a) feed flow rates between 30 and 120 kg/h, (b) voltage across the electrodes between 0 and 40 kV, and (c) drum speed between 20 and 100 rpm. Considering all these process parameters modified, the treated specimens were labelled as follows: FR-EV-DS, with “FR” being the, the feed flow rate; “EV” the electrode voltage; and “DS” the drum speed. All tests carried out are arranged according to Table 1. The deflection plates to discriminate between the CF and NCF were fixed in a vertical position according to initial tests. At each condition, batches of 100 kg of each raw material were electrostatically separated and later analysed.

2.2. Chemical and Physical Characterizations

For both input and output material flow rates, a deep chemical and physical characterization, evolved particle size distribution, chemical composition, density, CF, NCF, and mixed fraction (MIX) were determined. Thus, the particle size distribution has been determined by sieving according to the ISO 3310-1:2016 [15] standard using sieves with aperture sizes of 0.038, 0.075, 0.150, 0.3, 0.6, and 1.18 mm. In turn, the composition of the initial raw materials and the electrostatically separated PCBs were determined in weight percentages by Inductively Coupled Plasma–Optical Emission Spectroscopy (ICP-OES) for the main metals, such as Cu, Ni, and Sn. Meanwhile, the precious metals such as Au, Ag, Pd, and Pt were measured in parts per million concentration by Inductively Coupled Plasma–Mass Spectroscopy (ICP-MS) due to its higher sensibility. Concretely, a spectroBlue ICP-OES (Spectro Analytical Instruments GmbH, Kleve, Germany) and an ICP-MS/MS Agilent 8800 spectrometer (Agilent Scientific Instruments, Santa Clara, CA, USA) were used for these purposes. First, 1 g per each raw material and each electrostatic separated crushed PCB were acid-digested in 3 mL HNO3 + 3 mL HCl + 1 mL HF using an ultraWAVE microwave digestor (Milestone, Milan, Italy) at 220 °C and 45 bar for 20 min. At these conditions, all specimens, including the fibre glass, were completely digested. This protocol is similar to those used by different authors [16,17,18].
Subsequently, 10 g of each treated material, quintuplicated, was calcinated at 400 °C for 2 h using a custom-made and high-capacity furnace (designed by Thermolab, Águeda, Portugal) in static air. The weight loss was associated to the calcination of the plastic fraction of the separated PCBs. Finally, the density of each crushed and electrostatic separated PCBs was determined using the gas picnometer AccuPyc II 1340 TEC (Micromeritics, Tewkesbury, UK).
Therefore, the key parameters determined in this study include the mass distribution of the electrostatically separated fractions from the crushed PCBs—namely, the conductive fraction (CF), non-conductive fraction (NCF), and mixed fraction (MIX)—as well as the chemical composition of the NCF. The CF and MIX, enriched in metals, are considered as recovered fractions. Based on this, we also quantified the absolute amount of non-recovered metals remaining in the PCBs and calculated both the relative recovery and non-recovery rates by comparing the metal content in the separated fractions with the initial metal content in the original PCBs.

3. Results and Discussions

3.1. Raw Material Characterization

The particles size distribution of the PCB raw material is displayed in Figure 2. It is observed that although after the pre-treatment carried out in the shredder and hammer mills there is an outlet sieve of 3 mm, the crushed PCB raw material has a 90 wt.% of particle sizes less than 1.16 mm, with about 50 wt.% of particles having a particle size less than 0.3 mm and only 5 wt.% of particles between 1.18 and 0.3 mm.
The plastic fraction of the crushed PCBs was determined by gravimetry analysis, obtaining an average value of 27.6 ± 4.9 wt.%. This corresponds mainly to epoxy resin coming from the motherboard. The same characterization was carried out on the crushed PCB raw material to determinate the metallic composition (Table 2), in this case, by ICP-OES. It was observed that the main metals presented are Al, Cu, Fe, Ni, Si, and Sn, representing a total amount of 44.9 wt.%. It is also important to highlight the amount of Cu (21.7 wt.%), mainly coming from the tracks that connect the electronic components, which is one of the most valuable metals to recover in the PCBs. Finally, the concentration of noble metals in ppm correspond to around 1.1 wt.%. Although their amounts are rather low, the higher price of noble metals makes them of interest to recover in this type of e-waste. In this context, based on metal prices as of July 2025—Au at approximately 107,300 EUR/kg, Ag at 1200 EUR/kg, Cu at 10 EUR/kg, Sn at 30 EUR/kg, Ni at 20 EUR/kg, Pd at 38,500 EUR/kg, Al at 2.4 EUR/kg, Si at 2.2 EUR/kg, and Fe at 0.13 EUR/kg—and assuming perfect separation of all metals, the gross metal value in these PCBs could reach approximately 50 EUR/kg. Most of this value is derived from gold, corroborating the strong interest in their recovery.
Finally, the remanent material, excluding plastics (27.6 ± 4.9 wt.%) and metals (45.5 wt.%) in the crushed PCBs, must correspond to the fiberglass existing in the substrate motherboard of the PCBs, i.e., a 26.9 wt.% of fiberglass.
In addition, the density of the crushed PCBs used as raw materials before the electrostatic separation tests as 4.10 ± 0.07 g/cm3. Attending to the percentage of the above-mentioned phases and the corresponding density of each phase and metal, by Vegard’s Law it is possible to estimate a theoretical density value of 3.98 g/cm3. Thus, both the experimental and theoretical values are in concordance, suggesting that the compositions and percentage of phases are correctly determined.

3.2. Effect of Feed Flow Rates in the Electrostatic Separation

For this purpose, the feed flow rate was modified from 30 kg/h to 75 kg/h and, finally, 125 kg/h; meanwhile, other technological parameters were maintained as constant, such as 20 rpm for the drum speed and 35 kV as the electrode voltage. Table 3 and Figure 3 below display the tests carried out and the main results obtained.
The first data to highlight is the mixed fraction (MIX), i.e., the unseparated fraction between the conductive fraction (CF) and non-conductive fraction (NCF). It was slightly increased but still at a low amount with the increase in the feed flow rate (between 1.4 and 3.o wt.%). In turn, the CF was increased with the feed flow rate and, consequently, there was opposite behaviour for the NCF. Therefore, attending only to the optimization of the separation of the fraction (Figure 3a), the increase in the flow rate from 30 kg/h to 120 kg/h improves this separation.
The determined amount of plastic for the CF was low in all cases, between 1.9 and 2.8 wt.%, suggesting an interesting degree of separation between metals and plastic, which suggests a high purity of the metals in the CF. Opposite, for the NCF, the amount of plastic determined by calcination, between 32.2 wt.% and 44.1 wt.%, suggests the presence of other elements with a different nature. They can be, concretely, fibres and metals. Therefore, the NCF streams after the electrostatic separation is susceptible to being separated by another consecutive physical separation technique, such as shaking tables, flotation, hydrocyclone, etc.
In this context, we determined the degree of the presence of metals in these NCFs, and the metallic composition in the NCF is displayed in the Table 4. They need to be quantitatively measured to determine the amount of metals required to be recovered by another subsequent separation method after electrostatic separation. It is important to comment that the CF can be identified as a concentrated metallic stream because the plastic content analysis in the CF shows results under 3 wt.% of plastic. Therefore, the metallic composition was not measured, and the CF was accepted as a total recovered phase. In addition, the low amount of the mixed fraction in all tests carried out, together with the low amount of plastics, also makes it admissible as a recovered metal stream. Thus, it is observed in the NCF how the separation of Cu is not adequate, obtaining a high value between 11.1 and 16.7 wt.%. Extrapolating these amounts to the initial crushed PCBs, they correspond to between 3.8 and 2.7 wt.% of the total PCBs. Even more, attending to the relative non-recovered metallic percentage of Cu over the total initial Cu in the PCBs, it was determined to be between 17.8 and 12.6 wt.%, corroborating the requirement for additional separation steps for the NCF or even a recirculation of these NCFs in the electrostatic separation step at different operation parameters.
On the other hand, the quantification of the different metals in the NCF (Figure 3b) showed an inhomogeneous behaviour with the feed flow rate. Meanwhile, as a general trend, the noble metals reached stable or low values at 120 kg/h, and the main metal, Cu, increased its percentage in the NCF, reaching a value of 16.7 wt.% for the FR120-EV35-DS20 sample. Specifically, the lowest percentage of Ag was 431 and 445 ppm for FR75-EV35-DS20 and FR120-EV35-DS20, respectively. For Au, the values remained constant, around 120 ppm, independent of the electrostatic separation conditions. Pd reduces its amount up to 3.3 wt.% in the NCF of the 120 kg/h of the feed flow rate (FR120-EV35-DS20).
However, the previous values must be analysed not only in terms of the NCF, but they also need to be compared with the percentage that they represent in the original PCB (Figure 3c). In this case, a general and consistent trend was found for all measured metals. Specifically, the increase in the feed flow rate reduced the amount of unrecovered metals after the electrostatic separation tests, suggesting that the increase in the speed of the materials increases the different behaviours of metals and electrical insulators (plastic and fibres) during separation tests. Thus, with the increase in the feed flow rate, the amount of metals represents a lower unrecovered absolute amount based on the total amount of PCBs. Although the copper concentration in the NCF slightly increases at higher feed rates, this fraction’s total mass decreases significantly, resulting in a lower absolute amount of unrecovered copper. Going even further, in the quantification of the separated metals, in Figure 3d,e, the non-recovered and recovered metals based on the absolute initial amount of those metals in the PCBs are displayed, respectively, Thus, for the quantified metals, a general increase in the recovery metals in the CF and mixed fraction with the feed flow rate can be detected, reaching values more than 85 wt.% for all of them. More specifically, 87.4 wt.% of Cu, 91.6 wt.% of Ag, 94.6 wt.% of Pd, 95.8 wt.% of Au, 96.9 wt.% of Sn, and 99.4 wt.% of Sn were recovered in the CF and MIX, as can be directly extracted from Figure 3e at a 120 kg/h feed flow rate. This effect can be physically explained in terms of different parameters. The higher feed rates enhance the frequency of particle–particle collisions, which empirical studies show to be the dominant mechanism for triboelectric charging in turbulent flows. In belt-type and drum-type separators, this also promotes the formation of a more uniform particulate layer, preventing localized agglomerates and improving charge response in the electric field. Additionally, heavier feed suppresses excessive clumping, thereby increasing the active surface area and enhancing charge acquisition. Collectively, these effects lead to a higher net charge per particle and more effective deflection toward the metallic fraction, resulting in improved metal recovery [19,20].

3.3. Effect of Electrode Voltage in the Electrostatic Separation

Analogous to the effect of the feed flow rate applied, in this section, electrostatic separation tests were carried out by the modification of the electrode voltage applied. In this case, the electrode voltages were modulated at 25 kV, 30 kV, and 40 kV. In these conditions, the percentage of phases (displayed in Table 5 and Figure 4a) showed no significant variation using a 30 kV or 40 kV electrode voltage. Thus, the electrostatic separation produced a maximum separation of CF, NCF, and MIX at 30 kV, or, concretely, 24.6 wt.% of the CF, 57.8 wt.% of the NCF, and 17.7 wt.% of the mixed fraction (MIX). However, in general terms, although the separation of the fraction reached no modification, the presence of a non-negligible amount of a mixed phase suggests the necessity to modify another parameter to optimize this separation of phases and diminish the MIX phase. Another important aspect is the absence of plastic materials in the MIX obtained at a 40 kV electrode voltage. These metallic particles most likely were either small in diameter and/or had a low electrostatic force and flew into the MIX rather than the CF container. This aspect could hide the total amount and distribution of metal in the output fractions.
Subsequently, the composition of the NCF was determined in terms of the metal content. These metal amounts were referred to as the percentage over the initial amount of PCBs, and, in terms of the recovered metals, corresponded to the difference between the percentage in the NCF and the presence in the original PCBs. Thus, all this information is exhibited in Table 6 and Figure 4b–e. As a first view, the modification of the electrode voltage had no clear influence on the amount of most of the metals in the NCF and, considering the similar amount of the CF and MIX, also in the initial PCBs. As an exception, the percentage of Cu in the NCF in terms of the initial PCB increased with the electrode voltage. Pd showed opposite behaviour, with lower values when the electrode voltage was increased.
The most important aspect in this study is based in terms of the recovered and non-recovered amount of each metal, as shown in Figure 4d,e, respectively. Heterogeneous behaviours were observed for different metals. Meanwhile, the total recovery of Sn and Pd increased with the electrode voltage, and the recovery of the valuable Ag, Au, and Cu metals decreased with the electrode voltage. In any case, the minimum non-recovered amount of some of the studied metals (marked in bold in Table 6), concretely, 26.2 wt.% of Ag, 9.9 wt.% of Au, 24.6 wt.% of Cu, and 19.2 wt.% of Pd, suggests the necessity of improving the electrode voltage in the electrostatic separation process to optimize the recovery of metals in the CF. The high amount of the mixed phase also supports this position. Thus, another experimental parameter should be also modified.

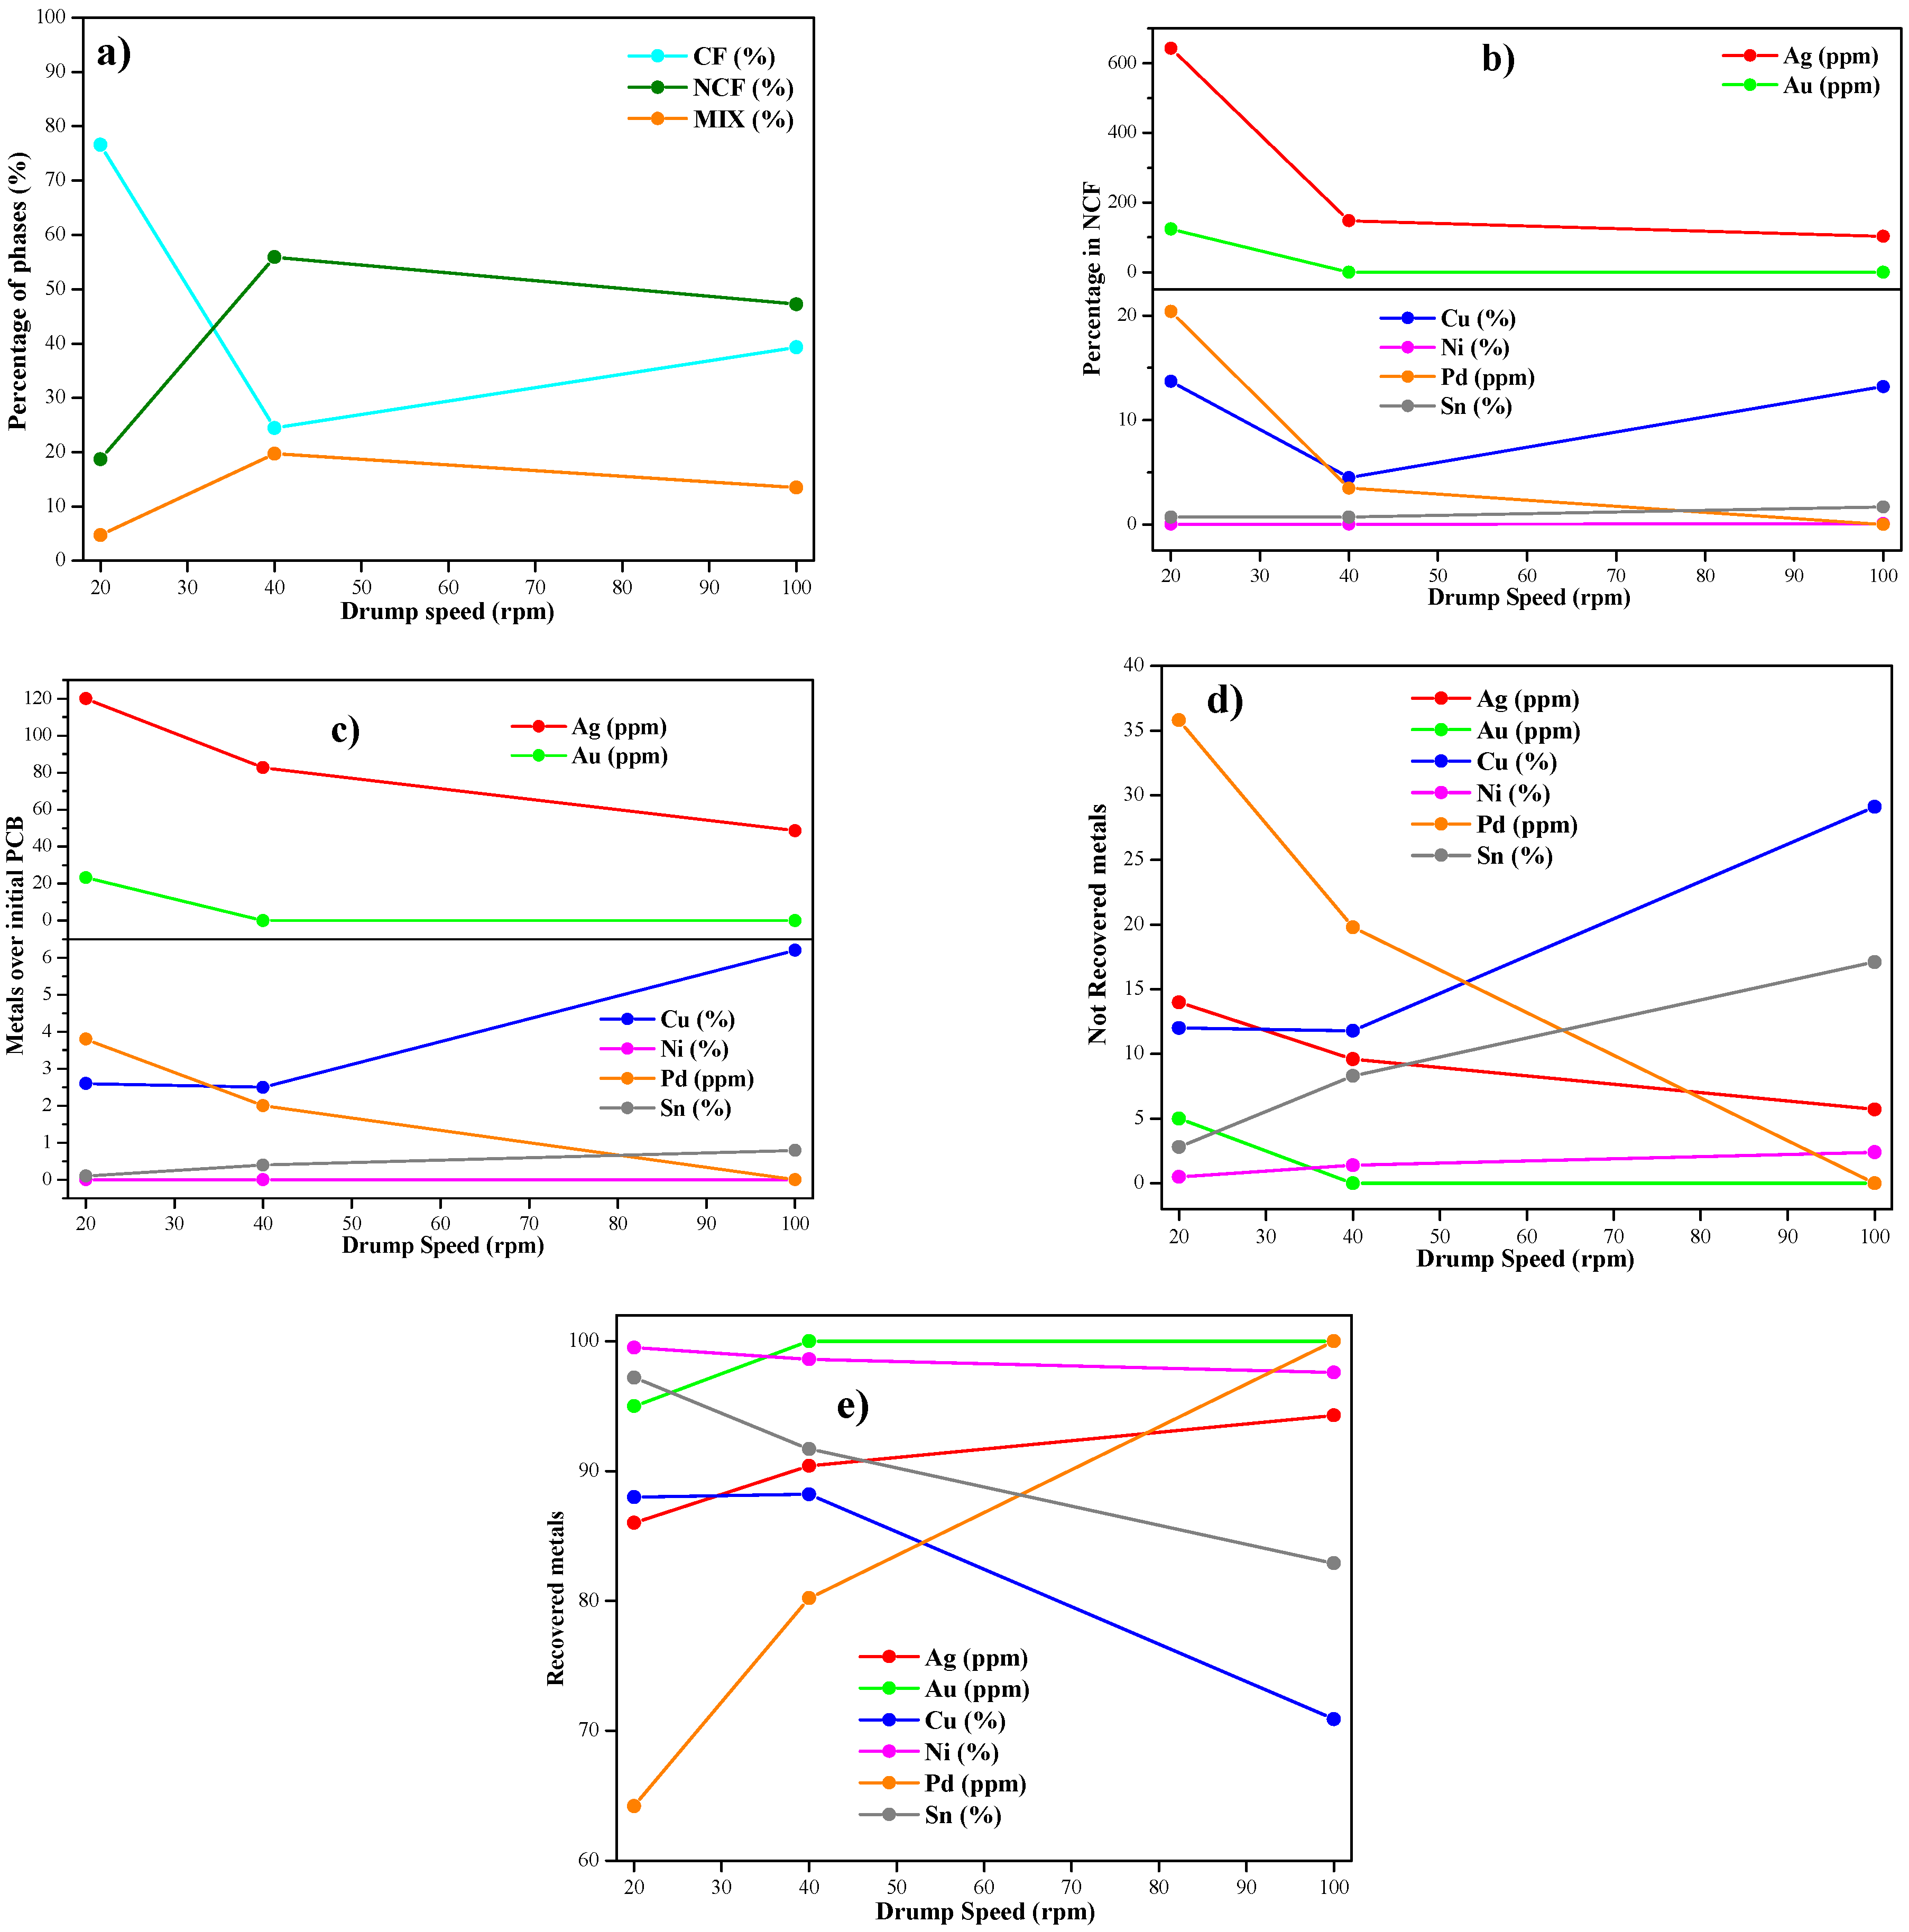
3.4. Effect of Drum Speed in the Electrostatic Separation

The effect of the modification of the drum speed, between 20 rpm and 100 rpm, on the electrostatic separation of the pre-crushed PCBs was studied, with fixed values of 30 kg/h of the feed flow rate and 40 kV of electrode voltage. Table 7 and Figure 5a display the percentage of the separated CF, NCF, and MIX phases. Thus, the increase in the drum speed generated an abrupt decrease in the CF phase from 76.6 wt.% at 20 rpm to 24.4 wt.% at 40 rpm and 39.3 wt.% at 100 rpm (Table 7). This time it is clear that, in terms of CF separation, applying a lower drum speed shows a clear advantage in comparison with a higher drum speed. In addition, also for the non-optimal separated phase, i.e., the mixed phase (MIX), only the FR30-EV40-DS20 showed a low amount of this phase, suggesting an optimal separation between the CF and the NCF at this lower 20 rpm. Therefore, the increase in drum speed is clearly detrimental for this separation of the CF, NCF, and MIX phases.
A subsequent aspect is the determination of the composition of the NCF in order to quantify the non-recovered metals present in this phase that would suggest subsequent separation stages (Table 8). Thus, although the CF was lower at 20 rpm (FR30-EV40-DS20), the increase in the drum speed allowed to decrease the amount of Ag, Au, Cu, and Pd in the NCF at 40 or 100 rpm (Figure 5b). The initial low amount of Ni and Sn makes difficult to observe a clear trend for those metals. Extending this quantification over the initial PCBs (Figure 5c), it is also determined how the Ag, Au, and Pd decrease the amount over the PCBs, corroborating the requirement to compare not only the percentage in the NCF but also the total amount in comparison with the initial PCB. Opposite, the Cu amount increased with the rpm in comparison with the initial PCB.
The last interesting comparison is based on the recovery of each metal based on the total amount of them (Figure 5d,e). In this sense, the recovery of Ag, Au, Cu, and Sn was reached at a low drum speed (20 or 40 rpm). Recovery percentages more than 90 wt.% were reached for those metals. In contrast, the recovery of Pd, another key metal, was clearly increased with the drum speed, reaching values close to 100% at 100 rpm. However, the low initial amount of this noble metal makes this measurement less reliable.

4. Conclusions

  • Electrostatic separation tests were successfully carried out on pre-crushed printed circuit boards (PCBs) at different feed flow rates, electrode voltages, and drum speeds.
  • The determination of different output fractions suggests that the tests separated according to conductive fractions (CFs) and non-conductive fractions (NCFs), with an intermediate non-correctively separated fraction (mixed fraction, MIX), but in all cases with a low percentage (always less than 3.5 wt.%).
  • In terms of the recovery of metals from the initial PCBs, the maximum values are obtained for the specimen FR120-EV35-DS20, i.e., for a feed flow rate of 120 kg/h, a 35 kV electrode voltage, and a drum speed of 20 rpm. In those conditions, more than 90% of metal recovery was reached for all of them, except CU, where an 85% recovery was reached.
  • Specifically, if the maximum percentage of Cu is required, as a key metal in the industry, using a low drum speed is the key parameter, at 20–40 rpm, corresponding to the samples FR30-EV40-DS20 and FR30-EV40-DS40. Opposite, if the maximum recovered amount is required for noble metals (Au and Ag, mainly), the drum speed has less influence, suggesting the use of intermediate values of the feed flow rate and electrode voltage to recover up to 95 wt.% of both noble metals.
  • Although no single set of operating conditions can achieve perfect separation, the primary objective of these processes is to isolate the metal fraction as effectively as possible. The resulting metal-rich mixture typically requires further refining and/or purification through methods such as hydrometallurgy, smelting, or vacuum distillation, if necessary. In the case of the NCF (i.e., the plastic-rich stream), additional separation techniques are required to achieve complete metal recovery. Processes such as flotation, plastic distillation, or incineration with CO2 capture may be necessary to enable full material recovery and contribute to closing the loop of the circular economy.
  • Furthermore, although not explored in this study, the management and potential reuse or disposal of the separated fractions represent an important area for future research, given their variability depending on the goals and capabilities of the processing entity.

Author Contributions

Conceptualization, J.M.G. and E.C.; methodology, A.M.L.-P., V.H.G.G.-O., J.M.G. and E.C.; software, V.H.G.G.-O.; formal analysis, A.M.L.-P. and R.E.S.-F.; investigation, A.M.L.-P., R.E.S.-F. and E.C.; data curation, E.C.; writing—original draft, A.M.L.-P. and E.C.; writing—review and editing, A.M.L.-P., V.H.G.G.-O., J.M.G., R.E.S.-F. and E.C.; project administration, V.H.G.G.-O. and E.C.; funding acquisition, J.M.G. and E.C. All authors have read and agreed to the published version of the manuscript.

Funding

This research was funded by EIT Raw Materials, grant number 21021.

Data Availability Statement

The original contributions presented in this study are included in the article. Further inquiries can be directed at the corresponding author.

Conflicts of Interest

Author Victoria Humildad Gallardo García-Orta was employed by the company Atlantic Copper, S.L.U. The remaining authors declare that the research was conducted in the absence of any commercial or financial relationships that could be construed as a potential conflict of interest.

References

  1. Cui, J.; Forssberg, E. Mechanical recycling of waste electric and electronic equipment: A review. J. Hazard. Mater. 2003, 99, 243–263. [Google Scholar] [CrossRef] [PubMed]
  2. Park, Y.J.; Fray, D.J. Recovery of high purity precious metals from printed circuit boards. J. Hazard. Mater. 2009, 164, 1152–1158. [Google Scholar] [CrossRef] [PubMed]
  3. Kelly, E.G.; Spottiswood, D.J. The theory of electrostatic separations: A review part II. Particle charging. Miner. Eng. 1989, 2, 193–205. [Google Scholar] [CrossRef]
  4. Zhou, Y.; Qiu, K. A new technology for recycling materials from waste printed circuit boards. J. Hazard. Mater. 2010, 175, 823–828. [Google Scholar] [CrossRef] [PubMed]
  5. Huang, T.; Zhu, J.; Huang, X.; Ruan, J.; Xu, Z. Assessment of precious metals positioning in waste printed circuit boards and the economic benefits of recycling. Waste Manag. 2022, 139, 105–115. [Google Scholar] [CrossRef] [PubMed]
  6. Veit, H.M.; Bernardes, A.M.; Ferreira, J.Z.; Tenório, J.A.S.; de Fraga Malfatti, C. Recovery of copper from printed circuit boards scraps by mechanical processing and electrometallurgy. J. Hazard. Mater. 2006, 137, 1704–1709. [Google Scholar] [CrossRef] [PubMed]
  7. Ogunniyi, I.O.; Vermaak, M.K.G.; Groot, D.R. Chemical composition, and liberation characterization of printed circuit board comminution fines for beneficiation investigations. Waste Manag. 2009, 29, 2140–2146. [Google Scholar] [CrossRef] [PubMed]
  8. Chicardi, E.; Lopez-Paneque, A.; García-Orta, V.H.G.; Sepúlveda-Ferrer, R.E.; Gallardo, J.M. Enrichment Methods for Metal Recovery from Waste from Electrical and Electronic Equipment: A Brief Review. Metals 2025, 15, 140. [Google Scholar] [CrossRef]
  9. Kumar, A.; Holuszko, M.; Espinosa, D.C.R. E-waste: An overview on generation, collection, legislation, and recycling practices. Resour. Conserv. Recycl. 2017, 122, 32–42. [Google Scholar] [CrossRef]
  10. Wu, J.; Li, J.; Xu, Z. Electrostatic separation for recovering metals and nonmetals from waste printed circuit board: Problems and improvements. Environ. Sci. Technol. 2008, 42, 5272–5276. [Google Scholar] [CrossRef] [PubMed]
  11. de Oliveira, C.M.; Bellopede, R.; Tori, A.; Zanetti, G.; Marini, P. Gravity and Electrostatic Separation for Recovering Metals from Obsolete Printed Circuit Board. Materials 2022, 15, 1874. [Google Scholar] [CrossRef] [PubMed]
  12. EU Parliament and Council. Directive 2012/19/EU on Waste Electrical and Electronic Equipment (WEEE). Off. J. Eur. Union 2012. Available online: https://eur-lex.europa.eu/eli/dir/2012/19/2024-04-08 (accessed on 23 June 2025).
  13. Guo, C.; Wang, H.; Liang, W.; Fu, J.; Yi, X. Liberation characteristic and physical separation of printed circuit board (PCB). Waste Manag. 2011, 31, 2161–2166. [Google Scholar] [CrossRef] [PubMed]
  14. Suponik, T.; Franke, D.M.; Nuckowski, P.M.; Matusiak, P.; Kowol, D.; Tora, B. Impact of Grinding of Printed Circuit Boards on the Efficiency of Metal Recovery by Means of Electrostatic Separation. Minerals 2021, 11, 281. [Google Scholar] [CrossRef]
  15. ISO 3310-1:2016; Test Sieves—Technical Requirements and Testing—Part 1: Test Sieves of Metal Wire Cloth. AENOR: Madrid, Spain, 2016.
  16. Holgersson, S.; Steenari, B.M.; Björkman, M.; Cullbrand, K. Analysis of the metal content of small-size Waste Electric and Electronic Equipment (WEEE) printed circuit boards—Part 1: Internet routers, mobile phones and smartphones. Resour. Conserv. Recycl. 2018, 133, 300–308. [Google Scholar] [CrossRef]
  17. Luyima, A.; Shi, H.; Zhang, L. Leaching studies for metals recovery from waste printed wiring boards. JOM 2011, 63, 38–41. [Google Scholar] [CrossRef]
  18. Sheng, P.P.; Etsell, T.H. Recovery of gold from computer circuit board scrap using aqua regia. Waste Manag. Res. 2007, 25, 380–383. [Google Scholar] [CrossRef] [PubMed]
  19. Lindley, K.S.; Rowson, N.A. Feed preparation factors affecting the efficiency of electrostatic separation. Phys. Sep. Sci. Eng. 1997, 8, 161–173. [Google Scholar] [CrossRef]
  20. Gehringer, S.; Luckeneder, C.; Flachberger, H. Systematic Separation Studies on Finely Dispersed Raw Magnesite by Using Triboelectrostatic Belt Separation. BHM Berg- Und Hüttenmänn. Monatsh. 2020, 165, 364–368. [Google Scholar] [CrossRef]
Figure 1. Schematic diagram for a drum electrostatic separator. Courtesy of Hamos company.
Metals 15 00826 g001
Figure 2. Particle size distribution for PCB raw material.
Metals 15 00826 g002
Figure 3. Percentage of different output fractions (a) and metallic percentage over the different fractions (be) after the electrostatic separation tests for variation in the feed flow rate.
Metals 15 00826 g003
Figure 4. Percentage of different output fractions (a) and metallic percentage over the different fractions (be) after the electrostatic separation tests for variation in the electrode voltages.
Metals 15 00826 g004
Figure 5. Percentage of different output fractions (a) and metallic percentage over the different fractions (be) after the electrostatic separation tests for variation in the drum speed.
Metals 15 00826 g005
Table 1. Experimental conditions for specimens from electrostatic separation. Green boxes: feed flow rate modification. Pink boxes: electrode voltage modification. Blue boxes: drum speed modification.
Operating Conditions *Feed Flow Rate
(kg/h)
Electrode Voltage (kV)Drumm Speed (rpm)
FR30-EV35-DS20303520
FR75-EV35-DS2075
FR120-EV35-DS20120
FR30-EV25-DS40302540
FR30-EV30-DS4030
FR30-EV40-DS4040
FR30-EV40-DS20304020
FR30-EV40-DS4040
FR30-EV40-DS100100
* FR = Feed Rate; EV = Electrode Voltage; DS = Drum Speed.
Table 2. Metallic composition from original MG crushed PCBs, shown alphabetically.
SampleAl (wt.%)Ag (ppm) #Au (ppm) #Cu (wt.%)Fe (wt.%)Ni (wt.%)Pd (ppm) #Si (wt.%)Sn (wt.%)
Crushed PCBs12.7 ± 1.2858 ± 23467 ± 1421.4 ± 1.20.7 ± 0.31.6 ± 0.39.9 ± 1.03.8 ± 0.44.7 ± 0.9
# ppm values can be converted to wt.% by dividing by 10,000 (1 ppm = 1 × 10⁻⁴ wt.%).
Table 3. Physical characterization (mass percentage, density, and plastic percentage) for distinct phases obtained from specimens tested at different feed flow rates.
Operating Conditions *Output Fraction **Mass
(wt.%)
Density (g/cm3)Plastics (wt.%)
FR30-EV35-DS20CF64.6 ± 2.25.72.8 ± 0.2
NCF31.0 ± 2.32.144.1 ± 1.2
MIX1.4 ± 0.13.17.3 ± 0.7
FR75-EV35-DS20CF69.5 ± 3.27.71.9 ± 0.7
NCF27.7 ± 2.32.032.2 ± 2.3
MIX2.8 ± 1.02.216.7 ± 3.0
FR120-EV35-DS20CF78.9 ± 2.38.12.1 ± 0.6
NCF16.1 ± 2.21.939.6 ± 2.5
MIX3.0 ± 0.52.912.1 ± 1.8
* FR = feed rate; EV = electrode voltage; DS = drum speed; ** CF: conductive fraction; NCF: non-conductive fraction; MIX: mixed fraction.
Table 4. Composition of distinct phases obtained from specimens tested at different feed flow rates.
Operating
Conditions *
FractionAg
(ppm)
Au
(ppm) #
Cu (wt.%)Ni (wt.%)Pd
(ppm) #
Sn
(wt.%)
FR30-EV35-DS20NCF **627 ± 21123.0 ± 15.512.3 ± 1.10.05 ± 0.015.8 ± 0.50.9 ± 0.1
AP ##194 ± 1438.1 ± 8.03.8 ± 0.60.02 ± 0.011.8 ± 0.20.3 ± 0.1
MP @22.6 ± 3.28.2 ± 2.017.8 ± 2.61.0 ± 0.218.2 ± 2.25.9 ± 0.3
FR75-EV35-DS20NCF431 ± 16121.0 ± 10.311.1 ± 0.60.07 ± 0.016.6 ± 1.41.6 ± 0.1
AP119 ± 1133.5 ± 3.63.1 ± 0.20.02 ± 0.011.8 ± 0.10.4 ± 0.1
MP13.9 ± 1.37.2 ± 1.314.4 ± 0.41.2 ± 0.118.4 ± 0.59.4 ± 0.2
FR120-EV35-DS20NCF445 ± 22122 ± 1216.7 ± 1.20.06 ± 0.013.3 ± 0.20.9 ± 0.1
AP72 ± 1619.6 ± 0.62.7 ± 0.10.01 ± 0.010.5 ± 0.10.2 ± 0.1
MP8.4 ± 3.04.2 ± 0.212.6 ± 1.00.6 ± 0.15.4 ± 0.23.1 ± 0.1
* FR = feed rate; EV = electrode voltage; DS = drum speed; ** NCF: non-conductive fraction; ## AP: absolute percentage over the initial PCB; @ MP: metallic percentage over the initial metallic amount; # ppm values can be converted to wt.% by dividing by 10,000 (1 ppm = 1 × 10⁻⁴ wt.%).
Table 5. Physical characterization (mass percentage, density, and plastic percentage) of distinct phases obtained from specimens tested at different electrode voltages.
Operating Conditions *Output Fraction **Mass
(wt.%)
Density (g/cm3)Plastics (wt.%)
FR30-EV25-DS40CF31.4 ± 2.24.8<1
NCF52.2 ± 3.22.329.1 ± 3.3
MIX16.4 ± 1.92.424.7 ± 2.3
FR30-EV30-DS40CF24.6 ± 1.95.8<1
NCF57.8 ± 5.82.330.5 ± 4.0
MIX17.7 ± 3.12.516.1 ± 2.7
FR30-EV40-DS40CF22.2 ± 1.25.3<1
NCF57.5 ± 4.02.233.4 ± 1.9
MIX20.2 ± 1.63.0<1
* FR = feed rate; EV = electrode voltage; DS = drum speed; ** CF: conductive fraction; NCF: non-conductive fraction; MIX: mixed fraction.
Table 6. Composition of distinct phases obtained from specimens tested at different electrode voltages.
Operating
Conditions *
FractionAg
(ppm) #
Au
(ppm) #
Cu (wt.%)Ni (wt.%)Pd
(ppm) #
Sn
(wt.%)
FR30-EV25-DS40NCF **431 ± 13121 ± 1210.1 ± 0.90.07 ± 0.017.6 ± 0.21.6 ± 0.2
AP ##225 ± 1263 ± 55.3 ± 1.20.04 ± 0.014.0 ± 0.40.8 ± 0.1
MP @26.2 ± 3.213.5 ± 3.624.6 ± 3.22.3 ± 0.140.1 ± 4.317.8 ± 1.2
FR30-EV30-DS40NCF484 ± 2580 ± 2.713.9 ± 1.80.07 ± 0.019.7 ± 2.11.3 ± 0.1
AP279 ± 2346 ± 5.58.0 ± 1.00.04 ± 0.015.6 ± 1.00.8 ± 0.1
MP32.6 ± 6.69.9 ± 1.737.5 ± 3.02.5 ± 0.356.6 ± 5.616.0 ± 1.3
FR30-EV40-DS40NCF444 ± 18123 ± 1616.7 ± 2.50.06 ± 0.023.3 ± 0.80
AP255 ± 2971 ± 109.6 ± 0.80.03 ± 0.011.9 ± 0.30
MP29.8 ± 4.315.1 ± 2.244.9 ± 2.92.2 ± 0.119.2 ± 3.90
* FR = feed rate; EV = electrode voltage; DS = drum speed; ** NCF: non-conductive fraction; ## AP: absolute percentage over the initial PCB; @ MP: metallic percentage over the initial metallic amount; # ppm values can be converted to wt.% by dividing by 10,000 (1 ppm = 1 × 10⁻⁴ wt.%).
Table 7. Physical characterization (mass percentage, density, and plastic percentage) of distinct phases obtained from specimens tested at different drum speeds.
Operating Conditions *Output Flow Type **Mass
(wt.%)
Density (g/cm3)Plastics (wt.%)
FR30-EV40-DS20CF76.6 ± 9.15.6<1
NCF18.7 ± 3.42.048.8 ± 5.2
MIX4.7 ± 1.23.038.5 ± 3.0
FR30-EV40-DS40CF24.4 ± 2.55.2<1
NCF55.9 ± 6.02.333.4 ± 2.7
MIX19.7 ± 3.03.0<1
FR30-EV40-DS100CF39.3 ± 2.15.6<1
NCF47.2 ± 3.62.043.0 ± 4.0
MIX13.5 ± 1.92.418.9 ± 3.3
* FR = feed rate; EV = electrode voltage; DS = drum speed. ** CF: conductive fraction; NCF: non-conductive fraction; MIX: mixed fraction.
Table 8. Composition of distinct phases obtained from specimens tested at different drum speeds.
Operating
Conditions*
FractionAg
(ppm) #
Au
(ppm) #
Cu (wt.%)Ni (wt.%)Pd
(ppm) #
Sn
(wt.%)
FR30-EV40-DS20NCF **643 ± 23124 ± 1613.7 ± 1.50.04 ± 0.0120.4 ± 3.20.7 ± 0.1
AP ##120 ± 823.2 ± 4.02.6 ± 0.203.8 ± 0.30.1 ± 0.1
MP @14.0 ± 1.35.0 ± 0.512.0 ± 2.00.5 ± 0.138.5 ± 4.92.8 ± 0.2
FR30-EV40-DS40NCF148 ± 1704.5 ± 1.10.04 ± 0.013.5 ± 0.20.7 ± 0.1
AP82.7 ± 11.002.5 ± 0.602.0 ± 0.20.4 ± 0.1
MP9.6 ± 1.6011.8 ± 0.81.4 ± 0.219.8 ± 3.58.3 ± 0.3
FR30-EV40-DS100NCF103 ± 8.2013.2 ± 1.90.08 ± 0.0101.7 ± 0.2
AP48.6 ± 5.006.2 ± 1.2000.8 ± 0.1
MP5.7 ± 1.7029.1 ± 2.22.4 ± 1.0017.1 ± 0.2
* FR = feed rate; EV = electrode voltage; DS = drum speed; ** NCF: non-conductive fraction; ## AP: absolute percentage over the initial PCB; @ MP: metallic percentage over the initial metallic amount; # ppm values can be converted to wt.% by dividing by 10,000 (1 ppm = 1 × 10⁻⁴ wt.%).
Disclaimer/Publisher’s Note: The statements, opinions and data contained in all publications are solely those of the individual author(s) and contributor(s) and not of MDPI and/or the editor(s). MDPI and/or the editor(s) disclaim responsibility for any injury to people or property resulting from any ideas, methods, instructions or products referred to in the content.

