Article

Modeling Mechanical Properties of Industrial C-Mn Cast Steels Using Artificial Neural Networks

by
Saurabh Tiwari
1,†,
Seongjun Heo
1,†,
Nokeun Park
1,2,* and
Nagireddy Gari S. Reddy
3,*
1
School of Materials Science and Engineering, Yeungnam University, Gyeongsan 38541, Republic of Korea
2
Institute of Materials Technology, Yeungnam University, Gyeongsan 38541, Republic of Korea
3
Virtual Materials Laboratory, School of Materials Science and Engineering, Engineering Research Institute, Gyeongsang National University, Jinju 52828, Republic of Korea
*
Authors to whom correspondence should be addressed.
These authors contributed equally to this work.
Metals 2025, 15(7), 790; https://doi.org/10.3390/met15070790
Submission received: 30 April 2025 / Revised: 7 July 2025 / Accepted: 10 July 2025 / Published: 12 July 2025
(This article belongs to the Special Issue Advances in Constitutive Modeling for Metals and Alloys)

Abstract

This study develops a comprehensive artificial neural network (ANN) model for predicting the mechanical properties of carbon–manganese cast steel, specifically, the yield strength (YS), tensile strength (TS), elongation (El), and reduction of area (RA), based on the chemical composition (16 alloying elements) and heat treatment parameters. The neural network model, employing a 20-44-44-4 architecture and trained on 400 samples from an industrial dataset of 500 samples, achieved 90% of test predictions within a 5% deviation from actual values, with mean prediction errors of 3.45% for YS and 4.9% for %EL. A user-friendly graphical interface was developed to make these predictive capabilities accessible, without requiring programming expertise. Sensitivity analyses revealed that increasing the copper content from 0.05% to 0.2% enhanced the yield strength from 320 to 360 MPa while reducing the ductility, whereas niobium functioned as an effective grain refiner, improving both the strength and ductility. The combined effects of carbon and manganese demonstrated complex synergistic behavior, with the yield strength varying between 280 and 460 MPa and the tensile strength ranging from 460 to 740 MPa across the composition space. Optimal strength–ductility balance was achieved at moderate compositions of 1.0–1.2 wt% Mn and 0.20–0.24 wt% C. The model provides an efficient alternative to costly experimental trials for optimizing C-Mn steels, with prediction errors consistently below 6% compared with 8–20% for traditional empirical methods. This approach establishes quantitative guidelines for designing complex multi-element alloys with targeted mechanical properties, representing a significant advancement in computational material engineering for industrial applications.

Graphical Abstract

1. Introduction

Carbon-manganese (C-Mn) cast steels represent a cornerstone material class for modern industrial applications, combining exceptional mechanical properties with economic viability. These alloys, characterized by carbon contents ranging from 0.2% to 0.6% and strategic manganese addition, exhibit superior strength-to-weight ratios, enhanced ductility, and remarkable wear resistance, making them indispensable for automotive components, structural elements, and heavy machinery applications [1,2,3,4]. The synergistic effects of carbon and manganese create a biphasic microstructure where carbon strengthens through pearlite formation and solid solution hardening, while manganese significantly improves hardenability and promotes austenite stability, resulting in enhanced strength–ductility combinations [2,4]. Precise control of minor alloying elements such as chromium (Cr), nickel (Ni), molybdenum (Mo), copper (Cu), and niobium (Nb) enables sophisticated microstructural engineering to meet increasingly demanding industrial requirements [5,6].
The mechanical properties of C-Mn cast steels are governed by complex interactions between the chemical composition, microstructural evolution, and thermal processing parameters. Recent advances in understanding these relationships have revealed that chromium provides solid solution strengthening in ferrite while enhancing corrosion resistance; nickel improves toughness through austenite stabilization; molybdenum contributes to high-temperature strength through carbide formation; copper enhances precipitation hardening through coherent precipitate formation; and niobium refines grain structures through carbonitride precipitation and microalloying effects [7,8,9,10,11]. The precipitation behavior of Cu-rich particles and Nb(C,N) precipitates significantly influence the strengthening mechanisms, whereas the austenite-to-ferrite transformation kinetics are fundamentally altered by these microalloying additions [12,13]. Heat treatment parameters, including heating temperature (890–940 °C), soaking time (1–4 h), and cooling rate, fundamentally alter the microstructural constituents from ferrite-pearlite to bainitic or martensitic structures, thereby controlling the final mechanical properties through transformation-induced plasticity (TRIP) and transformation-induced strengthening mechanisms [14,15,16]. Recent investigations have demonstrated that controlled cooling rates can achieve optimal bainite fractions ranging from 25% to 60%, directly correlating with enhanced yield strengths between 480 and 520 MPa in low-carbon, medium-manganese steels [17,18].
Traditional experimental approaches for optimizing C-Mn steel compositions and heat treatment parameters are time-consuming, expensive, and often provide limited insight into complex multi-element interactions. Machine learning techniques, particularly artificial neural networks (ANNs), have emerged as powerful tools for material property prediction, offering the capability to model nonlinear relationships between composition, processing parameters, and mechanical properties [6,19,20]. Recent comprehensive reviews have highlighted significant progress in ML applications for steel property prediction, with particular emphasis on the evolution from simple regression models to sophisticated deep learning architectures [21]. Significant advances have been made in various applications of steel. Bartsch et al. [22] developed neural networks to achieve high accuracy in predicting the fatigue strength of structural steel details using European industrial databases, whereas recent work on 316 L stainless steel has shown that ML models successfully optimize selective laser melting processes with R2 values exceeding 0.95 [22,23]. Wang et al. [24] demonstrated that random forest algorithms can effectively predict the mechanical properties of hot-rolled steel strips, achieving superior performance compared to traditional statistical methods. However, most existing models focus on limited compositional ranges or specific steel grades, with insufficient attention paid to the comprehensive effects of multiple alloying elements and heat treatment interactions in industrial C-Mn cast steels.
Explainable artificial intelligence (XAI) approaches have gained prominence in materials science because they provide interpretable insights into model predictions. Recent systematic reviews have identified XAI as a critical component for advancing material discovery, with particular emphasis on feature attribution methods and sensitivity analysis values for understanding complex material–property relationships [25,26]. Butler et al. [27] emphasized that explainable machine learning models are essential for materials scientists to gain physical insights from AI predictions, whereas recent manufacturing applications have demonstrated how XAI enhances transparency and trust in AI-powered industrial systems [28]. This interpretability is crucial for industrial applications, where understanding the underlying metallurgical principles is as important as the predictive accuracy, particularly in quality control and process optimization scenarios [29,30].
The primary objective of this study was to develop a comprehensive ANN model for predicting the mechanical properties of industrial C-Mn cast steels, specifically the yield strength (YS), tensile strength (TS), elongation (El), and reduction of area (RA), based on the complete chemical composition and heat treatment parameters. This research addresses four critical gaps in the current literature: (1) comprehensive analysis of all significant alloying elements, including Cr, Ni, Mo, Cu, and Nb, alongside C and Mn with detailed microstructural interpretation; (2) integration of detailed heat treatment parameters with compositional effects through thermodynamic considerations; (3) development of an interpretable model using explainable AI techniques that provide metallurgical insights alongside predictive capabilities; and (4) validation using extensive industrial datasets representing real manufacturing variability. The model utilizes an extensive industrial dataset from Kharagpur Metal Reforming Industries Private Limited (KMRIPL), encompassing 500 samples with 16 alloying elements and four heat treatment parameters, representing real-world manufacturing conditions with compositional variations typical of commercial C-Mn cast steel production. Through systematic feature analysis, correlation mapping, sensitivity studies, microstructural interpretation, and explainable AI techniques, this study aims to bridge the gap between advanced machine learning capabilities and practical metallurgical engineering, providing both accurate predictions and fundamental insights into C-Mn steel behavior that can guide industrial process optimization and quality control strategies.

2. Materials and Methods

2.1. The Material Data Preprocessing

The Kharagpur Metal Reforming Industry (KMRIPL-India) produces C-Mn steels using various casting methodologies, including sand casting, investment casting, and centrifugal casting. The industry systematically collects data pertaining to diverse steel grades, with an emphasis on their chemical compositions, heat-treatment protocols, and mechanical characteristics. Table 1 presents a comprehensive summary of the ranges of composition, heat-treatment parameters, and mechanical properties that were scrutinized. The entire dataset is shown in Supplementary Data S1.
Raw materials from railways, automobiles, and steel plants introduce impurities during melting. Its chemical composition includes elements such as carbon (C), manganese (Mn), silicon (Si), sulfur (S), phosphorus (P), chromium (Cr), nickel (Ni), molybdenum (Mo), vanadium (V), tungsten (W), titanium (Ti), tin (Sn), aluminum (Al), and iron (Fe). The mechanical properties, such as the yield strength (YS), tensile strength (TS), elongation (El), and reduction of area (RA), are output parameters.
C-Mn steels are subjected to a range of thermal treatments including stress relief, annealing, normalizing, hardening, and tempering. The heat treatment process consisted of the following stages: (1) Heating Phase: Steel samples were heated to temperatures ranging from 890 to 940 °C over a period of 8.5–12 h at a controlled heating rate. (2) Soaking Time: this refers to the isothermal holding period (1–4 h) at the target temperature to ensure uniform temperature distribution throughout the steel cross-section and complete phase transformation. (3) Cooling Phase: the cooling time (2–13 h) represents the controlled cooling process from the soaking temperature to the ambient temperature. The cooling rate varies depending on the desired microstructure and mechanical properties, ranging from slow furnace cooling (annealing) to accelerated air cooling (normalization). These are conventional thermal processing methods for carbon-manganese steels to optimize their mechanical properties through microstructural control rather than precipitation-hardening treatments.

Data Preprocessing

The dataset used in this study was collected from the Kharagpur Metal Reforming Industry and consists of 630 samples of industrial cast steel compositions and processing conditions. The cast steel components are primarily used for railway applications (axles, wheels, and structural frames), automotive parts (chassis and suspension components), general structural applications (beams, plates, and fabricated structures), and cast components for machinery and equipment. Based on the chemical composition ranges (C: 0.119–0.299 wt%, Mn: 0.624–1.548 wt%) and the presence of microalloying elements (V: 0.001–0.019 wt%, Nb: 0.000–0.008 wt%, Ti: 0.001–0.027 wt%), the samples represent a diverse range of industrial cast steels that includes C-Mn cast steels, microalloyed cast steels, and potentially some high-strength low-alloy cast steel compositions. The compositional diversity corresponds to various international cast steel standards, including general engineering cast steels (EN 10293), structural cast steels (EN 10340), and pressure vessel cast steels (EN 10213) [31,32,33]. During data cleaning, 130 records were removed due to incompleteness, vague entries, or evident outliers identified through visual inspection. The remaining 500 complete and consistent records were used for model development, acknowledging that the dataset encompasses multiple cast steel categories with varying alloying strategies and metallurgical characteristics.
The remaining 500 complete and consistent records were used for the model development. All input and output variables of these 500 samples were normalized to a range between 0.1 and 0.9 to ensure uniform scaling and efficient convergence during ANN training. This min–max normalization approach helps avoid numerical dominance by variables with larger ranges and improves training stability. For the ANN model development, the dataset was split into 80% for training (400 samples) and 20% for testing (100 samples) using random selection. A separate validation set was not used in this study.

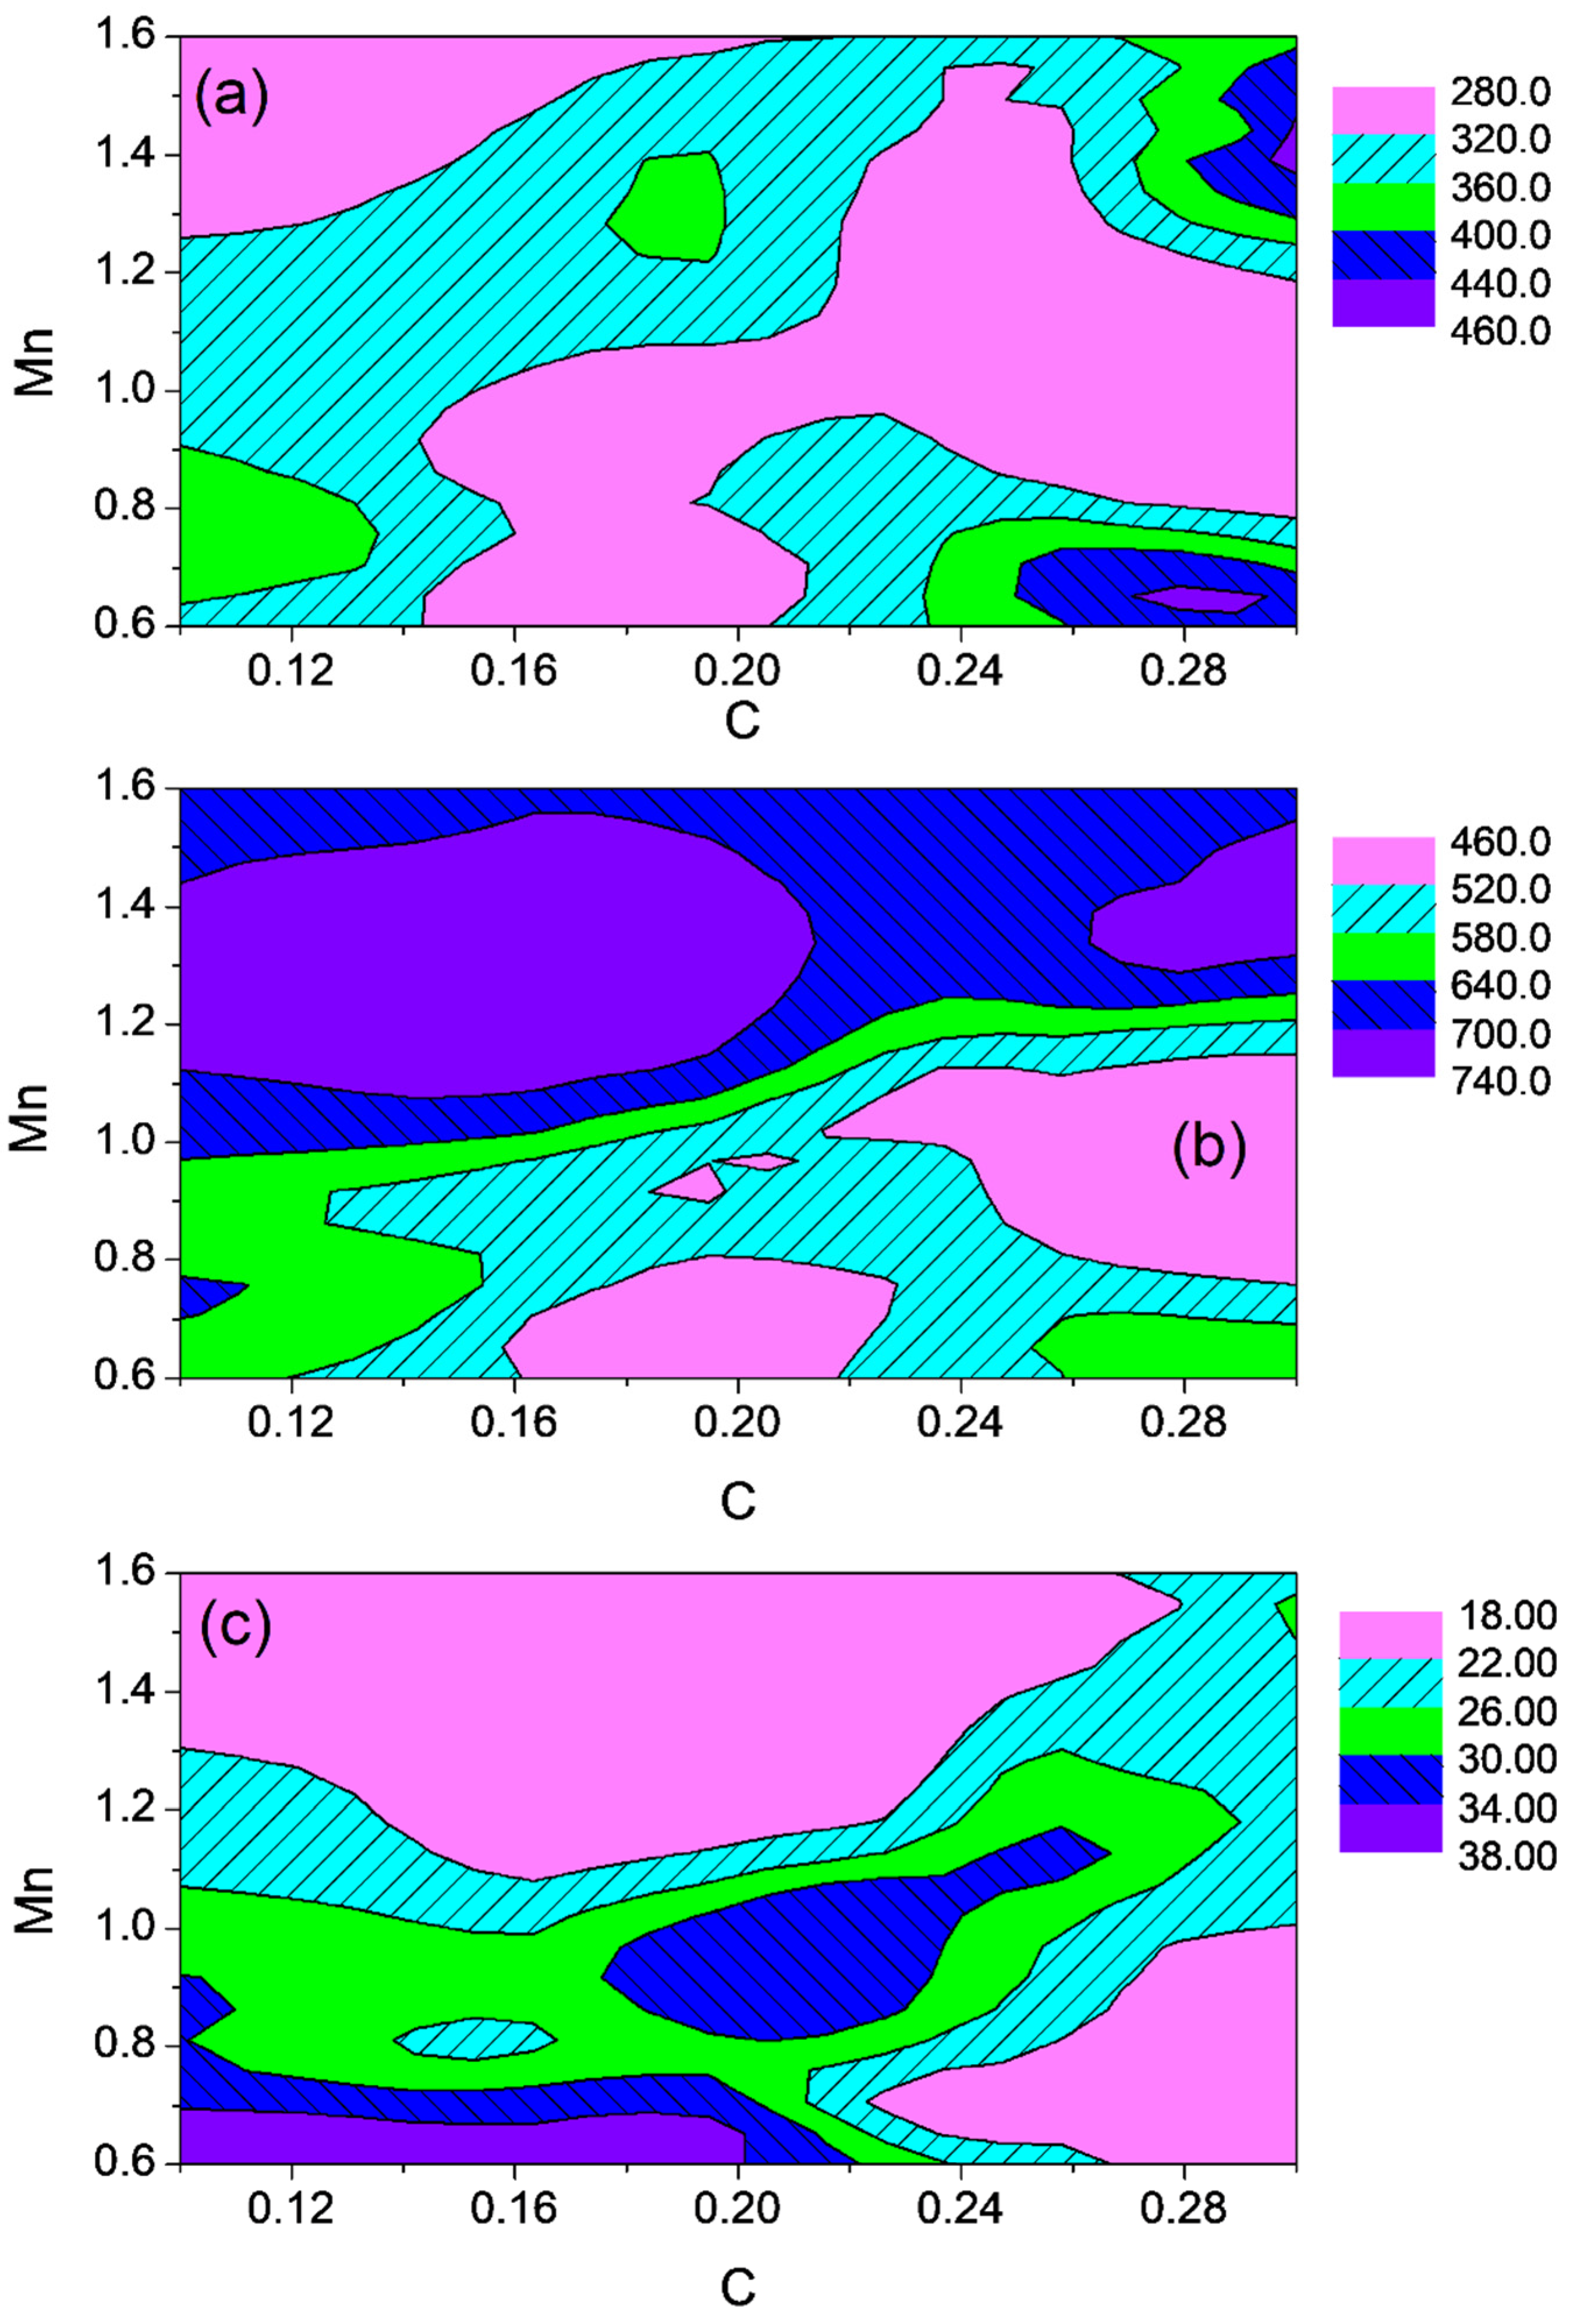
2.2. Visualizing the Relationship Between Composition, Heat Treatment, and Mechanical Properties

To observe the interdependencies among the processing parameters, alloying elements, and mechanical properties, a correlation heatmap was constructed (Figure 1). Rather than serving as a conclusive analysis, this visualization captures the statistical distribution and general trends across a broader compositional and thermal dataset, offering insight into the multivariate relationships that govern the mechanical behavior of C-Mn steels. The correlation coefficients revealed the distinct roles of various alloying elements. Nb, Cr, and V showed moderate positive correlations with the yield strength (YS: 0.028, 0.048, and 0.107, respectively) and tensile strength (TS: 0.026, 0.013, and 0.046, respectively), which is in agreement with their roles in solid solution strengthening, precipitation hardening, and grain refinement. Al demonstrated a more pronounced association with ductility and was positively correlated with elongation (EL: 0.004) and reduction of area (RA: 0.073). In contrast, Fe showed a significant negative correlation with YS (−0.093) and TS (−0.024), suggesting that excessive Fe content may compromise the strength. The thermal processing parameters strongly influence the mechanical performance. The increased heating temperature correlates positively with both the YS and TS (0.271), which is likely due to the enhanced dissolution of the secondary phases.
Extended heating and soaking times showed stronger associations with strength (YS: 0.427 and 0.196, respectively; TS: 0.422 and 0.320, respectively), indicating improved microstructural homogenization and phase stabilization. However, prolonged cooling times were negatively correlated with YS (−0.262) and TS (−0.282), likely due to microstructural coarsening or precipitate overgrowth. Notably, the mechanical properties displayed characteristic interrelationships. YS and TS are highly correlated (0.82), reflecting their shared dependence on microstructural hardening mechanisms. However, both properties exhibit inverse relationships with ductility metrics (EL and RA), highlighting the classical trade-off between strength and plasticity.
The strong positive correlation between the EL and RA (0.608) underscores their mutual association with fracture resistance. Taken together, the heatmap facilitates a data-driven understanding of the complex interplay between composition, processing, and mechanical performance. These correlations establish a framework for the targeted design and optimization of advanced C-Mn steels while guiding more detailed mechanistic investigations in subsequent sections.

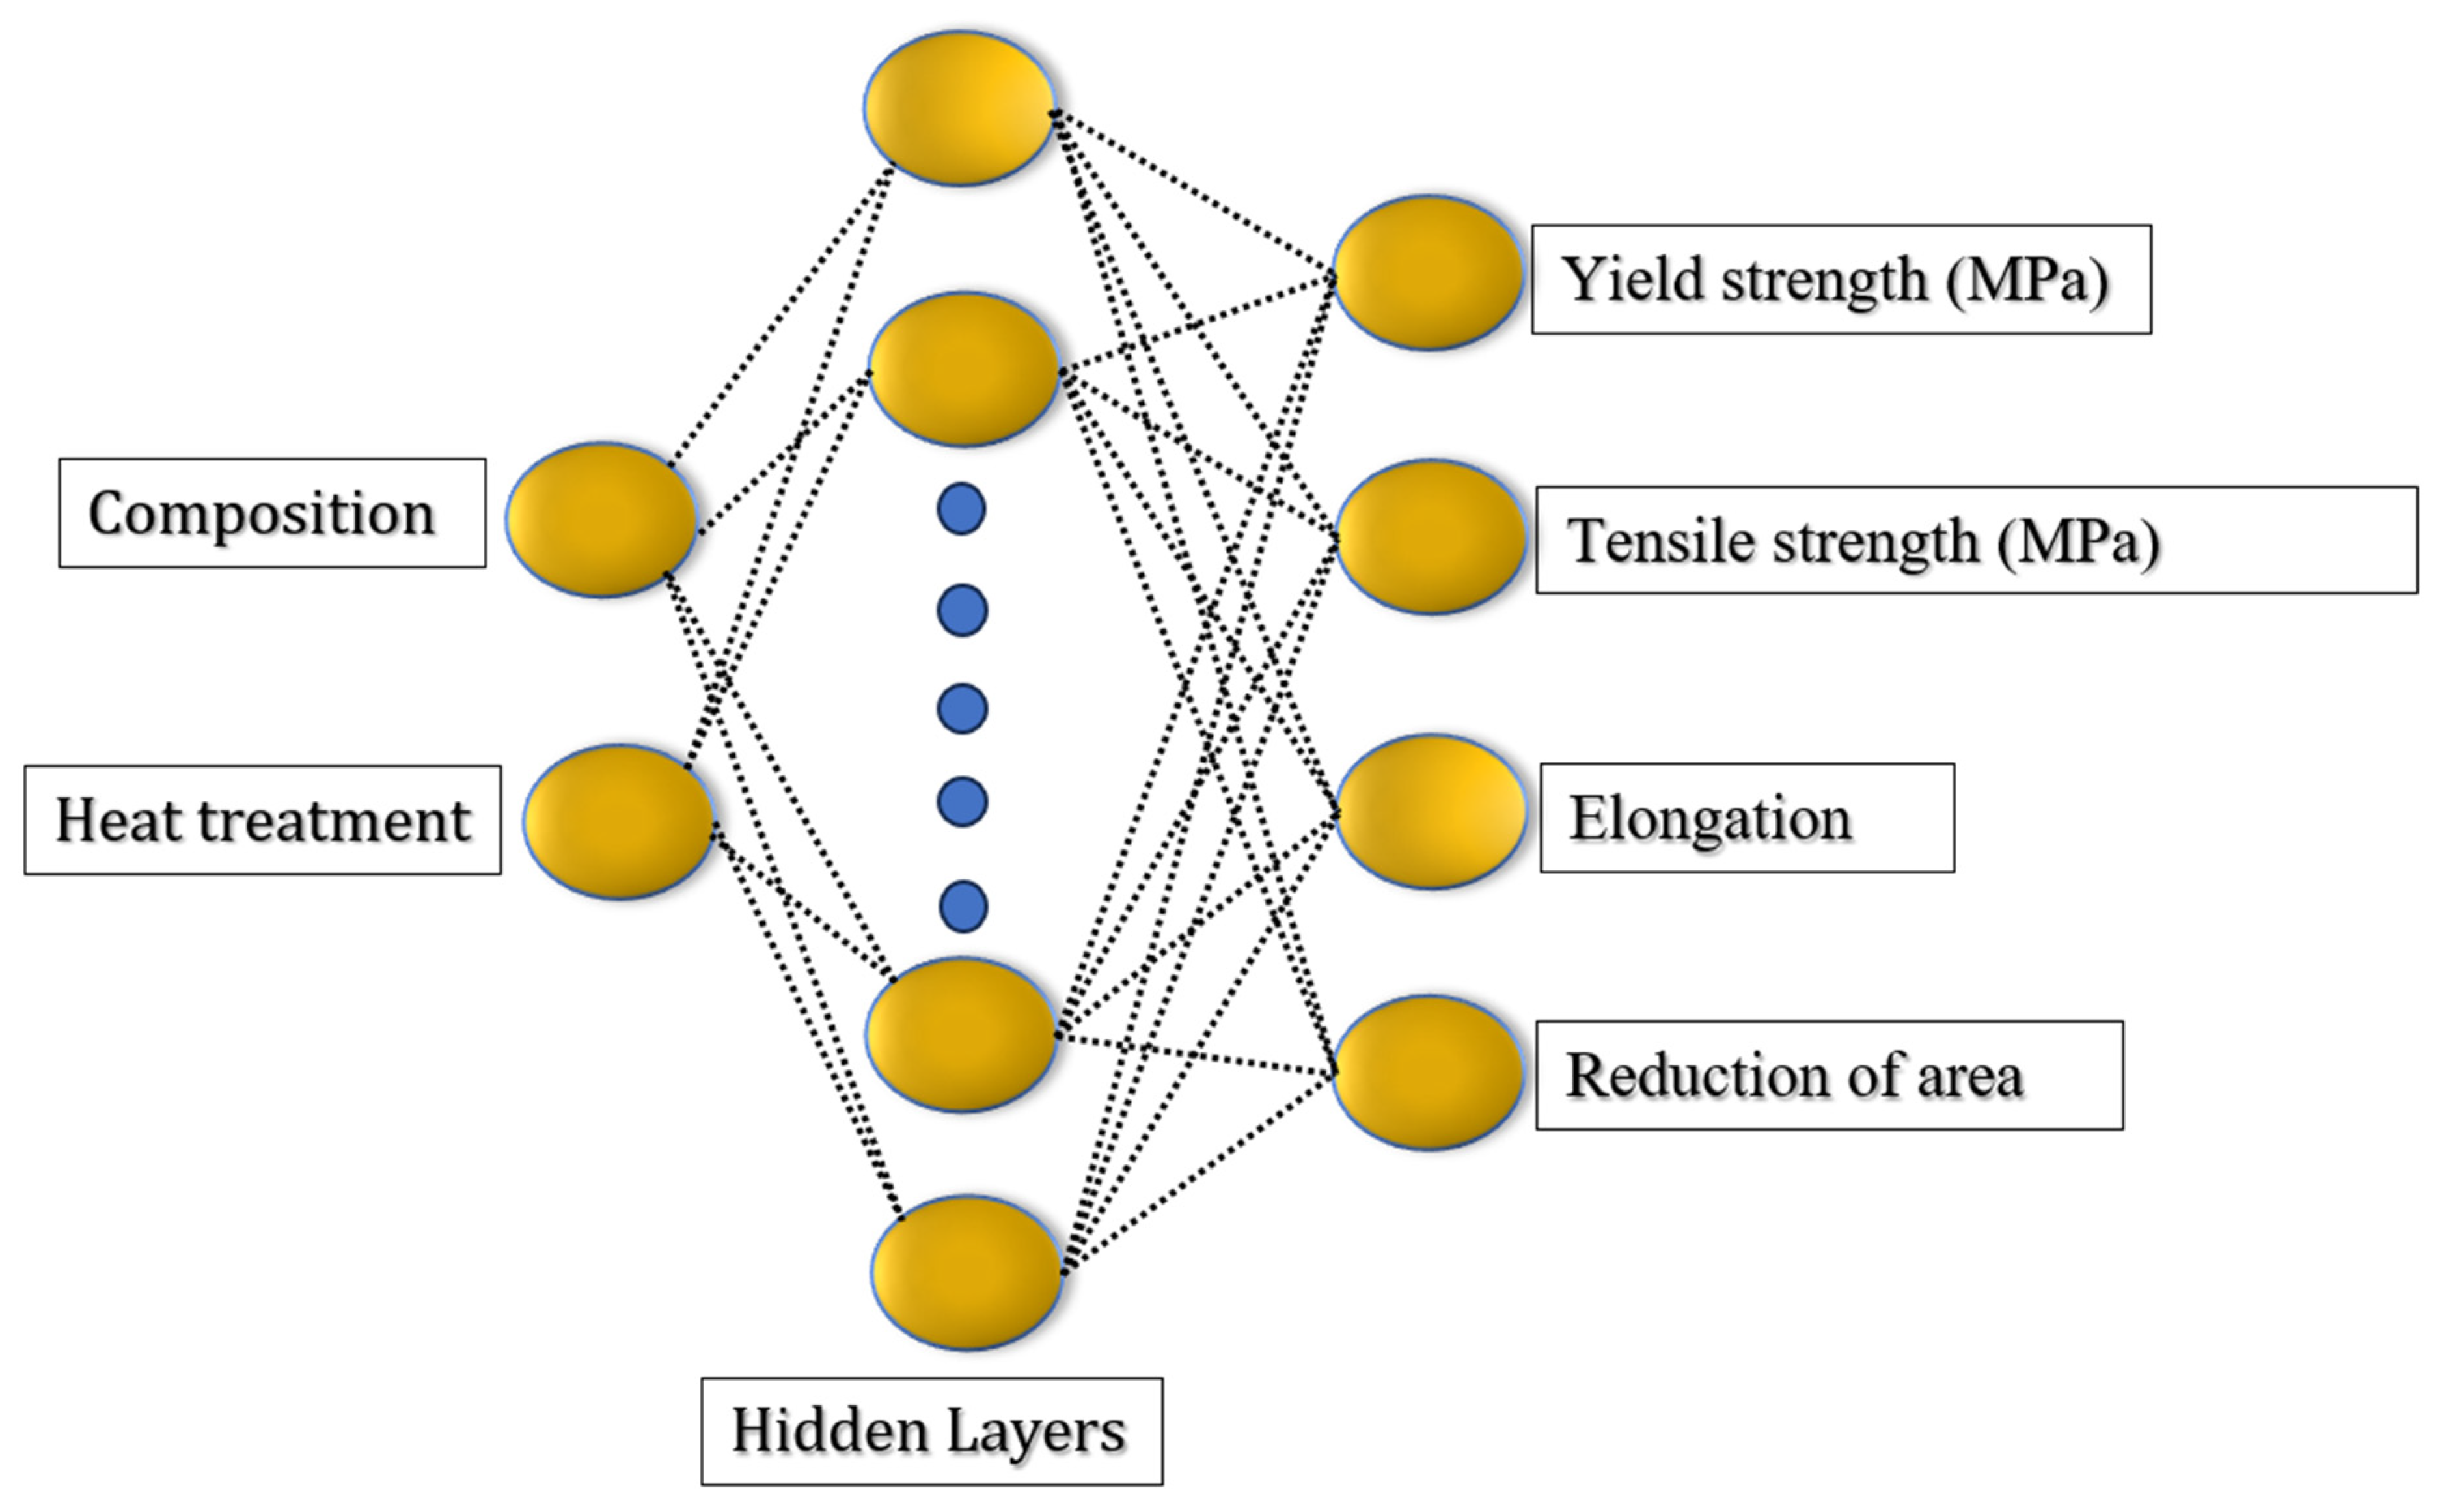
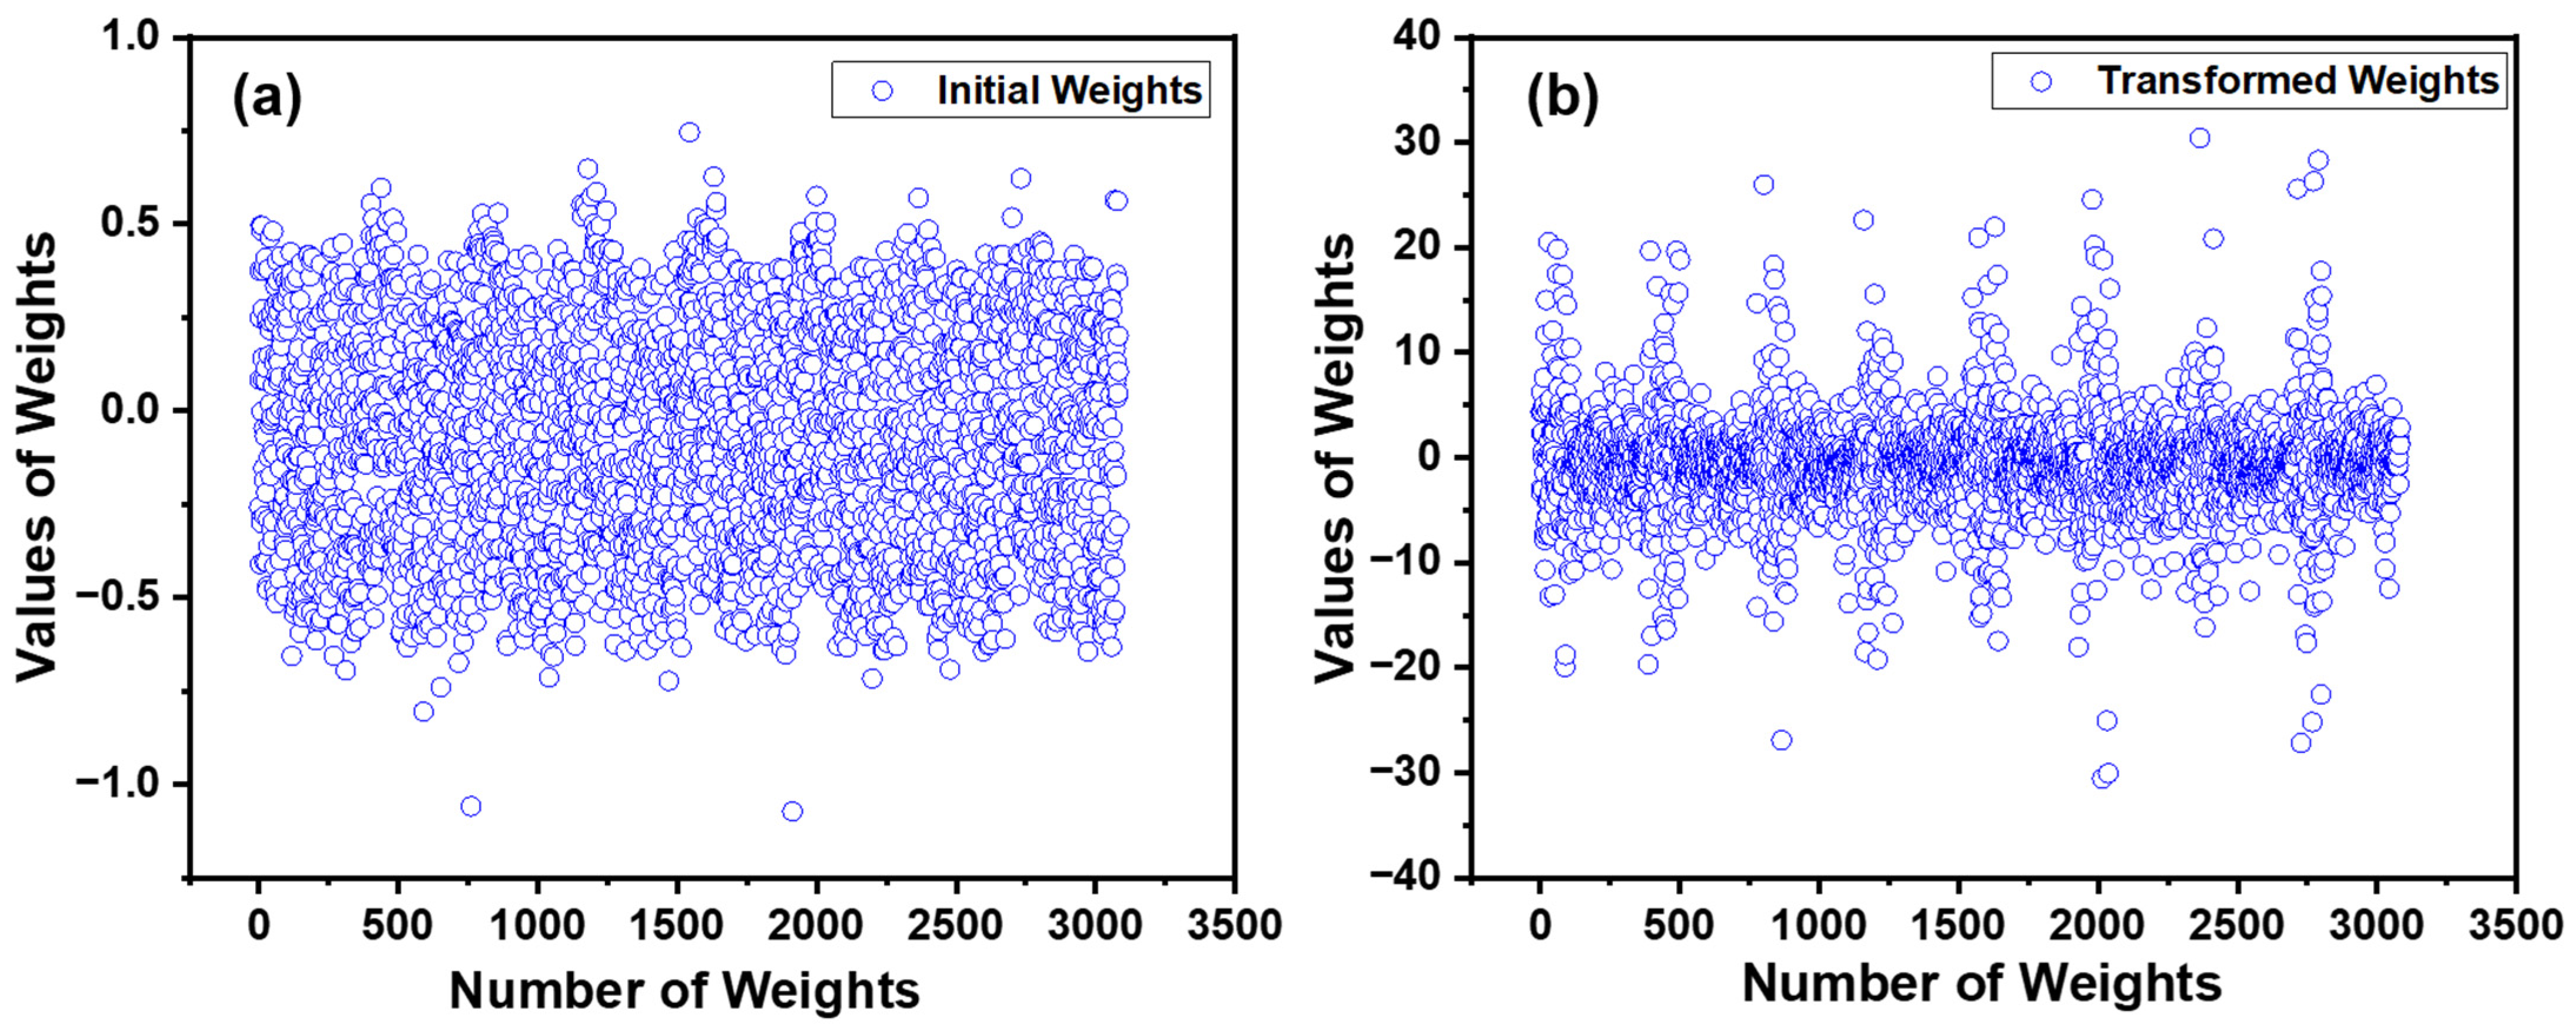
3. Developing ANN Model

An FFNN was developed to predict the mechanical properties of alloys based on their elemental composition and heat-treatment parameters. The network was trained using a back-propagation algorithm with a sigmoid activation function. The model architecture consists of an input layer, hidden layers, and output layer (Figure 2). Custom software coded in the C programming language (C99) was used for the implementation [14,15,16]. The input features included the heating time, heating temperature, soaking time, cooling time, and alloy composition, whereas the output targets were yield strength (YS), tensile strength (TS), elongation (El), and reduction of area (RA). The full dataset comprised 500 samples, which were randomly divided into a training set (400 samples) and a validation set (100 samples) to evaluate the generalization performance of the model. To ensure efficient training and convergence, both the input and output variables were normalized to a range of 0.1 to 0.9, according to Equation (1) [34]:
x n = ( x x m i n ) × 0.8 ( x m a x x m i n ) + 0.1
where x n represents the normalized value x, and x m a x   a n d   x m i n denote the maximum and minimum values of x, respectively. After identifying the optimal trained network, the transformed data were reverted to their original scale using (2) [34].
x = x n 0.1 × ( x m a x x m i n ) 0.8
This process converts the data into dimensionless quantities, eliminating arbitrary influences caused by varying units and similarities between data. Determining the optimal architecture of an ANN remains challenging. This involves selecting the appropriate number of hidden units and their connections, aiming for a minimal yet effective design for approximating the true function. Trial-and-error methods are often employed because the true function is typically unknown. A similar approach was used in this study and the selected model was validated using statistical criteria. The activation function used between the input-to-hidden and hidden-to-output layers is the sigmoid function, which enables continuous nonlinear transformations of output values, mimicking the behavior of biological neurons [14,17]. This function is expressed as follows:
S ( x ) = 1 1 + e x
Rigorous cross-validation techniques were employed to minimize the mean square error (MSE) and enhance prediction accuracy. An undersized network may lack the flexibility to accurately learn the process, whereas an oversized network may struggle to converge during training or risk overfitting data. The trial-and-error approach begins with two neurons in the hidden layer, progressively increasing the number of neurons (e.g., three and four). The MSE calculated using Equation (4) served as a metric for evaluating the performance of each architecture.
M S E = 1 p j = 1 p y j d y j o 2  
where, y d represents the desired response, y o is the output response of the ANN, and p denotes the number of patterns presented.
To optimize the ANN architecture, the key hyperparameters were systematically adjusted through a structured experimental approach. First, the number of neurons in the hidden layers was varied from two to 50, and the MSE and training error (Etr) were monitored. As shown in Figure 3, the configuration with 44 neurons provided minimum errors. The momentum term (MT) varied from 0.1 to 0.9, with the number of hidden neurons fixed at 44. As illustrated in Figure 4, a momentum value of 0.9 yielded the lowest error, suggesting enhanced convergence stability. Subsequently, the learning rate was optimized by varying its value, while maintaining 44 neurons and a momentum term of 0.9.
According to Figure 5, a learning rate of 0.8 resulted in the lowest MSE and Etr, demonstrating the best balance between convergence speed and stability. Finally, the number of training iterations was optimized by testing the range of 5000–3,000,000 iterations. As shown in Figure 6, the model achieved convergence at approximately 150,000 iterations, beyond which no significant reduction in error was observed. This final model configuration consisted of 44 neurons, a momentum term of 0.9, a learning rate of 0.8, and 150,000 training iterations and consistently delivered the best predictive performance across both the training and validation datasets.
The training parameters were initialized with the following optimized values: number of hidden neurons set to 44, learning rate (η) of 0.8, momentum term (α) of 0.9, total iterations capped at 150,000, and error threshold (ϵ) of 0.005. In this study, the minimum MSE achieved was 0.00051 after 150,000 iterations, indicating successful convergence of the training process. This iterative method ensures that the network reaches an optimal solution, while minimizing the risk of overfitting. The final optimized FFNN configuration consisted of 20 input neurons, two hidden layers with 44 neurons each, and four output neurons, utilizing a learning rate of 0.8, momentum of 0.9, and error threshold of 0.005. This configuration consistently achieves the lowest MSE and Etr values across multiple runs and validation tests.
The optimized artificial neural network (ANN) model used in this study comprises a 20-44-44-4 architecture, representing 20 input features, two hidden layers with 44 neurons each, and four output neurons. The total number of weights in the model was 3084, which was calculated as (20 + 1) × 44 + (44 + 1) × 44 + (44 + 1) × 4 = 3084. The additional ‘+1′ terms account for the biases associated with each neuron in the respective layers. To enhance the learning capacity and generalization of the network, a transformation was applied to the initial weight matrix (Supplementary Data S2). As shown in Figure 7, the initial weights were narrowly distributed within a range of approximately ±0.5, reflecting standard initialization. After transformation, the weight distribution significantly expanded to ±35, suggesting nonlinear scaling and enhanced separation in the weight space. After training multiple models, the optimal model yielding the lowest prediction errors had its final trained weights transformed naturally through the learning process to a wider distribution of approximately ±35. Thus, transformation refers to the outcome of training rather than the pre-training adjustment. This transformation proved effective in improving model performance, and the transformed weight set was selected as the best-fit solution for the final ANN model. This configuration was subsequently used for further analysis and prediction.

4. Results and Discussion

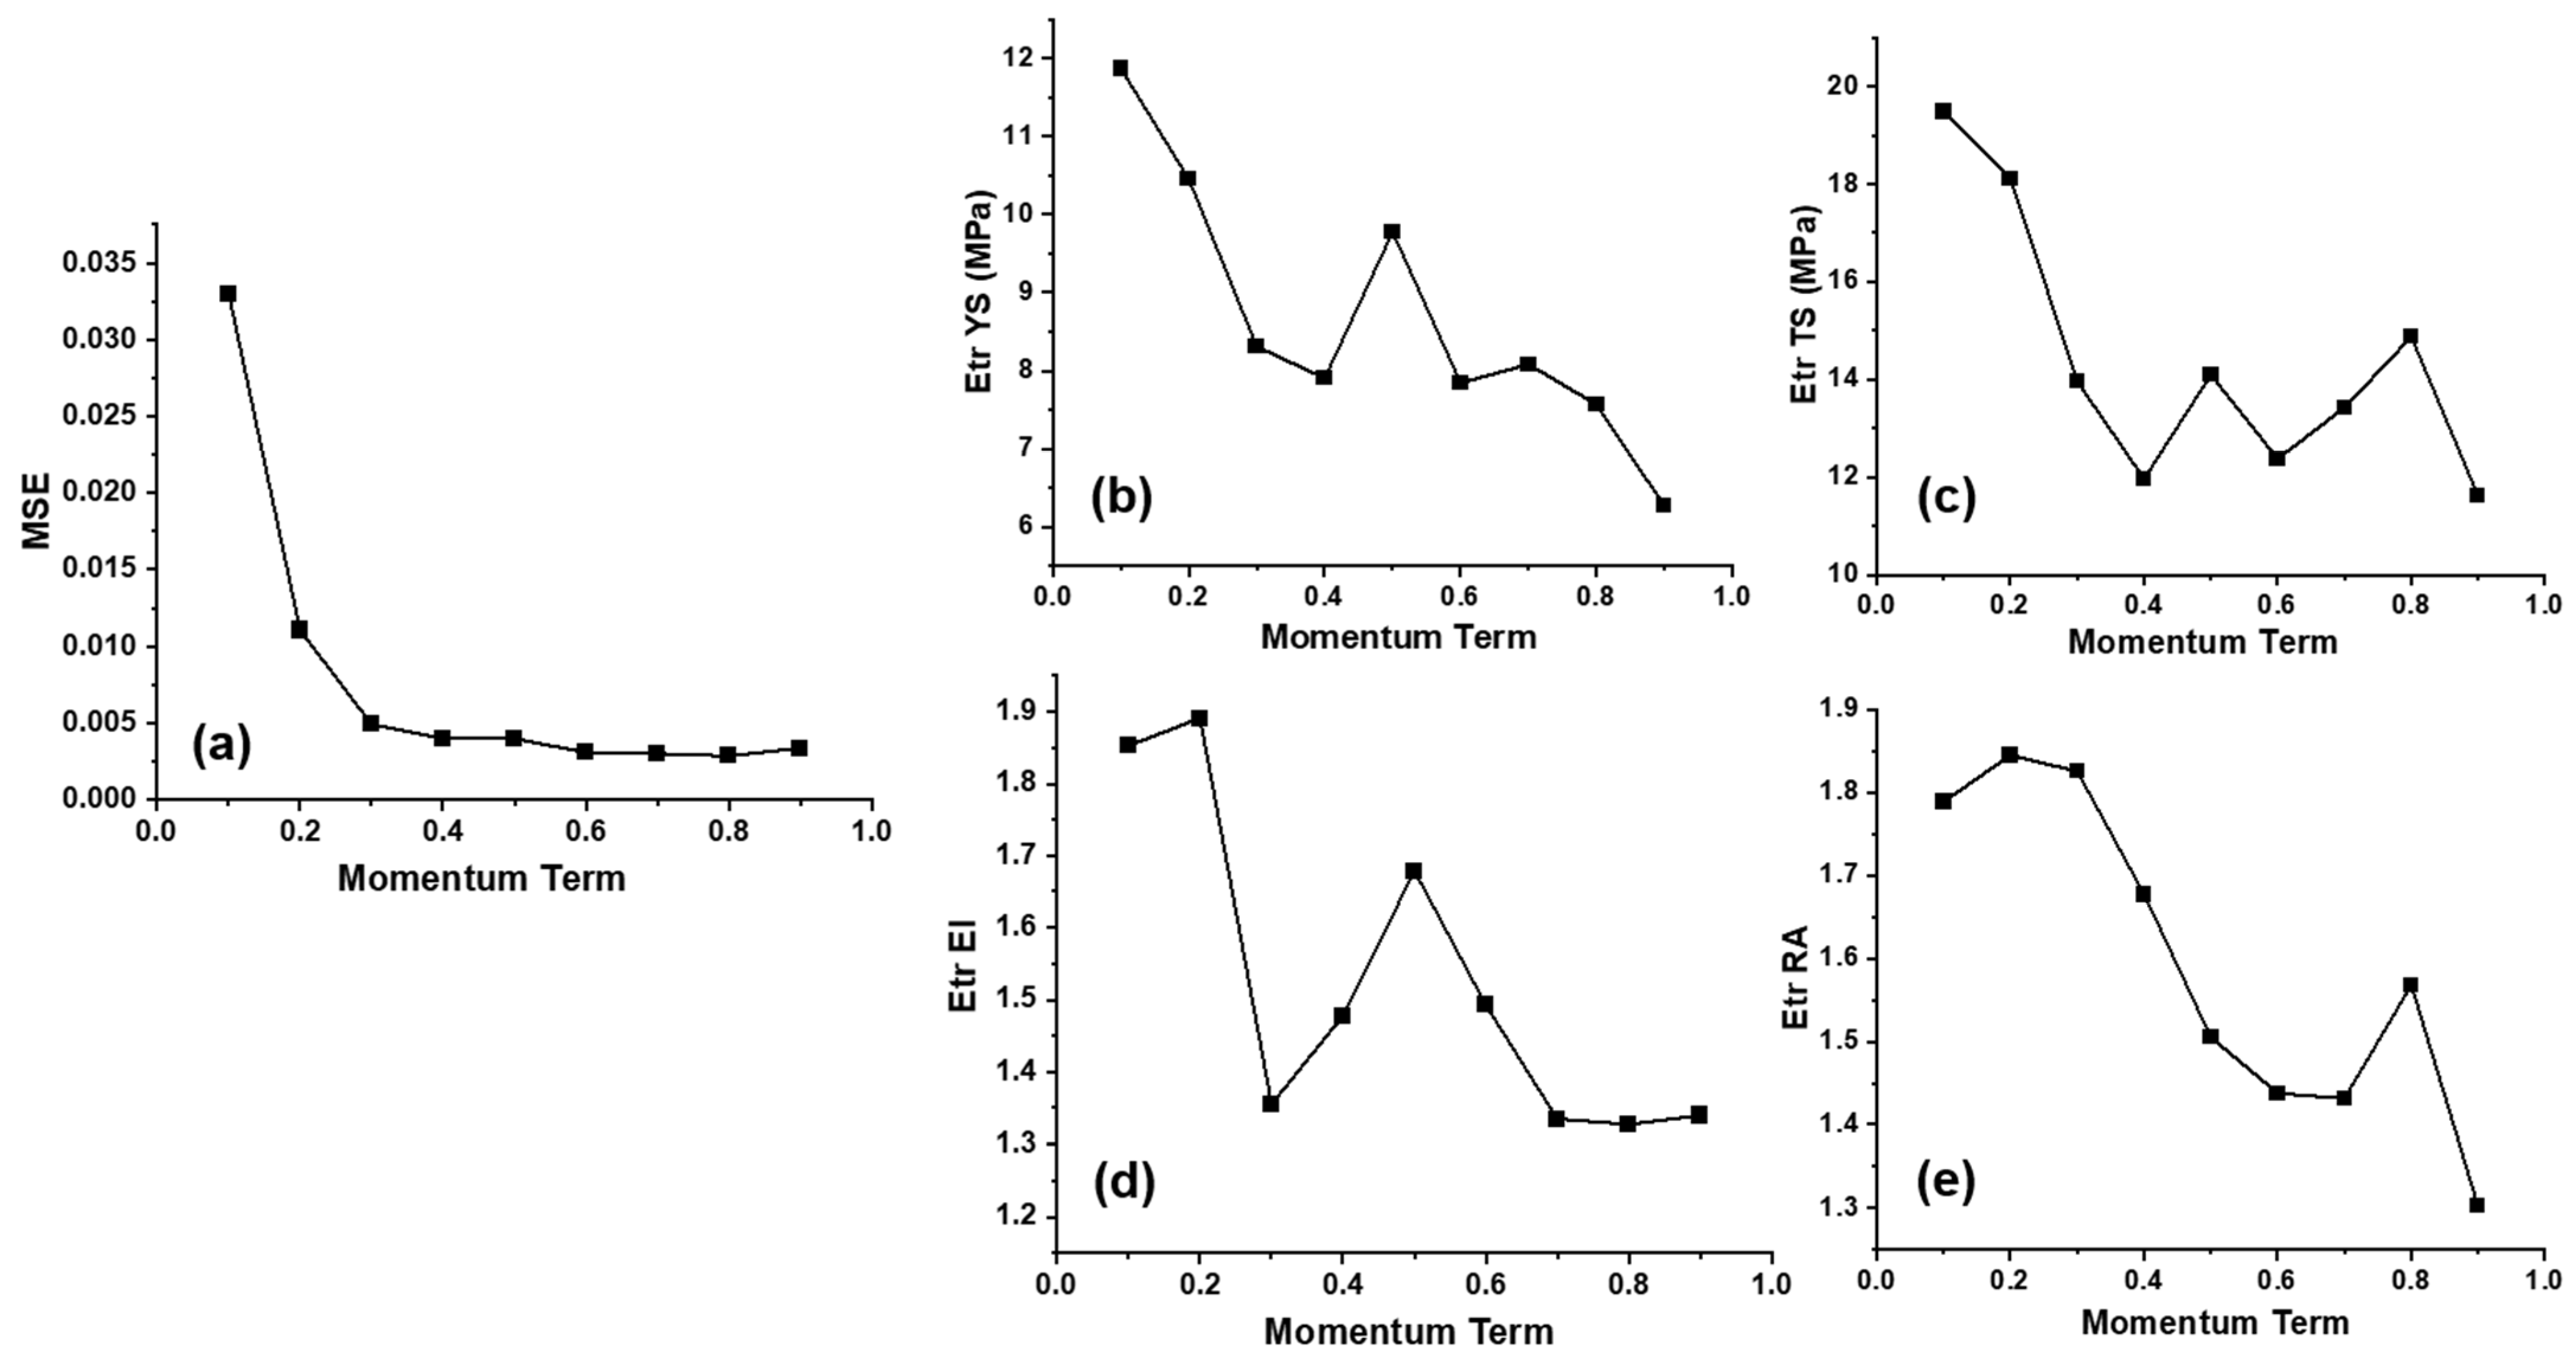
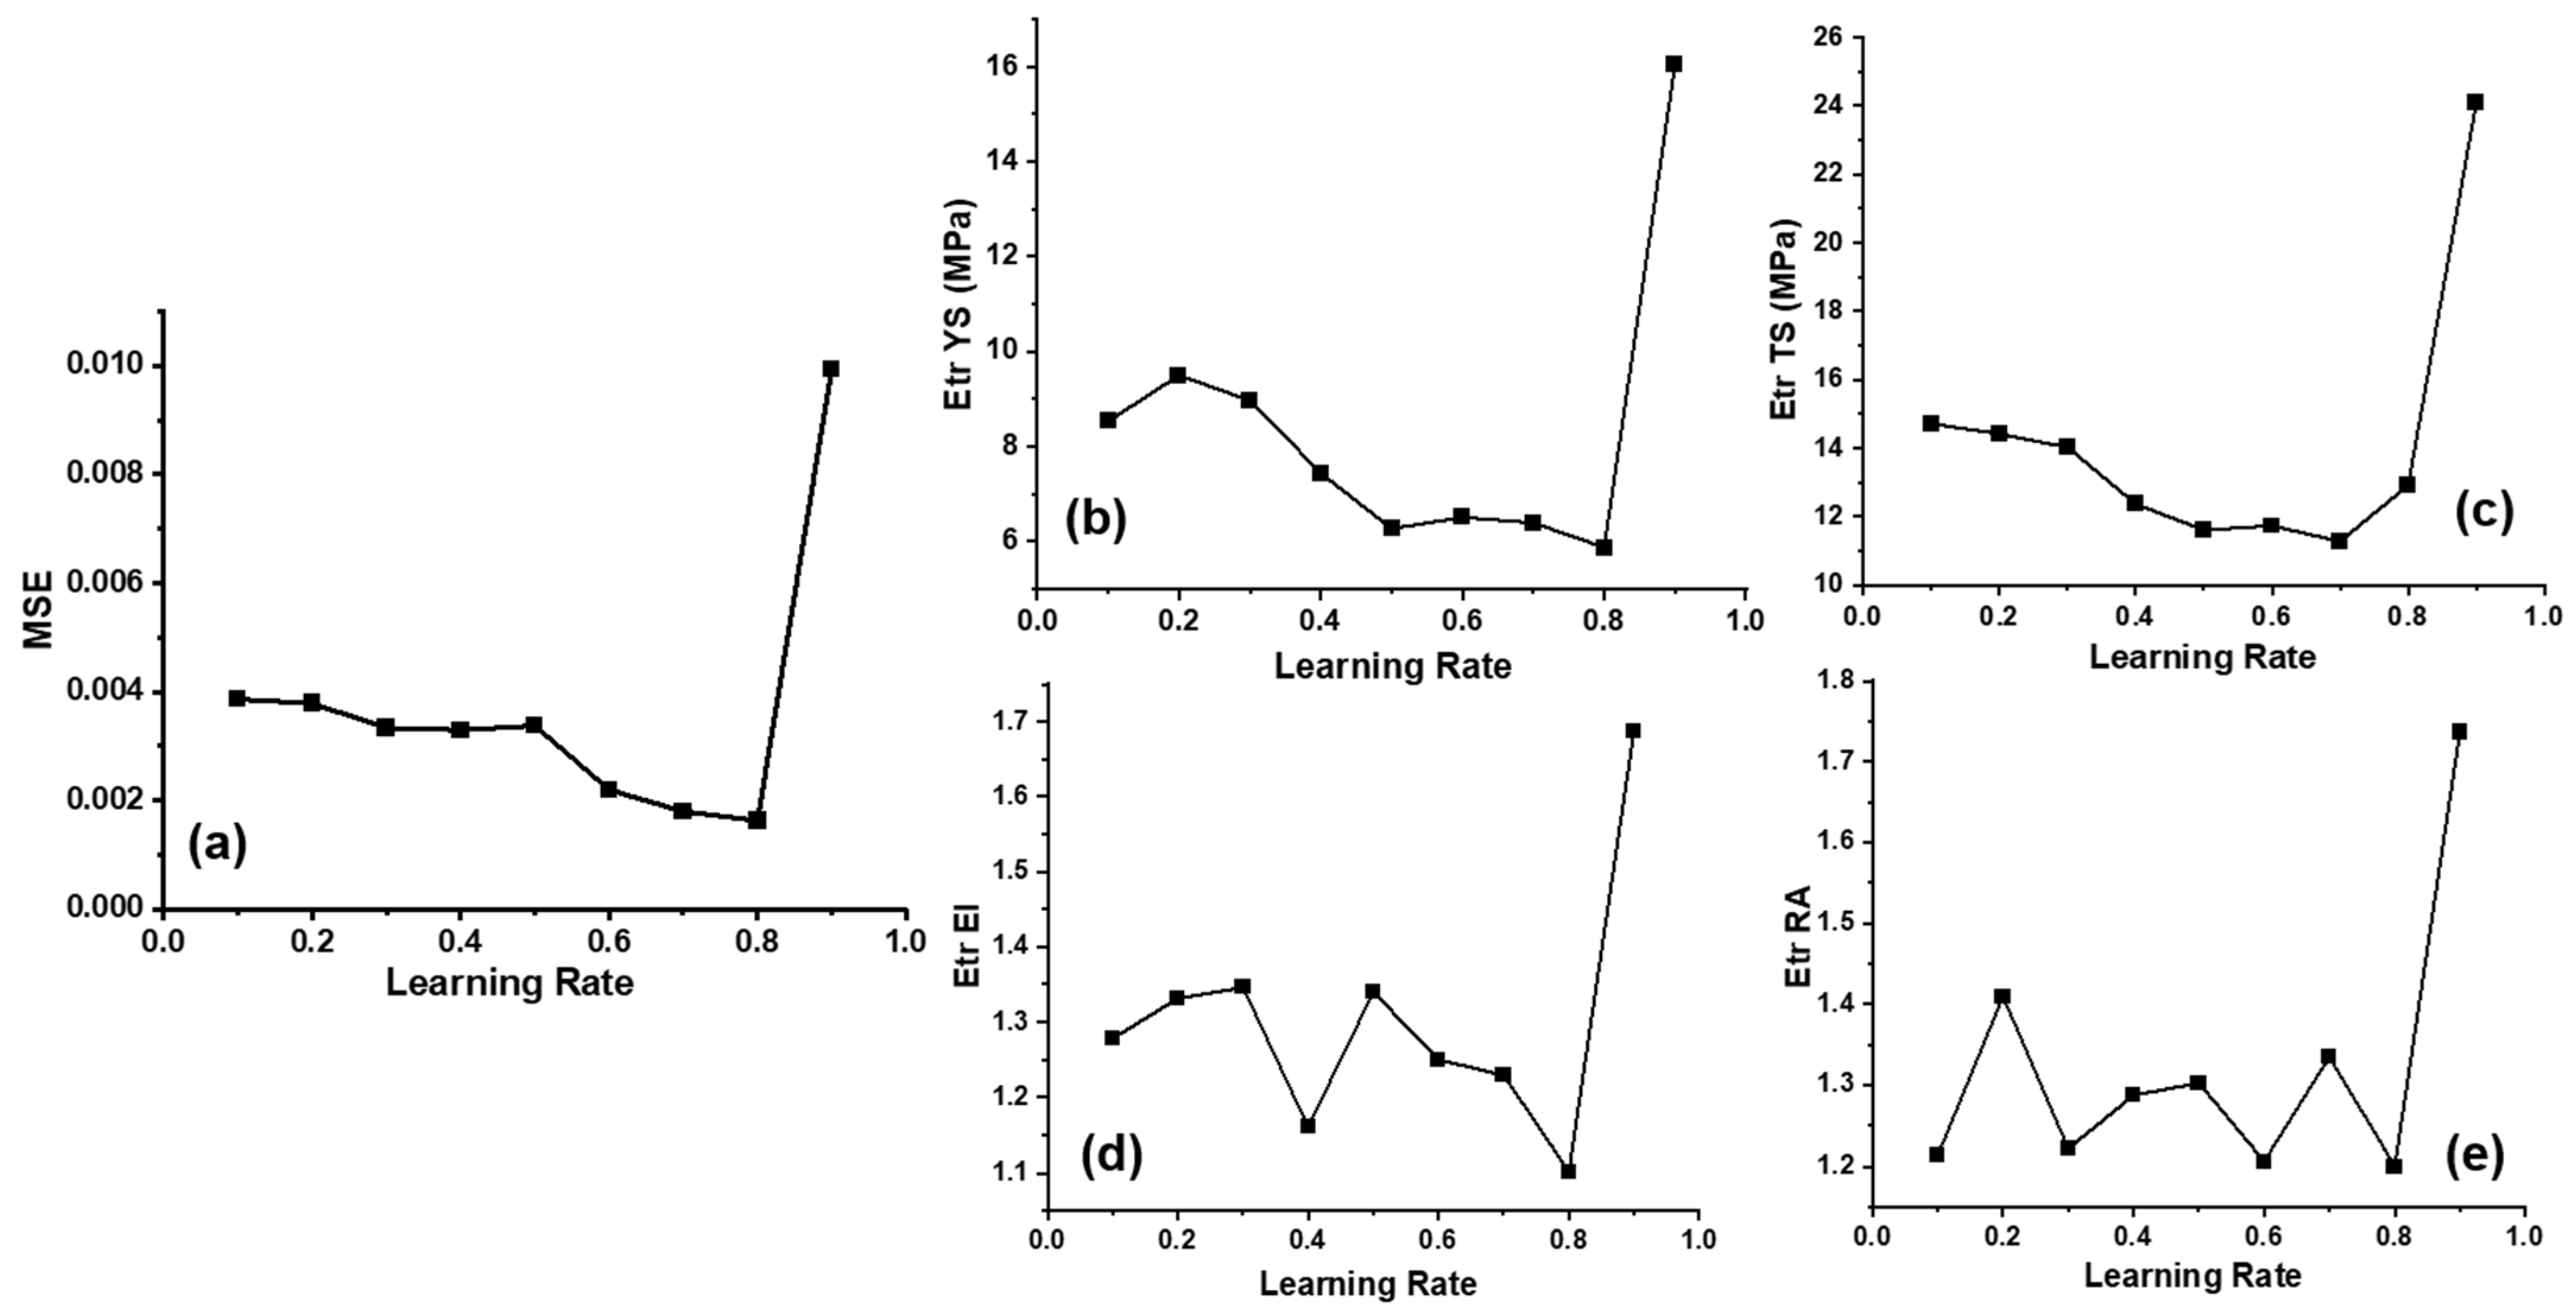
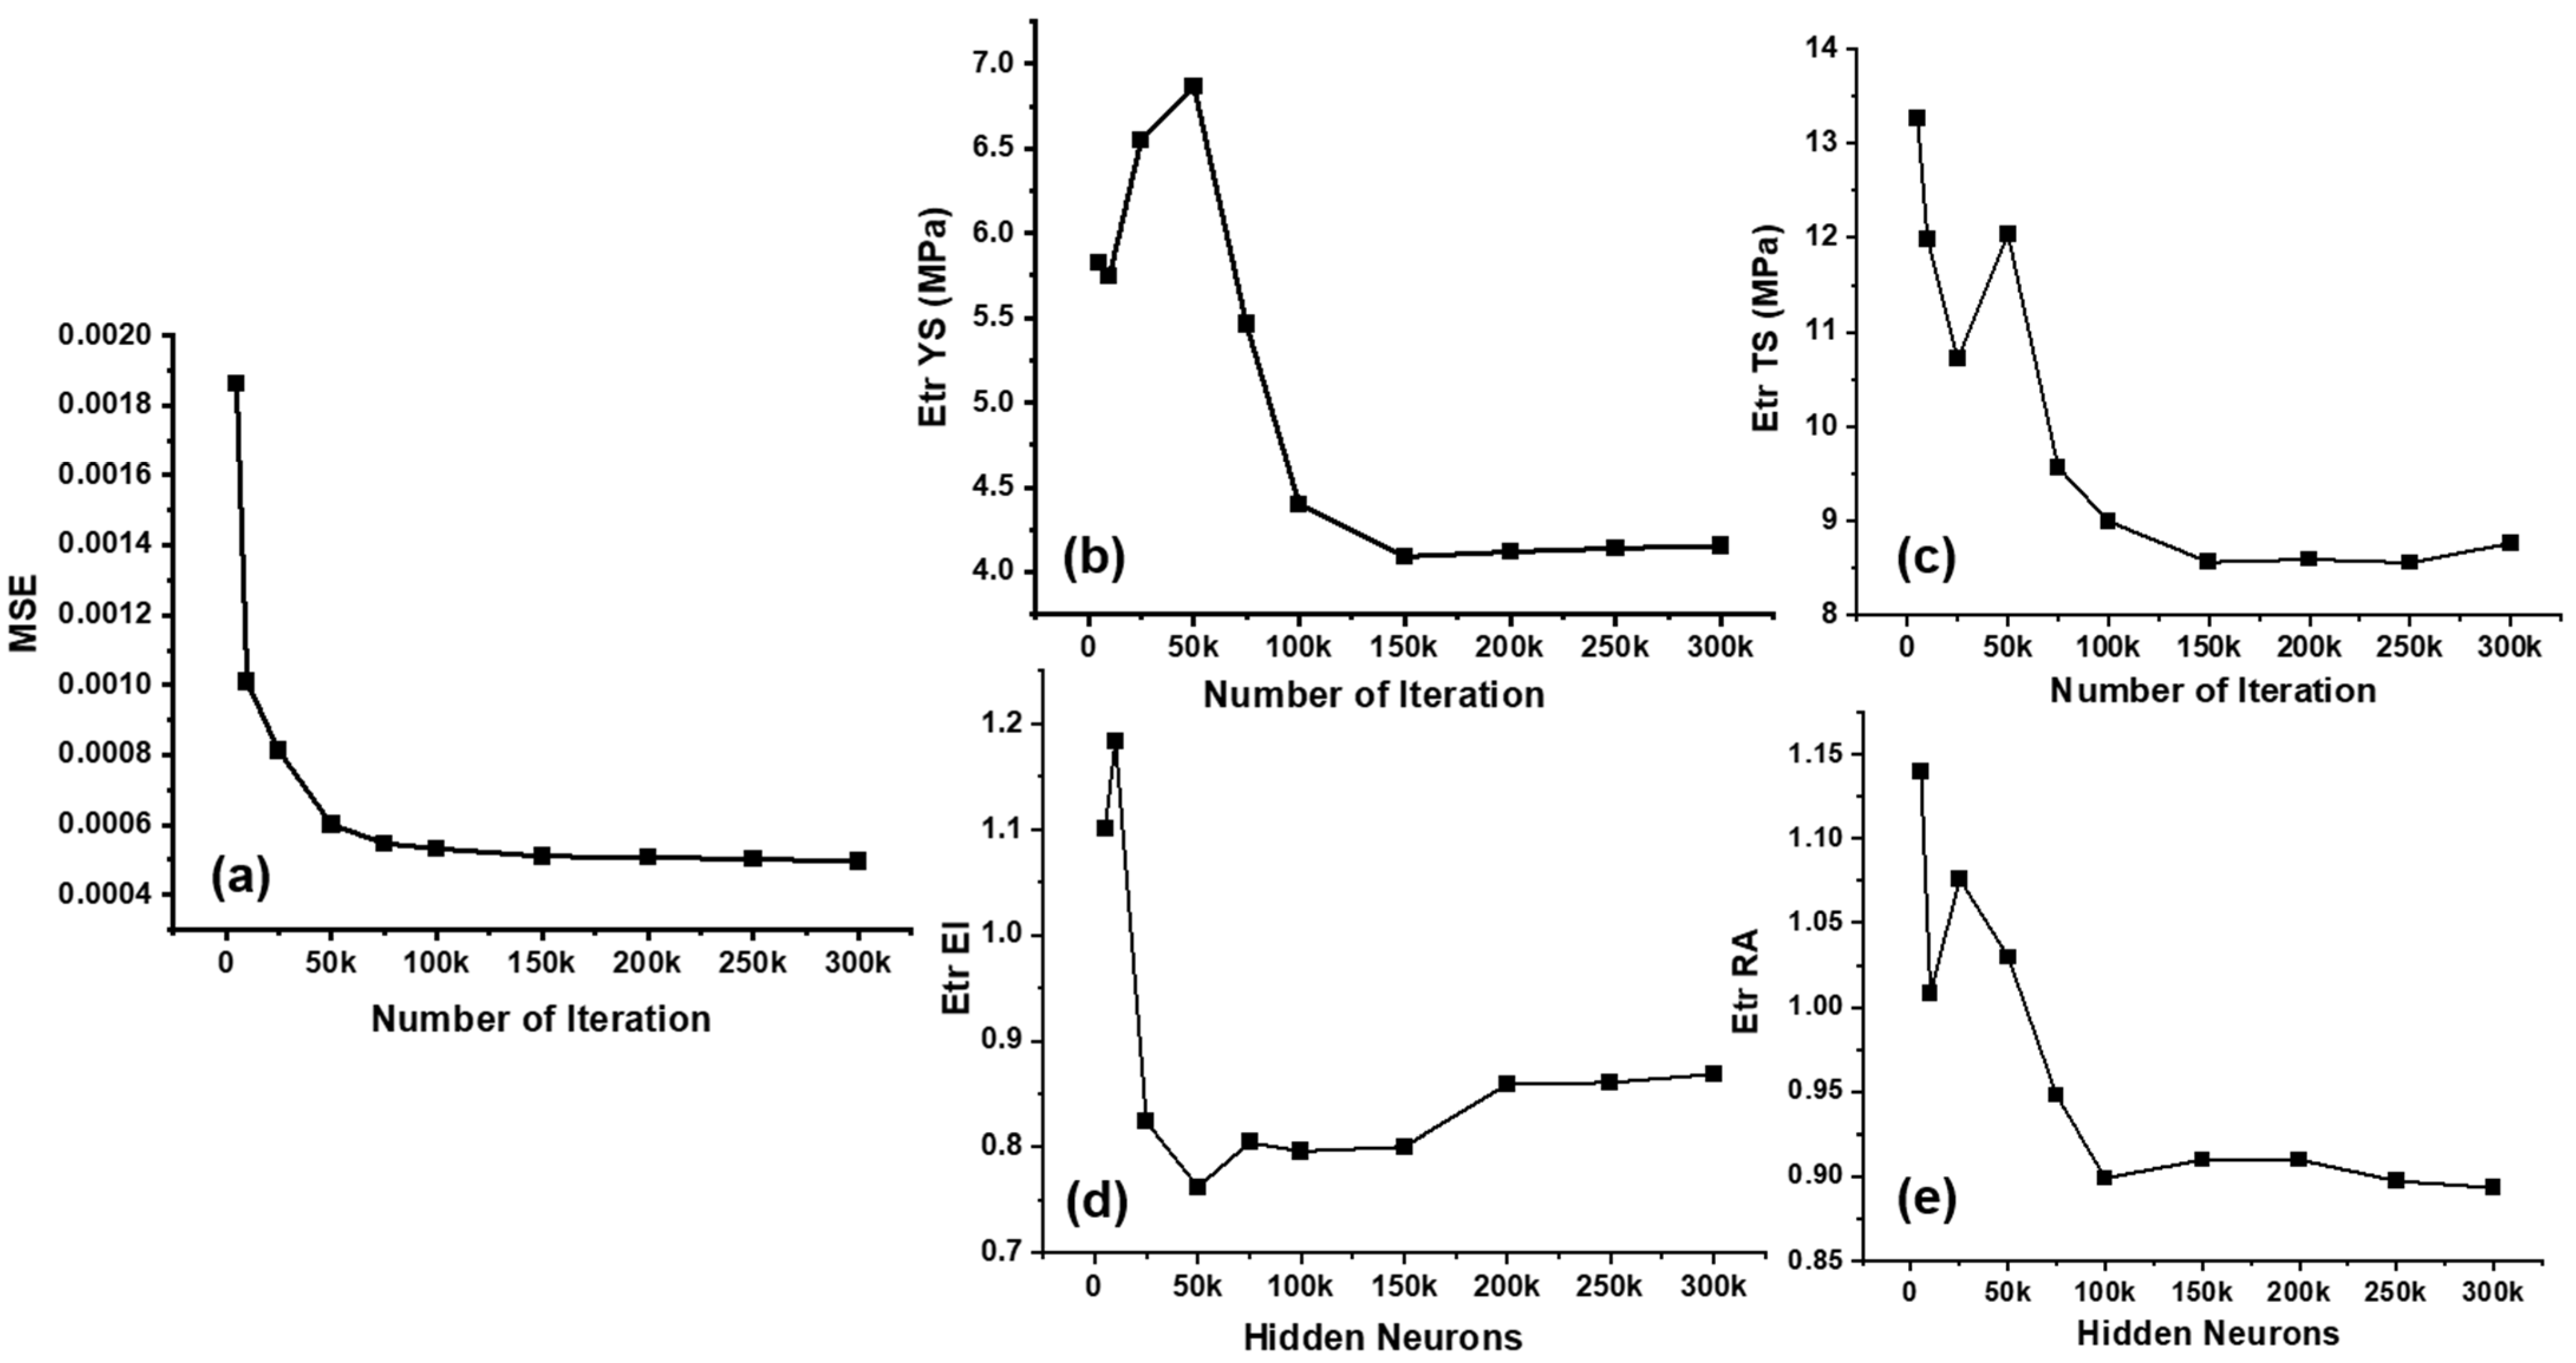
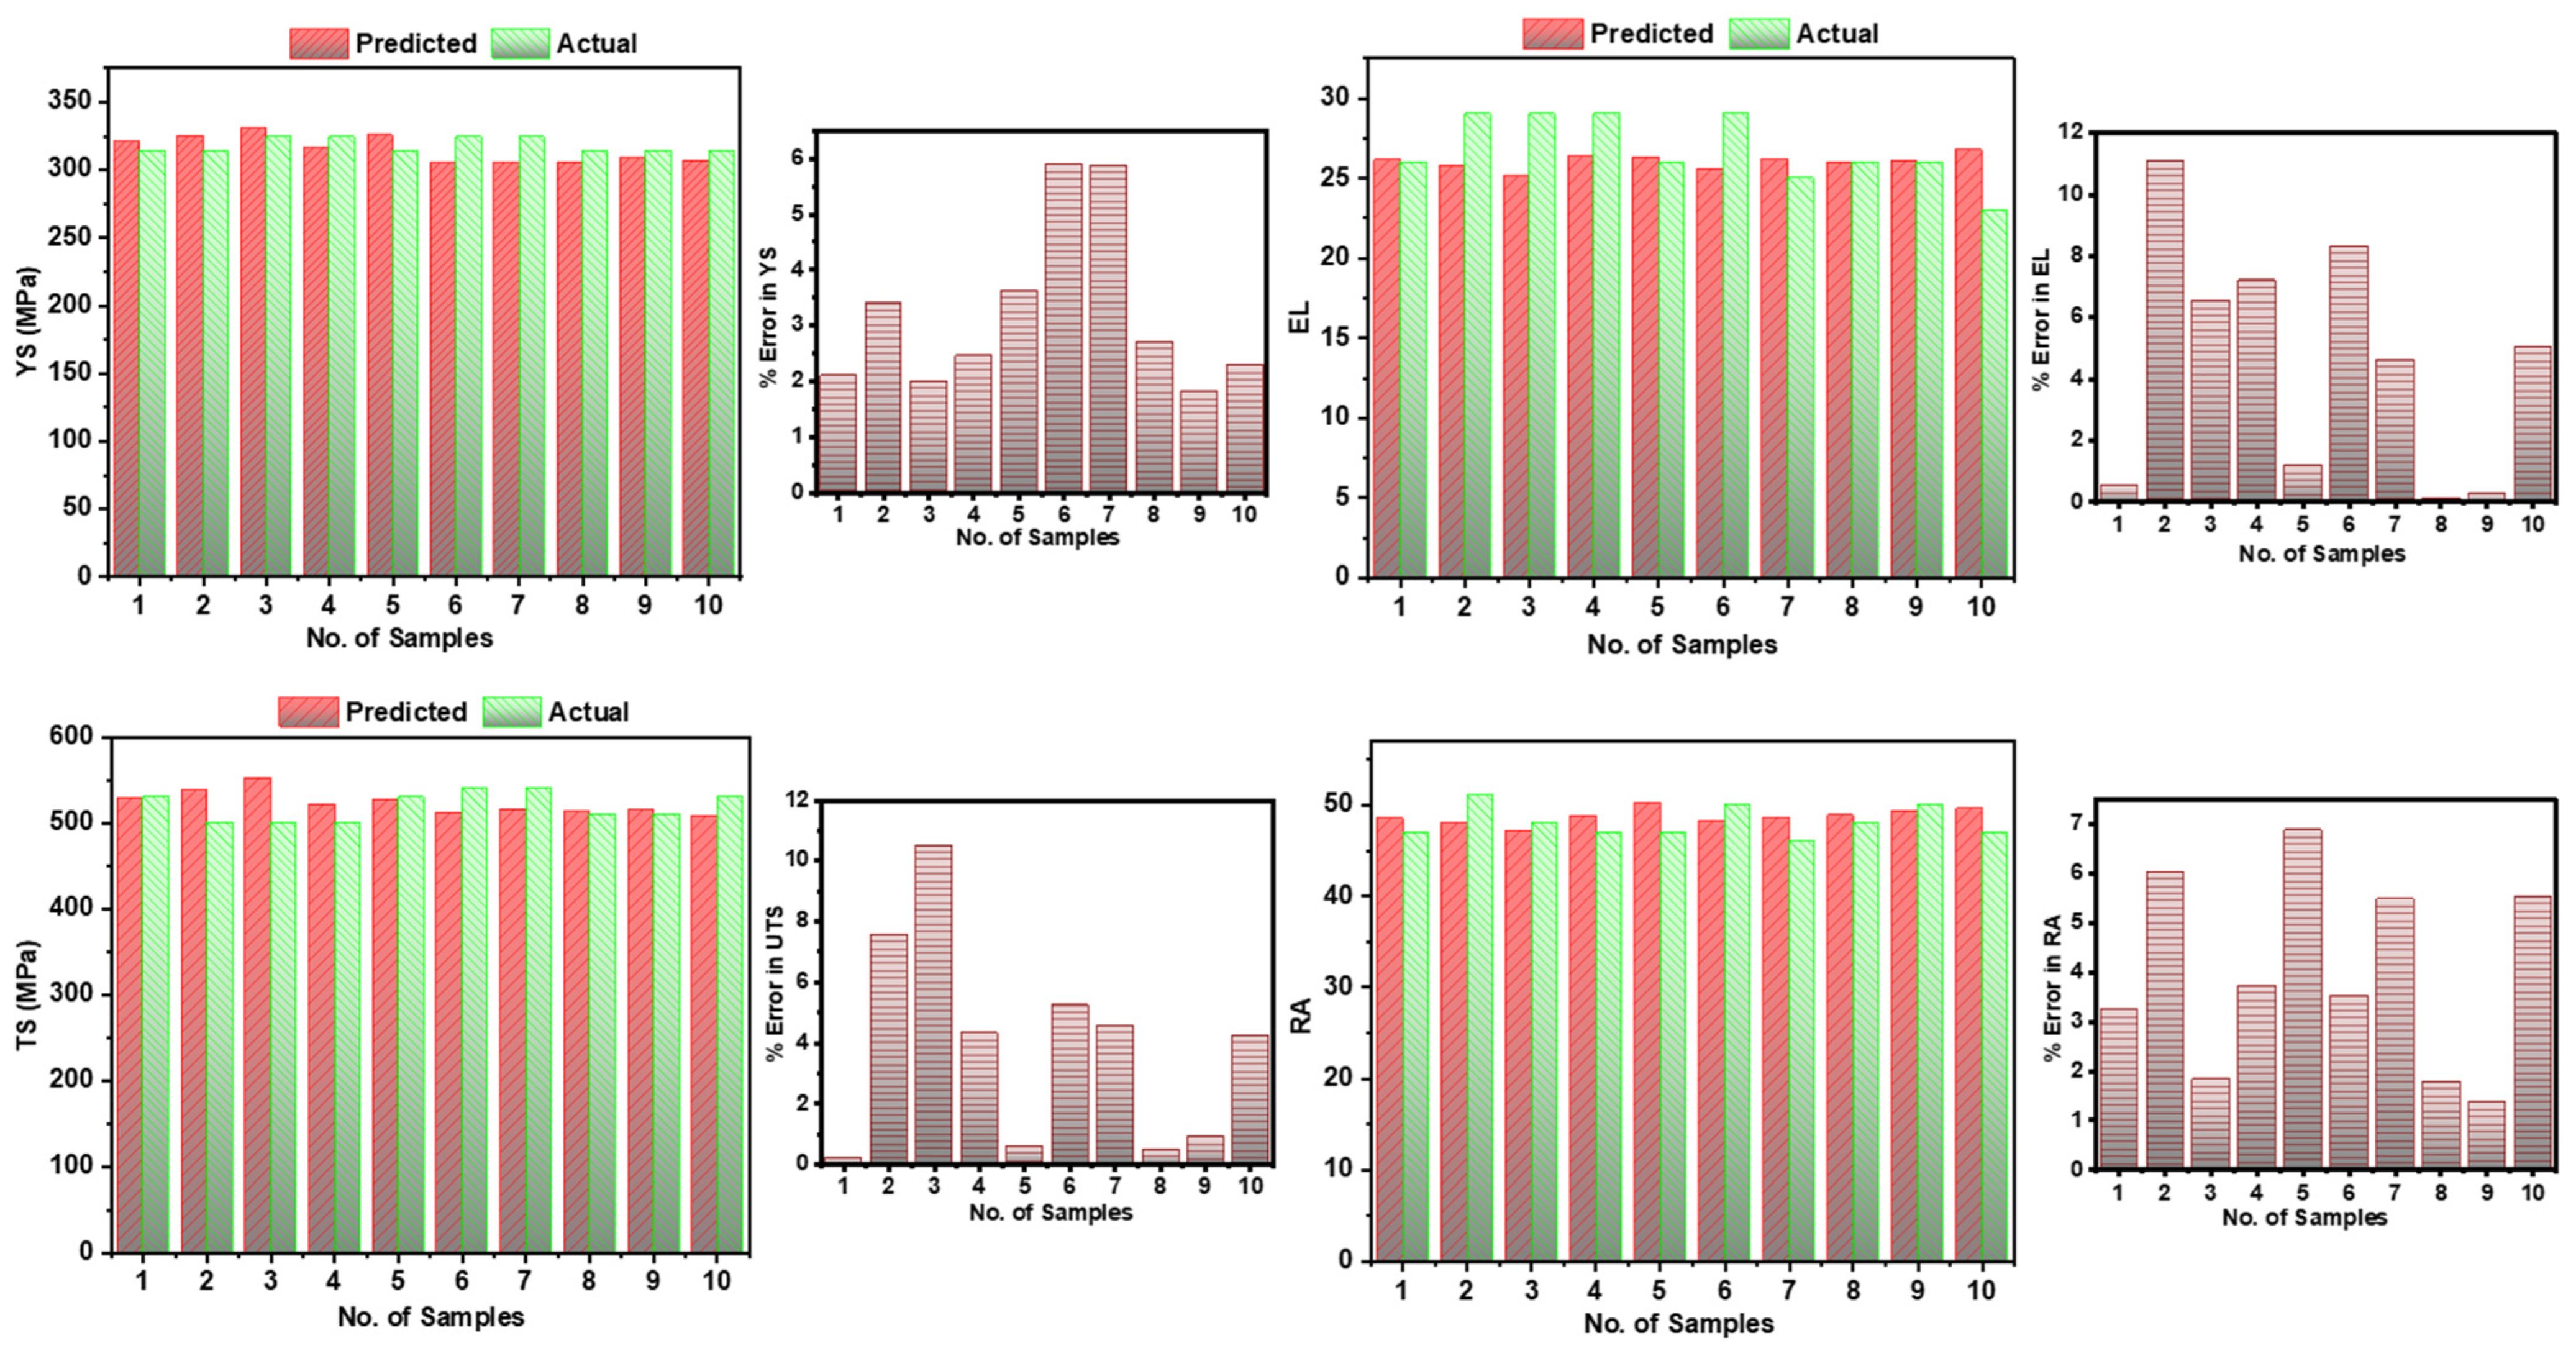
4.1. Performance of ANN Model

The trained ANN model demonstrated strong predictive capability across multiple mechanical properties, as illustrated in Figure 8. A comparison between the predicted and actual values is shown for YS, TS, EL, and RA for test samples 401, 409, 430, 445, 448, 468, 471, 478, 487, 490, and 491, respectively.
Figure 8 presents the grouped bar plots of the predicted versus actual values along with the corresponding percentage error plots for each property. The ANN model achieved average percentage errors of 3.45% for YS, 3.97% for TS, 4.9% for EL, and 3.8% for RA, indicating a consistent accuracy across all target variables. While a few samples exhibited relatively higher deviations (up to 12% in TS and 10% in EL), the majority of the predictions fell within a 5% error margin, thereby confirming the robustness and generalizability of the model. These results validate the effectiveness of the ANN model in predicting the mechanical behavior of C-Mn cast steels using the compositional and processing data provided in the dataset.

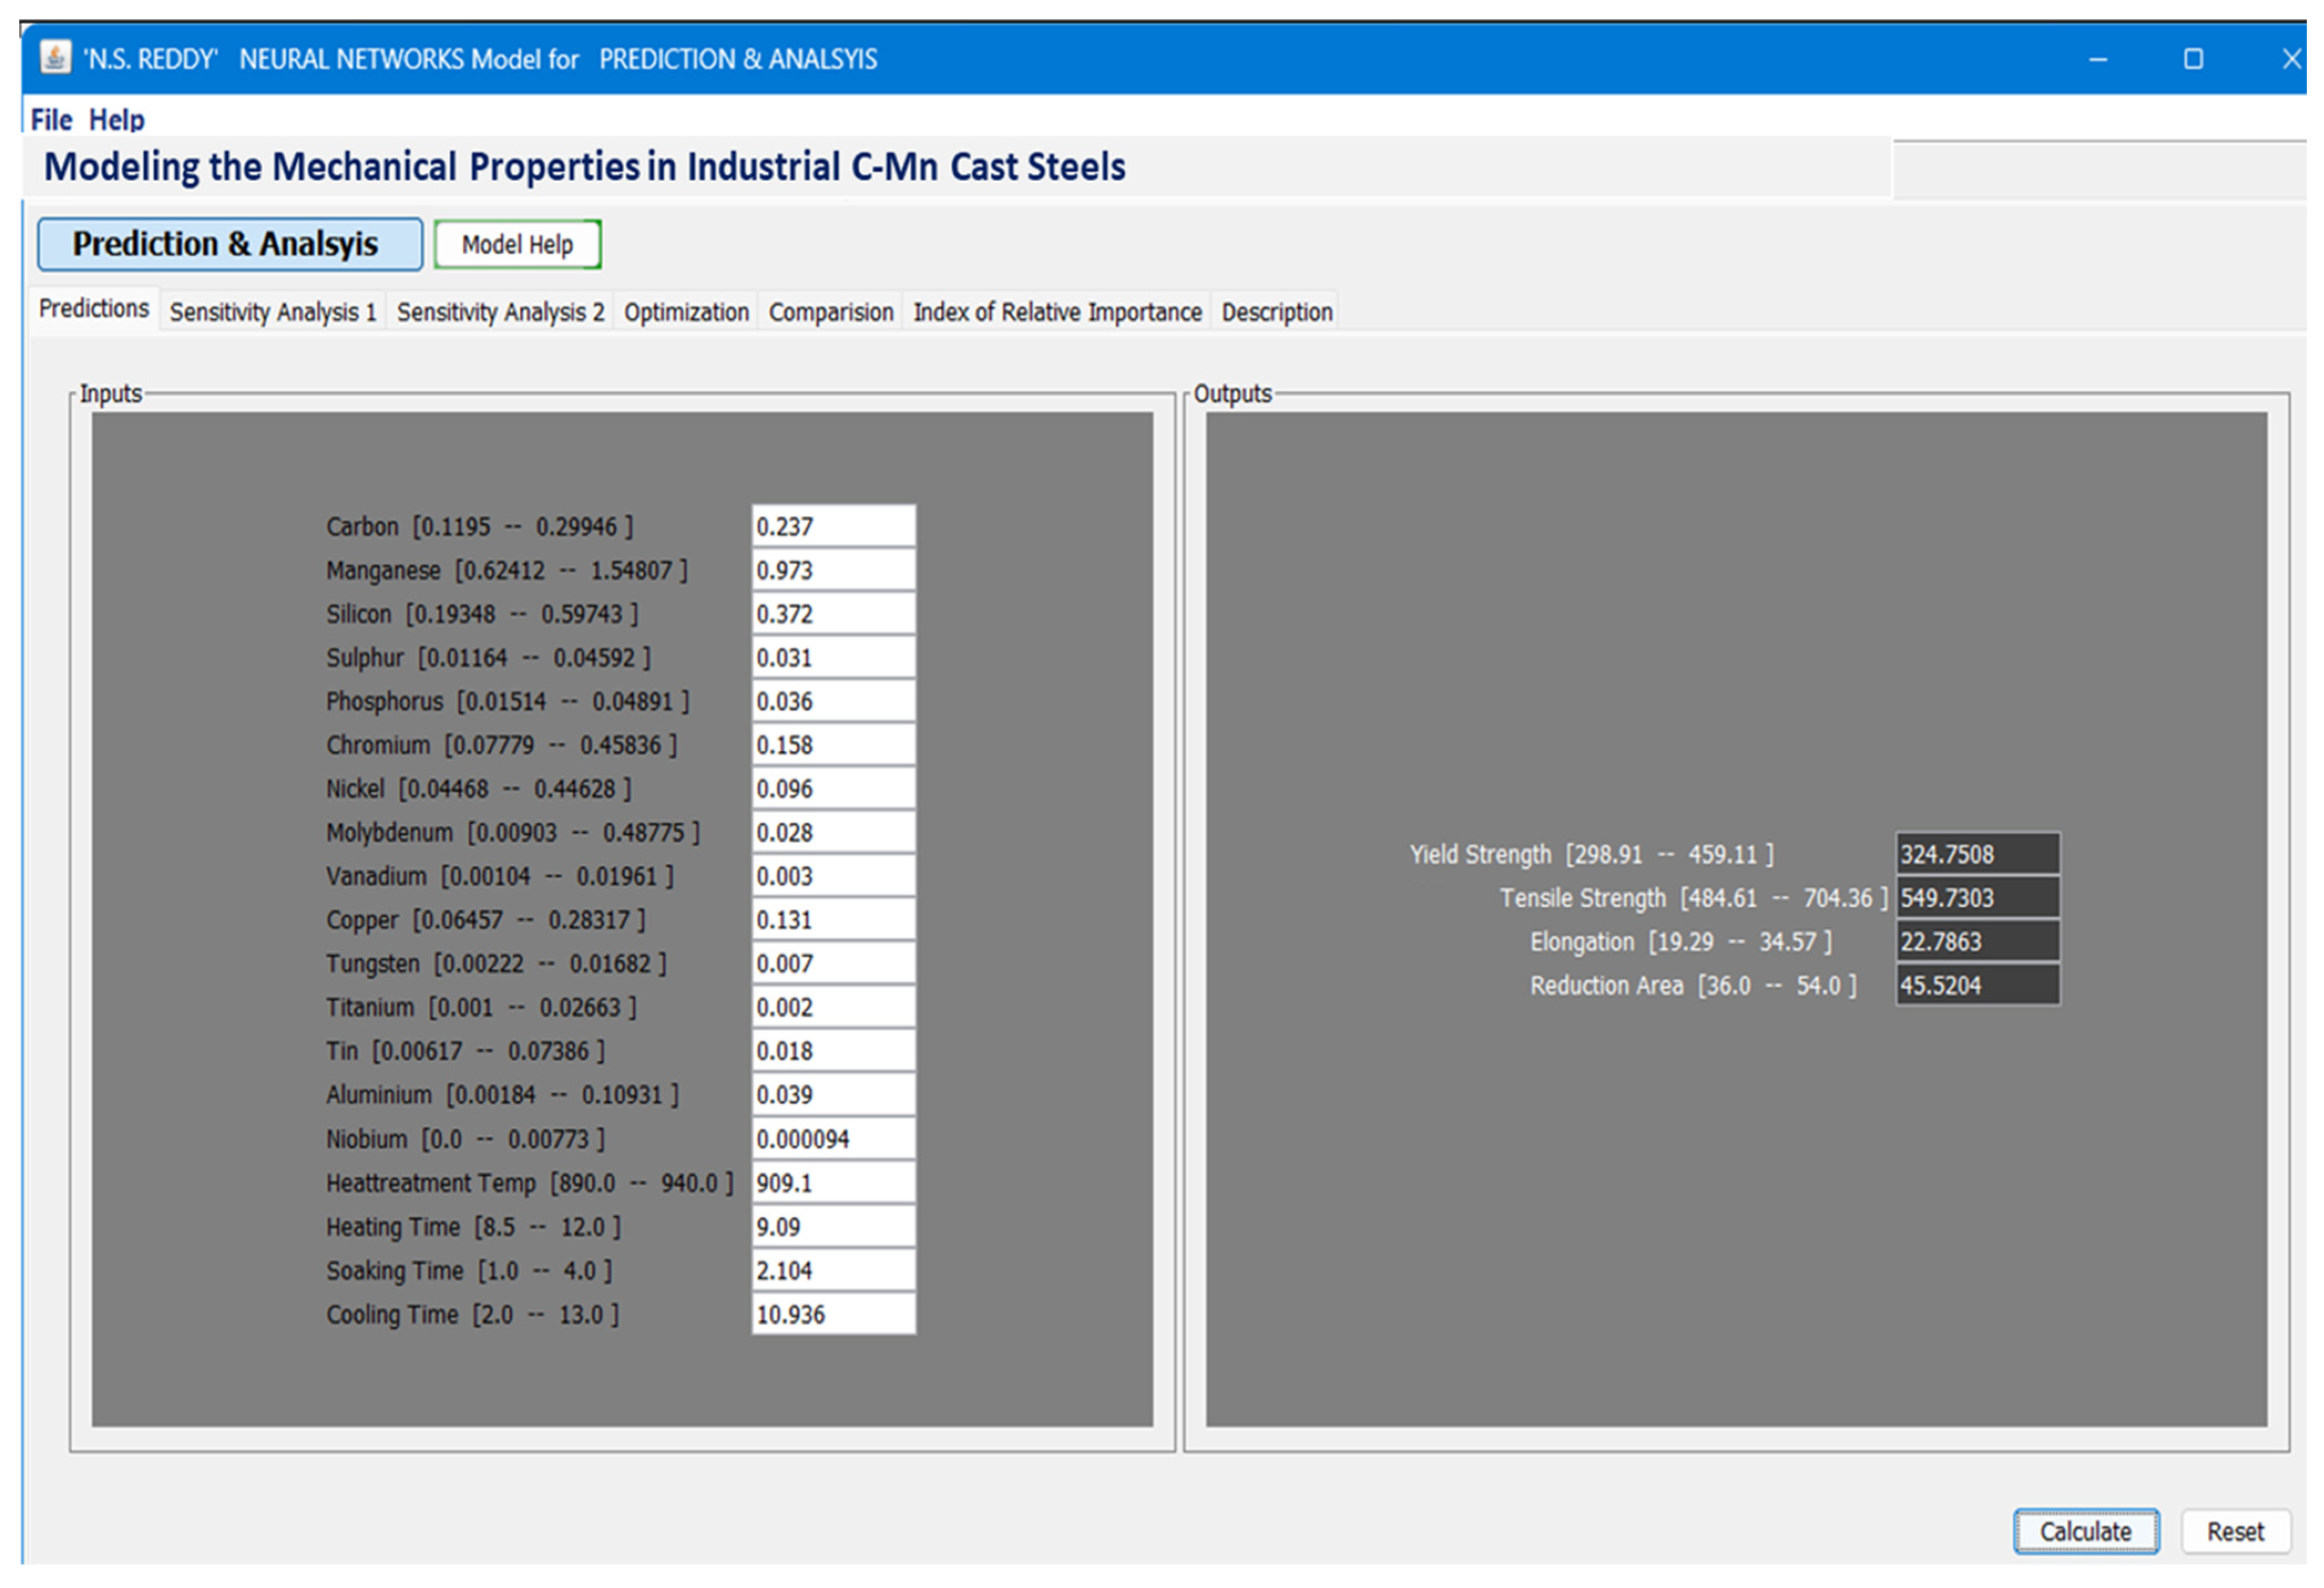
4.2. Creating a Graphical User Interface (GUI)

An intuitive graphical interface was used to predict the mechanical properties of C-Mn cast steels. Utilizing insights from 16 alloying elements and four key heat-treatment parameters, this interface integrates a finely tuned 20-44-44-4 neural-network model. The model’s weight coefficients, ranging from −15.96 to 12.92, ensure accurate mechanical properties predictions across diverse alloy compositions and heat treatment scenarios. Suitable for both novices and experts, this user-friendly interface allows users to input specific steel compositions and heat-treatment parameters without requiring advanced programming skills or deep understanding of neural networks. Beyond prediction, the GUI (Figure 9) fosters innovation by enabling users to explore alloy interactions, perform sensitivity analyses, and customize materials for specialized applications.
The Artificial Neural Network (ANN) Graphical User Interface (GUI) shown in Figure 9 is an accurate prediction of the mechanical properties of industrial C-Mn cast steels based on the chemical composition and heat treatment parameters. Developed using ideal model weights, the GUI can predict outcomes for infinite combinations of input variables, including values not originally present in the training database. In this example, predictions were provided for the mean values of the composition and heat treatment variables, demonstrating the model’s strong generalization capability. This tool significantly reduces the time, material usage, and costs traditionally required for experimental measurements, thereby providing a highly efficient and reliable alternative for optimizing material properties in industrial applications.

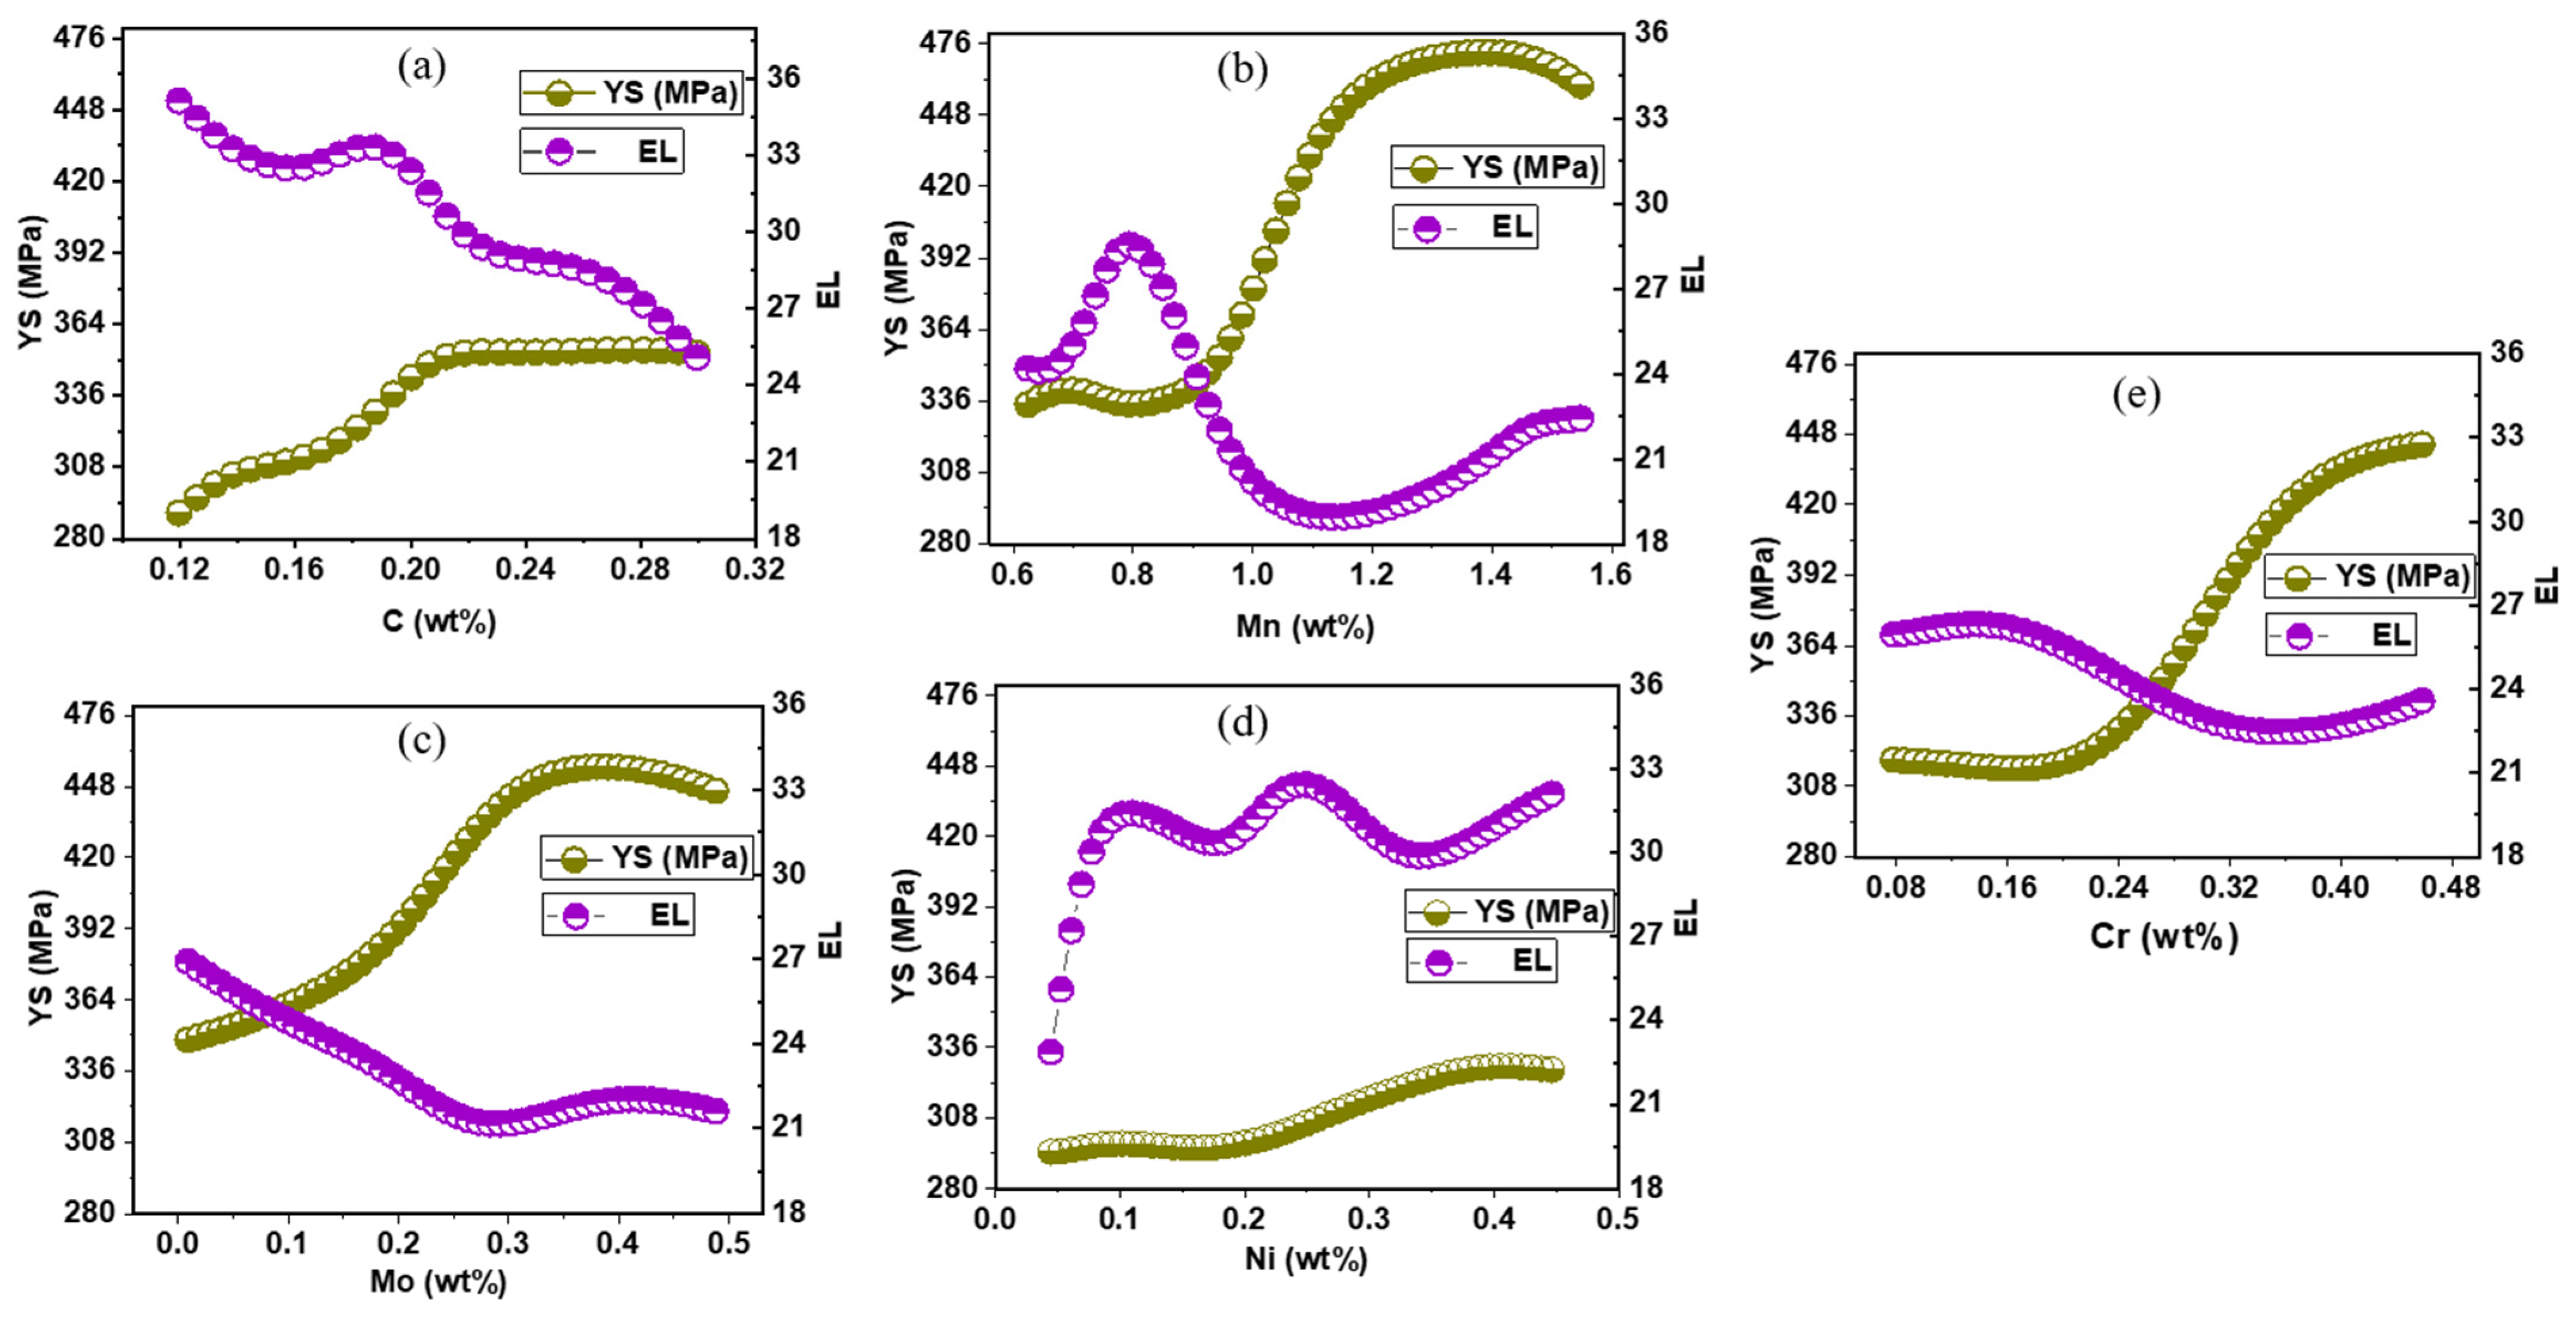
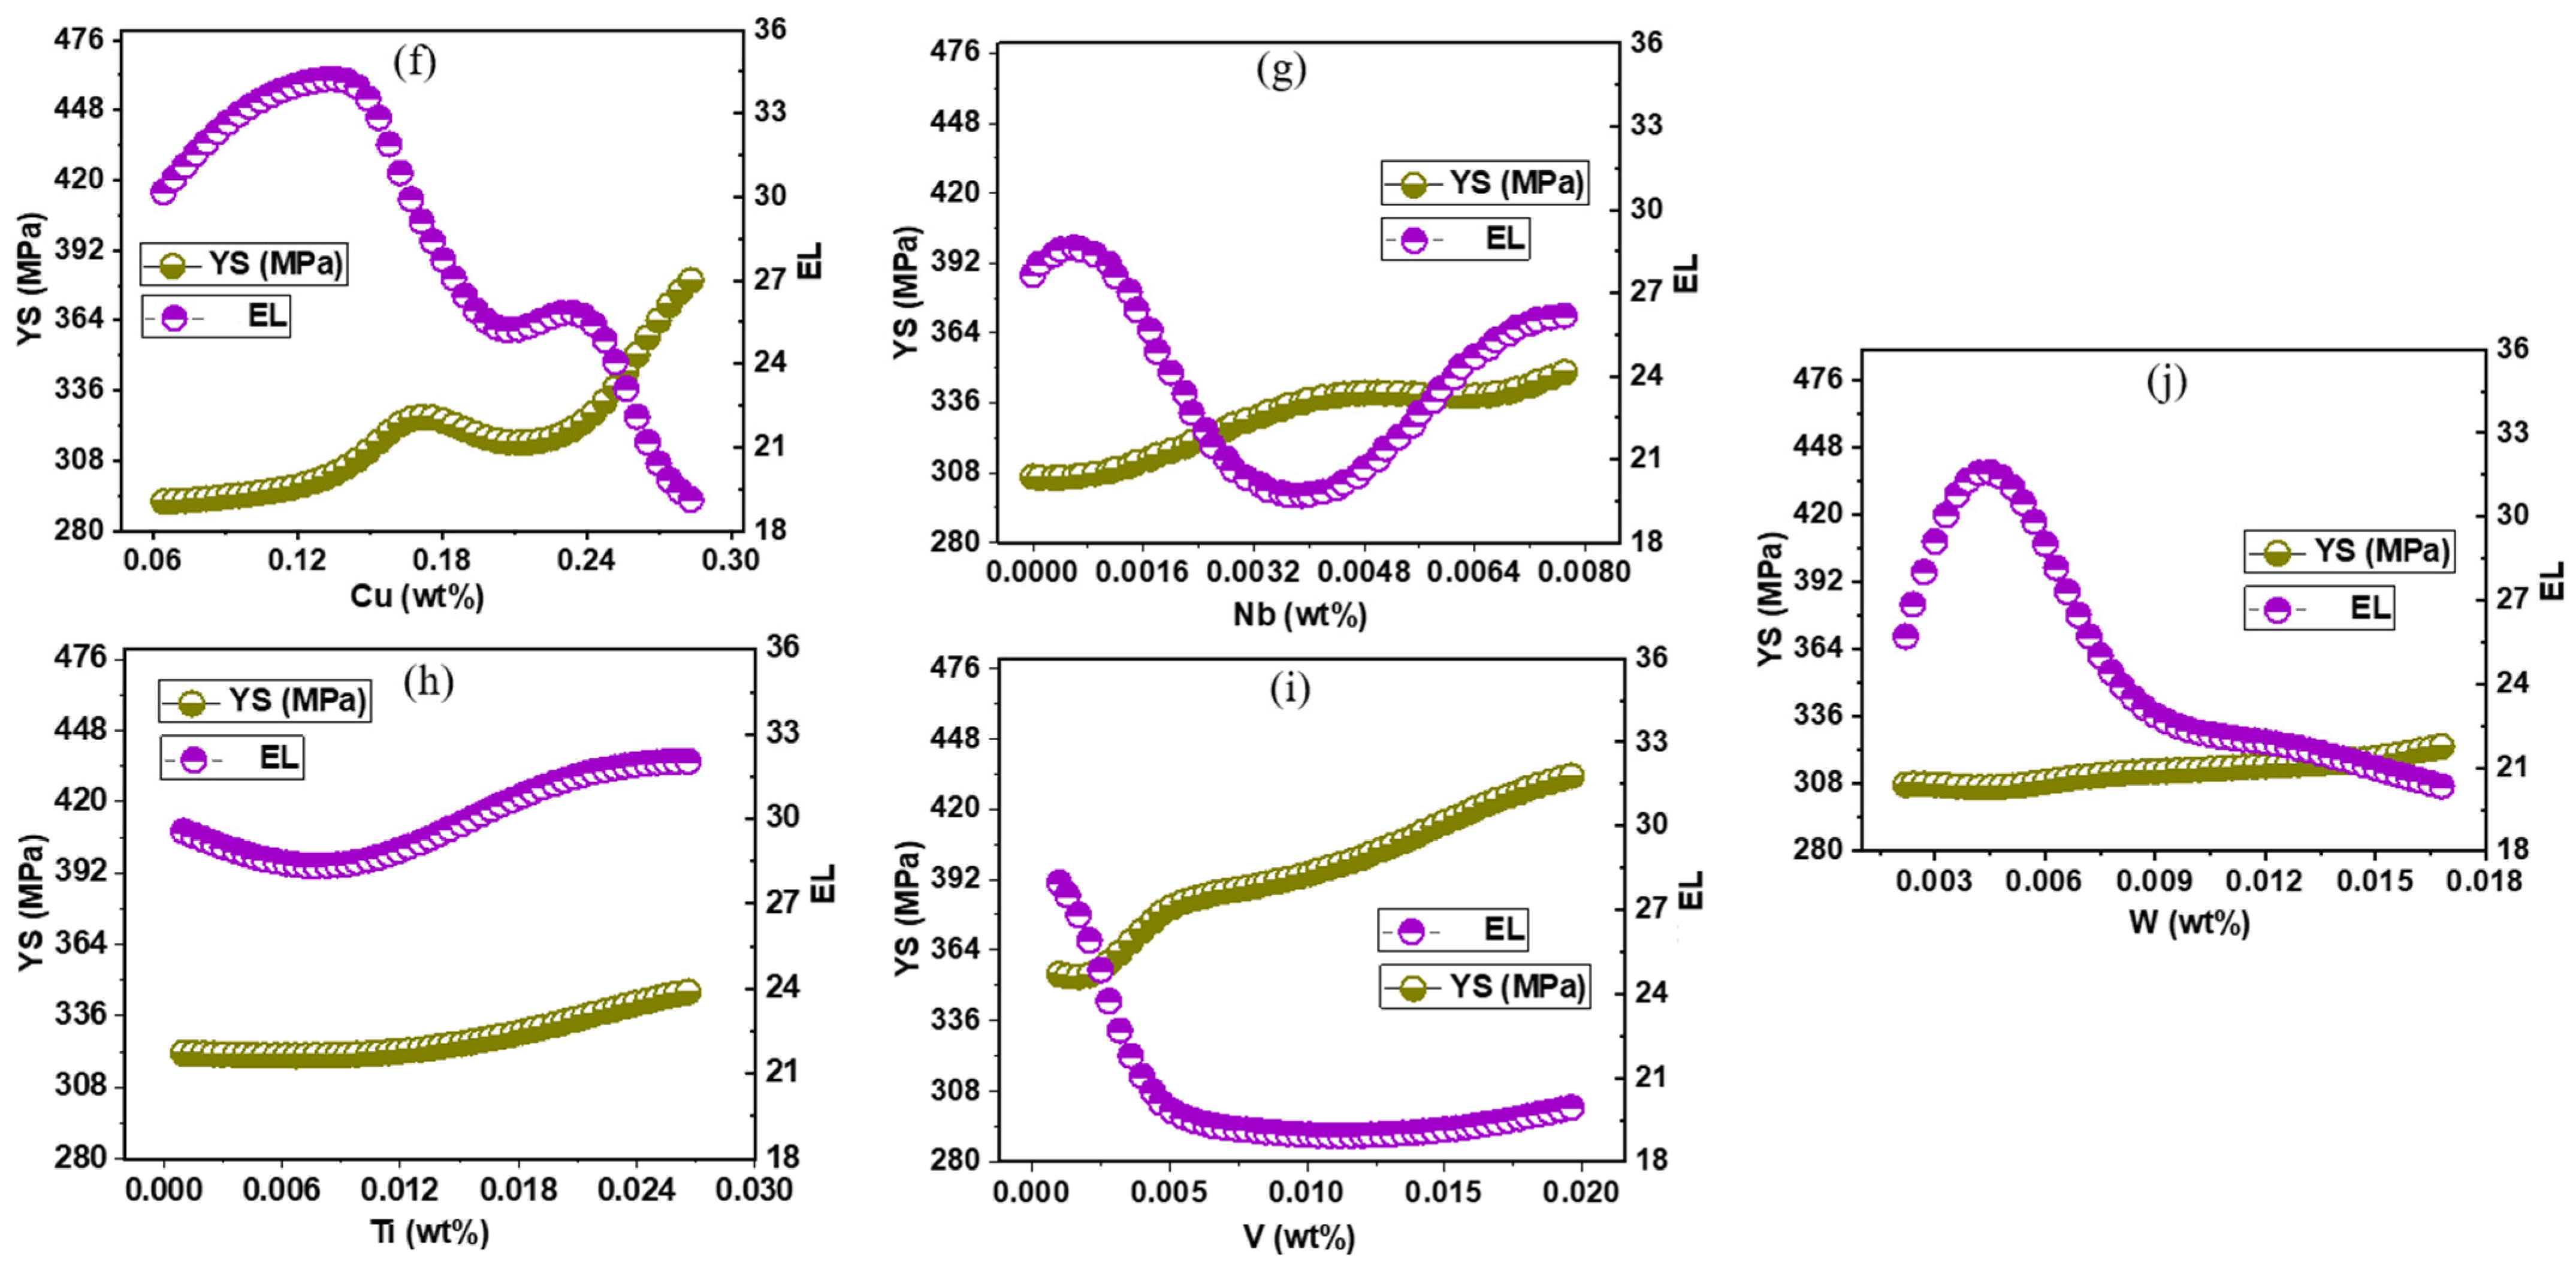
4.3. Creation of Hypothetical C-Mn Steels and Comprehensive Alloying Element Effects

In Table 2, the chemical composition of a specific C-Mn cast steel sample is referred to as S. No. 1 in Supplementary Data S1. The developed model can predict and optimize a wide range of alloy combinations through comprehensive sensitivity analysis that accounts for complex element interactions (as illustrated in Figure 9). The sensitivity analysis methodology inherently considers the synergistic and antagonistic effects between alloying elements by systematically varying individual element concentrations while maintaining realistic compositional constraints, thereby capturing the nonlinear interactions that govern mechanical property responses in multi-component steel systems. Utilizing the composition of the initial seed alloy (S. No. 1 in Supplementary Data S1), the model accurately predicted mechanical property values that were closely aligned with the experimental measurements, achieving an accuracy with an error margin of less than 5%. The purpose of this comparison was to evaluate how closely the model predictions were aligned with actual values from the dataset, rather than from a newly prepared experimental sample. Thus, we did not experimentally synthesize or test a new steel composition; instead, we used the existing measured data to validate the accuracy of the model. However, to fully understand the complex alloying behavior, additional elements and their interactions require further investigation through expanded experimental campaigns and enhanced modeling approaches. In the sensitivity analysis of the ANN models, we examined the impact of altering the input features on the model predictions. We gained valuable insights into feature importance and model behavior by varying the individual features while keeping the others constant. Based on the development of the synergistic ANN Model, various hypothetical C-Mn alloys, constructed based on sensitivity analysis, are presented for the representative effects of alloying elements.
The findings presented in Figure 10 reveal the complex roles of the microalloying elements and their interactions. Based on the development of the synergistic ANN model and comprehensive sensitivity analysis, the effects of various alloying elements in C-Mn cast steels are presented in Figure 10, revealing an understanding of element criticality that requires careful interpretation within the context of concentration ranges and mechanistic contributions.
The analysis revealed that the carbon content (Figure 10a) significantly influenced both strength and ductility. As carbon content increases from 0.12 to 0.32 wt%, the yield strength initially increased from approximately 290 MPa to a peak of 355 MPa at approximately 0.24 wt%, and then slightly decreased. Conversely, elongation showed an inverse relationship, decreasing from 32% to 24% as the carbon content increased. This behavior is attributed to the formation of carbides at higher carbon contents, which enhances the strength but reduces ductility [35,36].
Mn demonstrates a complex non-linear relationship with the mechanical properties (Figure 10b). Yield strength shows relatively stable behavior between 0.6 and 1.0 wt% Mn (330–340 MPa), followed by a significant increase to 475 MPa at 1.4 wt%. Elongation exhibits fluctuating behavior with peaks around 0.7 wt% and 1.5 wt% Mn, indicating optimal ductility windows. This complex behavior reflects the dual role of Mn in solid-solution strengthening and austenite stabilization [17].
Among the investigated elements, Mo exhibited the strongest strengthening effect (Figure 10c). Yield strength increases dramatically from 350 MPa to 450 MPa as Mo content increases from 0.0 to 0.5 wt%. This validates the multiple strengthening mechanisms previously analyzed as strong solid-solution effects, carbide formation potential, and hardenability enhancement [37]. The significant ductility reduction (27 to 21% elongation) confirmed the predicted trade-off associated with the strong carbide-forming tendency of Mo [38].
Nickel (Figure 10d) shows moderate strengthening (294 MPa to 328 MPa yield strength, 0.0 to 0.5 wt% Ni) with maintained or slightly improved ductility (31–33% elongation). This behavior validates the theoretical prediction of the role of Ni in promoting retained austenite formation and TRIP effects, explaining the unique combination of strength enhancement and preserved ductility [39,40].
Chromium content shows (Figure 10e) a progressive strengthening effect, with yield strength increasing steadily from 330 MPa at 0.08 wt% to 475 MPa at 0.48 wt%. The observed linear relationship validates the predicted solid-solution strengthening mechanism (Δσ_Cr = 84 × wt% Cr), confirming consistent lattice distortion effects without microstructural phase changes in this composition range. The accompanying ductility reduction (32–22% elongation) experimentally supports the theoretical analysis of increased dislocation resistance [37,41].
When Cu is present in a solid solution, it stiffens the ferrite and decreases ductility. The microstructural mechanisms underlying the influence of Cu on mechanical properties are complex and multifaceted, as Cu primarily strengthens steel through precipitation hardening via the formation of coherent ε-Cu precipitates during aging or tempering processes [42,43]. As shown in Figure 10, Cu demonstrates complex behavior with yield strength increasing from 290 MPa to 380 MPa across the 0.06–0.30 wt% range, corresponding to +90 MPa strengthening per 0.24 wt% Cu range. The literature validation shows good agreement with the established values of 60–100 MPa strengthening per wt% Cu through precipitation hardening mechanisms [44]. However, the critical nature of Cu stems from its efficiency per unit concentration and unique precipitation hardening mechanism. This strengthening behavior can be attributed to the Orowan strengthening mechanism, where the yield strength increment (Δσy) follows the relationship Δσy = (0.4 Gb/πλ) × ln(d/2b), where G is the shear modulus, b is the Burgers vector, λ is the interparticle spacing, and d is the precipitate diameter [36]. Furthermore, the ductility behavior shows an initial improvement (30% to 33.5% elongation up to 0.12% Cu) followed by a reduction, indicating the transition from beneficial solid-solution effects to precipitation-dominated strengthening. This unique dual-phase behavior distinguishes Cu from simple solid-solution strengtheners, justifying its critical classification despite its moderate absolute effects [37,45]. However, it should be acknowledged that the model’s predictions regarding Cu behavior, particularly the complex precipitation hardening mechanisms and dual-phase transitions, require further validation through expanded experimental campaigns and independent studies by the broader research community to fully confirm the accuracy of these predicted relationships.
The effectiveness of Nb as both a grain refiner and strengthening element stems from its strong affinity for carbon and nitrogen, forming thermodynamically stable Nb(C,N) precipitates [46,47]. As shown in Figure 10g, Nb exhibits complex behavior with a yield strength varying between 305 and 350 MPa across the 0.000–0.008% range. Nb significantly influences mechanical properties through multiple microstructural mechanisms. Nb(C,N) precipitates formed during austenite conditioning (900–1100 °C) acted as potent nucleation sites for recrystallization, resulting in fine austenite grains. The austenite grain size follows the relationship; dγ = k1 × (Nbsol)0.5, where dγ is the austenite grain size, k1 is a constant, and Nbsol represents the Nb content in solid solution [37]. This refined austenite grain structure transforms to fine ferrite grains during cooling, contributing to strengthening via the Hall–Petch relationship; σy = σ0 + ky × d−0.5, where σ0 is the friction stress and ky is the Hall–Petch coefficient [37]. Baker [39] reports typical Nb effects of 70–100 MPa/0.01 wt% Nb (7000–10,000 MPa/wt% efficiency). Our calculated efficiency falls within the lower range, suggesting that the dataset may not fully capture the potential of Nb owing to its limited concentration range [39].
Nb atoms in solid solution exert a solute drag effect on dislocations, contributing to solid solution strengthening according to; Δσss = kss × (CNb)2/3, where k_ss is the solid solution strengthening coefficient and CNb is the Nb concentration [47]. The observed improvement in both strength and ductility with the addition of Nb (Figure 10g) represents the optimal balance between grain refinement strengthening and maintained work-hardening capacity in fine-grained structures. The enhanced ductility is attributed to the uniform distribution of fine precipitates, which promotes homogeneous deformation and delays necking initiation. While Nb demonstrates high theoretical efficiency, its limited concentration range undermines confidence in its critical designation within this specific dataset. Future studies with expanded Nb concentration ranges are required for definitive classification.
Figure 10h shows that Ti provides +25 MPa strengthening per 0.029 wt% range (efficiency: +862 MPa/wt% Ti) with ductility improvement from 29% to 32% elongation. This unique behavior stems from the dual mechanisms of TiN precipitation strengthening and the beneficial grain-refinement effects. Gladman [37] confirms 60–80 MPa/0.01 wt% Ti through TiN precipitation. Our efficiency calculation (+862 MPa/wt%) suggests stronger effects, possibly owing to synergistic interactions with other microalloying elements or enhanced grain refinement in the cast steel microstructure.
Vanadium demonstrated the most significant strengthening among the microalloying elements, as shown in Figure 10i. As the yield strength increased from 355 MPa to 435 MPa across the 0.000–0.020% range, V provided +80 MPa strengthening per 0.019 wt% range. Vervynckt et al. [41] documented precipitation strengthening of 148 MPa/wt% V through V(C,N) precipitation and lowers elongation thereby. Our analysis suggests that V effects may have been underestimated in previous classifications because of the limited concentration range investigated.
Tungsten provided modest strengthening across the 0.003–0.018% range (Figure 10j). Although the absolute effect is limited, the calculated efficiency suggests its potential importance in specialized applications. Bhadeshia [38] documented the effects of W2C and WC carbide formation, which are reflected in reduced elongation. The strengthening mechanism involves both solid-solution effects and secondary carbide precipitation during tempering. Future studies should investigate wider concentration ranges for Nb (0.000–0.050%), V (0.000–0.100%), and Ti (0.000–0.100%) to establish reliable strengthening relationships and validate the efficiency calculations obtained from the currently limited dataset. The investigation of modern microalloying additions (B, Al, and N) and their interactions would enhance the understanding of contemporary steel design, which is beyond the scope of the present work.
The combined effects of C and Mn are shown in Figure 11, revealing distinct property optimization regions. In Figure 11a, the YS varies between 280 MPa and 460 MPa, with peak values concentrated in regions containing moderate Mn content (1.2–1.4 wt%) and lower C content (0.12–0.18 wt%). This experimental observation aligns with the theoretical understanding that moderate Mn enhances solid solution strengthening while avoiding excessive carbide precipitation, which can impede plastic deformation. As shown in Figure 11b, TS exhibited a broader optimization window, ranging from 460 to 740 MPa. Maximum tensile strength is achieved in compositions containing higher Mn (1.2–1.6 wt%) and intermediate C (0.18–0.26 wt%), experimentally confirming the synergistic strengthening mechanisms previously discussed. The enhanced TS in this compositional range validates the predicted balance between refined pearlite morphology and controlled transformation kinetics [38,48,49].
The elongation results in Figure 11c show values ranging from 18% to 38%, with optimal ductility occurring in compositions with moderate C (0.18–0.24 wt%) and Mn levels around 0.8–1.2 wt%. These experimental findings support the microstructural analysis, indicating that this compositional window effectively balances carbide precipitation strengthening while maintaining work-hardening capacity.
The observed strength–ductility balance in the optimal range (1.0–1.2 wt% Mn, 0.20–0.24 wt% C) validates the calculated Ar3 temperatures and their influence on final microstructure. The strength plateau and ductility optimization regions experimentally verified the predicted transition from beneficial fine M3C carbides to detrimental coarse carbide networks at higher C contents. The TS distribution pattern confirms the calculated hardenability effects, where intermediate C-Mn combinations promote the optimal cooling of the transformation products. The comprehensive analysis demonstrated that the developed ANN model successfully captured complex C-Mn interactions and their individual contributions to the mechanical properties. The model accurately predicted the experimental property distributions shown in Figure 11, validating both the underlying microstructural understanding and the machine-learning approach for C-Mn cast steel property optimization.

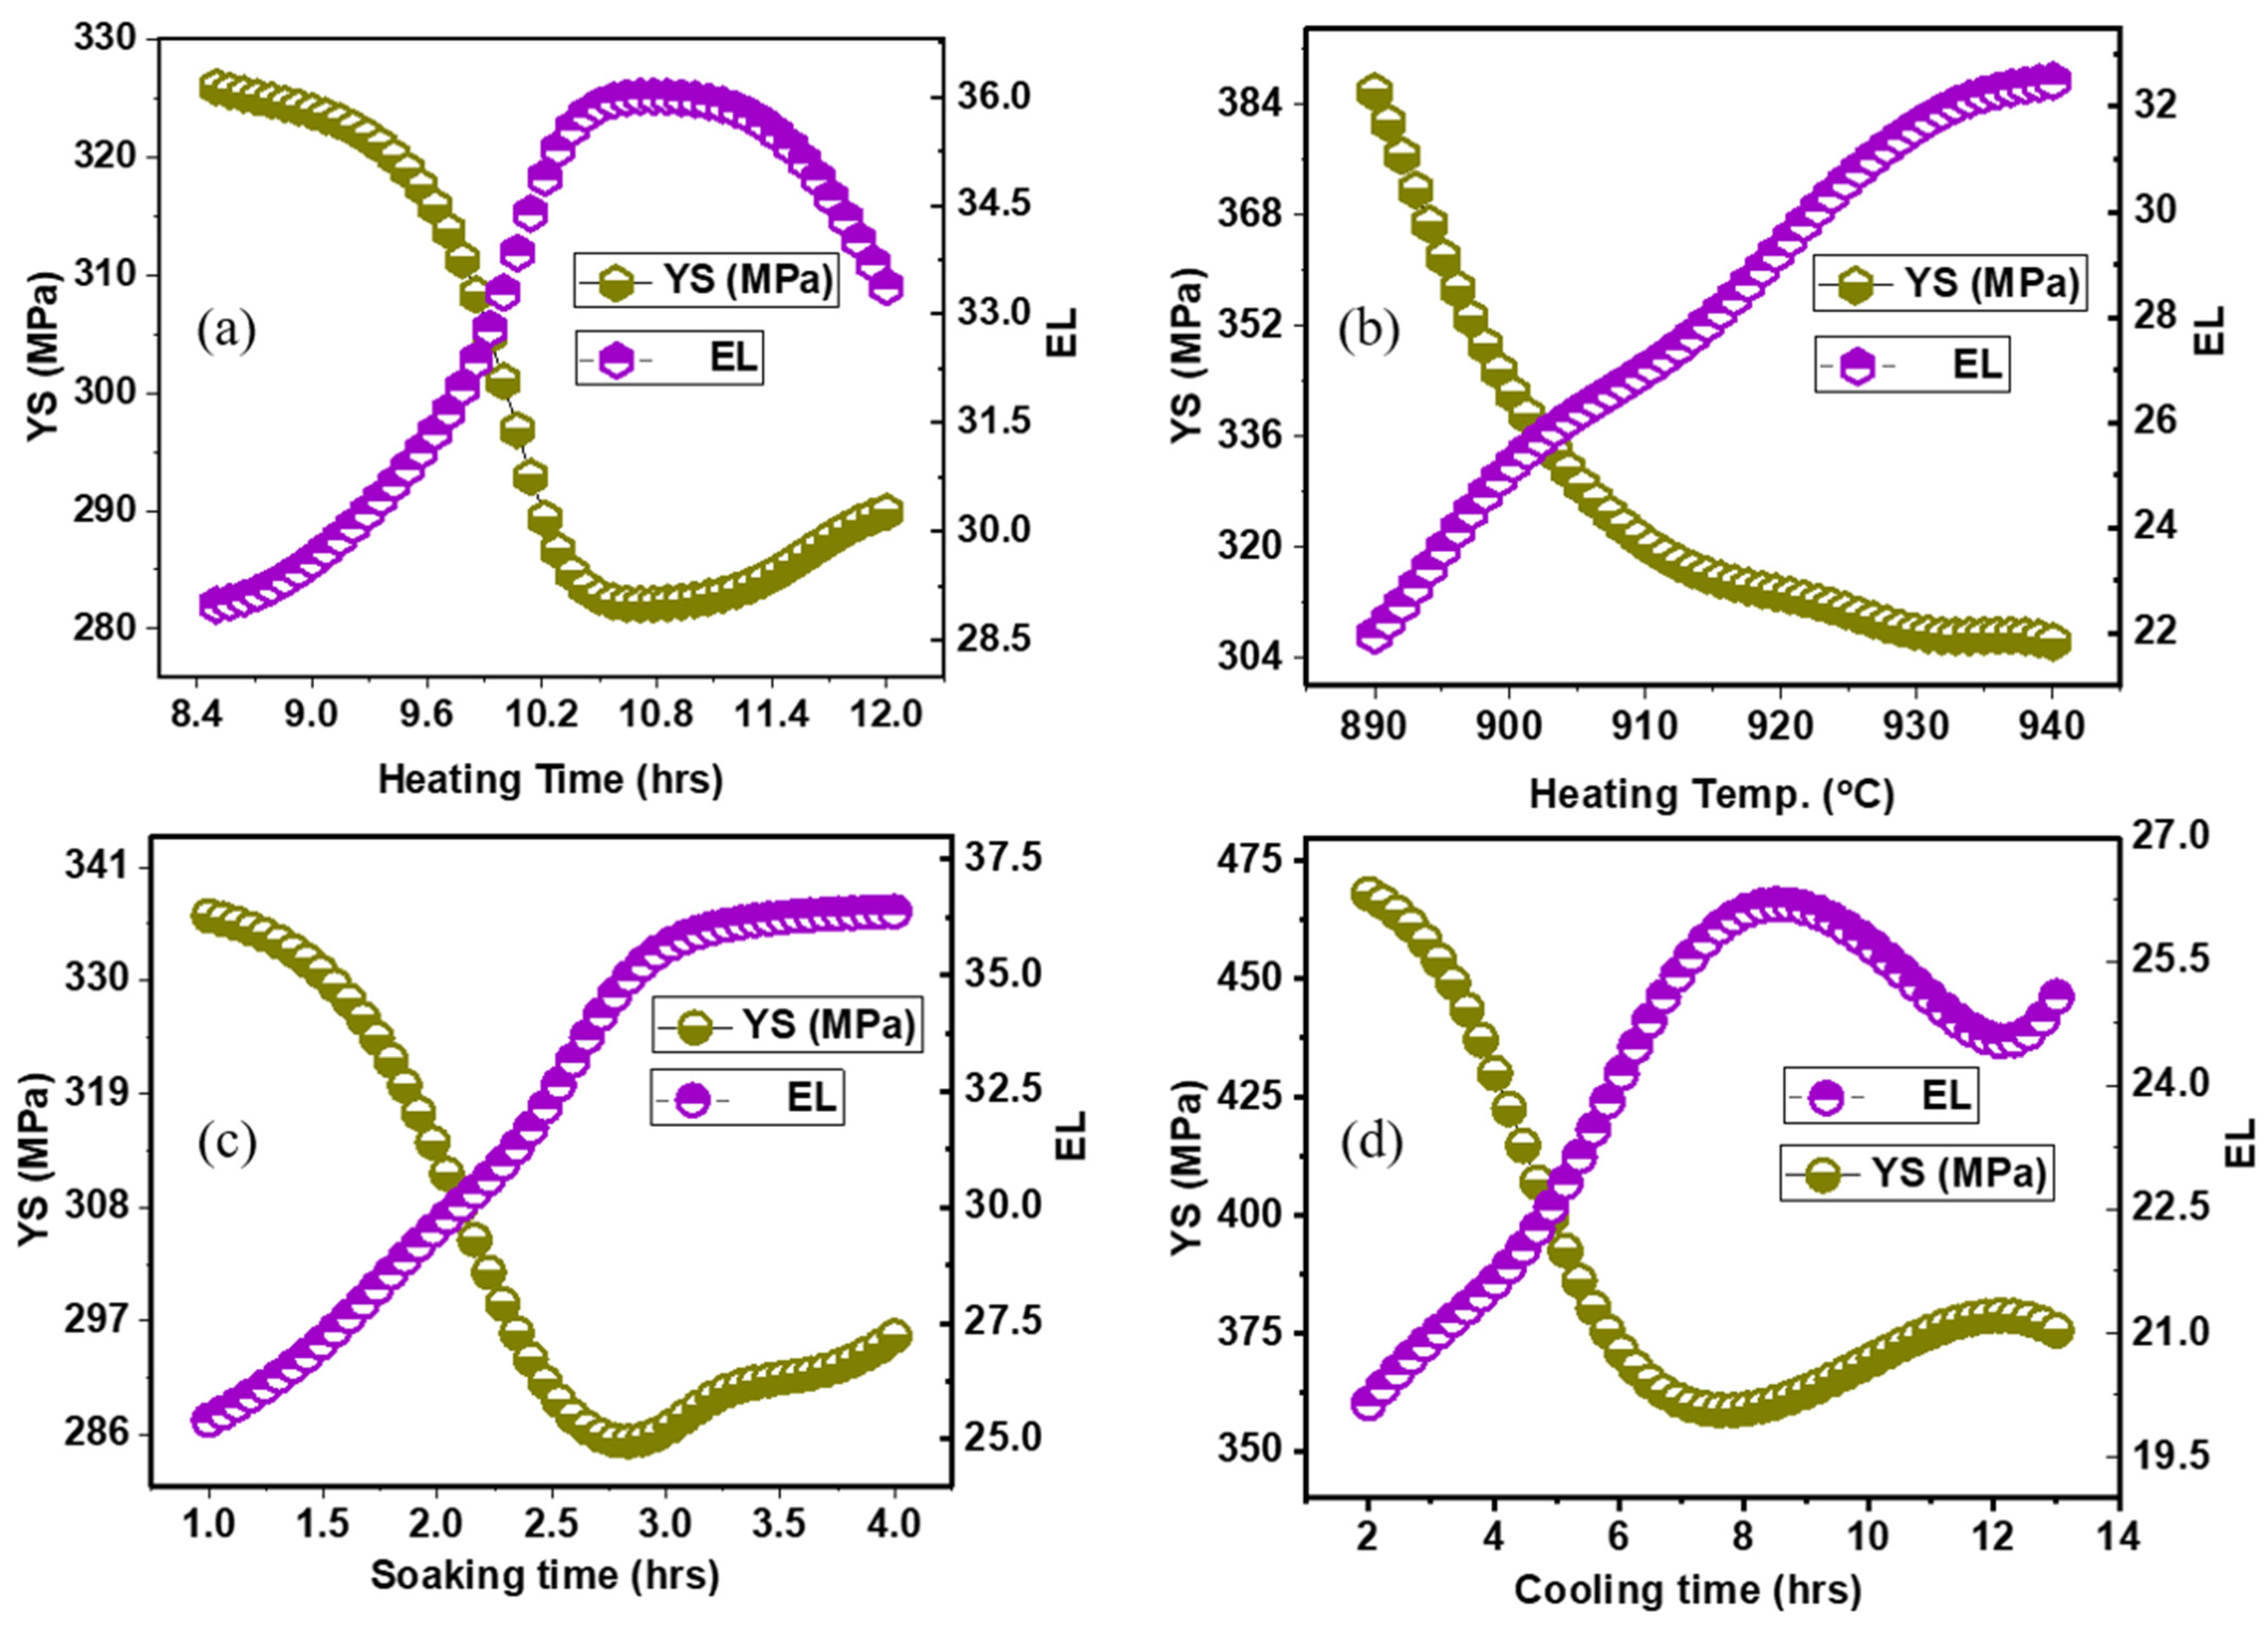
Heat Treatment Parameters on Mechanical Properties

The developed ANN model successfully captured the complex interdependencies between the heat-treatment parameters and the mechanical properties of C-Mn cast steels, as shown in Figure 12. The thermal processing parameters exhibited a significant influence on mechanical performance, validating their critical role in microstructural evolution and property optimization. Figure 12a reveals a distinct nonlinear relationship between the heating time and mechanical properties. Within the experimental range of 9–12 h, the yield strength initially decreased from approximately 325 MPa to 285 MPa as the heating time increased to 10.2 h, followed by a gradual recovery to 290 MPa at extended heating times. Conversely, the elongation exhibited an inverse trend, increasing from 28.5% to 36.0% at 10.8 h before stabilizing at approximately 33.0%. Extended heating times promote austenite grain growth following the relationship; d2 − d02 = kt, where d is the grain size at time t, d0 is the initial grain size, and k is the temperature-dependent growth rate constant [49,50]. The initial strength decrease corresponds to carbide dissolution and austenite grain coarsening, whereas the recovery at extended times suggests dynamic recrystallization and grain size stabilization. The heating temperature range of 890–940 °C had pronounced effects on the mechanical properties (Figure 12b). The yield strength decreased monotonically from 384 MPa to 304 MPa with increasing temperature, while the elongation exhibited a corresponding increase from 22% to 32%. This temperature-dependent behavior reflects the enhanced austenite grain growth and dissolution of strengthening carbides at elevated temperatures. Correlation analysis confirmed a positive correlation coefficient of 0.271 between the heating temperature and both the yield strength and tensile strength, indicating that higher temperatures facilitate the complete dissolution of secondary phases, leading to improved microstructural homogenization despite reduced strength [50,51].
Figure 12c illustrates the impact of soaking time (1.0 to 4.0 h) on the mechanical properties. The yield strength decreased from 335 MPa to 295 MPa with extended soaking, whereas the elongation increased from 26% to 36%. The extended soaking time allowed for complete microstructural transformation and stress relief, resulting in enhanced ductility through grain-boundary relaxation and carbide spheroidization. The positive correlation coefficients between soaking time and strength properties (YS: 0.196; TS: 0.320) confirm that controlled soaking promotes phase stabilization and microstructural refinement [38].
The cooling time parameter (2–13 h) exhibited the most complex influence on mechanical properties (Figure 12d). The yield strength initially decreased from 470 to 375 MPa during rapid cooling (2–8 h), and then gradually recovered to 377 MPa with extended cooling times. The elongation showed an inverse relationship, decreasing from 25% to 20% with prolonged cooling. The negative correlation coefficients for the cooling time with both YS (−0.262) and TS (−0.282) suggest that extended cooling promotes microstructural coarsening and precipitate overgrowth, which compromises the strength properties while potentially improving the ductility through stress relaxation [50].
The thermal processing effects observed in Figure 12 can be rationalized through fundamental metallurgical principles. Extended heating times and elevated temperatures promoted austenite grain growth and carbide dissolution, leading to reduced strength and enhanced ductility. The effects of soaking time demonstrate the importance of thermal equilibration for achieving homogeneous microstructures. The cooling rate sensitivity reflects the competition between precipitation strengthening and microstructural coarsening, where controlled cooling rates optimize the balance between the strength and ductility. These findings demonstrate that the heat treatment parameters serve as critical control variables for tailoring the mechanical properties of C-Mn cast steels. The ability of the ANN model to capture these complex thermal-mechanical relationships provides a valuable tool for optimizing industrial heat treatment processes to achieve the desired property combinations.

4.4. Literature Validation and Performance Comparison

The developed 20-44-44-4 artificial neural network architecture, trained on 500 industrial C-Mn cast steel samples, achieved mean prediction errors of 3.45% for yield strength, 4.2% for tensile strength, and 4.9% for elongation. Remarkably, 90% of all predictions fell within the industrially acceptable tolerance of ±5%, establishing a new benchmark for the accuracy of cast steel property prediction.
When evaluated against contemporary machine-learning studies, the model demonstrated clear performance advantages. Liu et al. [52] achieved R2 values exceeding 0.93 for austenitic stainless steels using neural networks on 200+ samples, while Xiong et al. [53] reported mean absolute percentage errors of 4.8% and 5.2% for yield strength and tensile strength, respectively, using ensemble methods on 360 carbon and low-alloy steel samples. The superior precision of the present study stems from its larger dataset providing enhanced statistical reliability and specialized focus on industrial cast steels, addressing a critical gap in which most studies have concentrated on wrought or stainless-steel grades. Industrial-scale applications by Zippo et al. [54] achieved real-time prediction errors of less than 6% using self-updating machine-learning systems. While offering adaptive capabilities, their approach requires continuous model updates, whereas the proposed model provides superior baseline accuracy without such computational overhead. The comprehensive sensitivity analysis and user-friendly graphical interface further enhance the practical applicability for industrial implementation. Advancements over conventional approaches have been substantial. Traditional empirical methods [55] typically exhibit errors of 8–15% for the yield strength and 6–12% for the tensile strength, whereas the Hall-Petch relationships [56] demonstrate errors ranging from to 10–20% and 8–15% respectively. The performance of the proposed model represents a two-to four-fold improvement, highlighting the transformative potential of optimized machine learning in metallurgical property prediction (Table 3). Three key factors distinguish this work from the existing literature. First, the comprehensive 500-sample industrial dataset incorporating 16 alloying elements surpasses most studies in terms of scope and industrial relevance. Second, unlike research focusing solely on chemical composition, this model integrates heating temperature, soaking time, and cooling parameters, capturing complete process-property relationships. Third, the specialized application to C-Mn cast steels fills an identified industrial gap, while providing more stringent validation through ±5% deviation criteria rather than typical R2 reporting. This research represents a significant step toward the digitalization of metallurgical engineering, demonstrating how optimized neural network architectures can effectively bridge fundamental material science with industrial practice. The combination of superior accuracy, comprehensive process integration, and accessible implementation makes this model a valuable tool for industrial steel production optimization and quality control applications.

5. Discussion and Future Perspectives

The developed ANN model demonstrated exceptional predictive performance, with 90% of the predictions within ±5% deviation, significantly outperforming traditional empirical methods (8–20% typical errors). The comprehensive analysis of 16 alloying elements and four heat-treatment parameters captures complex nonlinear interactions that are difficult to obtain through conventional experimental approaches. Training on 500 industrial samples ensures practical applicability and direct transferability to manufacturing settings, offering substantial cost and time savings compared with traditional trial-and-error optimization methods. This user-friendly graphical interface democratizes advanced predictive capabilities, making them accessible to both experts and technicians without programming expertise. Table 3 presents a quantitative comparison of the prediction accuracies of our developed ANN model and the performance metrics reported in the literature.
Despite these advantages, the proposed approach has important limitations that must be acknowledged. The predictive capability of the model is constrained to the compositional and processing parameter ranges in the training dataset, limiting extrapolation beyond these boundaries. This approach lacks explicit microstructural modeling, which restricts mechanistic insights into property–microstructure relationships crucial for advanced alloy design. Current heat-treatment parameters are simplified and do not account for complex thermal cycles or advanced processing techniques that are increasingly important in modern steel manufacturing. Additionally, the model provides point predictions without uncertainty quantification, making it difficult to assess prediction reliability for individual cases.
Future work should prioritize integrating microstructural modeling with property prediction by incorporating physics-based models for phase transformation and precipitation kinetics. Expanding the model to include advanced processing parameters, such as controlled cooling rates and thermomechanical processing conditions, would enhance its industrial applicability. The development of multi-objective optimization frameworks that simultaneously optimize multiple properties while considering manufacturing constraints represents a critical advancement opportunity. Implementing uncertainty quantification through Bayesian neural networks enhances the decision-making capabilities in industrial applications.
Successful industrial implementation requires integration with existing quality management systems and establishment of protocols for model maintenance and performance monitoring. This approach represents a significant step toward the digitalization of metallurgical engineering, demonstrating how machine learning can bridge fundamental materials science and industrial practice. The methodology establishes a framework applicable to other alloy systems and manufacturing processes, contributing to Industry 4.0 and smart manufacturing objectives. The success of industrial C-Mn cast steel prediction suggests the potential for accelerating material discovery and optimization across various industrial sectors, representing a paradigm shift from traditional experimental approaches to data-driven material engineering.

6. Conclusions

This study successfully developed and validated a comprehensive artificial neural network (ANN) model for predicting the mechanical properties of carbon-manganese cast steels based on chemical composition and heat treatment parameters.
The optimized 20-44-44-4 ANN architecture demonstrated exceptional predictive performance, achieving mean prediction errors of 3.45% for YS, 3.97% for TS, 4.9% for EL, and 3.8% for RA, with 90% of the predictions falling within a tolerance range of ± 5%. This represents a significant improvement over traditional empirical method. The model was trained on an extensive industrial dataset of 500 samples incorporating 16 alloying elements and four heat-treatment parameters, ensuring direct transferability to manufacturing environments.
Sensitivity analysis revealed critical material insights: among the major alloying elements, manganese demonstrated the strongest strengthening effect (yield strength increasing from 330–340 MPa to 475 MPa at 1.4 wt%), followed by molybdenum (350 MPa to 450 MPa across 0.0–0.5 wt% range) and chromium (330 MPa to 475 MPa across 0.08–0.48 wt% range). Carbon showed a complex behavior with peak strengthening at approximately 0.24 wt% (290 MPa to 355 MPa). Among the microalloying elements, vanadium exhibited the most significant strengthening effect (355 MPa to 435 MPa across the 0.000–0.020% range), followed by niobium (305 to 350 MPa across the 0.000–0.008% range), titanium (315 MPa to 350 MPa across the 0.000–0.029 wt% range), and tungsten (modest strengthening 310 MPa to 330 MPa across the 0.003–0.018% range). While niobium showed a narrower concentration range (0.008% variation) than vanadium (0.019%), titanium (0.027%), and tungsten (0.017%), its strengthening efficiency remained significant within the investigated range.
The development of an intuitive graphical user interface democratizes advanced predictive capabilities, making sophisticated material–property predictions accessible without programming expertise. This significantly reduces the experimental costs and time compared to traditional trial-and-error optimization methods.

Supplementary Materials

The following supporting information can be downloaded at: https://www.mdpi.com/article/10.3390/met15070790/s1, Supplementary Data S1 KMPRI data (under various combinations of composition and heat treatment conditions) and Supplementary Data S2 (weight files).

Author Contributions

Conceptualization, S.T., N.P. and N.G.S.R.; methodology: S.T. and S.H.; software, N.G.S.R. and S.T.; validation, S.H. and S.T.; formal analysis and investigation, S.H. and S.T.; resources, N.G.S.R. and N.P.; data curation, S.T. and S.H.; writing—original draft preparation, S.T. and N.G.S.R.; writing—review and editing, S.T., N.G.S.R. and N.P.; visualization, S.H.; supervision, N.G.S.R. and N.P.; project administration, N.G.S.R.; funding acquisition, N.P. and N.G.S.R. All the authors have read and agreed to the published version of the manuscript. All authors have read and agreed to the published version of the manuscript.

Funding

This research was also funded and conducted under the Industrial Innovation Talent Growth Support Project of the Korean Ministry of Trade, Industry, and Energy (MOTIE), operated by the Korea Institute for Advancement of Technology (KIAT). (No. P0023676, Expert Training Project for eco-friendly metal materials industry). This work was supported by the Learning & Academic Research Institution for Master’s PhD students and the Postdocs (LAMP) Program of the National Research Foundation of Korea (NRF), funded by the Ministry of Education (No. RS-2023-00301974).

Data Availability Statement

The original contributions of this study are included in the article and Supplementary Material. Further inquiries can be directed to the corresponding authors.

Conflicts of Interest

The authors declare that they have no conflicts of interest.

References

  1. Woolman, J.; Mottram, R.A. En 14—Carbon–Manganese Steel. In En 1 to En 20; Woolman, J., Mottram, R.A., Eds.; Pergamon: Oxford, UK, 1964; pp. 220–245. ISBN 978-0-08-010835-3. [Google Scholar]
  2. Lee, S.H.; Kim, K.H.; Van, D.; Nam, S. Effect of C-Mn Ratio on the Maximum Hardness and Toughness in TMCP Steels with an Identical Carbon Equivalent. J. Mater. Res. Technol. 2020, 9, 8916–8928. [Google Scholar] [CrossRef]
  3. Liu, R.; Wang, X.; Xu, X.; Cui, C.; Lv, D.; Sun, Q.-F.; Cao, Z.; He, L.; Teng, F.; Fan, W.; et al. Effect of Isothermal Treatment and Rolling on the Microstructure and Properties of Low Carbon Manganese Steel. J. Mater. Eng. Perform. 2025. print. [Google Scholar] [CrossRef]
  4. Gürol, U.; Can, K.S. Effect of Carbon and Manganese Content on the Microstructure and Mechanical Properties of High Manganese Austenitic Steel. J. Min. Metall. Sect. B 2020, 56, 171–182. [Google Scholar] [CrossRef]
  5. Timokhina, I.; Hodghson, P.; Pereloma, E.V. Effect of Alloying Elements on the Microstructure-property Relationship in Thermomechanically Processed C-Mn-Si TRIP Steels. Steel Res. 2002, 73, 274–279. [Google Scholar] [CrossRef]
  6. Ishtiaq, M.; Tiwari, S.; Nagamani, M.; Kang, S.-G.; Reddy, N.G. Data-Driven ANN-Based Predictive Modeling of Mechanical Properties of 5Cr-0.5Mo Steel: Impact of Composition and Service Temperature. Crystals 2025, 15, 213. [Google Scholar] [CrossRef]
  7. Zaitsev, A.; Koldaev, A.; Arutyunyan, N.; Dunaev, S.; D’yakonov, D. Effect of the Chemical Composition on the Structural State and Mechanical Properties of Complex Microalloyed Steels of the Ferritic Class. Processes 2020, 8, 646. [Google Scholar] [CrossRef]
  8. Wang, Z.; Zhao, A.; Zhao, Z.; Ye, J.; Tang, D.; Zhu, G. Microstructures and Mechanical Properties of C-Mn-Cr-Nb and C-Mn-Si-Nb Ultra-High Strength Dual-Phase Steels. Int. J. Miner. Metall. Mater. 2012, 19, 915–922. [Google Scholar] [CrossRef]
  9. Zhu, Y.Z.; Yin, Z.M.; Zeng, Y.; Huang, J.W.; Li, X.Q. Effects of Heat Treatment on Microstructure and Mechanical Properties of Fe-Co-Ni-Cr-Mo-C Alloy. J. Cent. South Univ. Technol. 2004, 11, 229–234. [Google Scholar] [CrossRef]
  10. Wendler, M.; Weiß, A.; Krüger, L.; Mola, J.; Franke, A.; Kovalev, A.; Wolf, S. Effect of Manganese on Microstructure and Mechanical Properties of Cast High Alloyed CrMnNi-N Steels. Adv. Eng. Mater. 2013, 15, 558–565. [Google Scholar] [CrossRef]
  11. Chernova, G.P.; Bogdashkina, N.L.; Porshneva, A.I.; Shvets, V.A.; Troshkin, G.N. Effect of C and Cr on the Structure, Phase Composition, and Mechanical Properties of Cast Fe−Cr Alloys. Met. Sci. Heat Treat. 1989, 31, 60–63. [Google Scholar] [CrossRef]
  12. Benedito, A.V.; Torres, C.A.B.; Silva, R.M.D.C.; Krahl, P.A.; Cardoso, D.C.T.; Silva, F.D.A.; Martins, C.H. Effects of Niobium Addition on the Mechanical Properties and Corrosion Resistance of Microalloyed Steels: A Review. Buildings 2024, 14, 1462. [Google Scholar] [CrossRef]
  13. Salvetr, P.; Gokhman, A.; Svoboda, M.; Donik, Č.; Podstranská, I.; Kotous, J.; Nový, Z. Effect of Cu Alloying on Mechanical Properties of Medium-C Steel after Long-Time Tempering at 500 °C. Materials 2023, 16, 2390. [Google Scholar] [CrossRef] [PubMed]
  14. Kumar, J.T.; Sudha, J.; Padmanabhan, K.; Frolova, A.; Stolyarov, V. Influence of Strain Rate and Strain at Temperature on TRIP Effect in a Metastable Austenitic Stainless Steel. Mater. Sci. Eng. Struct. Mater. Prop. Microstruct. Process 2020, 777, 139046. [Google Scholar] [CrossRef]
  15. Pantilimon, M.C.; Berbecaru, A.C.; Gherghescu, I.A.; Coman, G.; Ciucă, S.; Grecu, A.; Sohaciu, M.G.; Dumitrescu, R.E.; Predescu, C. Comparative Evaluation of the TRIP Effect in Steels with Different Contents of Mn and Al. Metals 2022, 12, 443. [Google Scholar] [CrossRef]
  16. Kučerová, L. The Effect of Two-Step Heat Treatment Parameters on Microstructure and Mechanical Properties of 42SiMn Steel. Metals 2017, 7, 537. [Google Scholar] [CrossRef]
  17. Zhou, Y.; Song, X.; Liang, J.; Shen, Y.; Misra, R. Innovative Processing of Obtaining Nanostructured Bainite with High Strength—High Ductility Combination in Low-Carbon-Medium-Mn Steel: Process-Structure-Property Relationship. Mater. Sci. Eng. Struct. Mater. Prop. Microstruct. Process 2018, 718, 267–276. [Google Scholar] [CrossRef]
  18. Caballero, F.; Bhadeshia, H.; Mawella, K.; Jones, D.; Brown, P. Design of Novel High Strength Bainitic Steels: Part 2. Mater. Sci. Technol. 2001, 17, 517–522. [Google Scholar] [CrossRef]
  19. Bhadeshia, H. Neural Networks in Materials Science: The Importance of Uncertainty; Tata McGraw–Hill Publishing Company Ltd.: Mumbai, India, 2006. [Google Scholar]
  20. Ishtiaq, M.; Tiwari, S.; Panigrahi, B.B.; Seol, J.B.; Reddy, N.S. Neural Network-Based Modeling of the Interplay between Composition, Service Temperature, and Thermal Conductivity in Steels for Engineering Applications. Int. J. Thermophys. 2024, 45, 137. [Google Scholar] [CrossRef]
  21. da Cunha Rocha, A.; Enrique Monforte Brandão Marques, P. The Use of Machine Learning to Predict Steel Properties—A Review on the Latest Works. In New Advances in Steel Engineering; da Cunha Rocha, A., Ed.; IntechOpen: Rijeka, Croatia, 2024; ISBN 978-1-83769-831-8. [Google Scholar]
  22. Bartsch, H.; Voelkel, J.; Feldmann, M. Developing Artificial Neural Networks to Estimate the Fatigue Strength of Structural Steel Details Using the New European Database. Steel Constr. 2025, 18, 1–13. [Google Scholar] [CrossRef]
  23. Hodroj, A.; Bouglia, R.; Ding, Y.; Zghal, M. Machine Learning for Density Prediction and Process Optimization of 316L Stainless Steel Fabricated by Selective Laser Melting. J. Intell. Manuf. 2025, 1–15. [Google Scholar] [CrossRef]
  24. Wang, S.; Wu, X. The Mechanical Performance Prediction of Steel Materials Based on Random Forest. Front. Comput. Intell. Syst. 2023, 6, 1–3. [Google Scholar] [CrossRef]
  25. Saarela, M.; Podgorelec, V. Recent Applications of Explainable AI (XAI): A Systematic Literature Review. Appl. Sci. 2024, 14, 8884. [Google Scholar] [CrossRef]
  26. Nikiforidis, K.; Kyrtsoglou, A.; Vafeiadis, T.; Kotsiopoulos, T.; Nizamis, A.; Ioannidis, D.; Votis, K.; Tzovaras, D.; Sarigiannidis, P. Enhancing Transparency and Trust in AI-Powered Manufacturing: A Survey of Explainable AI (XAI) Applications in Smart Manufacturing in the Era of Industry 4.0/5.0. ICT Express 2024, 11, 135–148. [Google Scholar] [CrossRef]
  27. Butler, K.T.; Oviedo, F.; Canepa, P. Machine Learning in Materials Science; ACS In focus; American Chemical Society: Washington, DC, USA, 2022; ISBN 978-0-8412-9946-7. [Google Scholar]
  28. Beyer, H.-G.; Tukey, J.W. Exploratory Data Analysis. Addison-Wesley Publishing Company Reading, Mass.—Menlo Park, Cal., London, Amsterdam, Don Mills, Ontario, Sydney 1977, XVI, 688 S. Biom. J. 1981, 23, 413–414. [Google Scholar] [CrossRef]
  29. Kotsiopoulos, T.; Papakostas, G.; Vafeiadis, T.; Dimitriadis, V.; Nizamis, A.; Bolzoni, A.; Bellinati, D.; Ioannidis, D.; Votis, K.; Tzovaras, D.; et al. Revolutionizing Defect Recognition in Hard Metal Industry through AI Explainability, Human-in-the-Loop Approaches and Cognitive Mechanisms. Expert Syst. Appl. 2024, 255, 124839. [Google Scholar] [CrossRef]
  30. Tiwari, S.; Narayana, P.L.; Ishtiaq, M.; Wang, X.-S.; Park, N.; Reddy, N.S. Artificial Neural Network-Based Prediction of Stacking Fault Energy in Fe-Cr-Mn-C-N Steels. Can. Metall. Q. 2025, 1–9. [Google Scholar] [CrossRef]
  31. BS EN 10293:2015; Steel Castings for General Engineering Uses. British Standards Institution: London, UK, 2015.
  32. BS EN 10340:2007; Steel Castings for Structural Uses. British Standards Institution: London, UK, 2007.
  33. BS EN 10213:2007+A1:2016; Steel Castings for Pressure Purposes. British Standards Institution: London, UK, 2016.
  34. Bishop, C.M.; Nasrabadi, N.M. Pattern Recognition and Machine Learning; Springer: Berlin/Heidelberg, Germany, 2006; Volume 4. [Google Scholar]
  35. Barnett, M.R.; Wang, H.; Guo, T. An Orowan Precipitate Strengthening Equation for Mechanical Twinning in Mg. Int. J. Plast. 2019, 112, 108–122. [Google Scholar] [CrossRef]
  36. Ahmadi, M.R.; Povoden-Karadeniz, E.; Öksüz, K.I.; Falahati, A.; Kozeschnik, E. A Model for Precipitation Strengthening in Multi-Particle Systems. Comput. Mater. Sci. 2014, 91, 173–186. [Google Scholar] [CrossRef]
  37. Gladman, T. The Physical Metallurgy of Microalloyed Steels; Taylor & Francis Group: London, UK, 2002; ISBN 978-1-902653-81-5. [Google Scholar]
  38. Bhadeshia, H.K.D.H. 21—Physical Metallurgy of Steels. In Physical Metallurgy, 5th ed.; Laughlin, D.E., Hono, K., Eds.; Elsevier: Oxford, UK, 2014; pp. 2157–2214. ISBN 978-0-444-53770-6. [Google Scholar]
  39. Baker, T.N. Microalloyed Steels. Ironmak. Steelmak. 2016, 43, 264–307. [Google Scholar] [CrossRef]
  40. Lugovy, M.; Slyunyayev, V.; Brodnikovskyy, M. Solid Solution Strengthening in Multicomponent Fcc and Bcc Alloys: Analytical Approach. Prog. Nat. Sci. Mater. Int. 2021, 31, 95–104. [Google Scholar] [CrossRef]
  41. Vervynckt, S.; Verbeken, K.; Thibaux, P.; Houbaert, Y. Characterization of the Precipitation State during Austenite Processing of a Microalloyed Steel. In Journées Annuelles de la SF2M 2010= SF2M Annual Meeting 2010; Société Française de Métallurgie et de Matériaux (SF2M): Paris, France, 2010; pp. 158–159. [Google Scholar]
  42. Fine, M.E.; Liu, J.Z.; Asta, M.D. An Unsolved Mystery: The Composition of Bcc Cu Alloy Precipitates in Bcc Fe and Steels. Mater. Sci. Eng. A 2007, 463, 271–274. [Google Scholar] [CrossRef]
  43. Cui, S.; Mamivand, M.; Morgan, D. Simulation of Cu Precipitation in Fe-Cu Dilute Alloys with Cluster Mobility. Mater. Des. 2020, 191, 108574. [Google Scholar] [CrossRef]
  44. Leslie, W.C. The Physical Metallurgy of Steels; Hempisphere Publishing Corporation: London, UK, 1981; ISBN 978-0-07-037780-6. [Google Scholar]
  45. Regenspurg, S.; Geigenmüller, I.; Milsch, H.; Kühn, M. Copper Precipitation as Consequence of Steel Corrosion in a Flow-through Experiment Mimicking a Geothermal Production Well. Geotherm. Energy 2017, 5, 11. [Google Scholar] [CrossRef]
  46. Majta, J.; Muszka, K. 9—Modelling Microstructure Evolution and Work Hardening in Conventional and Ultrafine-Grained Microalloyed Steels. In Microstructure Evolution in Metal Forming Processes; Lin, J., Balint, D., Pietrzyk, M., Eds.; Woodhead Publishing: New Delhi, India, 2012; pp. 237–264. ISBN 978-0-85709-074-4. [Google Scholar]
  47. Cai, F.; Zhou, M.; Tian, J.; Xu, G. Comparative Study of the Role of Niobium in Low-Carbon Ferritic and Bainitic Steels. Mater. Sci. Eng. A 2022, 851, 143579. [Google Scholar] [CrossRef]
  48. ASM Handbook Committee. Properties and Selection: Irons, Steels, and High-Performance Alloys; ASM International: Almere, The Netherlands, 1990; ISBN 978-1-62708-161-0. [Google Scholar]
  49. Burke, J.E.; Turnbull, D. Recrystallization and Grain Growth. Prog. Met. Phys. 1952, 3, 220–292. [Google Scholar] [CrossRef]
  50. Yue, C.; Zhang, L.; Liao, S.; Gao, H. Kinetic Analysis of the Austenite Grain Growth in GCr15 Steel. J. Mater. Eng. Perform. 2010, 19, 112–115. [Google Scholar] [CrossRef]
  51. Rajan, T.V.S.; Sharma, A.K.; Sharma, C.P. Heat Treatment: Principles and Techniques; PHI Learning: Delhi, India, 2011; ISBN 978-81-203-4095-4. [Google Scholar]
  52. Wang, Y.-X.; Wu, X.; Li, X.; Xie, Z.M.; Liu, R.; Liu, W.; Zhang, Y.; Xu, Y.; Liu, C. Prediction and Analysis of Tensile Properties of Austenitic Stainless Steel Using Artificial Neural Network. Metals 2020, 10, 234. [Google Scholar] [CrossRef]
  53. Xiong, J.; Zhang, T.; Shi, S.-Q. Machine Learning of Mechanical Properties of Steels. Sci. China-Technol. Sci. 2020, 63, 1247–1255. [Google Scholar] [CrossRef]
  54. Zippo, V.; Robotti, E.; Maestri, D.; Fossati, P.; Valenza, D.; Maggi, S.; Papallo, G.; Belay, M.; Cerruti, S.; Porcu, G.; et al. Development of a Self-Updating System for the Prediction of Steel Mechanical Properties in a Steel Company by Machine Learning Procedures. Technologies 2025, 13, 75. [Google Scholar] [CrossRef]
  55. Paupler, P. G. E. Dieter. Mechanical Metallurgy. 3rd ed., Mc Graw-Hill Book Co., New York 1986. XXIII + 751 p., DM 138.50, ISBN 0–07–016893–8. Cryst. Res. Technol. 1988, 23, 194. [Google Scholar] [CrossRef]
  56. Armstrong, R.W. The Influence of Polycrystal Grain Size on Several Mechanical Properties of Materials. Metall. Mater. Trans. B-Process Metall. Mater. Process Sci. 1970, 1, 1169–1176. [Google Scholar] [CrossRef]
Figure 1. Mechanical properties heatmap: effect of alloying elements and process parameters on C-Mn steel mechanical properties.
Metals 15 00790 g001
Figure 2. Graphic representation of the ANN structure.
Metals 15 00790 g002
Figure 3. Effect of number of hidden layers and neurons on (a) MSE, (b) Etr YS, (c) Etr TS, (d) Etr El, and (e) Etr RA. The black line represents a single hidden layer and the red line represents two hidden layers.
Metals 15 00790 g003
Figure 4. Effect of momentum term on (a) MSE, (b) Etr YS, (c) Etr TS, (d) Etr El, and (e) Etr RA.
Metals 15 00790 g004
Figure 5. Effect of the Learning term on (a) MSE, (b) Etr YS, (c) Etr TS, (d) Etr El, and (e) Etr RA.
Metals 15 00790 g005
Figure 6. Final Iteration for the best selection of architecture: (a) MSE, (b) Etr YS, (c) Etr TS, (d) Etr El, and (e) Etr RA.
Metals 15 00790 g006
Figure 7. (a) Initial weight distribution of the ANN model before transformation, showing a narrow spread centered around ±1.0, owing to standard initialization. (b) Transformed weight distribution of the optimized ANN model (20-44-44-4), where weights are nonlinearly scaled up to ±35, enhancing model convergence and predictive performance.
Metals 15 00790 g007
Figure 8. ANN model prediction for test data of C-Mn cast steels (Sample No. indicates 401, 409, 430, 445, 448, 468, 471, 478, 487, 490, and 491 datasets of Supplementary Data S1).
Metals 15 00790 g008
Figure 9. ANN-based GUI prediction of mechanical properties for mean composition and heat-treatment parameters.
Metals 15 00790 g009
Figure 10. Effect of individual alloying elements on yield strength (YS) and elongation (EL) in C-Mn cast steels obtained through ANN-based sensitivity analysis: (a) carbon, (b) manganese, (c) chromium, (d) nickel, (e) molybdenum, (f) copper, (g) niobium, (h) titanium, (i) vanadium, and (j) tungsten. Sensitivity analysis captures element interactions by varying individual concentrations within the dataset ranges while maintaining the mean values of other elements, revealing both direct and indirect influences through element interactions.
Metals 15 00790 g010aMetals 15 00790 g010b
Figure 11. Combined effects of variations in C and Mn on (a) YS, (b) TS, and (c) EL.
Metals 15 00790 g011
Figure 12. Effect of heat treatment parameters on mechanical properties of C-Mn cast steels predicted by ANN model: (a) heating time, (b) heating temperature, (c) soaking time, and (d) cooling time vs. yield strength and elongation. The dual y–axes show the yield strength (MPa) on the left and the elongation on the right. Sensitivity analysis captures parameter interactions by varying individual heat treatment parameters within the dataset ranges, while maintaining the mean values of other parameters, revealing both direct and indirect influences through thermal processing interactions.
Metals 15 00790 g012
Table 1. Range of C-Mn cast steel data.
Inputs/OutputsMinimumMaximumMeanStandard Deviation
Carbon (wt.%)0.1190.2990.2370.022
Manganese (wt.%)0.6241.5480.9730.107
Silicon (wt.%)0.1930.5970.3720.072
Sulfur (wt.%)0.0110.0460.0310.005
Phosphorous (wt.%)0.0150.0490.0360.005
Chromium (wt.%)0.0770.4580.1580.055
Nickel (wt.%)0.0440.4460.0960.036
Molybdenum (wt.%)0.0090.4880.0280.032
Vanadium (wt.%)0.0010.0190.0030.001
Copper (wt.%)0.0640.2830.1310.03
Tungsten (wt.%)0.0020.0170.0070.002
Titanium (wt.%)0.0010.0270.0020.001
Tin (wt.%)0.00620.0740.0180.006
Aluminum (wt.%)0.0020.1090.0390.022
Niobium (wt.%)0.000000.0080.0000940.022
Heating time (h)8.5129.090.33
Heating temp. °C890 940 909.1 9.65
Soaking time (h)01042.1040.391
Cooling time (h)021310.9362.234
Yield strength (MPa)294461333.25428.59
Tensile strength (MPa)481706544.90841.61
Elongation 19.2934.5726.0722.95
Reduction of area 36.0054.0048.0383.22
Table 2. Chemical composition of the C-Mn cast steel sample used for prediction and analysis (Figure 10 and Figure 11).
CMnSiSPCrNiMoVCu
0.21.1060.410.0260.0320.2490.0850.0240.0030.145
WTiSnAlNbH. Temp.H. TimeS. TimeC. TimeYS (MPa)
0.0090.0010.0190.0500.0019009211324
TS (MPa)EL (%)RA (%)
5402348
Table 3. Comparison of ML and empirical methods for YS and TS prediction across steel systems.
StudySteel SystemMethodAccuracy MetricYS
Prediction
TS
Prediction
Notable Features
Present StudyC-Mn Cast SteelANN (20-44-44-4)Mean Error3.45%4.2%Industrial dataset (500 samples), 90% predictions within 5%
Liu et al. [52]Austenitic StainlessANNR2>0.93>0.93200+ samples, tensile property focus
Xiong et al. [53]C and Low-alloyML EnsembleMAPE4.8%5.2%360 samples, multiple algorithms
Zippo et al. [54]Industrial SteelsSelf-updating MLReal-time Error<6%<6%Industrial scale, real-time prediction
Traditional Empirical [55]General SteelRegressionMAPE8–15%6–12%Conventional approach
Hall-Petch Relations [56]VariousEmpiricalTypical Error10–20%8–15%Grain size based
Disclaimer/Publisher’s Note: The statements, opinions and data contained in all publications are solely those of the individual author(s) and contributor(s) and not of MDPI and/or the editor(s). MDPI and/or the editor(s) disclaim responsibility for any injury to people or property resulting from any ideas, methods, instructions or products referred to in the content.

