Article

Numerical Simulation and Experimental Validation of Residual Stress in Heavy Machine Tool Crossbeam Casting During Demolding

1
State Key Laboratory of Materials Processing and Die & Mould Technology, School of Materials Science and Engineering, Huazhong University of Science and Technology, Wuhan 430074, China
2
School of Mechanical Engineering, Wuhan Vocational College of Software and Engineering (Wuhan Open University), Wuhan 430205, China
3
Wuhan Wuzhong Casting & Forging Co., Ltd., Wuhan Heavy Duty Machine Tool Group Corporation, Wuhan 430205, China
*
Author to whom correspondence should be addressed.
These authors contributed equally to this work.
Metals 2025, 15(7), 687; https://doi.org/10.3390/met15070687
Submission received: 26 April 2025 / Revised: 20 May 2025 / Accepted: 17 June 2025 / Published: 20 June 2025

Abstract

This study investigates a heavy-duty CNC machine tool crossbeam casting manufactured by a leading heavy machine tool producer. A numerical simulation model for the demolding process was developed using proprietary Computer-Aided Engineering (CAE) software. The experimental validation of the residual stress was performed using the blind-hole method on the guide rail mounting surface. The simulation results were compared with experimental data, revealing that the post-demolding simulations exhibited smaller fluctuations than the pre-demolding predictions. The maximum principal stress prediction resulted in an absolute error of 11.8%, effectively reflecting the residual stress distribution for casting design and production optimization.

1. Introduction

Gray cast iron is the primary material used for heavy machine tool crossbeams, widely utilized for its excellent casting performance and vibration damping properties. However, the distribution of internal residual stresses significantly influences the service performance of the casting [1]. Studies indicate that residual stresses can cause the bending deformation of guide rail surfaces, reduce dimensional accuracy, and directly affect the reliability of the casting [2,3,4,5]. However, traditional experimental methods are limited in terms of dynamically capturing stress evolution during casting processes due to the complex coupling of thermomechanical and phase transformation mechanisms. Furthermore, the high costs associated with trial-and-error in large castings render numerical simulation a critical tool for addressing these challenges. Establishing multiphysics coupling models systematically reveals the mechanisms governing residual stress evolution, providing theoretical support for process optimization [6].
Casting process optimization depends on the precise control of the temperature and stress fields within the casting. Numerical simulation techniques, utilizing multiphysics coupling models, systematically analyze the evolution of thermal, phase transformation, and mechanical constraint stresses during casting. Heavy machine tool crossbeams are complex castings with thick guide rail surfaces and thin-walled side structures. During solidification and cooling, these components experience significant residual stress gradients, which can degrade machining precision and dimensional stability, thereby affecting the performance of high-precision CNC machines. Numerical simulations predict residual stress distribution patterns, providing crucial data to mitigate deformation and cracking risks [7].
Casting CAE software has substantially improved the intelligence of process design. The Finite Element Method (FEM) is renowned for its high precision and has become the dominant method for simulating thermal stress in CNC machine tool castings. By coupling temperature and stress fields, the FEM predicts deformation and cracking risks during solidification and cooling, facilitating process optimization during the design phase [8,9,10]. While the finite difference method (FDM) offers computational efficiency advantages, its limited numerical accuracy restricts its application in complex stress field simulations [11,12]. Recent advancements integrating multiphysics coupling models in ABAQUS have incorporated the dynamic evolution of temperature, microstructure, and residual stress, demonstrating high predictive reliability through experimental validation [13]. Moreover, higher-order FEM and mechanical melt temperature models have significantly improved the accuracy of residual stress distribution analysis in gray cast iron castings [14,15]. These technological advancements offer reliable tools for quantitative residual stress research.
In numerical simulations of residual stresses in machine tool crossbeam castings, the interaction between the casting and the mold is a crucial issue. The contact element method enhances traditional approaches by addressing interface constraints between the casting and mold. It improves prediction accuracy for thermal cracks and deformation during heavy casting simulations [9]. However, recent studies predominantly focus on thermomechanical coupling during solidification. The redistribution of residual stresses resulting from mechanical constraint release during demolding remains insufficiently explored. The self-developed casting CAE software realizes the following:
  • Multiphysical field coupling process simulation based on the FDM, FEM, and local stiffness coefficient method to handle the interface constraints between the mold and the casting.
  • The introduction of an equivalent spring boundary to simulate the release of demolding stress.
  • The measured data by the blind-hole method are used for verification, and the process parameters are optimized based on the proposed simulation model.

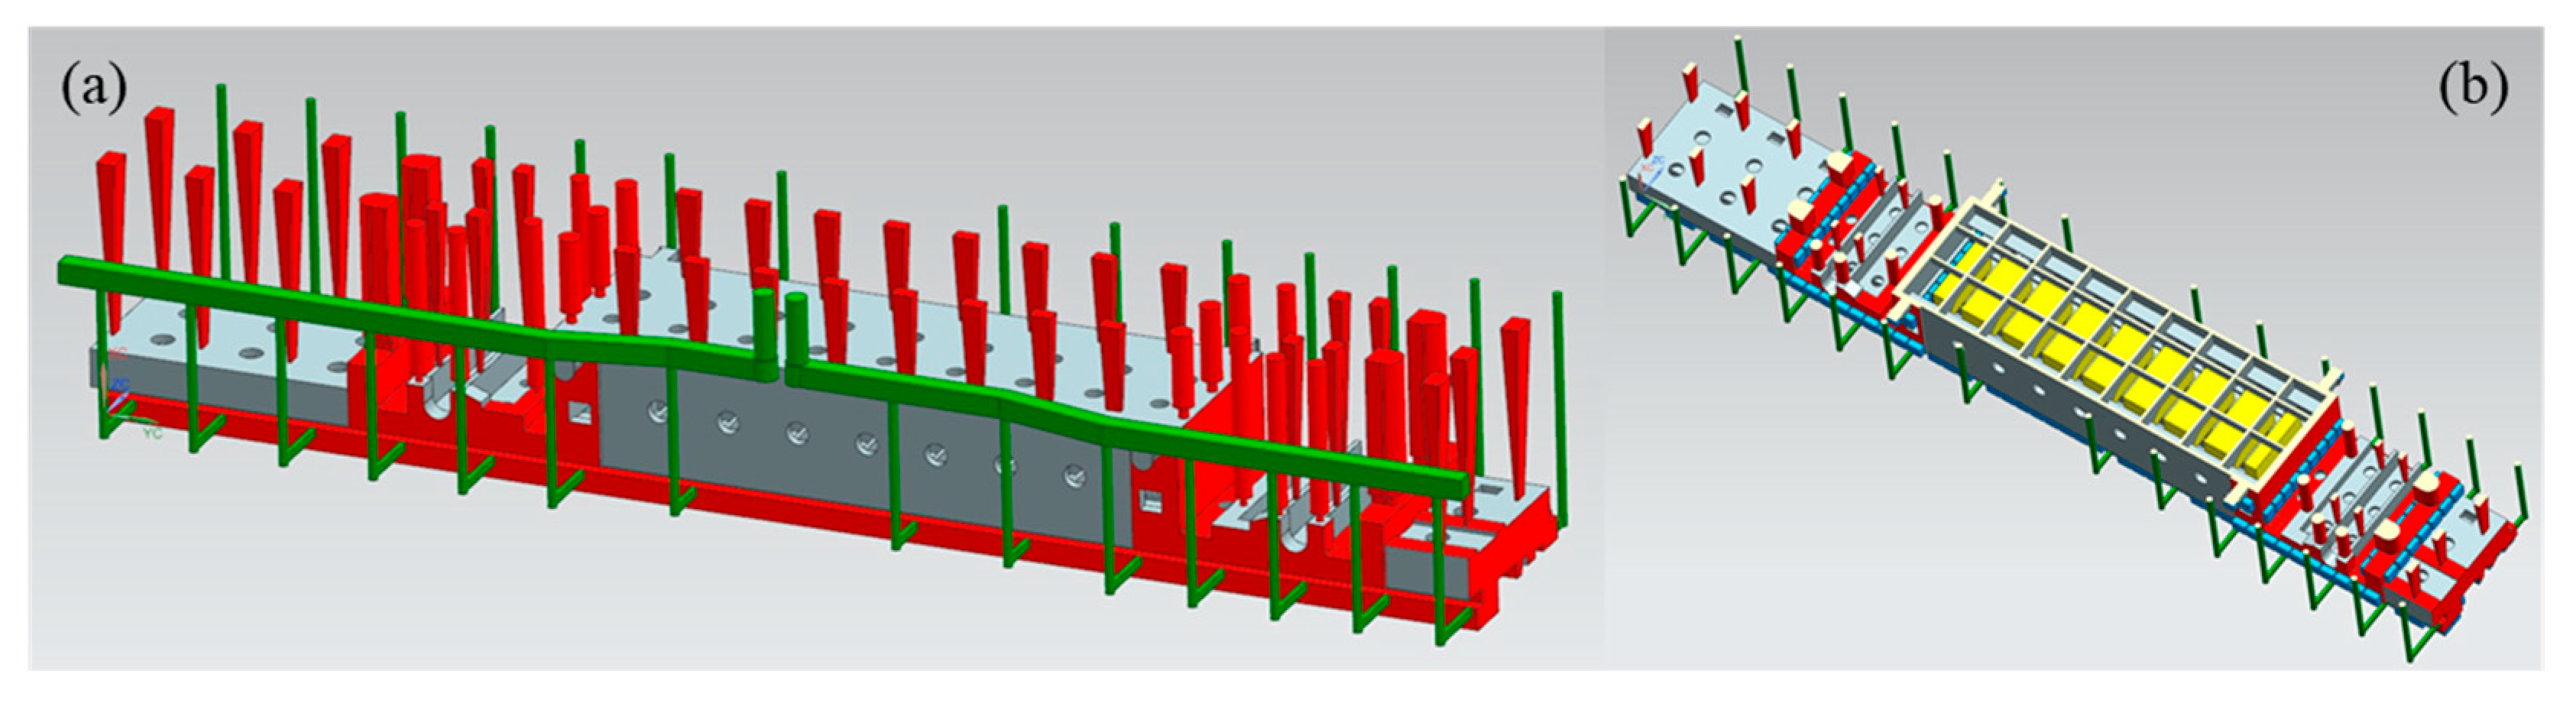
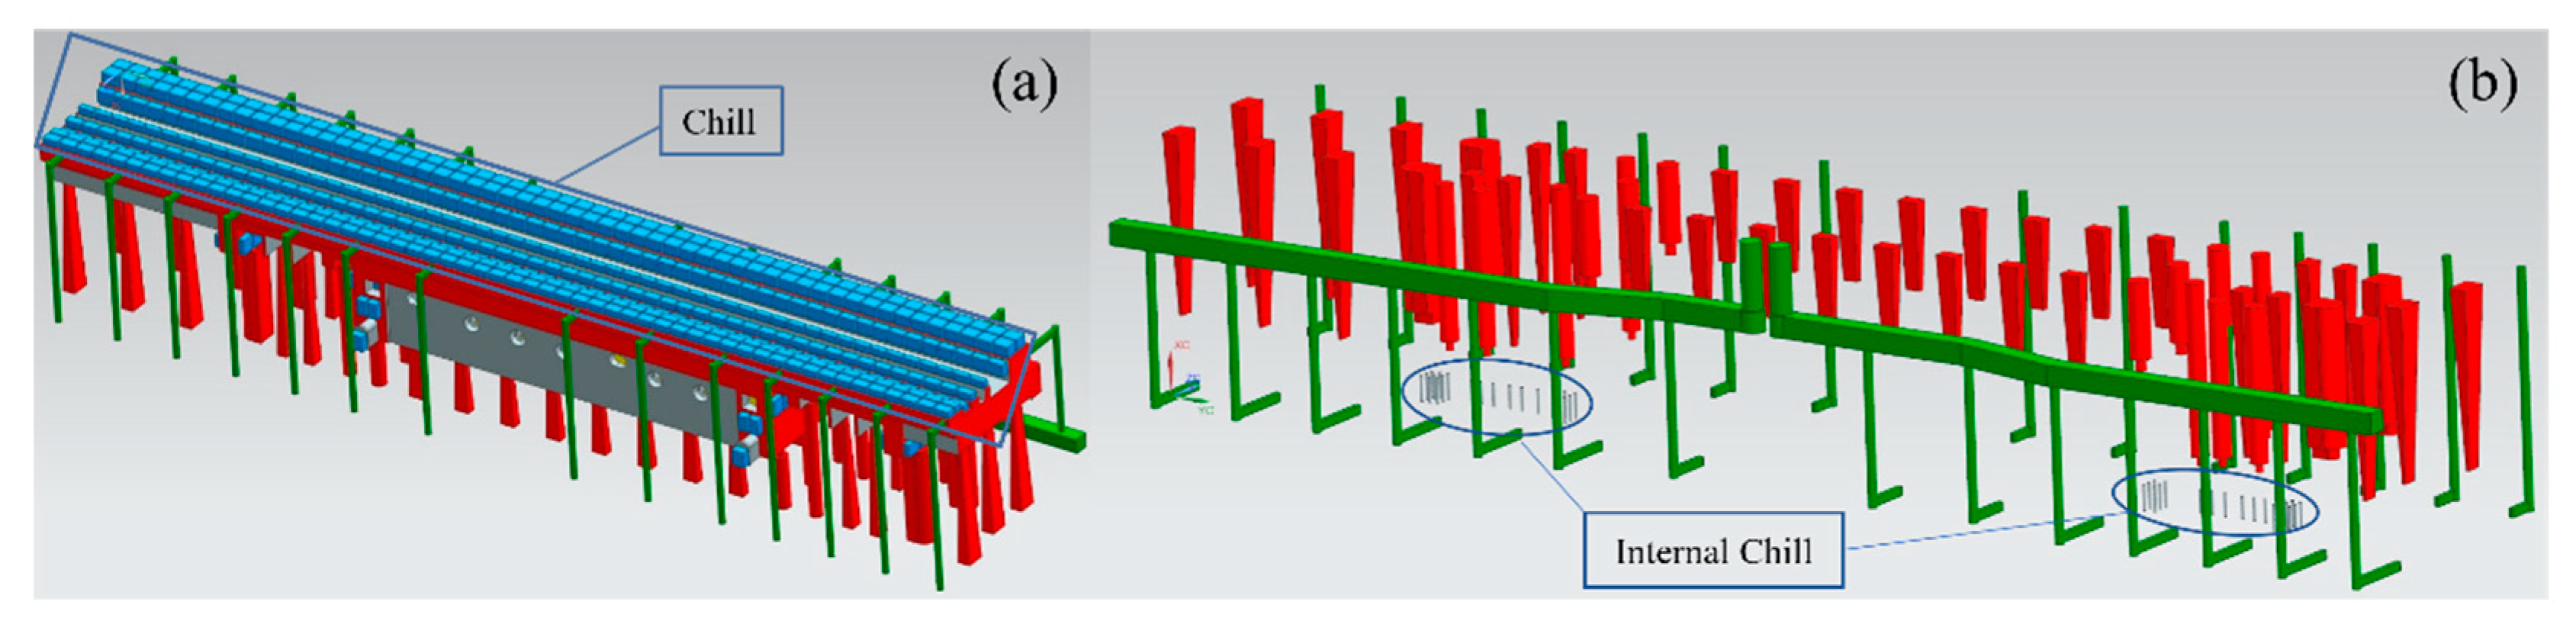
2. Casting Process Design

The crossbeam casting measures 9345 mm × 1390 mm × 1160 mm and has a mass of 23,123 kg, fabricated from HT 250 gray cast iron. The minimum wall thickness is 35 mm, and the rib thicknesses are designed to be 25 mm and 30 mm. Given the large dimensions of the casting, a pit-type sand casting process was employed. As shown in Figure 1a, a bottom-fed gating system ensures that molten metal flows upward into the mold cavity. The down sprue diameter was set to Ø140 mm to facilitate stable metal flow. As shown in Figure 1b, the hollow interior of the crossbeam was designed with split sand cores to improve dimensional accuracy and consistency. The CAD drawing can be found in Figure S1.
To ensure the flatness of the guide rail mounting surfaces, external chills were strategically placed to cover the entire surface (Figure 2a). Each chill has a thickness of 70 mm, with 20 mm spacing between adjacent chills. This design accelerates local cooling and minimizes warping [16,17]. Internal chills (Φ16 mm × 166 mm) were embedded in the thick sections of the casting (Figure 2b). These chills mitigate shrinkage porosity, refine grain structure, and reduce casting stresses, which is particularly beneficial for large castings [18]. Both external and internal chills were fabricated from HT 250 material to match the composition of the casting.

3. Residual Stress Simulation and Testing Methods

3.1. Preprocessing

The fluid–thermal coupling calculations utilized the FDM, with 10,925,750 hexahedral grid cells for the sand mold, chills, and casting. The FEM algorithm was employed to mesh the STL assembly model. This algorithm automatically repaired or ignored most geometric errors in the imported STL models, resulting in 247,933 nodes and 974,874 tetrahedral elements. Mesh independence verification is shown in Figures S2 and S3.
Material properties were selected based on performance indices and economic considerations: pearlitic gray cast iron HT 250, with a density of 7300 kg/m3, an experimentally measured elastic modulus of 100 GPa [19], and a pouring velocity of 2 m/s. The initial pouring temperature was set to 1360 °C, while the sand mold made of furan resin sand and the chills were initialized at 20 °C. Heat transfer coefficients are provided in Table 1, and the filling time was set to 120 s. The in-house CAE software, developed using C++ and accelerated with MPI parallel computing, completed a single simulation in approximately 10 h on an Intel 13900K CPU.

3.2. Numerical Simulation Theory

3.2.1. Fluid–Thermal Coupling Model

The fluid–thermal coupling model was discretized using the finite difference method. The incompressible flow condition is expressed as Equation (1):
    ρ   u   =   0
where ρ is density, and u is velocity. The Navier–Stokes equations govern fluid dynamics, as shown in Equation (2):
ρ   u t   +   u   u     =   p   +   τ   +   ρ g   +   f suc
The Darcy resistance term (fsuc) in the mushy zone is modeled as Equation (3):
f suc = 1 f l 2 f l 3 + 0.001 A mush u
where fl is the liquid fraction, Amush is the mushy zone parameter, and u is liquid velocity. Thermal conduction follows Equation (4):
T t + u T = λ ρ c T + S T
Here, T is temperature, λ is the local thermal conductivity, c is specific heat capacity, and ST represents heat sources. Phase change latent heat was handled using the equivalent specific heat method and temperature recovery method [20,21].

3.2.2. Mechanics Constitutive Model

The FEM is primarily applicable to continuum mechanics simulations, necessitating the omission of casting defects such as shrinkage porosity, shrinkage cavities, entrapped gas, and inclusions during actual production. The casting is treated as a continuous and homogeneous body, allowing temperature, displacement, strain, and stress fields to be represented as continuous functions of spatial coordinates. Although material properties such as segregation, microstructure, and grain size may vary, thermal elastic–plastic analysis assumes uniform properties across all points. This assumption implies that material properties are independent of spatial coordinates, enabling properties to be extracted from any infinitesimal element for study [22].
A thermal elastic–plastic stress–strain constitutive model in incremental form is used to calculate the residual stress of heavy machine tool beam castings, and the FEM is used for discretization. The total strain ε is composed of elastic strain εe, plastic strain εp, and thermal strain εth, as shown in Equation (5):
ε = ε e + ε p + ε t h
Among these types of strain, thermal strain is caused by the temperature change ΔT, and the specific calculation method is shown in Equation (6):
ε t h = α T I
where α is the thermal expansion coefficient, and I is the second-order unit tensor. The thermal elastic–plastic constitutive model based on the incremental theory is shown in Equation (7):
d σ = D e p d ε
where Dep is the fourth-order tensor of the elastoplastic constitutive model. The Mises yield criterion is used to judge whether the material yields, which is characterized by θ. Considering the low calculation efficiency of solving nonlinear equations and the large volume of heavy machine tool beam castings studied in this study, with a large number of grid units, a bilinear isotropic hardening model is used to simplify the stress constitutive model, reducing calculation time costs, as shown in Equation (8):
D e p = θ D e + ( 1 θ ) D p
In this study, the local stiffness coefficient calculation method of the mold proposed by A. Chang et al. [23] is used to set the boundary conditions of the stress field. Unit displacement is applied in the normal direction of the mold surface, the mold is regarded as a linear elastic body, and the stress distribution on the mold surface is obtained through static analysis. At this time, the average value of the normal force on the mold surface is equal to the local stiffness coefficient of the mold.

3.2.3. Calculation Method for Demolding Process

When the casting cools to approximately 200 °C, the demolding process is required. During this process, the mechanical constraint effect of the mold on the casting is completely eliminated. The change in strain energy within the casting causes deformation, affecting the accuracy of stress and strain numerical simulation calculations. Therefore, it is necessary to perform a numerical simulation of the release of mechanical constraint stress during demolding to obtain the stress, strain, and deformation states after the removal of mechanical constraints.
This study establishes an approximate calculation method for the stress and deformation of the casting during the demolding process, based on simplified boundary conditions. It should be noted that, in addition to the deformation and stress release caused by the removal of the sand mold during the casting demolding process, manual operations during demolding, including unstable human factors such as vibration and knocking, are difficult to describe stably with scientific principles and are therefore not considered here.
In the solidification process, it is assumed that changes in thermal stress caused by each temperature variation form a quasi-steady-state process. During each cooling process, mechanical wave propagation achieves force equilibrium.
We solve for the displacement ΔUi. Then ΔUi is substituted into the kinematic equation for the solution to obtain the strain Δεi. Finally Equation (7) is used to calculate stress Δσi in each step. By accumulation, we obtain the displacement Ui, strain εi, and stress σi. The matrix form of the FEM solution equation is shown in Equation (9):
i K i + M i U i = i L i T i
where Ki represents the stiffness matrix related to the structure in step i, discretized by Dep in Equation (7); Mi is the stiffness matrix obtained by the FEM discretization of the spring boundary conditions in step i; ΔUi is the displacement increment in Step i; Li is a matrix related to the thermo-force coupling effect in step i, which is discretized by the FEM in Equation (6); and ΔTi is the temperature change in the i-th step.
During demolding, the strain energy accumulated in the original spring boundary is released, causing deformation. In other words, we calculate an equivalent displacement to replace the spring boundary term. Let the displacement caused by demolding be ΔU′; then we have the following:
K + M U = i M U i
Here, K′ and M′ are the structural stiffness matrix and spring boundary matrix during the demolding process, respectively. A very small stiffness coefficient βair is filled into the matrix rows and columns corresponding to the degrees of freedom in M′. This is used to characterize the weak constraint of air on the casting and help with the convergence of the solution at the same time.

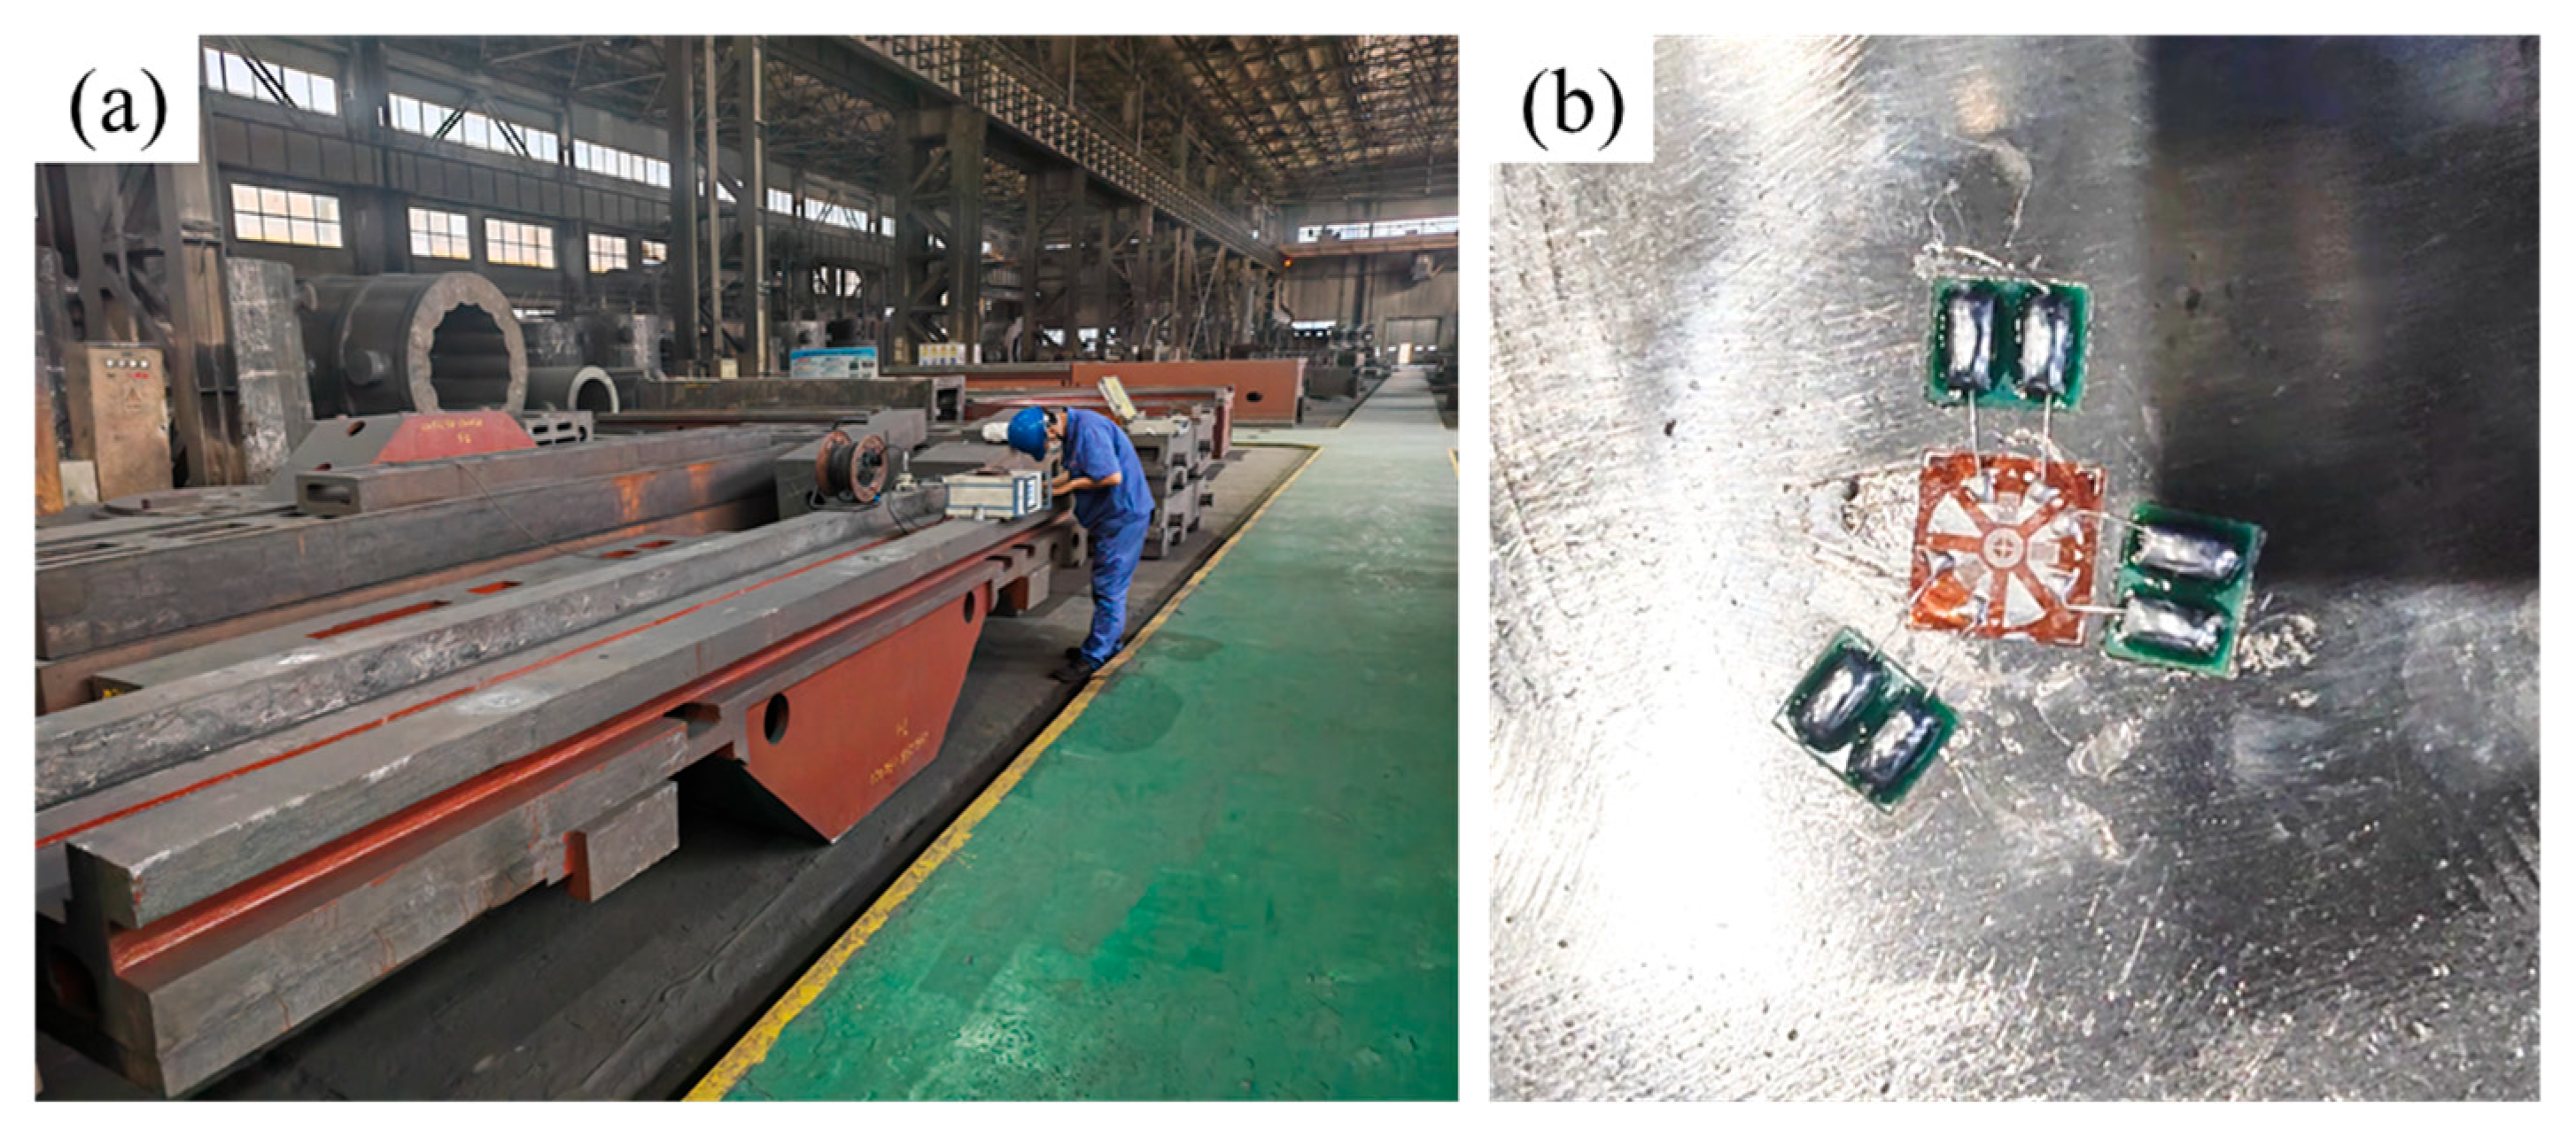
3.3. Experimental Test Methods

3.3.1. Blind-Hole Method for Residual Stress Measurement

The blind-hole method is used to measure the residual stress of the casting. A strain rosette is attached to the surface of the tested material, and a hole with a diameter of 1.5 mm and a depth of 2 mm is drilled at the center of the strain rosette. The residual stress is calculated based on the released strain measured after drilling.
The measurement equipment includes a ZDL-II residual stress drilling device, a YC-IV stress meter, and a special strain rosette for residual stress from the China Academy of Machinery Science and Technology. Figure 3 illustrates the residual stress measurement of the beam casting. The calculation formulas for residual stress using the blind-hole method are presented in Equations (11)–(14) [24]:
σ 1,2 = E ( ε 1 + ε 3 ) 4 A ± E 4 B ( ε 3 + ε 1 ) 2 + ( 2 ε 2 + ε 1 ε 3 ) 2
tan 2 θ = 2 ε 2 ε 1 ε 3 ε 3 ε 1
σ x = σ 1 + σ 2 2 + σ 1 σ 2 2 cos 2 θ
σ y = σ 1 + σ 2 2 σ 1 σ 2 2 cos 2 θ
ε1, ε2, and ε3 are the released strains measured by the three units of the residual stress strain; σ1, σ2, σx, and σy are the maximum and minimum principal stresses of the residual stress and the stresses in the ε1 and ε3 directions (i.e., the x and y directions); A and B are constants, where A = −0.07255, and B = −0.1514; and E is the elastic modulus, where E = 100 GPa [19].

3.3.2. Infrared Measurement of Unboxing Temperature

An industrial infrared thermometer is employed to measure the unboxing temperature of the casting. The measurement positions are depicted in Figure 4, and the measured temperature values are shown in Table 2. The cross-sectional views of the 7 positions in Figure 4 are shown in Figures S4–S10.
Whether on the wide or narrow guide rail surface, the highest temperature occurs slightly to the left of the center of the bed, measured at 150 °C and 160 °C, respectively. The temperature measured during unboxing generally shows a trend where the temperature at the thick and large section in the center of the bed is higher, while the temperature at both ends is lower. Compared to the narrow guide rail side, the temperature on the wide guide rail side is higher, primarily because the cross-section of the wide guide rail is larger, heat accumulation is more significant, and the gating system is designed to incline the gate to this side, which is the last part to solidify.
A temperature distribution cloud diagram of the heavy machine tool beam casting at the end of filling is presented in Figure 5. It can be observed that the wide guide rail surface side is generally orange, indicating a higher temperature compared to the yellow-green color on the narrow guide rail surface.

4. Residual Stress Simulation Analysis and Verification

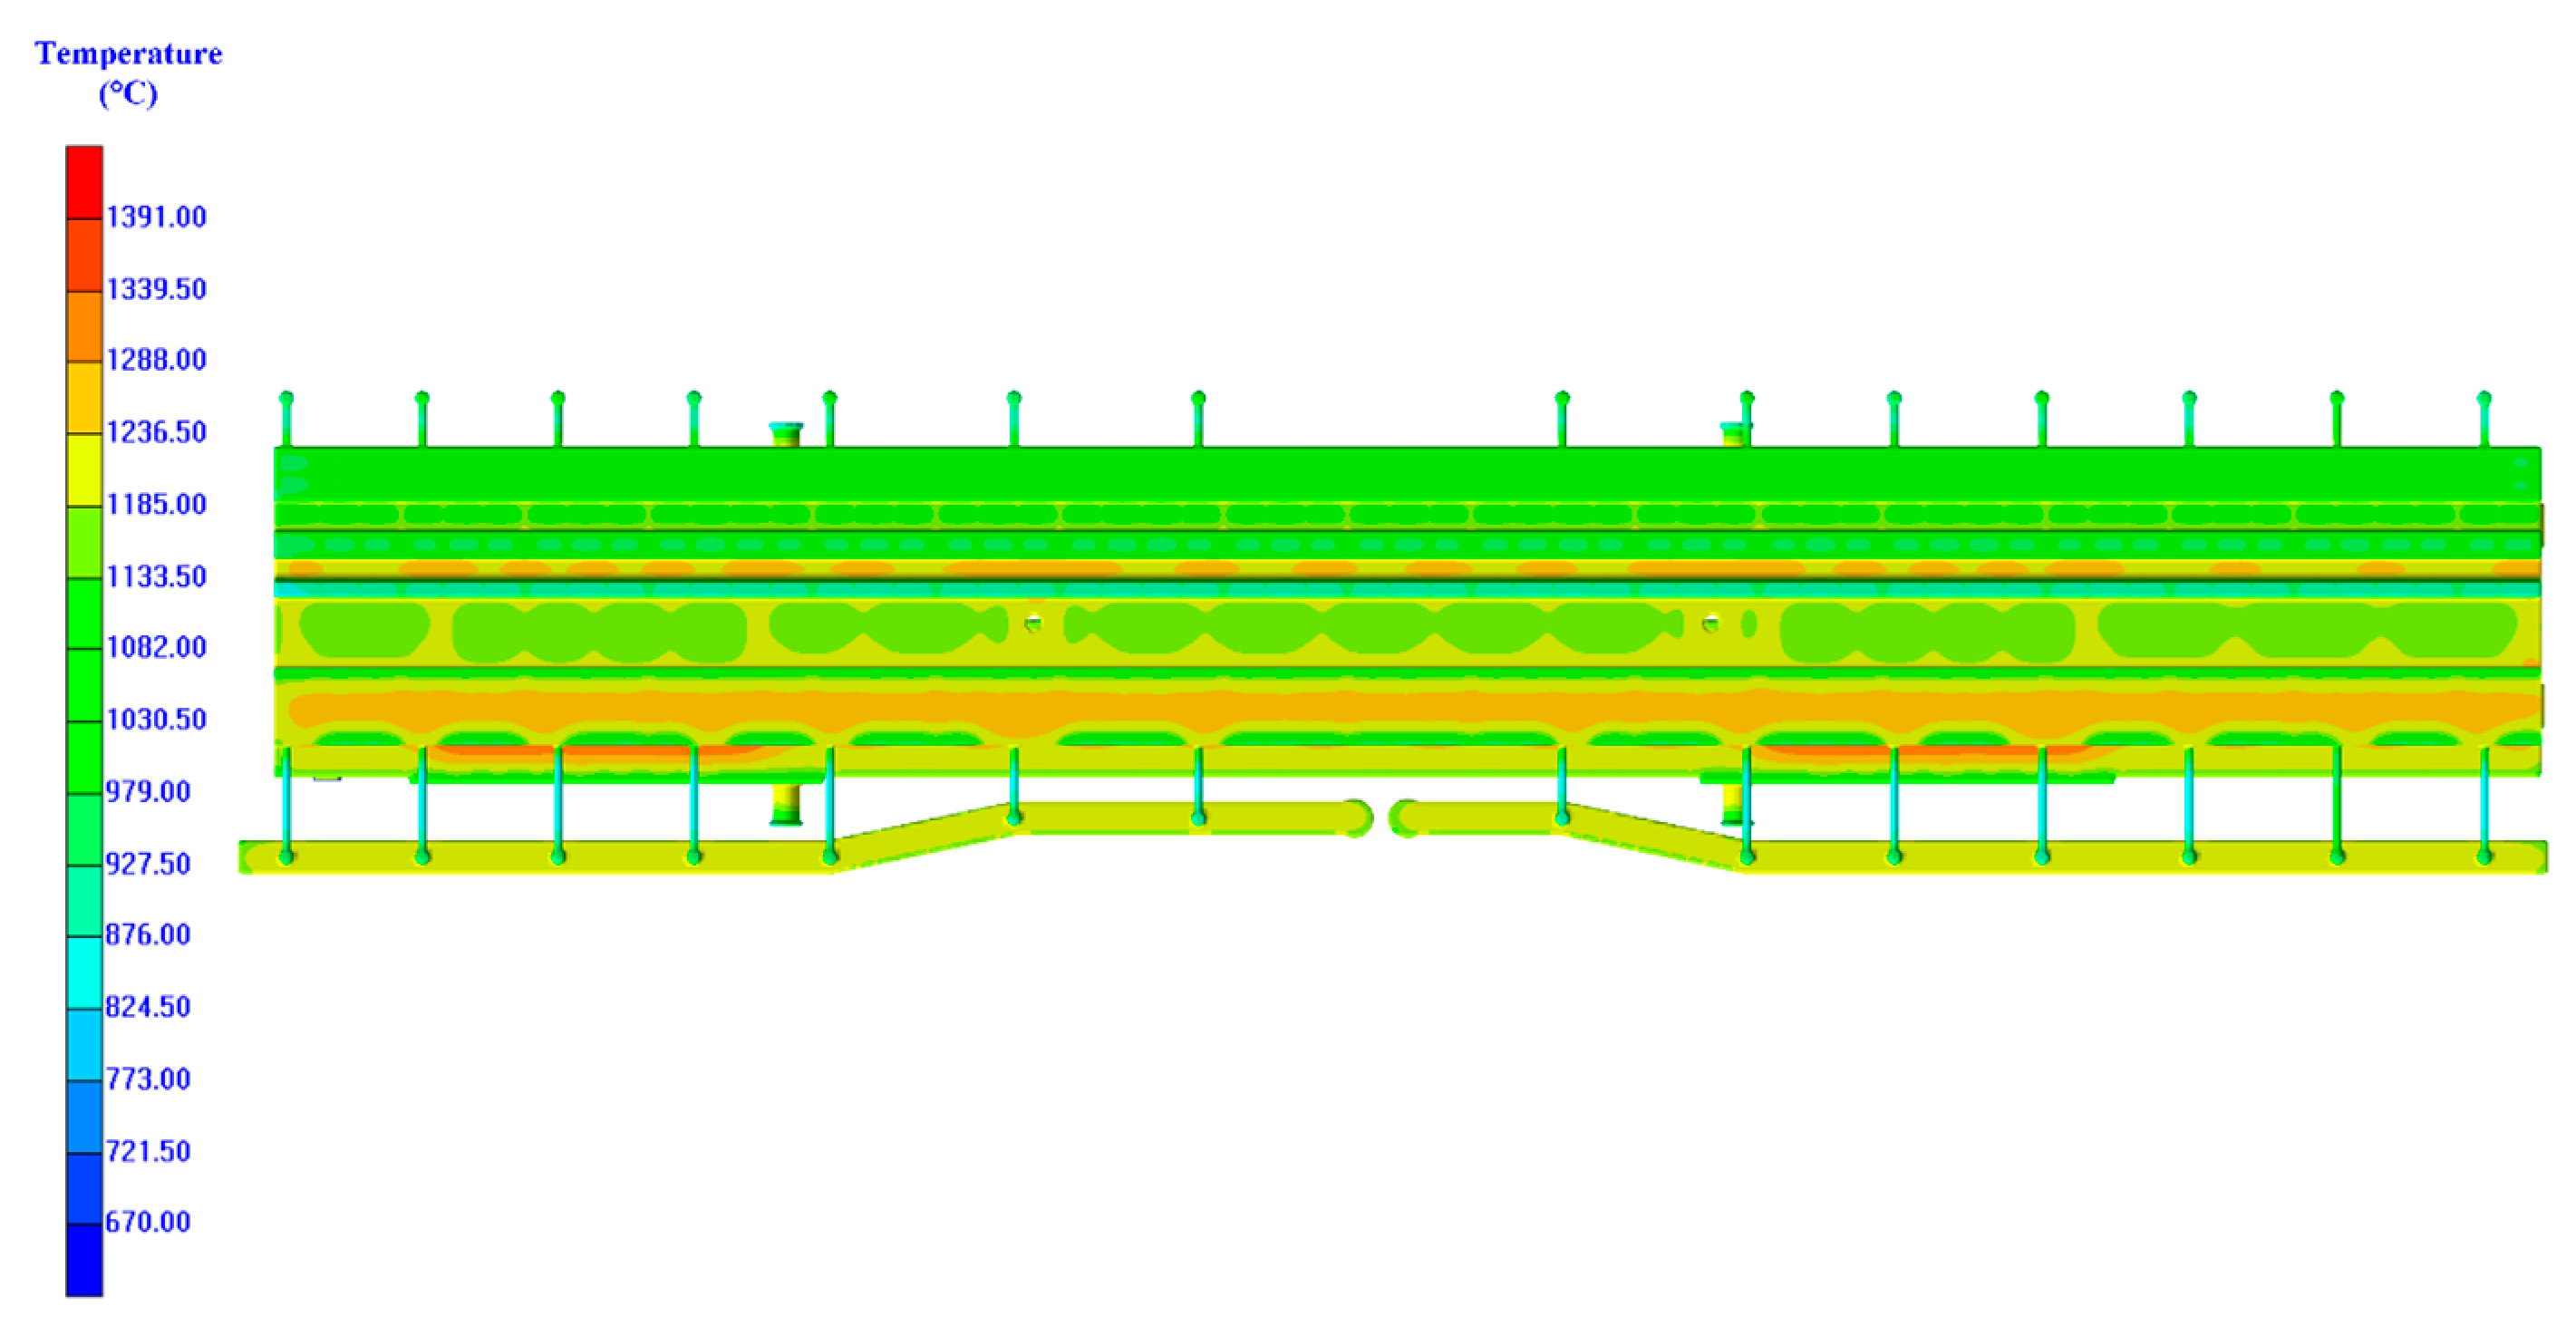
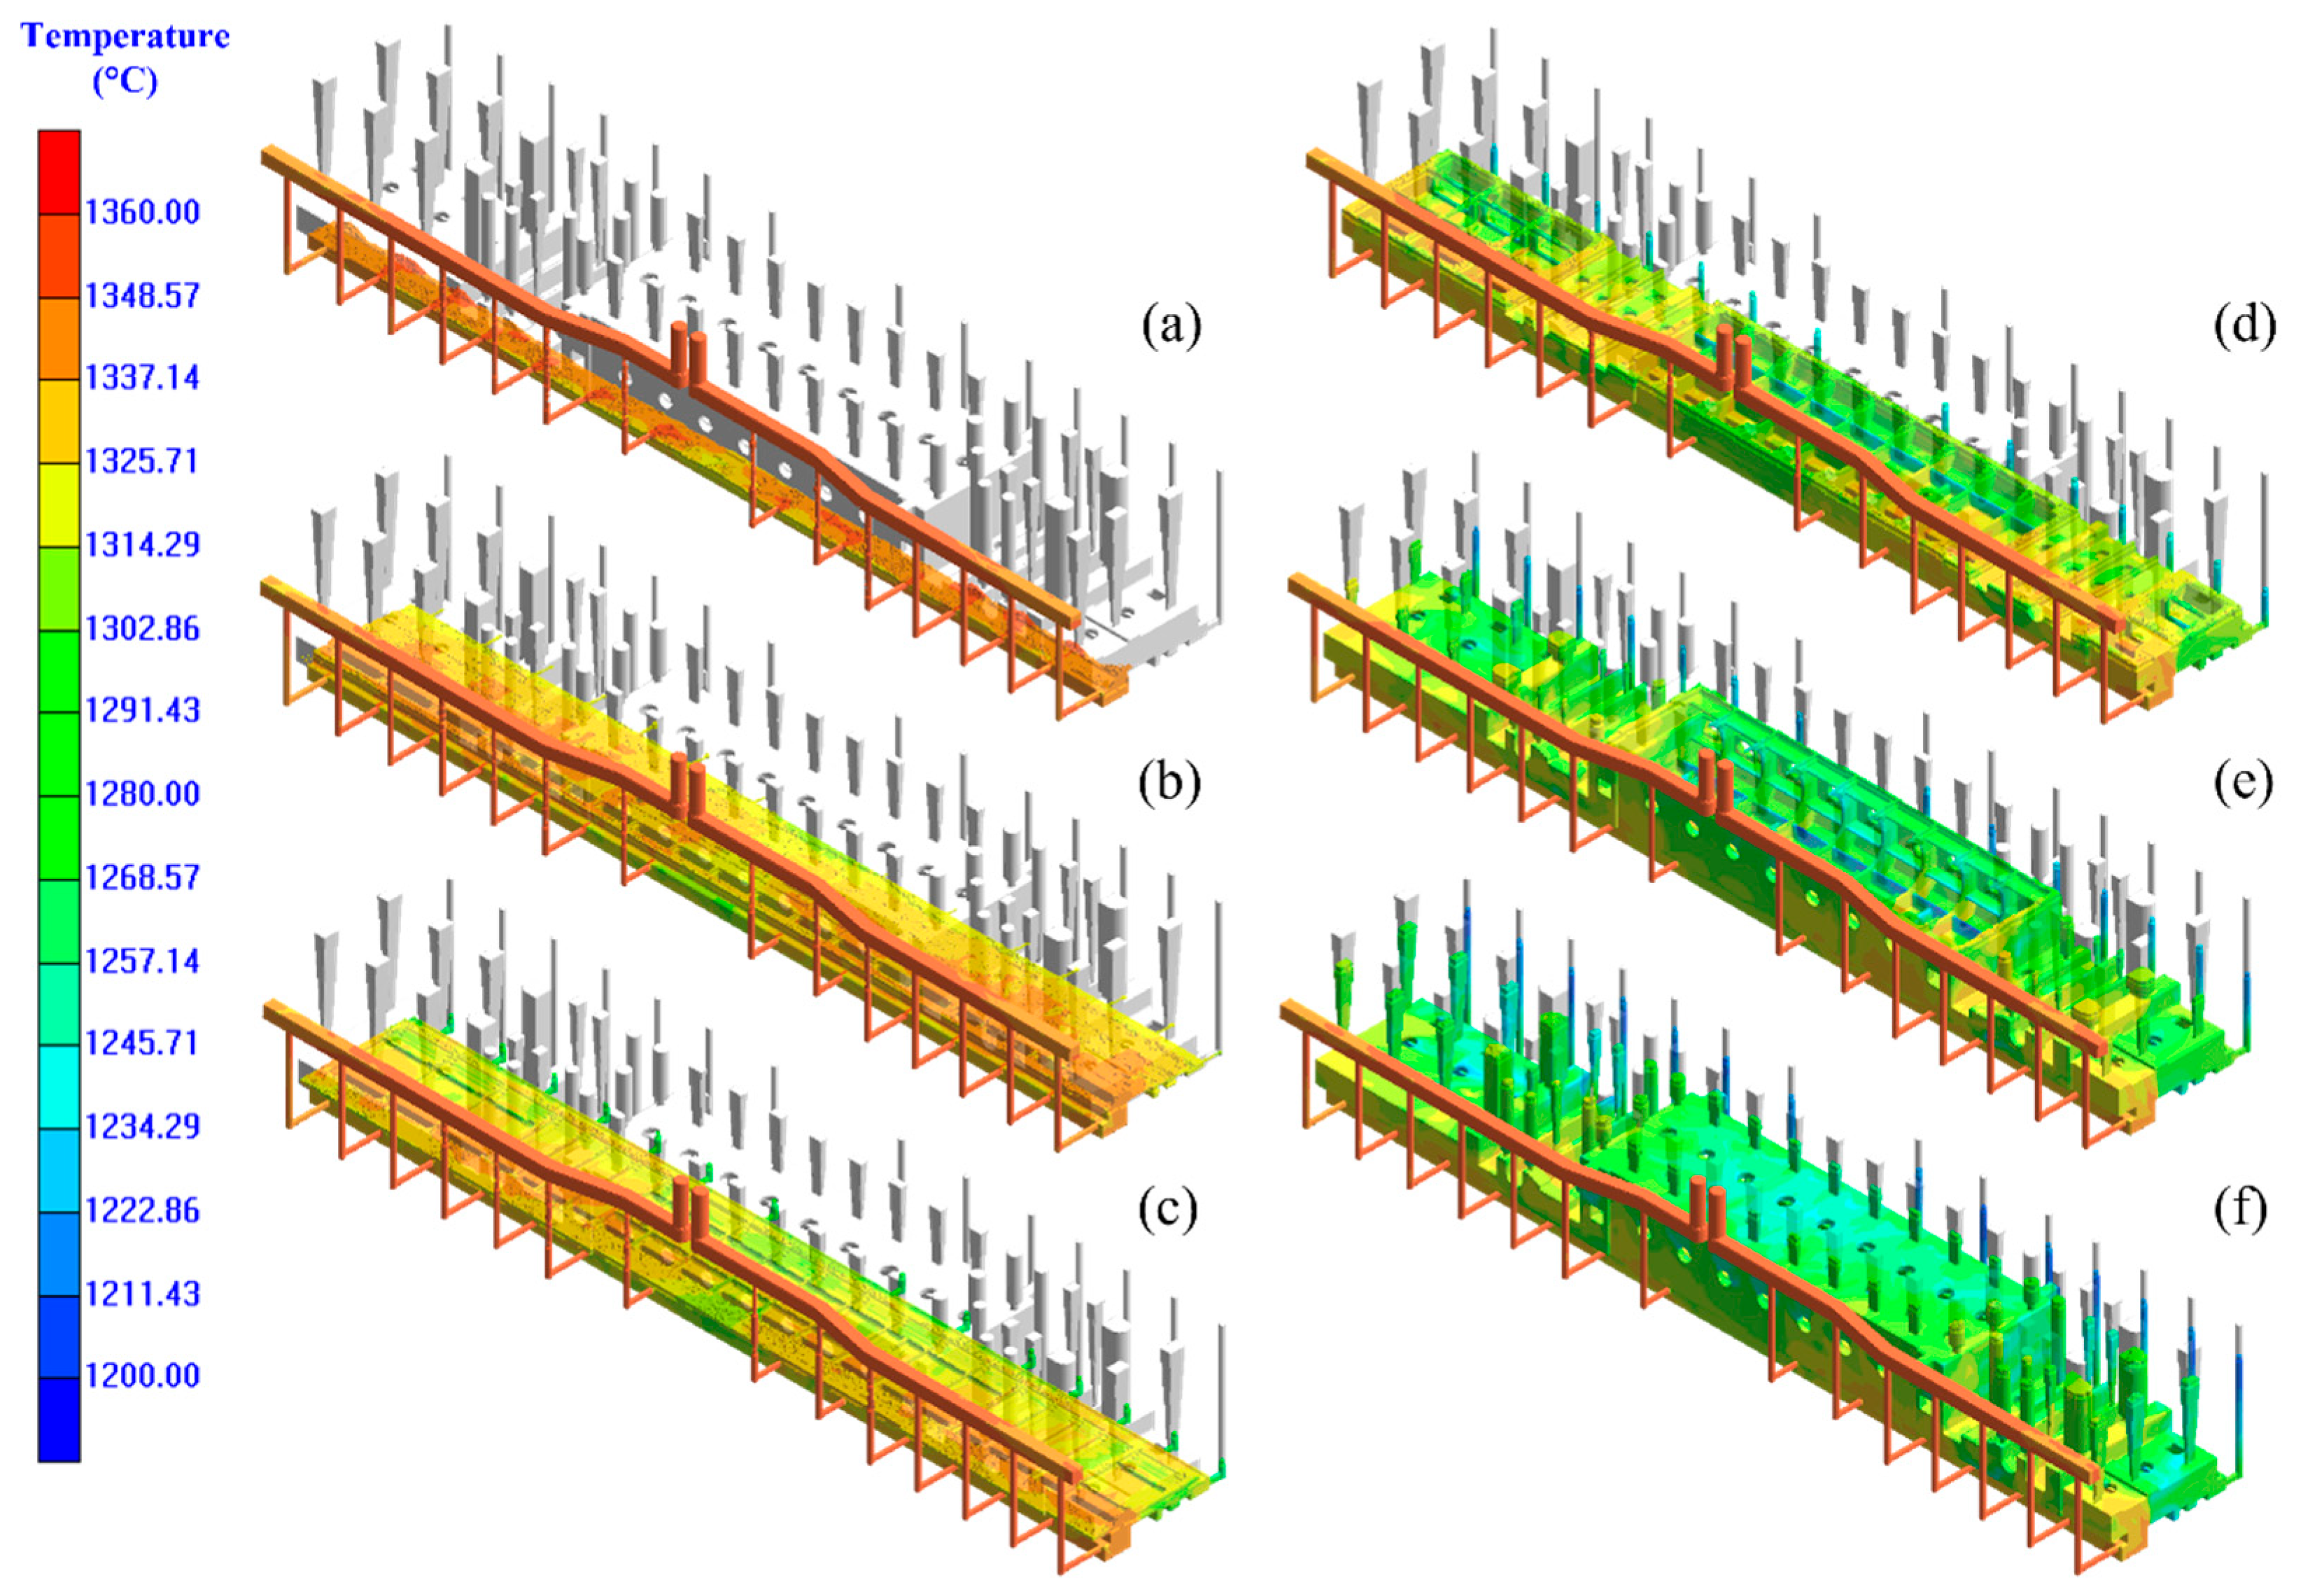
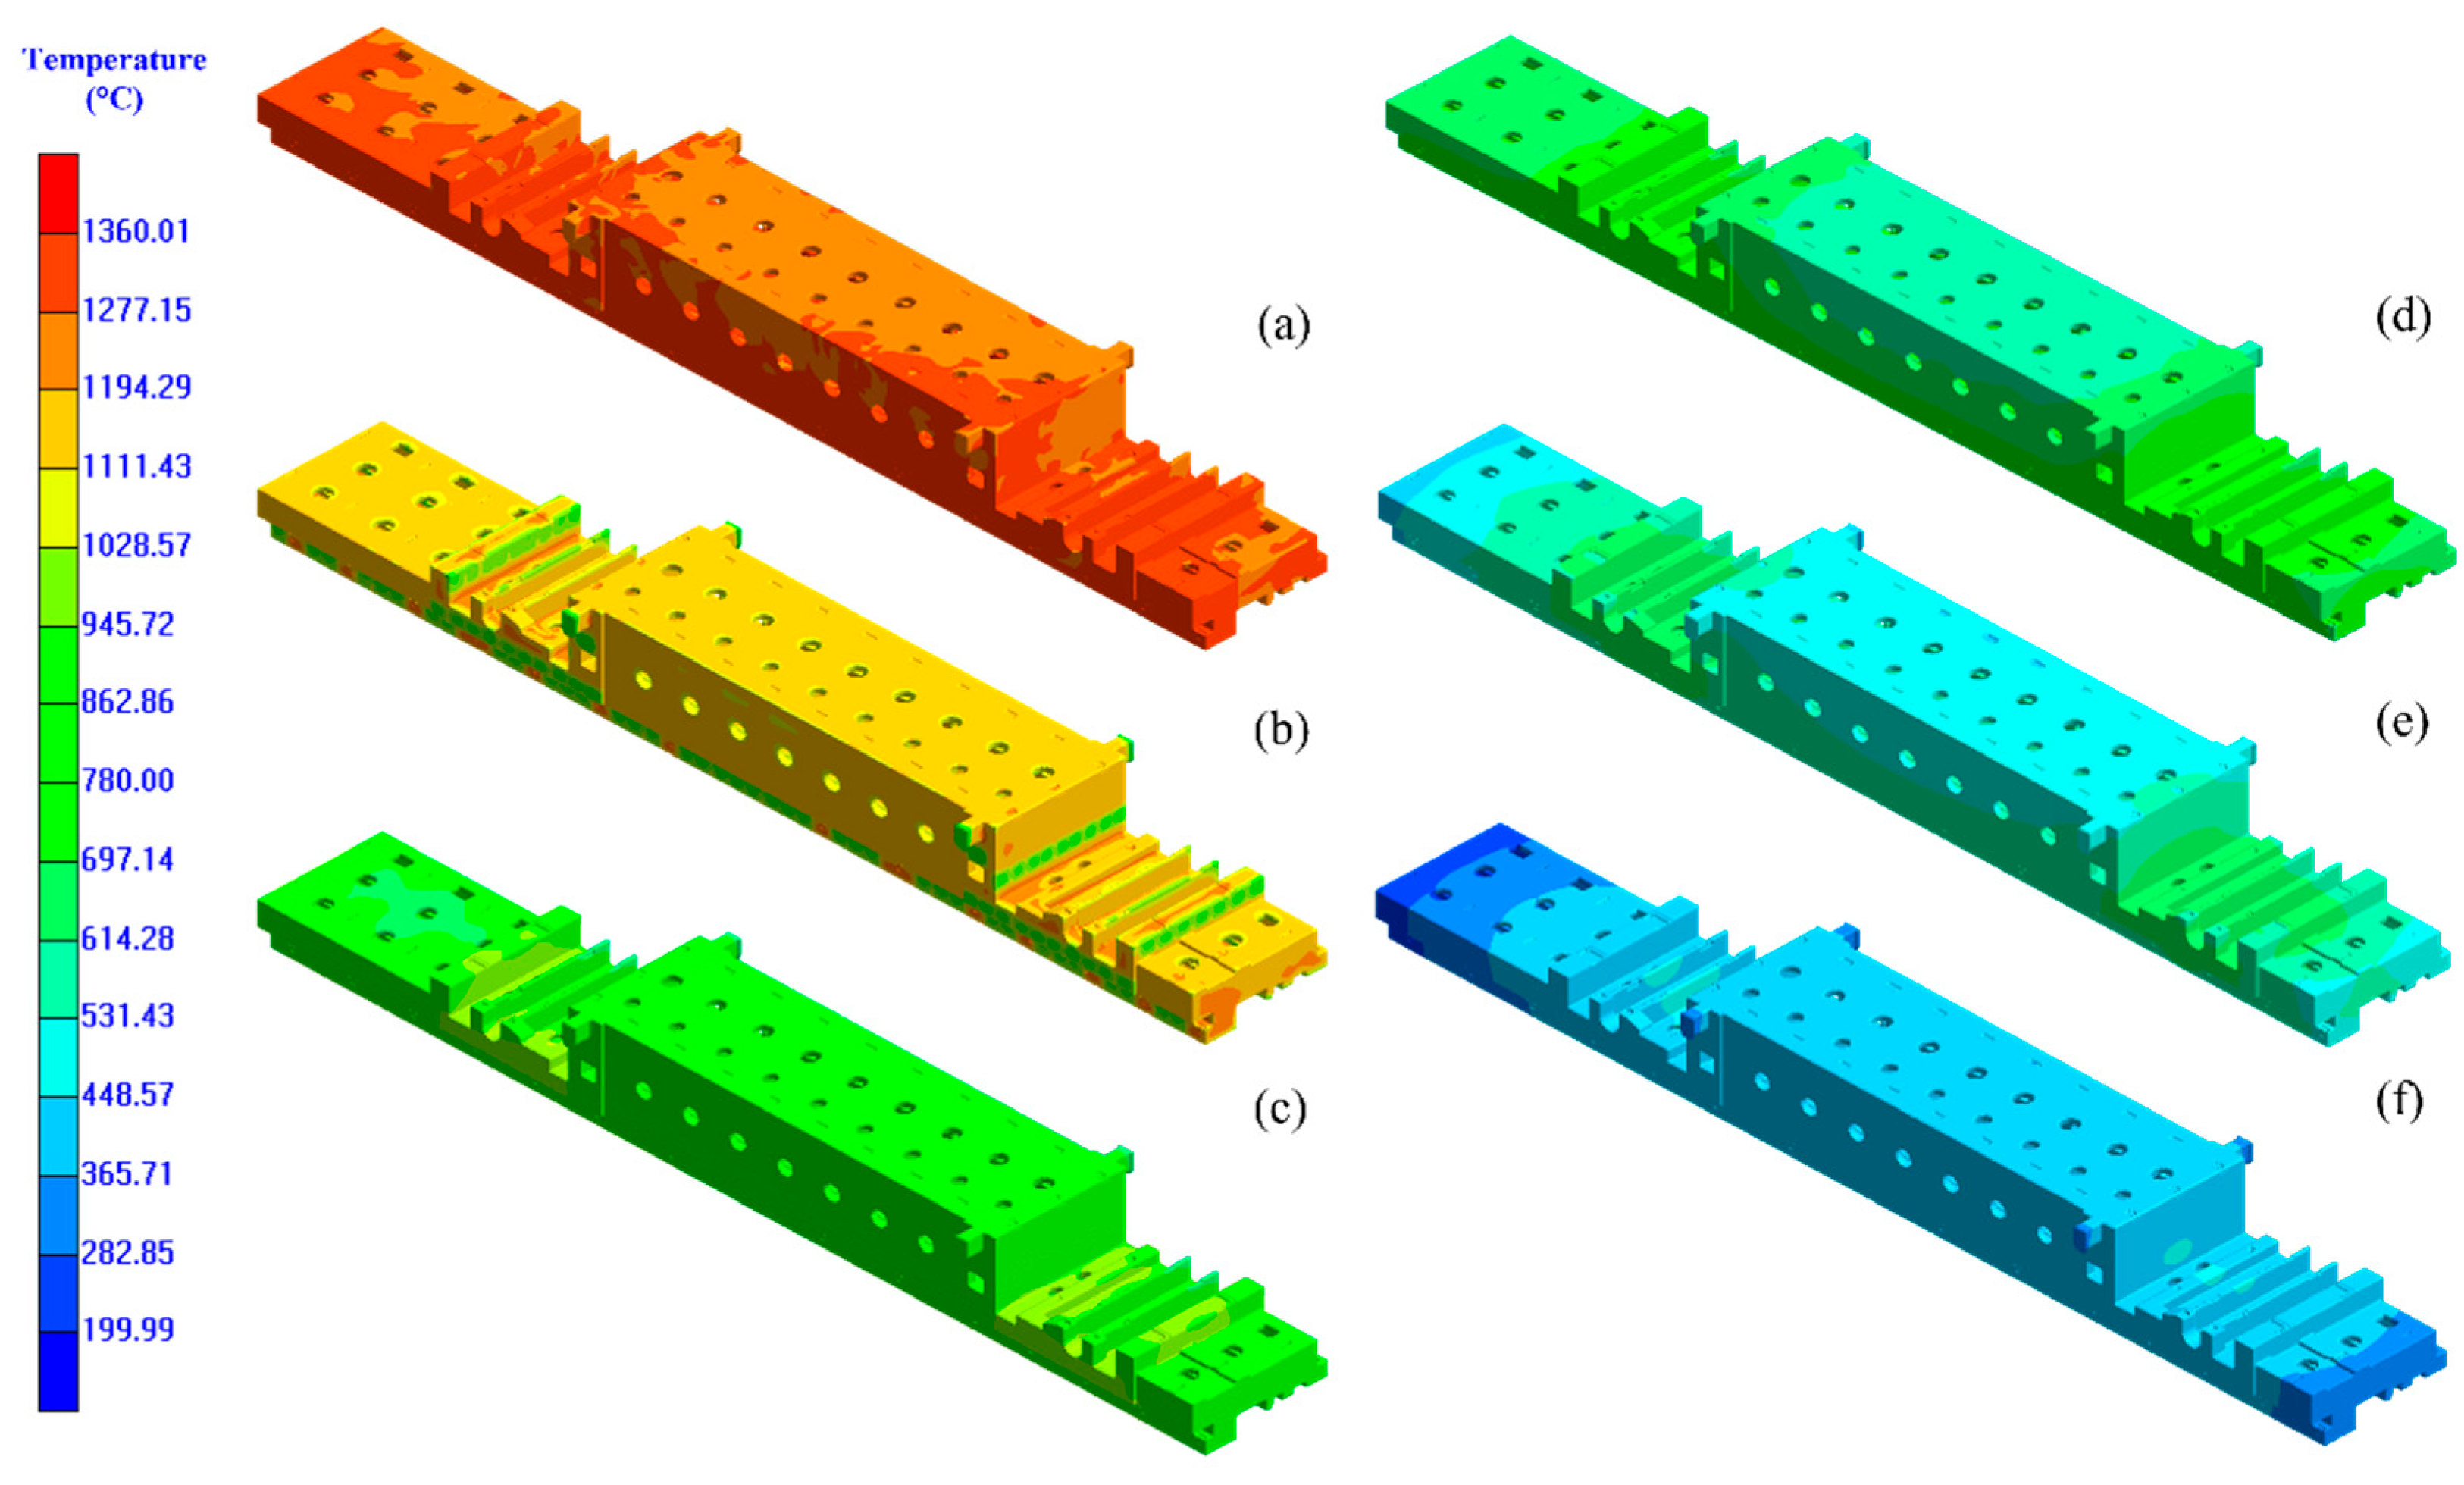
4.1. Filling and Solidification Process Simulation Analysis

Figure 6 presents the temperature field distribution contour of the filling process. The bottom-gated system results in a relatively uniform temperature distribution throughout the casting during the filling process. Horizontally, the temperature is the highest at the midsection and decreases toward both sides. As the filling nears completion, pronounced cooling occurs at the edges, where the temperature falls below the pouring temperature. Upon the completion of filling, certain regions have already solidified.
Figure 7 presents the temperature field distribution contour of the solidification process. The temperature distribution varies significantly across different regions, particularly in the thick-walled areas where the cooling rate is considerably slower and heat accumulation is more pronounced. Conversely, regions such as the ribs and ends, in full contact with the sand mold, experience a faster rate of heat dissipation.
Studies have shown that significant residual stress is generated during pouring due to the temperature gradient within the mold and the mold’s mechanical resistance [25]. Overall, the simulation of solidification and cooling during the pouring of the heavy machine tool beam casting aligns with real-world production processes. Regions with thinner walls and higher surface areas solidify and cool more rapidly, whereas the thicker central areas experience slower rates. The theoretical simulation analysis closely aligns with the actual casting process.

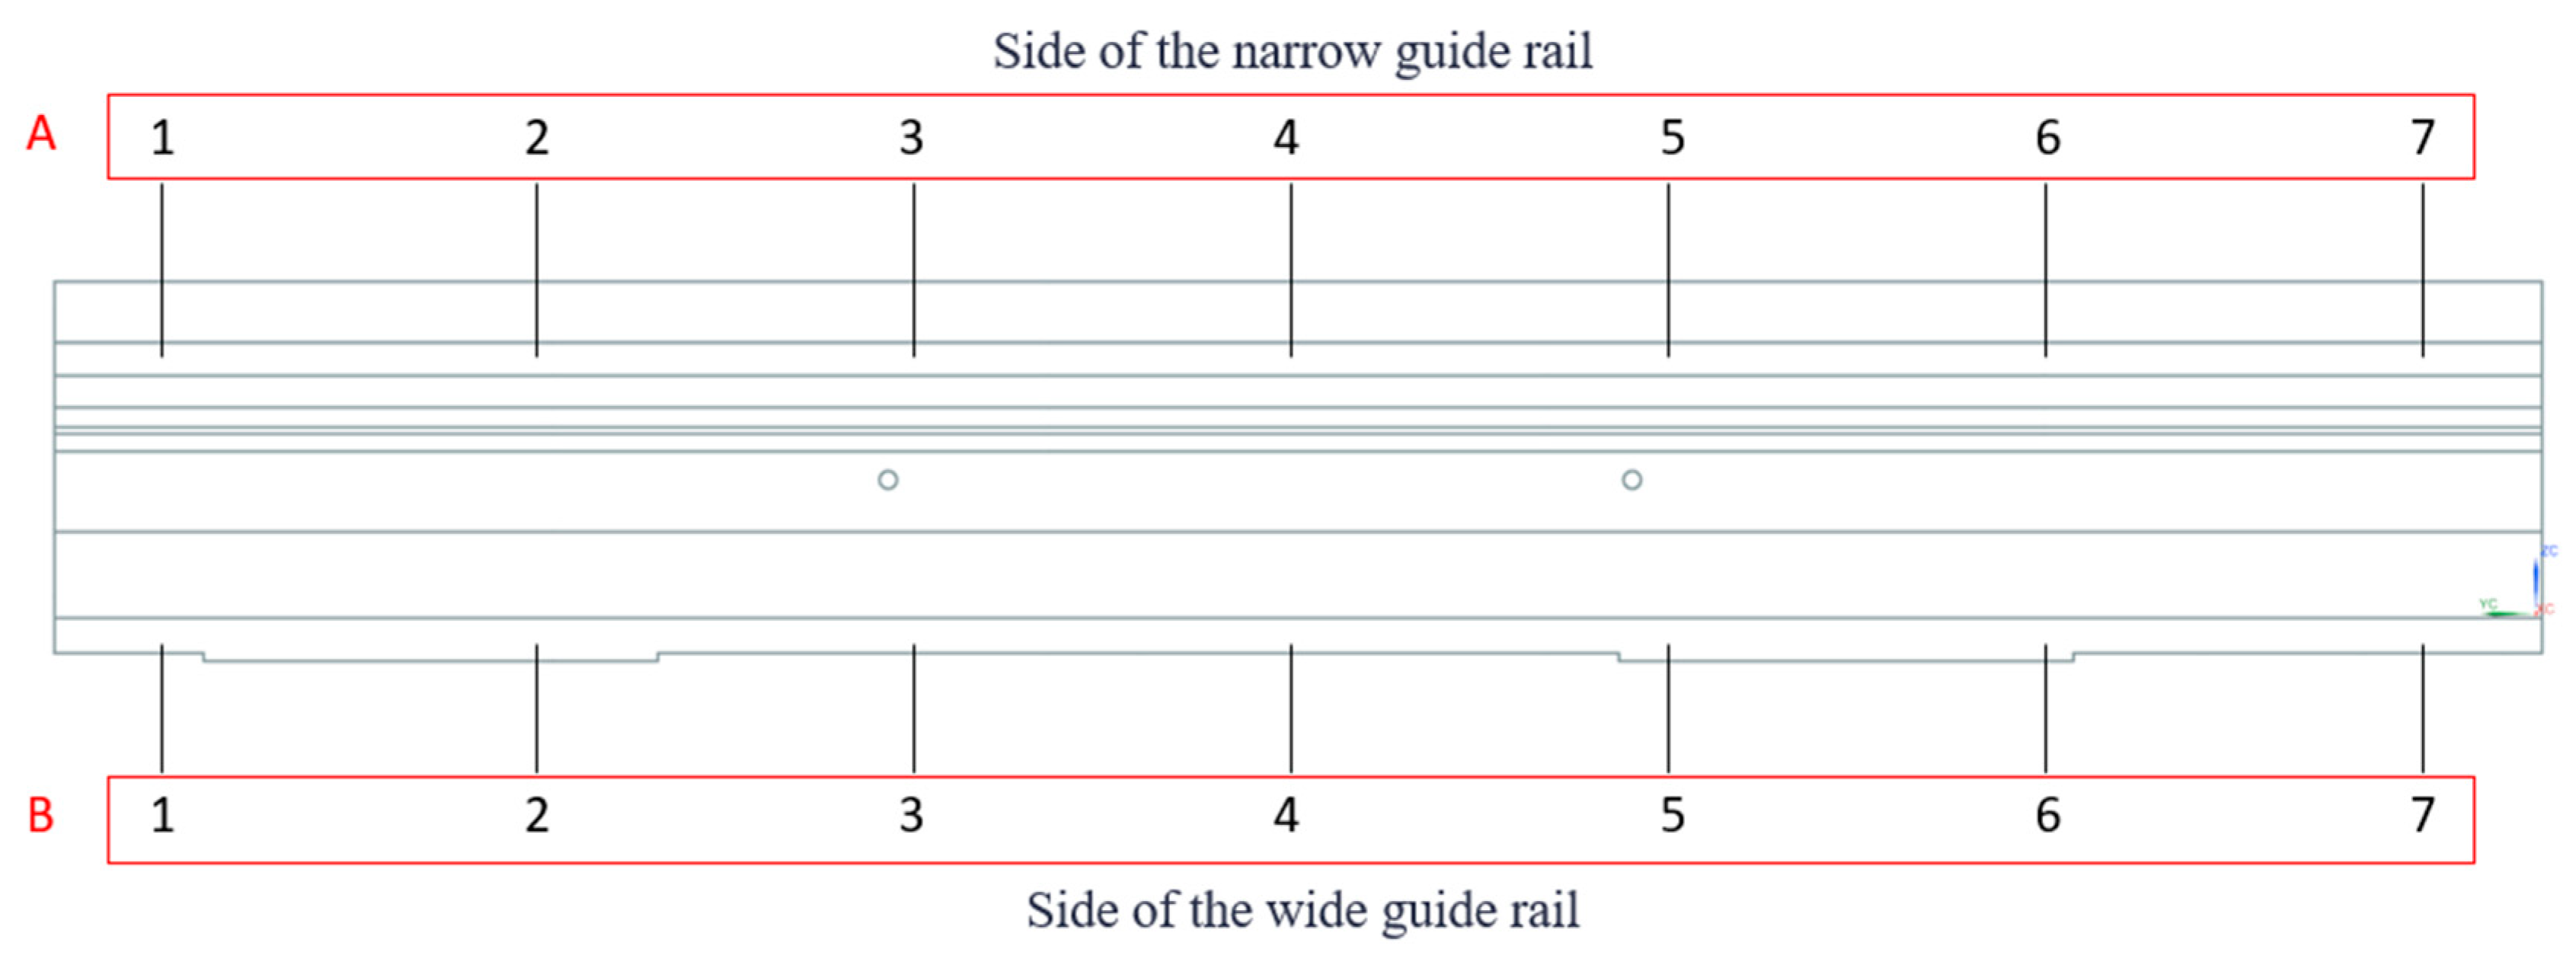
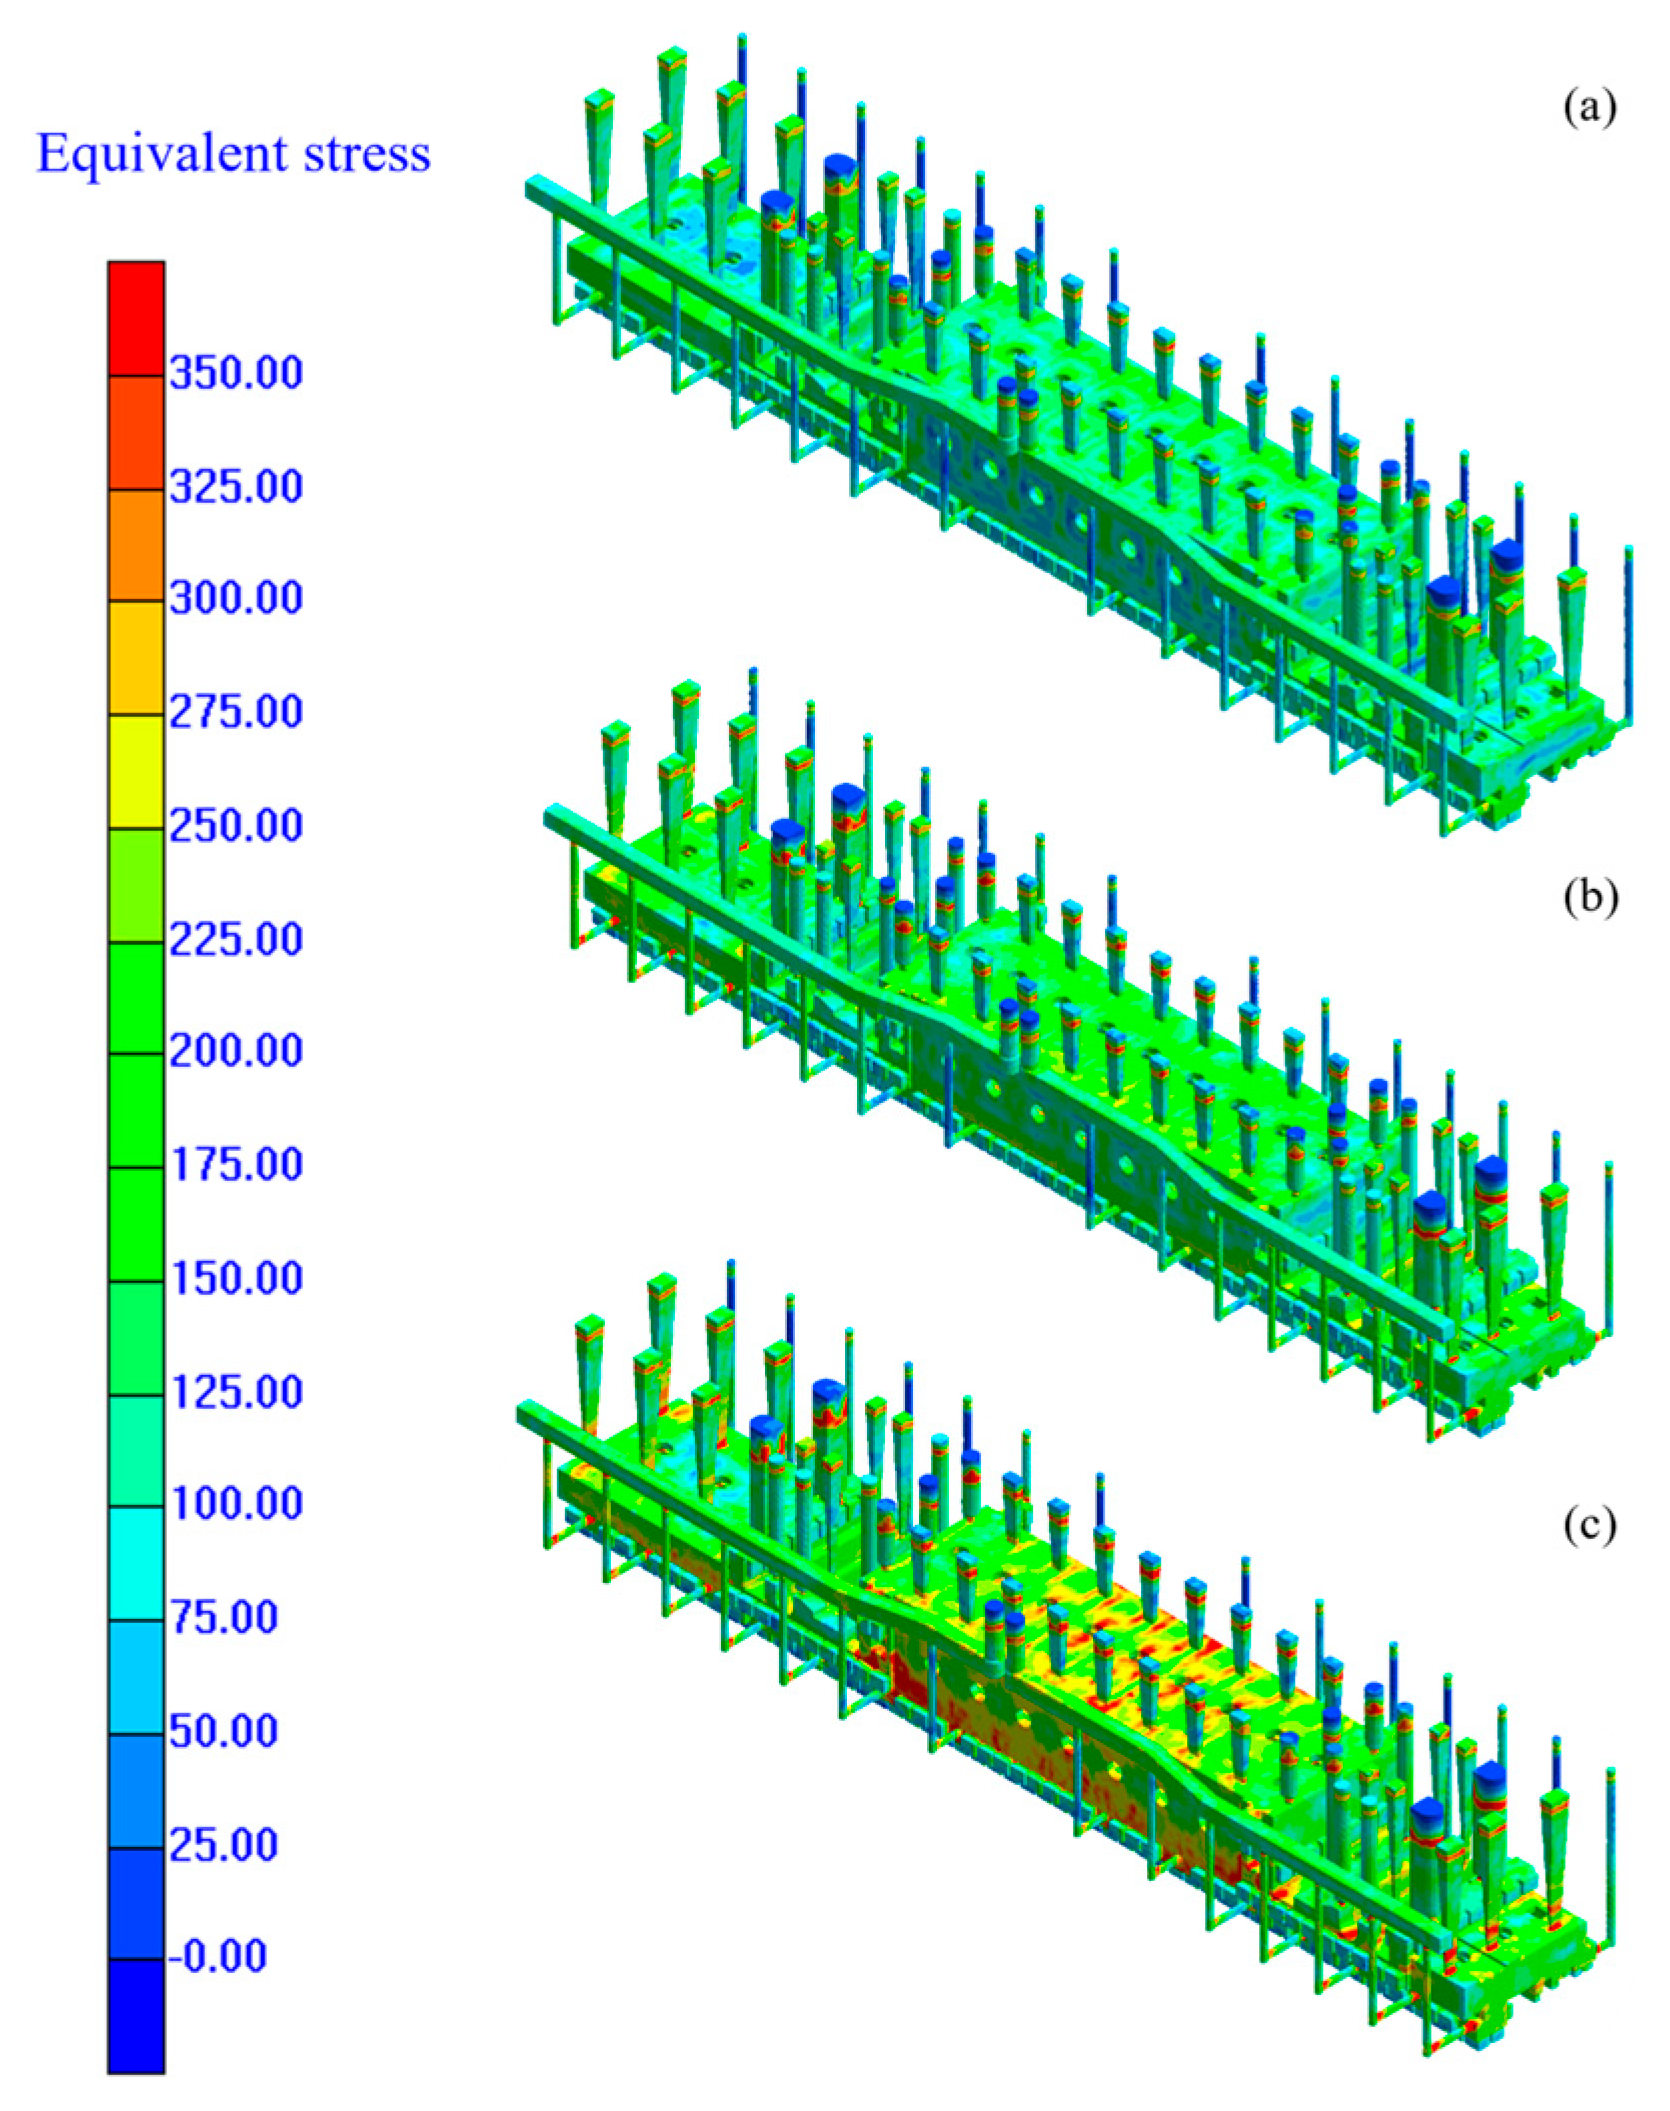
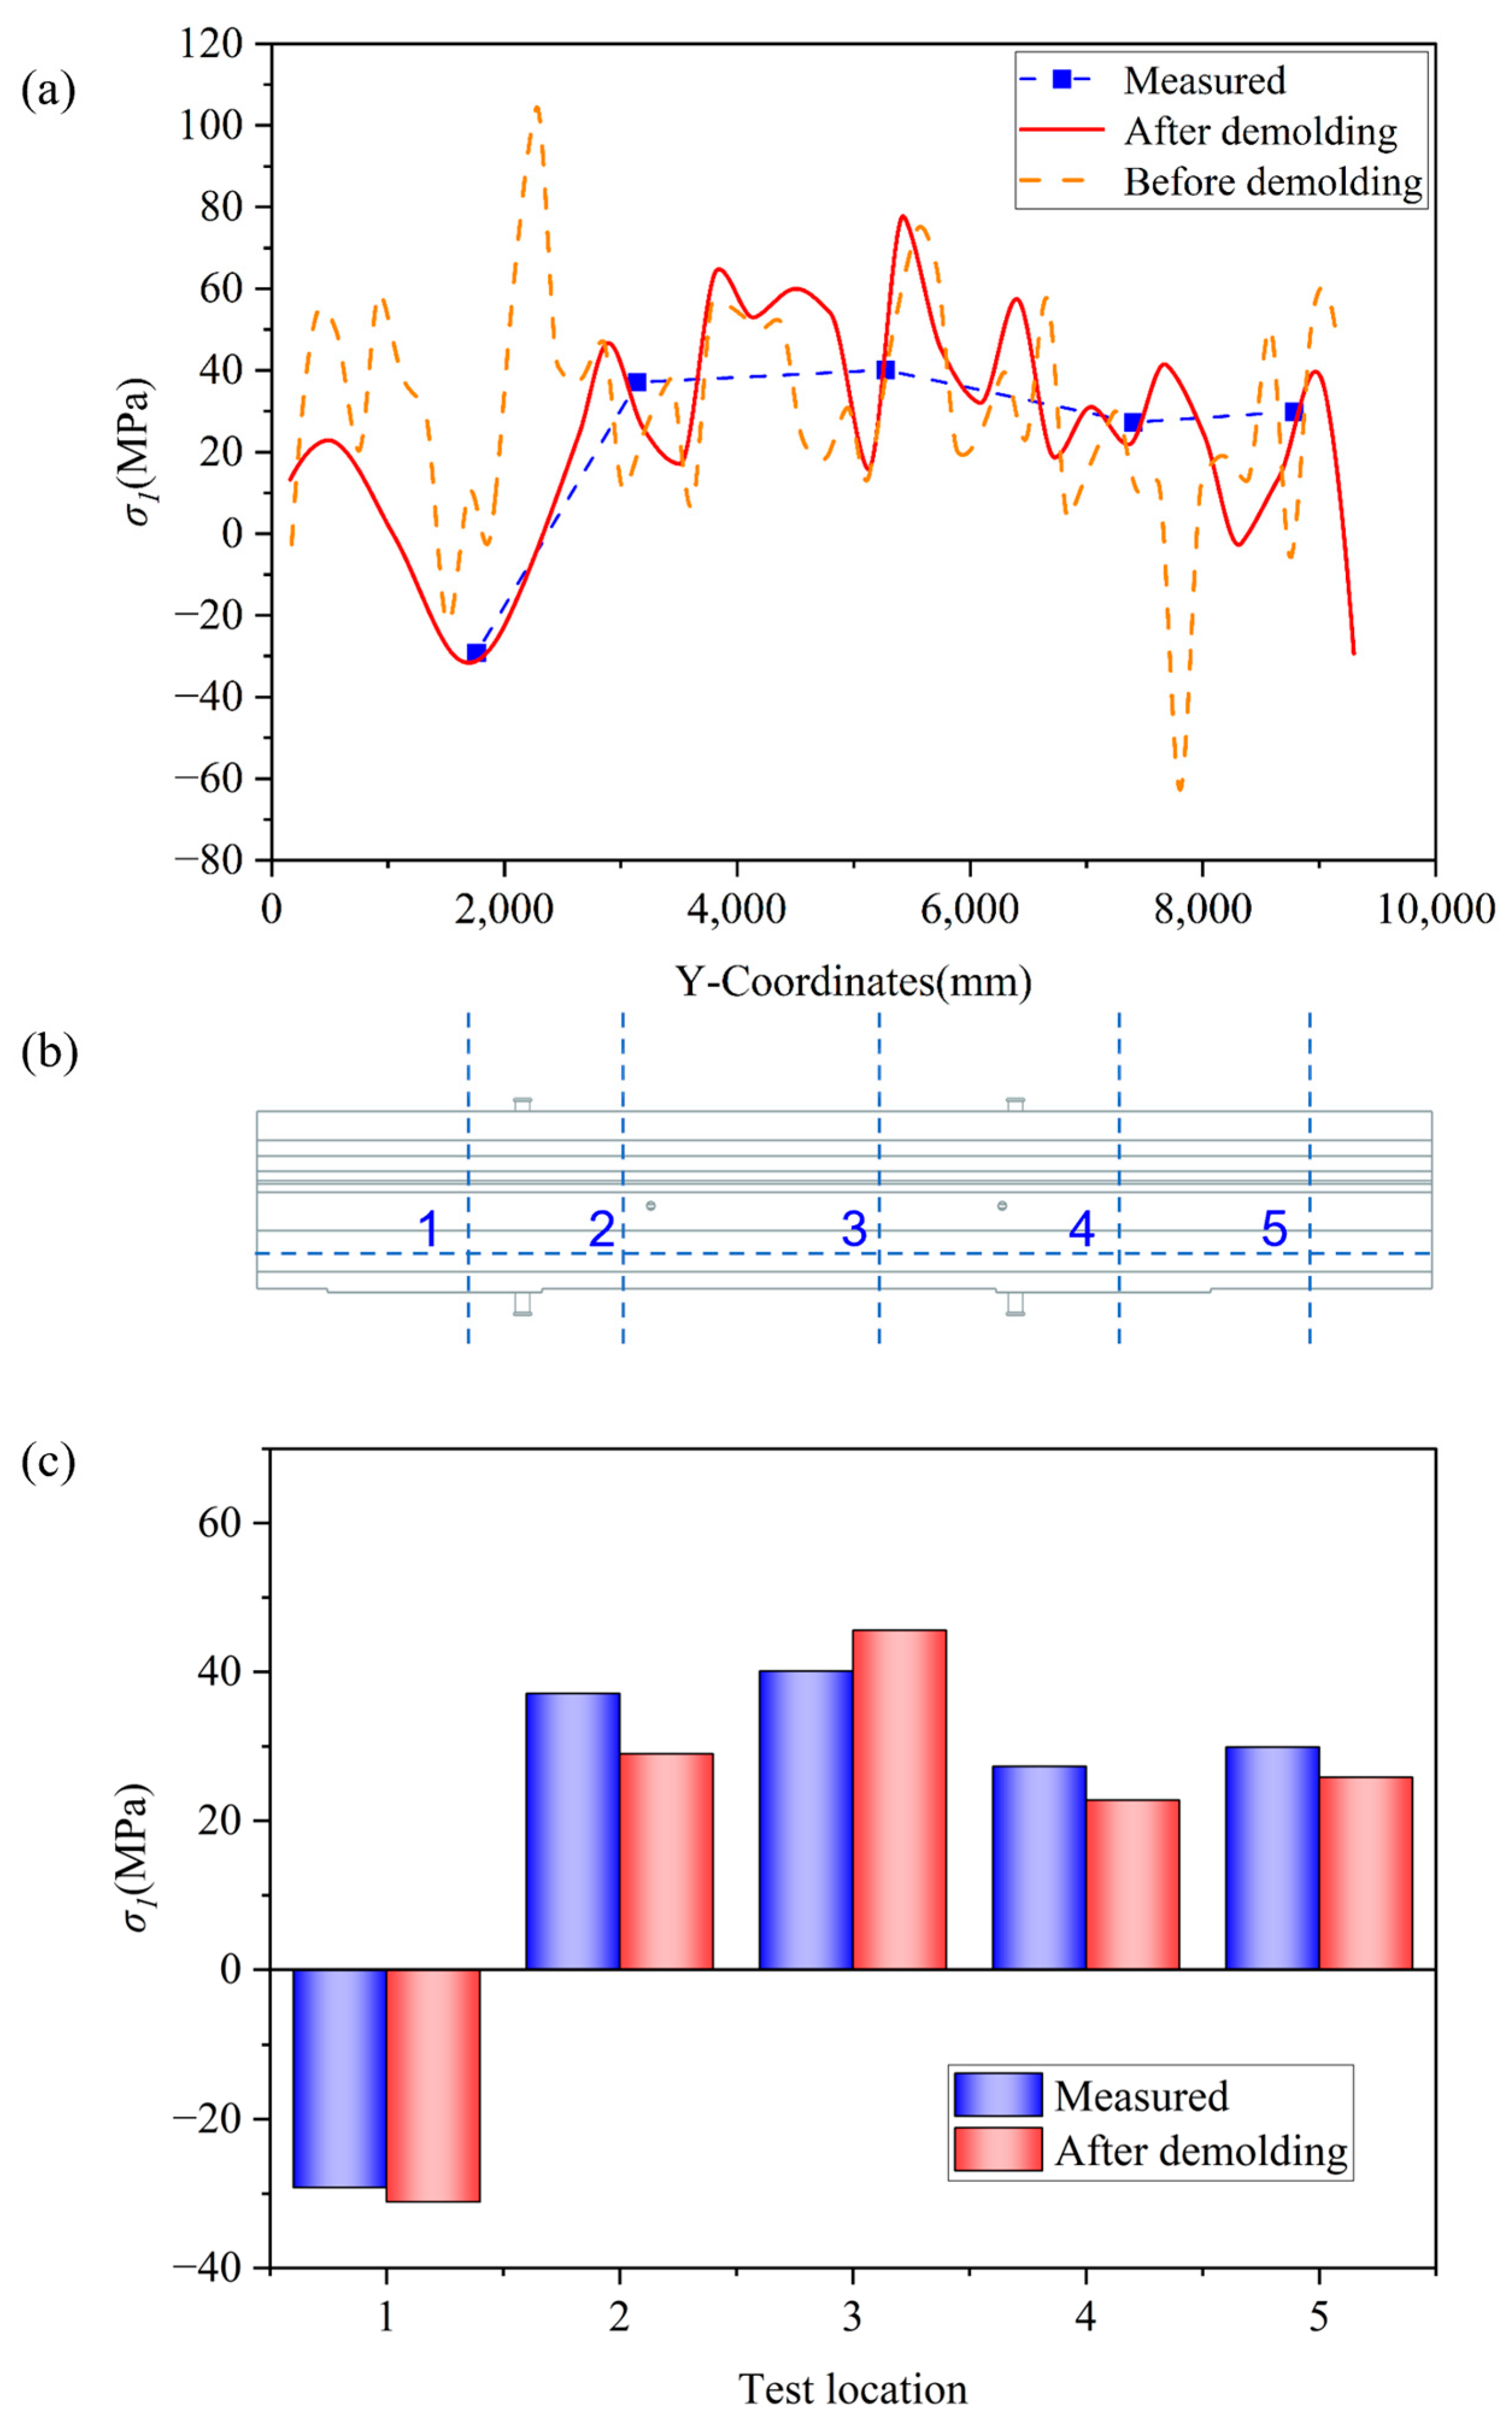
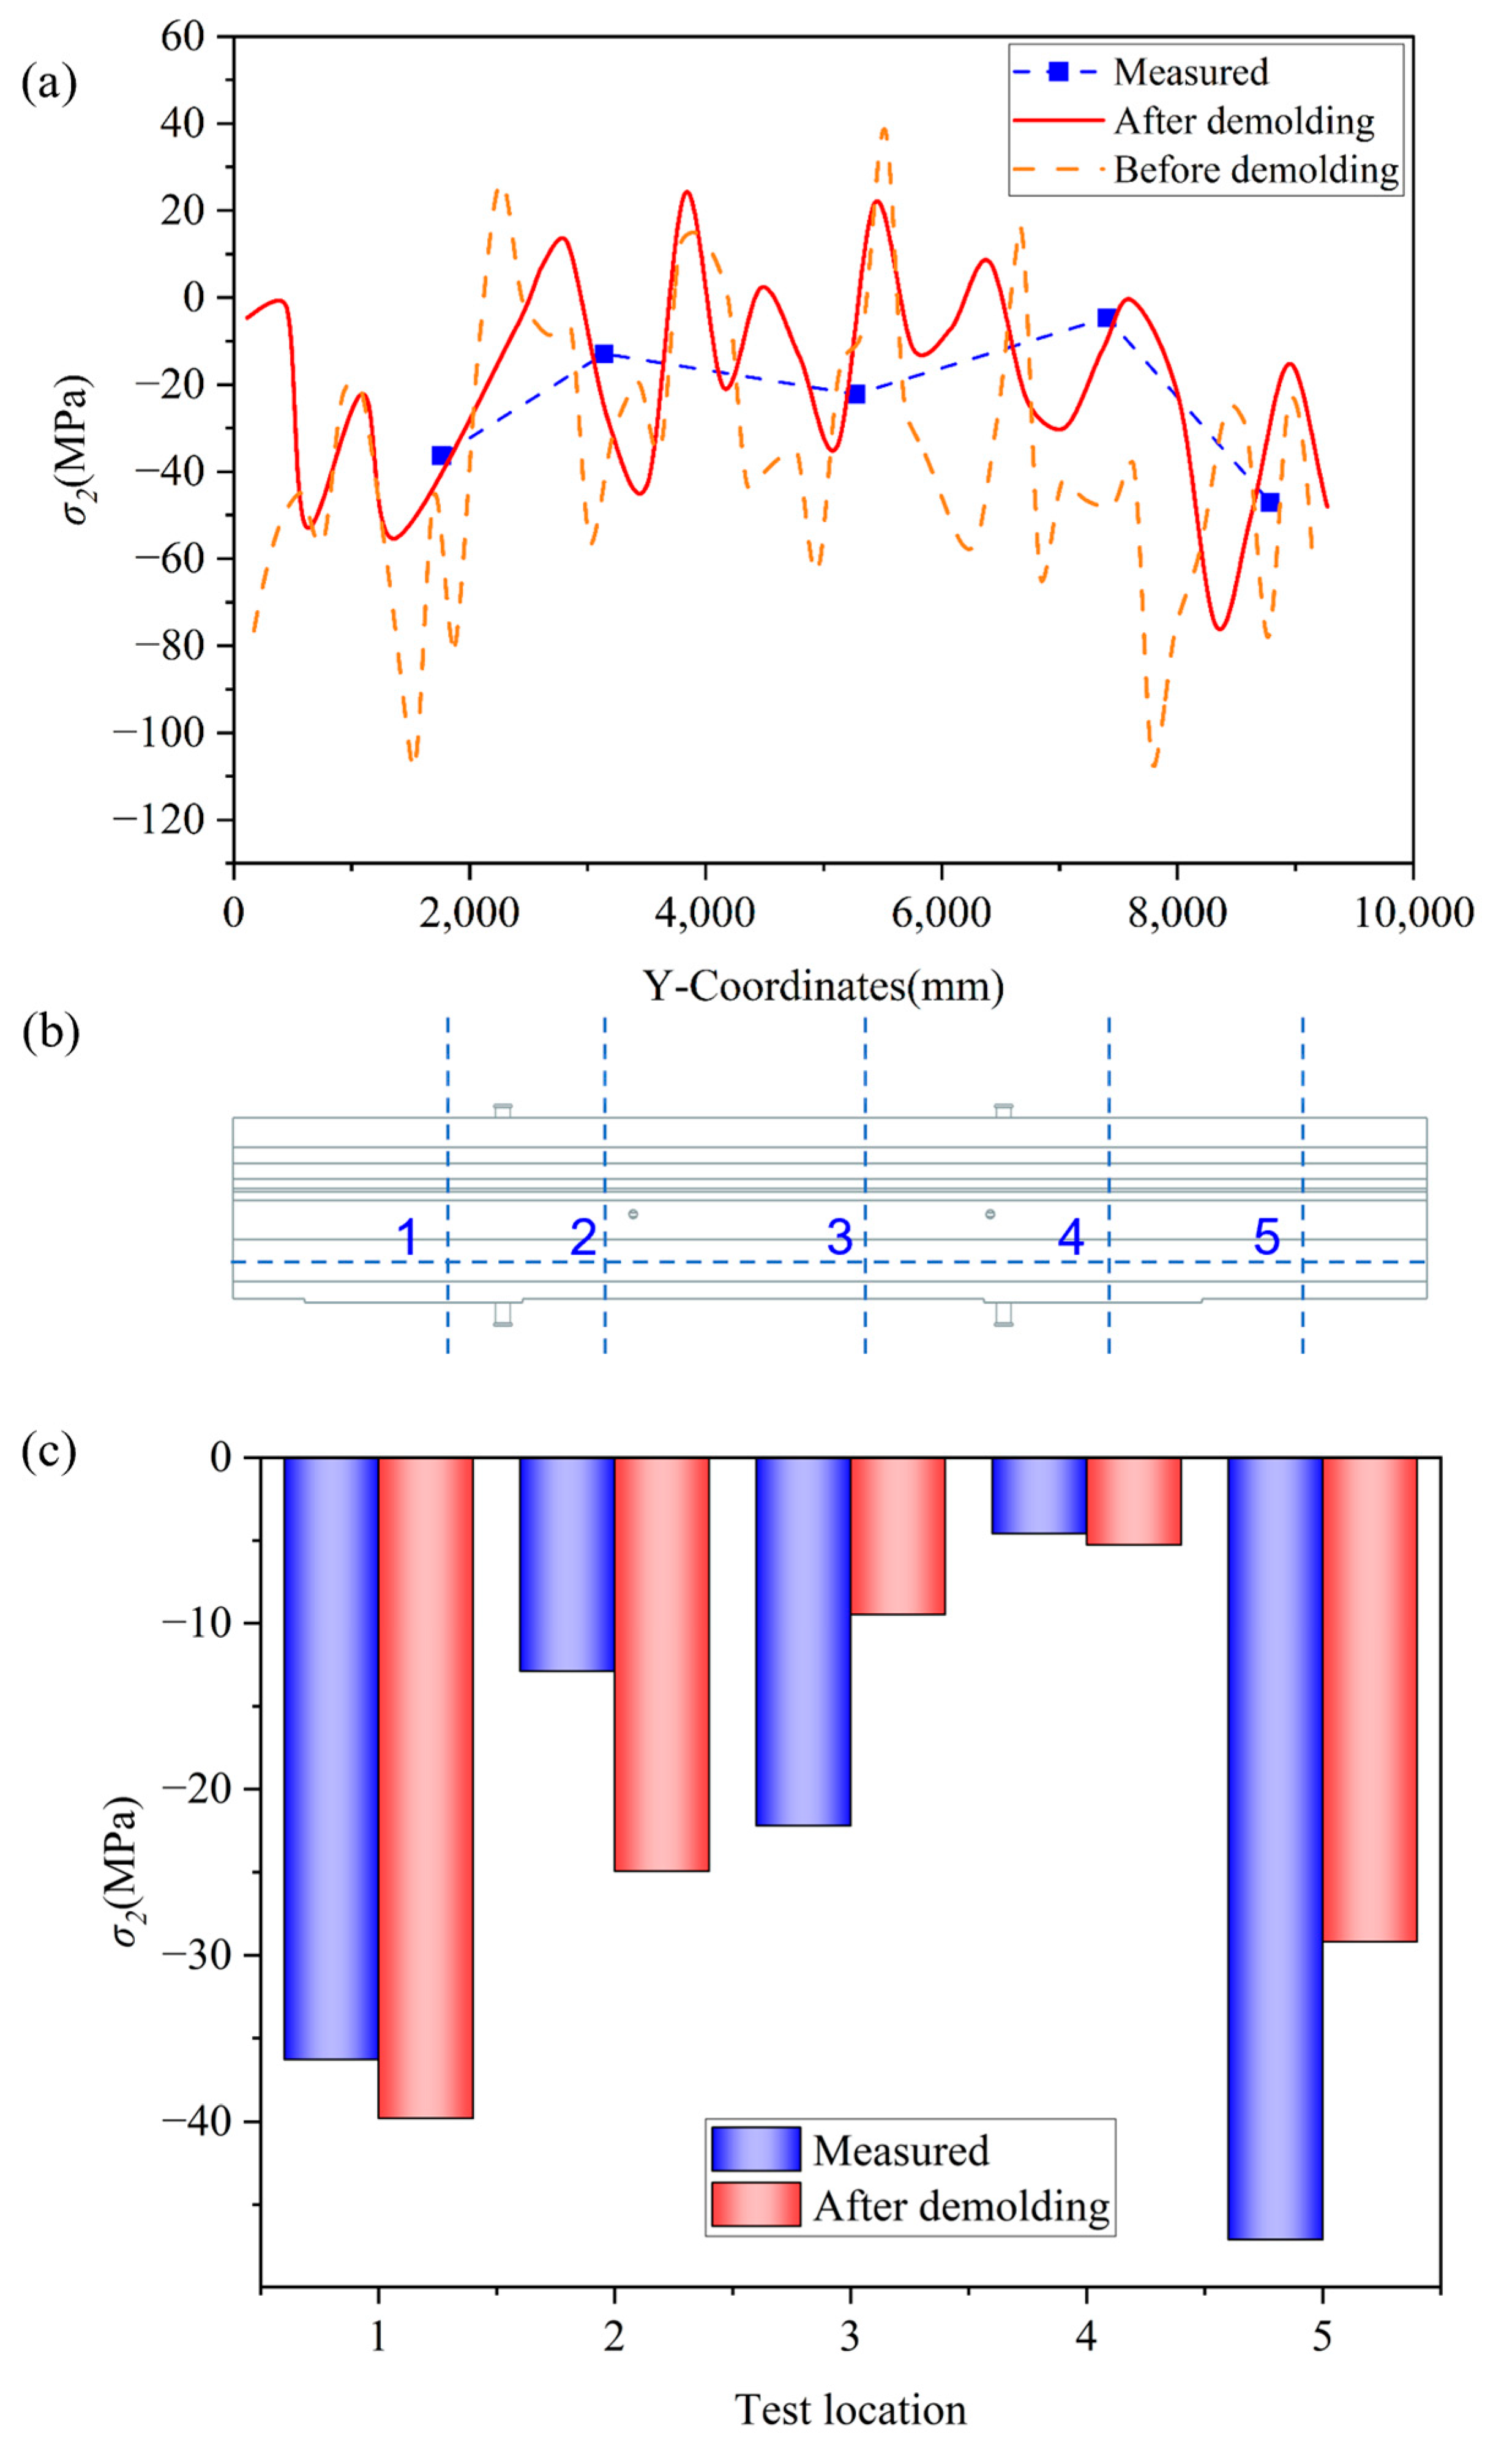
4.2. Stress Simulation Analysis and Verification

After the beam is poured, it undergoes cooling during solidification, with the temperature difference between the inner and outer layers, along with uneven cooling, leading to inconsistent shrinkage rates and the formation of thermal stress within the casting. Additionally, the thermal expansion of the sand mold and its resistance to the casting shrinkage also play significant roles in affecting casting performance. These forces induce internal stress within the casting. Post-demolding, factors such as air circulation and the release of sand mold constraints lead to a gradual change in the internal stress of the beam casting as the temperature decreases, eventually stabilizing and forming residual stress.
Figure 8a illustrates the equivalent stress field of the beam casting cooled from 1360 °C to about 200 °C, obtained through numerical simulation. The areas exhibiting the highest overall residual stress in the beam are found at the edges of the rib plates and the structural holes.
Additionally, the stress distribution on the guide rail mounting surface is uneven, caused by the thicker guide rail surface and the larger temperature gradient between the inner and outer layers. In this study, the wide guide rail surface at the installation location of the machine tool beam is selected for residual stress testing using the blind-hole method.
Figure 9 and Figure 10 show a comparison of the experimental residual stress values of σ1 and σ2 with the simulated residual stress values. Figure 9a and Figure 10a show a comparative line chart of the simulated and measured values before and after demolding. Figure 9b and Figure 10b show the positions of the stress measurement points. Figure 9c and Figure 10c show a bar graph comparing the simulated values after demolding with the experimental values. Notably, the measurement points shown in Figure 9b and Figure 10b mark the same spot on the wide guide rail surface at the machine tool beam installation site.
From Figure 9a and Figure 10a, it is evident that the residual stress simulation curves before and after the demolding process are generally consistent with the experimental values, with the post-demolding results being closer to the experimental data. In the central region of the casting, the residual stress values before and after demolding calculations do not differ significantly. However, at the two ends of the beam casting, such as positions 1 and 5, the results show considerable discrepancies. The stress results calculated before demolding exhibit significantly larger amplitude fluctuations compared to those after demolding.
The σ1 stress before demolding is higher than that after demolding at the left position but lower at the right position. This may be due to the position of the bed body of the heavy-duty machine tool beam casting being on the left. The right side has a longer guide rail surface with a faster solidification rate, whereas the left bed, as the mass center, has a greater cross-sectional thickness, resulting in a significant solidification gradient over time, consistent with the temperature distribution trend shown in Table 2.
As the thin-walled guide rail area on the right solidifies first, it experiences rigid mold constraints, generating thermal shrinkage compressive stress while simultaneously applying tensile constraints to the left liquid phase through the mold force transmission path. The thicker part on the left is restricted in its shrinkage during the later solidification stages, forming a tensile stress field. The part that solidifies first undergoes greater shrinkage during cooling, but this shrinkage is constrained by the surrounding material, resulting in internal compressive stress [26]. After the demolding process simulation, the excessive tensile stress on the left and compressive stress on the right of the guide rail surface are released.
Combined with the infrared temperature measurement results shown in Table 2, the pit removal temperature on the wide guide rail surface is higher than at other positions, indicating that the larger cross-sectional area of the guide rail surface leads to slower cooling in the central region and a relatively gentler temperature gradient. The overall residual stress accumulation is uniform; however, due to the longer duration of thermal stress accumulation, the average value is higher.
Experimental measurements indicate that the maximum residual stress occurs at point 3, located at the center of the guide rail surface. This is due to the gate position being at the center, almost directly beneath it, making this the last area to solidify and leading to the relatively large stress at this location. The maximum σ1 values in both the experimental results and the post-demolding simulation results from the self-developed CAE software occur at this position, measuring 40.1 MPa and 45.6 MPa, respectively, both of which are lower than the tensile strength of HT 250. Compared to the maximum residual stress of 150 MPa reported in the literature, the residual stress of the casting designed in this study is smaller, demonstrating the rationality of the casting process [7]. For heavy castings, the self-developed casting CAE can more accurately predict their stress distribution, as well as the location and magnitude of the maximum tensile stress.

5. Heavy Machine Tool Beam Casting Process Optimization

The liquidus line of the gray cast iron used in this study is approximately 1330 °C. During the casting process, maintaining an appropriate degree of superheat is crucial for ensuring casting quality. Increasing the pouring temperature improves the fluidity of the molten metal, thereby reducing the risk of insufficient pouring [27]. The pouring temperature is typically set 30 °C~100 °C above the liquidus line [28]. Therefore, 1360 °C, 1400 °C, and 1430 °C are chosen as the simulated process parameters in this study, and residual stress is calculated using the previously proposed numerical simulation model to obtain process parameters with lower residual stress.
Figure 11 presents the variation curve of the equivalent stress on the guide rail surface shown in Figure 9b with the y-coordinate under different pouring temperatures: (a) 1360 °C, (b) 1400 °C, and (c) 1430 °C.
High-temperature pouring leads to a larger temperature gradient, which also causes a larger initial expansion of the metal. Therefore, the metal in the edge area shrinks faster, and due to weaker constraint conditions, the material shrinks freely, resulting in smaller thermal stress. The middle area is constrained on both sides, restricting shrinkage and leading to greater tensile stress, thus increasing the equivalent stress. The overall simulation results of the equivalent stress obtained in this study align with the conclusions in [14,29]. In general, the magnitude of residual stress decreases as the pouring temperature decreases. Figure 8 presents an equivalent stress distribution cloud diagram of the heavy machine tool beam casting after demolding at different pouring temperatures.
Figure 8a–c correspond to the simulation results at 1360 °C, 1400 °C, and 1430 °C, respectively. At 1360 °C, the casting exhibits low equivalent stress. Most of the structure is light green or light blue, with only a few high-stress regions. The stress distribution is uniform and lacks obvious concentration. At 1400 °C, the green region expands, indicating the growth of medium-stress areas. Light green to yellow zones appear on local protrusions and connection points, suggesting an increase in stress and the onset of localized concentration. At 1430 °C, high-stress regions increase significantly. Yellow, orange, and even red zones appear in thin walls and at structural transitions such as the column–beam junction. Stress concentration becomes more pronounced, while low-stress areas shrink and concentrate in the gating system. Overall, higher pouring temperatures intensify stress concentration. High-stress regions expand inward from the edges and connections, with the greatest concentration occurring at the junction between the vertical support and the main beam.
Although increasing the pouring temperature helps the metal flow and fill small grooves and cavities better in the mold to ensure the integrity of the casting, a higher pouring temperature usually leads to greater shrinkage, thereby increasing residual stress. A higher temperature gradient will also generate greater thermal stress during the cooling process, which is further converted into residual stress [14]. However, for the thin-walled parts of the casting, appropriately adjusting the pouring temperature can improve the stress distribution, thereby reducing deformation and cracking [29].
Since the overall stress level increases with an increase in temperature, especially in thin-walled positions, the stress increase phenomenon is more obvious, and at high temperatures, the stress distribution becomes more uneven, and the difference between high-stress areas and low-stress areas is more significant. By comparing the three temperatures, 1360 °C as the pouring temperature is conducive to uniform stress distribution, so 1360 °C is selected as the pouring temperature for actual production.

6. Conclusions

This study constructs a thermal flow–mechanical coupling numerical model for the demolding process of heavy machine tool beam castings, verifies the prediction accuracy of residual stress distribution through blind-hole method experiments, and proposes a casting process optimization scheme. The main conclusions are as follows:
  • Numerical Simulation Model Construction: This study uses a hybrid FEM/FDM algorithm to construct a numerical model for the solidification and demolding processes that couples heat conduction, melt flow, and structural mechanics multiphysical fields. A self-developed casting CAE software for the numerical simulation of residual stress in heavy machine tool beam castings is developed, which solves the defects of traditional models that do not consider the residual stress simulation model triggered by mechanical constraint release and improves the prediction accuracy of stress.
  • Model Effectiveness Verification: The comparison between the data measured with the self-developed CAE software and that from the blind-hole method shows that the absolute error between the simulated value and the experimental value of the maximum principal stress on the guide rail installation surface is less than 10 MPa, and the relative error is 11.8%. The simulation results successfully capture the stress concentration areas at the edges of the rib plates and the edges of the structural holes, which have spatial consistency with the service failure positions of the casting. This model has been applied to actual production by cooperative enterprises, verifying its industrial applicability.
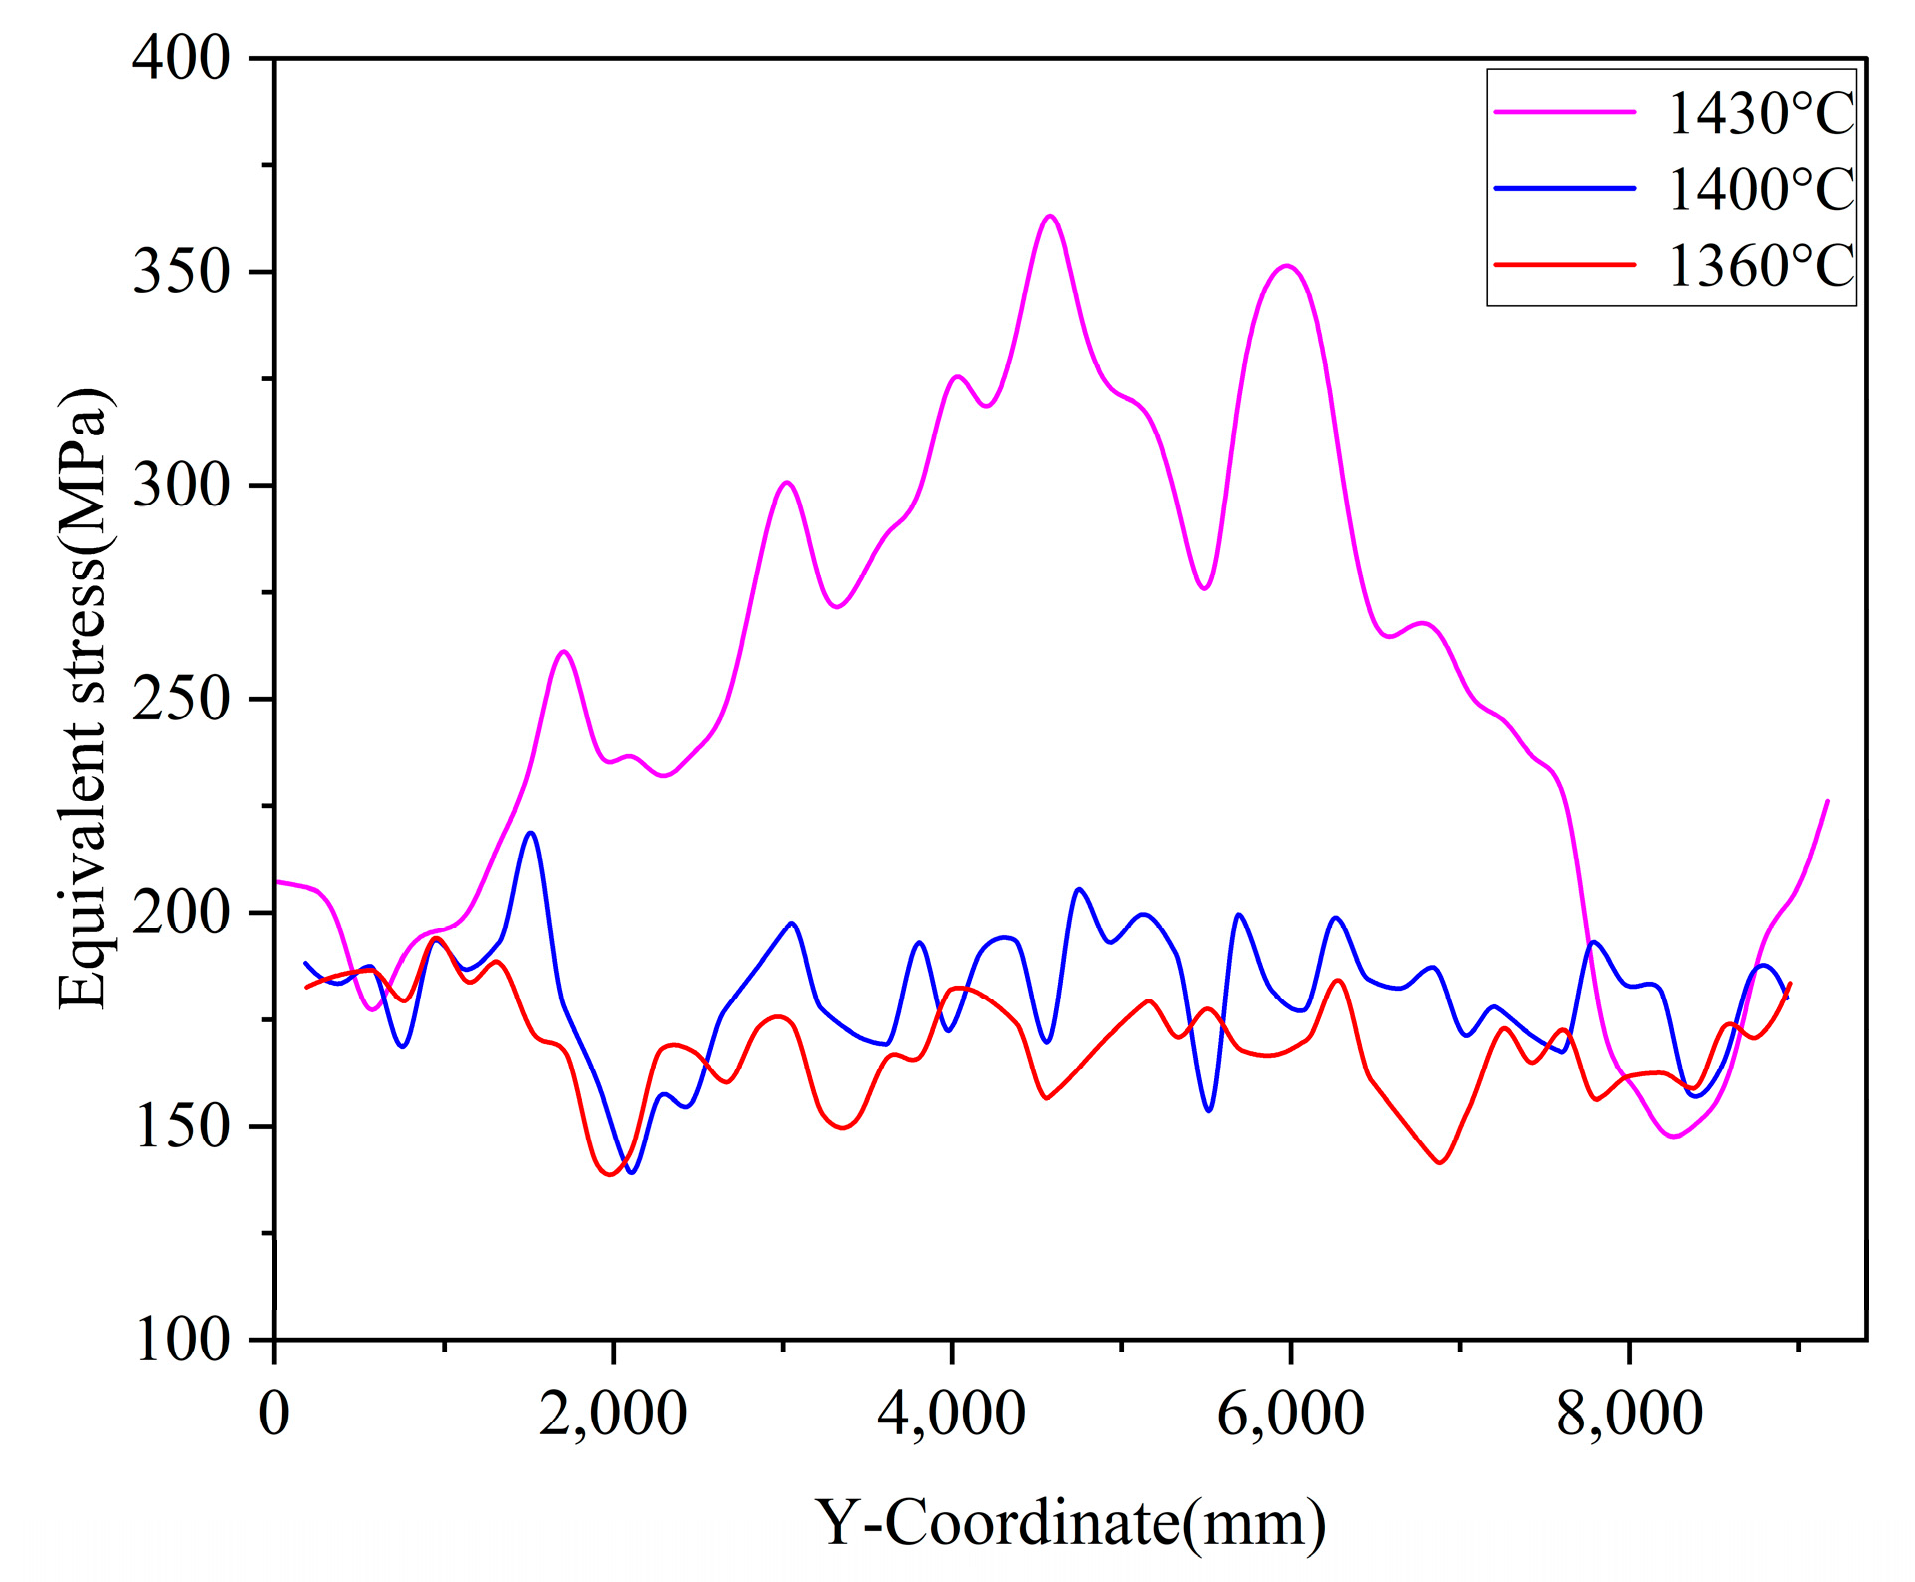
  • Process Parameter Optimization: The numerical simulation experiment of pouring temperature regulation shows that under the 1360 °C working condition, the overall equivalent stress of the casting is lower than that under the 1430 °C working condition, and the proportion of high-stress areas is reduced. By constructing a process scheme for heavy machine tool beam castings with a split sand core design and gradient chill layout, high-quality heavy machine tool beam castings are produced.
Future research will focus on breaking through the construction of a multi-scale residual stress evolution model and carrying out a numerical simulation of aging treatment processes to further improve the prediction system for the residual stress and dimensional stability of castings under complex working conditions.

Supplementary Materials

The following supporting information can be downloaded at: https://www.mdpi.com/article/10.3390/met15070687/s1. Figure S1: Crossbeam CAD drawing.pdf; Figure S2: Verification of difference mesh independence.png; Figure S3: Verify the finite element mesh independence.png; Figures S4–S10: Section 1–7.png.

Author Contributions

Conceptualization, D.L.; Methodology, D.L.; Software, Y.Z.; Validation, J.C. and Y.Z.; Investigation, J.C.; Resources, J.C.; Writing—original draft, J.C. and Y.Z.; Writing—review and editing, D.L.; Visualization, Y.Z.; Supervision, D.L.; Project administration, D.L.; Funding acquisition, J.C. All authors have read and agreed to the published version of the manuscript.

Funding

This work was funded by the Knowledge Innovation Program Shuguang Project of Wuhan Science and Technology Bureau (No. 2023010201020487) and the Science and Technology Research Program Guidance Project of the Hubei Provincial Department of Education (No. B2023532).

Data Availability Statement

The original contributions presented in this study are included in the article. Further inquiries can be directed to the corresponding author.

Acknowledgments

The authors of this study express their sincere gratitude for the support of Wuhan Heavy Duty Machine Tool Group Corporation. Our heartfelt thanks go to Bing Liu, Hongcheng Liang, Mi Pan, Ke Zhang, Yuke Ma, Yuxuan Ma, Wenjian Qiu and Yuhao Chen for their invaluable guidance, assistance in experiments, and diligent efforts in data analysis and discussion.

Conflicts of Interest

Author Jingfan Cheng was employed by the company Wuhan Wuzhong Casting & Forging Co., Ltd., Wuhan Heavy Duty Machine Tool Group Corporation. The remaining authors declare that the research was conducted in the absence of any commercial or financial relationships that could be construed as a potential conflict of interest.

References

  1. Nemyrovskyi, Y.; Shepelenko, I.; Storchak, M. Plasticity Resource of Cast Iron at Deforming Broaching. Metals 2023, 13, 551. [Google Scholar] [CrossRef]
  2. Zelenova, V.D.; Butaev, É.I.; Knorozova, T.B.; Muratov, S.A.; Lushnikov, F.G. Residual-Stress Distribution and Microstructure of Fractures in Blanks of Cylinder Shells of Gray Cast Iron. Met. Sci. Heat Treat. 1982, 24, 382–386. [Google Scholar] [CrossRef]
  3. Yang, H.; Zhou, T.; Wang, Q.; Zhou, H. Effects of Laser Melting Distribution on Wear Resistance and Fatigue Resistance of Gray Cast Iron. Metals 2020, 10, 1257. [Google Scholar] [CrossRef]
  4. Motoyama, Y.; Ebihara, N.; Shiga, H.; Sato, T.; Kambe, H.; Yoshida, M. Thermal Stress Analysis of Residual Stress in a Cylindrical Aluminum Casting with Cast-in GCI Liner, Taking Recovery Behavior Effect into Account. Met. Mater. Trans. A 2018, 49, 5619–5635. [Google Scholar] [CrossRef]
  5. Lukoševičienė, O.; Leonavičius, M.; Lukoševičius, V.; Bazaras, Ž. Investigation of Crack Propagation in Locally Thermal-Treated Cast Iron. Materials 2025, 18, 321. [Google Scholar] [CrossRef]
  6. Yang, D.; Li, L.; Zhou, C.; He, Q. Research on Dynamic Evolution of Residual Stress Based on Simulation of Piston Manufacturing Process. Metals 2024, 14, 1327. [Google Scholar] [CrossRef]
  7. Zhang, S.; Ran, Y.; Murphy, A.; Zhang, G.; Wang, W. Residual Stress Analysis of Gray Cast Iron Manufacturing Processes. Mater. Manuf. Process. 2020, 35, 1781–1788. [Google Scholar] [CrossRef]
  8. Deng, X.L.; Fu, J.Z.; He, Y.; Chen, Z.C.; Jiao, H.F. An Analysis of Thermal-Structural Characteristics for Precision Linear Rolling Guide CNC Grinding Machine Tool’s Bed. Appl. Mech. Mater. 2010, 37–38, 86–89. [Google Scholar] [CrossRef]
  9. Chen, Y.; Li, S.; Huang, J.; Hu, T.; Li, X.; Li, C.; Xian, G.; Zhou, C.; Fan, H. Research on Key Casting Process of High-Grade CNC Machine Tool Bed Nodular Cast Iron. Rev. Adv. Mater. Sci. 2023, 62, 20230164. [Google Scholar] [CrossRef]
  10. Zhang, L.H.; Liu, X.G.; Kang, J.W.; Huang, T.Y.; Bian, D.T. Numerical Simulation of the Solidification Process of a Heavy Roll Stand for Temperature Field and Thermal Stress Field. Zhuzao (Foundry) 2006, 55, 922–926. [Google Scholar]
  11. Key, S.W.; Krieg, R.D. Comparison of Finite-Element and Finite-Difference Methods. In Numerical and Computer Methods in Structural Mechanics; Fenves, S.J., Perrone, N., Robinson, A.R., Schnobrich, W.C., Eds.; Academic Press: Cambridge, MA, USA, 1973; pp. 337–352. ISBN 978-0-12-253250-4. [Google Scholar]
  12. Xue, X.; Wang, Y.P.; Zhang, Y.B. Numerical Simulation of Thermal Stress and Deformation in a Casting Using Finite Difference Method. Mater. Sci. Forum 2013, 762, 218–223. [Google Scholar] [CrossRef]
  13. Futas, P.; Pástor, M.; Pribulova, A. Analysis of the Possibilities of Reducing the Levels of Residual Stresses in Casting Produced from Synthetic Cast Iron. Heliyon 2024, 10, e33623. [Google Scholar] [CrossRef]
  14. Motoyama, Y.; Inukai, D.; Okane, T.; Yoshida, M. Verification of the Simulated Residual Stress in the Cross Section of Gray Cast Iron Stress Lattice Shape Casting via Thermal Stress Analysis. Metall. Mater. Trans. A 2014, 45, 2315–2325. [Google Scholar] [CrossRef]
  15. Motoyama, Y.; Takahashi, H.; Okane, T.; Fukuda, Y.; Yoshida, M. Numerical and Experimental Study on Residual Stress in Gray Cast Iron Stress Lattice Shape Casting. Metall. Mater. Trans. A 2013, 44, 3261–3270. [Google Scholar] [CrossRef]
  16. Guterres, N.; Rusnaldy, R.; Widodo, A. Effect of Chill Plate Thickness on Surface Hardening and Dimensional Accuracy of Nodular Cast Iron Gears Manufactured by the Chill Casting Method. Designs 2023, 7, 56. [Google Scholar] [CrossRef]
  17. Farhang Mehr, F.; Cockcroft, S.; Reilly, C.; Maijer, D. Investigation of the Efficacy of a Water-Cooled Chill on Enhancing Heat Transfer at the Casting-Chill Interface in a Sand-Cast A319 Engine Block. J. Mater. Process. Technol. 2020, 286, 116789. [Google Scholar] [CrossRef]
  18. Gafur, M.A.; Haque, M.N.; Prabhu, K.N. Effect of Chill Thickness and Superheat on Casting/Chill Interfacial Heat Transfer during Solidication of Commercially Pure Aluminium. J. Mech. Work. Technol. 2003, 133, 257–265. [Google Scholar]
  19. Pan, M.; Yang, Z.M.; He, C.; Yang, H. Effect of Graphite on Tensile Strength and Elastic Modulus of Gray Cast Iron Machine Tool Beam Castings. Foundry Eng. 2023, 47, 34–37. [Google Scholar]
  20. Cao, Z.; Dong, M.; Liu, K.; Fu, H. Temperature Field in the Heat Transfer Process of PEEK Thermoplastic Composite Fiber Placement. Materials 2020, 13, 4417. [Google Scholar] [CrossRef]
  21. Cui, Z.; Hu, X.; Dong, S.; Yan, S.; Zhao, X. Numerical Simulation and Experimental Study on Residual Stress in the Curved Surface Forming of 12CrNi2 Alloy Steel by Laser Melting Deposition. Materials 2020, 13, 4316. [Google Scholar] [CrossRef]
  22. Kurosawa, E.; Nakagawa, T. High-Efficiency Coupled Solidification-Thermal Stress Simulation of Casting Based on Explicit Finite Element Method. Trans. JSME 2015, 81, 15–00192. [Google Scholar]
  23. Chang, A.; Dantzig, J. Improved Sand Surface Element for Residual Stress Determination. Appl. Math. Model. 2004, 28, 533–546. [Google Scholar] [CrossRef]
  24. Zhao, Q.; Chen, K.; Chen, M.; Briseghella, B.; Guo, Z.; Yang, G. Use of Plastic Correction Formula to Improve Accuracy of Welding Residual Stress Test with Blind-Hole Method. Trans. Tianjin Univ. 2018, 24, 480–488. [Google Scholar] [CrossRef]
  25. He, Q.; Zhou, C.; Jing, X.; Jiang, Y.; Zhou, H. Research on Residual Stress Evolution of Diesel Engine Piston Manufacturing Based on Finite Element Method. J Braz. Soc. Mech. Sci. Eng. 2022, 44, 522. [Google Scholar] [CrossRef]
  26. Maj, M. The Formation of the Strength of Castings Including Stress and Strain Analysis. Materials 2024, 17, 2484. [Google Scholar] [CrossRef]
  27. Ding, M.; Song, J.; Honghui, L. Effect of Pouring Temperature on Typical Structure of Thin-Walled ZL105A Alloy Casting. Mater. Manuf. Process. 2014, 29, 853–863. [Google Scholar] [CrossRef]
  28. Yang, S.H.; Du, X.M. The Lost Foam Casting Simulation of the Gray Cast Iron Linner. Adv. Mater. Res. 2014, 834, 1580–1583. [Google Scholar] [CrossRef]
  29. Zeng, Y.D.; He, L.T.; Zhang, J. Numerical Simulation of Casting Deformation and Stress of A356 Aluminum Alloy Thin-Walled Frame Casting. Mater. Sci. Forum 2021, 1033, 24–30. [Google Scholar] [CrossRef]
Figure 1. Gating system and sand core design: (a) gating system; (b) sand core.
Metals 15 00687 g001
Figure 2. Chilling system design: (a) chill; (b) internal chill.
Metals 15 00687 g002
Figure 3. Measurement of residual stress: (a) actual production process of castings; (b) stress measurement utilizing blind-hole method.
Metals 15 00687 g003
Figure 4. Temperature measurement locations for beam casting at shakeout and pit removal.
Metals 15 00687 g004
Figure 5. Top-down temperature cloud map of solidification process of crossbeam casting component.
Metals 15 00687 g005
Figure 6. Numerical simulation temperature distribution cloud map of filling process of heavy machine tool crossbeam casting: (a) 9.16 s; (b) 18.49 s; (c) 27.82 s; (d) 37.19 s; (e) 40.00 s; (f) 56.91 s.
Metals 15 00687 g006
Figure 7. Numerical simulation temperature distribution cloud map of solidification process of heavy machine tool crossbeam castings: (a) 59.24 s; (b) 492.89 s; (c) 12,048.20 s; (d) 39,481.99 s; (e) 119,937.79 s; (f) 256,140.59 s.
Metals 15 00687 g007
Figure 8. Distribution cloud map of different pouring temperature effects on stress of heavy machine tool crossbeam castings: (a) 1360 °C; (b) 1400 °C; (c) 1430 °C.
Metals 15 00687 g008
Figure 9. Comparison chart of experimental and simulated values of σ1: (a) line graph comparing measured values with σ1 before and after demolding; (b) stress measurement point position; (c) comparison bar chart of simulated values after demolding and experimental values.
Metals 15 00687 g009
Figure 10. Comparison chart of experimental and simulated values of σ2: (a) line graph comparing measured values with σ2 before and after demolding; (b) stress measurement point position; (c) comparison bar chart of simulated values after demolding and experimental values.
Metals 15 00687 g010
Figure 11. Variation curves of equivalent stress on guide rail surface with respect to y-coordinate under different pouring temperatures.
Metals 15 00687 g011
Table 1. Heat transfer coefficient settings for thermal process numerical simulation.
UnitCasting–AirCasting–Mold WallMold Wall–AirCasting–ChillChill–Mold Wall
h/W·m2·K−12050052000500
Table 2. Temperatures of casting at shakeout and pit removal.
NodesSurface of PartingSide of Parting SurfaceGuide Rail Surface
ABAB
1///146156
213998107145160
314795108150151
414094110147148
512492106148157
613590100140154
7///142153
Average temperature/°C13794106145154
Disclaimer/Publisher’s Note: The statements, opinions and data contained in all publications are solely those of the individual author(s) and contributor(s) and not of MDPI and/or the editor(s). MDPI and/or the editor(s) disclaim responsibility for any injury to people or property resulting from any ideas, methods, instructions or products referred to in the content.

