Article

Characterization of Porosity and Copper Infiltration Mechanism in Sintered Steel via Computed Tomography

1
Metal Powder Materials Industrial Technology Research Institute of GRINM, Beijing 101407, China
2
Institute for Advanced Materials and Technology, University of Science and Technology Beijing, Beijing 100083, China
3
GRIPM Advanced Materials Co., Ltd., Beijing 101407, China
4
General Research Institute for Nonferrous Metals, Beijing 100081, China
5
GRINM Additive Manufacturing Technology Co., Ltd., Beijing 101407, China
*
Author to whom correspondence should be addressed.
Metals 2025, 15(6), 635; https://doi.org/10.3390/met15060635
Submission received: 9 April 2025 / Revised: 3 June 2025 / Accepted: 4 June 2025 / Published: 5 June 2025
(This article belongs to the Special Issue Powder Metallurgy of Metals and Alloys)

Abstract

This study employs CT non-destructive detection to quantitatively analyze the pore structure of sintered steel and investigate copper infiltration mechanisms. As density increases from 6.55 to 6.95 g/cm3, pore characteristics exhibit significant changes: pore quantity initially increases then decreases, while average pore size monotonically reduces from 35.7 to 17.2 μm. Copper infiltration dramatically transforms the material’s porosity, characterized by reduced pore count, decreased distribution uniformity, increased closed pore proportion, and morphological regularization. The infiltration process demonstrates selective filling, primarily governed by pore connectivity, size effect, and capillary forces. Molten copper preferentially penetrates high-connectivity networks, prioritizing irregular angular regions. Medium-sized pores (10.52–23.76 μm) with optimal connectivity are predominantly filled. At 6.75 g/cm3, an optimal balance between pore quantity, size, and connectivity facilitates uniform copper infiltration.

1. Introduction

Iron-based powder metallurgy products, commonly called sintered steel, are extensively utilized in the automotive, aerospace, engineering machinery, home appliance, and medical industries due to their superior dimensional accuracy, wear resistance, and high material utilization efficiency. However, conventional iron-based powder metallurgy products typically exhibit 10–15% porosity, which poses a significant challenge to achieving full densification and directly affects the material’s dynamic mechanical properties, particularly its fatigue performance [1,2,3]. To mitigate residual porosity in sintered steel, researchers have developed several methods, including copper infiltration, hot repressing, thermal pressure treatment, and powder hot forging. Among these techniques, copper infiltration technology is notable for its comprehensive performance and cost-effectiveness, yielding substantial improvements in the density, strength, wear resistance, and thermal conductivity of sintered steel. It is particularly effective in enhancing dynamic mechanical properties, such as impact toughness and fatigue strength, and has been widely adopted in the automotive, hydraulic systems, and electric tool industries [4,5,6,7]. This efficacy originates from the melt-infiltration-solidification sequence, during which molten copper, driven by capillary forces, permeates and fills the interconnected pore network within the sintered steel matrix. A portion of this copper dissolves into the iron matrix to form a supersaturated solid solution, imparting a significant solid solution strengthening effect and thereby enhancing both strength and toughness. Concurrently, the softer, more ductile copper phase residing within these pores facilitates a more uniform stress distribution under load. This mechanism mitigates stress concentrations and promotes greater plastic deformation prior to macroscopic fracture. Consequently, compared to their uninfiltrated porous counterparts, copper-infiltrated sintered steels exhibit substantially enhanced hardness, impact toughness, and tensile strength.
Copper-infiltrated sintered steel, a key material in powder metallurgy, exhibits performance and microstructural properties that significantly impact final product service life and functionality. The pore characteristics of the sintered steel matrix are pivotal in influencing both the copper infiltration process and the resultant properties of the infiltrated material. Multifaceted parameters of the pore structure—including morphological features, size distribution, and connectivity—not only dictate the effective infiltration pathways and kinetics for molten copper but also significantly influence the material’s ultimate load-bearing capacity [8,9,10,11,12]. Furthermore, the overall matrix porosity determines the maximum pore volume available for the copper infiltrant. Research by Dzyachkova [8] demonstrated that maintaining pre-sintered compact porosity within the 12–17% range yields optimal copper infiltration. In low-porosity matrices, molten copper shows a greater propensity to infiltrate along grain boundaries, which possess relatively high interfacial energy. Conversely, in high-porosity matrices, molten copper primarily permeates the interconnected pore network via bulk flow, thereby diminishing the relative contribution of grain boundary transport. These differing infiltration pathways directly impact the final material’s microstructure and mechanical properties.
Characterization of the pore structure provides a fundamental basis for understanding the relationship between material properties and microstructural evolution during copper infiltration. Conventional research methodologies primarily rely on two-dimensional (2D) morphological characterization of pores from cross-sections of polished samples, often supplemented by other measurement techniques to ascertain pore sizes. However, this limited 2D sectional perspective frequently fails to comprehensively capture the complex three-dimensional (3D) topological architecture of the pore network. Consequently, it exhibits significant limitations in characterizing critical features such as pore connectivity, spatial distribution heterogeneity, and shape anisotropy. Pore size estimation heavily depends on the cross-section location, with the apparent diameters of the same pore varying substantially across different cutting orientations, resulting in a size distribution that poorly represents the actual pore geometry. Furthermore, distinguishing between closed and open pores is challenging, which hinders the quantitative characterization of pore connectivity—a critical factor for understanding copper flow paths during infiltration. Additionally, the anisotropic nature of pore shapes poses difficulties in accurate quantification, as pores in iron-based powder compacts exhibit significant differences in long-axis characteristics between the vertical and parallel directions relative to the pressing direction.
X-ray computed tomography (CT) has emerged as a sophisticated non-destructive detection method, offering distinct advantages in the development of new materials, microstructural analysis of geotechnical materials, and non-destructive testing of complex materials. Compared to traditional methods, CT scanning maintains sample integrity. It provides high-resolution, three-dimensional visualization, rendering it particularly well-suited for the precise characterization of internal structures in low-porosity sintered steel [13,14,15,16,17,18]. Three-dimensional (3D) observation using CT provides a powerful means to systematically reveal in-depth structural information about internal pores in sintered steel, including their spatial coordinates, volume distribution functions, connectivity tensors, and local characteristics. These precise microstructural data quantitatively delineate the geometric features of the pore network and furnish an experimental basis for understanding the flow behavior of molten copper within such multi-scale porous architectures. However, despite this considerable potential for characterizing pore morphology, systematic 3D quantitative investigations of the internal microstructure, particularly for low-porosity sintered steels, remain relatively scarce. Furthermore, high-temperature, real-time dynamic CT characterization techniques are still nascent, complicating the capture of transient structural changes during processes such as copper infiltration. These limitations collectively constrain the in-depth understanding and precise control of crucial manufacturing processes like copper infiltration.
Based on the aforementioned research status, this study focused on an Fe–Cu–C matrix as its research subject and utilized industrial CT scanning technology for non-destructive examination of sintered and copper-infiltrated specimens. By extracting pore channels and constructing pore network models, the study quantitatively analyzed various pore parameters, including pore count, pore radius, and neighbor count, thereby precisely characterizing pore structure and topological features. Additionally, microscale simulations of the copper infiltration process in sintered steel were performed, providing significant insights that substantially support a deeper understanding of the copper infiltration mechanism.

2. Materials and Methods

The experiment utilized water-atomized iron powder (particle size < 200 μm), electrolytic copper powder (particle size < 50 μm), and graphite powder (particle size < 40 μm) as raw materials. Following the FC0208 standard [19] composition ratio, zinc stearate was used as a lubricant. A three-dimensional powder mixer blended the powder components for 1 h. The mixed powder was then loaded into a mold and pressed into circular disc-shaped specimens (φ25 mm × 3 mm) under a 300–600 MPa compaction pressure. The pressed green bodies underwent pre-sintering and copper infiltration in a tube furnace under an N2-H2 mixed gas atmosphere. The specific process was as follows: specimens were placed in an alumina ceramic boat and heated at a rate of 10 °C/min to 750 °C, where they were held for 30 min to remove the lubricant. Subsequently, the temperature was increased at 5 °C/min to 1120 °C and maintained for 30 min, followed by furnace cooling to room temperature. The prepared specimens were grouped and numbered according to density, with M series representing sintered samples and I series corresponding to copper-infiltrated samples of the M series, using a copper infiltration amount of 10 wt%. The specific relationship between density and sample numbering is presented in Table 1. Density was measured by the Archimedes method using a direct-reading electronic densitometer (DH-300, DahoMeter, Dongguan, China, precision ± 0.001 g/cm3), according to ISO 2738:1999 [20].
Samples were machined into cylindrical specimens with a diameter of 2 mm. The experiment utilized a high-energy industrial CT equipment (ZEISS METROTOM 1500 225kV G3, ZEISS, Oberkochen, Germany) for scanning, with a minimum scanning resolution of 4.95 μm.
Based on the Maximum Ball (MB) algorithm, pores were defined as larger clusters formed by nearby overlapping MBs. In comparison, throats were characterized as smaller clusters absorbed from two other larger clusters. This approach simplifies the complex pore space within sintered steel into a three-dimensional structural model composed of interconnected pores and throats. For pores of arbitrary shape, their equivalent diameter can be obtained by calculating the diameter of a spherical particle with the same volume, expressed by the following equation:
EqDiameter   = 6 × V π 3
where V represents the pore volume. Based on the pore structure data from industrial CT scanning, a stereolithographic file was generated and imported into COMSOL Multiphysics coupling simulation software to construct a multi-porous network computational model. Comprehensively considering the fluid flow, surface tension, and pressure fields, the Level Set method was introduced to track liquid–gas interface evolution. The model incorporated material physical parameters (density, viscosity, surface tension coefficient, etc.) and considered the wetting angle at the solid–liquid interface. A time-dependent solver was employed for numerical calculations to simulate copper infiltration behavior in sintered steel.

3. Results

3.1. Characterization of the Pore Structure of Sintered Steel

Three-dimensional reconstruction and pore extraction analysis of CT scanning data revealed the authentic three-dimensional morphological characteristics of internal pores in specimens of varying densities, as shown in Figure 1. The image demonstrates a distinctive pore distribution, and the colors of the pores distinguish between different, interconnected pores.
To elucidate the spatial distribution characteristics and connectivity of internal pores, the Maximum Ball algorithm was applied to the three-dimensional reconstructed matrix, successfully extracting precise morphological features of interconnected pores and establishing a corresponding sphere-stick model. In this model, spheres of different colors represent varying sizes, with red spheres denoting the largest, followed by yellow, green, and blue spheres in descending order. Red rods connecting spheres at both ends represent throats, simplifying the complex pore network into a regularized three-dimensional structural model composed of spheres and rods, as illustrated in Figure 2. The M-1 specimen exhibits a highly interconnected structural characteristic, with large pores (red spheres) occupying central positions in the pore network, accompanied by densely distributed throat connections characterized by relatively uniform pore sizes of medium scale and good inter-pore connectivity. In contrast, the pore network structure of M-2 tends towards densification, featuring spheres with a more extensive spatial distribution that forms a relatively uniform spatial arrangement while maintaining moderate connectivity. Conversely, the pore network structure of M-3 exhibits a pronounced sparsification characteristic, with an increased proportion of small pores primarily distributed along the network periphery.
The pore throat size denotes the diameter of the narrow constrictions (throats) connecting larger pores. Figure 3 shows the distribution of pore and throat sizes in matrix samples of varying densities. In M-1, pores within the 90–110 μm range are most prevalent, with 76.47% of pores falling below 110 μm and 94.12% below 150 μm. Throat sizes are predominantly distributed in the 10–30 μm interval. As the density increases to 6.75 g/cm3, M-2 exhibits a notable shift in pore size distribution, with pores between 30–40 μm most abundant. The cumulative number of pores within 50 μm accounts for 88.94% of the total, and throat sizes are mainly concentrated in the 10–20 μm range. In M-3, pores between 30–40 μm continue to dominate, with 91.98% of pores accumulated within 50 μm. Throat sizes are primarily distributed in the 7–17 μm range, displaying a highly concentrated size distribution characteristic.
A comparison of the sphere-stick model and three-dimensional characteristics of the matrix pores reveals that, as density increases, the spheres representing pores and the connecting rods representing channels exhibit a significant trend of size reduction. Large pores predominate in the M-1 sample, with a density of 6.55 g/cm3, but their overall number is relatively low, with poor spatial distribution uniformity. As the density increases to 6.75 g/cm3, the M-2 sample shows a tendency towards uniformization and dispersion of pore distribution, accompanied by a notable reduction in maximum pore and throat sizes and an increase in pores and throats. In the M-3 sample, with a density of 6.95 g/cm3, the material exhibits not only a lower pore distribution density and smaller pore sizes but also features isolated ultra-small pores in the sphere-stick model, which form closed pore structures due to the absence of interconnecting channels.
Tortuosity is defined as the ratio of the actual path length a fluid travels through a porous medium to the macroscopic, straight-line distance across that medium. A key indicator of pore network complexity, tortuosity is closely related to material permeability. Lower tortuosity signifies more direct transport pathways, leading to enhanced material permeability and, consequently, more efficient fluid transport, especially for liquid metals. Figure 4 provides a schematic representation of the tortuosity framework, visually illustrating the spatial distribution characteristics of the pore channels. The M-1 sample exhibits a relatively regular and uniformly distributed channel network. In contrast, the pore channel networks of samples M-2 and M-3 display pronounced twisted and deviated characteristics, where the highly bent transport paths inevitably increase the flow resistance of the liquid metal, thereby diminishing the permeation efficiency.
Table 2 presents the results of the tortuosity calculations, highlighting the intrinsic relationship between the pore channel characteristics of samples with different densities and their permeation behaviors. A comparative analysis reveals that the M-2 sample, with a density of 6.75 g/cm3, exhibits a unique tortuosity distribution: despite having a maximum tortuosity value of 6.44, significantly higher than that of the M-1 sample (5.10), its average tortuosity is only 1.08, the lowest among the three groups of samples. This distinctive tortuosity distribution aligns well with its micro-network topological parameters, ensuring sufficient connectivity while avoiding excessively convoluted permeation paths. When the matrix density increases to 6.95 g/cm3 (M-3 sample), although the maximum tortuosity decreases to 3.67, the average tortuosity increases significantly to 2.26, the highest among all samples. As sintering density increases, larger pores tend to close preferentially, retaining mainly small channels with high tortuosity, which shifts the tortuosity distribution towards higher values overall. In contrast, despite having a larger pore volume fraction, the M-1 sample (6.55 g/cm3) exhibits a moderate tortuosity level of 1.38 and a more dispersed pore size distribution, failing to form an efficient permeation channel network.
The M-2 sample provides the ideal microchannel environment due to its moderate pore network structure and optimized tortuosity distribution. Together, these create optimal conditions for the uniform permeation of liquid copper and fundamentally determine the final infiltration quality. Consequently, the density condition of 6.75 g/cm3 offers a suitable pore network structure and, more importantly, an optimized tortuosity distribution that provides the best microchannel environment for uniform liquid copper permeation, which is crucial for enhancing the final infiltration quality.

3.2. Pore Evolution of Sintered Steel After Copper Infiltration

The evolution of the pore structure of the three samples after copper infiltration is shown in Figure 5. The metallographic images demonstrate significant differences in the distribution and morphology of the pores (black areas) as the matrix porosity and the amount of infiltrated copper vary. As the matrix density increases (M-1 to M-3), the number and size of the pores gradually decrease, and their distribution becomes more uniform, indicating that a matrix with lower porosity has a finer pore structure. At 5 wt% copper infiltration, the large pores in all three samples significantly diminish due to enhanced pore connectivity. This suggests that molten copper primarily concentrates along highly connected pathways without achieving complete infiltration. As copper infiltration increases to 10 wt%, small pores in M-1 and M-3 samples become filled, with capillary forces facilitating the migration of molten copper from large pores toward connected smaller pores. At this stage, large pores in M-2 are gradually eliminated, preferentially filling with molten copper, thereby enhancing the continuity of inter-pore pathways. The black pore regions transform from large contiguous distributions to scattered areas, particularly at pore edges and throat transition points. When copper infiltration is further increased to 15 wt%, pores in M-2 and M-3 are substantially filled, although some large pores remain difficult to infiltrate. In contrast, the lower-density M-1 remains unable to entirely fill all pores at this stage. At 20 wt% copper infiltration, residual pores further decrease and exhibit small, dispersed morphologies, with M-2 and M-3 samples approaching complete filling, whereas M-1 still retains several smaller pores. The significant increase in copper infiltration accelerates the completion of the capillary filling process. It enhances the diffusion wetting effect, thereby promoting progressive pore filling and ultimately achieving high densification of the matrix.
Furthermore, the morphological characteristics and residual distribution of pores are significantly influenced by matrix density [21]. In M-1, residual pores predominantly exist in larger, block-like forms, mainly concentrated in irregular regions of the pore network, areas with geometric mutations in the throats, and at the edges where the pressure field is weaker. This suggests that, while a high-porosity matrix offers better connectivity, it is more likely to retain pores in complex geometrical structures. In contrast, M-3 features residual pores that are small and dispersed, with a more uniform distribution, indicating a significant improvement in the infiltration efficiency of molten copper, effectively filling most of the fine pores. Ultimately, the microstructure reveals that, in low-porosity matrices, pores are highly homogenized and connectivity is reduced, resulting in greater densification. The characteristics of the pore structure directly determine the filling mechanism and efficiency of copper infiltration. In the M-1 sample, the larger number of pores with good network connectivity results in the capillary filling mechanism predominance during infiltration, characterized by high filling efficiency, rapid formation of connected paths, and a significant reduction in the pressure gradient. In contrast, in the M-2 and M-3 samples, the more uniform pore distribution and dominance of small pores lead the copper infiltration process to rely more on the diffusion mechanism.
In the in-depth examination of how copper infiltration quantity affects the pore evolution mechanism, the 10 wt% copper infiltration stage marks a critical transition in pore structure. A more thorough analysis of the pore structure in samples at this infiltration level is warranted. Figure 6 shows the three-dimensional morphological characteristics of the pores in the samples following 10 wt% copper infiltration.
The samples treated with copper infiltration (I-1, I-2, and I-3) exhibit distinct differences in pore size characteristics. Figure 7 shows the pore size distribution of the samples after copper infiltration, revealing a significant reduction in the total number of pores. In Figure 7, the purple and green dashed boxes represent the distribution probability for pore sizes < 10 μm and <30 μm, respectively. This phenomenon is reflected in the notable decrease in the slope of the cumulative distribution curve, indicating that the pore size distribution tends towards homogenization. The copper infiltration treatment substantially alters the distribution pattern of pore sizes. Quantitative analysis reveals that, in sample I-1, micro-fine pores (size < 10 μm) account for 52.30%, while medium-sized pores (10–30 μm) constitute 33.27%. In I-2, these proportions decrease to 22.03% and increase to 58.25%, respectively. I-3 exhibits similar distribution characteristics to I-2, corresponding to 22.03% and 54.91%. This significant evolution of pore characteristics can be attributed to the selective filling mechanism of molten copper, where, under the driving force of capillary action, molten copper preferentially infiltrates well-connected pore networks. In contrast, locally isolated closed pores are difficult to fill.
Further analysis of the pore network’s neighbor count at this copper infiltration level was conducted. The neighbor count is a crucial parameter for evaluating the topological structure of the pore network, representing the number of connections each pore has with a throat, thereby reflecting pore connectivity. Figure 8a,b display the probability distribution graphs of the neighbor counts for the samples. In the sintered samples, the proportion of pores with a neighbor count of 0 indicates the presence of closed pores, suggesting that some pores are isolated and unfavorable for infiltration. The neighbor count gradually increases from 0 to 2, reaching its highest probability at a neighbor count of 2, indicating that most pores are connected to two throats, forming a relatively compact structure. The primary coordination range spans from 1 to 5, accounting for 85% of the total pores. As sintering density increases, the neighbor counts’ distribution curve shifts towards lower values, and the proportion of pores with high neighbor counts decreases from 6.84% in M-1 to 4.12% in M-3. This suggests that the densification process significantly reduces the overall connectivity of the pore network, which can be attributed to the preferential elimination of large pores with higher neighbor counts during sintering, resulting in decreased overall connectivity.
The samples after copper infiltration exhibit significantly different neighbor count distribution characteristics, as shown in Figure 8b. The most notable change is the substantial increase in the proportion of isolated closed pores with a neighbor count of 0, with the closed pore rate decreasing as matrix density increases. Specifically, the closed pore ratio is highest in sample I-1 at 31.46%, followed by I-2 at 23.88%, and lowest in I-3 at 18.01%. This significant increase in the closed pore rate suggests that the molten copper disrupts the original pore connectivity network during infiltration, forming numerous unconnected “island” structures. The low-density sample (M-1) has a more extensive pore network, which makes the “encapsulation-segmentation” effect more pronounced during the copper infiltration process. In contrast, the high-density sample (M-3), due to fewer initially connected pores, experiences a relatively limited network segmentation effect during copper infiltration, resulting in a lower closed pore rate. The peak of the neighbor count distribution shifts from 2 before copper infiltration to 1 afterward, indicating that mainly terminal-type pore structures remain. The correlation between neighbor count and pore radius significantly weakens after copper infiltration, indicating a high selectivity of the copper infiltration process regarding pores of different sizes.
Comparative analysis shows that, under the same neighbor count conditions, the average radius of residual pores after copper infiltration is reduced by 43.6% compared to before infiltration. This phenomenon can be attributed to the competitive effects between the small pore preferential filling mechanism driven by capillary action and the topological characteristic of large pores preferentially connecting. Molten copper preferably fills large pores with high neighbor counts and, due to capillary forces, fills some of the small pores connected to them, resulting in some low neighbor count small pores being isolated into unconnected closed pore structures.
The sphericity of the sample pores is defined as the ratio of the surface area of a unit volume sphere to the surface area of the pore. The closer this value is to 1, the more regular the pore morphology; values approaching 0 indicate highly irregular or rough pore shapes. Figure 8c,d show the sphericity distribution characteristics of sintered matrix samples with different densities, revealing a density-dependent effect. As the density increases from 6.55 g/cm3 to 6.95 g/cm3, the sphericity distribution curve shifts toward the higher value region, reflecting the spontaneous evolution trend of pore morphology driven by the principle of surface energy minimization during the sintering process. Particularly in the sphericity range of 0.6–0.8, the M-3 sample (6.95 g/cm3) shows the highest probability distribution. This phenomenon of increasing sphericity with density can be explained in two ways: first, the surface diffusion and volume diffusion mechanisms during sintering promote material migration along the surface energy gradient [22], spontaneously reducing the system’s free energy and driving the pore morphology toward regularization; second, the high-density sintering process preferentially eliminates irregular large-sized pores and connected channels, mainly retaining relatively independent near-spherical pores.

3.3. Copper Infiltration Process Simulation

The dynamic viscosity and density of the infiltration agent in the high-temperature liquid phase were determined through thermodynamic calculations to determine the rheological characteristics of the copper infiltration agent during the infiltration process. At 1120 °C, the molten infiltration agent has a viscosity of 3.83 mPa·s, a density of 7.916 g/cm3, and a surface tension of 1.268 N/m.
Due to the one-sided nature of two-dimensional images in reflecting the overall characteristics of pore channels, studying the infiltration behavior of liquid metal in the pore network of sintered steel requires three-dimensional simulation technology. For this purpose, actual three-dimensional pore structures were obtained through CT scanning, and flow analysis was conducted based on this data. However, the highly complex nature of micron-scale pore structures in CT data can lead to problems of poor mesh quality and low computational efficiency in direct numerical simulation. Therefore, preprocessing of the three-dimensional reconstruction model is necessary to ensure the accuracy and operability of the flow simulation. As shown in Figure 9, the preprocessing workflow includes: (1) optimization of the model surface; (2) adaptive mesh generation with quality control; and (3) flow analysis of the processed model to obtain the dynamic fluid distribution within the connected pores.
The sintered steel was modeled as a two-phase medium consisting of an iron matrix and pores, with molten copper continuously infiltrating and filling the pore network. The mesh generation in the simulation was optimized by employing differentiated mesh strategies for regions of varying sizes: extremely fine meshes were used for pore areas with diameters less than 5 μm; relatively coarse meshes were applied to the interiors of larger pores; and boundary layer meshes were utilized for the pore wall regions, regardless of size. With the Z direction designated as the infiltration direction, boundary conditions were established: the top and bottom faces of the Z-axis were set as the inlet and outlet, respectively, while the side faces were treated as free-slip walls, and the remaining inner walls were assigned no-slip conditions. Based on the established pore network model, the two-phase flow simulation results revealed the intrinsic mechanisms of infiltration dynamics. In the simulation, red color represents the liquid phase (Φ = 1), blue color represents unfilled pores (Φ = 0), and the intermediate transition zone (0 < Φ < 1) contains both phases, reflecting the dynamic evolution of infiltration within the internal structures of the three sintered steel samples.
Figure 10 illustrates the dynamic evolution of molten copper during the infiltration process in the three samples, clearly demonstrating typical percolation instability phenomena. Observations reveal that molten copper exhibits distinct selective characteristics in the initial stages of infiltration, preferentially expanding along pore networks with higher connectivity. This pattern fully embodies the dominant effect of capillary action. As the infiltration process progresses, molten copper exhibits a trend of gradual downward progression from the top, simultaneously infiltrating along multiple parallel channels, forming a characteristic “advancing percolation” mode with its fluid front maintaining a relatively regular morphology. This infiltration behavior directly correlates with the high degree of pore connectivity within the material.
Notably, significant preferential flow phenomena are observable in the areas marked by dashed circles in Figure 10(a1,b1,c1). These regions rapidly develop into local “fast channels”, through which molten copper, driven by capillary forces, gradually expands and infiltrates the secondary pore networks on both channels. This process progressively constructs a hierarchical, dendritic percolation structure, whose morphological characteristics closely resemble the well-studied “fingering effect” in porous media [23]. This non-uniform percolation pattern results in certain pore regions being “bypassed” or “surrounded”, ultimately forming isolated pore areas that are difficult to fill in later stages, as illustrated in Figure 10(a3,b1,c1).
Figure 11 illustrates the molten copper’s velocity streamline distribution characteristics in three matrix samples with different densities, and the overall blue color represents the velocity of the copper melt flow. As the matrix density increases from 6.55 g/cm3 to 6.95 g/cm3, the flow paths of molten copper exhibit significant evolution: in the M-1 sample, streamlines are distributed chaotically with winding and tortuous paths; in the M-2 sample, streamlines gradually converge; while in the M-3 sample, streamline paths are most concentrated and distinct. Among these, the average pore diameters of the paths with the highest percolation velocities are 23.76 μm (M-1), 18.17 μm (M-2), and 10.52 μm (M-3), respectively. The red dashed boxes represent high-velocity flow regions of molten copper in the porous medium, revealing the selective filling mechanism of molten copper. The formation of preferential flow channels originates from the geometric heterogeneity of the pore structure, and high-speed regions indicate that molten copper tends to selectively fill larger pores with lower flow resistance and better geometric connectivity.

4. Discussion

In summary, traditional metallographic analysis typically offers only localized 2D information regarding pore morphology on polished material surfaces. This approach inherently possesses significant limitations in comprehensively and precisely characterizing the complex topological structure of 3D pore networks, particularly in revealing key 3D features such as pore connectivity, spatial distribution heterogeneity, and morphological anisotropy. In contrast, 3D imaging and analysis based on X-ray CT technology can non-destructively and systematically unveil detailed 3D structural information of internal pores within materials like sintered steel. This includes, for instance, distributions of pore size and volume fraction, tortuosity, connectivity parameters, and local morphological characteristics. These precise 3D microstructural parameters not only enable the accurate quantitative description of the complex geometric properties of the pore network but, more critically, they provide an actual, digitized pore structure basis for a deeper understanding of the complex flow behavior of fluids, such as molten copper, within multi-scale porous media.
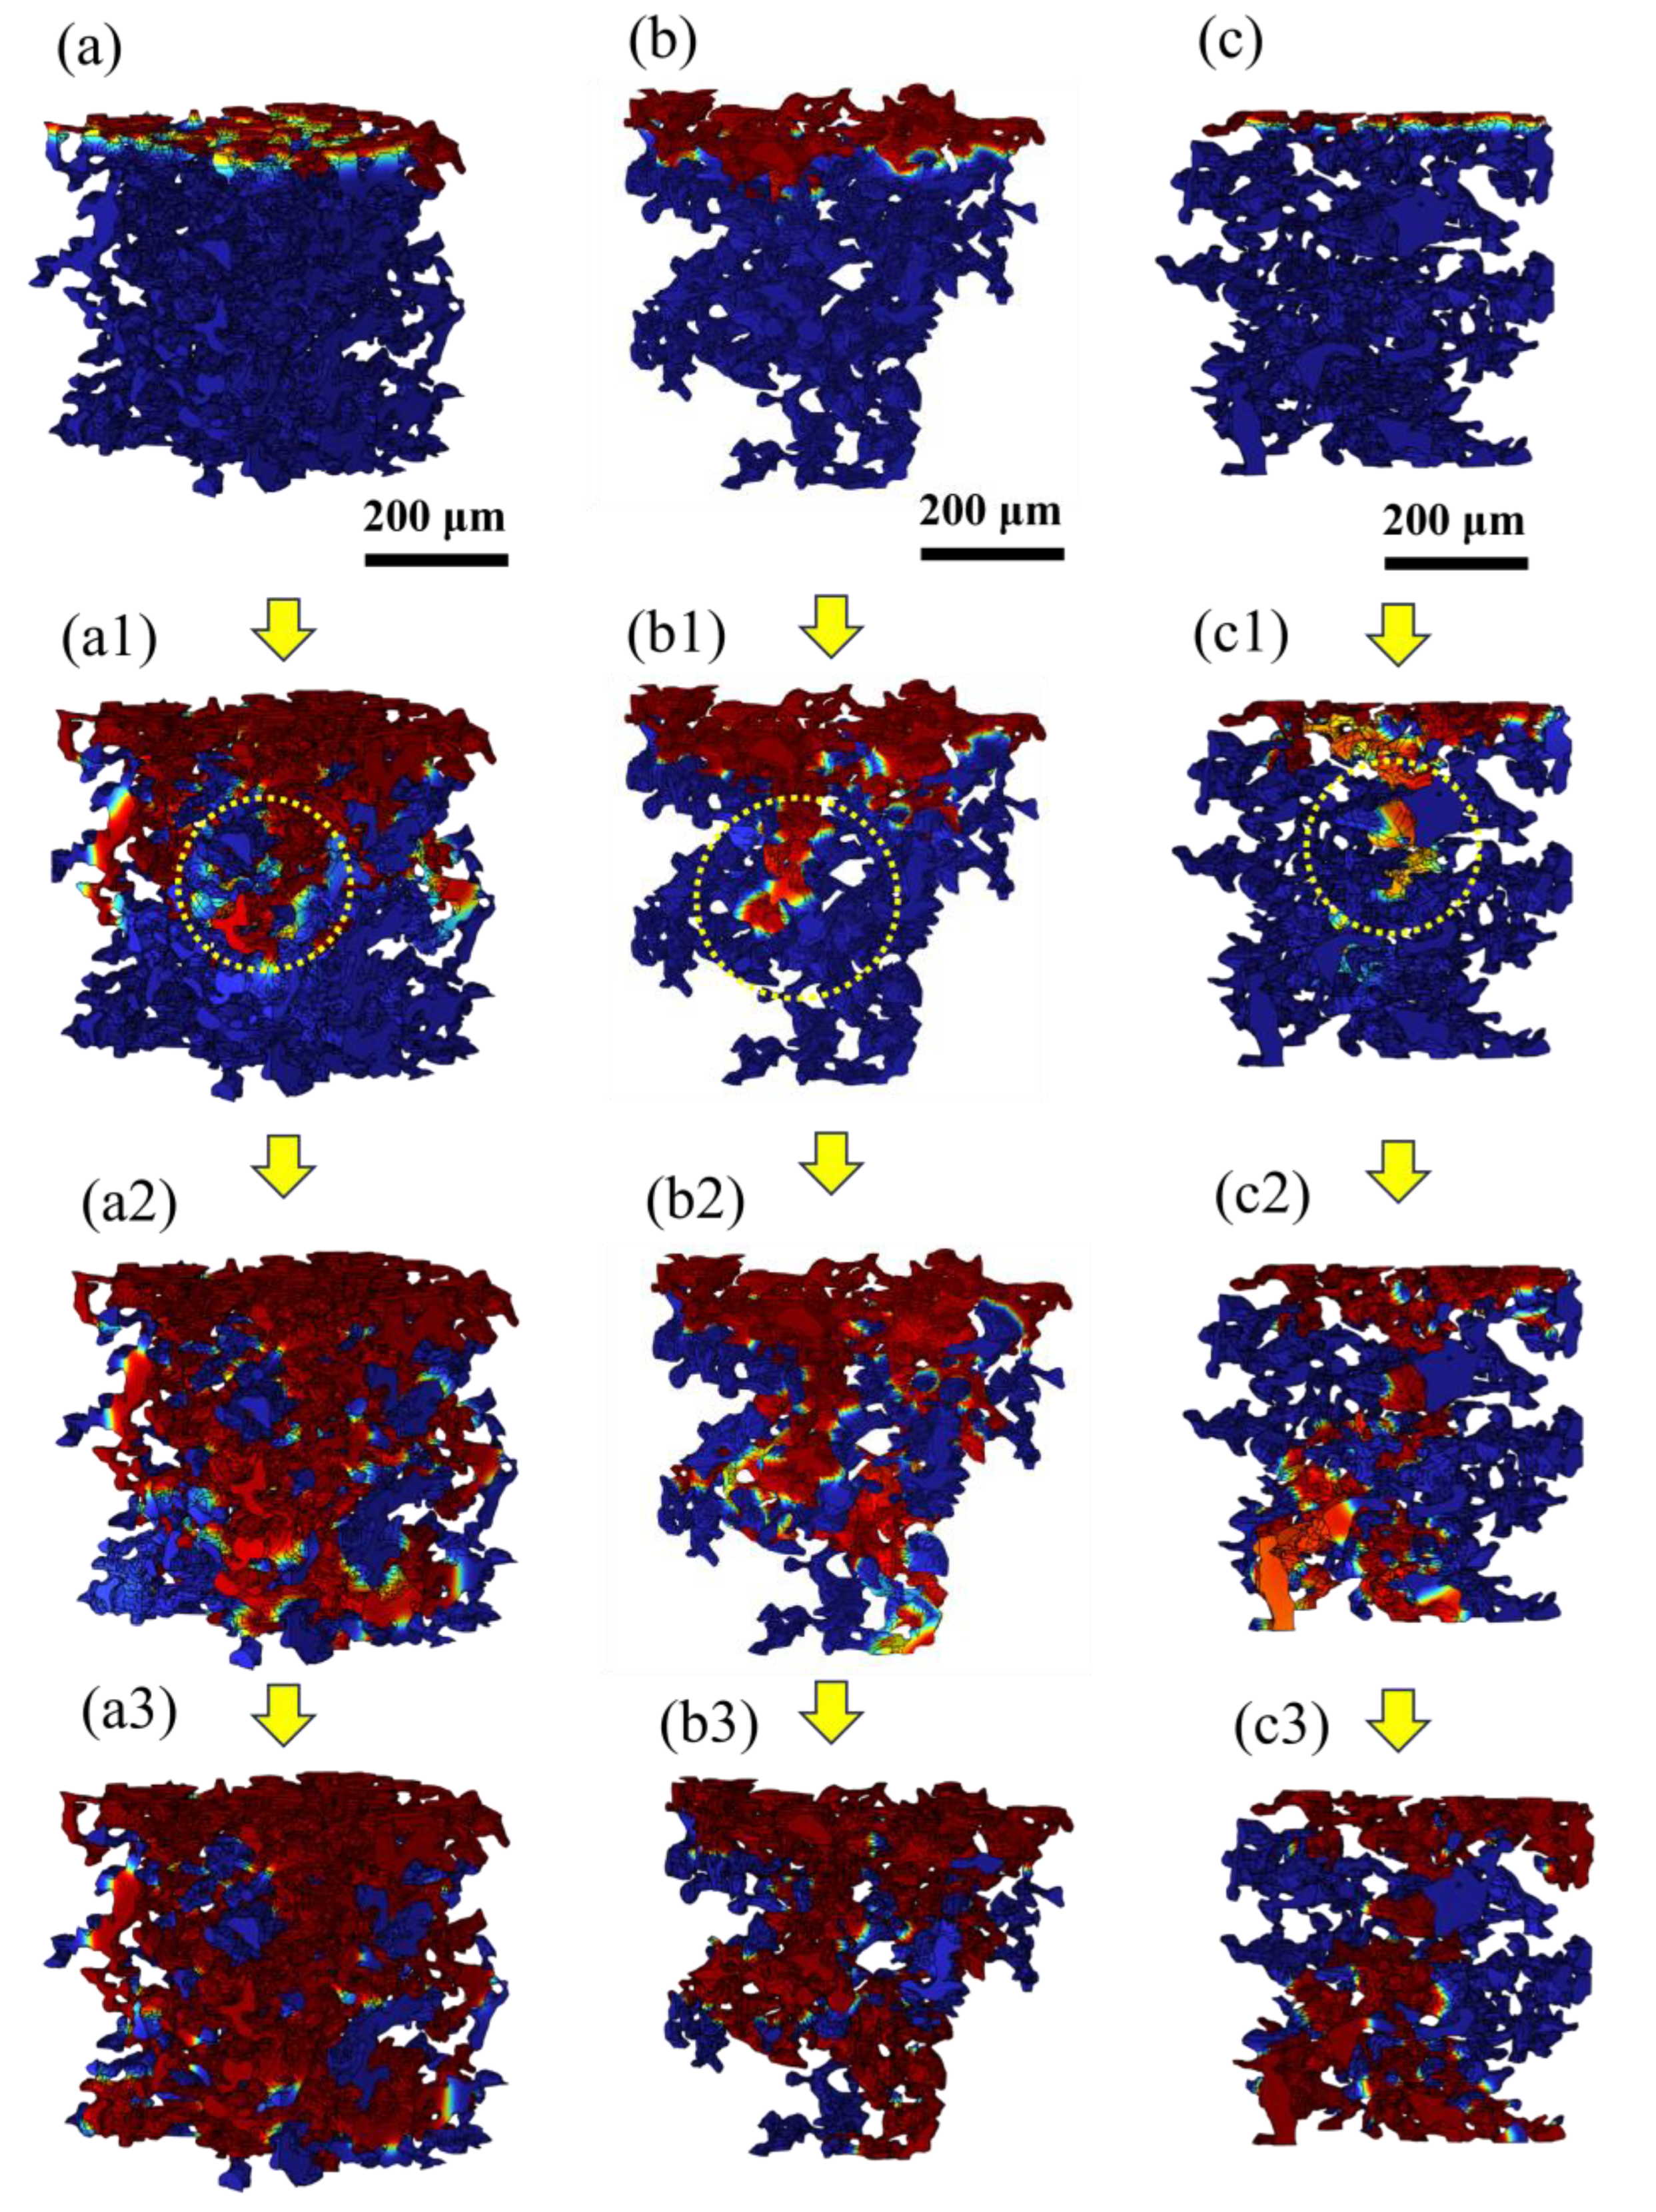
Detailed simulation analysis of the copper infiltration process reveals that the penetration process exhibits distinct heterogeneity in the initial infiltration stage, with significant differences in fluid distribution between pores. As the copper infiltration progresses, molten copper gradually expands into a more extensive pore network. The increasingly active migration behavior of copper liquid between pores forms interconnected channels that significantly enhance overall fluidity and infiltration efficiency. When copper infiltration flow reaches a relatively stable state, although most pores have been effectively filled with copper liquid, some residual pores remain concentrated in the peripheral areas of the pore network, geometric dead corners, and areas of pore throat transitions [24]. These microscopic regions exhibit significant infiltration inhibition characteristics, with different formation mechanisms.
In the peripheral areas of pores, fluid flow is restricted by complex geometric boundary conditions, resulting in significantly limited penetration capability; in dead corner positions, the sharp reduction in fluid turbulence characteristics further inhibits effective penetration dynamics; while at pore throat transition locations, the abrupt increase in flow resistance caused by sudden changes in structural cross-sections makes it difficult for the liquid phase to diffuse efficiently. These irregular geometric features work together, making it difficult for residual gas to be expelled entirely from the system, ultimately forming dispersed block-like closed pore structures within the material [25,26,27,28]. Notably, the morphological characteristics and residual distribution of pores are significantly influenced by matrix density. In the low-density matrix (M-1), residual pores primarily exist as larger block-like formations, mainly concentrated in irregular areas of the pore network, geometric transitions of throats, and edge positions with relatively weak pressure fields. This phenomenon indicates that, although low-density matrices have better overall connectivity, they are also more prone to leaving unfilled pores in complex geometric structures. In contrast, in high-density matrices (M-3), residual pores exist only in fine and dispersed forms with more uniform spatial distribution, clearly indicating that the infiltration efficiency of liquid copper is significantly improved, capable of effectively filling most of the fine pore network. The ultimately formed microstructure confirms that pores in low-porosity matrices are highly uniform in distribution with notably reduced connectivity, thereby achieving more ideal material densification.
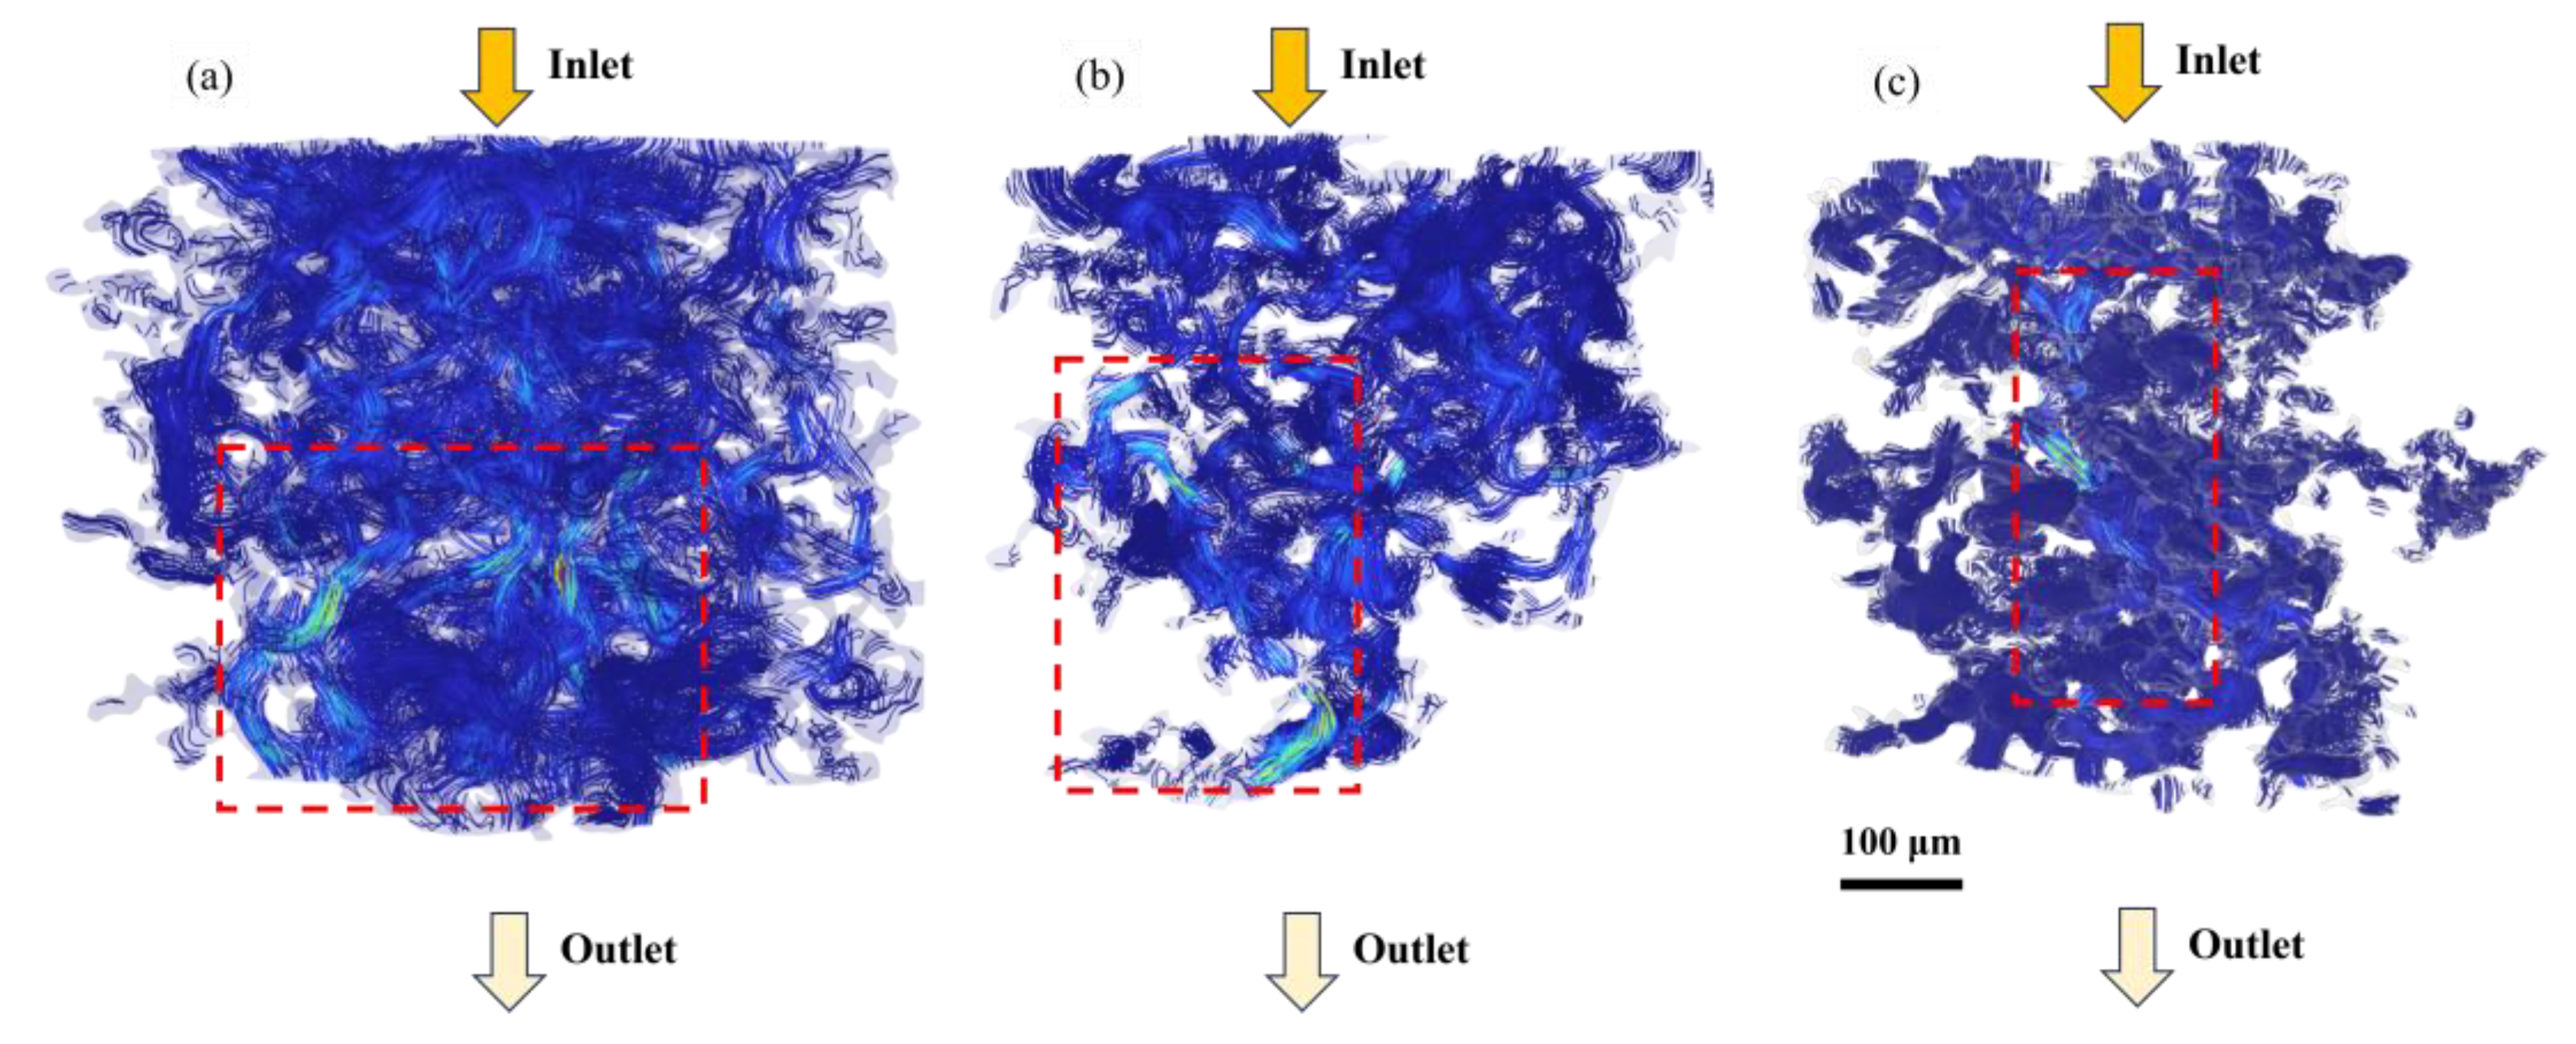
Comprehensive simulation analysis results indicate that the copper infiltration stage exhibits significant selective filling characteristics of molten copper, with the infiltration behavior of molten copper in sintered steel pores showing typical preferential flow phenomena. Further simulation analysis results of different density matrices (M-1 to M-3) reveal that the average pore diameters of preferential flow channels are 23.76 μm, 18.17 μm, and 10.52 μm, respectively, all concentrated in the medium range of 10–30 μm pore sizes. These pores generally have higher geometric connectivity (neighbor count ≥ 3) and moderate pore diameters, thus forming channels with lower flow resistance, with this flow behavior mainly controlled by the synergistic effects of pore connectivity, size effects, and capillary forces.
Although larger pores (>30 μm) theoretically have higher infiltration flux potential, their relatively lower capillary pressure results in insufficient driving force, while smaller pores (<10 μm), despite significantly enhanced capillary pressure, are limited by the multiplied viscous resistance caused by excessively narrow pore throats, actually resulting in reduced infiltration rates. Therefore, medium-sized pores of 10–30 μm, combining moderate capillary driving force with flow efficiency, become molten copper’s main preferential infiltration pathways.
Connectivity is another key factor affecting selective filling. Pore structures with neighbor counts ≥ 3 exhibit obvious preferential filling tendencies during the copper infiltration, with filling rates 43.7% higher than low-coordination pores (≤2). Even if some channels are blocked by early copper liquid filling, pore structures with high neighbor counts still have alternative pathways to ensure continuous liquid phase penetration. In contrast, isolated pores and terminal pores, due to the lack of effective liquid phase supply pathways, have significantly reduced filling rates and thus remain in higher proportions in post-infiltration samples.
Additionally, selective filling characteristics manifest in the behavioral pattern of molten copper preferentially filling the sharp corners and edges of pores. Regions with smaller radii of curvature generate more significant capillary pressure [
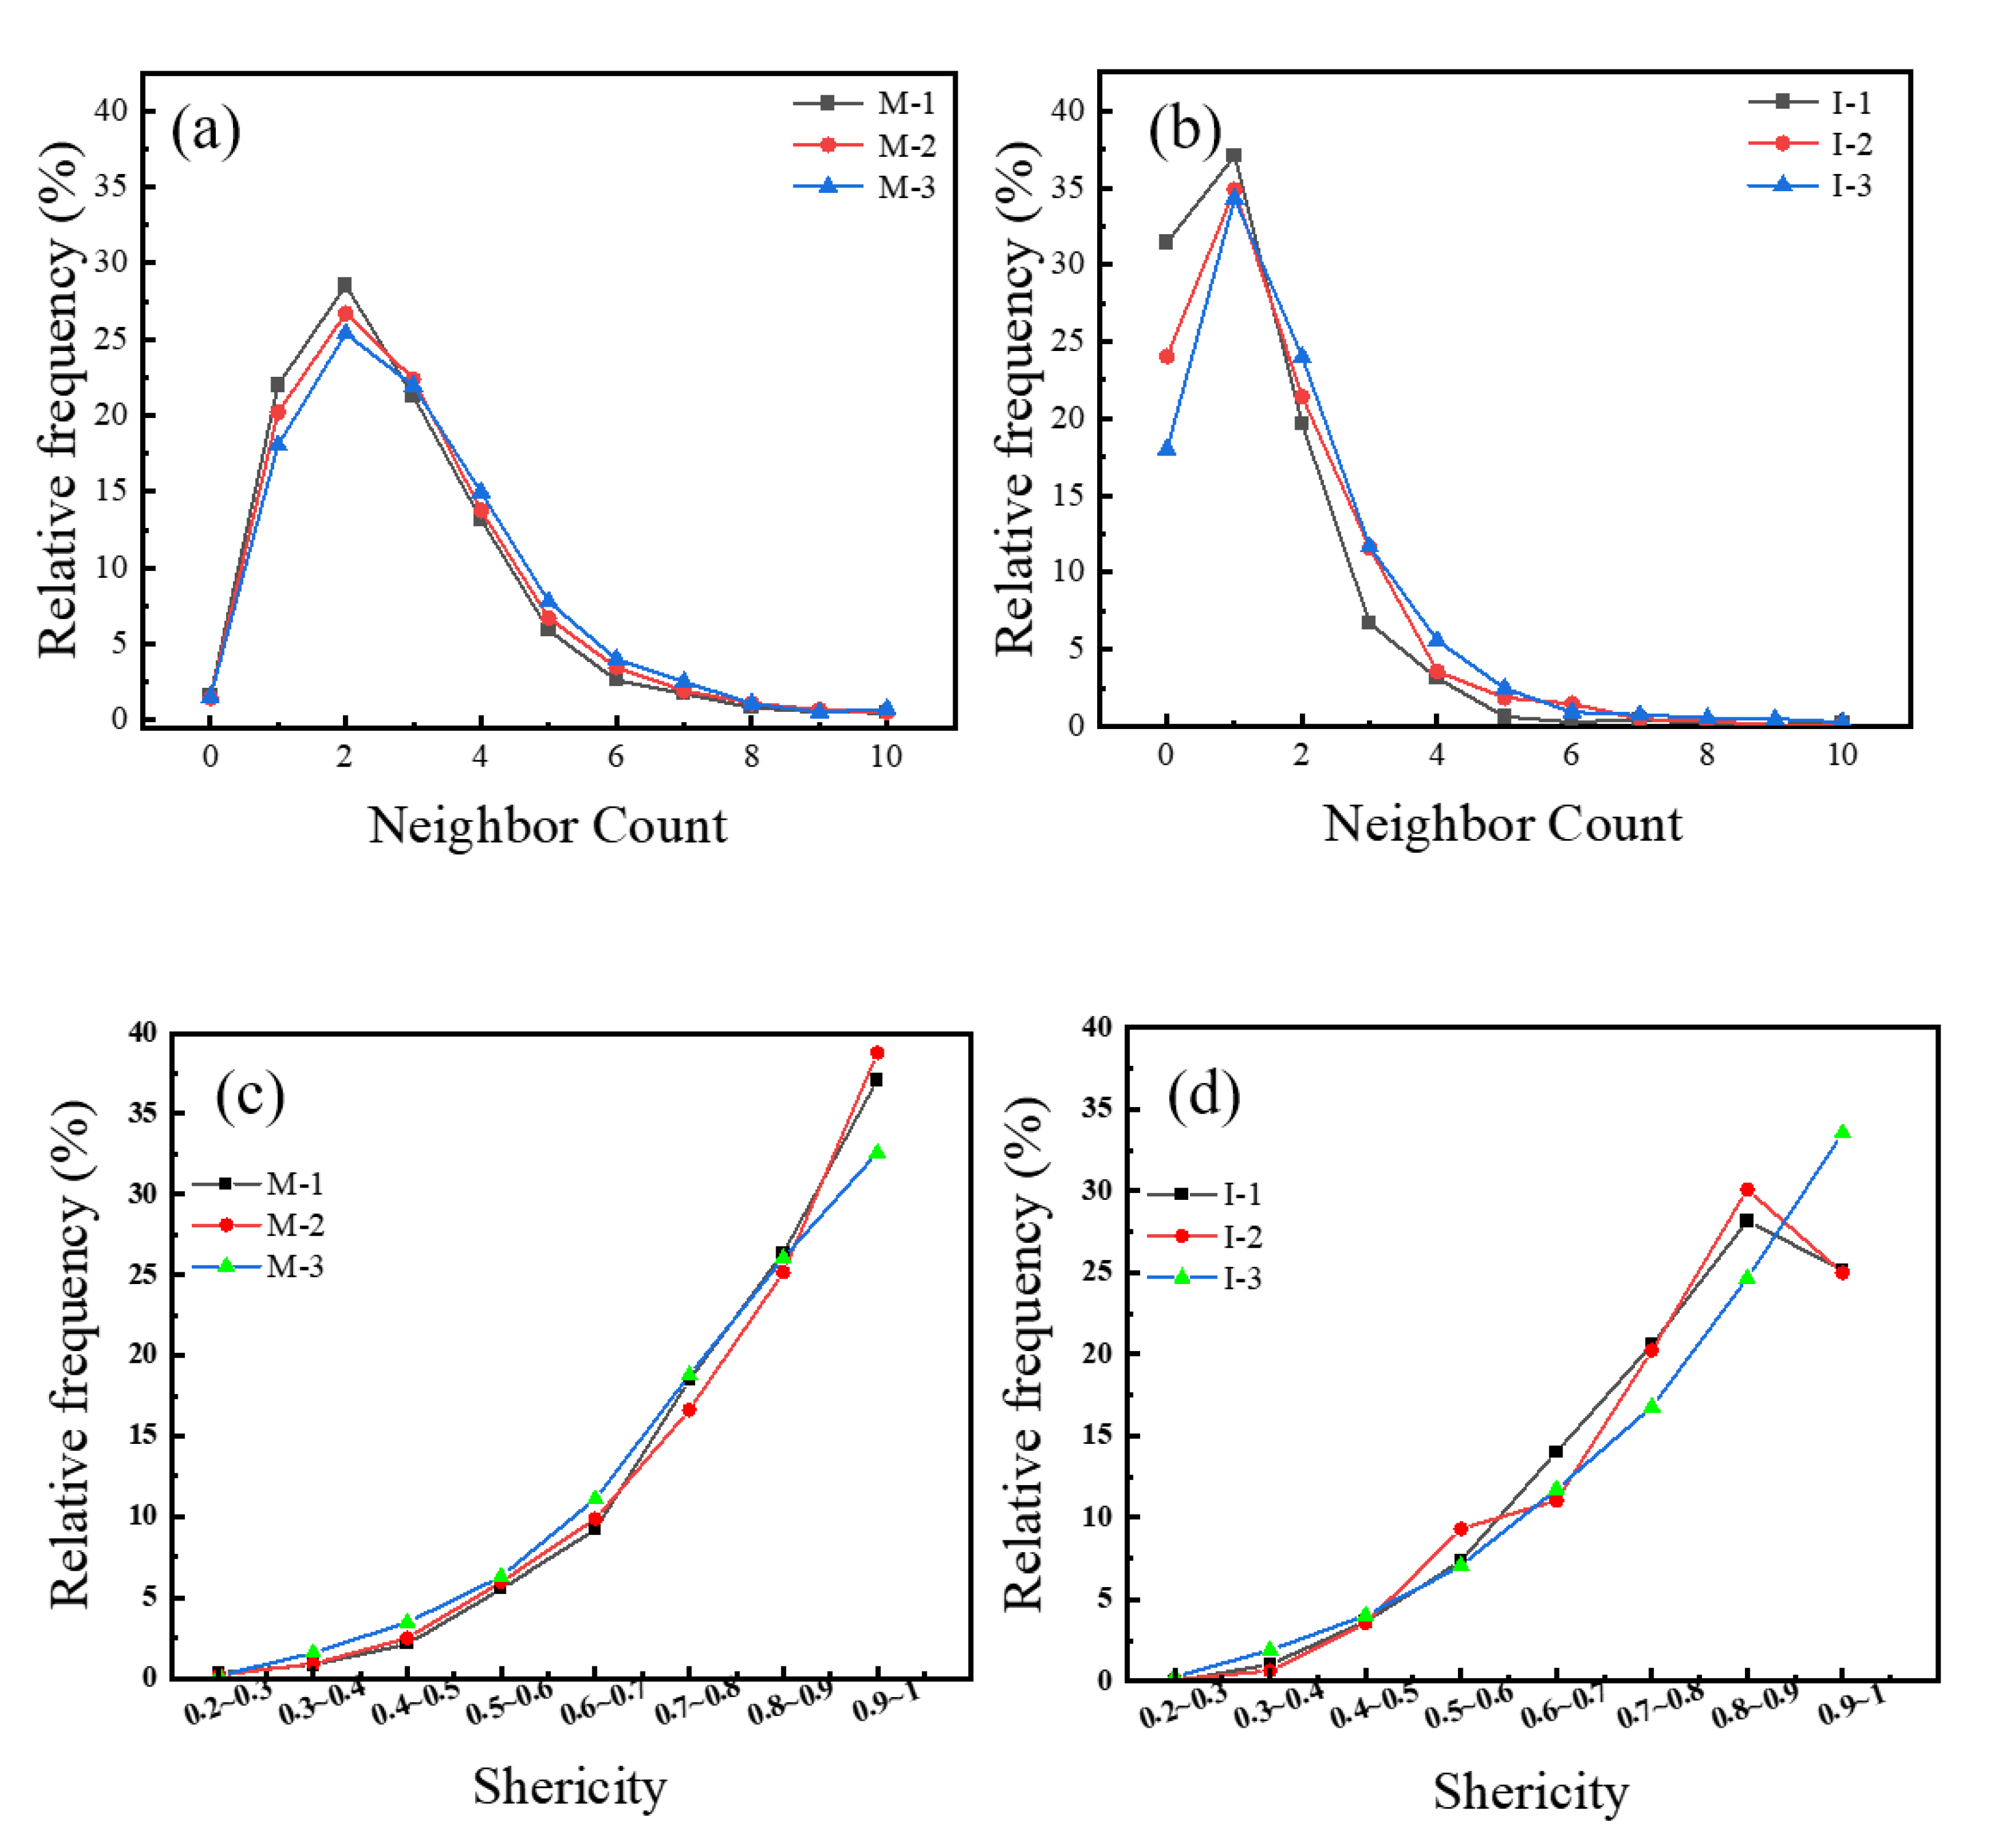
29], thus copper liquid preferentially penetrates the depressed areas and sharp corners of irregular pores. This selective filling behavior promotes the gradual regularization of residual pore morphology, with sphericity average values significantly increasing from 0.67–0.76 before copper infiltration to 0.78–0.84 after infiltration. Among these, the high-density sample (I-3) shows the highest probability distribution in the sphericity range of 0.7–0.9, indicating that tightly packed pore structures are more conducive to forming uniform and regular residual pore morphologies.

5. Conclusions

This research established pore network models through three-dimensional non-destructive characterization of sintered steel pore structures, statistically analyzing parameters such as pore count, pore radius, and neighbor count to characterize pore structure and topological features quantitatively, and conducted microscale simulations of the copper infiltration process in sintered steel. The research conclusions are as follows:
  • The pore structure of the sintered matrix exhibits significant density-dependent characteristics. As density increases from 6.55 g/cm3 to 6.95 g/cm3, the average pore size monotonically decreases from 35.7 μm to 17.2 μm. Statistical analysis of pore size distribution indicates that the densification process preferentially eliminates large-sized pores. Three-dimensional network analysis shows that neighbor count follows a “rise-then-fall” trend with density changes, reaching optimal coordination distribution at a density of 6.75 g/cm3; sphericity increases monotonically with density (from 0.69 to 0.76). Under the moderate density condition of 6.75 g/cm3, the specimen exhibits an average tortuosity of only 1.08, with the number of pores, size, and connectivity reaching an optimal balance, providing the most favorable microscopic channels for uniform infiltration of molten copper.
  • Copper infiltration significantly alters the pore characteristics of the material, manifested as reduced total pore count, decreased distribution uniformity, increased proportion of closed pores, and regularization of morphology. The reduction ratio of high neighbor count pores before and after copper infiltration is significantly higher than the reduction ratio of total pores, indicating that copper liquid preferentially infiltrates highly connected pore networks, and molten copper preferentially fills irregular angular portions, with residual pores tending toward regularization.
  • The copper infiltration process exhibits significant selective filling characteristics, primarily controlled by pore connectivity, size effects, and capillary forces. Medium-sized pores (10.52–23.76 μm) with good connectivity are preferentially filled with copper liquid, mainly attributed to their combination of low fluid resistance and moderate capillary driving force.

Author Contributions

Investigation, P.L. and S.L.; writing—original draft, P.L.; visualization, P.L.; methodology, L.W. (Linshan Wang), S.L., X.L., Q.H., L.W. (Limin Wang) and X.Q.; project administration, L.W. (Linshan Wang) and L.W. (Limin Wang); writing—review and editing, L.W. (Linshan Wang), S.L., X.L., Q.H., L.W. (Limin Wang) and X.Q. All authors have read and agreed to the published version of the manuscript.

Funding

This research received no external funding.

Data Availability Statement

The original contributions presented in this study are included in the article. Further inquiries can be directed to the corresponding author.

Conflicts of Interest

Authors Linshan Wang, Xuebing Liang and Qiang Hu were employed by GRIPM Advanced Materials Co., Ltd. and GRINM Additive Manufacturing Technology Co., Ltd. Author Pengcheng Lin and Limin Wang were employed by GRIPM Advanced Materials Co., Ltd. The remaining author declares that the research was conducted in the absence of any commercial or financial relationships that could be construed as a potential conflict of interest.

References

  1. Yang, F.; Guo, L.; Li, P.; Guo, Z. The Effect of FeS film on the surface of iron powder particles on mechanical properties and fracture of Fe-Cu-C alloys. Powder Metall. 2016, 59, 376–383. [Google Scholar] [CrossRef]
  2. Taub, A.; Moor, E.D.; Luo, A.; Matlock, D.K.; Speer, J.G.; Vaidya, U. Materials for automotive lightweighting. Annu. Rev. Mater. Res. 2019, 49, 327–359. [Google Scholar] [CrossRef]
  3. Akhtar, S.; Saad, M.; Misbah, M.R.; Sati, M.C. Recent advancements in powder metallurgy: A review. Mater. Today Proc. 2018, 9, 18649–18655. [Google Scholar] [CrossRef]
  4. Zhang, W.; Liu, K.; Zhou, J.; Chen, R.; Zhang, N.; Lian, G. Numerical investigation into the densification of ferrous powder in high velocity compaction. Phys. Scr. 2020, 6, 65704. [Google Scholar] [CrossRef]
  5. Sundaram, M.V.; Surreddi, K.B.; Hryha, E.; Veiga, A.; Berg, S.; Castro, F.; Nyborg, L. Enhanced densification of PM steels by liquid phase sintering with boron-containing master alloy. Metall. Mater. Trans. A 2018, 49, 255–263. [Google Scholar] [CrossRef]
  6. Campos, M.; Torralba, J.M.; Oro, R.D.; Bernardo, E.; Galán-Salazar, A. New Opportunities for Low Alloy Steels—Master Alloys for Liquid Phase Sintering. Metals 2021, 11, 176. [Google Scholar] [CrossRef]
  7. Kulkarni, H.; Dabhade, V.V. Green Machining of powder-metallurgy-steels (pms): An overview. J. Manuf. Process. 2019, 44, 176. [Google Scholar] [CrossRef]
  8. Dyachkova, L.; Vityaz, P. The structure and properties formation in iron–carbon powder composite materials during infiltration. Met. Powder Rep. 2019, 74, 90–94. [Google Scholar] [CrossRef]
  9. Campos, M.; Torralba, J.M.; Menapace, C.; Molinari, A. Effect of copper infiltration on fracture mode in sintered steels. Powder Metall. 2008, 51, 176–181. [Google Scholar] [CrossRef]
  10. Oro, R.; Campos, M.; Gierl-mayer, C.; Danninger, H.; Torralba, J.M. New alloying systems for sintered steels: Critical aspects of sintering behavior. Metall. Mater. Trans. A 2015, 46, 1349–1359. [Google Scholar] [CrossRef]
  11. Geykhman, L.K.; Larinin, D.M.; Shatsov, A.A. Structurally unstable pseudoalloys powder nickel-molybdenum steel-copper. J. Alloys Compd. 2018, 767, 894–898. [Google Scholar] [CrossRef]
  12. Lin, P.; Wang, L.; Liang, X.; Hu, Q.; Wang, L.; Qu, X. Effect of pore structure on the impact toughness of copper-infiltrated sintered steel. Mater. Res. Express. 2024, 11, 036502. [Google Scholar] [CrossRef]
  13. Guo, X.; Liu, R.; Wang, J.; Shuai, S.; Xiong, D.; Bai, S.; Zhang, N.; Gong, X.; Wang, X. 3D actual microstructure-based modeling of non-isothermal infiltration behavior and void formation in liquid composite molding. Appl. Math. Model. 2021, 94, 388–402. [Google Scholar] [CrossRef]
  14. Shang, Z.; Li, T.; Yang, S.; Yan, J.; Guo, H. Three-dimensional characterization of typical inclusions in steel by X-ray Micro-CT. J. Mater. Res. Technol. 2020, 9, 3686–3698. [Google Scholar] [CrossRef]
  15. Yan, K.; Yin, T.; Sun, J.; Hong, J.; Zhu, Y. Flow mechanism characterization of porous oil-containing material base on micro-scale pore modeling. Materials 2021, 14, 3896. [Google Scholar] [CrossRef]
  16. Cai, P.; Que, Y.; Jiang, Z.; Li, X. 3D quantitative characterization and flow simulation of granite residual soil based on CT scanning. Sci. Sin. Technol. 2022, 52, 1065–1082. [Google Scholar] [CrossRef]
  17. Shigeta, Y.; Nomura, N.; Kondoh, K.; Uesugi, K.; Hoshino, M.; Aramaki, M.; Ozaki, Y. Use of X-ray CT imaging to quantitatively analyze the effects of the pore morphology on the tensile properties of CP-Ti L-PBF materials. ISIJ Int. 2024, 64, 1162–1171. [Google Scholar] [CrossRef]
  18. Li, L.; Wang, S.; Jia, W.; Luo, J.; Meng, Z.; Gou, J.; Zhou, H.; Zhong, D.; Xiu, W.; Bai, X. Mathematical model of shale oil seepage at micro-nano pore scale. Energies 2022, 15, 8041. [Google Scholar] [CrossRef]
  19. MPIF STANDARD 35-SP; Materials Standards for PM Structural Parts. Metal Powder Industries Federation: Princeton, NJ, USA, 2020.
  20. ISO 2738:1999; Sintered Metal Materials, Excluding Hardmetals—Permeable Sintered Metal Materials—Determination of Density, Oil Content and Open Porosity. ISO (International Organization for Standardization): Geneva, Switzerland, 1999.
  21. Wong-Ángel, W.D.; Téllez-Jurado, L.; Chávez-Alcalá, J.F.; Chavira-Martínez, E.; Verduzco-Cedeño, V.F. Effect of copper on the mechanical properties of alloys formed by powder metallurgy. Mater. Des. 2014, 58, 12–18. [Google Scholar] [CrossRef]
  22. Uhlmann, D.; Chalmers, B.; Jackson, K. Interaction between particles and a solid-liquid interface. J. Appl. Phys. 1964, 35, 2986–2993. [Google Scholar] [CrossRef]
  23. Zhang, C.; Oostrom, M.; Wietsma, T.W.; Grate, J.W.; Warner, M.G. Influence of viscous and capillary forces on immiscible fluid displacement: Pore-scale experimental study in a water-wet micromodel demonstrating viscous and capillary fingering. Acta Ophthalmol. 2011, 25, 3493–3505. [Google Scholar] [CrossRef]
  24. Roland, L.; Eric, T.; Cesar, Z. Numerical models and experiments on immiscible displacements in porous media. J. Fluid Mech. 1988, 189, 165–187. [Google Scholar]
  25. Molina-Jorda, J.-M.; Schneider, G.; Mortensen, A. Surface energy contributions to the work of infiltration in metal matrix composite processing. Scr. Mater. 2022, 206, 114223. [Google Scholar] [CrossRef]
  26. Varnavides, G.; Mortensen, A.; Carter, W. Simulating infiltration as a sequence of pinning and de-pinning processes. Acta Mater. 2021, 210, 116831. [Google Scholar] [CrossRef]
  27. Otaru, A.J. The permeability of replicated microcellular structures in the Darcy regime. AIChE J. 2020, 66, 16915. [Google Scholar] [CrossRef]
  28. Rathore, S.S.; Dabhade, V.V. Dimensional Change During Sintering of Fe–Cu–C Alloys: A Comparative Study. Trans. Indian. Inst. Met. 2016, 69, 991–998. [Google Scholar] [CrossRef]
  29. Shangguan, D.; Ahuja, S.; Stefanescu, D.M. An analytical model for the interaction between an insoluble particle and an advancing solid/liquid interface. Metall. Mater. Trans. A 1992, 23, 669–680. [Google Scholar] [CrossRef]
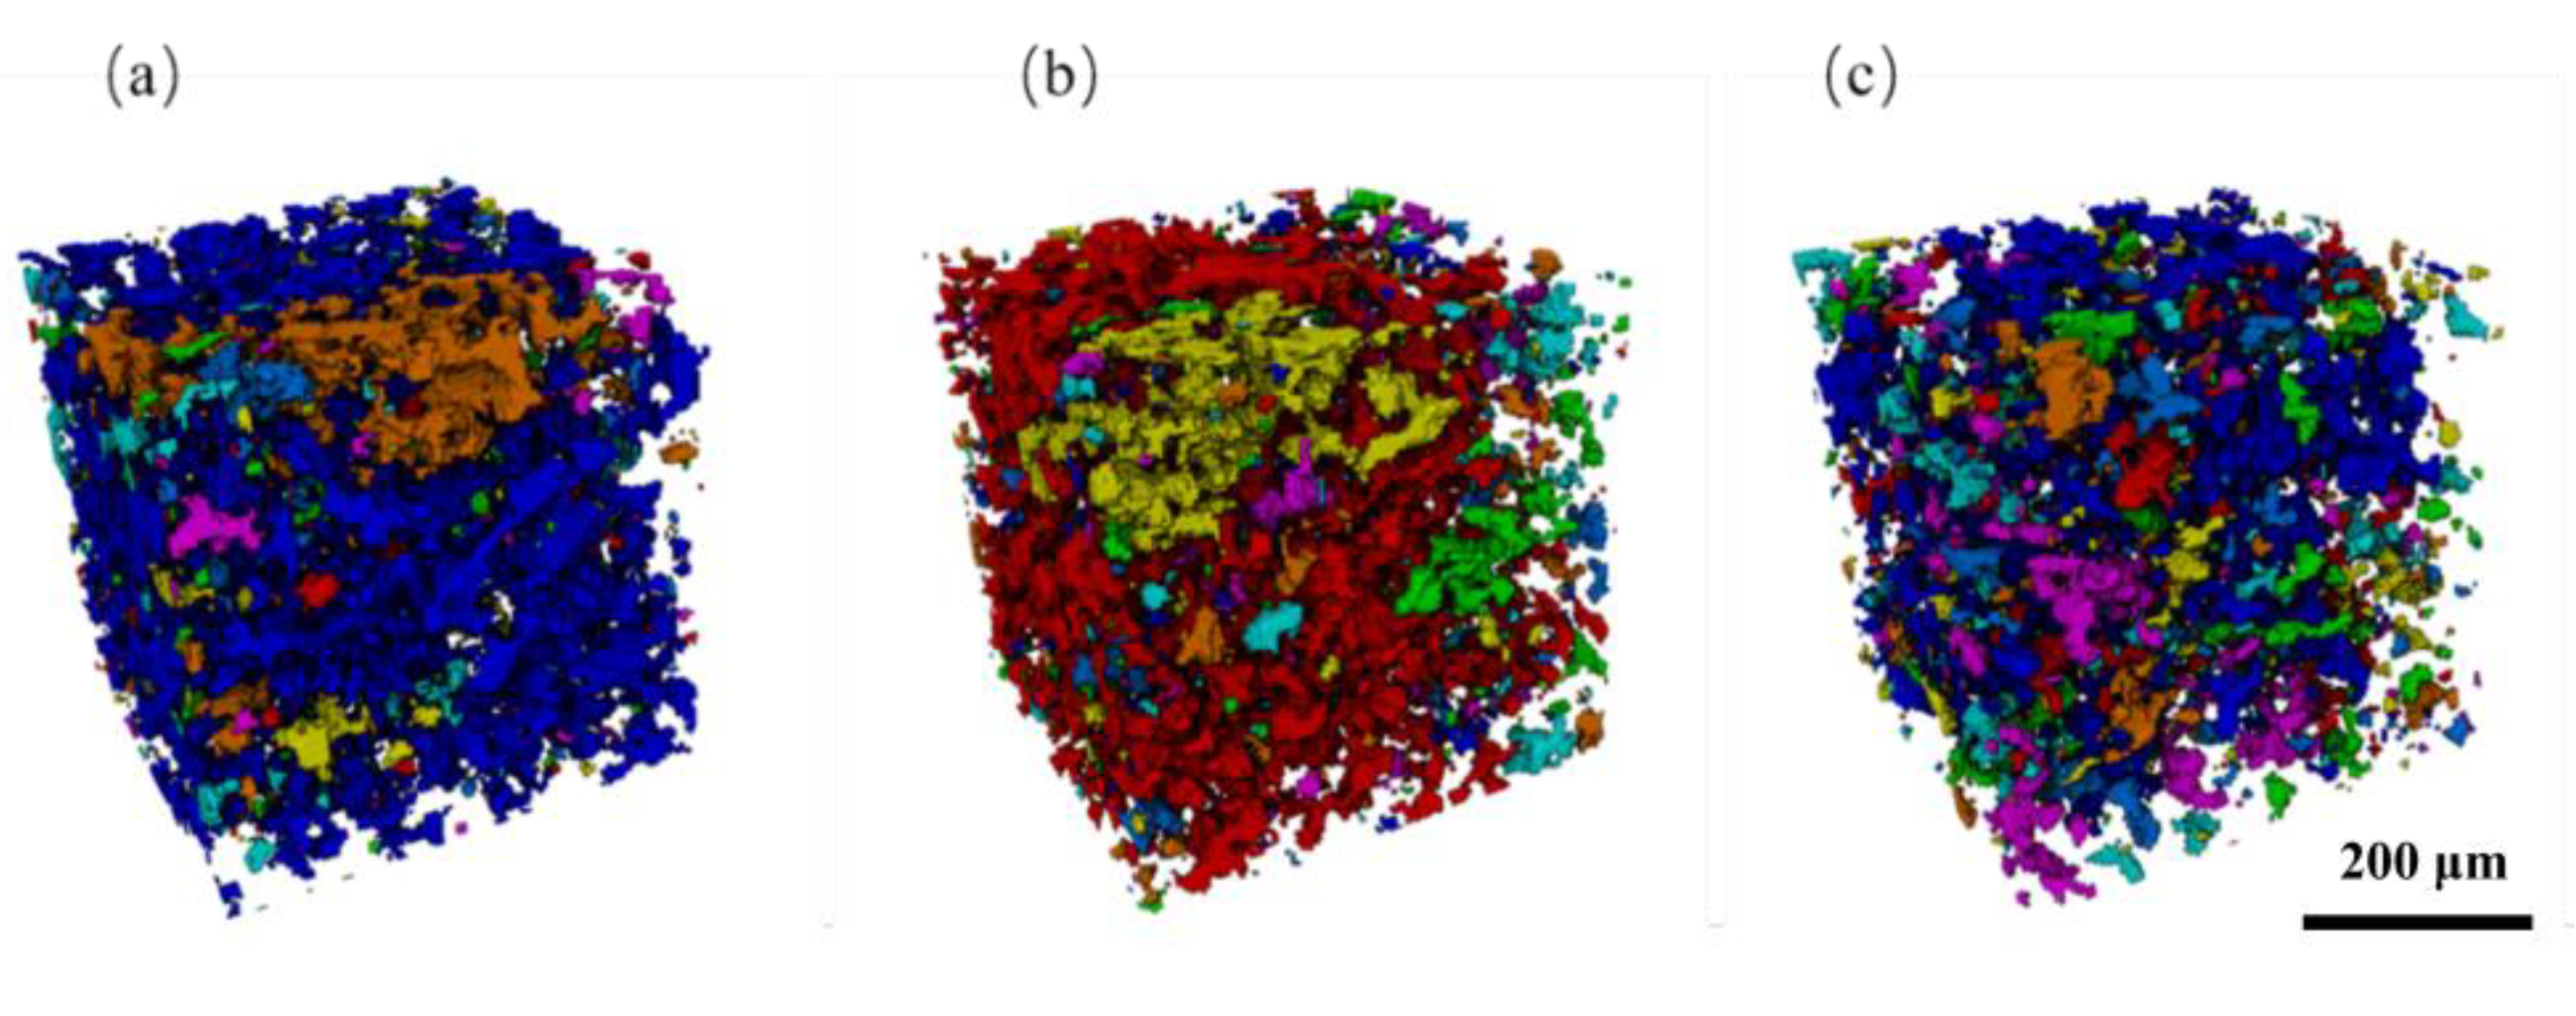
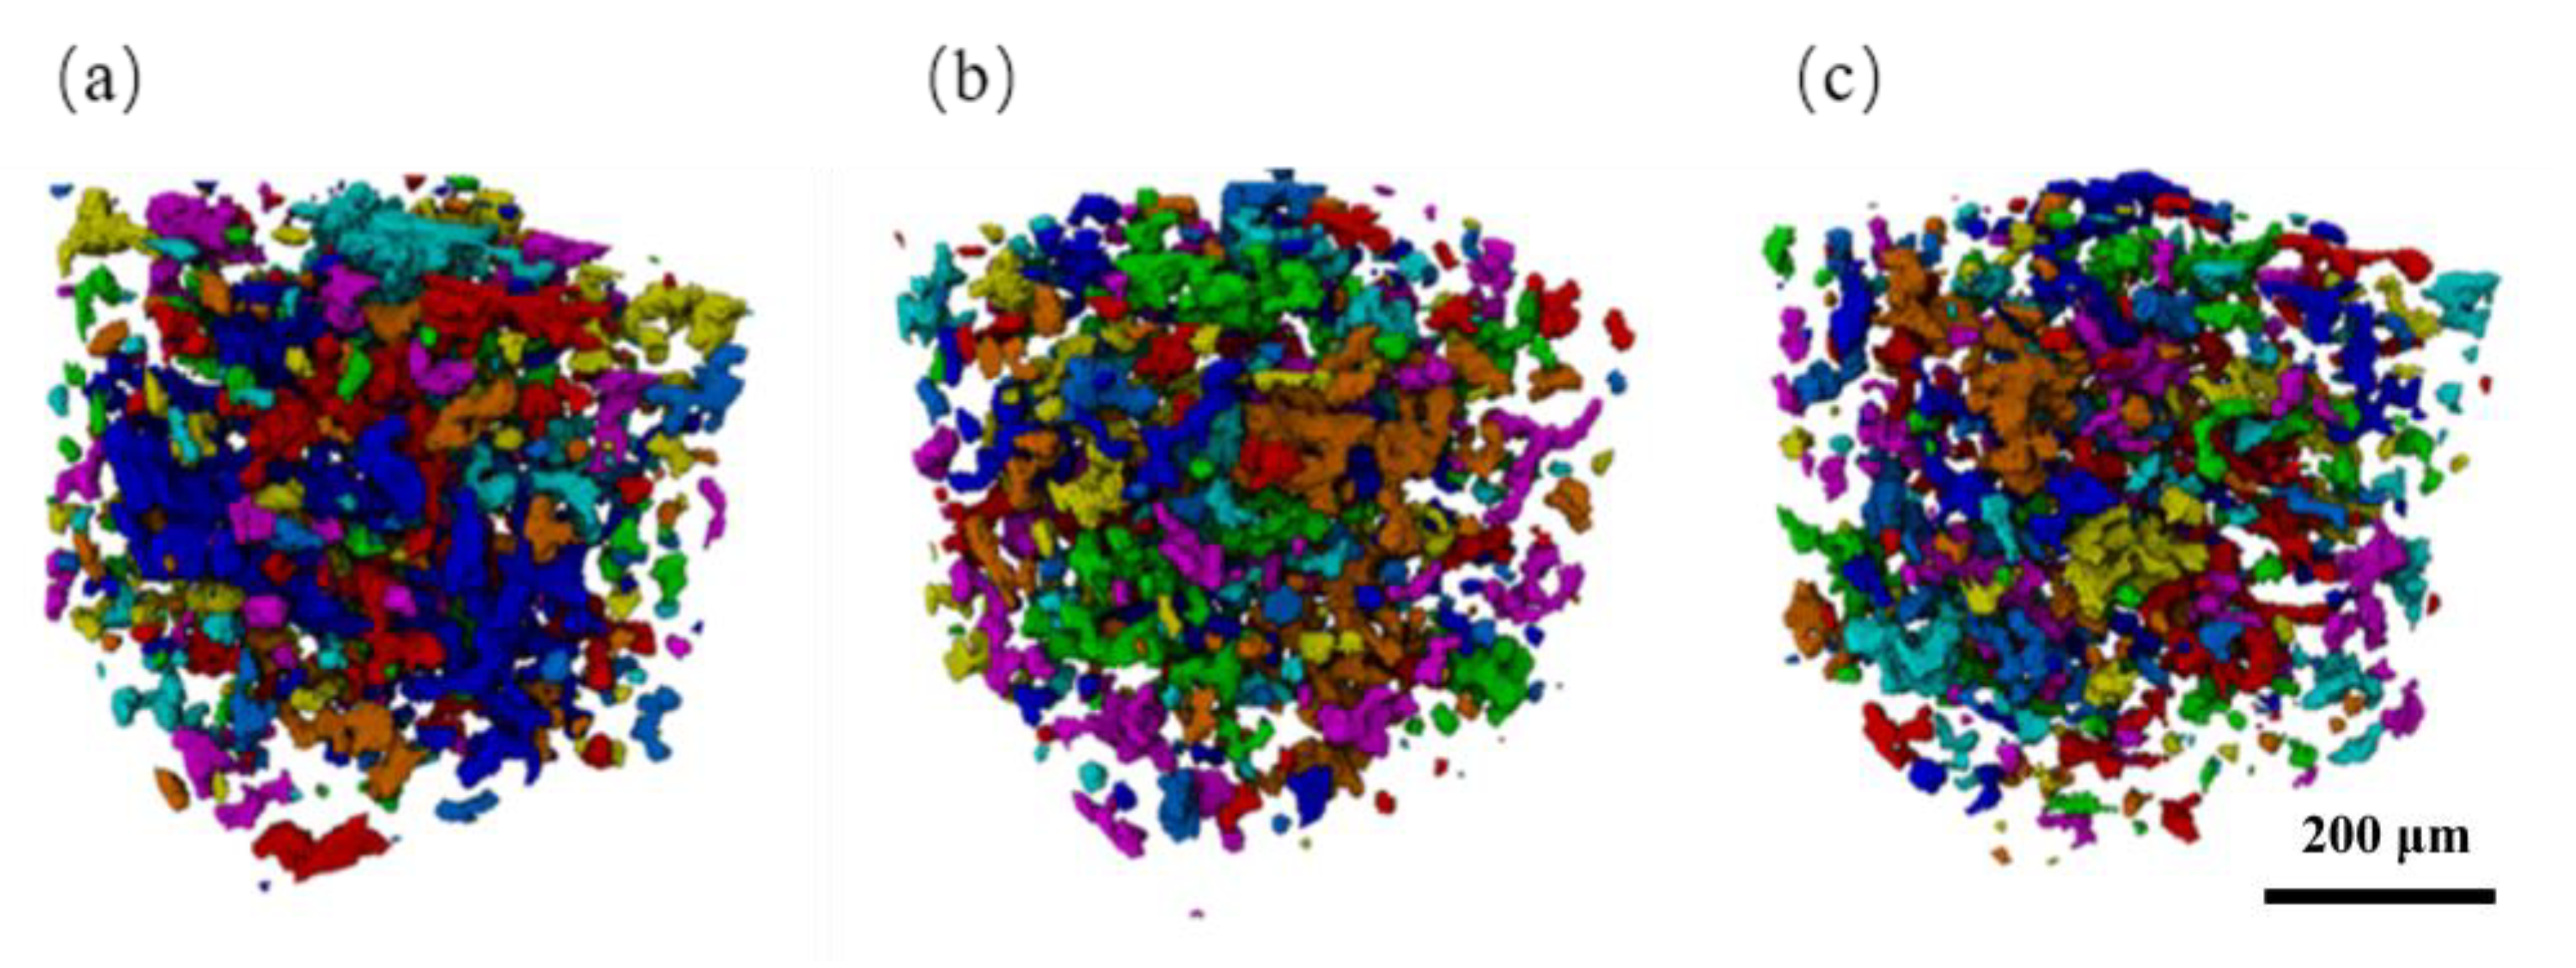
Figure 1. Three-dimensional actual shape of pores: (a) M-1, (b) M-2, (c) M-3.
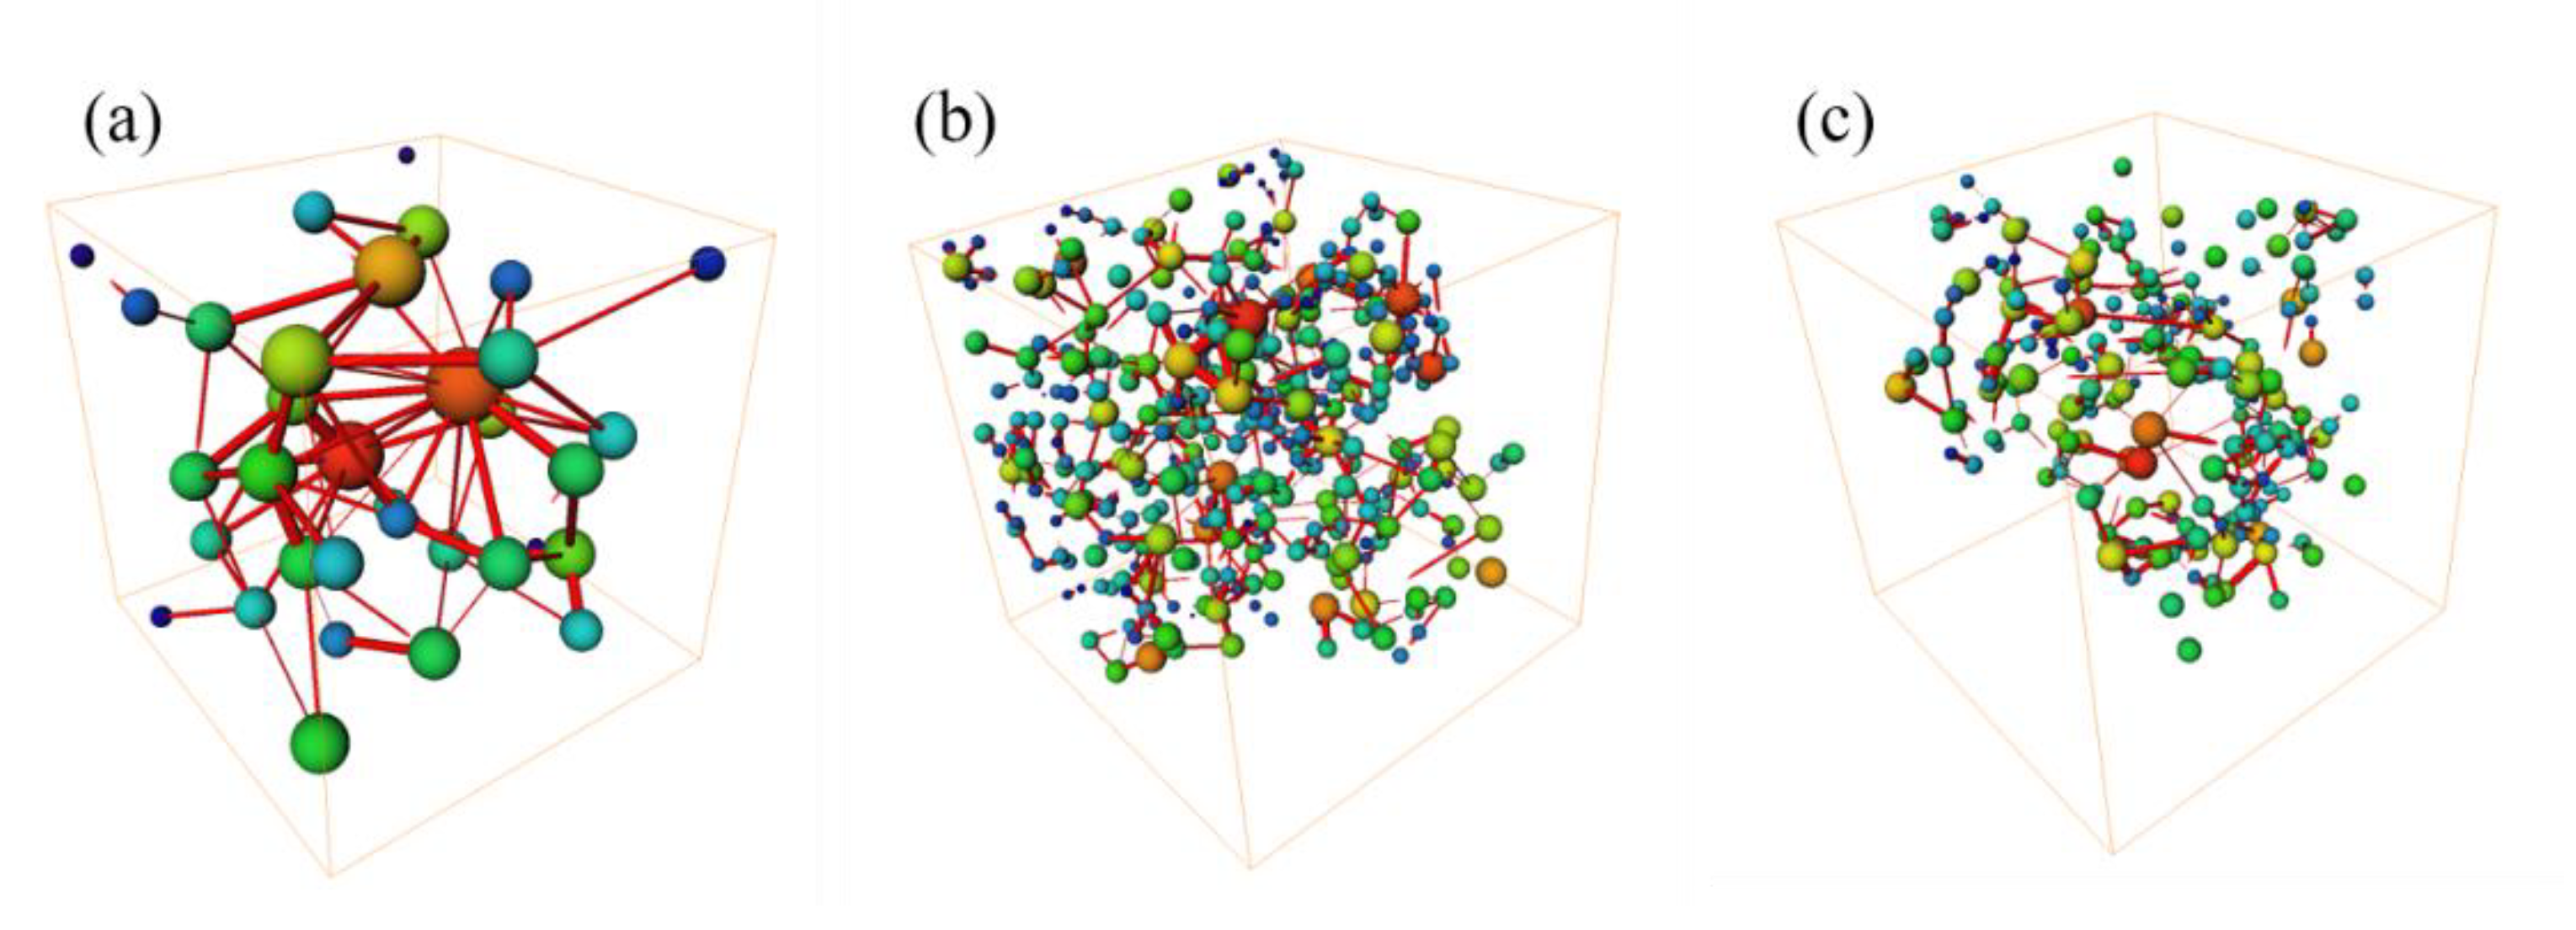
Metals 15 00635 g001
Figure 2. Pore ball-and-stick model of the samples: (a) M-1; (b) M-2; (c) M-3.
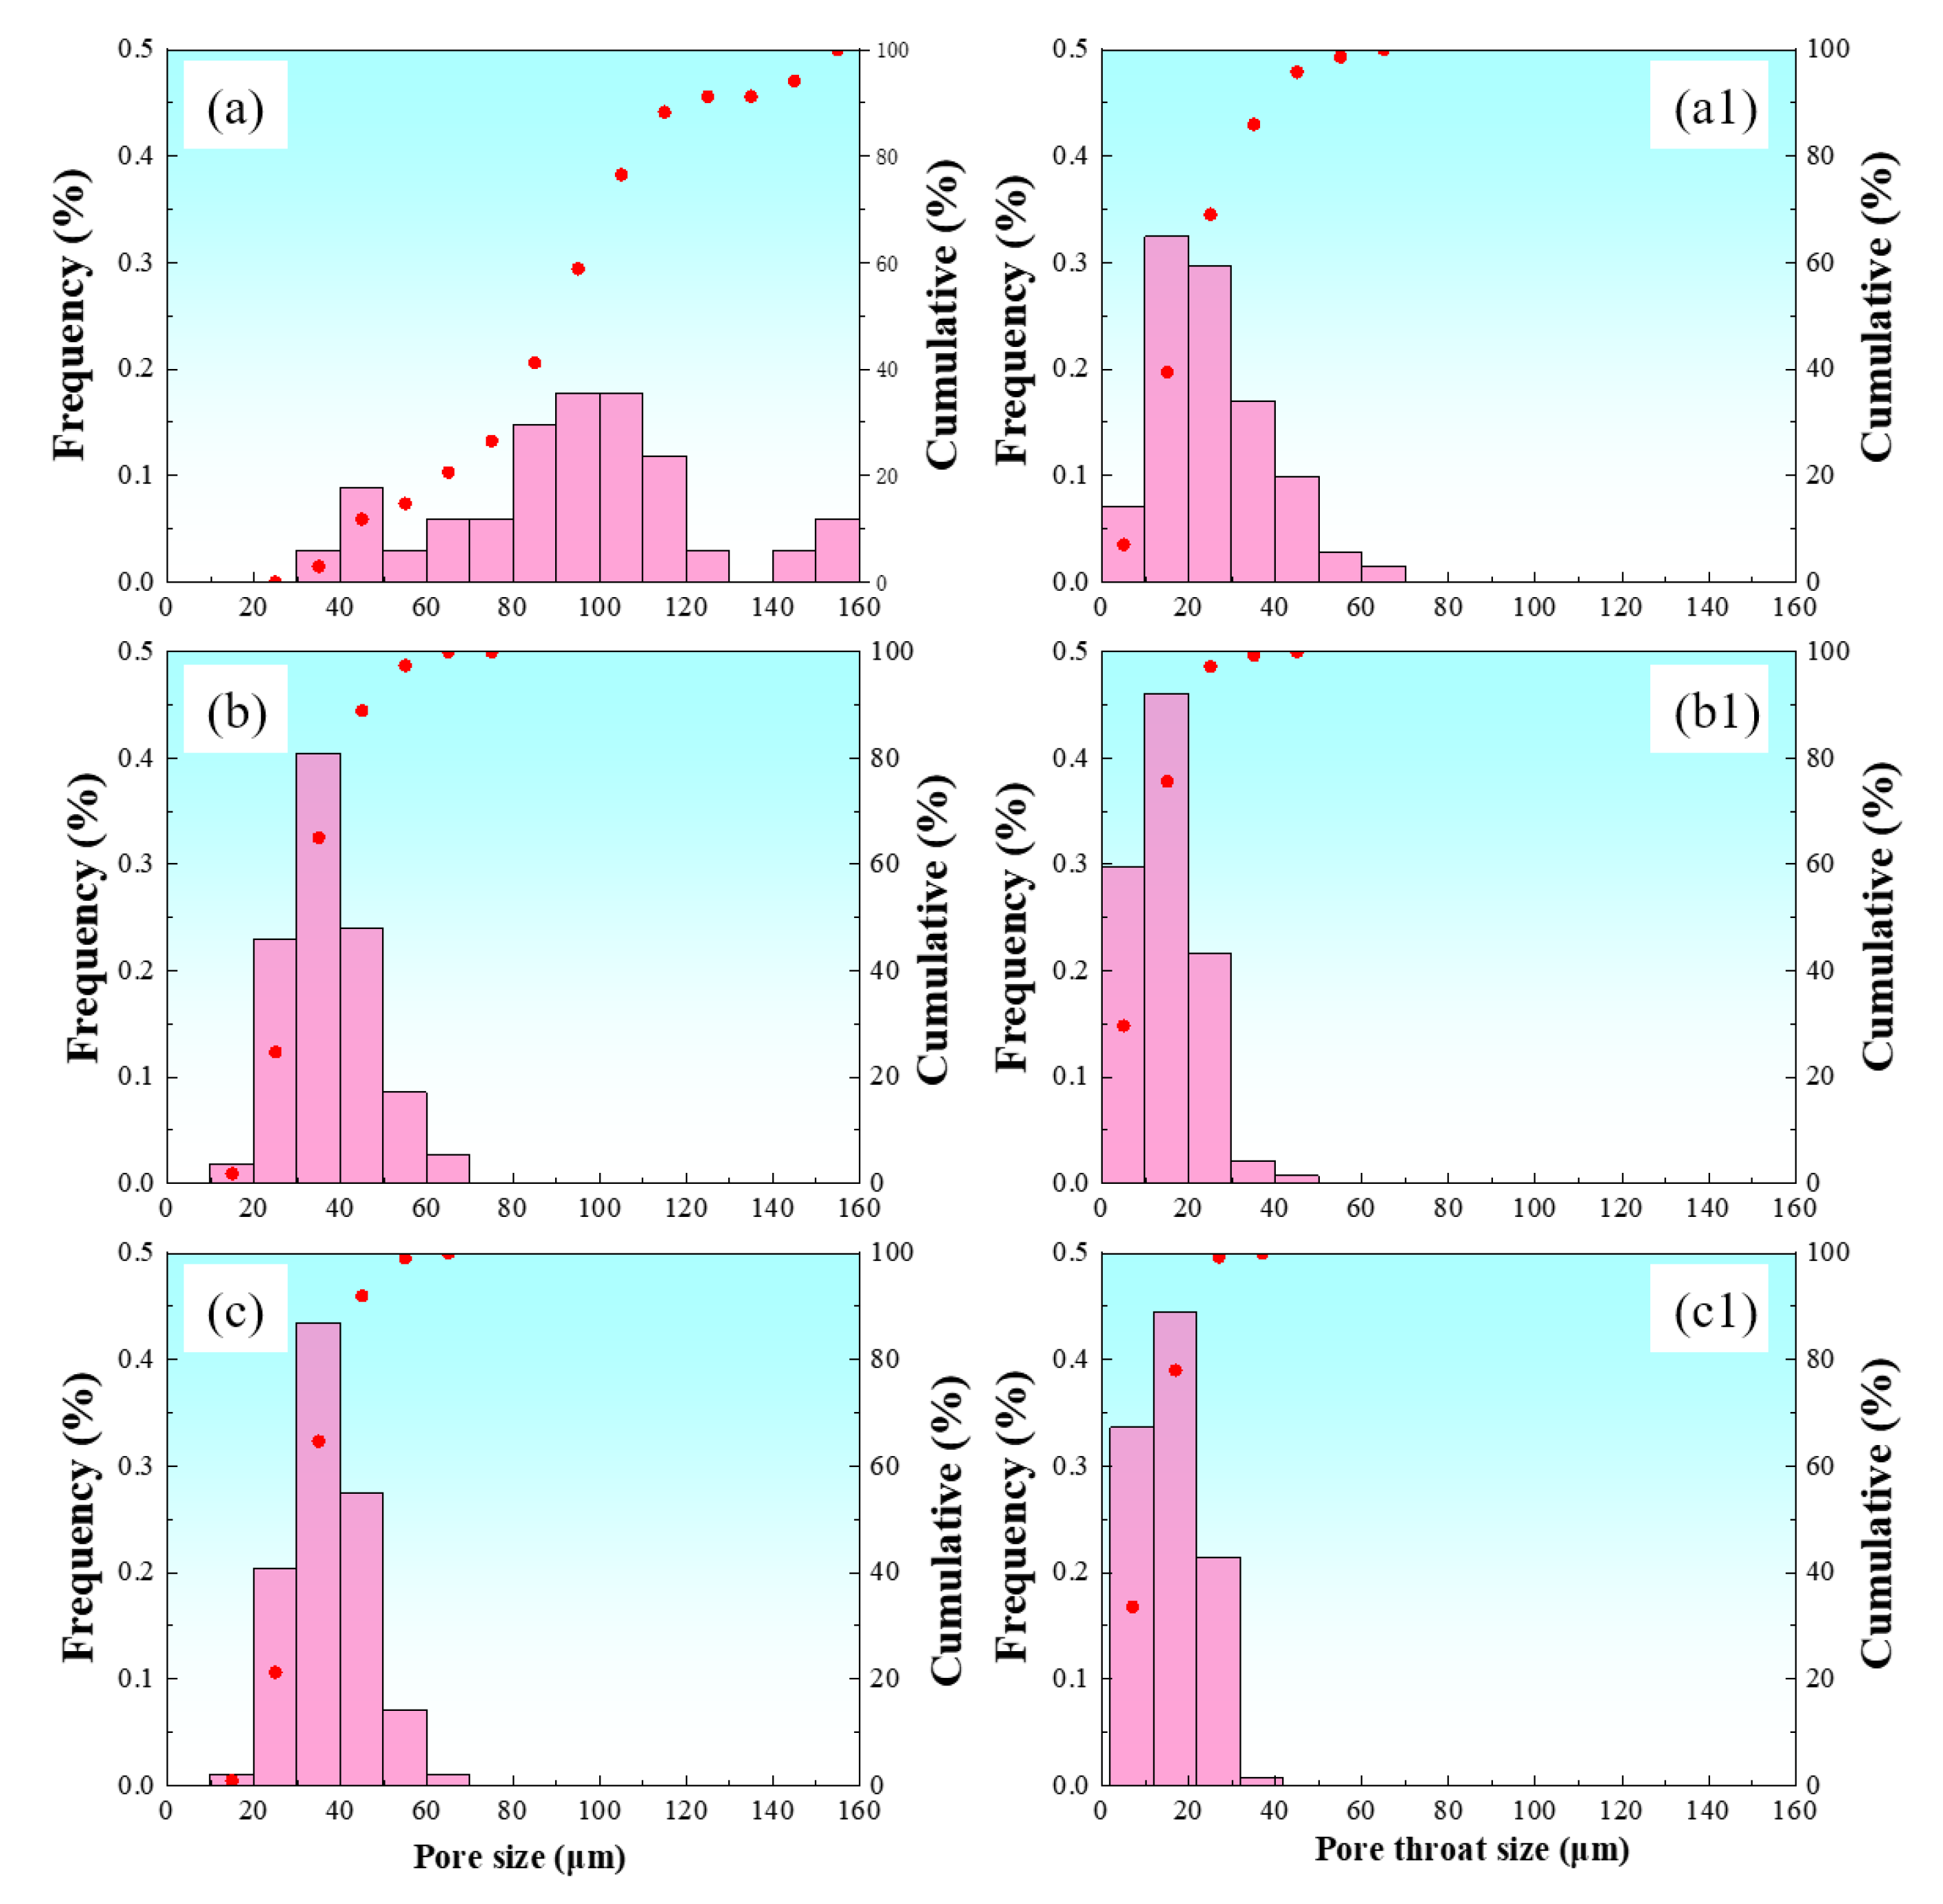
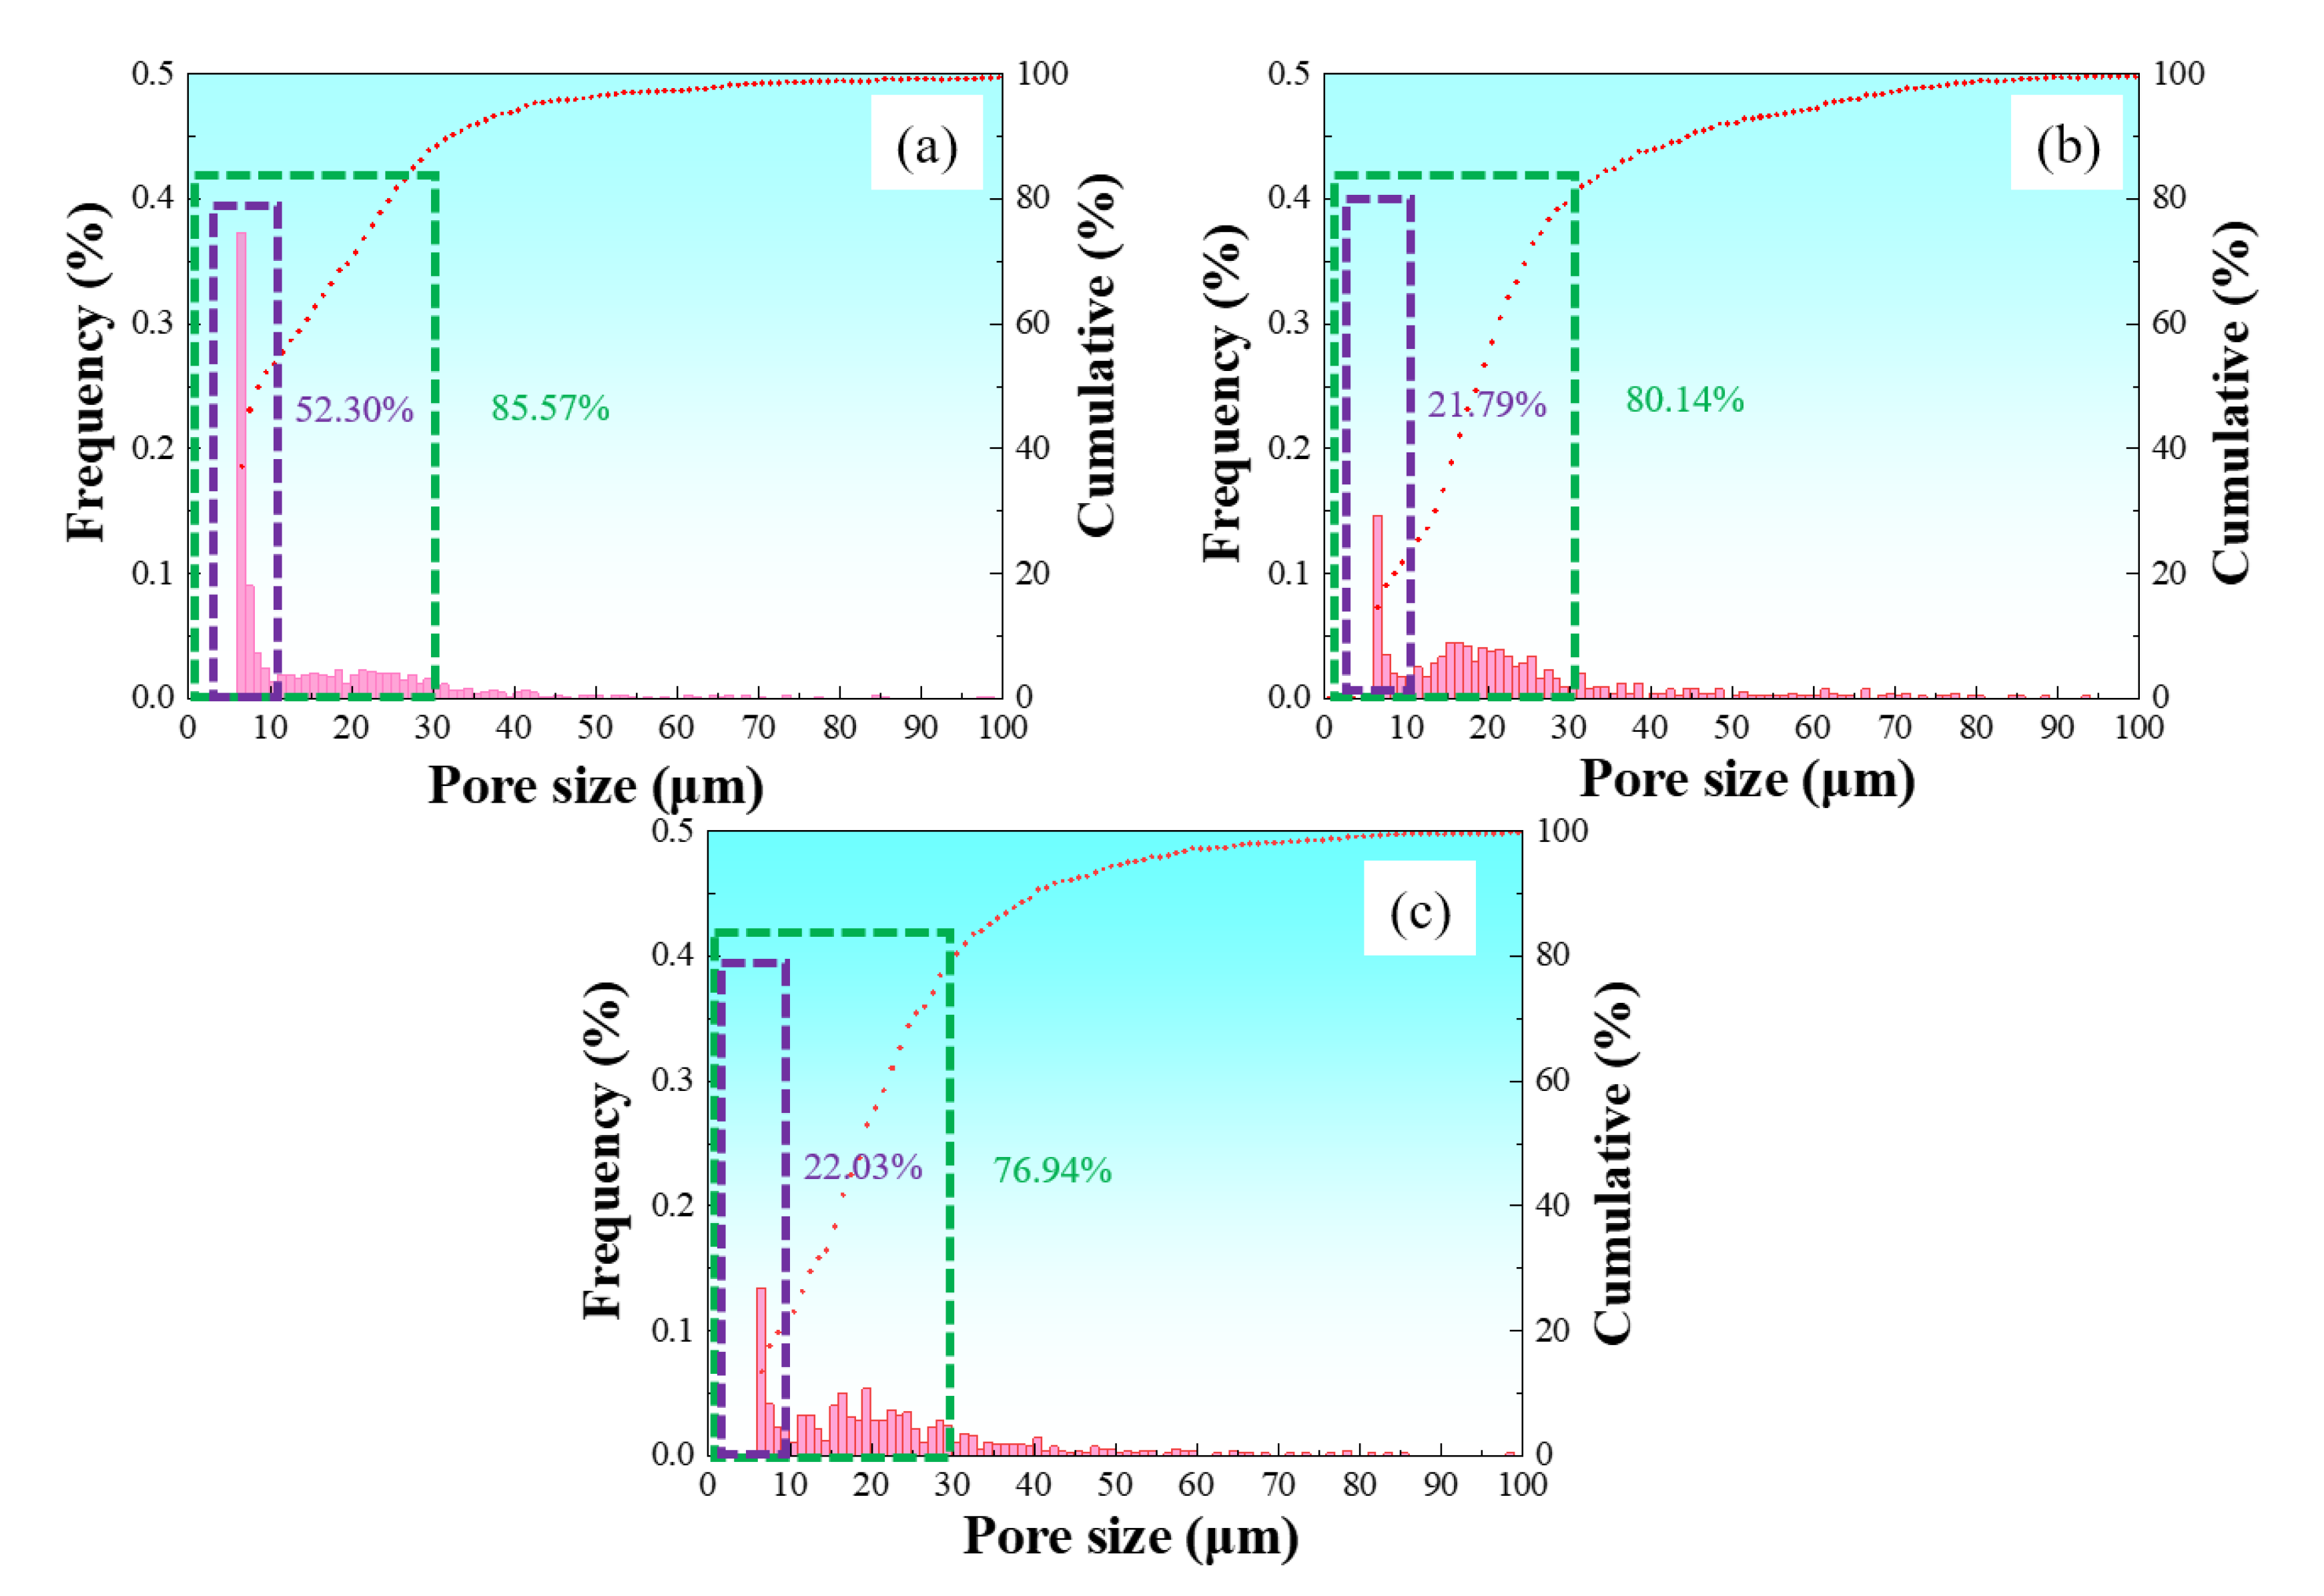
Metals 15 00635 g002
Figure 3. Pore and throat size distribution: (a) M-1 pore size distribution, (a1) M-1 pore throat size distribution, (b) M-2 pore size distribution, (b1) M-2 pore throat size distribution, (c) M-3 pore size distribution, (c1) M-3 pore throat size distribution.
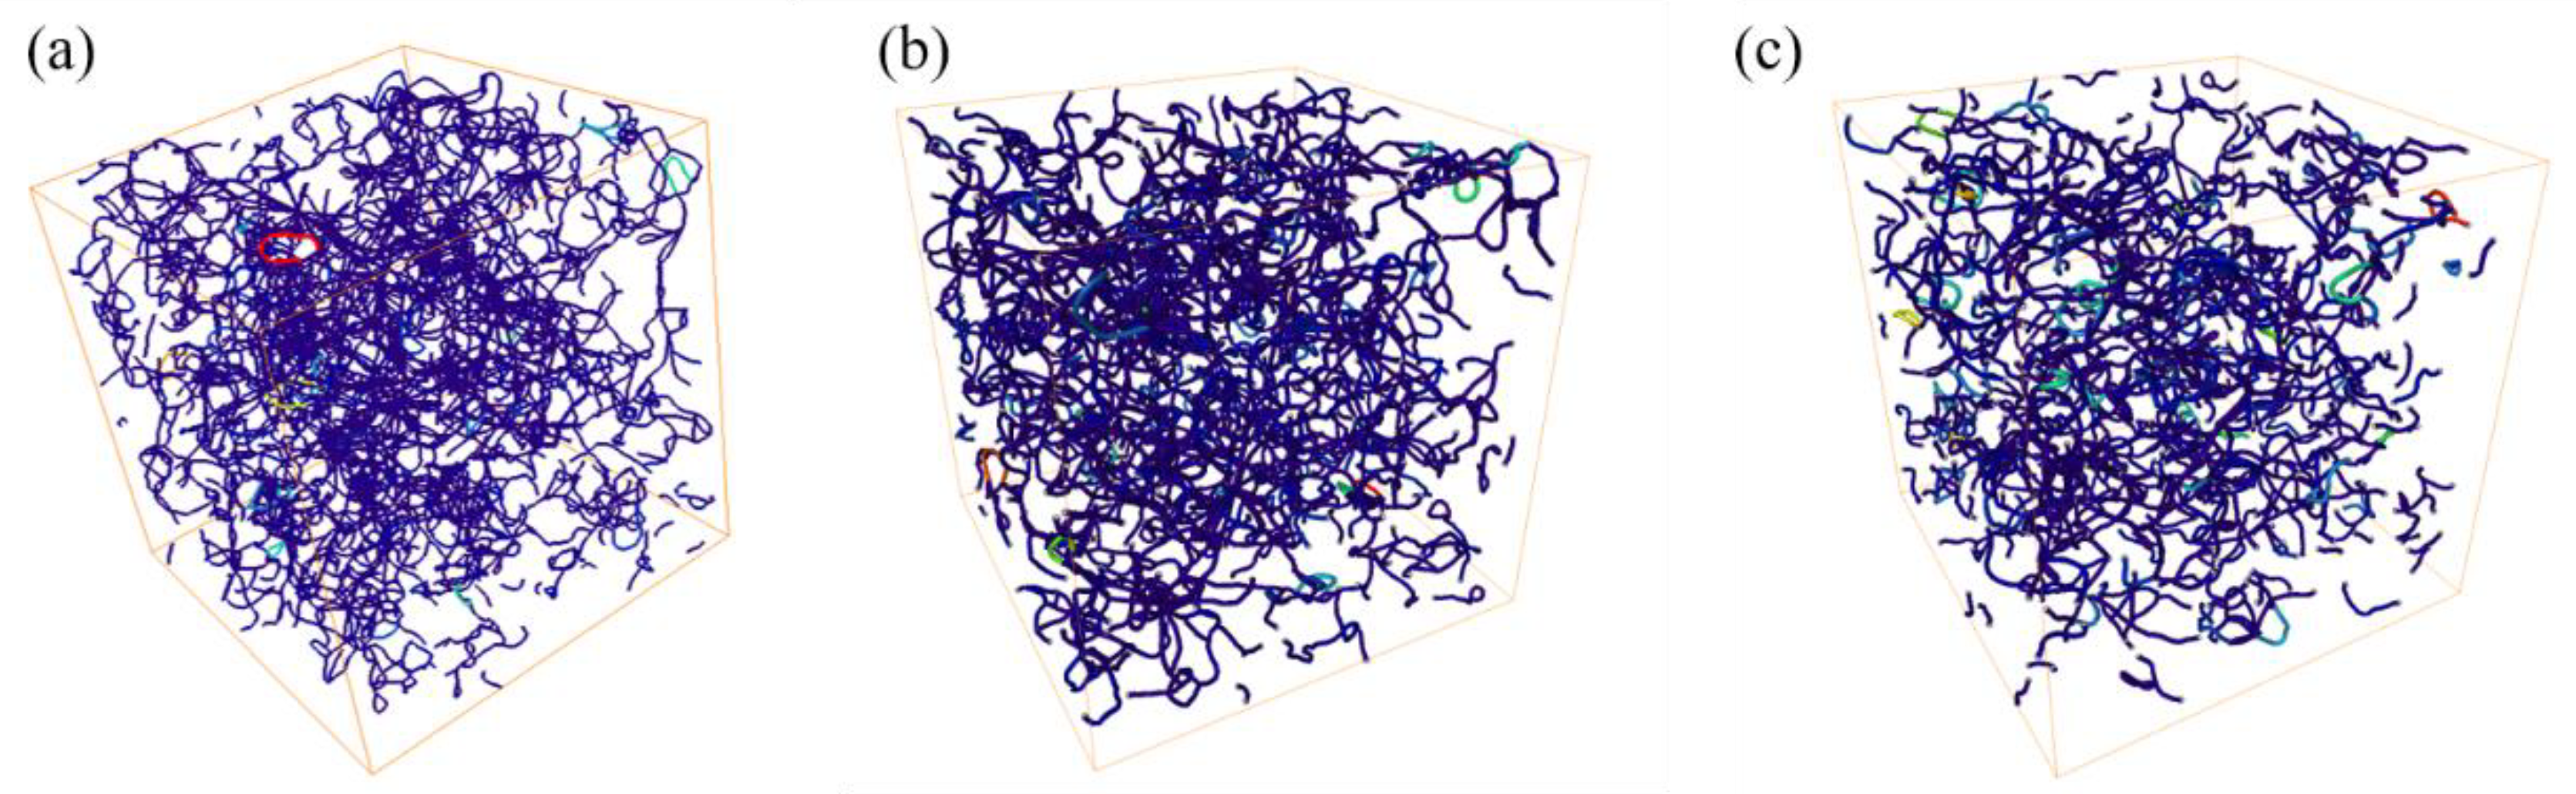
Metals 15 00635 g003
Figure 4. Schematic representation of tortuosity skeletonization (a) M-1; (b) M-2; (c) M-3.
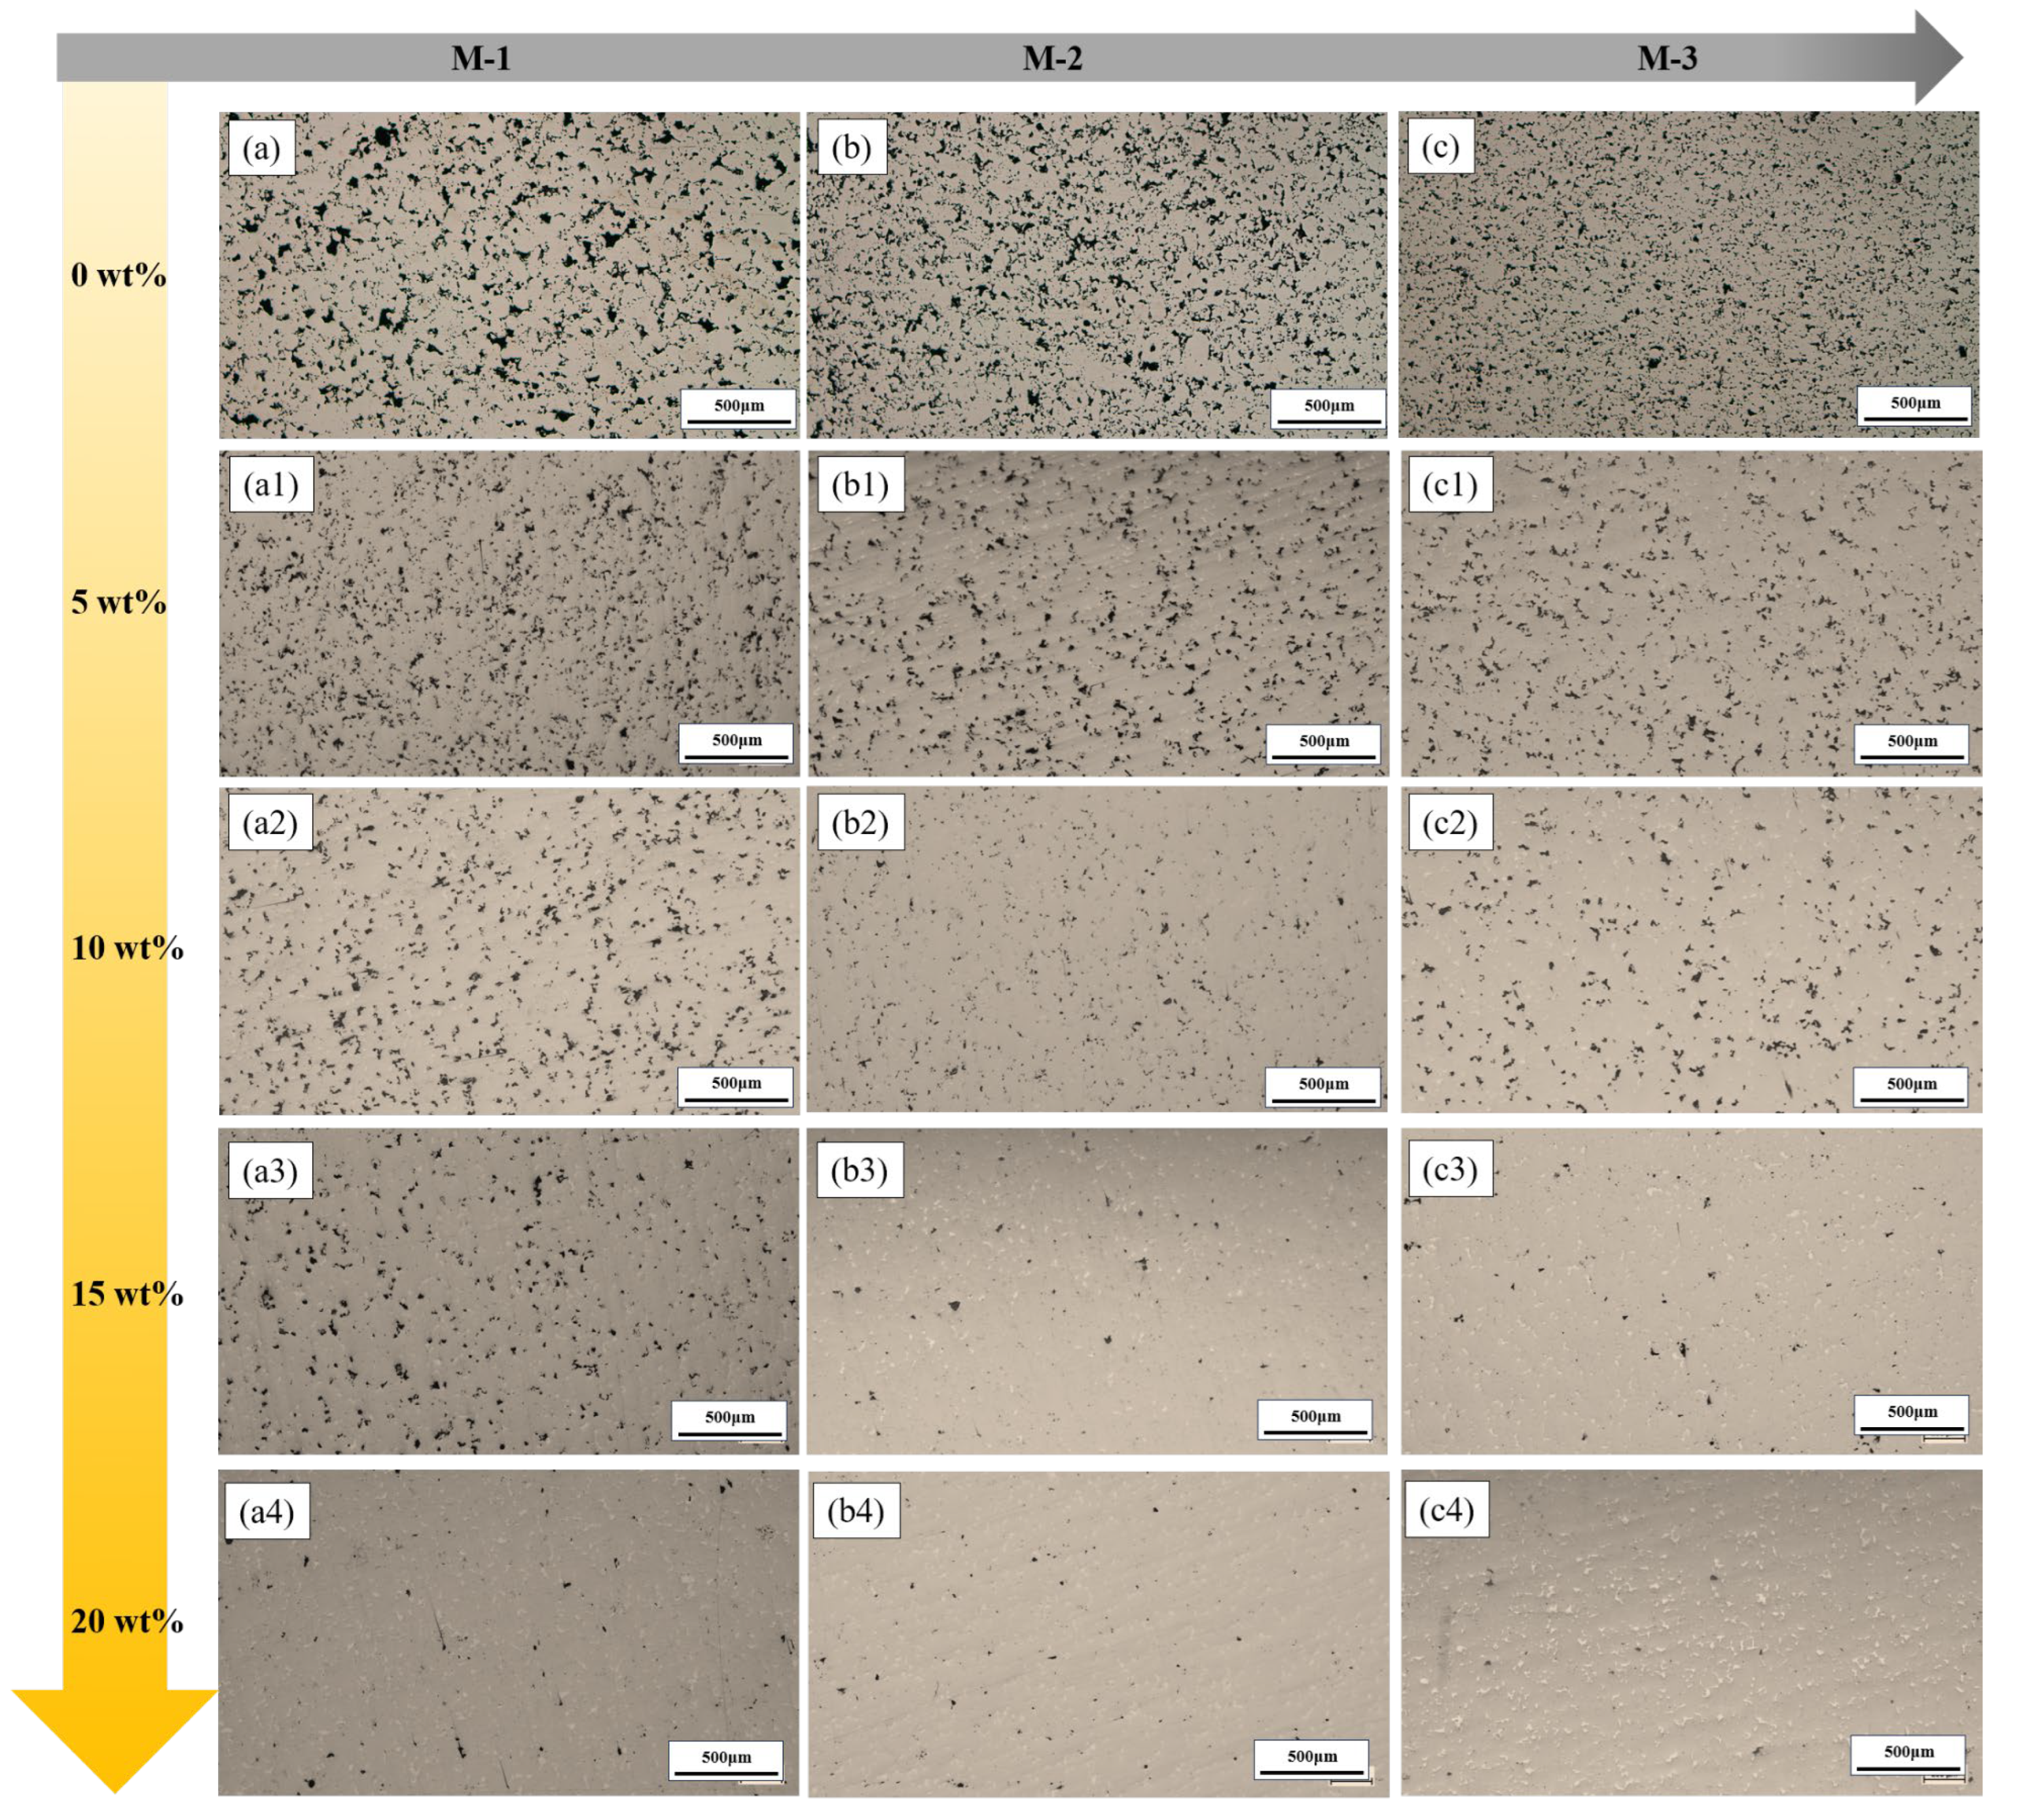
Metals 15 00635 g004
Figure 5. Characteristics of the microstructure evolution of the matrix with increasing copper infiltration.
Metals 15 00635 g005
Figure 6. Three-dimensional actual shape of pores after copper infiltration: (a) I-1, (b) I-2, (c) I-3.
Metals 15 00635 g006
Figure 7. Pore size distribution of samples after copper infiltration: (a) I-1, (b) I-2, (c) I-3.
Metals 15 00635 g007
Figure 8. Neighbor count probability distribution: (a) Matrix samples; (b) Copper-infiltrated samples; Sphericity probability distribution: (c) Matrix samples; (d) Copper-infiltrated samples.
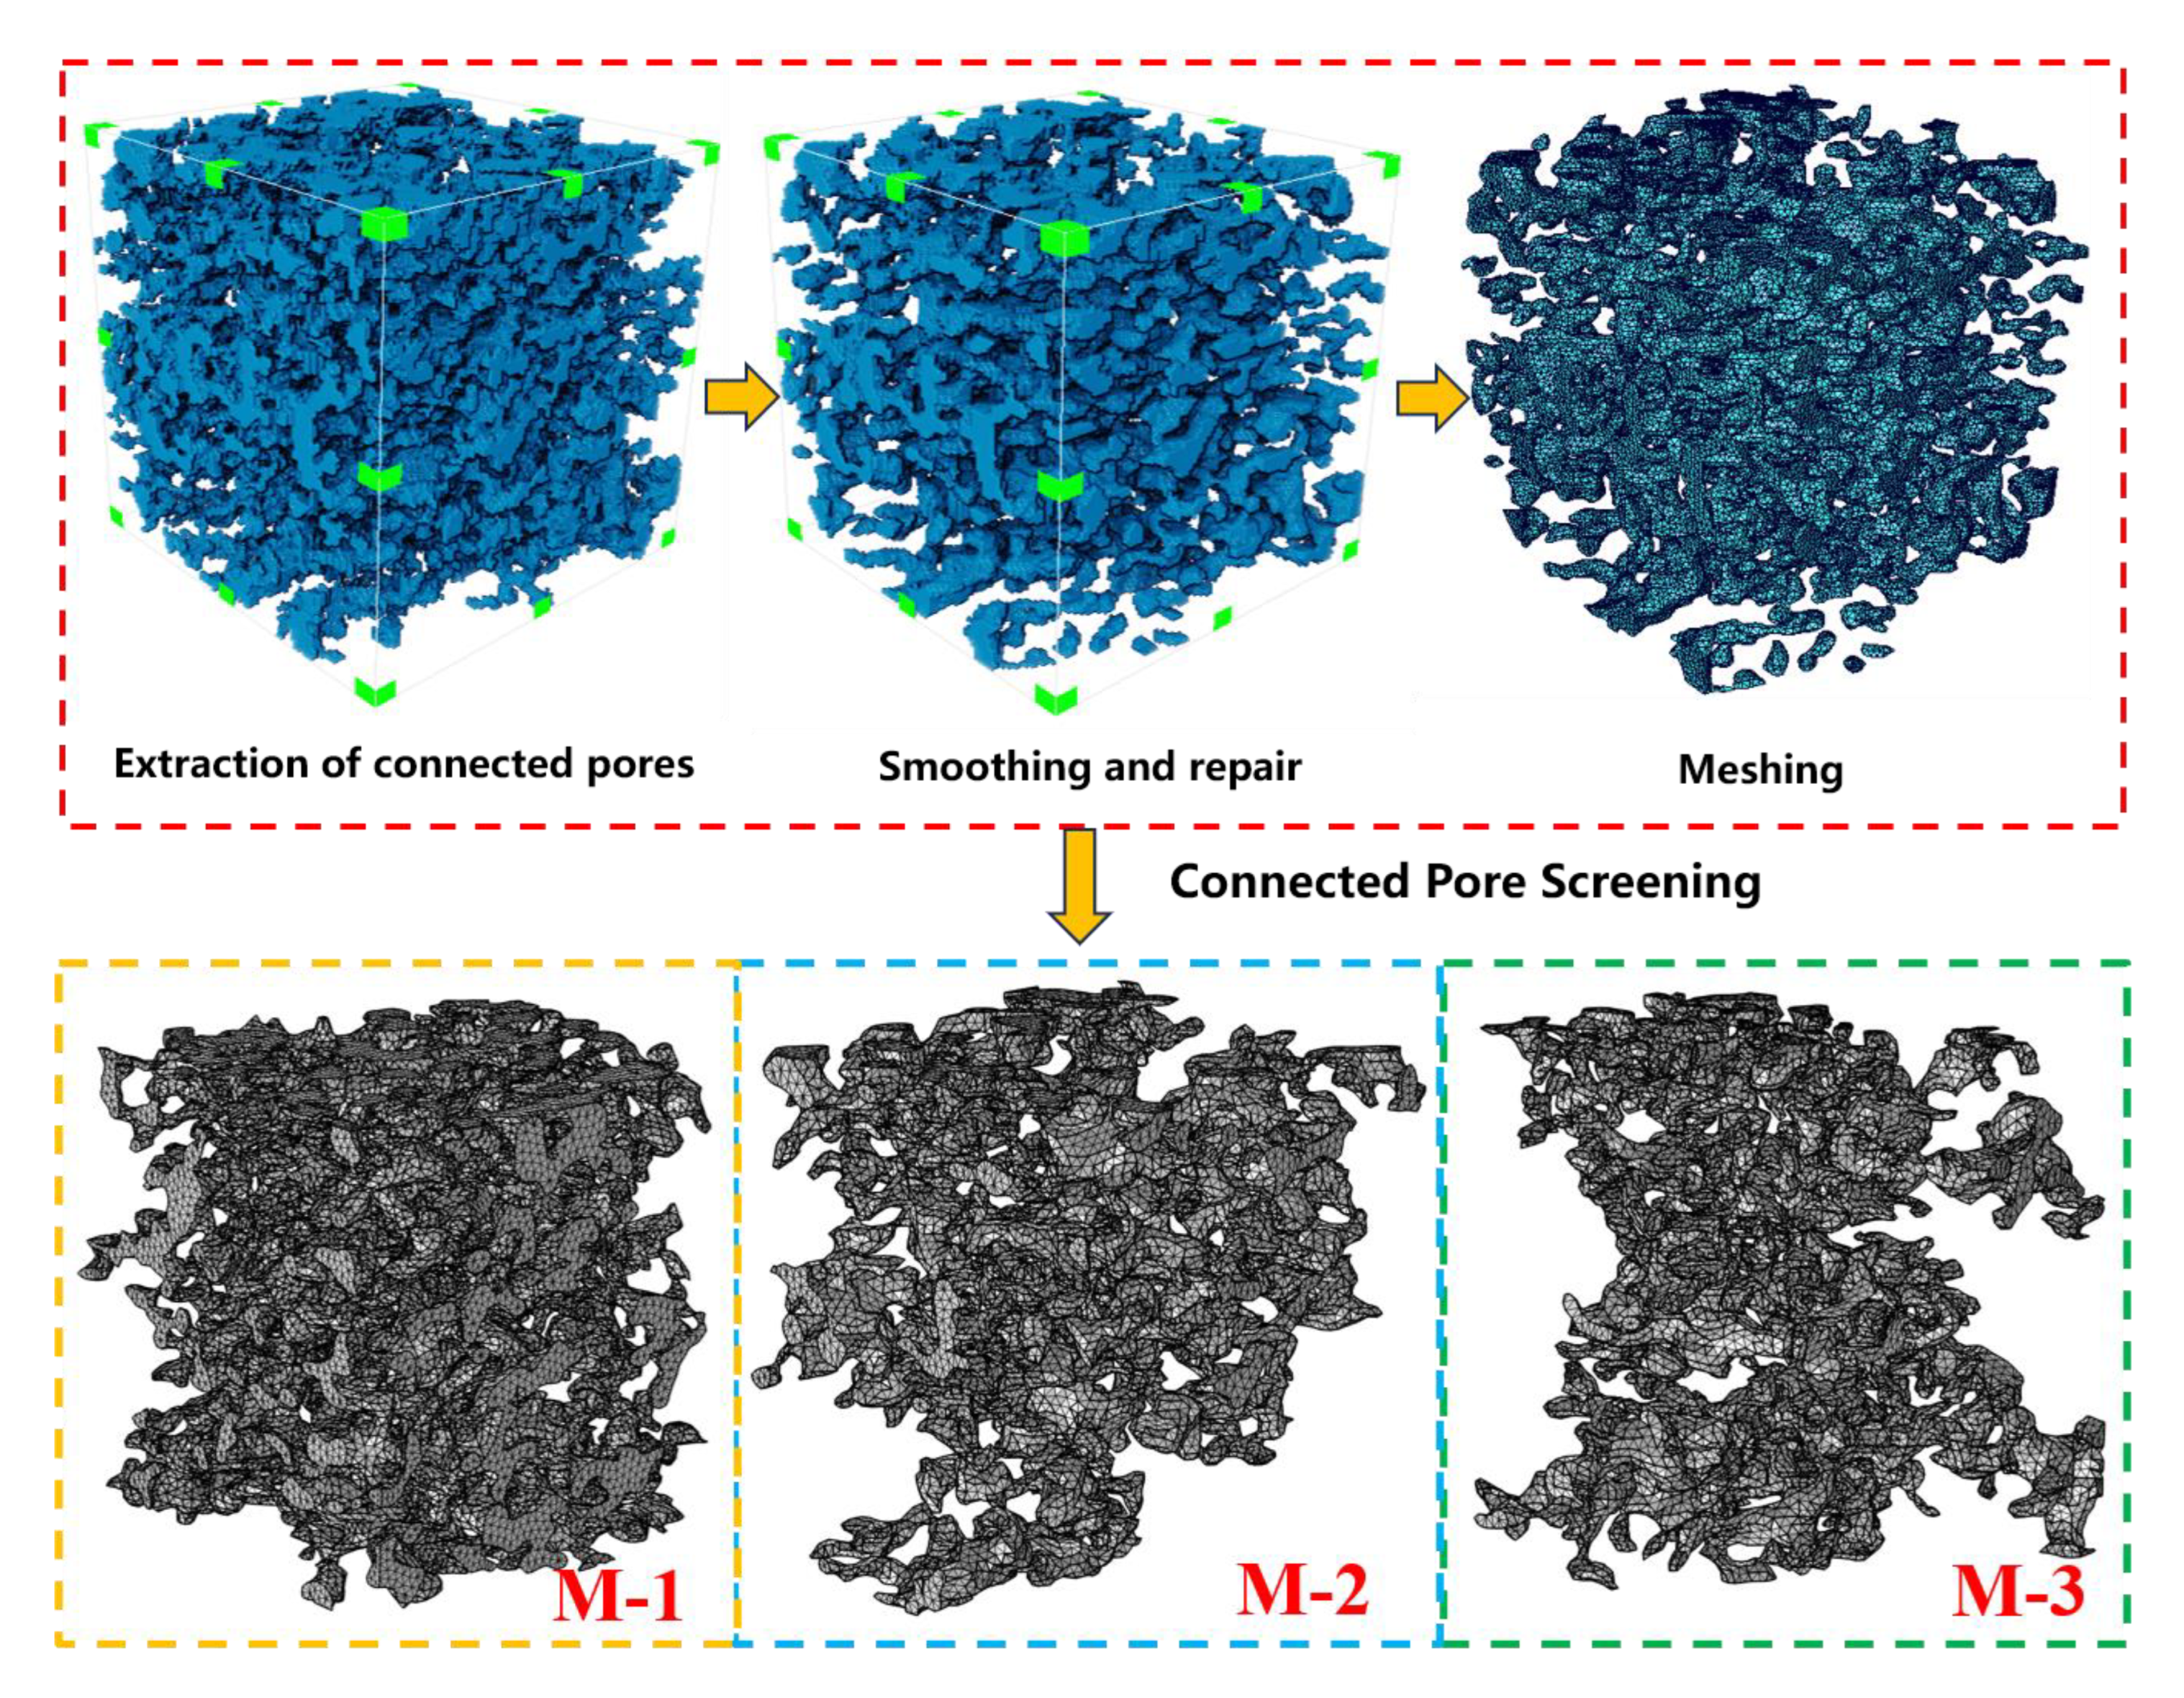
Metals 15 00635 g008
Figure 9. Connecting hole mesh processing flow.
Metals 15 00635 g009
Figure 10. Schematic of two-phase flow simulation with pore network models: (aa3) M-1; (bb3) M-2; (cc3) M-3.
Metals 15 00635 g010
Figure 11. Molten copper velocity streamlines: (a) M-1; (b) M-2; (c) M-3.
Metals 15 00635 g011
Table 1. Sample designations, preparation conditions, and measured densities.
DescriptionSample DesignationDensity (g/cm3)
Sintered Fe-2Cu-0.8CM-16.55
M-26.75
M-36.95
Sintered Fe-2Cu-0.8C + 10 wt.% Cu InfiltrationI-17.15
I-27.30
I-37.45
Table 2. Matrix tortuosity data.
SampleM-1M-2M-3
Minimum tortuosity111
Maximum tortuosity5.106.443.67
Average tortuosity1.381.082.26
Disclaimer/Publisher’s Note: The statements, opinions and data contained in all publications are solely those of the individual author(s) and contributor(s) and not of MDPI and/or the editor(s). MDPI and/or the editor(s) disclaim responsibility for any injury to people or property resulting from any ideas, methods, instructions or products referred to in the content.

