Abstract
This study investigated the high-temperature tensile durability of G115 steel after aging at 650 °C for different periods of time using a high-temperature tensile testing system. The results show that with the increase in aging time, the microstructure of G115 steel changes to a certain extent, which shows that as the martensite lath width and HAGB increases, the dislocation density decreases and the second precipitate shows obvious growth. As the tensile test temperature increases, the tensile strength decreases from ~750 MPa to ~350 MPa. The effect of aging time on the high-temperature tensile durability of steel after a 3000 h aging process is not significant, which should be related to the relatively high microstructure thermal stability of G115 steel during the aging process.
1. Introduction
Currently, ultra-supercritical (USC) power plants operate at temperatures around 650 °C, significantly surpassing the operational parameters of subcritical and supercritical boilers in terms of both temperature and pressure [1,2,3,4]. This advancement has markedly improved the power generation efficiency of coal-fired plants, playing a pivotal role in advancing the development of the power industry [5,6,7,8,9]. However, with the increasing integration of renewable energy into power grids, there is a growing demand for the flexible operation of coal-fired boilers. This requires coal-fired units to adapt to rapid grid load fluctuations and deep peak-shaving demands, thereby enhancing the power system’s capacity to accommodate renewable energy while ensuring grid stability. Consequently, material selection for USC boilers must prioritize both high-temperature durability under operating conditions and adequate strength retention during rapid start–stop cycles.
Traditional 9–12% chromium ferritic steels, currently used in boiler components, are limited to service temperatures below 600 °C [10,11,12,13,14], posing challenges to the safe operation of USC plants. ASME T/P92 steel (9Cr-1.8W-0.5Mo-Nb-V), an upgraded variant of 9% Cr heat-resistant steels [13,14], enhances creep strength through Mo, V, and Nb additions to promote precipitation hardening, while increased Cr content improves oxidation resistance [4,15,16,17,18,19,20,21,22,23,24]. However, issues such as grain coarsening and toughness degradation persist above 600 °C. High-Cr steels with Mo additions are prone to Fe2Mo formation at grain boundaries during long-term high-temperature service, leading to intergranular fracture.
G115 martensitic steel (9Cr-3W-3Co) exhibits superior mechanical properties [16,17,18,19,25,26,27,28,29,30,31]. Compared to conventional high-Cr steels, the addition of Co and optimized alloying elements endows G115 steel with enhanced high-temperature oxidation resistance and creep rupture strength. Nevertheless, with the adoption of flexible peak-shaving technologies, frequent start–stop cycles or thermal transients induce steep temperature gradients in rear wall components, subjecting critical parts to cyclic thermal stresses [32,33]. Under such conditions, the high-temperature durability of G115 steel may degrade, increasing fracture risks. It has been confirmed that G115 steel undergoes aging with the precipitation of secondary phases (e.g., Laves phases (LPs) [14], MxCy carbides (M = Cr, Fe) [11,14,19,20,21,22,27], and MX carbonitrides (M = Nb, Ti) [4,23,24,25,28,29,30,31]) during prolonged aging at 700 °C. Coarsening of these phases during aging adversely affects the impact toughness of G115 steel, as demonstrated in our research [32]. However, conventional room-temperature impact tests fail to replicate high-temperature service conditions or long-term operational effects in our previous work [32], leaving uncertainties regarding their influence on the high-temperature durability and deformation mechanisms of G115 steel. Therefore, it is imperative to investigate the correlation between the microstructural evolution and high-temperature mechanical properties of G115 steel under various aging conditions.
In this study, the evolution of microstructure and high-temperature tensile mechanical properties of aging G115 steel was studied. The influence of the aging process and service temperature gradient on the high-temperature durability of G115 steel was clarified by means of characterization analysis, which will help the further application of advanced high-temperature materials in the field of energy and power generation. This study builds upon our prior research framework [32], with a focused investigation into the effects of aging treatments on microstructural evolution and their implications for high-temperature strength. The key advancements in this work are twofold, described as follows:
- Service temperature alignment
The present experiments were conducted at 650 °C, including G115 steel preparation and tests after the long-term aging process, which precisely matches the operational temperature of ultra-supercritical (USC) power units. This represents a critical improvement over previous 700 °C evaluations, as it better simulates actual service conditions while maintaining experimental relevance to industrial applications.
- 2.
- Phase stability optimization
Thermodynamic calculations based on the Ostwald ripening theory predict a 40–60% higher equilibrium volume fraction of secondary phases (Laves phase and Cu-rich precipitate) at 650 °C compared to 700 °C, as shown in Figure 1a. This enhanced phase stability aligns with the previous results [32,33], where these precipitates demonstrated exceptional strengthening efficacy through Orowan bypassing and interfacial pinning mechanisms at intermediate temperatures (600–680 °C).
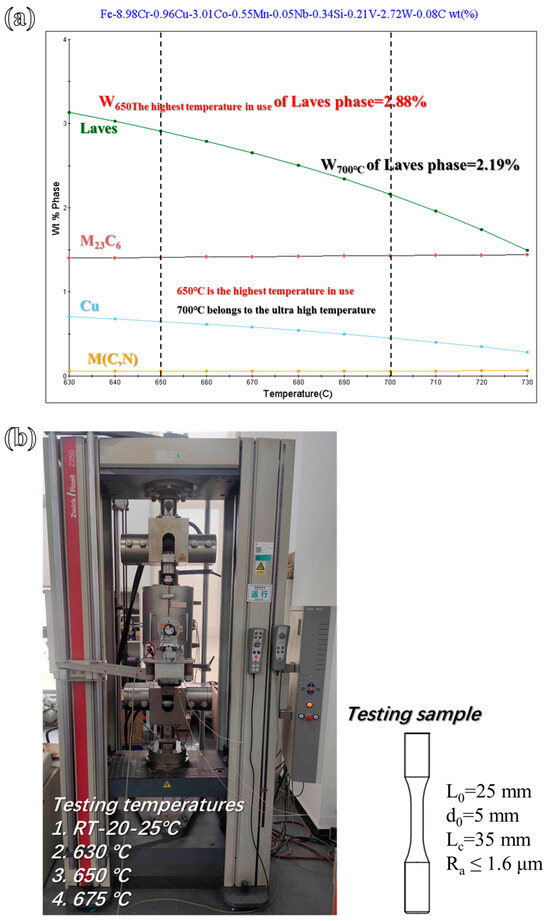
Figure 1.
(a) The second phase composition of G115 steel at 600–750 °C; (b) schematic diagram of the tensile test machine and the machining dimension of test specimens.
This study build upon our previous ideas [32] mainly exploring the effect of aging treatment on microstructure and the effect of high-temperature strength. The difference between the two is that, on the one hand, the service temperature of this work is 650 °C, which is consistent with the actual service temperature of the ultra-supercritical unit, which can simulate the actual service process well compared with the ultra-high temperature environment of 700 °C. On the other hand, at this temperature, the theoretical content of the second phase at 650 °C is significantly higher than that at 700 °C. According to the results of previous studies, the second phase can play a good strengthening role at this temperature.
2. Materials and Experiments
2.1. Microstructure Study
The chemical composition (wt.%) of the G115 steel used in the tests is composed of C at 0.08, Si at 0.34, Mn at 0.55, Cr at 8.98, W at 2.72, Co at 3.01, V at 0.21, Nb at 0.05, Cu at 0.96, and Fe balanced, which was obtained from the Institute of Special Steels, Central Iron and Steel Research Institute Co., Ltd. (Beijing, China). The G115 steel sample as the base material (BM) was annealed at 650 °C for 2 h and then cooled in air, and the heat treatment temperature was determined based on the actual service parameters of ultra-supercritical power plants. The second phase composition of G115 steel at 600–750 °C can be seen in Figure 1a, which confirms that the composition of Laves phase and the Cu-rich precipitate at 650 °C is higher than that at 700 °C. The phase map was completed by JMatPro 10.0 software. After standard mechanical polishing procedures and then etching in a mixed solution (5 g FeCl3 + 15 mL HCl + 80 mL H2O) for 35 s, the microstructures of specimens after aging at 650 °C for 500 h, 3000 h, and 10,000 h were characterized by an optical microscope (OM) and scanning electron microscopy (SEM, Gemini 360, Oberkochen, Germany). The width of lath martensite was measured by Image J 2x software. After the vibration polishing (UNIPOL-900Z, Shenyang, China) process, samples were characterized by the electron back-scattered diffraction (EBSD) technique for obtaining the grain orientation, the proportion of the low-angle grain boundaries (LAGBs), and high-angle grain boundaries (HAGBs), as well as the phase composition after different aging processes. The microstructures and second phases such as M23C6, MX, LP particles, and the lath martensite were characterized in the thin foils of G115 steel by using the TECNALG220 field emission transmission electron microscope (FETEM) at 200 kV (Hillsboro, OR, USA), and the testing specimens were electropolished using a twin-jet electro polisher in a mixed solution of 5 vol.% perchloric acid and 95 vol.% ethanol.
2.2. Tensile Test
Tensile tests were performed using a tensile testing machine (Z250, SANS, Beijing, China) equipped with an elevated temperature furnace and an extensometer in accordance with the GB/T 228.1-2021 standard, as shown in Figure 1b. The circular bar-shaped tensile specimen was used in the test, and the machining dimension of the test sample can be seen in Figure 1. The test temperature’s different strain rate regimes (RT, 20–25 °C) were set to 630 °C, 650 °C, and 670 °C for evaluating the high-temperature plastic deformation performance, which maintained consistency with the aging temperature. The strain rates were set to 7 × 10⁻⁵ s−1. The holding time before the start of the tensile test was approximately 30 min. Three tests were carried out, and the average value of the data was obtained. The neck portions of ruptured specimens were observed by SEM for illustrating the fracture mode. Tensile strength (Rm/MPa) and a reduction in area (ψ) were statistically analyzed.
3. Results
3.1. Microstructures
Figure 2 illustrates the etched metallographic morphology of steel specimens. The microstructure primarily consists of lath martensite within prior austenite grain (PAG) boundaries. Prolonged aging durations induced progressive grain coarsening and widening of martensitic laths, as evidenced by prior studies [10,12]. Microstructural analysis revealed that specimens subjected to aging treatments spanning 500 h to 10,000 h exhibited notable increases in both PAG size and martensite lath width, which can be confirmed by the results in Figure 2. The increasing size of PAG is obvious in the G115 steel aging at 650 °C from 500 h to 10,000 h. The average width of lath martensite increases from 25 μm to 28 μm (three measurement positions), and the coarsening of lath martensite resulted in diminished boundary clarity and elongation of the martensitic lath structure, as shown in Figure 2.
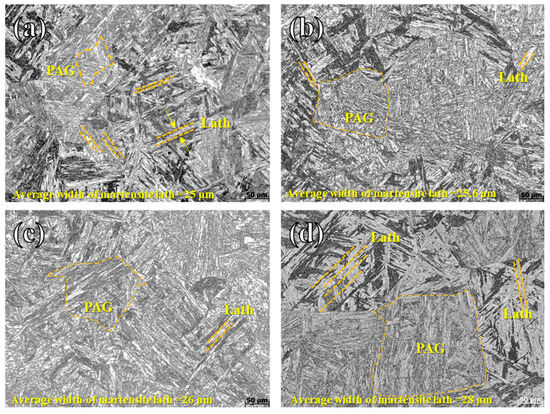
Figure 2.
Metallographic morphology of G115 steel after different aging times at 650 °C: (a) BM, (b) 500 h, (c) 3000 h, and (d) 10,000 h; PAGs are marked in images, and the average width of martensite lath is marked in the corresponding morphology.
As shown in Figure 3, SEM morphologies of G115 steel after different aging times revealed that lath martensite growth was constrained by PAG size, which can be illustrated by the different growth directions of lath martensite in each PAG. It has been reported that the aging-induced dislocation density reduction can promote the lath expansion of martensite [7,18], which can explain the phenomenon in Figure 2. Some sub-grains and PAGs can be found in the sample after the 3000 h aging process at 650 °C, contrasting the microstructure in the BM and the aged sample after 500 h. Some second phases such as MX/M23C6 carbides and Laves phase (Fe2W) precipitates gradually become coarse with aging time, as shown in Figure 3a,d. Consistent with prior investigations [16,17,18,19], the precipitates exhibited preferential segregation along both grain boundaries and martensitic lath interfaces, as clearly delineated in the microstructural characterization presented in Figure 3d. Precipitate coarsening, governed by synergistic elemental diffusion and thermodynamic driving forces, induced a progressive augmentation of matrix coverage. This microstructural alteration is hypothesized to perturb local crystallographic integrity, necessitating systematic EBSD/TEM interrogation to elucidate the fundamental mechanistic relationships between phase evolution kinetics and lattice reorganization phenomena, as extensively debated in prior theoretical frameworks [11,12,13,14,15,16,17].
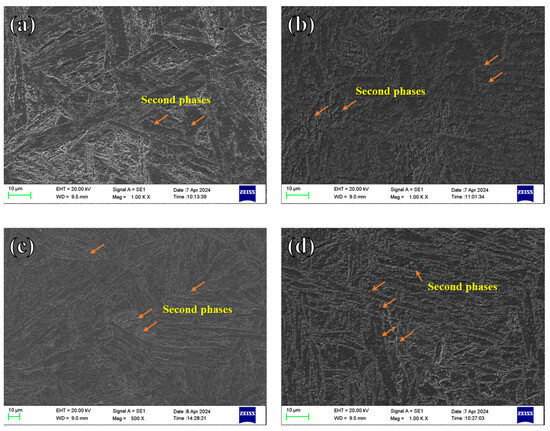
Figure 3.
SEM morphologies of microstructures in G115 steel with different aging times at 650 °C: (a) BM, (b) 500 h, (c) 3000 h, and (d) 10,000 h.
3.2. EBSD Characterizations
The microstructures and the random orientation of different G115 steels after aging times were investigated by EBSD techniques, as shown in Figure 4, including the quality image (QI) and the inverse pole figure (IPF). From the QI results, it can be found that the length and width of lath martensite increased with aging time, which is consistent with the SEM results in Figure 3. Based on the mass index of the electron backscatter diffraction signal, QI reflects the mass of the crystal orientation and lattice integrity. Thus, some second phases can be found in lath martensite in Figure 4a1–d1. The IPF shows the distribution of a certain direction in the sample coordinate system in the crystallographic space, as shown in Figure 4a2–d2. It can be found that within a single prior austenite grain, the orientation of martensite laths is essentially the same. However, the orientation of martensite laths differs significantly between adjacent austenite grains. With the aging time processing, the difference in the orientation of martensite laths gradually weakened, which should be related to the grain boundary migration, slat merging, and the coarsening of martensite, as shown in Figure 4a1–d1. It has been reported that the occurrence of relaxation and optimization of crystallographic orientation was usually accompanied by the homogenization and weakening of texture [19,21], which can be further analyzed through the phase distribution map and the local strain diagram.
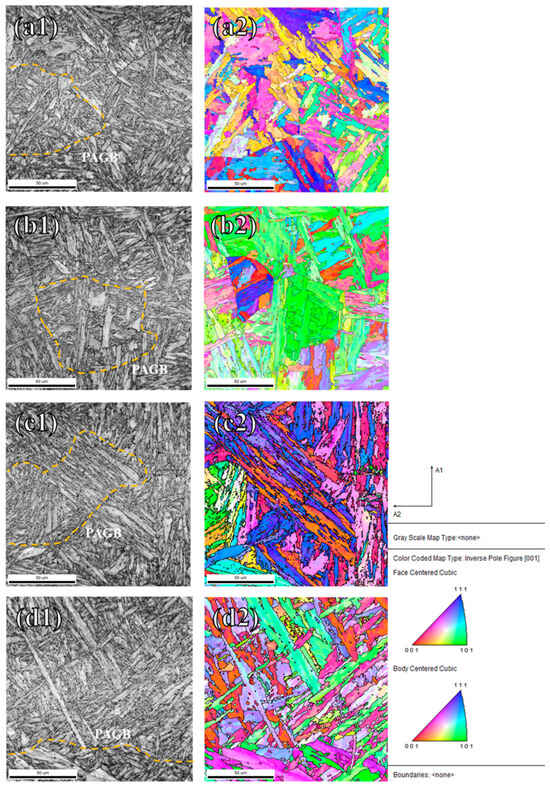
Figure 4.
EBSD maps of G115 steel with different aging times at 650 °C: (a) BM, (b) 500 h, (c) 3000 h, and (d) 10,000 h; 1—quality image (QI); 2—inverse pole figure (IPF). PAGB: prior austenite grain boundary.
Figure 5 shows the phase distribution maps of G115 steel after different aging processes, including the phase proportional results. In the map, the red area represents the martensite and the blue area represents reverse austenite. It can be found that the proportion of reverse austenite increased from 5% to 7% with aging time, which should be the transition and re-conversion from martensite to austenite under a high temperature [4,25]. Some studies have confirmed that this phenomenon was particularly obvious in the process of long-term high-temperature aging [26,28]. Overall, the martensitic structure stability of this steel is relatively high, resulting in a less significant reverse-phase transformation process.
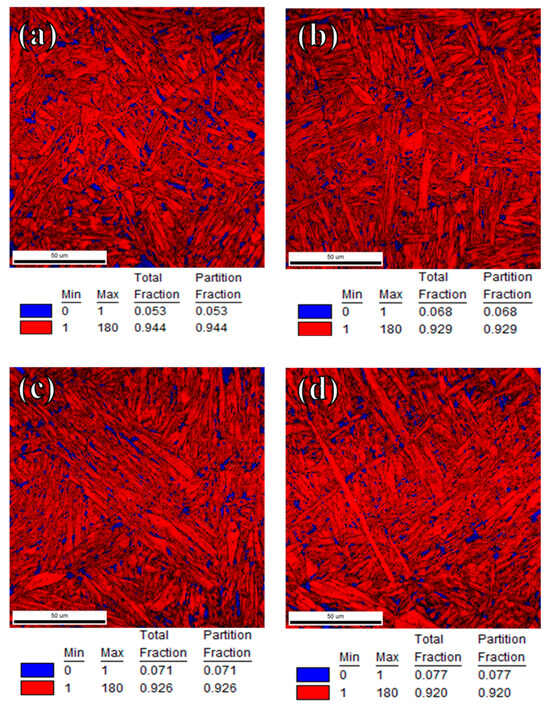
Figure 5.
Phase images of G115 steel with different aging times at 650 °C: (a) BM, (b) 500 h, (c) 3000 h, and (d) 10,000 h; red area: martensite; blue area: reverse austenite.
The grain boundary distribution of G115 steel after different aging times was characterized by the EBSD technique, as shown in Figure 6. It can be seen that the black lines denote high-angle grain boundaries (HAGBs) with misorientation angles > 15° and red lines represent low-angle grain boundaries (LAGBs) with values between 2° and 15° [12,18]. The proportion of HAGBs increases from 0.34 for BM to 0.38 for the sample after the 10,000 h aging process, which should be related to the grain boundary migration, the recrystallization, and the microstructure homogenization during the long-term aging process. The decrease in dislocation density, sub-crystalline merging, and grain boundary migration resulted in the decrease in the number of LAGBs, which will be discussed in the TEM results. The decrease in LAGBs may lead to a decrease in strength, while the increase in HAGBs may improve toughness [20,22].
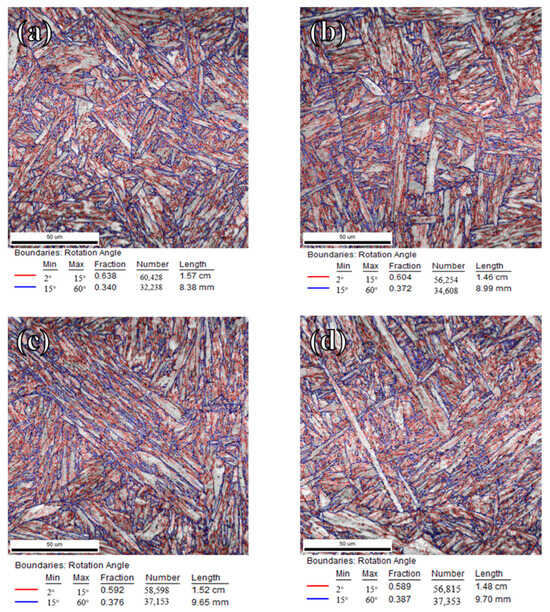
Figure 6.
Grain boundary distribution maps of G115 steel with different aging times at 650 °C: (a) BM, (b) 500 h, (c) 3000 h, and (d) 10,000 h; red line: LAGB; blue line: HAGB.
3.3. TEM Observation
Figure 7 presents the TEM images and the corresponding selected area electron diffraction (SAED) results of G115 steel after different aging times at 650 °C. With the extension of aging time, the microstructure of G115 steel has undergone significant changes, which may have important impacts on mechanical behavior and are worth further exploration. In the BM sample, a fine lath martensite structure can be observed, and precipitation particles are distributed on the lath martensite boundary [19,20]. Through SAED and the relevant literature, it can be determined that these particles are mainly composed of CrxCy and Laves phases, and there is significant dislocation packing at grain boundaries and lath martensite boundaries [15,27]. With the increase in aging time, the width of lath martensite gradually increases, and the size of precipitates on the lath martensite boundary significantly increases. After aging for 3000 h, the martensite laths significantly broaden with the decrease in dislocation density. When the aging time is extended to 10,000 h, the number and size of precipitated phases further significantly increase. In addition, the lath martensite structure began to become blurred, and the dislocations almost disappeared, indicating that long-term aging led to the degradation and homogenization of the structure. The evolution of these microstructures, including the decrease in dislocation density, the coarsening of martensite, the growth of the Laves phase, and CrxCy precipitates [20,24], may have an important impact on the high-temperature rupture strength of G115 steel, resulting in different high-temperature mechanical behaviors. Therefore, it is necessary to further discuss the high-temperature mechanical behavior of G115 steel and combine it with the microstructure evolution to derive the high-temperature mechanical micro-mechanism.
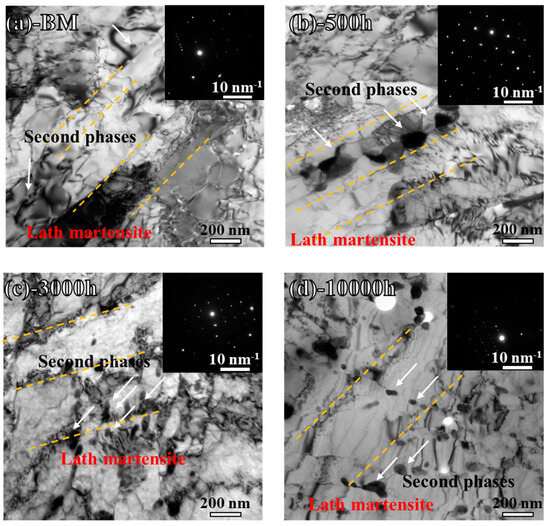
Figure 7.
TEM images and corresponding SAED of G115 steel with different aging times at 650 °C: (a) BM, (b) 500 h, (c) 3000 h, and (d) 10,000 h; white arrow: second phases; yellow line: boundaries of lath martensite.
3.4. Tensile Test Results and Analysis
The high-temperature durability of materials was studied through high-temperature slow-rate tensile tests. The engineering stress–strain curves of G115 steel after aging at different temperatures were plotted based on experimental data, as shown in Figure 8. It can be observed that the flow stress of the steels is sensitive to temperature changes, regardless of whether it has been processed within an aging process or not. Under constant strain rate conditions, as the test temperature increases, the overall flow stress shows a decreasing trend. At 650 °C, the thermal activation energy is significantly enhanced and the slip and climb movement of the dislocation is facilitated. This enhanced dislocation motion reduces the flow stress of the material. In addition, there is no significant transition from the yield point to the peak in any room temperature tensile curve, and the steel exhibits continuous yield behavior. However, there is a clear yield process observed in the high-temperature tensile curve, which is related to the microstructural evolution of G115 steel under mechanical high-temperature conditions. At a high temperature, the precipitated phases (such as MX phase, M23C6 carbide, and Laves phase) in G115 steel may coarsen, and their pinning effect on dislocation motion is weakened, resulting in a decrease in yield stress. According to the shape of the engineering stress–strain curve, the tensile curve can be divided into three stages [29,31,32,33]; as for the first stage, the flow stress increases with the increase in strain (from point A to point B). A long and stable softening curve (from point B to point C), in which the flow stress decreases linearly until mechanical instability (necking), occurs. The deformation of the specimen during the softening stage is uniform, which means that the plastic deformation is stable and uniform. For BM, the softening rate (slope) of flow stress is poorly correlated with temperature. For materials after aging, the softening rate (slope) of flow stress remains basically unchanged with increasing temperature. At point C, due to the appearance of necking, the softening behavior begins to change, leading to point D fracture. Figure 8e shows stress–strain curves of four samples at 650 °C. The high-temperature ductility of G115 steel exhibits a gradual decline with prolonged aging time, yet the ductility loss becomes statistically insignificant after 3000 h of thermal exposure. This phenomenon is intrinsically linked to the exceptional microstructural stability of G115 under elevated temperatures. It should be clarified that the plasticity data obtained from high-temperature tensile tests differ fundamentally from the impact toughness results at room temperature (our previous study demonstrated this at 700 °C) [32] in their physical implications. The former characterizes the material’s ductile fracture resistance under quasi-static conditions, governed by coupled creep–plasticity mechanisms, whereas the latter reflects the competition between cleavage fracture and ductile dimple rupture mechanisms under dynamic loading conditions. This distinction arises from their markedly different strain rate regimes (10−2–102 s−1 vs. 102–104 s−1) and underlying deformation mechanisms. More critically, the thermomechanical processing protocol implemented for G115 steel in this study exhibits fundamental distinctions from conventional approaches. Specifically, the thermal treatment regime was designed to replicate service conditions at 650 °C, where the as-received specimens underwent controlled air-cooling from this peak temperature to simulate material response during rapid start–stop cycles of ultra-supercritical boiler operations. The varying aging durations (0–3000 h) systematically correspond to distinct service time intervals, enabling precise tracking of microstructural evolution under prolonged thermal exposure.
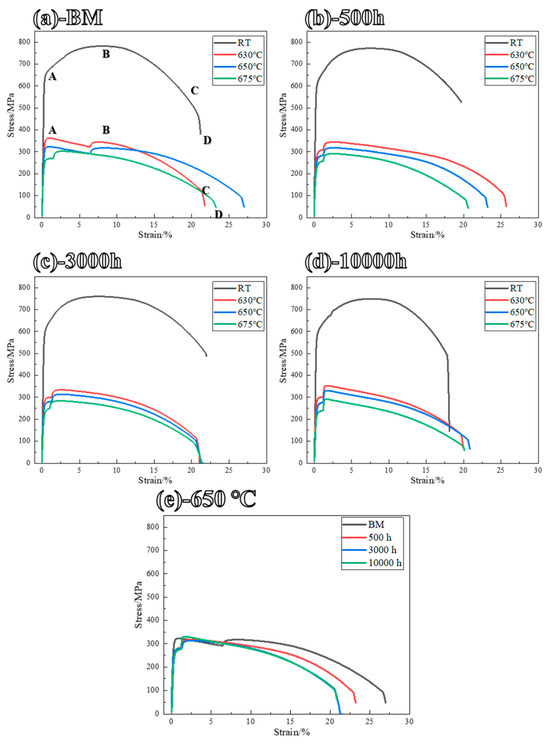
Figure 8.
Engineering stress–strain curves at 7 × 10⁻⁵ s−1 of G115 steel after long-term aging at 650 °C: (a) BM, (b) 500 h, (c) 3000 h, and (d) 10,000 h; (e) stress–strain curves of four samples at 650 °C.
Figure 9 presents the statistical results of tensile strength and reduction in cross-sectional area (ψ). It can be found that the tensile strength (Rm) of G115 steel treated with different aging times varies at different tensile test temperatures. As for room temperature (RT), Rm gradually decreases from ~780 MPa to ~750 MPa with the extension of aging time (Figure 9a), and the ψ value presents unsignificant changes, as shown in Figure 9b. At high-temperature conditions, Rm suddenly drops to below 400 MPa for all G115 steels. Meanwhile, Rm decreases from 630 °C to 675 °C under the same trend. Further, the ψ value increases with test temperature in each sample, while it can be found that the ψ value at RT is basically the same as that at 675 °C. The obvious differences in the ψ value between RT and high temperatures (630 °C, 650 °C, and 675 °C) can be found in Figure 9b, which confirms the phenomenon of a persistent decrease in high temperatures.
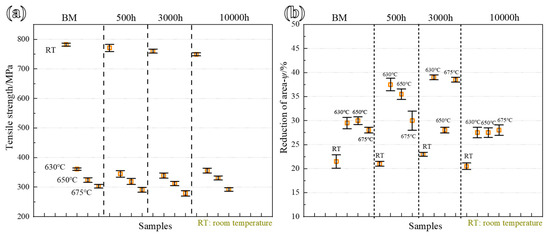
Figure 9.
The statistical results of (a) tensile strength (Rm) and (b) reduction in cross-sectional area (ψ) for different G115 steels.
For exploring the fracture mechanism of steels during tensile deformation at elevated temperatures, fracture morphologies are shown in Figure 10, Figure 11, Figure 12 and Figure 13, which exhibit obvious necking features, including the radiation area and the fiber region. As shown in Figure 10, many micro-cracks and fine dimples can be found in BM tested at RT, which should be related to the deformation of microstructure. The grains containing lath martensite with different orientations were bound to each other (Figure 4), and the slip must be carried out along multiple slip systems, which crossed each other. The results show a snake-like sliding feature on the fracture in Figure 10b. Meanwhile, the second phases provided crack initiation sites, and the boundaries of prior austenite grain and lath martensite provided a crack propagation path. As for the BM tested at 675 °C, the ductile fracture mode can be confirmed from the dimples with a large size in Figure 10d, which should be related to the relatively uniform microstructure [20,22].
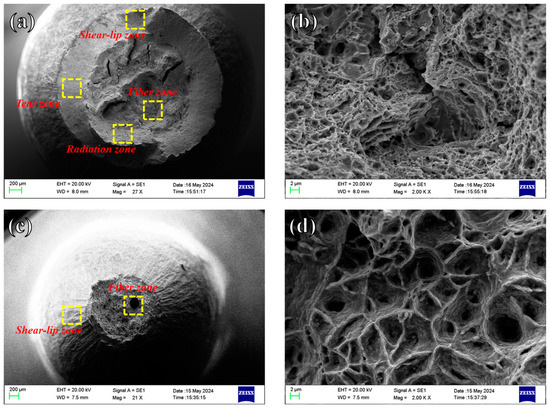
Figure 10.
SEM micrographs of tensile fracture for BM at (a,b) RT and (c,d) 675 °C (the magnified morphology at the fiber zone is shown on the side).
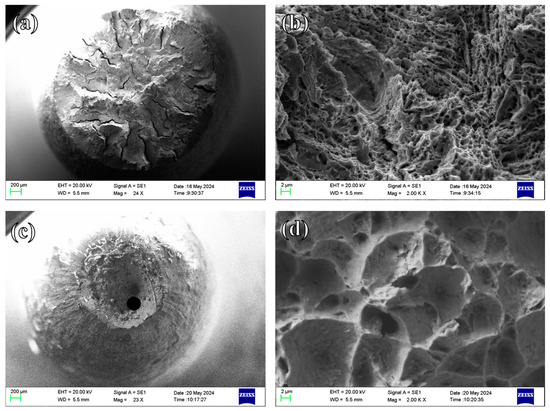
Figure 11.
SEM micrographs of tensile fracture for G115 after aging at 650 °C for 500 h tested at (a,b) RT and (c,d) 675 °C, and the magnified morphology at the fiber zone is shown on the side.
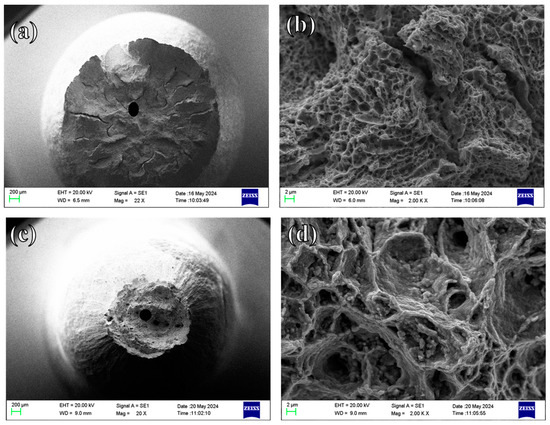
Figure 12.
SEM micrographs of tensile fracture for G115 after aging at 650 °C for 3000 h tested at (a,b) RT and (c,d) 675 °C, and the magnified morphology at the fiber zone is shown on the side.
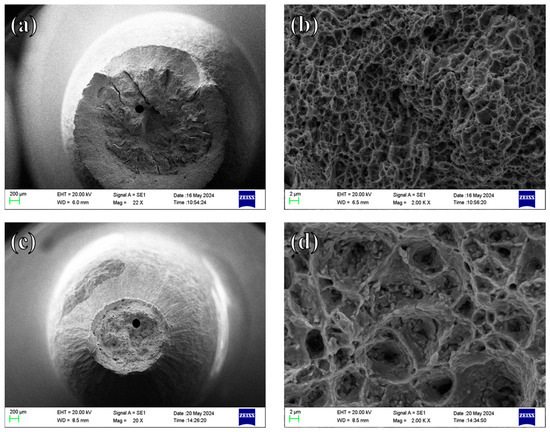
Figure 13.
SEM micrographs of tensile fracture for G115 after aging at 650 °C for 10,000 h tested at (a,b) RT and (c,d) 675 °C, and the magnified morphology at the fiber zone is shown on the side.
As shown in Figure 11, the tensile fracture morphologies of G115 steel aged at 650 °C for 500 h was obtained after testing at RT and 675 °C. Compared with BM tested at RT, the number of cracks in the fiber zone has significantly increased in the G115 steel aged at 650 °C for 500 h, which should be related to the weakening of strength at the lath martensite boundary, as shown in Figure 11b. The cracks and micro-dimples shown in Figure 11b indicate that the initiation of cracks was related to the continuous combination of micro-dimples during deformation [23,25]. As for the sample tested at 675 °C, the dimples present a larger size than that in BM, which should be related to the decrease in strength at the lath martensite boundary [20,29].
Figure 12 shows that the tensile fracture morphologies of G115 steel aged at 650 °C for 3000 h was obtained after testing at RT and 675 °C. The sample aged for 3000 h presents a similar morphology as the sample after the 500 h aging process, which is mainly composed of the fiber zone and radiation zone, and the tear zone was compressed and almost invisible. This fracture mode usually means that the material does not undergo significant plastic deformation before fracture, and the crack spreads rapidly. As for the sample tested at 675 °C, some large dimples and particles can be found in the fracture morphology, as shown in Figure 12. Combined with the EBSD and TEM results, the Laves phase particles with large sizes acted as the main factor to reduce toughness, which destroyed the stabilization of the microstructure and weakened the ability to resist the local plastic deformation [29,32]. The enlarged micro-dimples in Figure 12b and the second phase particle distributed at the dimple boundary and bottom jointly confirm the above inference [25,29,31].
Figure 13 shows the SEM micrographs of tensile fracture for G115 after aging at 650 °C for 10,000 h tested at RT and 675 °C. The number of cracks decreases compared with the samples after the 500 h and 3000 h aging processes, and many dimples can be found in the fiber zone. Consistent with the microstructural evolution observed in the 3000 h aged specimen, second-phase particles exhibited predominant localization within nanoscale dimples, demonstrating characteristic dimensional confinement that aligns with established phase precipitation mechanisms [22,27], while the bottoms of the dimples with larger sizes are clean, which should be related to the fact that the precipitates in the large dimple region may be dissolved or torn, while the precipitates in the small dimple region remain [10,13]. The large dimple corresponds to the area with large plastic deformation, and the small dimple corresponds to the area with local stress concentration, which should be a pre-condition for rupture [15,18]. Thus, it can be concluded that the formation and growth of precipitated phases, the decreased dislocation density, and the formation of HAGBs promoted the reduction in material toughness to some extent [26,28]. It is precisely because of the relatively high microstructural thermal stability of G115 steel during long-term aging at high temperatures that the microstructural changes that affect mechanical properties are not significant enough, ultimately leading to an insignificant impact of aging time on the high-temperature tensile durability of G115 steel.
4. Conclusions
The relationship between the high-temperature tensile durability and the microstructure after aging at 650 °C with different times for G115 steel was systematically investigated. The increase in width of lath martensite and HAGBs and the decrease in dislocation density were found in G115 steel with increasing aging times from 500 h to 10,000 h at 650 °C. The second precipitates grew obviously with aging time, such as CrxCy, Cu-rich precipitates, and Laves phases. The tensile strength decreased from ~750 MPa to ~350 MPa with the increase in test temperature (from room temperature to 675 °C, while the differences in high-temperature tensile durability among steels aged with different times were insignificant, which should be related to the relatively high microstructural thermal stability of G115 steel during the aging process, which was confirmed by the subtle reverse-phase transformation from martensite to reverse austenite in this work.
Author Contributions
Conceptualization, S.M. and S.H.; Methodology, X.L. and Y.L.; Software, X.L. and Y.L.; Validation, X.L., Y.L. and C.W.; Formal analysis, S.M. and S.H.; Investigation, S.M., S.H., X.L. and Y.L.; Writing—original draft, S.M. and S.H.; Writing—review & editing, C.W.; Funding acquisition, C.W. All authors have read and agreed to the published version of the manuscript.
Funding
This research was funded by Heilongjiang Province’s key technology project ‘Leading the Charge with Open Competition’ of Science and Technology Department, Heilongjiang Province (grant number 2023ZXJ04A02) and the National Key Research and Development Program of China (grant number 2022YFB3705200).
Data Availability Statement
The data presented in this study are available upon request from the corresponding author. The data are not publicly available due to technical or time limitations.
Conflicts of Interest
Authors were employed by the company China Special Equipment Inspection and Research Institute. The authors declare that the research was conducted in the absence of any commercial or financial relationships that could be construed as a potential conflict of interest.
References
- Chen, Y.D.; Chen, X.D.; Jiang, H.F.; Chen, C.G.; Zhang, X.A. Design technology of large-scale spiral wound heat exchanger in re-finery industry. Proc. Eng. 2015, 130, 286–297. [Google Scholar] [CrossRef]
- Abe, F.; Tabuchi, M.; Tsukamoto, S. Alloy Design of Martensitic 9Cr-Boron Steel for A-USC Boiler at 650 °C-Beyond Grades 91, 92 and 122. In Energy Materials 2014: Conference Proceedings; John Wiley & Sons, Inc.: Hoboken, NJ, USA, 2016. [Google Scholar]
- Yang, X.J.; Liu, M.H.; Liu, Z.Y.; Du, C.W.; Li, X.G. Failure analysis of a 304 stainless steel heat exchanger in liquid sulfur recovery units. Eng. Fail. Anal. 2020, 116, 104729. [Google Scholar] [CrossRef]
- Jing, H.; Su, D.; Xu, L.; Zhao, L.; Han, Y.; Sun, R. Finite element simulation of creep fatigue crack growth behavior for P91 steel at 625 °C considering creep-fatigue interaction. Int. J. Fatigue 2017, 98, 41–52. [Google Scholar] [CrossRef]
- Gong, X.; Short, M.P.; Auger, T.; Charampopoulou, E.; Lambrinou, K. Environmental degradation of structural materials in liquid lead- and lead-bismuth eutectic-cooledreactors. Prog. Mater. Sci. 2022, 126, 100920. [Google Scholar] [CrossRef]
- Zhang, J.C.; Di, H.S.; Deng, Y.G.; Misra, R.D.K. Effect of martensite morphology and volume fraction on strain hardening and fracture behavior of martensite-ferrite dual phase steel. Mater. Sci. Eng. A 2015, 627, 230–240. [Google Scholar] [CrossRef]
- Semba, H.; Abe, F. Alloy design and creep strength of advanced 9%Cr USC boiler steels containing high concentration of boron. J. Energ. Mater. 2013, 4, 238–244. [Google Scholar] [CrossRef]
- Abe, F. Alloy design of creep and oxidation resistant 9% Cr steel for high efficiency USC power plant. Mater. Sci. Forum 2012, 706–709, 3–8. [Google Scholar] [CrossRef]
- Wen, J.F.; Tu, S.T. A multiaxial creep-damage model for creep crack growth considering cavity growth and microcrack interaction. Eng. Fract. Mech. 2014, 123, 197–210. [Google Scholar] [CrossRef]
- Ostergren, W.J. A damage function and associated failure equations for predicting hold time and frequency effects in elevated temperature, low cycle fatigue. J. Test. Eval. 1976, 4, 327–339. [Google Scholar] [CrossRef]
- Zhang, M.Y.; He, G.Z.; Lapington, M.; Zhou, W.Y.; Shory, M.P.; Bagot, P.A.J.; Moody, M.P. Nano-scale corrosion mechanism of T91 steel in staticlead-bismuth eutectic: A combined APT, EBSD, and STEM investigation. Acta Mater. 2024, 271, 119883. [Google Scholar] [CrossRef]
- Abe, F. Precipitate design for creep strengthening of 9% Cr tempered martensitic steel for ultra-supercritical power plants. Sci. Technol. Adv. Mat. 2008, 9, 013002. [Google Scholar] [CrossRef] [PubMed]
- Liu, S.R.; Zhu, W.J.; Li, Y.J.; Ma, X.F.; Wang, D. New insights into selective leaching and ferritization in 15-15Ti austenitic steel in lead-bismuth eutectic through parent phase reconstruction. Scr. Mater. 2025, 254, 116316. [Google Scholar] [CrossRef]
- Xu, L.; Zhao, L.; Gao, Z.; Han, Y. A novel creep-fatigue interaction damage model with the stress effect to simulate the creep-fatigue crack growth behavior. Int. J. Mech. Sci. 2017, 130, 143–153. [Google Scholar] [CrossRef]
- Ma, X.L.; Huang, C.X.; Moering, J.; Ruppert, M.; Hoppel, H.W.; Goken, M.; Narayan, J.; Zhu, Y.T. Mechanical properties of cop-per/bronze laminates: Role of interfaces. Acta Mater. 2016, 116, 43–52. [Google Scholar] [CrossRef]
- Yan, P.; Liu, Z.; Bao, H.; Weng, Y.; Liu, W. Effect of tempering temperature on the toughness of 9Cr-3W-3Co martensitic heat re-sistant steel. Mater. Des. 2014, 54, 874–879. [Google Scholar] [CrossRef]
- Zhao, L.; Xu, L.; Nikbin, K. Predicting failure modes in creep and creep-fatigue crack growth using a random grain/grain bound-ary idealised microstructure meshing system. Mater. Sci. Eng. A 2017, 704, 274–286. [Google Scholar] [CrossRef]
- Lemaitre, J.A.; Plumtree, A. Application of damage concepts to predict creep-fatigue failures. J. Eng. Mater. Technol. 1979, 101, 284–292. [Google Scholar] [CrossRef]
- Zhao, L.; Jing, H.; Han, Y.; Xiu, J.; Xu, L. Prediction of creep crack growth behavior in ASME P92 steel welded joint. Comp. Mater. Sci. 2012, 61, 185–193. [Google Scholar] [CrossRef]
- Hyde, T.H.; Saber, M.; Sun, W. Testing and modelling of creep crack growth in compact tension specimens from a P91 weld at 650 °C. Eng. Fract. Mech. 2010, 77, 2946–2957. [Google Scholar] [CrossRef]
- Maia, E.L.; Gavrilov, S.; Tsisar, V.; Baert, K.; De Graeve, I. Early stages of liquid-metal corrosion on pre-oxidized surfaces of austenitic stainless steel 316L exposedto static Pb-Bi eutectic at 400 °C. Corros. Sci. 2024, 227, 111680. [Google Scholar] [CrossRef]
- Hajyakbary, F.; Sietsma, J.; Böttger, A.J. An improved X-ray diffraction analysis method to characterize dislocation density in lath martensitic structures. Mater. Sci. Eng. A 2015, 639, 208–218. [Google Scholar] [CrossRef]
- Gao, Q.; Dong, X.; Li, C.; Lin, Z.; Yang, X.; Dai, M. Microstructure and oxidationproperties of 9Cr-1.7W-0.4Mo-Co ferritic steel after isothermal aging. J. Alloys Compd. 2015, 651, 537–543. [Google Scholar] [CrossRef]
- Cantwell, P.R.; Tang, M.; Dillon, S.J.; Luo, J.; Rohrer, G.S.; Harmer, M.P. Grainboundary complexions. Acta Mater. 2014, 62, 1–48. [Google Scholar] [CrossRef]
- Xiao, B.; Xu, L.; Zhao, L.; Jing, H.; Han, Y.; Tang, Z. Microstructure evolution and fracture mechanism of a novel 9Cr tempered martensite ferritic steel during short term creep. Mater. Sci. Eng. A 2017, 707, 466–477. [Google Scholar] [CrossRef]
- Zhu, S.P.; Huang, H.Z.; He, L.P.; Liu, Y.; Wang, Z. A generalized energy-based fatigue-creep damage parameter for life prediction of turbine disk alloys. Eng. Fract. Mech. 2012, 90, 89–100. [Google Scholar] [CrossRef]
- Qu, Z.; Zhang, Z.J.; Liu, R.; Xu, L.; Zhang, Y.N.; Li, X.T.; Zhao, Z.K.; Duan, Q.Q.; Wang, S.G.; Li, S.J.; et al. High fatigue resistance in a titanium alloy via near-void-free 3D printing. Nature 2024, 626, 999–1004. [Google Scholar] [CrossRef] [PubMed]
- Saxena, A.; Narasimhachary, S.B. Round robin on creep fatigue crack growth testing for verification of ASTM standard 2760-10. Mater. High Temp. 2014, 31, 357–363. [Google Scholar] [CrossRef]
- Schroer, C.; Tsisar, V.; Durand, A.; Wedemeyer, O.; Skrypnik, A.; Konys, J. Corrosionin iron and steel T91 caused by flowing lead–bismuth eutectic at 400 °C and 10–7mass% dissolved oxygen. ASME J. Nucl. Rad. Sci. 2019, 5, 011006. [Google Scholar] [CrossRef]
- Fedoseeva, A.; Dudova, N.; Kaibyshev, R. Creep behavior and microstructure of a 9Cr-3Co-3W martensitic steel. J. Mater. Sci. 2017, 52, 2974–2988. [Google Scholar] [CrossRef]
- Xu, Y.T.; Wang, M.J.; Wang, Y.; Gu, T.; Chen, L.; Zhou, X.; Ma, Q.; Liu, Y.M.; Huang, J. Study on the nucleation and growth of Laves phase in a 10% Cr martensite ferritic steel after long-term aging. J. Alloys Compd. 2015, 621, 93–98. [Google Scholar] [CrossRef]
- Yu, J.; Ma, S.; Liang, K.; Yan, K.; Yang, X.; Zhang, S. Evolutions on Microstructure and Impact Toughness of G115 Steel after Long-Term Aging at 700 °C. Metals 2024, 14, 921. [Google Scholar] [CrossRef]
- Hajra, R.N.; Rai, A.K.; Tripathy, H.P.; Raju, S.; Saroja, S. Influence of tungsten on transformation characteristics in P92 ferritic-martensitic steel. J. Alloys Compd. 2016, 689, 829–836. [Google Scholar] [CrossRef]
Disclaimer/Publisher’s Note: The statements, opinions and data contained in all publications are solely those of the individual author(s) and contributor(s) and not of MDPI and/or the editor(s). MDPI and/or the editor(s) disclaim responsibility for any injury to people or property resulting from any ideas, methods, instructions or products referred to in the content. |
© 2025 by the authors. Licensee MDPI, Basel, Switzerland. This article is an open access article distributed under the terms and conditions of the Creative Commons Attribution (CC BY) license (https://creativecommons.org/licenses/by/4.0/).