Article

Production of ZnO Nanofibers from Zinc Galvanizing Flue Dust

by
Klaudia Kundráková
1,*,
Jana Pirošková
1,
Jarmila Trpčevská
1 and
Erika Múdra
2
1
Institute of Recycling and Environmental Technologies, Faculty of Materials, Metallurgy and Recycling, Technical University of Košice, Letná 1/9, 042 00 Kosice, Slovakia
2
Institute of Materials Research, Slovak Academy of Sciences, Watsonova 45, 040 01 Košice, Slovakia
*
Author to whom correspondence should be addressed.
Metals 2025, 15(5), 522; https://doi.org/10.3390/met15050522
Submission received: 14 March 2025 / Revised: 15 April 2025 / Accepted: 21 April 2025 / Published: 6 May 2025

Abstract

:
This work focuses on the production of ceramic nanofibers from waste materials, which represents a significant contribution to the sustainable use of resources and innovative solutions in the field of nanotechnology. The research builds on existing knowledge of nanofiber production, with a specific focus on the use of zinc galvanizing flue dust. The main objective of the study is to explore the possibilities of converting zinc-containing waste materials into ceramic nanofibers, introducing a new direction in nanotechnology. Laboratory experiments involved leaching processes and electrostatic spinning processes of zinc solutions. From the obtained results, it can be concluded that ZnO ceramic nanofibers produced from both synthetic and real solutions exhibit similar fiber structures. Therefore, it can be stated that both acids (HCl and H2SO4) are suitable for preparation. Among them, 0.5 M HCl is the most ideal, resulting in oval fibers with a rough and coarse surface, while 0.5 M H2SO4 produces fibers with a different morphology in the form of hollow ribbons, which are presumed to have a higher specific surface area. Thus, it can be concluded that the production of ceramic nanofibers from zinc galvanizing flue dust is feasible and effective, with electrostatic spinning proving to be a low-waste technology. The study also examines the influence of contaminants from real waste solutions on the production of ceramic nanofibers and compares their properties with nanofibers obtained from synthetic solutions. Experimental results suggest that contaminants in real solutions did not have a negative impact on the morphology of the prepared ZnO nanofibers. In conclusion, the production of ZnO ceramic nanofibers from waste offers a promising approach for the future development of nanotechnology, combining innovation with sustainability and efficient resource utilization.

1. Introduction

Approximately 60% of the world’s zinc production is used to protect steel from corrosion [1]. One of the important methods is hot-dip galvanizing (HDG), namely the batch hot-dip galvanizing process, also known as the general galvanizing process [1]. This process is significant not only for its wide range of applications but also for producing zinc-rich waste, which is significant not only for its wide range of applications but also for the production of zinc-rich waste [1]. The waste represents a valuable source for the recovery of secondary zinc [1]. The hot-dip galvanizing process consists of immersing a pre-treated steel part in a zinc bath at a temperature of around 450 °C [1]. The largest source of zinc waste is dross. There are two types of drosses: bottom and top. The bottom zinc dross contains more than 97% zinc and 6% iron [1]. On the other hand, the top dross, also known as zinc ash, contains about 70% zinc [1]. Zinc galvanizing flue dust is another solid waste that originated during the galvanizing process [1]. This waste is characterized by fine dust particles ranging from 1 to 2 µm [2]. Zinc galvanizing flue dust, often containing more than 20% zinc, is formed when the steel parts come into contact with molten zinc, resulting in the formation of so-called ‘white smoke’ [1,3]. The formation of white smoke is closely related to the decomposition of NH4Cl (around 340 °C), which is a part of the flux together with water vapor and oils. These, together with a fine dust called zinc drift, are captured by filtering devices [4]. According to the EPA (Environmental Protection Agency, European Waste Catalog and Hazardous Waste List, KO61), zinc galvanizing flue dust is classified as hazardous waste [5].
The processing of zinc galvanizing flue dust has not yet received much attention, and there are no known procedures for its processing in practice. However, some experimental studies have focused on the use of hydrometallurgical methods in order to obtain various zinc and flux products. These studies have investigated the leaching process in different environments such as water, dilute HCl, and H2SO4, looking at the effect of various factors such as temperature, liquid-to-solid phase ratio, leaching time, and others [6,7,8,9]. In one study, a pyrometallurgical process was also used in combination with the treatment of zinc ash, which has a similar chemical composition [10].
Regarding the electrostatic spinning of ZnO-based nanofibers, a short literature review was carried out. Electrostatic spinning is an advanced technology that allows the production of nanofibers with diameters on the order of nanometers, thus providing materials with large surface area, high porosity, and excellent mechanical and chemical properties. The process uses a strong electrostatic field to pull thin fibers from a liquid precursor, most commonly a polymer solution or sol–gel mixtures containing suitable materials to produce the desired nanofibers [11,12,13].
  • Electrostatic spinning includes several types:
Needle spinning: This is the most common electrostatic spinning method, in which the polymer solution or melt is fed through a thin needle. An electric field is applied between the needle and the collecting electrode, creating a jet of polymer that is extended into a fine filament under the influence of electrostatic forces. The resulting filament is then collected on a collection surface, which may be flat or rotating. This method allows precise control of the process and is suitable for both laboratory and industrial applications [11,12,13]. Needle-free spinning: In this method, the fibers are not formed from a thin needle but from the free surface of the polymer solution or melt. This type of spinning often uses a rotating electrode or surface electrode where the polymer is distributed, and the electric field pulls the fibers directly from the surface. This technique allows for higher fiber production because multiple fibers can be formed simultaneously from different locations. Nanospider™ is an example of a device [11,12,13]. Electrostatic spinning from a rod is a specific variation of needle-free electrostatic spinning, where a solid rod is used instead of a needle to generate fibers. A polymer solution is applied to the surface of the rod, and when a high voltage is applied between the rod and the collection electrode, fine fibers are generated and trapped on the collection surface. This process allows multiple filaments to be formed simultaneously from different points on the rod surface, increasing production efficiency and eliminating the need for complicated nozzles [11,12,13].
In the fabrication of pure zinc oxide (ZnO) nanofibers, electrostatic spinning is very popular because it enables their simple and efficient preparation with controlled dimensions and structures. The electrostatic spinning process typically involves the use of a zinc-containing solution, often in combination with polymer solutions (polyvinylpyrrolidone, dimethylformamide, polyvinyl alcohol, and others), which provide suitable high-elastic properties for fiber formation. These polymers are subsequently removed by calcination to obtain a pure ZnO nanofibrous structure [11,12,13,14].
  • The process of manufacturing nanofibers consists of several steps:
  • Preparation of electrostatic spinning solution;
  • Electrostatic spinning of polymer-inorganic composite fibers;
  • Calcination of composite fibers to remove the organic components (polymer and solvent) and obtain a pure ceramic phase;
  • Annealing of ceramic fibers to modify the microstructure [15,16].
The most challenging part of this process is preparing a suitable solution, as it requires a precise balance of forces between charges, viscosity, and surface tension. If the correct composition is achieved, the resulting ceramic nanofibers can be applied in fields such as catalysis, filtration, and medical materials [15,16].
In one of the studies, the authors focused on the production of ZnO nanofibers and the effect of aluminum oxide doping on the structural, electrical, and optical properties of the produced ZnO nanofibers. ZnO nanofibers doped with Al2O3 were prepared using a sol–gel process with polyvinylpyrrolidone (PVP), zinc acetate (Zn(CH3COO)2), and aluminum acetate (Al(CH3COO)3) as precursors [17]. For the zinc oxide precursor solution, zinc acetate (Zn(CH3COO)2) was dissolved in water at a ratio of 1:4. A solution of polyvinylpyrrolidone (PVP) and ethanol at a ratio of 1:6 was added to the aqueous zinc acetate solution in a 1:1.5 ratio. The aluminum oxide precursor solution was prepared with a weight ratio of aluminum acetate (Al(CH3COO)3) to water and ethanol of 1:1:1, and it was magnetically stirred for 24 h at room temperature [17]. The prepared PVP solution with a weight ratio of 3:40 was then added to the aluminum acetate solution in a weight ratio of 1.7:1. The amount of the composite PVP/Al(CH3COO)3 solution added to the PVP/Zn(CH3COO)2 solution was varied according to the desired level of doping. The authors concluded that the electrical conductivity of their nanofibers depends on the amount of aluminum dopant in the matrix, which is reflected in changes in the oxidation state. They found that electrospinning is a productive, simple, and easy method for preparing and improving the conductivity of zinc oxide semiconductor nanofibers [17].
In another study, researchers focused on the highly efficient photocatalytic activity of stable ZnO nanofibers. Manganese-doped zinc oxide nanofibers (Mn:ZnO) were synthesized using the electrospinning process and compared with undoped ZnO nanofibers. To examine the photocatalytic activity of the nanofibers under both UV and visible light, methylene blue (MB) was used as a representative dye pollutant [18]. Mn:ZnO nanofibers were synthesized in two steps using zinc acetate dihydrate (Zn(CH3COO)2·2H2O, 98%), polyvinyl alcohol (PVA), and manganese acetate (C4H6MnO4·4H2O). In the first step, a solution for electrospinning was prepared, and composite fibers were collected on electrically conductive substrates [18]. In the second step, the composite fibers were heat-treated in air to obtain ZnO nanofibers with a wurtzite crystal structure (iron and zinc sulfide [(Zn,Fe)S]). The amount of 1.54 g of PVA was completely dissolved in 10 mL of deionized water at 70 °C for 4 h under mild stirring. After cooling to room temperature, 1.0 g of Zn(CH3COO)2·2H2O and 4.5 mL of deionized water were added to the prepared PVA solution. Manganese acetate (Mn(CH3COO)2) was used as the source of Mn dopant, added to the solution in various concentrations (0, 0.3, 0.5, 1.0, and 3.0 wt%) under intense stirring [18]. Among all studied dopant concentrations, 0.5 wt% of Mn:ZnO was identified as the optimal composition in the produced fibers. The authors also focused on the degradation of the nanofibers produced using the MB (methylene blue) dye and found out that the degradation reached ~100% efficiency after 90 min and ~35% after 100 min using UV light. The doped fibers exhibited high stability and durability in degradation tests, even after ten cycles. The Mn:ZnO nanofibers are, therefore, suitable materials for photocatalytic applications with excellent efficiency and high repeatability [18].
The literature review indicates that the production of ZnO-based nanofibers has significant applications, both in medicine as biosensors for detecting glucose levels in the body and in industry for the removal of phenols from wastewater [15,19,20,21,22,23].
Based on the theoretical knowledge gained from the production of ZnO ceramic nanofibers, it is clear that their production exclusively uses materials of high purity with a high content of the target metal, in this case, zinc. Furthermore, it can be stated that none of the reviewed scientific literature uses waste materials for the preparation of solutions for electrospinning. Therefore, waste materials, which are valuable secondary sources of metals such as Zn, also come into consideration. In the area of waste processing, electrospinning appears to be a potential method for the material recovery of such waste.
The mentioned zinc dust was subjected to an experimental study of the leaching process, followed by a needleless electrospinning process, with the aim of producing ZnO ceramic nanofibers.

2. Materials and Methods

The material used in the experimental part was zinc galvanizing flue dust. Due to the inhomogeneity of zinc galvanizing flue dust, particle size adjustment was performed to prepare a homogeneous and representative sample for further analysis. The sample was subjected to initial chemical analysis using the HRCS AAS (high-resolution continuum source atomic absorption spectrometry method) on a contrAA 700 device (Analytik Jena AG, Jena, Germany) to determine the content of elements (Zn, Fe, Al, Cu, and Pb). Chlorides were analyzed using a titration method with a 0.1 M AgNO3 (Centralchem, Bratislava, Slovakia) solution and 5% of K2CrO4 (Centralchem, Bratislava, Slovakia) as an indicator. A total of 25 measurements were taken for each element, from which the average values, standard deviation, and relative standard deviation were calculated (Table 1).
Subsequently, XRF (X-ray fluorescence) analyses was performed using the Shimadzu-EDX 7000 (Kyoto, Japan) device in a helium atmosphere, and XRD phase analyses was conducted on the PANalytical PW3064/60 diffractometer with the XPERT-PRO system (Philips, Almelo, The Netherlands). The measurement conditions for X-ray analyses were as follows: cobalt lamp, measurement range from 10 to 120 [°2Θ], intensity of 30 mA, and voltage of 40 kV. Prior to the experimental study, a thermodynamic study was performed to track the changes in the standard Gibbs free energy of chemical reactions using HSC Chemistry software (version 10.0, Outotec, Pori, Finland) to generate Eh-pH diagrams. Galvanizing flue dust and high-purity zinc oxide samples were used for leaching. Analytical-grade p.a. chemicals were used for the experimental study.

2.1. Preparation of Synthetic Solutions Containing Zn

The leaching process was carried out in a glass beaker, which was placed in a water bath. A diluted solution of hydrochloric acid (HCl, Centralchem, Bratislava, Slovakia) and sulfuric acid (H2SO4, Centralchem, Batislava, Slovakia) with concentrations of 0.01 M, 0.5 M, and 1 M was used as the leaching agent. High-purity ZnO (Centralchem, 99.6% purity, Bratislava, Slovakia) was used to prepare the synthetic solutions, and it was added in such a quantity that the zinc concentration in the solution reached 40 g/L. The leaching process itself took place at a temperature of 60 °C and lasted for 30 min. During leaching, the slurry was mixed at a constant speed of 450 rpm. Samples for chemical analysis were taken after the experiment from the filtered leachate, with a sample volume of 10 mL. These samples were then analyzed using atomic absorption spectroscopy (AAS) to determine the zinc content in the solution. The main reason for preparing synthetic solutions and their subsequent electrospinning was to compare the preparation conditions and the resulting properties of nanofibers with those produced from real solutions. Furthermore, the study examined how impurities in the zinc galvanizing flue dust, passed into the solution, might affect the formation and structure of ceramic nanofibers made.

2.2. Preparation of Real Solutions Containing Zn

Leaching of the zinc dust was carried out in a similar method. The leaching agent was an aqueous solution of HCl and H2SO4 with concentrations of 0.01, 0.5, and 1 M. The liquid-to-solid phase ratio was L:S 30 (300 mL:10 g) and 5 (300 mL:60 g). Leaching took place at a temperature of 60 °C. The fine-grained fraction of zinc dust was chosen for leaching. The leaching time was 30 min. The slurry was mixed at a constant speed of 450 rpm. Samples for chemical analyses, with a volume of 10 mL, were taken only after the experiment from the filtered leachate, and the final volume of the leachate was determined. The samples were subjected to chemical analyses by AAS to analyze the Zn and other contaminants (Fe, Cu, Pb, Al) in the solution.
Prepared solutions were subjected to needleless electrospinning from the free surface of the polymer solution using a rotating wire electrode on the Nanospider™ device (Elmarco Co., Liberec, Czech Republic) for the production of zinc oxide (ZnO) nanofibers from both synthetic and real solutions.

2.3. Methodology of Experimental Work on Electrostatic Spinning

Two types of solutions were used to prepare the solution for needleless electrospinning: one obtained from the leaching of zinc dust and the other synthetic. Polyvinylpyrrolidone (C6H9NO) (PVP, SIGMA, Mw 360,000 g/mol) was added to both solutions to ensure the spinning process. Ethanol (C2H6O) (Centralchem, Bratislava, Slovakia, absolute) was used as a solvent for PVP. Additionally, citric acid (C6H8O7) (Centralchem, Bratislava, Slovakia, 99.8%) was added to help form stable complexes in the solution. Acetic acid (CH3COOH) (Acros Organics, 99.7%) was also added to all solutions, except those containing H2SO4, to increase the conductivity of the solution. The initial mass ratio of the components—solution/PVP/ethanol/citric acid/acetic acid—was 48/6/6/2.6/1. The mixture was stirred on a magnetic stirrer at 25 °C for approximately 48 h until it became completely homogeneous. The prepared solution was then electrospun using needleless technology on the Nanospider™ device (Elmarco Co., Liberec, Czech Republic), with a rotating wire electrode (Figure 1). A voltage range of 75 to 80 kV was applied between the spinning and collecting electrodes, with a distance between them from 130 mm to 140 mm. Electrostatic spinning occurred at a temperature of 25 °C and a relative humidity of 50%.
The ceramic nanofibers were subsequently obtained by heat treatment in alumina crucibles in a laboratory chamber furnace at temperatures of 550 °C and 600 °C, in an oxidative atmosphere (air), for 30 min at the given temperature with a heating rate of 10 °C/min.

3. Results and Discussion

3.1. Composition of Zinc Galvanizing Flue Dust

The results of the chemical analyses confirmed that the zinc galvanizing flue dust sample contained 25.33% zinc and 24.87% chlorides, while the content of other elements (Al, Fe, Pb, Cu) was below 1%, as shown in Table 1. Subsequently, XRD analysis confirmed the presence of the main zinc phases (NH4)2[ZnCl4] and ZnCl4, which are complex compounds of zinc with chlorides and ammonia. Phase analysis also identified the presence of iron in the phase (NH4)3[FeCl5].

3.2. Thermodynamic Study

The thermodynamic study of the behavior of Zn and Fe during the leaching of zinc galvanizing flue dust for selected acids and H2O was described by reactions (1–6). The ΔG°T calculations for the reactions were conducted at standard pressure and a temperature of 60 °C, referenced to 1 mol.
(NH4)2[ZnCl4] + HCl(ia) = ZnCl2(ia) + 2NH4Cl(ia) + HCl(ia)          ΔG°T = −55.50 [kJ]
[ZnCl2](NH3)2 + HCl(a) = ZnCl2(ia) + NH4Cl(ia) + NH3(a)             ΔG°T = −93.51 [kJ]
(NH4)2[ZnCl4] + H2SO4(ia) = ZnSO4(ia) + 2HCl(ia) + 2NH4Cl(ia)  ΔG°T = −55.31 [kJ]
[ZnCl2](NH3)2 + H2SO4(ia) = ZnSO4(ia) + 2NH4Cl(ia)                      ΔG°T = −140.77 [kJ]
(NH4)2[ZnCl4] + H2O(l) = ZnCl2(ia) + 2NH4Cl(ia) + H2O(l)            ΔG°T = −55.50 [kJ]
[ZnCl2](NH3)2 + 2H2O(l) = Zn(OH)2(ia) + 2NH4Cl(ia)                    ΔG°T = 25.104 [kJ]
The chemical reactions (1)–(5) exhibit negative values of ΔG°T, which suggests that they are likely to proceed in the direction of product formation. Reactions (2) and (4) have the most negative ΔG°T values, indicating that these reactions will likely occur primarily in the given systems (HCl or H2SO4). Reaction (6) shows a positive ΔG°T value, suggesting that this reaction is unlikely to proceed in the direction of product formation.
The given reactions from the thermodynamic study and their ΔG°T values are necessary for the creation and analysis of Eh-pH diagrams. The Eh-pH diagrams for the systems Zn-Al-Cl-Fe-H2O and Zn-Al-Fe-S-H2O at a temperature of 60 °C are shown in Figure 2a,b.
The study of Eh-pH diagrams confirmed that zinc exists in the form of ZnCl+ in the equilibrium systems within the water stability region from a pH boundary of 0 to approximately 5.8 in the system Zn-Al-Cl-Fe-H2O and up to a pH of 6.2 in the system Zn-Al-Fe-S-H2O. The concentration for the systems in question was. For zinc, 0.38 mol/dm3; for iron, 0.006 mol/dm3; and for aluminum, 0.33 mol/dm3.

3.3. Leaching—Synthetic and Real Solutions

Table 2 presents the achieved zinc yields in synthetic solutions under the chosen leaching conditions. The highest zinc transfer into the solution was achieved during leaching in 1 M HCl.
The results of leaching zinc galvanizing flue dust (preparation of real solutions) and the yields of zinc and other monitored metals (Fe, Cu, Pb, and Al) into the solution are shown in Table 3.
The results presented in Table 3 show that the highest concentration of Zn in the solution was achieved with 1 M HCl and 0.5 M H2SO4, where the Zn content ranged from 9 to 10 g/L for an L:S ratio of 30 and from 51 to 68 g/L for an L:S ratio of 5. The prepared synthetic and real solutions were subsequently used for the preparation of solutions for electrostatic spinning.

3.4. Electrospinning of Synthetic Solutions—Production of ZnO Ceramic Nanofibers

Figure 3 shows the precursor fibers and ceramic nanofibers prepared from the synthetic solution (1 M HCl).
In Figure 3a, the precursor fibers with thicknesses ranging from 300 to 400 nm and occasionally wide ribbon-shaped fibers up to 1 µm in thickness are observed. Figure 3b displays ceramic nanofibers after calcination at 550 °C, with fiber thicknesses ranging from 200 to 800 nm, while the fibers retain their ribbon shape. Figure 3c shows the EDX analysis that confirmed the presence of Zn and O. Figure 3d shows the mapping of EDS main elements. Figure 4 shows the precursor and ceramic fibers prepared from the synthetic solution (0.5 M H2SO4).
When using the 0.5 M H2SO4 solution, as shown in Figure 4a, very fine precursor fibers were formed. The continuous precursor fibers have a thickness of less than 100 nm, with occasional occurrences of thicker fibers (up to 400 nm). Figure 4b shows ceramic nanofibers after calcination at 550 °C, where the material shrinks down to a thickness of 50 nm. Figure 4c shows the mapping of EDS main elements. Figure 4d shows a surface EDX analysis of these nanofibers sintered at 550 °C, and the result confirms the presence of Zn and O, corresponding to the ZnO phase.

3.5. Electrospinning of Real Solutions—Production of ZnO Ceramic Nanofibers

In Figure 5a, precursor fibers from the real solution (0.5 M HCl) are shown. The precursor fibers consist of oval-shaped fibers with thicknesses ranging from 100 to 400 nm. Figure 5b displays ceramic nanofibers after calcination at 550 °C, where the fibers have retained their fibrous structure with some shrinkage. Figure 5c shows a close-up of the ceramic nanofiber morphology, revealing a structured and slightly porous surface. Figure 5d presents ceramic nanofibers after calcination at 600 °C, following the complete removal of carbon, where the fibers have maintained their fibrous structure. Figure 5e shows the mapping of EDS main elements. Figure 5f shows a surface EDX analysis of a sample calcinated at 600 °C, confirming the presence of Zn and O, corresponding to the ZnO phase.
The obtained ceramic nanofibers were subjected to XRD analysis (Figure 6), which confirmed the presence of the ZnO phase.
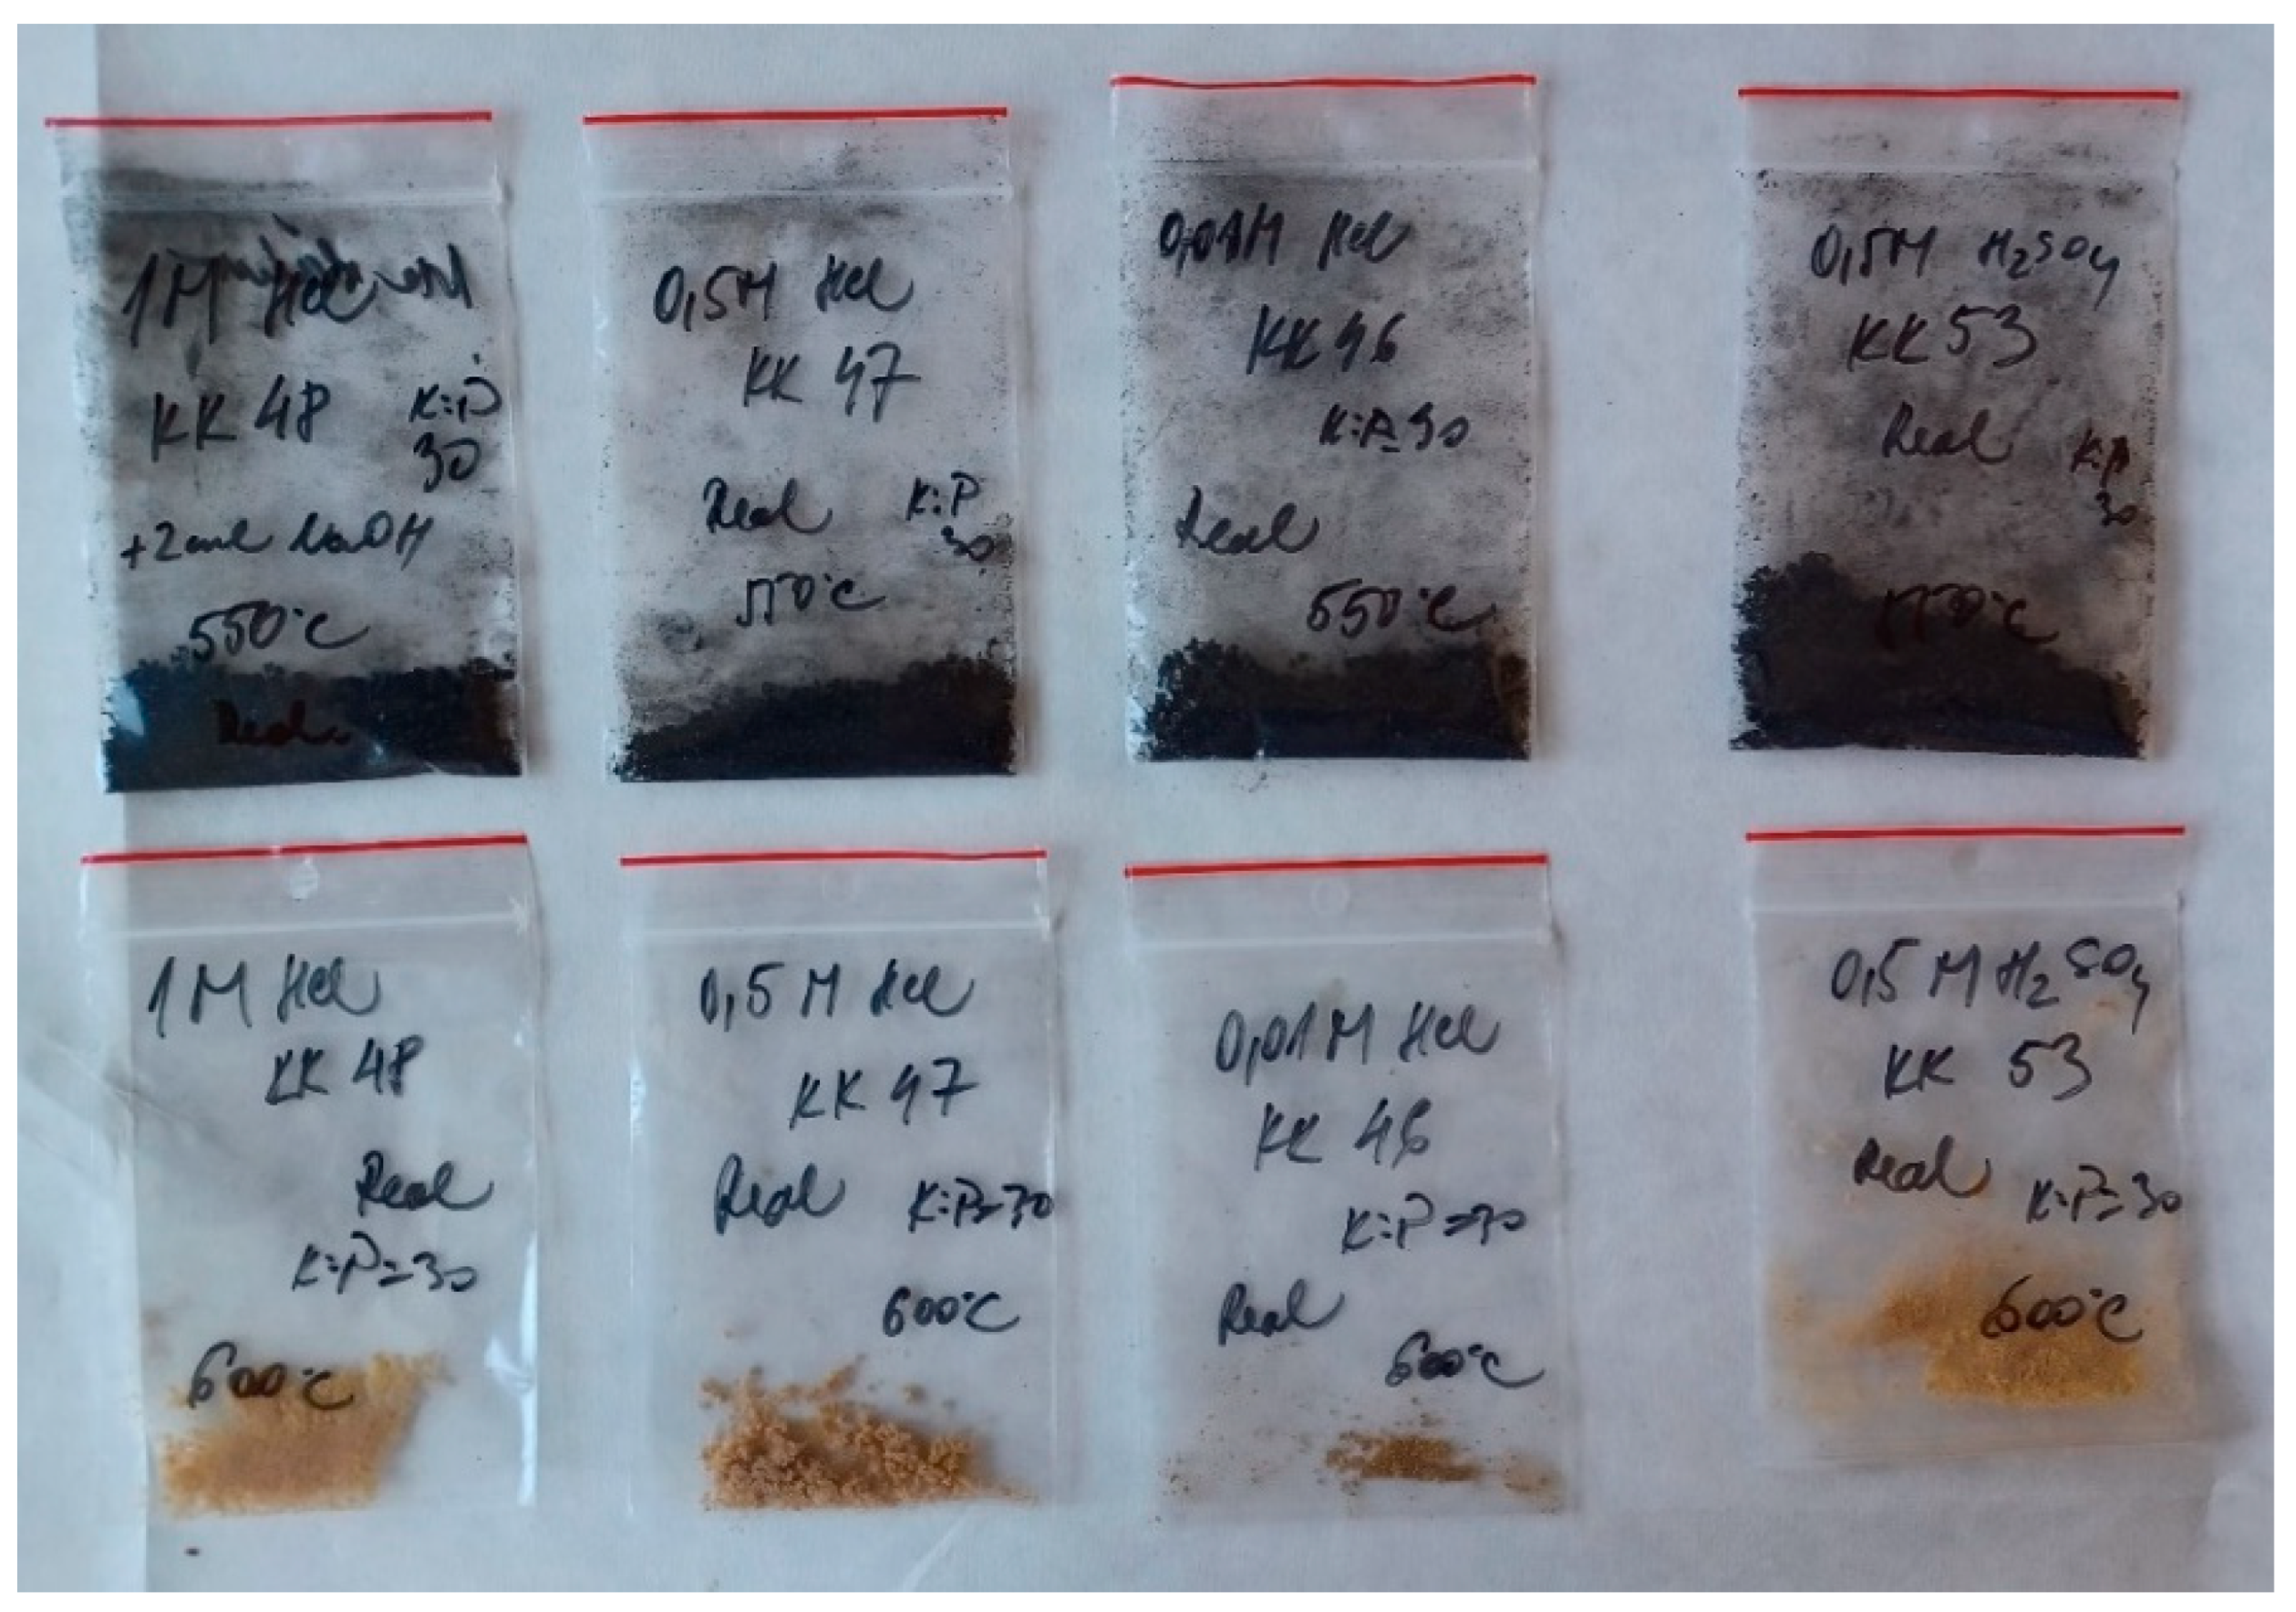
The produced ceramic nanofibers prepared from synthetic and real solutions were calcinated at the temperatures of 550 °C and 600 °C, and the effect of complete carbon removal from the present organic components (PVP/C2H6O/C6H8O7/CH3COOH) on the final fiber morphology was investigated. The nanofiber samples calcinated at 550 °C still exhibit a black color, indicating the presence of carbon. The nanofiber samples calcinated at 600 °C show a pale color. This fact is confirmed by the image shown in Figure 7. It can, therefore, be assumed that at 600 °C, the carbon and other components that were added to the solution for electrospinning were removed from PVP.
The following Figure 8 shows nanofibers made from real solutions of 0.5 M H2SO4 before and after calcination at 550 °C and 600 °C.
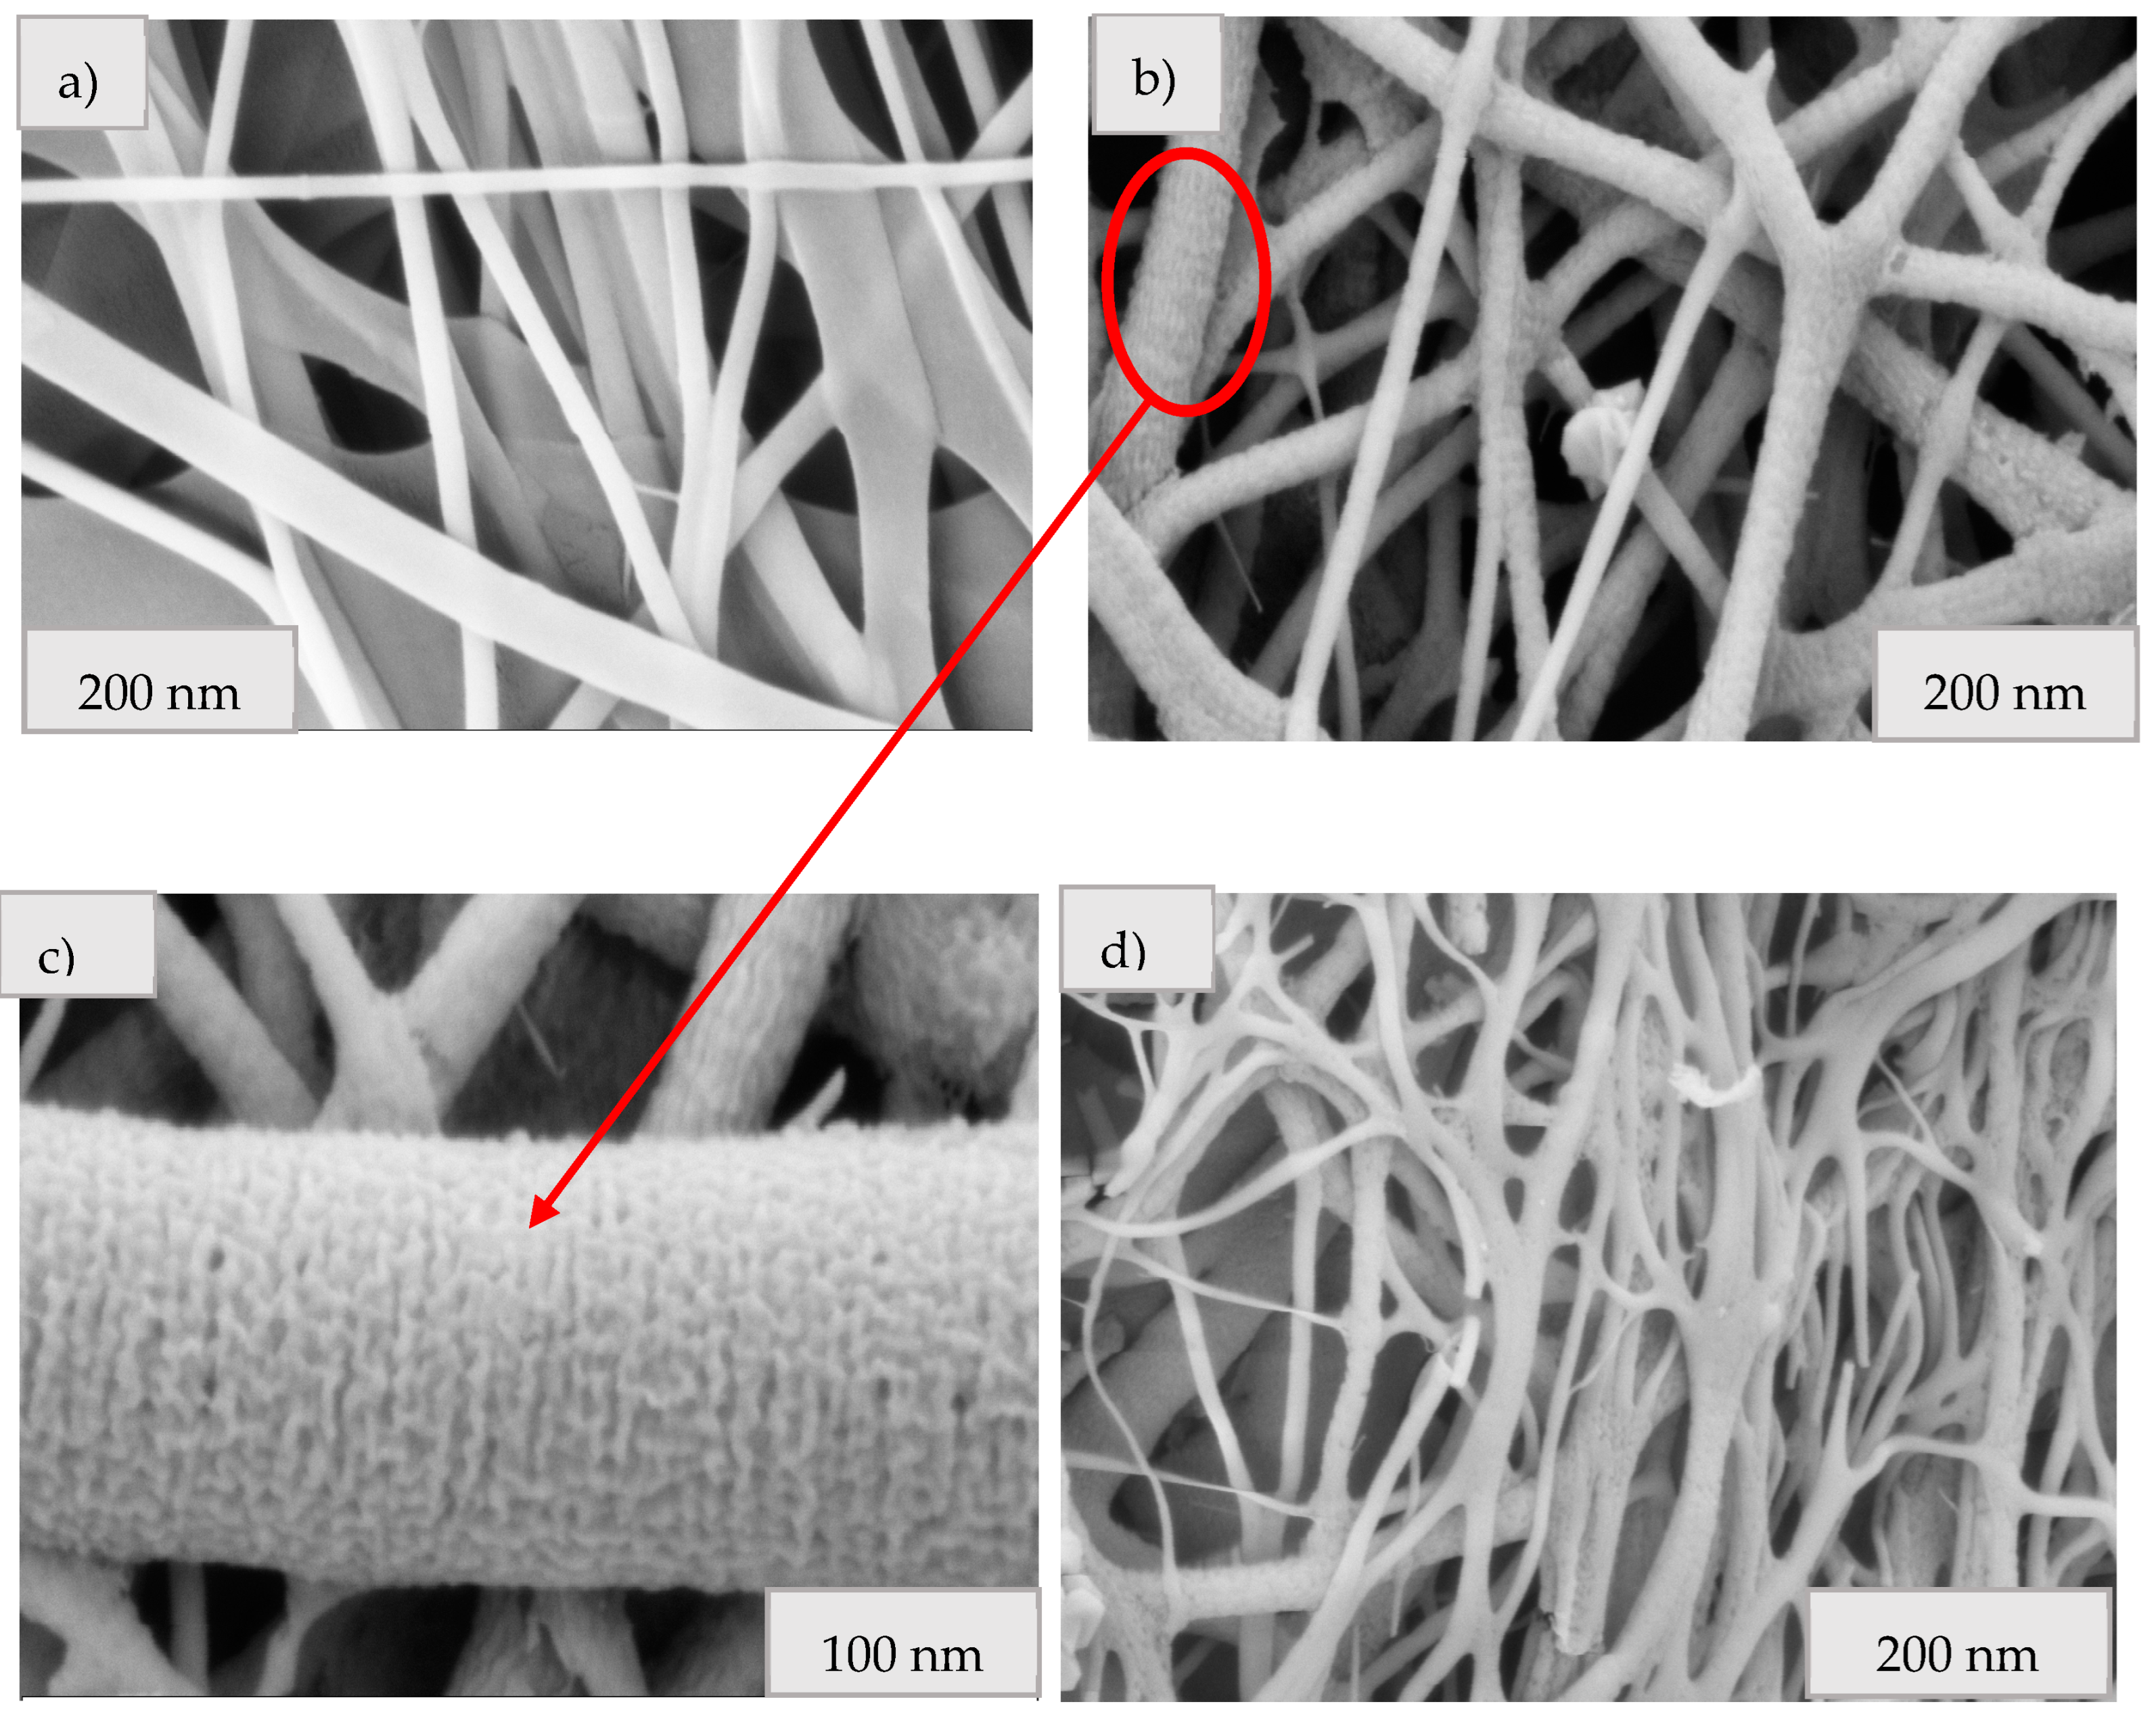
In Figure 8a, precursor fibers from the real solution of 0.5 M H2SO4 are shown. The precursor fibers are very fine, with a thickness of less than 100 nm. Figure 8b shows ceramic nanofibers after calcination at 550 °C, which are highly structured and porous. Figure 8c shows ceramic fibers after calcination at 600 °C, which have a structured surface composed of fine ZnO layers. The detail in Figure 8d highlights the hollow structure of the fibers. Figure 8e shows the mapping of EDS main elements. Figure 8f shows area EDX analysis, which confirmed the presence of Zn and O corresponding to the ZnO phase.
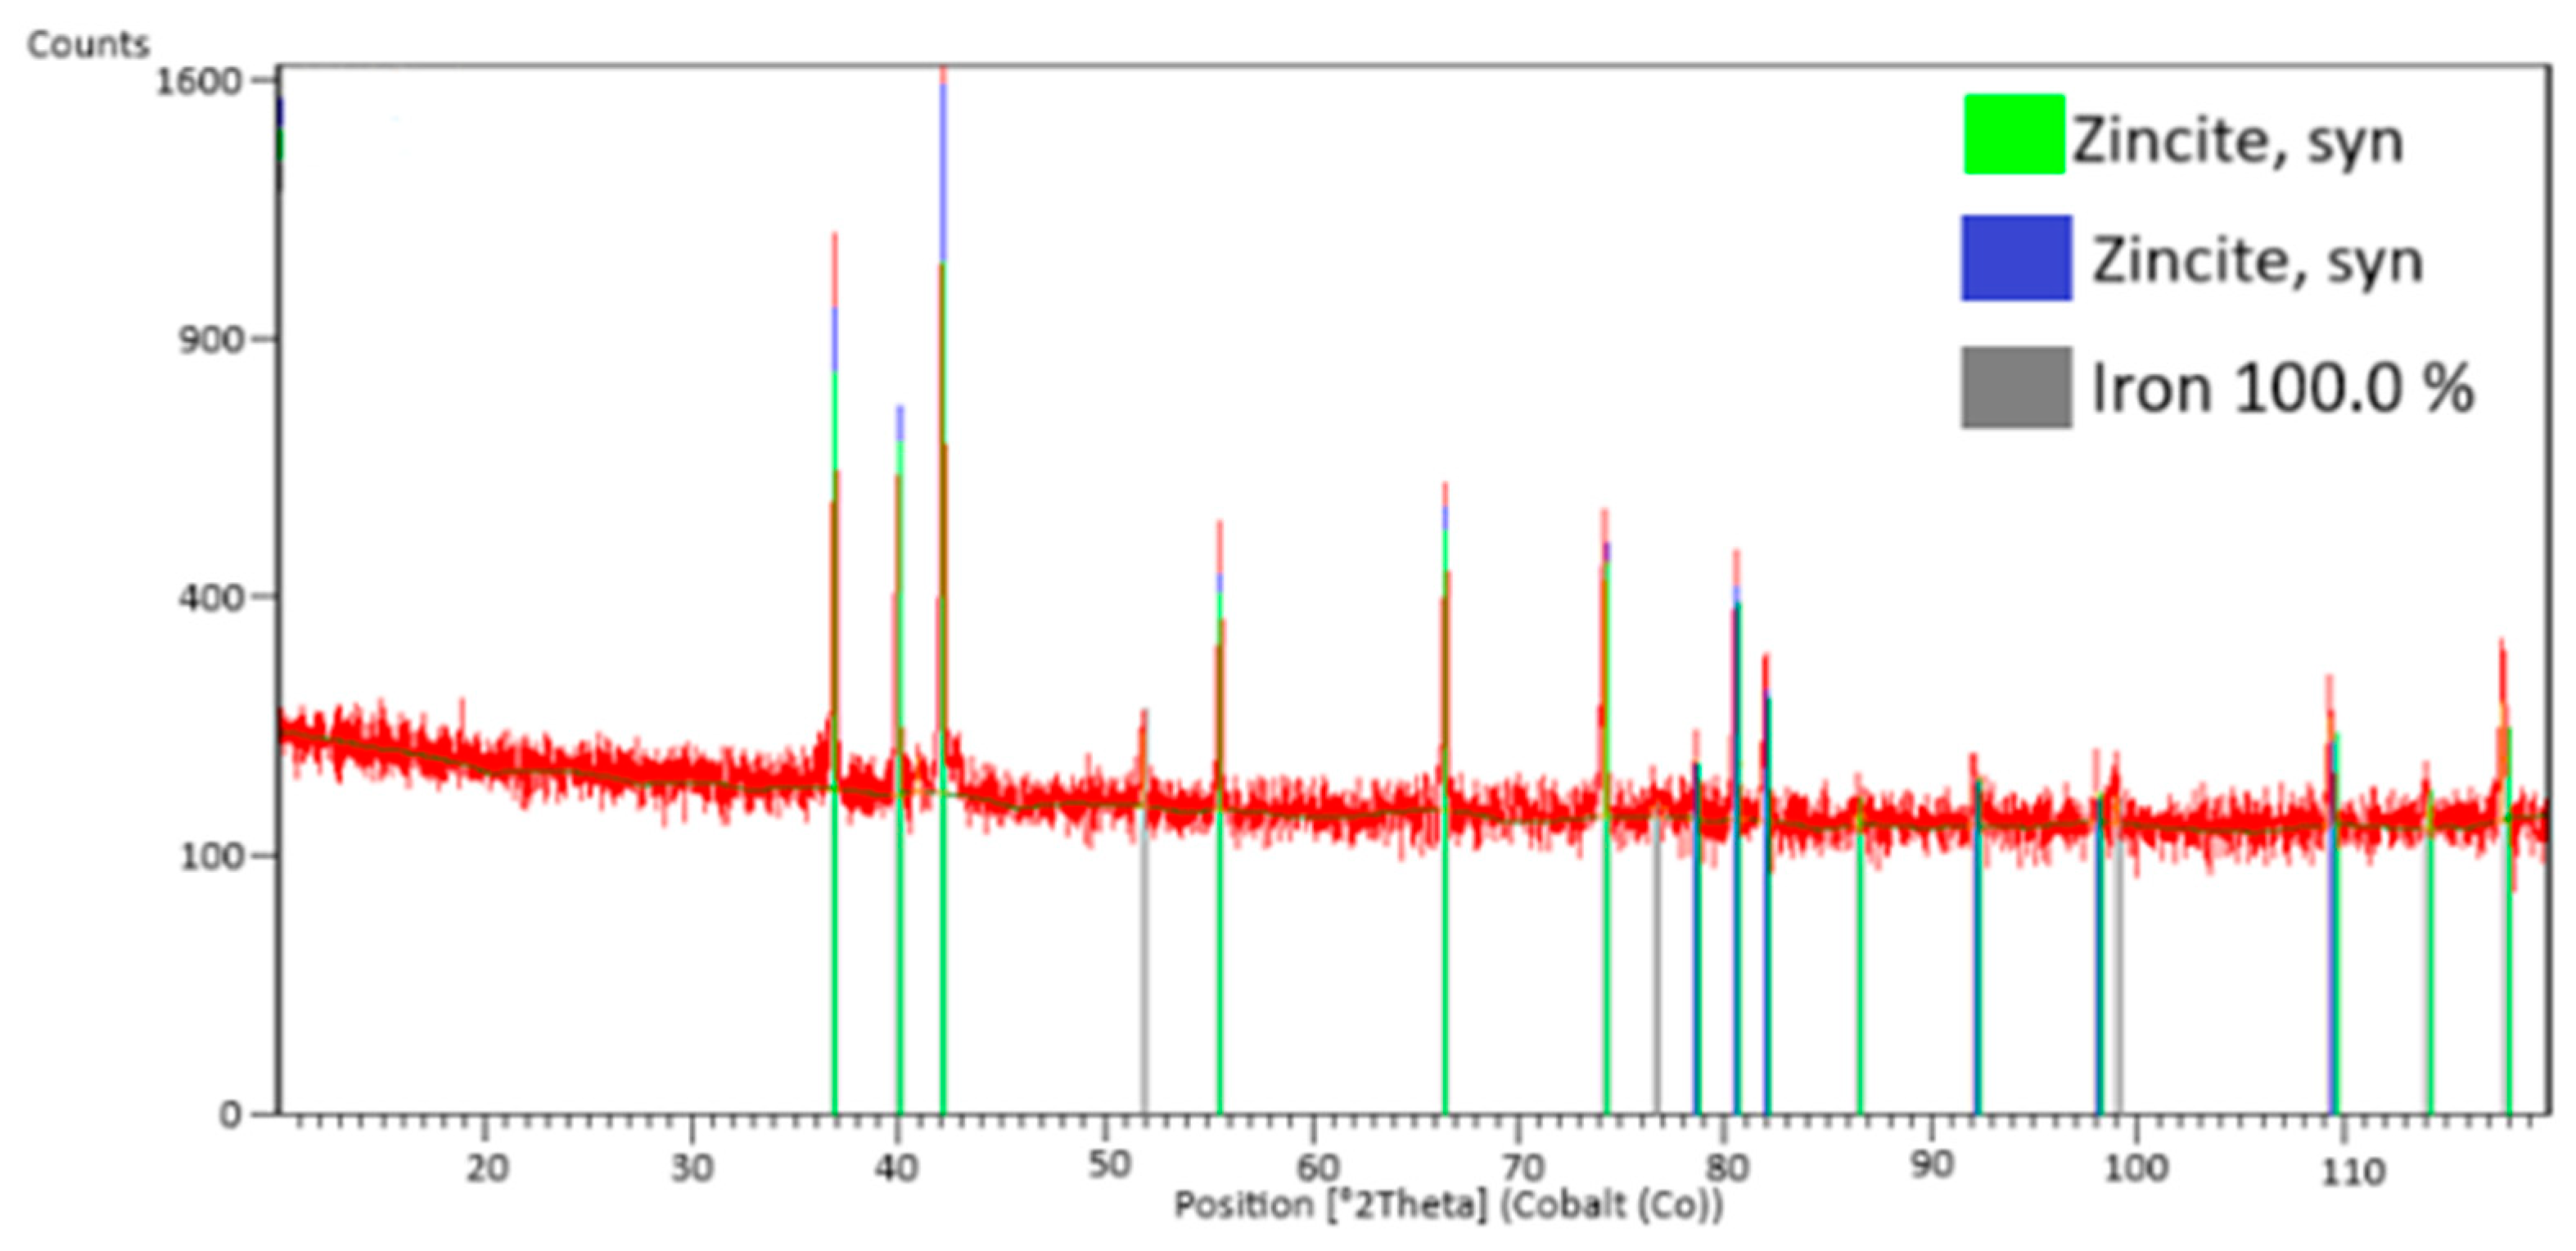
For all ceramic ZnO nanofibers produced from real solutions (0.01, 0.5, and 1 M HCl and 0.5 M H2SO4), XRD phase analysis was also performed, which confirmed the presence of the main ZnO phase, as shown in Figure 9. A small amount of Fe was also analyzed in the ceramic nanofiber samples (0.5 and 1 M HCl).
Only real solutions with an L:S ratio of 30 were used for the electrospinning process, as at an L:S ratio of 5, complete dissolution of PVP did not occur. As a result, these solutions were prepared under the following conditions: solution/PVP/C2H6O/C6H8O7/CH3COOH in the ratio of 48/6/6/2.6/1 and a mixing time of 48 h were not suitable for electrospinning. These conditions applied to all solutions with an L:S ratio of 5 and need further study and optimization, opening up new avenues for scientific research on this issue.

3.6. Comparison of ZnO Fibers from Synthetic and Real Solutions in Terms of Their Structure and Morphology

For comparison of the resulting ceramic nanofibers, synthetic and real nanofibers made from 0.5 M HCl and 0.5 M H2SO4 were selected. Based on the obtained results, it can be concluded that the ceramic ZnO nanofibers produced from synthetic and real solutions have a similar fiber structure (see Figure 10, Figure 11 and Figure 12). Therefore, it can be concluded that the mentioned acid concentrations are suitable for the preparation of ceramic ZnO nanofibers. A concentration of 0.5 M HCl, with the production of oval fibers with a jagged and rough surface, appears to be suitable. In contrast, using 0.5 M H2SO4 results in a different fiber morphology production with the shape of hollow ribbons, where a larger specific surface area can be expected. An XRD analysis was also conducted, confirming the presence of the main zinc phases, as shown in Figure 11 and Figure 13.

4. Conclusions

The presented work deals with the hydrometallurgical processing of zinc galvanizing flue dust with the aim of producing ceramic ZnO nanofibers, which represents an innovative and environmentally beneficial approach. The experiments confirmed that electrostatic spinning is an effective method for producing ceramic ZnO nanofibers, and the use of zinc galvanizing flue dust does not negatively affect the quality of the nanofibers. The resulting nanofibers made from real solutions are comparable in their properties to those made from synthetic materials. This process not only reduces the environmental burden associated with the landfill disposal of zinc galvanizing flue dust but also offers economic benefits by reducing waste disposal costs. Further research in this area could further support the industrial application of this technology and contribute to more efficient resource utilization.
The concluding findings of this work open new perspectives for the development and innovation in the field of nanotechnology and sustainable waste processing. The results could have far-reaching impacts not only on industry but also on environmental protection and economic sustainability.

Author Contributions

Conceptualization, K.K. and J.P.; Methodology, K.K., J.P. and E.M.; Investigation, K.K. and J.P.; Writing—Original Draft Preparation, K.K.; Writing—Review and Editing, K.K., J.P., J.T. and E.M.; Supervision, K.K. and J.P.; Funding Acquisition, J.T. All authors have read and agreed to the published version of the manuscript.

Funding

This research was funded by the Ministry of Education of the Slovak Republic, grant VEGA number 2/0080/23. This work was supported by the Slovak Research and Development Agency under contract no. APVV-23-0055.

Data Availability Statement

The original contributions presented in the study are included in the article. Further inquiries can be directed to the corresponding author.

Conflicts of Interest

The authors declare no conflicts of interest.

References

  1. Trpčevská, J.; Laubertová, M. Kovový Odpad a Jeho Spracovanie; Technical University of Kosice: Košice, Slovakia, 2015; ISBN 9788055323657. [Google Scholar]
  2. Maaß, P.; Peißker, P. Handbook of Hot-Dip Galvanization; John Wiley & Sons: Hoboken, NJ, USA, 2011. [Google Scholar]
  3. Lemke, E.E.; Hammond, W.F.; Thomas, G. Air Pollution Control Measures for Hot Dip Galvanizing Kettles. J. Air Pollut. Control Assoc. 1960, 10, 70–77. [Google Scholar] [CrossRef] [PubMed]
  4. Piroskova, J.; Trpcevska, J.; Orac, D.; Laubertova, M.; Horvathova, H.; Holkova, B. Production of Zinc Oxide from Hazardous Waste-Sal Ammoniac Skimming. J. Min. Metall. Sect. B Metall. 2018, 54, 377–384. [Google Scholar] [CrossRef]
  5. United States Environmental Protection Agency. Hazardous Waste Listings a User-Friendly Reference Document; United States Environmental Protection Agency: Washington, DC, USA, 2012.
  6. Rahman, L.; Quddus, S.; Khanam, J.; Bilkis, K.; Rahman, M. Fabrication of Zinc Oxide from Zinc Dust and Its Characterization. IOSR J. Appl. Chem. 2017, 10, 21–26. [Google Scholar] [CrossRef]
  7. Thorsen, G.; Grislingas, A.; Steintveit, G. Recovery of Zinc from Zinc Ash and Flue Dusts by Hydrometallurgical Processing. J. Met. 1981, 33, 24–29. [Google Scholar] [CrossRef]
  8. Pirošková, J.; Klimko, J.; Trpčevská, J.; Laubertová, M.; Plešingerová, B.; Liptai, P.; Vindt, T.; Oráč, D. Characterization of Galvanizing Flue Dust and Recycling Possibilities. Metals 2022, 12, 744. [Google Scholar] [CrossRef]
  9. Pirošková, J.; Klimko, J.; Ružičková, S.; Laubertová, M.; Marcinov, V.; Múdra, E.; Vojtko, M.; Oráč, D. Utilization of Galvanizing Flue Dust Residue: A Sustainable Approach towards Complete Material Recycling. Metals 2024, 14, 253. [Google Scholar] [CrossRef]
  10. Barakat, M.A. Recovery of Zinc from Zinc Ash and Flue Dust by Pyrometallurgical Processing. In Proceedings of the TMS Fall Extraction and Processing Conference; Minerals, Metals and Materials Society, Pittsburgh, PA, USA, 22–25 October 2000; pp. 211–223. [Google Scholar]
  11. Lukáš, D.; Sarkar, A.; Martinová, L.; Vodsed’álková, K.; Lubasová, D.; Chaloupek, J.; Pokorný, P.; Mikeš, P.; Chvojka, J.; Komárek, M. Physical Principles of Electrospinning (Electrospinning as a Nano-Scale Technology of the Twenty-First Century). Text. Prog. 2009, 41, 59–140. [Google Scholar] [CrossRef]
  12. Ahmadi Bonakdar, M.; Rodrigue, D. Electrospinning: Processes, Structures, and Materials. Macromol 2024, 4, 58–103. [Google Scholar] [CrossRef]
  13. CeCe, R.; Jining, L.; Islam, M.; Korvink, J.G.; Sharma, B. An Overview of the Electrospinning of Polymeric Nanofibers for Biomedical Applications Related to Drug Delivery. Adv. Eng. Mater. 2024, 26, 2301297. [Google Scholar] [CrossRef]
  14. Zhang, M.; Song, W.; Tang, Y.; Xu, X.; Huang, Y.; Yu, D. Polymer-Based Nanofiber-Nanoparticle Hybrids and Their Medical Applications. Polymers 2022, 14, 351. [Google Scholar] [CrossRef] [PubMed]
  15. Sigmund, W.; Yuh, J.; Park, H.; Maneeratana, V.; Pyrgiotakis, G.; Daga, A.; Taylor, J.; Nino, J.C. Processing and Structure Relationships in Electrospinning of Ceramic Fiber Systems. J. Am. Ceram. Soc. 2006, 89, 395–407. [Google Scholar] [CrossRef]
  16. Shepa, I.; Mudra, E.; Dusza, J. Electrospinning through the Prism of Time. Mater. Today Chem. 2021, 21, 100543. [Google Scholar] [CrossRef]
  17. Lotus, A.F.; Kang, Y.C.; Walker, J.I.; Ramsier, R.D.; Chase, G.G. Effect of Aluminum Oxide Doping on the Structural, Electrical, and Optical Properties of Zinc Oxide (AOZO) Nanofibers Synthesized by Electrospinning. Mater. Sci. Eng. B 2010, 166, 61–66. [Google Scholar] [CrossRef]
  18. Baylan, E.; Altintas Yildirim, O. Highly Efficient Photocatalytic Activity of Stable Manganese-Doped Zinc Oxide (Mn:ZnO) Nanofibers via Electrospinning Method. Mater. Sci. Semicond. Process. 2019, 103, 104621. [Google Scholar] [CrossRef]
  19. Thangavel, K.; Roshini, T.; Balaprakash, V.; Gowrisankar, P.; Sudha, S.; Mohan, M. Structural, Morphological and Antibacterial Properties of ZnO Nanofibers Fabricated by Electrospinning Technique. Mater. Today Proc. 2019, 33, 2160–2166. [Google Scholar] [CrossRef]
  20. Khankhuean, A.; Kuratsameethong, W.; Santibenchakul, S.; Laobuthee, A.; Sugimoto, M.; Srisawat, N.; Jamnongkan, T. Oriented ZnO Nanoflowers Obtained after Calcination of Electrospinning Poly(Vinyl Alcohol)/Zinc Oxide/Zinc Acetate Composite Mats. S. Afr. J. Chem. Eng. 2021, 37, 179–185. [Google Scholar] [CrossRef]
  21. Mercante, L.A.; Andre, R.S.; Facure, M.H.M.; Fugikawa-Santos, L.; Correa, D.S. Design of a Bioelectronic Tongue for Glucose Monitoring Using Zinc Oxide Nanofibers and Graphene Derivatives. Sens. Actuators Rep. 2021, 3, 100050. [Google Scholar] [CrossRef]
  22. Kale, S.M.; Kirange, P.M.; Kale, T.V.; Jee Kanu, N.; Gupta, E.; Chavan, S.S.; Kumar Vates, U.; Kumar Singh, G. Synthesis of Ultrathin ZnO, Nylon-6,6 and Carbon Nanofibers Using Electrospinning Method for Novel Applications. Mater. Today Proc. 2021, 47, 3186–3189. [Google Scholar] [CrossRef]
  23. Hassan, H.S.; Elkady, M.F.; Farghali, A.A.; Salem, A.M.; AbdEl-Hamid, A.I. Fabrication of Novel Magnetic Zinc Oxide Cellulose Acetate Hybrid Nano-Fiber to Be Utilized for Phenol Decontamination. J. Taiwan Inst. Chem. Eng. 2017, 78, 307–316. [Google Scholar] [CrossRef]
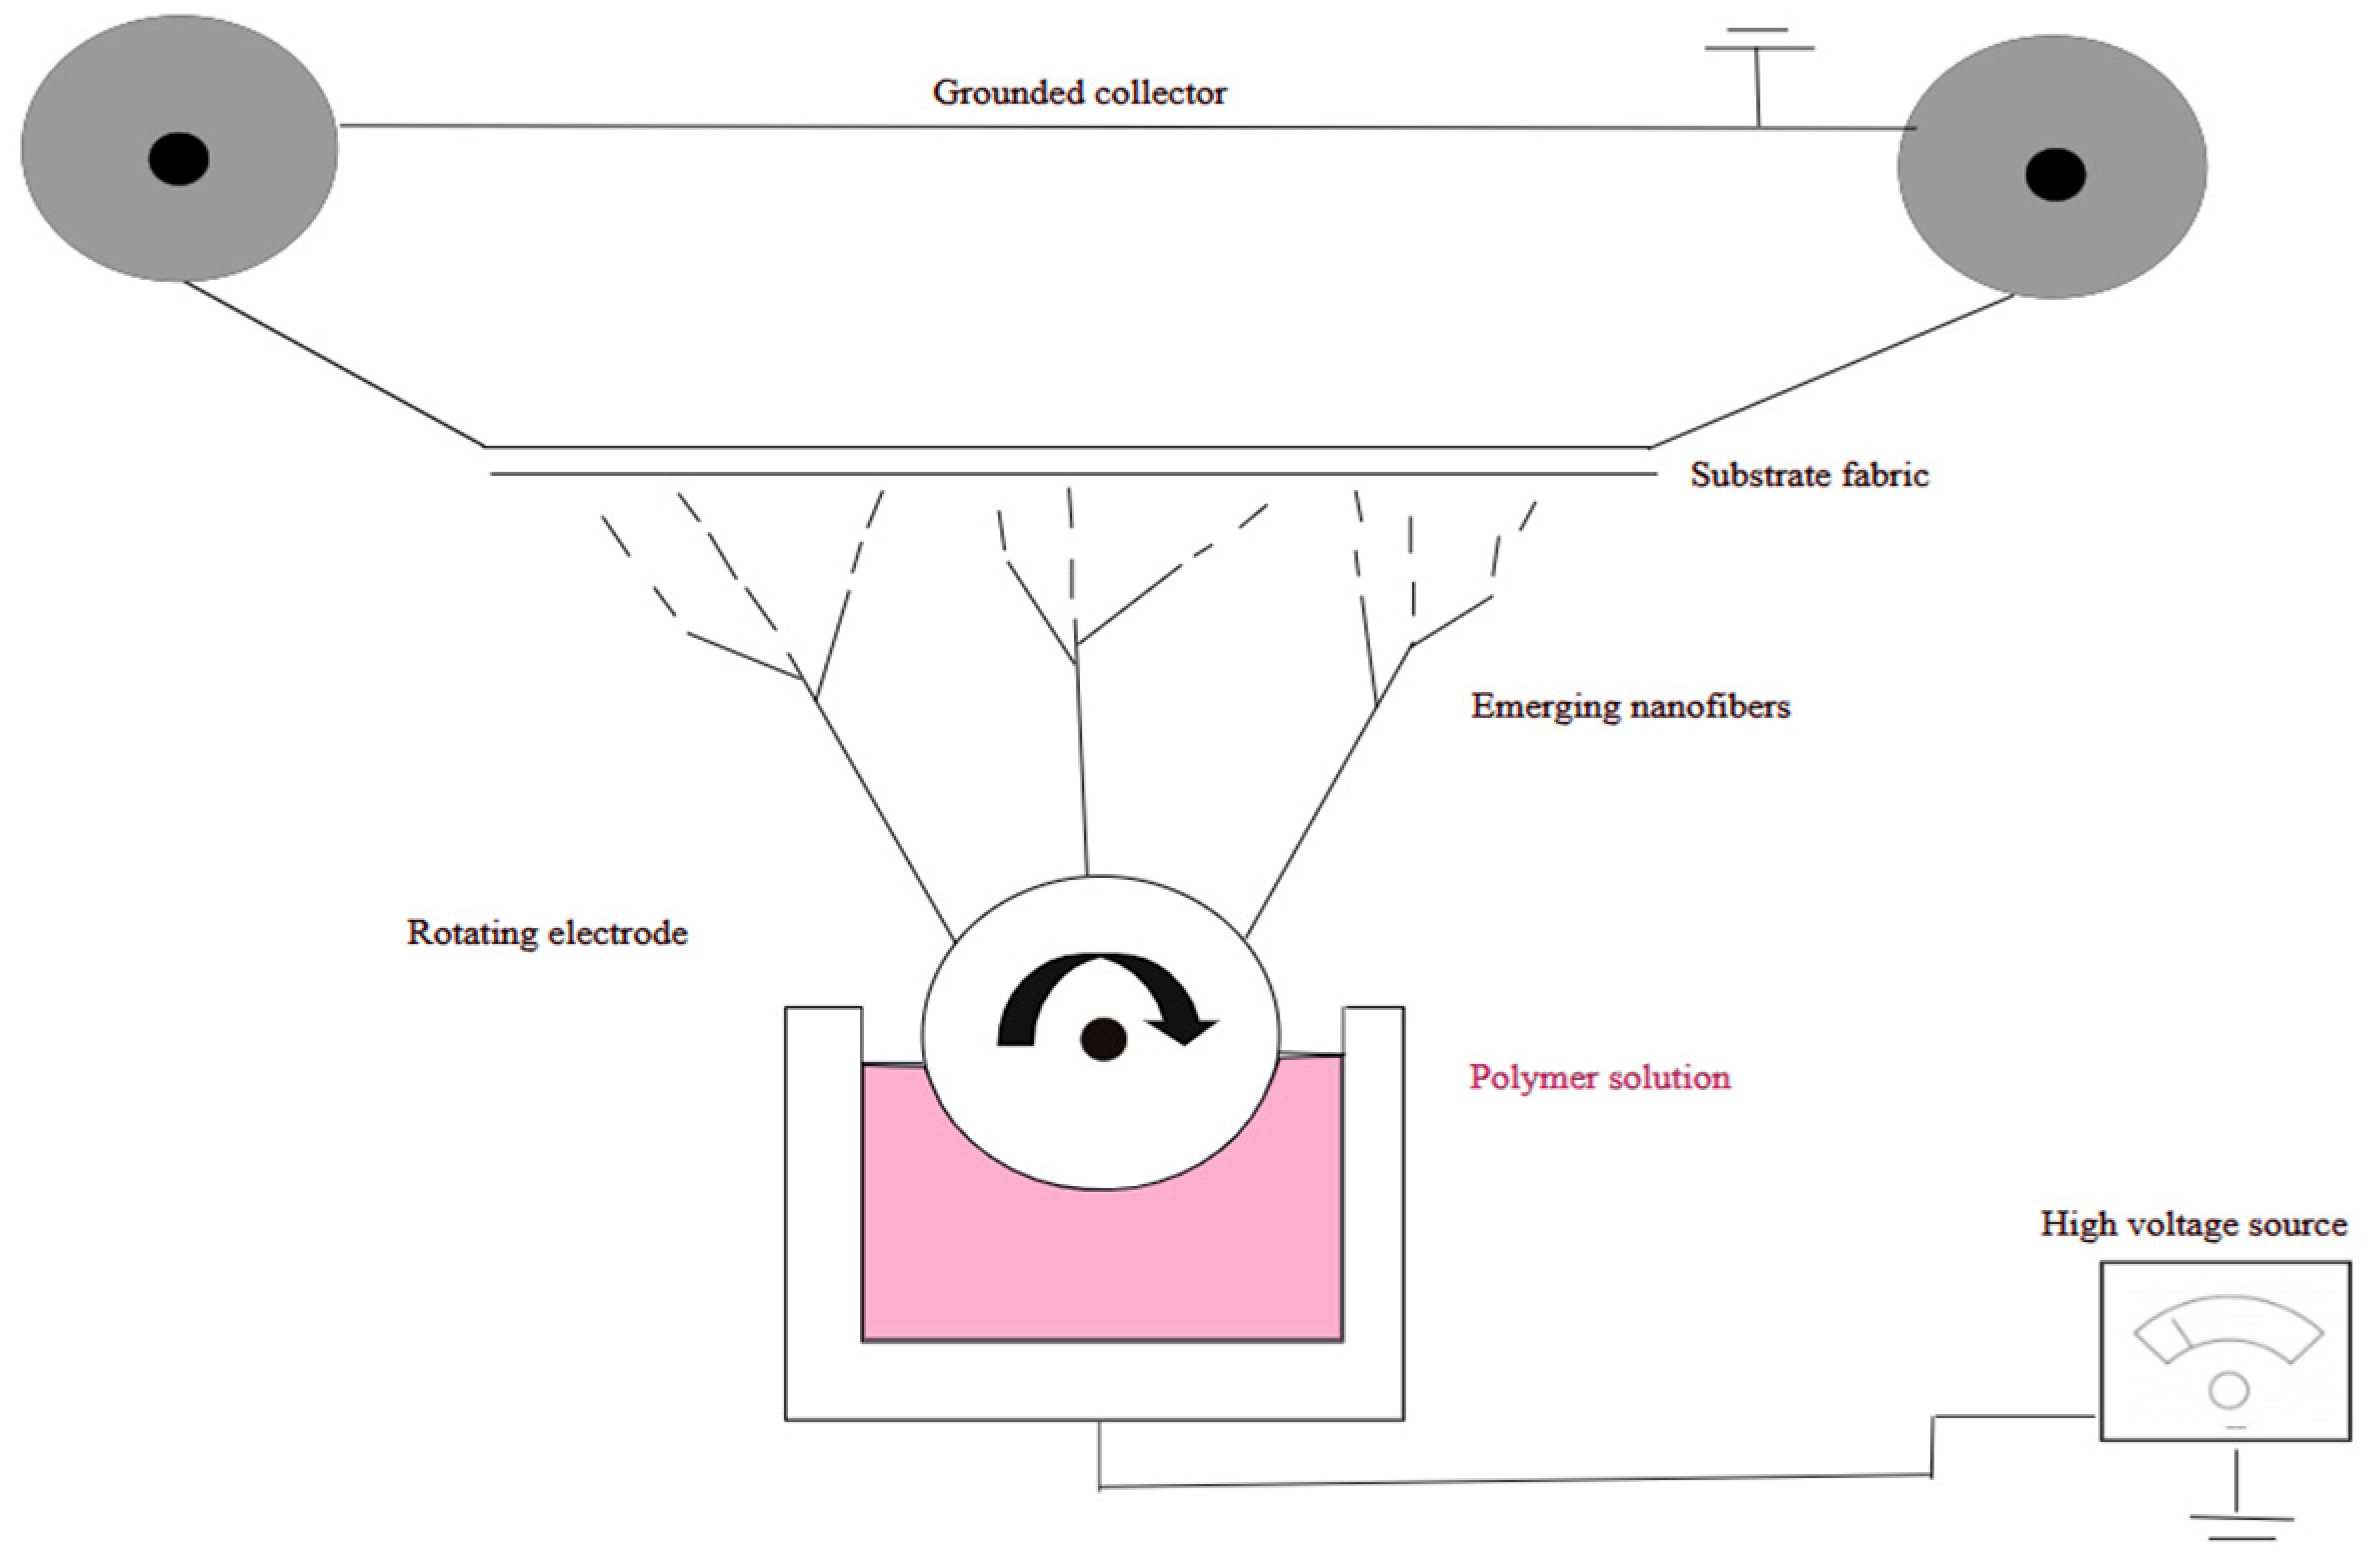
Figure 1. Scheme of needleless electrospinning from a free surface of polymer solution from a rotating drum. Adapted from [11].
Metals 15 00522 g001
Figure 2. (a) Eh-pH diagram of the system Zn-Al-Cl-Fe-H2O at 60 °C; (b) Eh-pH diagram of the system Zn-Al-Fe-S-H2O at 60 °C.
Metals 15 00522 g002
Figure 3. SEM images of (a) precursor fibers 1 M HCl, (b) ceramic fibers 1 M HCl at the temperature of 550 °C, (c) area EDX analysis of ceramic nanofibers at 550 °C, and (d) mapping of EDS main elements.
Metals 15 00522 g003
Figure 4. SEM images of (a) precursor fibers in 0.5 M H2SO4, (b) ceramic fibers in 0.5 M H2SO4 at the temperature of 550 °C, (c) mapping of EDS main elements, and (d) area EDX analysis of ceramic nanofibers at 550 °C.
Metals 15 00522 g004
Figure 5. SEM images of (a) precursor fibers 0.5 M HCl, (b) ceramic fiber 0.5 M HCl at the temperature of 550 °C, (c) fiber morphology, (d) ceramic fibers 0.5 M HCl at 600 °C, (e) mapping of EDS main elements, and (f) area EDX analysis of ceramic nanofibers at 600 °C.
Metals 15 00522 g005aMetals 15 00522 g005b
Figure 6. XRD analysis of ceramic nanofibers from the real solution 0.5 M HCl.
Metals 15 00522 g006
Figure 7. ZnO nanofibers calcined at 550 °C and 600 °C.
Metals 15 00522 g007
Figure 8. SEM images of (a) precursor fibers 0.5 M H2SO4, (b) ceramic fibers 0.5 M H2SO4 at the temperature of 550 °C, (c) ceramic fibers 0.5 M H2SO4 at the temperature of 600 °C, (d) fiber morphology, (e) mapping of EDS main elements, and (f) area EDX analysis of ceramic nanofibers at 600 °C.
Metals 15 00522 g008aMetals 15 00522 g008b
Figure 9. XRD analysis of ZnO nanofibers from real solutions.
Metals 15 00522 g009
Figure 10. Images of (a) ceramic fibers from synthetic solution of 0.5 M HCl at 600 °C and (b) ceramic fibers from real solution of 0.5 M HCl at 600 °C.
Metals 15 00522 g010
Figure 11. XRD analysis of ceramic nanofibers from the real 0.5 M HCl solution.
Metals 15 00522 g011
Figure 12. Images of (a) ceramic fibers from synthetic solution of 0.5 M H2SO4 at 600 °C and (b) ceramic fibers from real solution of 0.5 M H2SO4 at 600 °C.
Metals 15 00522 g012
Figure 13. XRD analysis of ceramic nanofibers from the real 0.5 M H2SO4 solution.
Metals 15 00522 g013
Table 1. Chemical composition of zinc dust sample.
SampleZn [wt%]Fe [wt%]Al [wt%]Cu [wt%]Pb [wt%]Cl [wt%]Residual [wt%]
Average25.330.380.910.0060.0924.8748.41
%%%%%%-
Standard deviation0.460.010.140.00080.062.07-
Relative standard deviation1.812.636507501508.32-
Table 2. Realized experiments.
Conditions 0.01 M HCl0.5 M HCl1 M HCl0.5 M H2SO4
Synthetic solutions----+
Zn content [g/L]7.1012.6427.3321.55
Table 3. Results of metal transfer into the solution.
ConditionsAcid Concentration Zn [g/L]Fe [g/L]Pb [g/L]Cu [g/L]Al [g/L]
L:S 300.01 M HCl6.5140.0010.00020.0120.009
0.5 M HCl9.3070.0630.00240.0150.388
1 M HCl9.0890.0800.00220.0250.344
0.5 M H2SO410.1300.0380.00280.00170.412
L:S 50.01 M HCl28.830.0010.00120.0380.010
0.5 M HCl49.760.0020.00140.0520.123
1 M HCl51.430.3420.00800.1141.951
0.5 M H2SO468.200.1320.09680.0410.216
Disclaimer/Publisher’s Note: The statements, opinions and data contained in all publications are solely those of the individual author(s) and contributor(s) and not of MDPI and/or the editor(s). MDPI and/or the editor(s) disclaim responsibility for any injury to people or property resulting from any ideas, methods, instructions or products referred to in the content.