Article

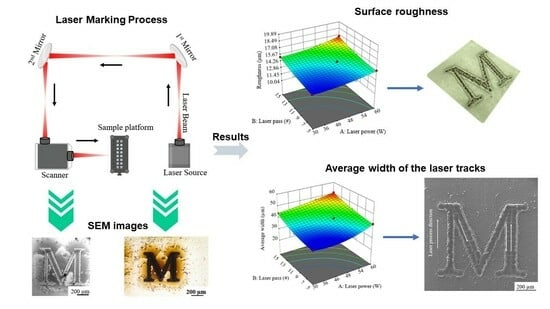
Statistical Modeling and Characterization of Laser Marking on AISI 301LN Stainless Steel Using Short-Pulsed Fiber Laser

by
Mohammad Rezayat
1,2,
Mojtaba Karamimoghadam
3,
Nicola Contuzzi
3,
Giuseppe Casalino
3 and
Antonio Mateo
1,2,*
1
Center for Structural Integrity, Micromechanics, and Reliability of Materials (CIEFMA), Department of Materials Science and Engineering, Universitat Politècnica de Catalunya-Barcelona TECH, 08019 Barcelona, Spain
2
Barcelona Research Center in Multiscale Science and Engineering, Politècnica de Catalunya-Barcelona TECH, 08019 Barcelona, Spain
3
Department of Mechanics, Mathematics and Management, Polytechnic University of Bari, Via Orabona 4, 70125 Bari, Italy
*
Author to whom correspondence should be addressed.
Metals 2025, 15(5), 519; https://doi.org/10.3390/met15050519
Submission received: 27 March 2025 / Revised: 26 April 2025 / Accepted: 30 April 2025 / Published: 4 May 2025

Abstract

:
This study explores the effects of nanosecond short-pulsed fiber laser processing on AISI 301LN stainless steel, focusing on optimizing surface characteristics through precise parameter control. Using a Design of Experiments (DOE) approach combined with response surface methodology (RSM), the influence of laser power (30–60 W) and the number of laser passes (5–15 times) was systematically investigated. The results demonstrate that increasing the laser power and passes significantly affected the surface properties. The highest surface roughness of 16.8 µm and engraving width of 51 µm were achieved with 60 W power and 15 passes, whereas the lowest roughness of 13.8 µm and width of 35 µm were observed with 30 W power and 5 passes. Wettability measurements revealed an inverse correlation with roughness, with contact angles ranging from 86.4° for rougher surfaces to 92.4° for smoother textures. The findings demonstrate the capability of short-pulsed fiber laser processing to tailor surface properties effectively, with potential applications in manufacturing and surface engineering where controlled roughness and wettability are critical.

Graphical Abstract

1. Introduction

Laser material processing has been widely recognized as a transformative technology in various industrial sectors, where precise control over surface characteristics has enabled significant advancements in material manipulation and functional optimization [1,2,3,4]. Among the diverse laser processing techniques, laser texturing has been extensively applied across different materials, including metals [5,6] and polymers [7,8]. This method has been increasingly utilized in industries such as aerospace, biomedical engineering, and automotive manufacturing due to its ability to deliver tailored surface properties with exceptional precision. Laser engraving, as a prominent subset of laser texturing, has been extensively implemented in industrial product marking and functional surface modifications. In this process, a highly focused laser beam is directed onto a material surface through pre-programmed software instructions, enabling the creation of intricate and repeatable patterns with remarkable accuracy [9,10,11]. Despite significant advancements in laser engraving technologies, a key technological challenge remains—the systematic optimization of laser parameters, such as the laser power and number of passes, to achieve desired surface characteristics, including surface roughness, engraving width, and wettability.
Previous research has demonstrated the importance of optimizing laser parameters to achieve specific surface outcomes [12,13,14]. For example, Dong et al. [15] investigated laser surface texturing on 316 stainless steel using nanosecond pulses, where various surface textures were generated, and their effects on wettability were analyzed. In another study, Soria-Biurrun et al. [16] applied femtosecond laser ablation to WC-Co inserts, focusing on optimizing parameters for minimal thermal damage and accurate surface texturing. Similarly, Narayanan et al. [17] developed a computational model for predicting surface topography using nanosecond pulsed laser texturing, achieving prediction accuracies exceeding 90%. Adjustments to parameters such as the spot size and fluence combinations were shown to significantly affect surface functionality.
Further investigations have been carried out on different materials, including Ti6Al4V alloys [18] and 2A12 aluminum alloys [19], where enhanced wettability, corrosion resistance, and tribological performance were reported following laser surface texturing. Tang et al. [20] explored the effects of sequential nanosecond and picosecond laser texturing on stainless steel surfaces, analyzing multi-scale structures and their influence on wettability. Additionally, Rezayat et al. [21] studied laser wobbling surface texturing (LWST) on AISI 301LN stainless steel, revealing changes in surface morphology, phase transformations, and microhardness. Zawadzki et al. [22] demonstrated the formation of patterned roughness and increased surface hardness on AISI 321 stainless steel following nanosecond laser irradiation.
Although these studies have provided valuable insights into laser surface texturing, limitations remain in the systematic optimization of multiple interacting parameters, which are essential for reproducible and scalable industrial applications [23,24,25]. Furthermore, quantitative correlations between the laser power, number of passes, and resulting surface characteristics have not been fully established.
In the present study, the effects of laser power and number of passes on the surface roughness, engraving width, and wettability of AISI 301LN stainless steel were systematically investigated. The parameters were optimized using response surface methodology (RSM), a statistical modeling approach designed to identify optimal parameter combinations for multi-variable systems. Through this methodology, a robust analysis of the relationships between processing parameters and surface responses was performed, providing insights into the underlying physical and chemical transformations induced by laser processing.
Additionally, advanced characterization techniques, including Scanning Electron Microscopy (SEM), confocal microscopy, and wettability measurements, were employed to comprehensively examine the microstructural changes, phase transformations, and surface characteristics resulting from the laser process. Special attention was paid to the formation of α’-martensite in the heat-affected zone, as well as the relationship between surface roughness and wettability, using established theoretical models, such as the Wenzel and Cassie-Baxter models. It is anticipated that the findings of this study will contribute significantly to the field of laser material processing, providing practical guidelines for the optimization of laser parameters in industrial applications. Moreover, the insights gained are expected to advance the current understanding of microstructural transformations induced by laser texturing, offering enhanced surface performance for applications such as biomedical implants, anti-corrosion coatings, and precision engineering components.

2. Materials and Methodology

2.1. Methodology

The Design of Experiment (DoE) approach evaluates the impact of multiple variables on an outcome variable. DoE involves a series of strategically structured experiments to create and measure input or response variables, gathering data across each setup. Other DoE approaches include conducting systematic experiments that intentionally vary process input variables to observe and quantify changes in the output response.
Response surface methodology (RSM) employs mathematical and statistical methods to model and analyze scenarios where multiple variables affect the desired outcome, with the goal of optimizing that outcome. In most RSM applications, the relationship between the response and independent variables is initially unknown. Thus, the first step in RSM is to develop an approximation for this relationship, often using low-order polynomials within the variables’ range. When the response can be effectively modeled by a linear function of independent variables, the first-order approximation is expressed as shown in Equation (1).
y = β 0 + β 1 x 1 + β 2 x 2 + + β k x k + ε
When curvature is present in the system, higher-order polynomials, such as a second-order model, should be used, represented by Equation (2):
y = β 0 + i = 1 k β i x i + i = 1 k β i i x i 2 + i j β i j x i
In this study, RSM was employed for statistical modeling to optimize the effects of laser power and the number of passes on surface characteristics, including the roughness, engraving width, and wettability. Laser power levels were set at 30 W, 45 W, and 60 W, while the number of passes varied between 5, 10, and 15 passes. The experimental design was conducted using a full factorial approach to ensure statistical robustness. Table 1 presents the input parameters with standard units. The ranges for laser power (10–30 W) and the number of passes (1–5) were selected based on preliminary experimental trials, which identified a stable operational window for achieving measurable and repeatable surface characteristics. These ranges are consistent with the findings from previous studies on laser marking of stainless steel alloys, where similar ranges were shown to yield optimal results for surface roughness, engraving width, and wettability. Additionally, practical constraints related to the laser equipment’s stability and performance influenced the choice, ensuring reproducibility and minimizing variability during processing.
A full factorial design of the input parameters was used, resulting in nine laser-engraved samples. The average width values represent the mean measurement of four sections (L1–L4) along the engraved letter M. Measurements L1, L2, L3, and L4 for each section of the letter M were taken using ImageJ software version 1.53t, and their average was calculated. Surface roughness measurements were performed using an Olympus OLS 3000 LEXT confocal microscope (Olympus, Tokyo, Japan), operating at a resolution of 0.1 µm. Measurements were taken at three distinct locations on each sample to account for spatial variability. The arithmetic mean roughness (Sa) was calculated as an average of these measurements. The data were analyzed to evaluate the influence of laser power and the number of passes on surface roughness. Table 2 displays the parameters of the laser processes and their corresponding responses.

2.2. Material and Laser

The laser processing experiments were performed using a short-pulsed fiber laser system (Spectra-Physics, Berlin, Germany) with a wavelength of 349 nm. The following parameters were set: scanning speed (6 mm/s), frequency (1000 Hz), focus distance (80 mm), pulse duration (2 ns), and spot size (50 µm). Sample dimensions (15 mm × 15 mm × 1.5 mm) were carefully selected to ensure uniform heat distribution during the engraving process [26]. The steel surface was polished with fine-grade sandpaper (1500 grit) and subsequently cleaned in preparation for the laser process. Table 3 provides the chemical composition of the AISI 301LN stainless steel samples, and their origin was duly indicated. Sulfur (S) and oxygen (O) contents were not provided by the material supplier, which may slightly influence surface tension effects.
The samples were processed using the laser setup shown in Figure 1a. The widths of the marked areas were then measured as illustrated in Figure 1b, and in Figure 1c, the measurement of the static water contact angle is illustrated, showing how the droplet profile and angle were analyzed. Optical images were captured using a Phenom XL Scanning Electron Microscope (SEM) (Thermo Fisher, MA, USA) with a field of view (FOV) of 465 µm. To assess surface roughness, an integrated optical 3D metrology system was used in conjunction with the SEM. A surface texture analysis was performed using ProSuite Version 3.1 software, which facilitated the calculation of the average surface roughness (Sa) and enabled the generation of 3D surface reconstructions for detailed visualization. The samples were engraved with a nanosecond (ns) solid-state laser (Spectra-Physics, Berlin, Germany) featuring a neodymium-doped yttrium lithium fluoride (Nd) gain medium, operating at a wavelength of 349 nm and without gas assistance. Figure 2 shows the large-scale optical microscopy of the engraved areas. According to a previous study [27], all experiments were conducted under controlled ambient conditions, with a room temperature of approximately 25 °C, with the relative humidity maintained between 40 and 50%, and ambient atmospheric oxygen exposure. No shielding gases were applied during laser marking to replicate standard industrial conditions. All laser passes were performed continuously, without delay between consecutive passes.
Wettability, defined as the ability of a liquid to spread across or remain on a solid surface, plays a crucial role in determining surface interactions, including adhesion, lubrication, and corrosion resistance [28]. In this study, the static water contact angle technique was employed as a reliable and widely accepted method to evaluate the wettability of laser-textured AISI 301LN stainless steel surfaces. This method involves measuring the contact angle (θ) formed between a liquid droplet and the solid surface, offering valuable insights into the hydrophilic or hydrophobic nature of the material. The wettability experiments were conducted using a high-precision contact angle goniometer (Advex Instruments, Brno, Czech Republic) equipped with a high-resolution camera for accurate droplet profile capture. Prior to the measurements, all laser-textured samples were meticulously cleaned using isopropyl alcohol and distilled water to remove contaminants and ensure surface uniformity. Samples were then dried under controlled conditions to prevent any residual moisture that could affect the measurements. During each measurement, a controlled volume of distilled water (approximately 5 µL) was carefully dispensed onto the sample surface using a micro-syringe, ensuring consistency across all trials [29,30]. The droplet profile was immediately captured under standardized lighting conditions, and the contact angle was determined using specialized image analysis software. To minimize experimental variability, measurements were repeated at three distinct points on each sample, and the average value was used for analysis.
Surfaces exhibiting contact angles below 90° were classified as hydrophilic, indicating a higher affinity of the material surface for water. Conversely, surfaces with contact angles exceeding 90° were deemed hydrophobic, suggesting reduced wettability. The measurement protocol was designed to minimize external influences, such as evaporation and droplet deformation, by performing measurements immediately after droplet placement. This approach ensures reproducibility and accuracy in capturing the intrinsic wettability characteristics of the laser-textured surfaces. The results from this analysis were subsequently correlated with surface roughness and microstructural changes, offering a comprehensive understanding of the relationship between laser processing parameters and wettability behavior.
The measured contact angles were interpreted using the Young–Laplace equation:
γ S V γ S L = γ L V c o s ( θ )
where γSV, γSL, and γLV represent the solid–vapor, solid–liquid, and liquid-vapor interfacial tensions, respectively [31,32]. This equation quantitatively links the observed contact angle to interfacial tensions, providing a theoretical basis for evaluating surface wettability. To ensure accuracy and reproducibility, the experiments were conducted under controlled temperature and humidity conditions. Droplet volumes were kept consistent, and surface uniformity was verified to minimize variability [33].

3. Results and Discussion
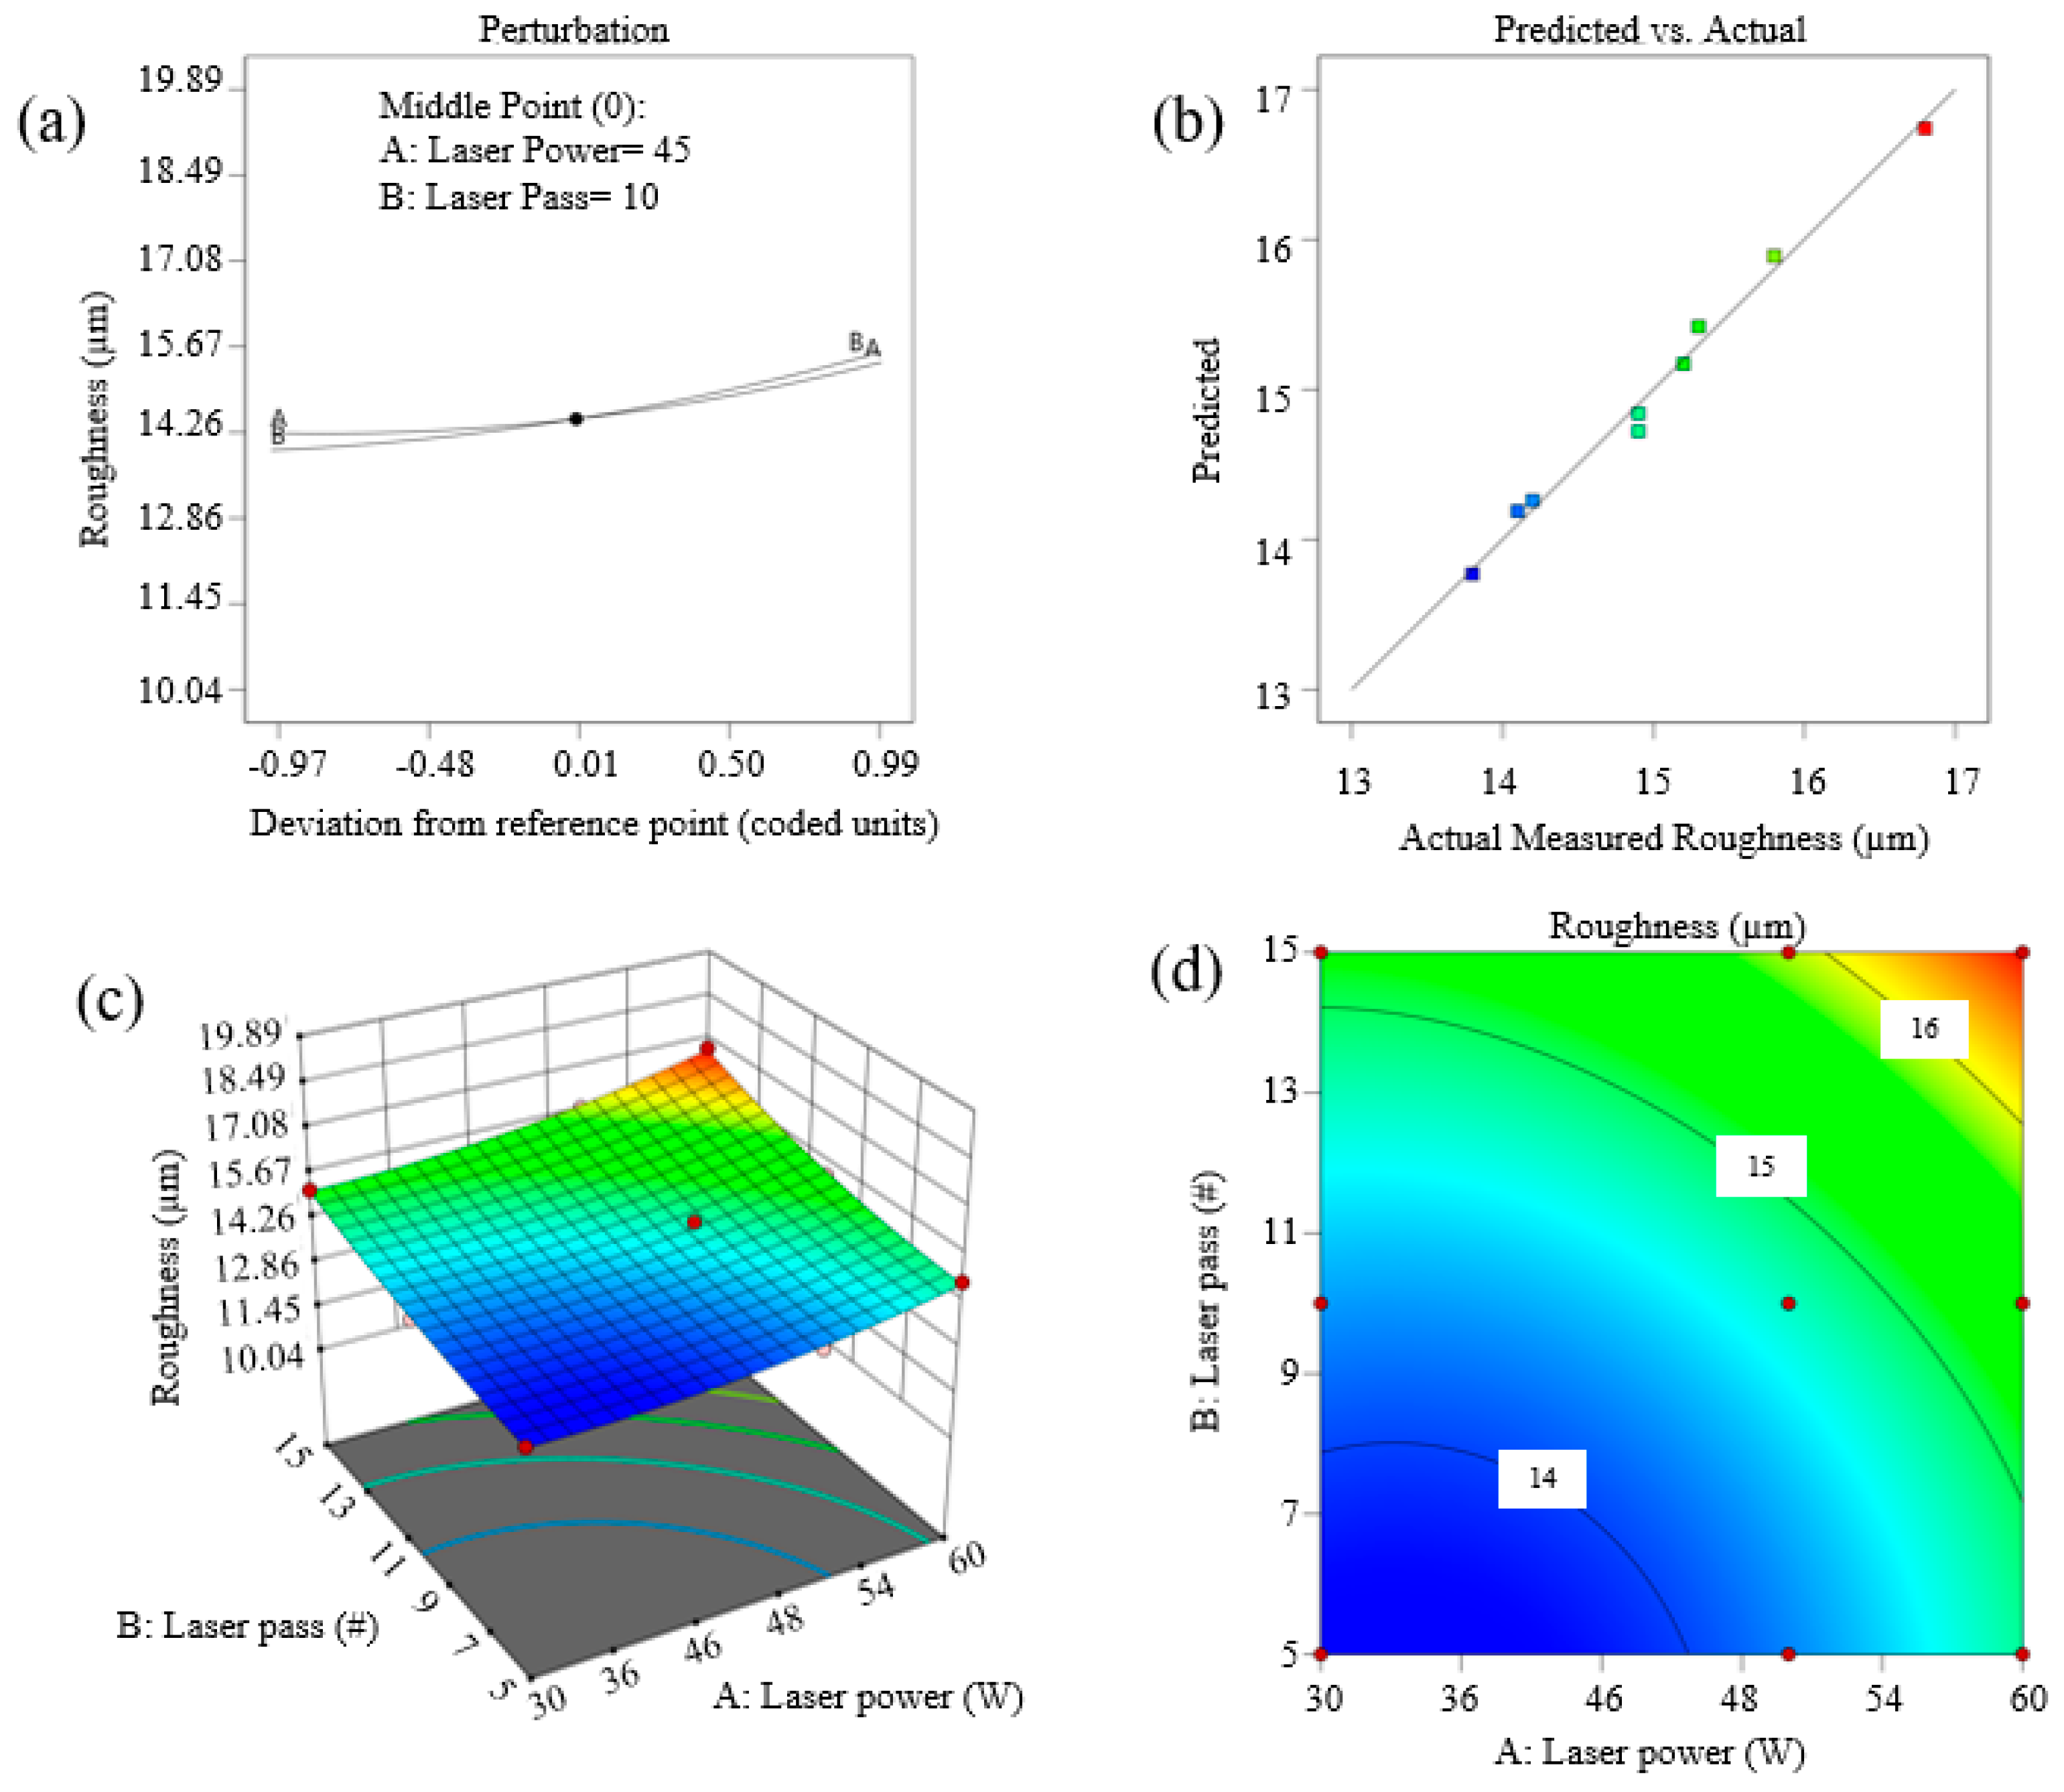
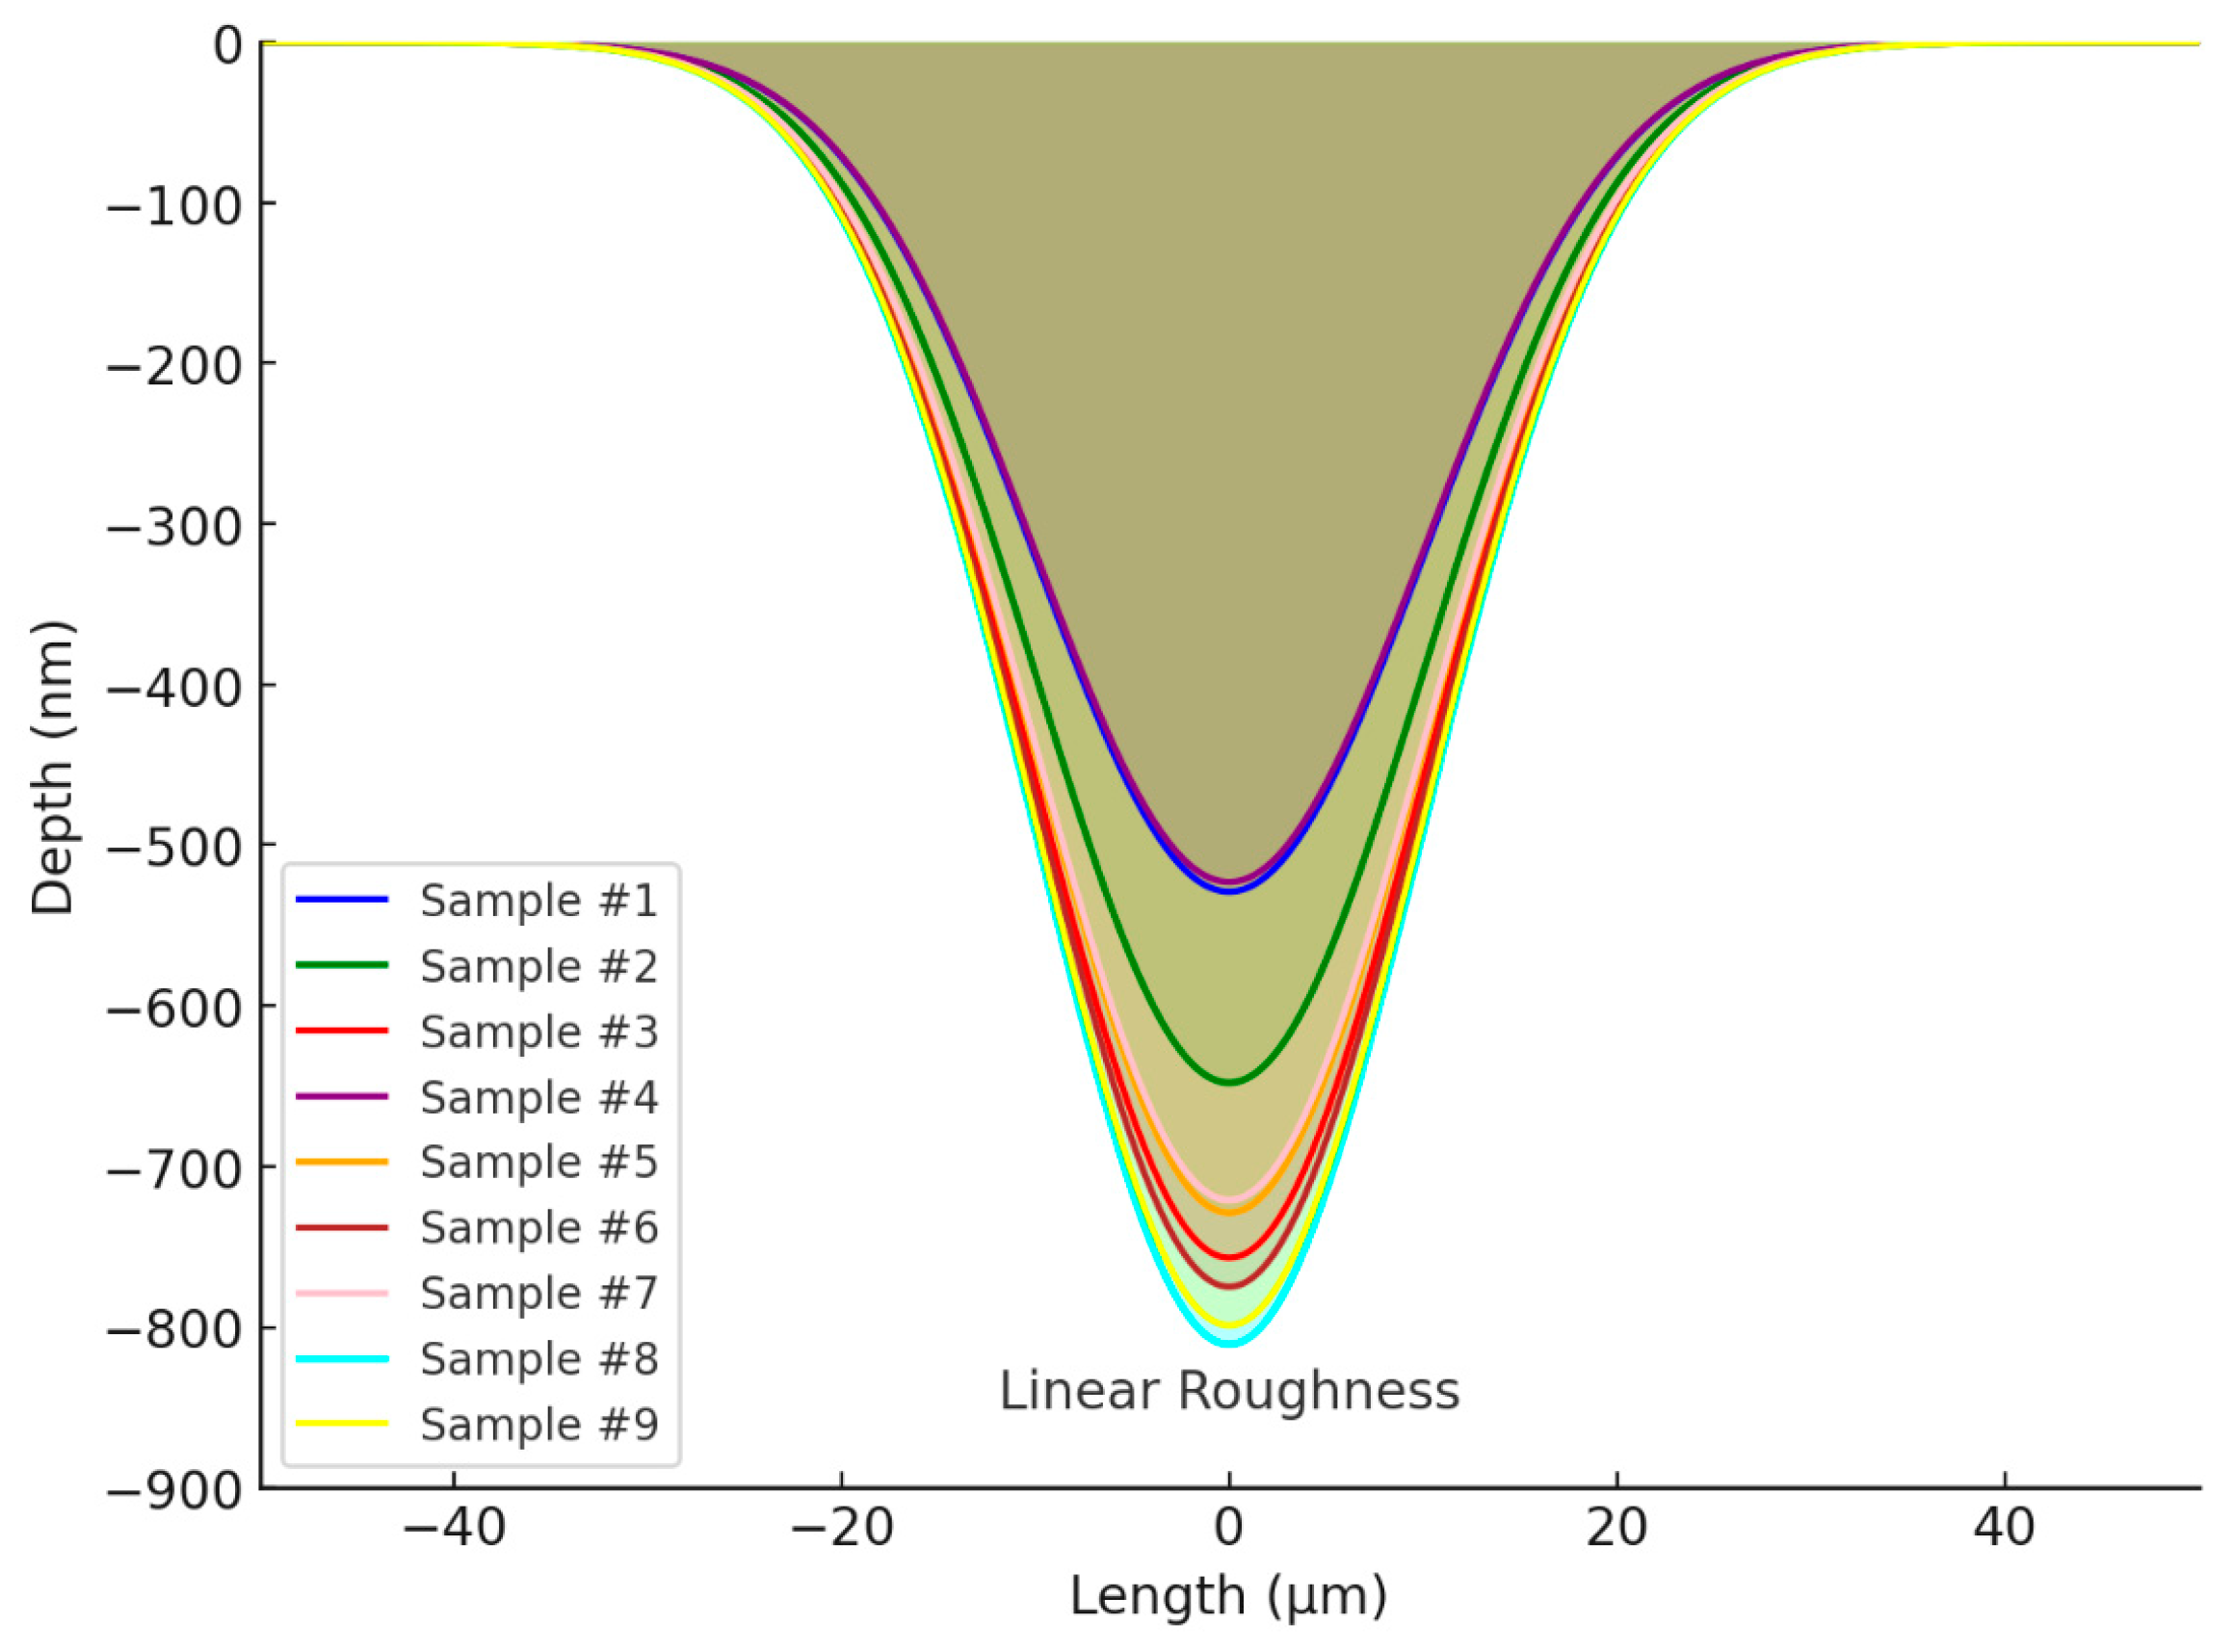
3.1. Roughness

Table 4 presents the ANOVA results for the roughness response in laser marking in this study. The model is statistically significant, with a p-value of 0.0045, indicating that the laser power and the number of passes have a meaningful effect on roughness, as shown in the regression equations (Equations (4) and (5)). The adjusted R2 value of 96.77% further confirms the reliability of the model in predicting roughness outcomes based on the input parameters.
Roughness = + 14.48 + 0.6333 Laser Power + 0.8196 Laser Pass + 0.1232 Laser Power × Laser Pass + 0.3500 Laser Power2 + 0.3000 Laser Pass2
Roughness = + 16.03333 − 0.114206 Laser Power − 0.150000 Laser Pass + 0.001643 Laser Power × Laser Pass + 0.001556 Laser Power2 + 0.012000 Laser Pass2
Figure 3a shows the perturbation plot of roughness based on the input parameters. The non-linear response reflects the regression equation coefficients for each parameter. The adjusted R2 value of 96.77% indicates excellent agreement between the predicted and experimental roughness values (Figure 3b).
According to the response surface plot (Figure 3c), the roughness increases with both a higher laser power and a greater number of passes. This trend can be explained by the fact that an increased laser power delivers more energy to the surface, leading to enhanced material ablation and irregular re-solidification patterns. Similarly, additional passes compound these effects by repeatedly exposing the material surface to thermal cycles.
The results demonstrate that the surface roughness increased with a higher laser power and additional passes. At 60 W power with 15 passes, roughness reached a peak value of 16.8 µm, whereas the lowest roughness of 13.8 µm was observed at 30 W with 5 passes. These trends can be attributed to the increased energy input per unit area, resulting in higher material ablation and non-uniform re-solidification.
Figure 4 presents SEM images showing surface morphology variations induced by different parameter settings. It can be observed that higher laser power tends to result in increased surface roughness and occasional remelting effects.
The rapid thermal cycles during laser marking are known to induce residual stress in the treated surfaces. This stress arises from thermal expansion and contraction cycles, localized melting, and subsequent re-solidification. Depending on the laser power and number of passes, residual stress may manifest as compressive stress (improving fatigue resistance) or tensile stress (increasing susceptibility to crack initiation). Although a residual stress analysis was not conducted in this study, techniques such as XRD (X-ray diffraction) or hole-drilling methods can provide quantitative insights into these stress distributions and their effects on mechanical behavior. Future work should incorporate these analytical methods to fully understand the mechanical implications of laser-induced stress fields. During the laser processing of AISI 301LN stainless steel, rapid heating and cooling cycles are known to promote the austenite-to-α’-martensite transformation. This transformation contributes to increased surface hardness and mechanical strength but may also introduce brittleness in regions with a high martensitic content. The steep thermal gradients and localized stresses induced by laser marking are primary drivers for this phase transformation.
It is important to distinguish between laser power, energy input, and the number of passes. While laser power determines the energy delivered per unit time, the number of passes dictates how many times the surface is exposed to that energy. Together, these parameters influence the total energy input per unit area. Figure 5 displays linear roughness profiles for nine samples, revealing distinct valley-like features influenced by varying laser parameters. The symmetry of these valleys suggests consistent energy delivery during the laser marking process. Deeper valleys, observed in Samples #8 and #9, correspond to higher energy input, resulting in pronounced ablation and material displacement. Shallower valleys, seen in Samples #1 and #4, indicate lower energy input, leading to reduced surface irregularities. The uniform Gaussian-like shape of the valleys across all samples suggests that the laser texturing process is highly reproducible and scalable. This is significant for industrial applications where precise control over roughness characteristics is required. For instance, deeper roughness profiles may enhance the bonding strength in coatings or promote hydrophilicity in biomedical implants, while smoother profiles are desirable for wear-resistant surfaces or fluidic applications.
The 3D reconstructions of laser-textured surfaces (Figure 6) provide further insights into the surface morphology changes induced by parameter variations. Samples with higher roughness values exhibit more pronounced peaks and valleys, indicating extensive ablation and re-solidification cycles. In contrast, samples with lower roughness values display smoother textures, reflecting minimal thermal and physical disruption during the process. These observations align with previous studies, where laser parameters directly influenced the surface morphology and wettability performance.
The observed inverse correlation between surface roughness and wettability can be explained using the Wenzel model, which assumes complete wetting of rough surfaces. Increased surface roughness in hydrophilic samples (e.g., Sample #1, 16.8 µm roughness) enhanced wettability (contact angle = 86.4°). In smoother samples (e.g., Sample #9, 13.8 µm roughness), reduced wettability (contact angle = 92.4°) was observed. The Cassie-Baxter model, which involves air pocket entrapment, had limited applicability due to the nature of the surface textures observed in this study. These results indicate that surface texture parameters, including groove depth, peak density, and uniformity, directly influence water droplet behavior and contact angle stability.

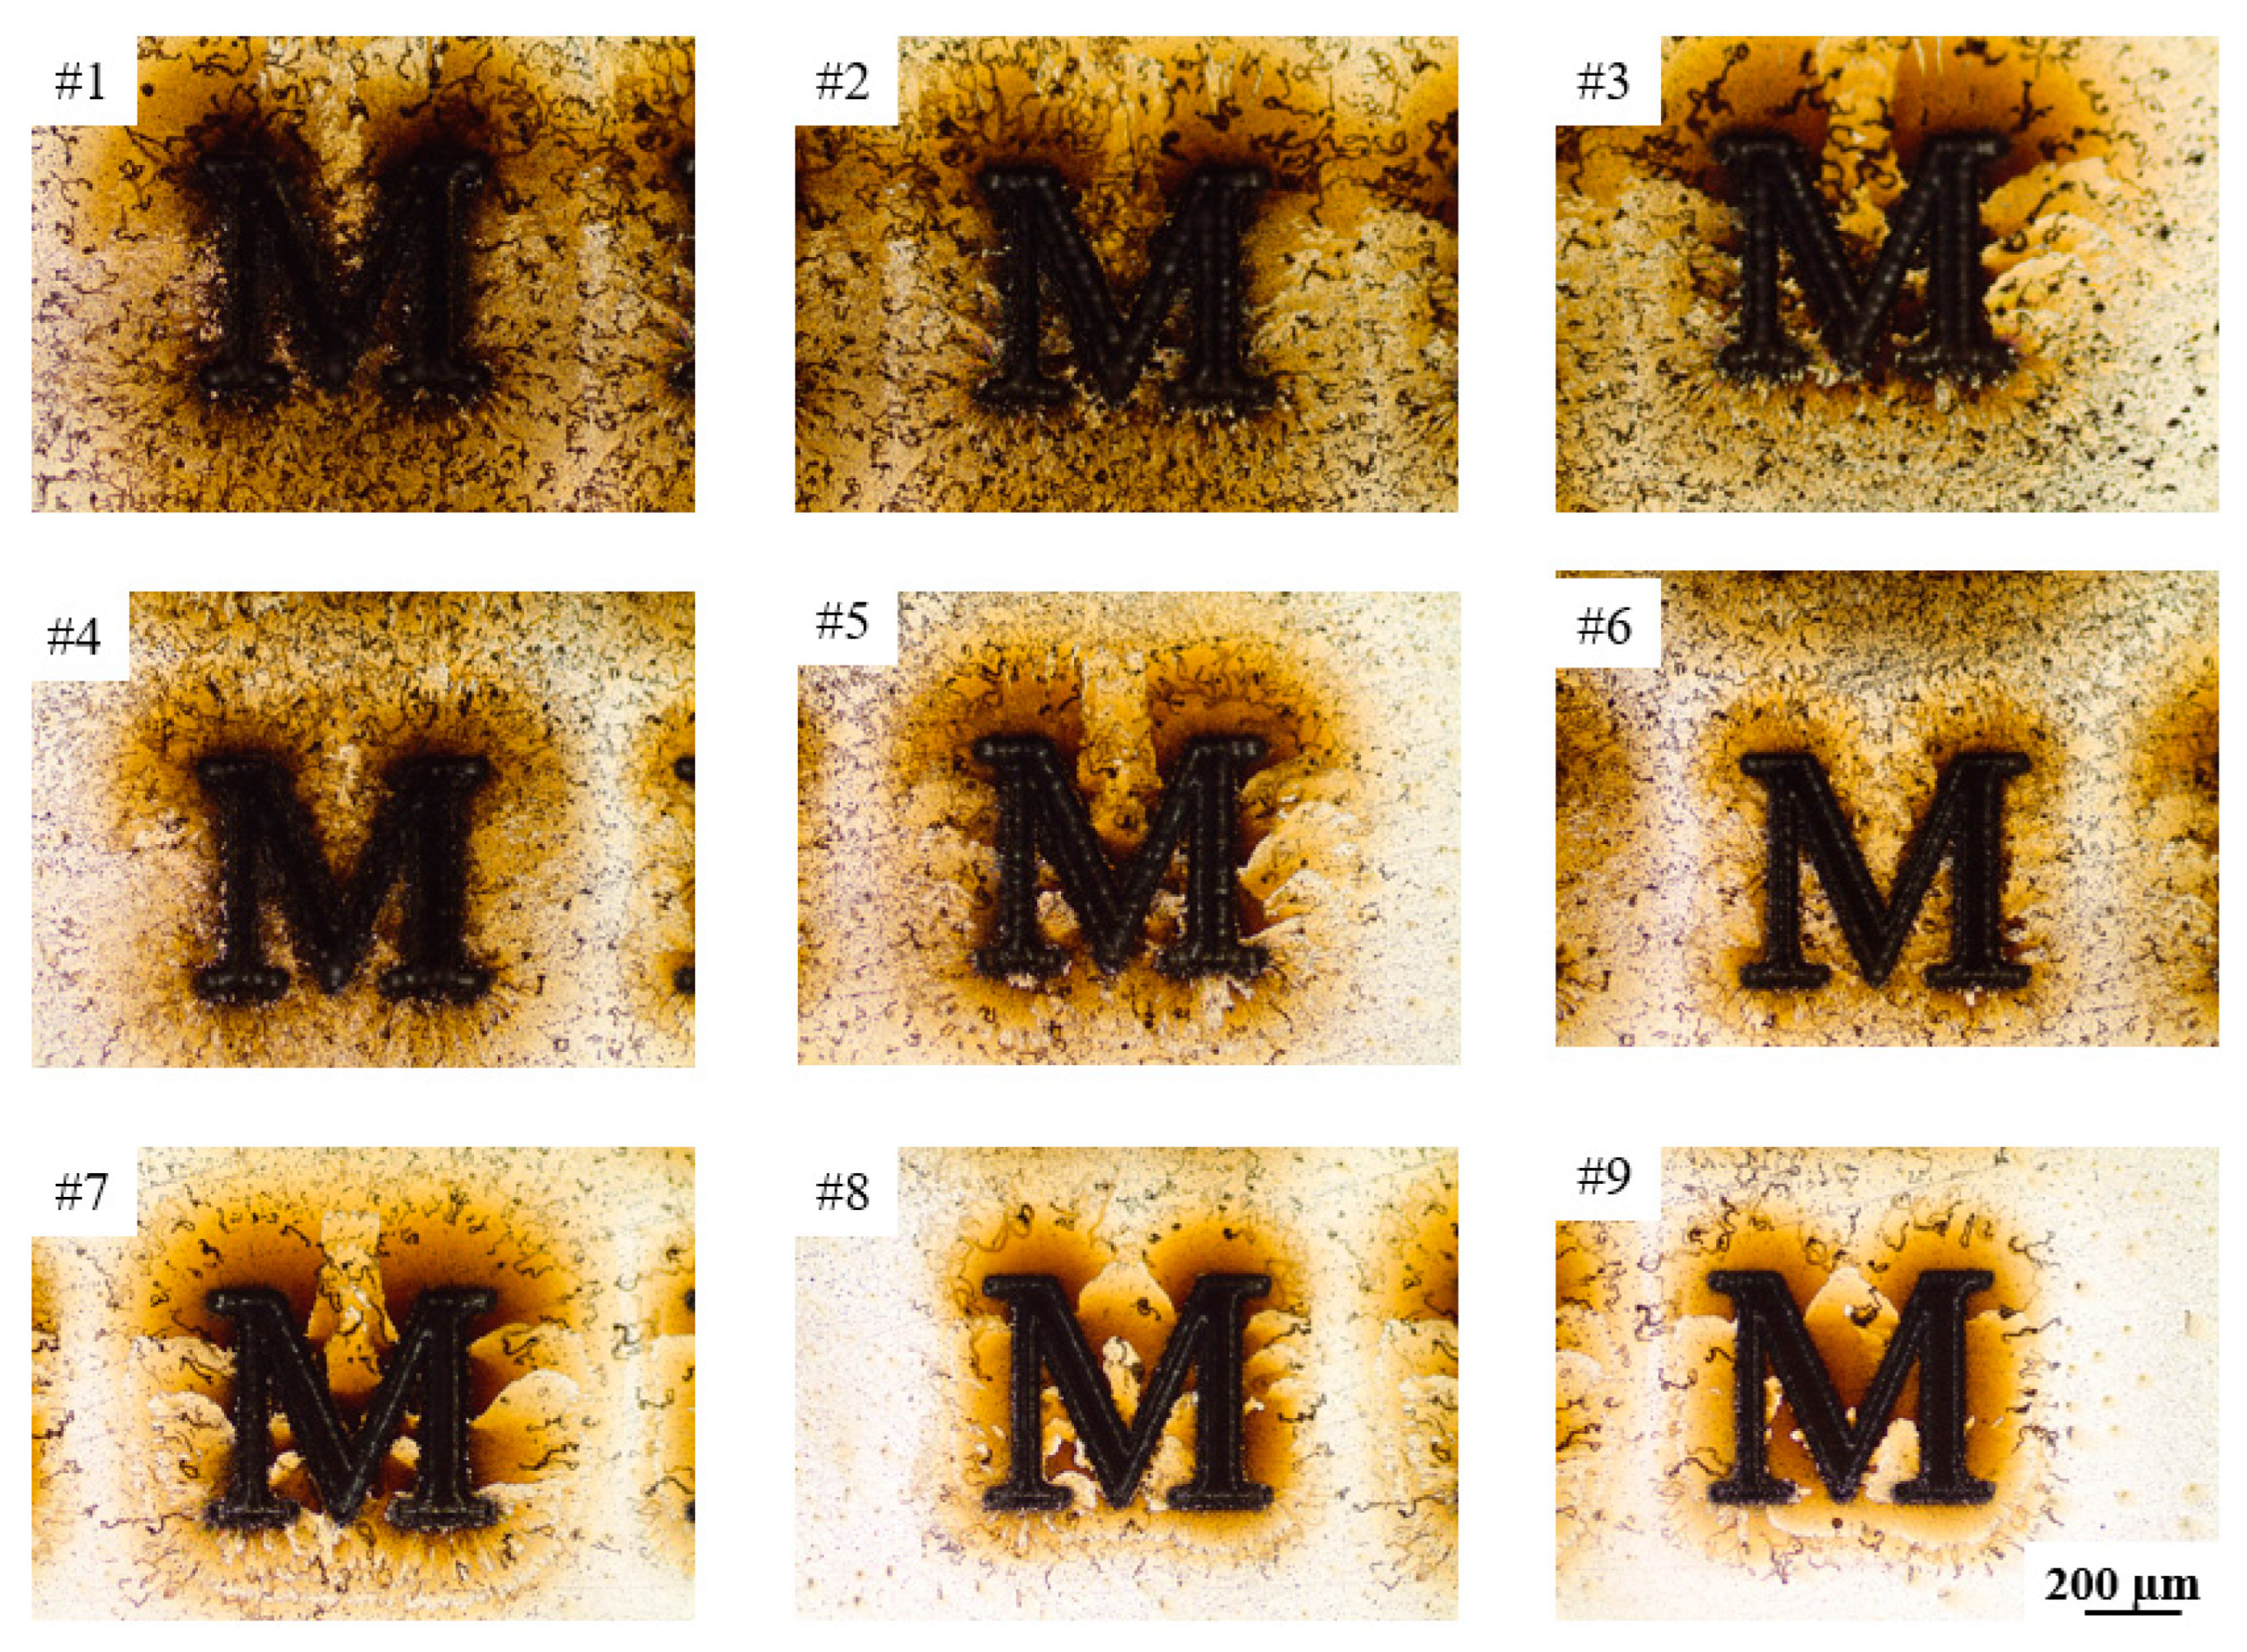
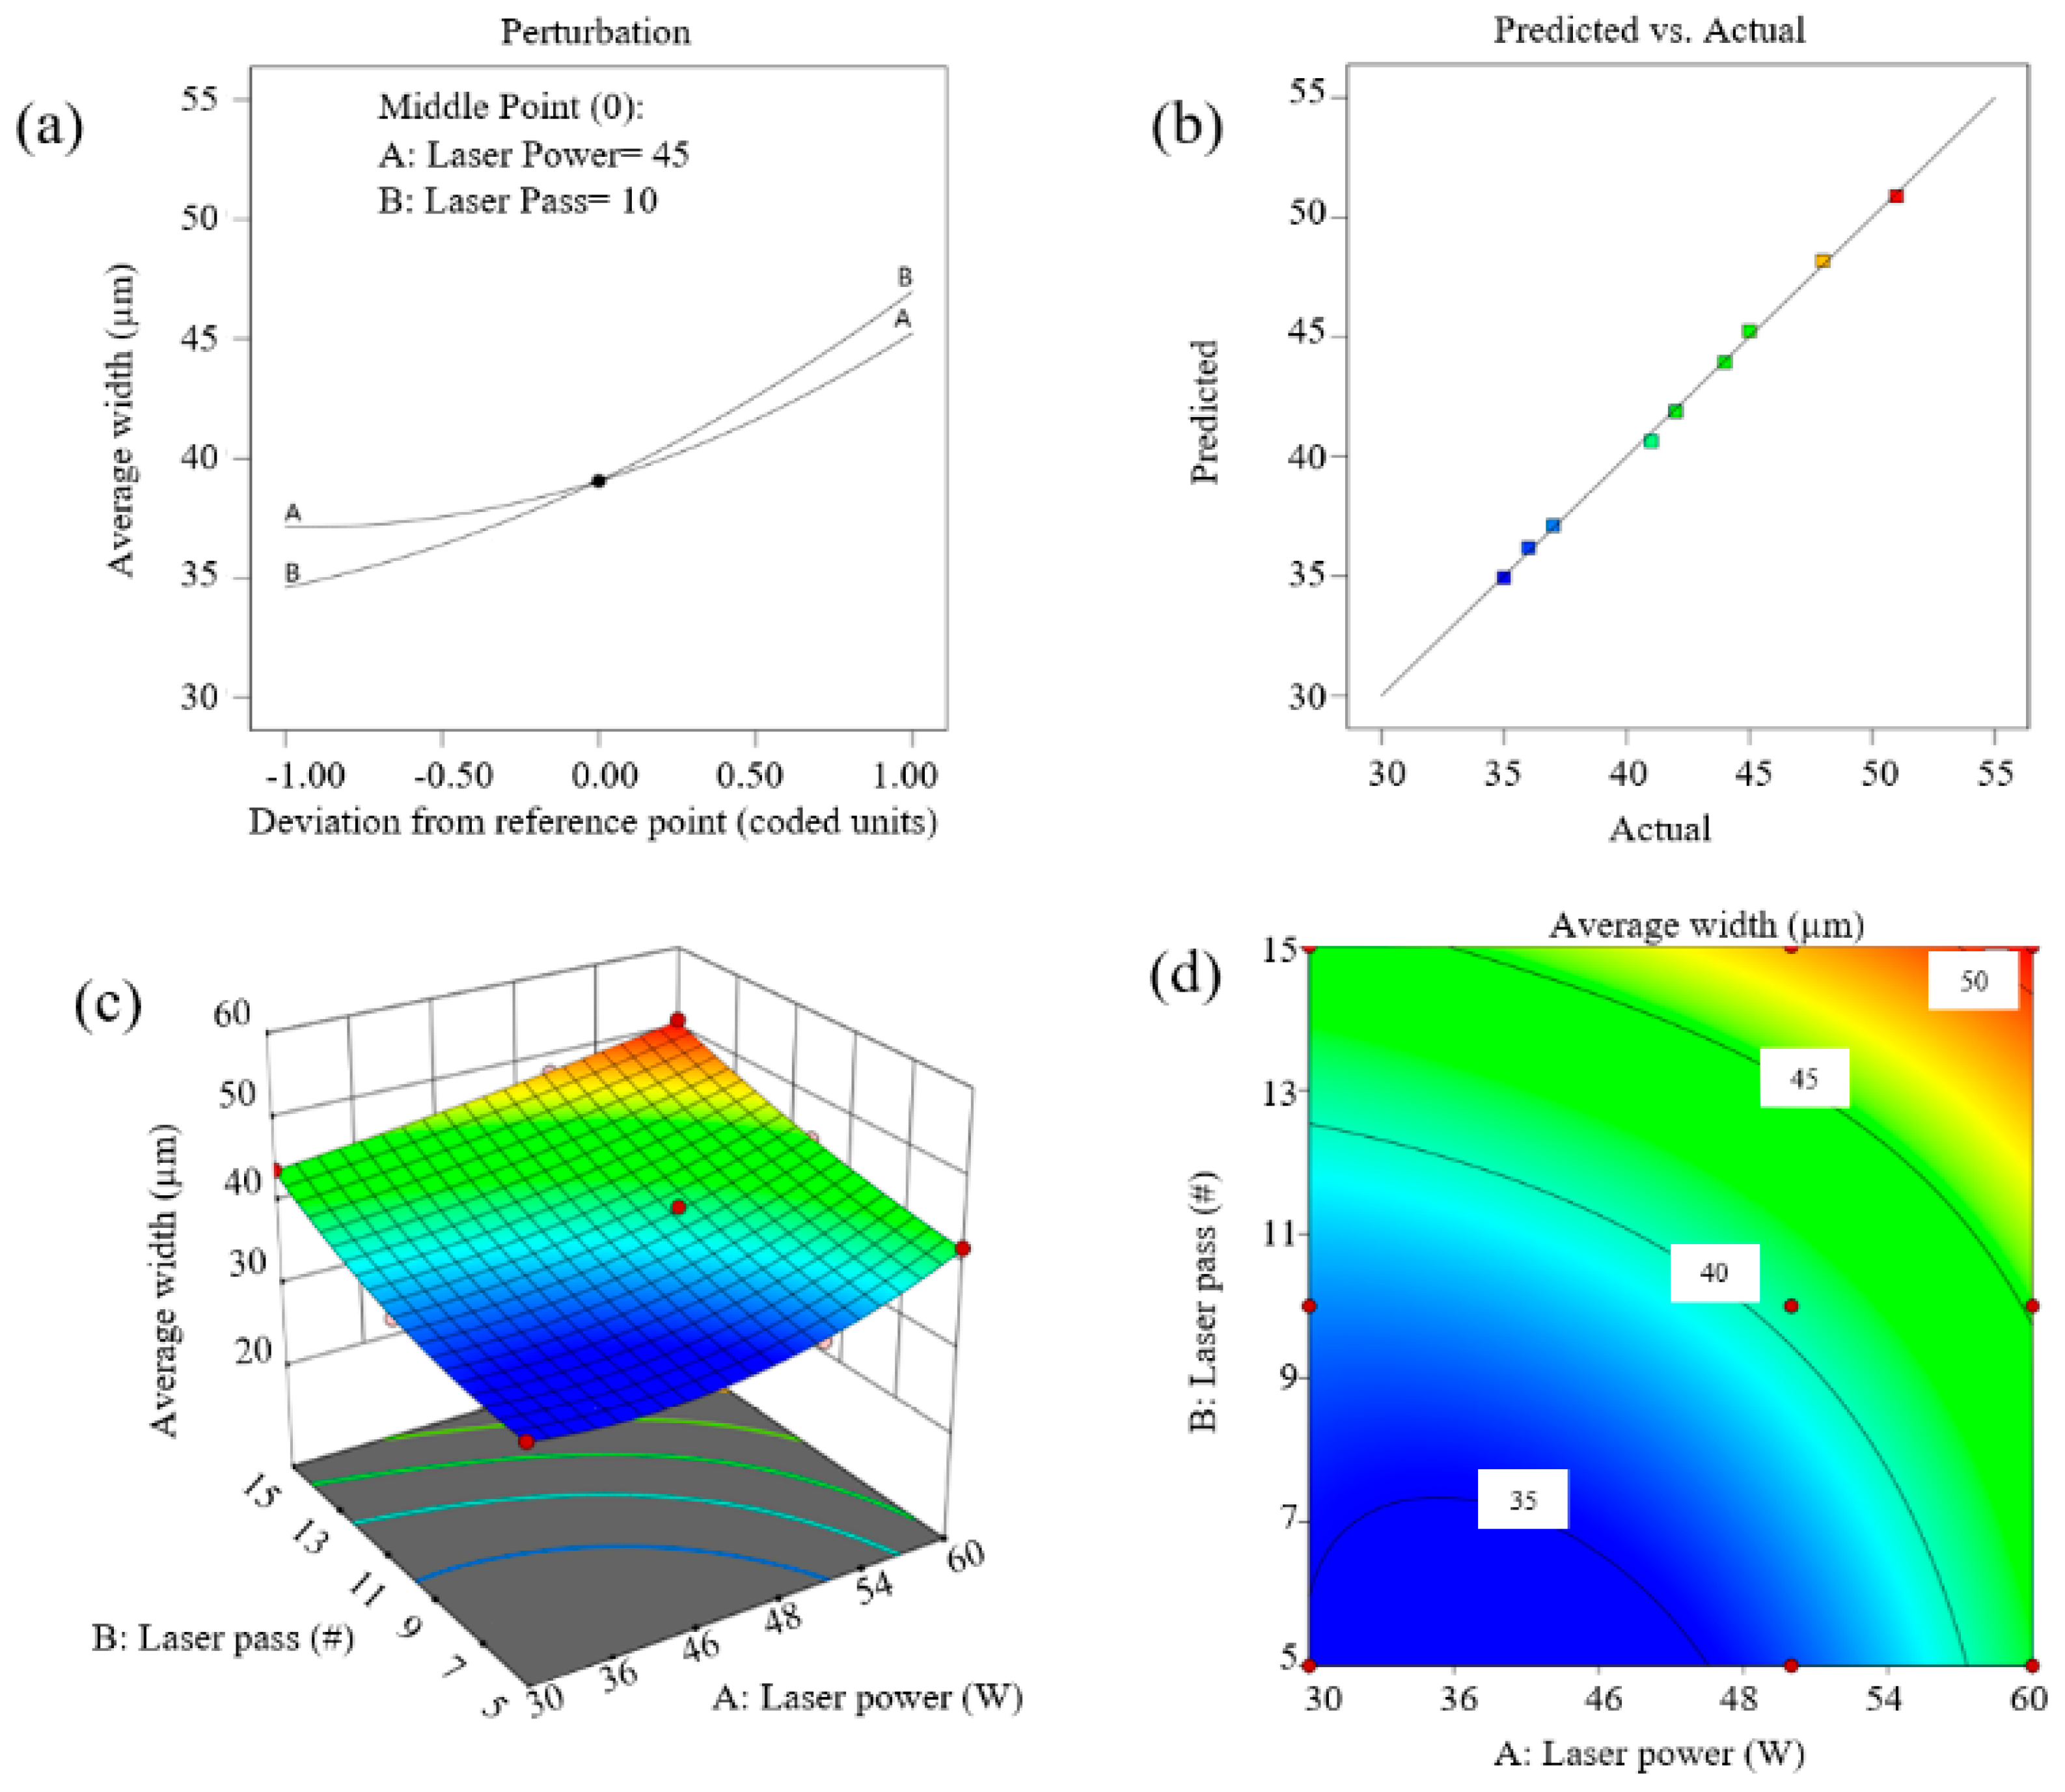
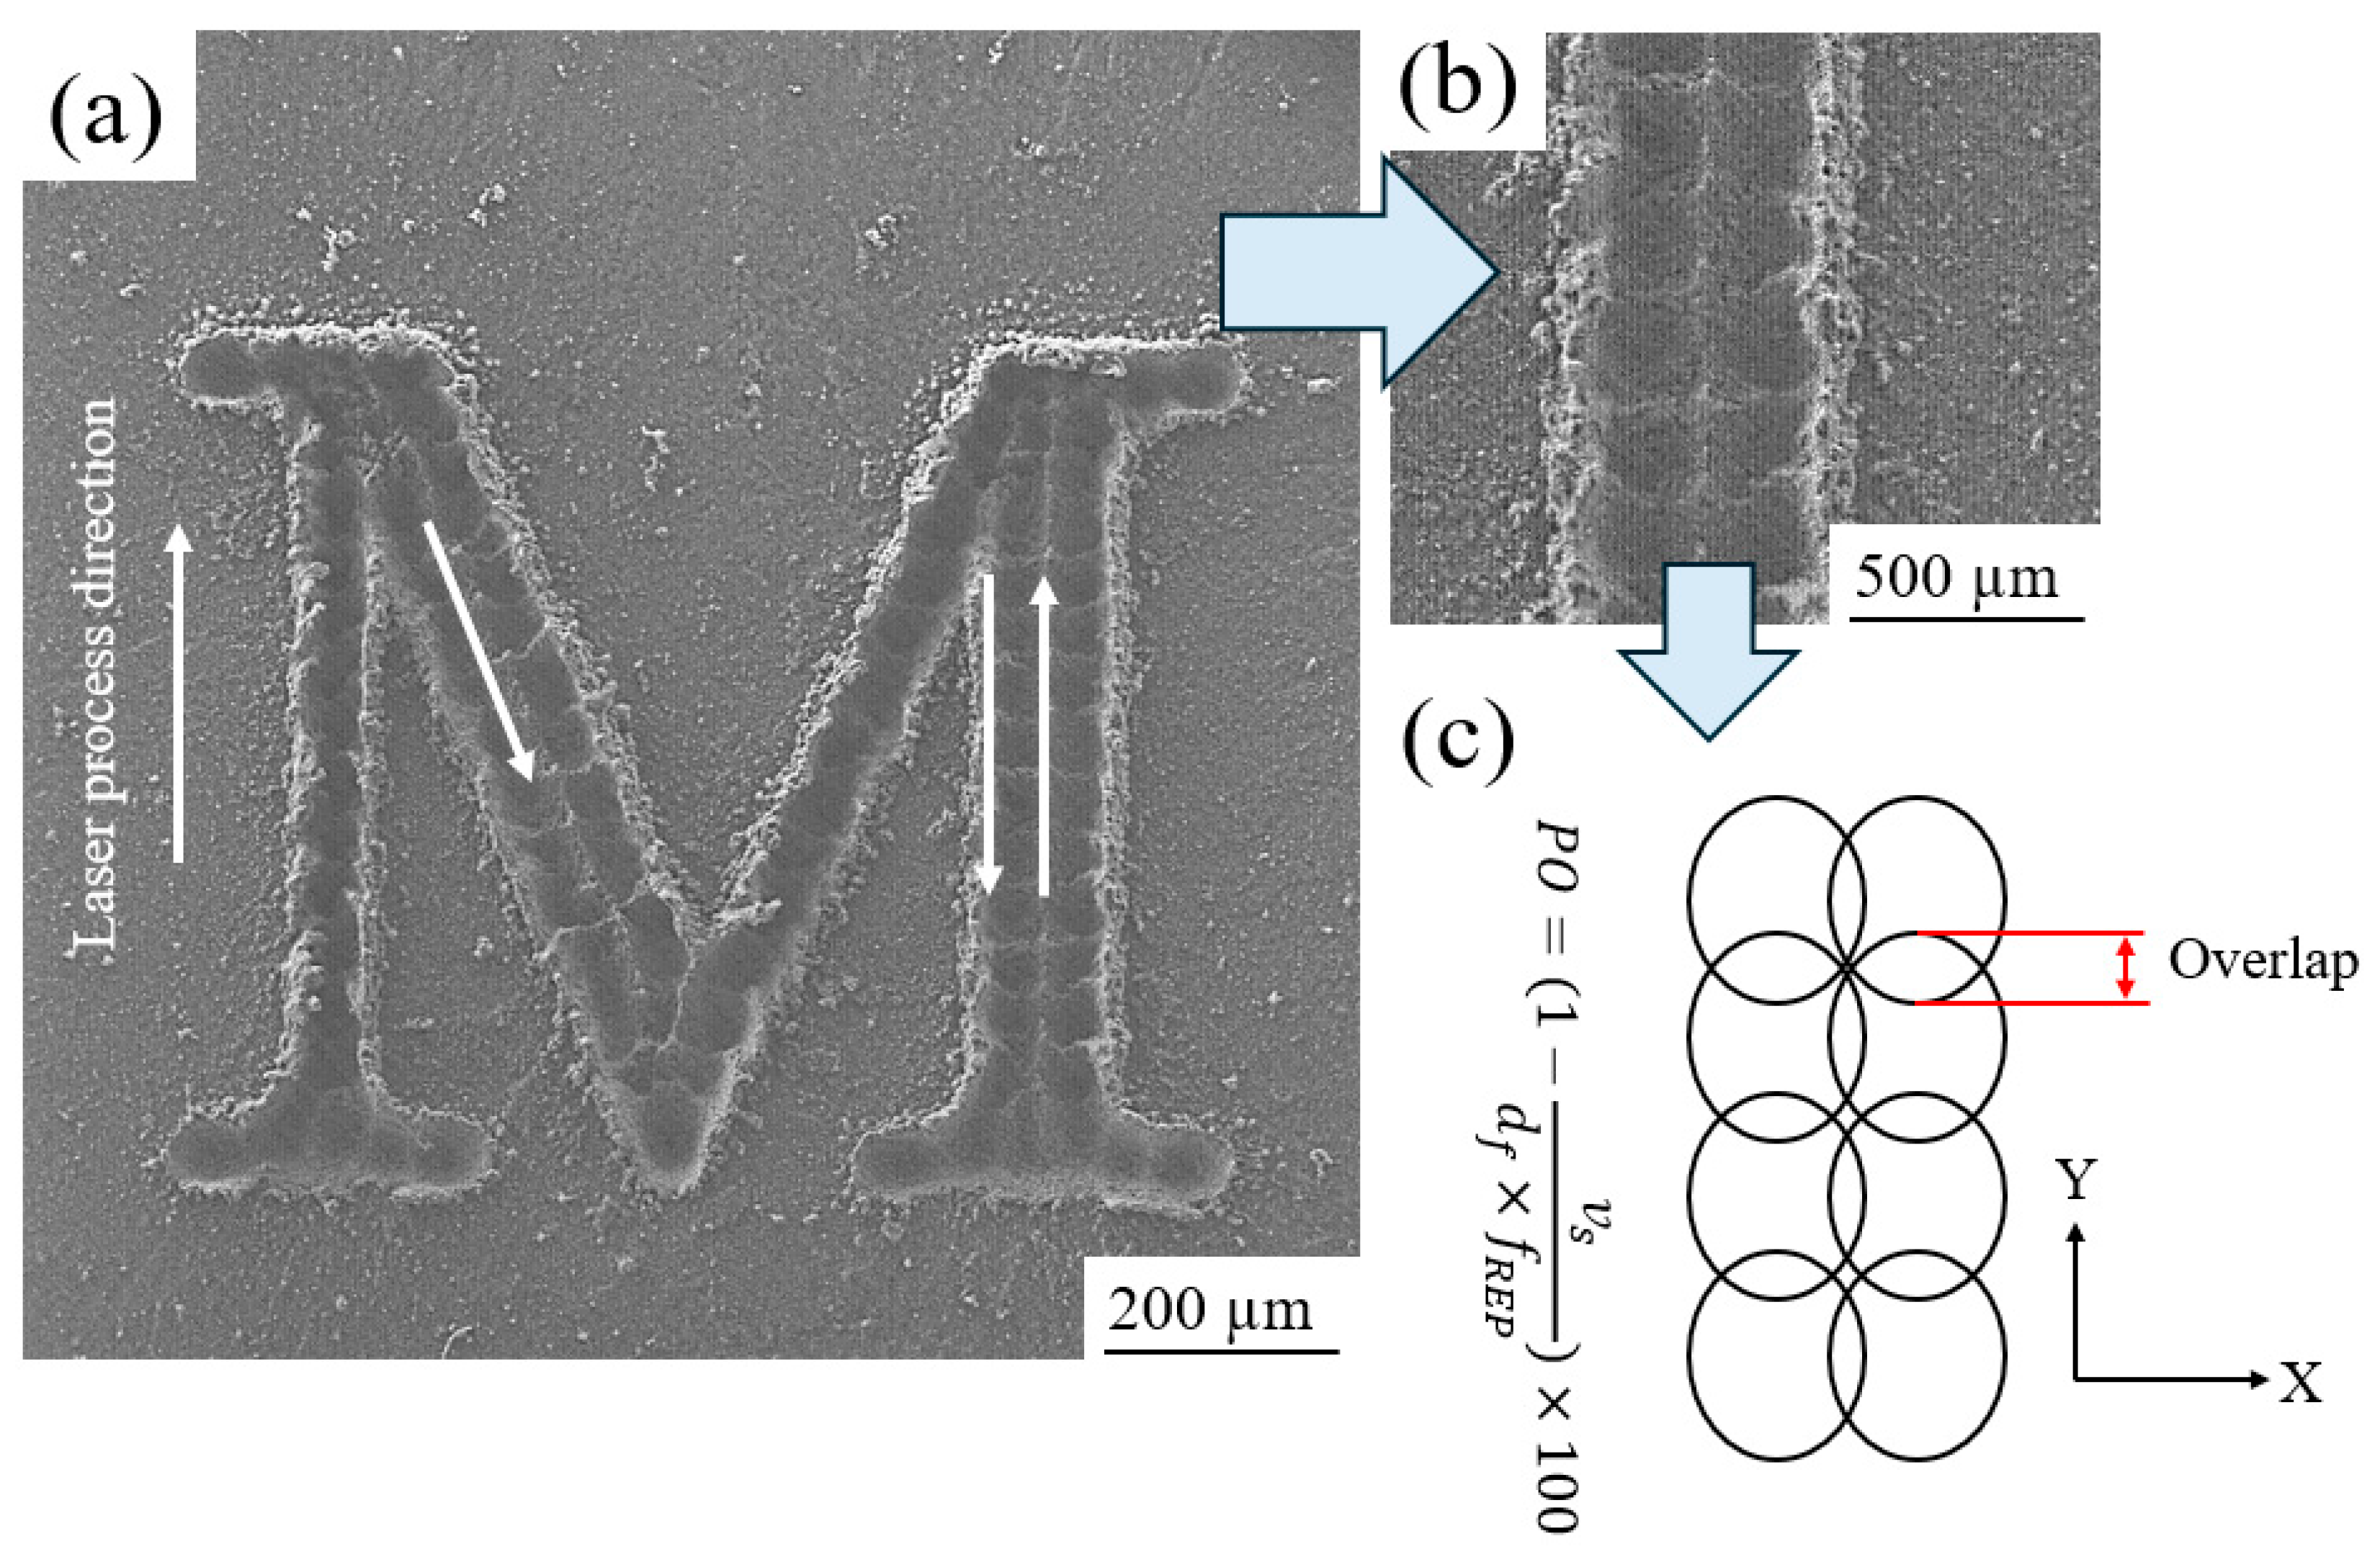
3.2. Average Width (AW)
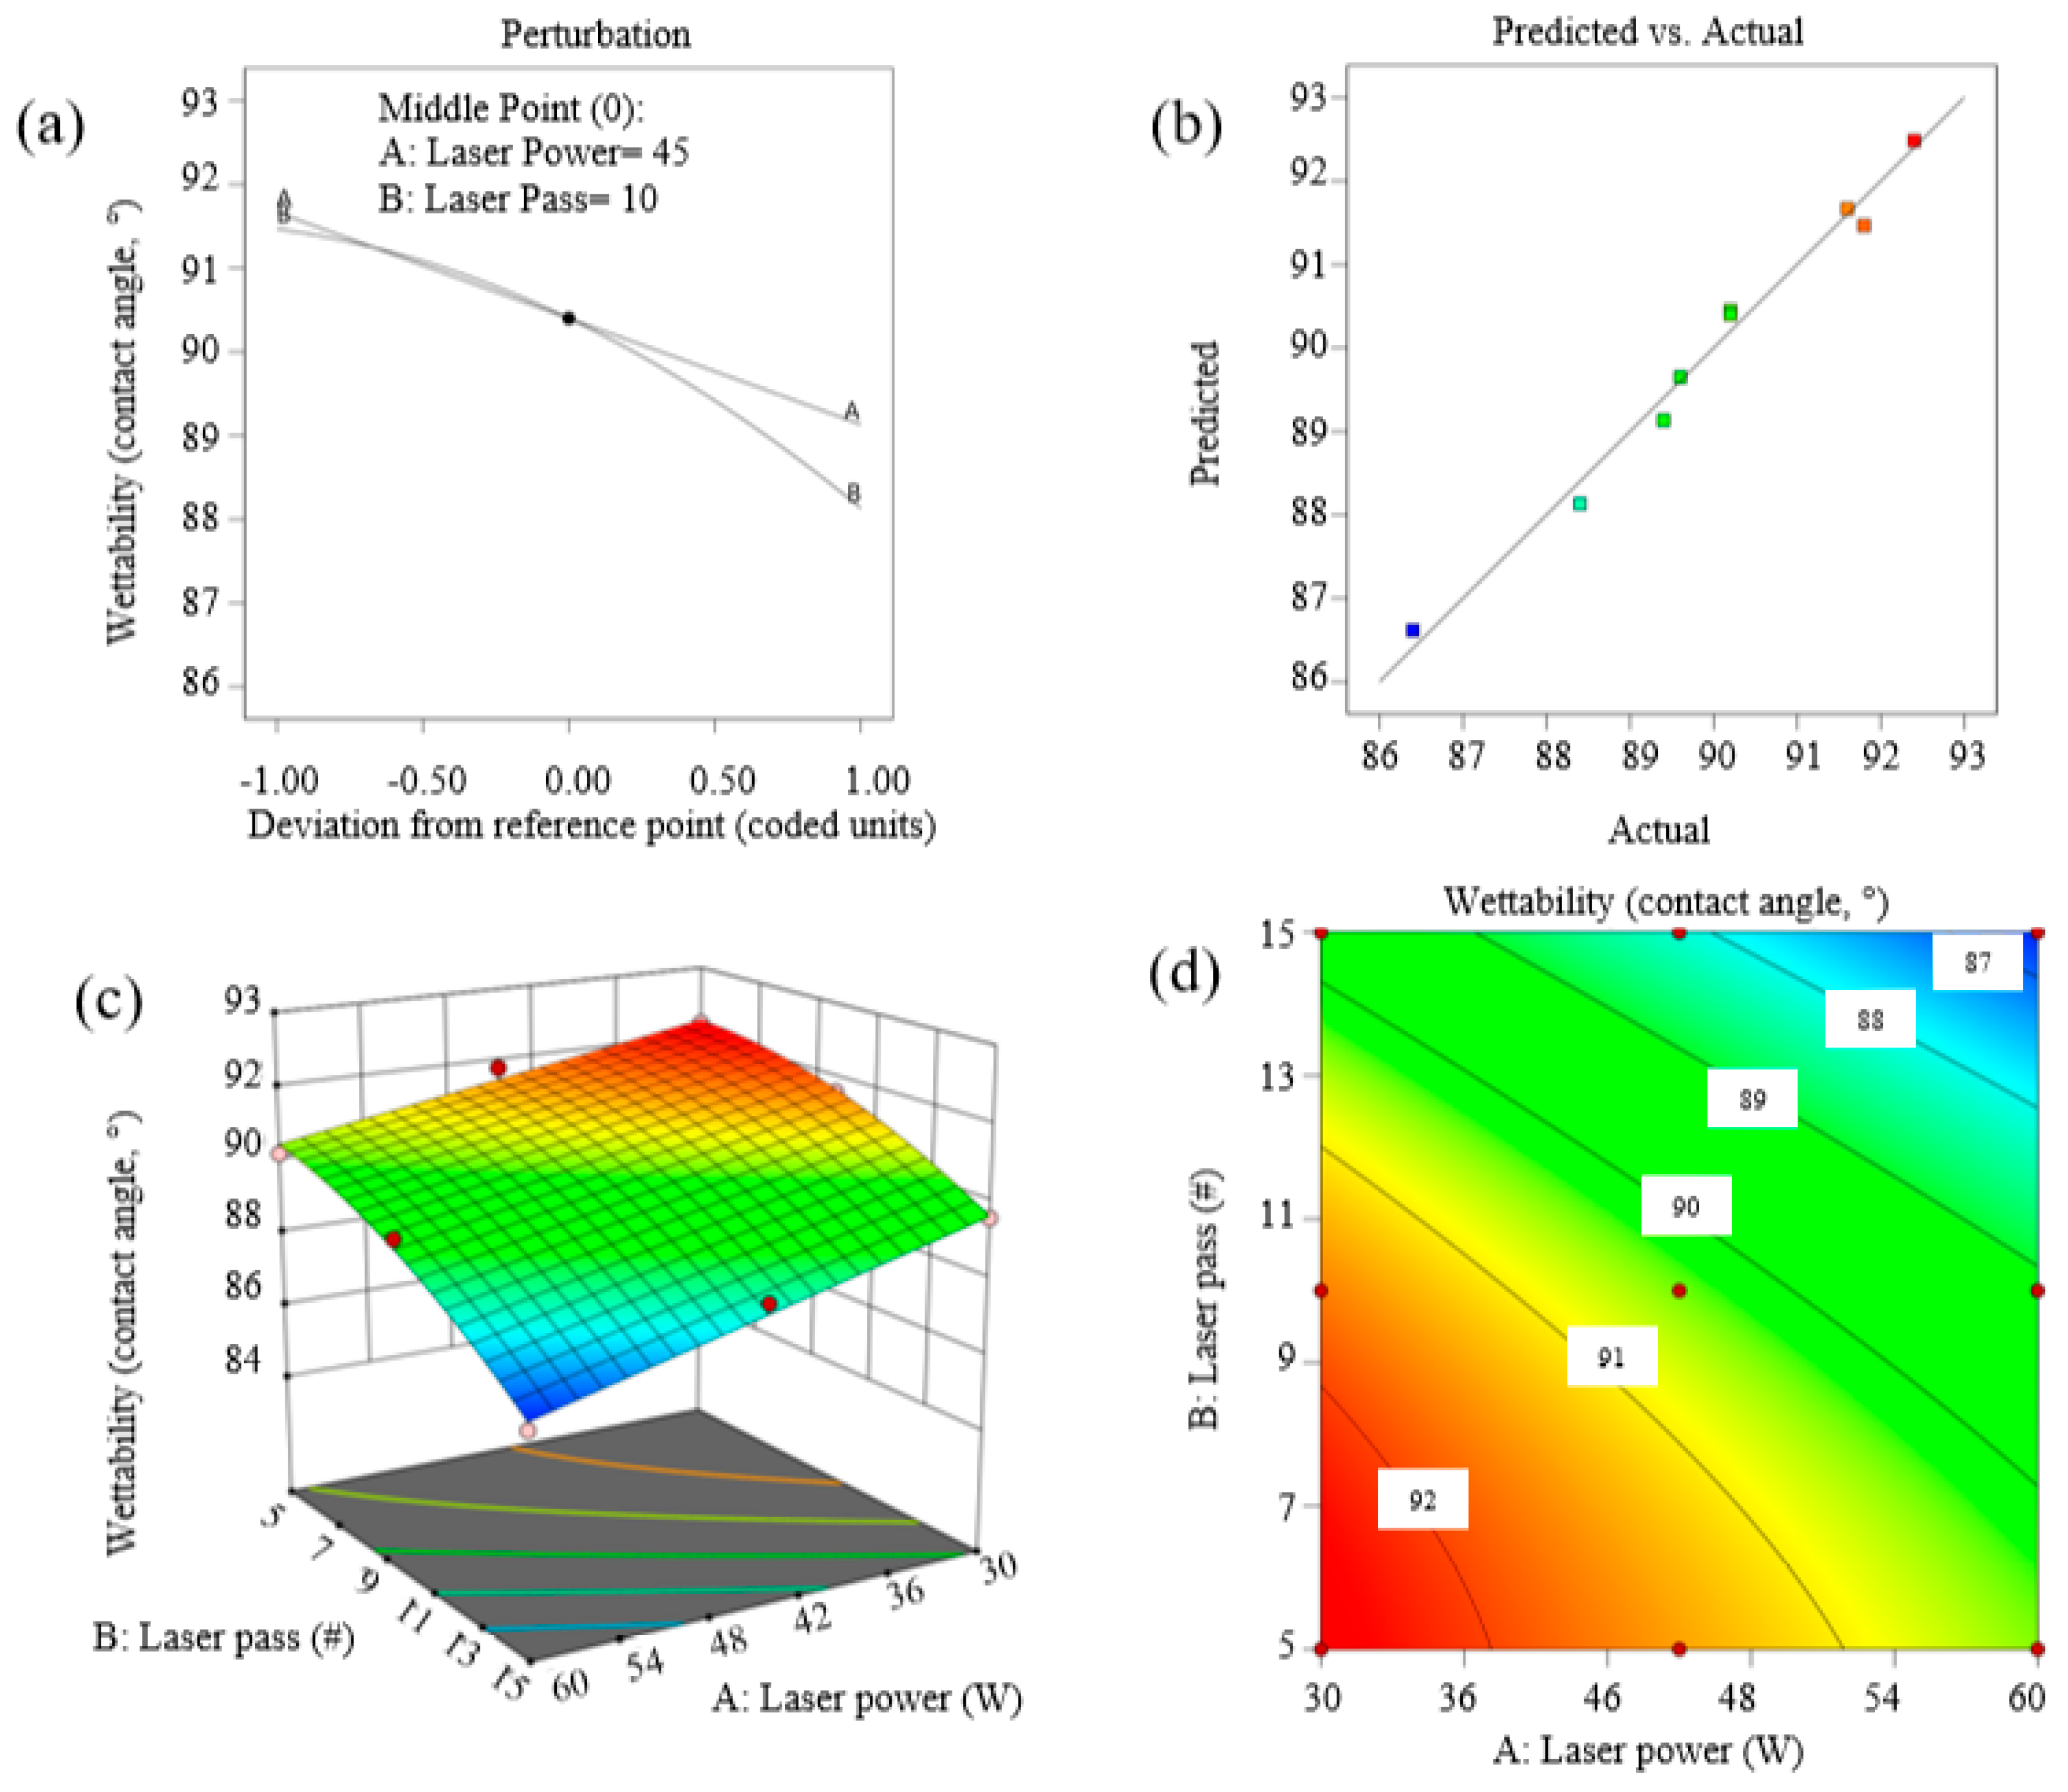
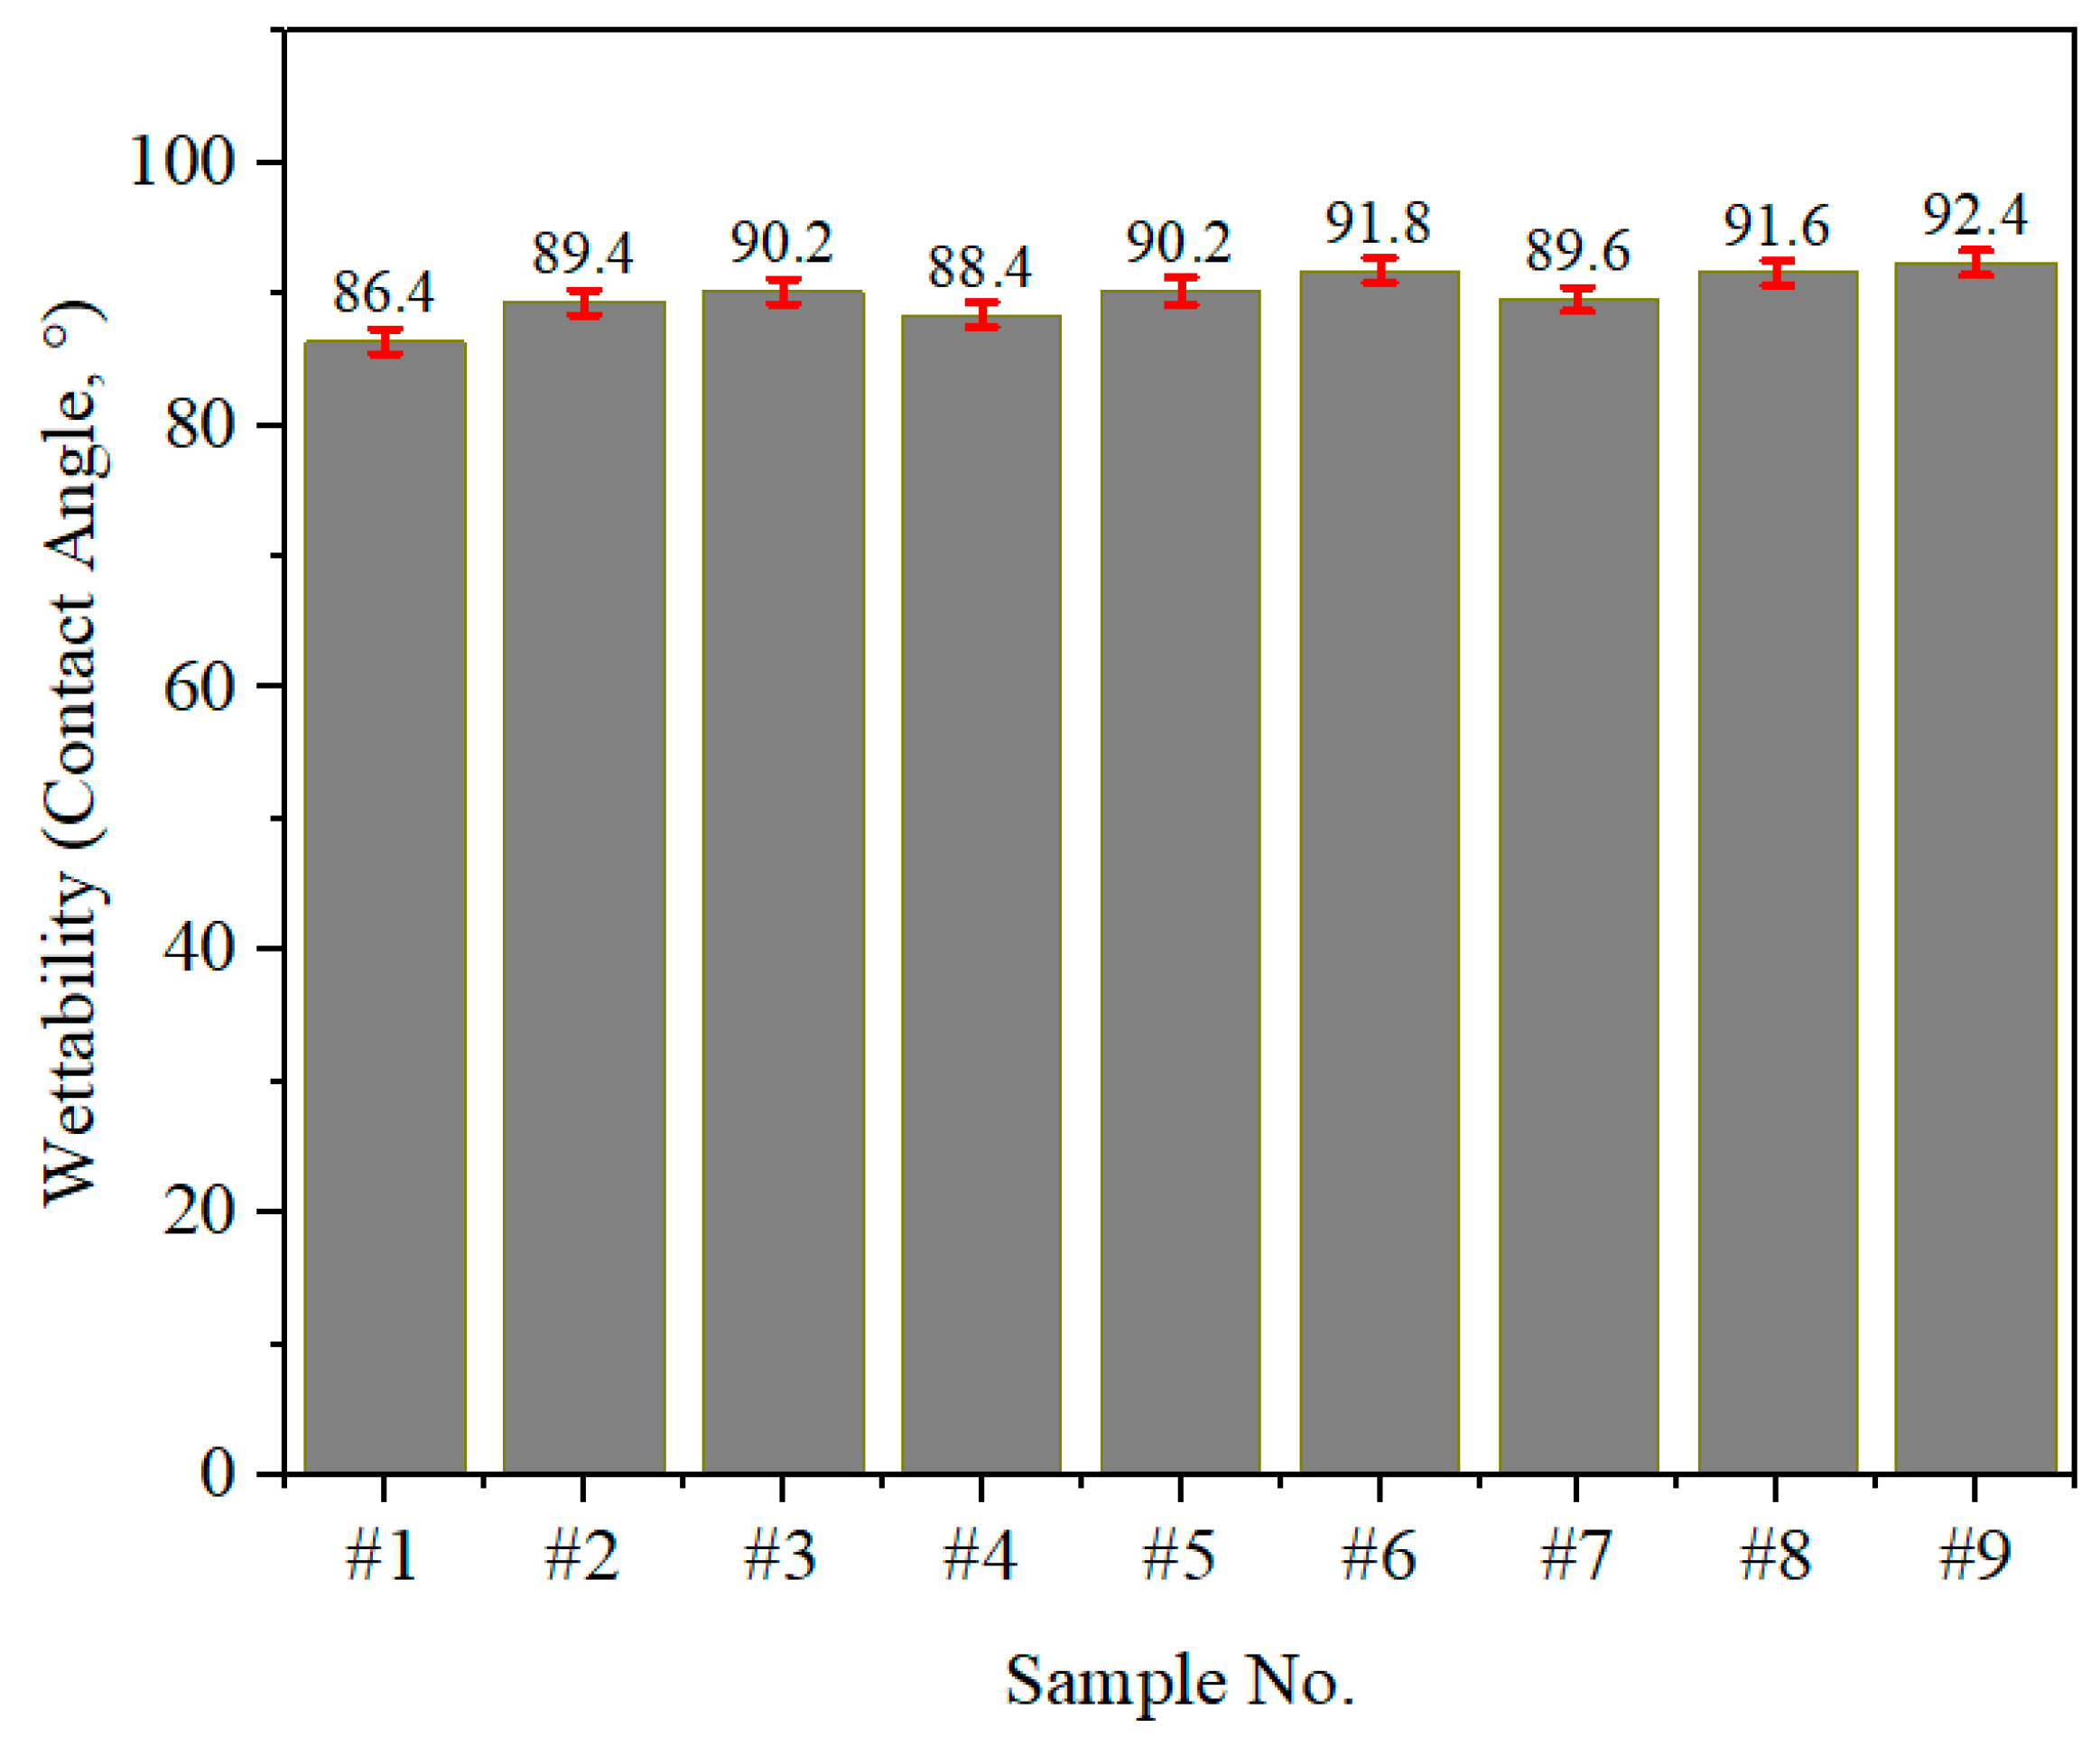
This section examines the average width (AW) of the engraved letter M segments (L1, L2, L3, and L4) created using the laser marking process. The significance of the influence of laser power and number of passes on engraving width was evaluated using statistical metrics such as p-values and F-values derived from an ANOVA (Table 5). Parameters with p-values below 0.05 were considered statistically significant. Overlapping effects, although not treated as a separate variable, were indirectly accounted for in the response surface methodology (RSM) analysis. The interaction between laser power and the number of passes inherently incorporates overlapping influences, as shown in the contour and surface response plots (Figure 7 and Figure 8). Table 5 also details the effects of input parameters—laser power and laser pass—as well as their combined and squared influences. Equations (6) and (7) display the regression equation’s coded and actual factor terms, respectively. With an adjusted R2 of 95.94%, this analysis indicates a strong alignment between the experimental results and the model predictions.
Average Width = + 39.10 + 3.67 Laser Power + 4.98 Laser Pass + 0.1607 Laser Power × Laser Pass + 2.13 Laser Power2 + 1.67 Laser Pass2
Average Width = + 44.88889 − 0.626984 Laser Power − 0.433333 Laser Pass + 0.002143 Laser Power × Laser Pass + 0.009444 Laser Power2 + 0.066667 Laser Pass2
where A = Laser Power (W), B = Laser Pass (number of passes), and Roughness/Average Width/Wettability are the response variables.
These models are valid within the experimental range of laser power (30–60 W) and the number of laser passes (5–15).
Figure 7a presents the perturbation plot of the AW in relation to the input parameters, illustrating the interaction between laser power and laser pass on the AW. Given that this model is significant, the predicted results closely align with the experimental data, as shown in Figure 7b. The response surface plots in Figure 7a,c reveal that increasing the input parameters extends the engraved area on the sample. The SEM images in Figure 8 highlight that overlapping areas are a critical aspect of the laser marking and texturing process; as the number of laser passes increases, a greater portion of the surface is engraved, and heat transfer to the metal promotes further engraving.
The mean absolute error (MAE, ε) was calculated as 0.10 µm for the roughness model and as 1.0 µm for the average width model, indicating good predictive accuracy.

3.3. Wettability

Table 6 presents the ANOVA results for the wettability of the surface after the laser marking process. It is evident that both input parameters, laser power and the number of laser passes, significantly influenced wettability. The model was found to be significant, with an R² value of 96.99%, indicating a strong fit between the predicted data and the experimental results. Equations (8) and (9) display the regression equation’s coded and actual factor terms, respectively.
Wettability = + 90.40 − 1.27 Laser Power − 1.67 Laser Pass − 0.2500 Laser Power × Laser Pass − 0.6000 Laser Pass2
Wettability = +93.63333 − 0.051111 Laser Power + 0.296667 Laser Pass − 0.003333 Laser Power × Laser Pass − 0.024000 Laser Pass2
Figure 9 illustrates the surface plot of wettability following the laser marking process. In Figure 9a, the interaction between the input parameters and wettability is depicted, showing that when both input parameters decrease simultaneously, wettability also decreases. Since this model is significant, the predicted results closely align with the experimental data, as shown in Figure 9b. Moving to Figure 9c, the response surface plot demonstrates that increasing laser power and the number of laser passes leads to higher wettability, attributed to the reduced contact angle of droplets on the surface. Additionally, the 2D representation of the response surface plot is presented in Figure 9d.
The plot presented in Figure 10 illustrates the wettability (contact angle in degrees) of nine laser-textured samples, emphasizing the relationship between laser processing parameters and surface wettability. The contact angle values range from 86.4° (Sample #1) to 92.4° (Sample #9), showing a moderate variation across the samples. This variation reflects the influence of roughness on the wettability of the AISI 301LN stainless steel surface, as induced by changes in laser power and the number of passes.
The observed contact angles show an inverse correlation with surface roughness, consistent with the predictions of Wenzel’s and Cassie-Baxter’s wettability models. Samples with lower roughness values, such as Sample #9 (13.8 µm roughness, 92.4° contact angle), exhibit higher contact angles, indicating reduced wettability and a more hydrophobic surface. In contrast, surfaces with higher roughness, like Sample #1 (16.8 µm roughness, 86.4° contact angle), display lower contact angles, reflecting enhanced wettability and a more hydrophilic surface. Our results show similar trends to those reported in [34,35], where increased laser energy also led to enhanced roughness and wettability changes.
Both laser power and the number of passes play a significant role in determining surface roughness and, consequently, wettability behavior. Higher laser power and multiple passes (e.g., Sample #1: 60 W, 15 passes) result in increased surface melting and ablation, creating rougher textures and promoting enhanced wetting behavior. In contrast, lower laser power and fewer passes (e.g., Sample #9: 30 W, 5 passes) produce smoother textures that resist wetting, leading to higher contact angles. These surface characteristics offer distinct advantages depending on the application. Rougher hydrophilic surfaces are beneficial for scenarios requiring improved adhesion, such as protective coatings, biomedical implants, or lubrication systems. Conversely, smoother hydrophobic surfaces are desirable in applications requiring liquid repellency, such as self-cleaning surfaces, anti-fouling coatings, or water management systems.

4. Conclusions

This study investigated the effects of nanosecond short-pulsed fiber lasers on the surface properties of AISI 301LN stainless steel, focusing on optimizing laser parameters for precise marking and surface texturing. By employing the response surface methodology (RSM), the interplay between laser power, the number of passes, and the resulting surface morphology and microstructure was analyzed. Advanced characterization techniques provided critical insights into the laser’s impact on surface roughness, engraving width, and wettability.
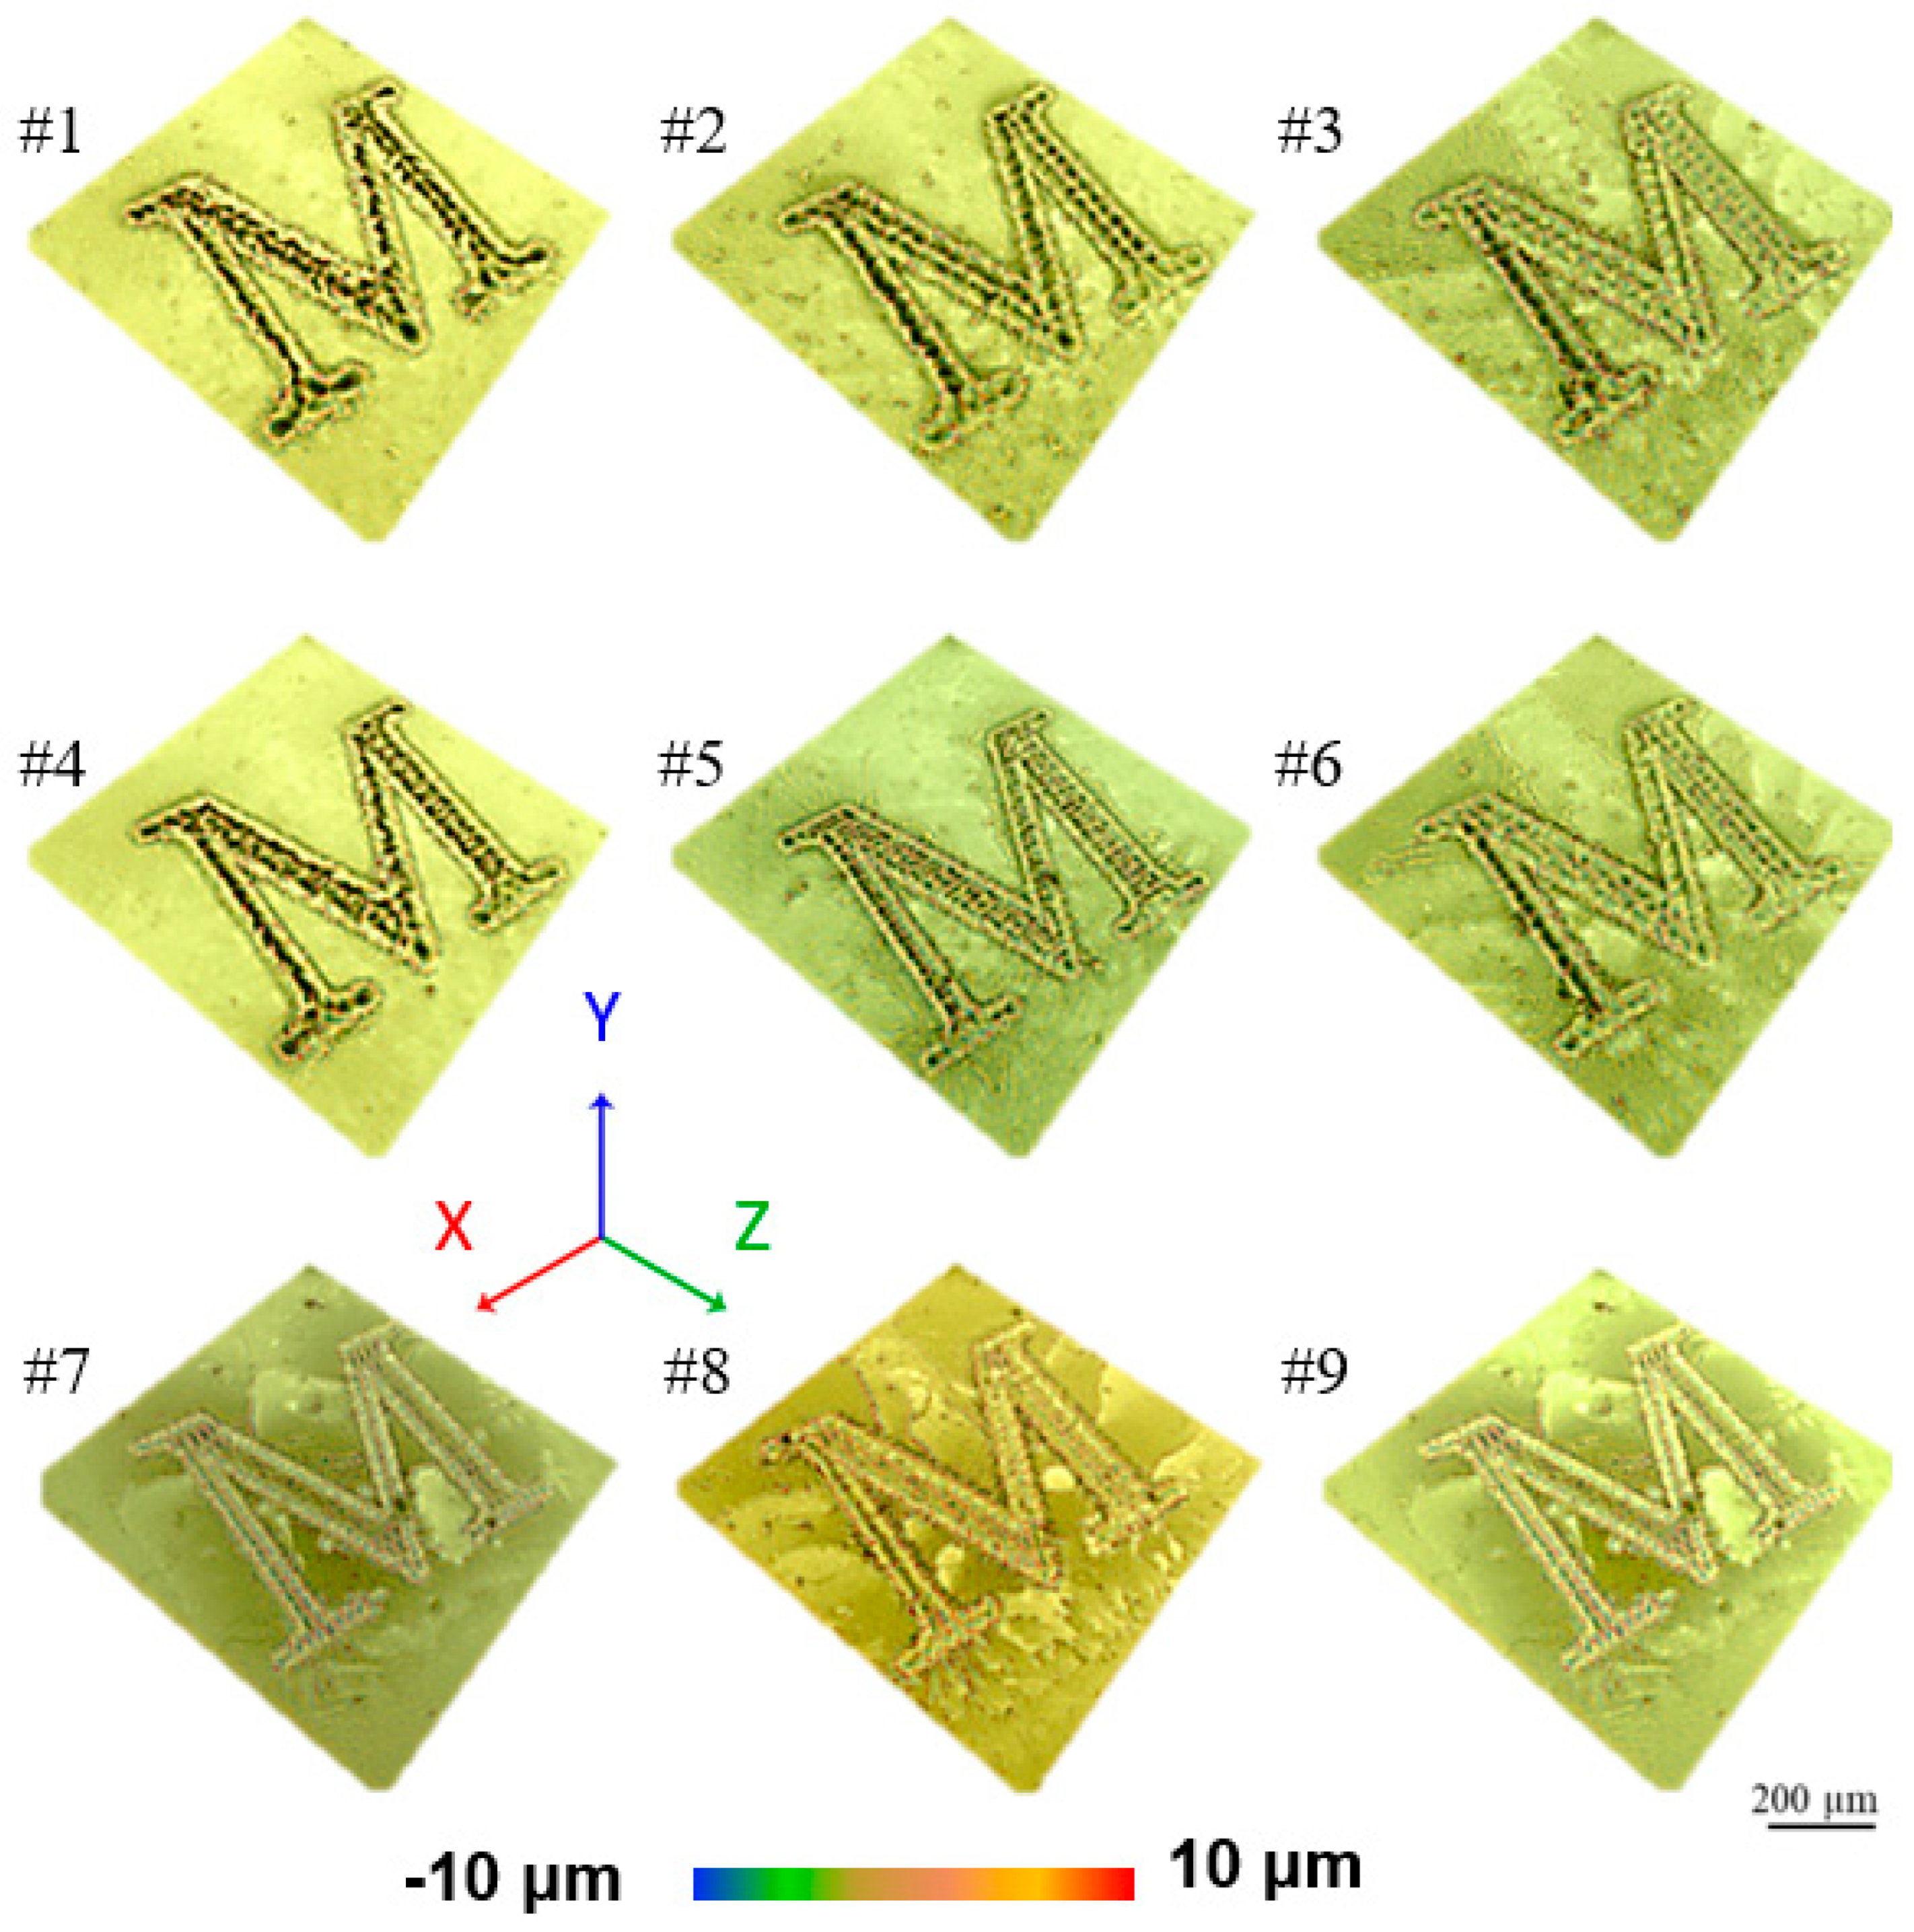
  • This study demonstrated effective control over surface roughness and engraving width through the optimization of short-pulsed fiber laser parameters, specifically laser power and the number of passes. The highest roughness (16.8 µm) and widest engraving width (51 µm) were achieved at 60 W laser power with 15 passes, while the lowest roughness (13.8 µm) and narrowest width (35 µm) were observed at 30 W power with 5 passes.
  • An inverse relationship between surface roughness and wettability was clearly observed. Rougher surfaces (e.g., Sample #1 with a roughness of 16.8 µm) exhibited a contact angle of 86.4°, indicating increased wettability. Conversely, smoother surfaces (e.g., Sample #9 with a roughness of 13.8 µm) displayed a higher contact angle of 92.4°, reflecting reduced wettability.
  • The results emphasize the critical importance of optimizing laser power and the number of passes to achieve targeted surface characteristics. Higher laser power and increased passes led to greater material ablation and enhanced surface texturing, while lower parameters produced smoother textures, which are beneficial for applications requiring lower wettability.
  • The findings of this study offer practical guidelines for the design and optimization of laser-textured surfaces in industrial applications, including manufacturing, biomedical devices, and anti-corrosion coatings. Future research should focus on evaluating the long-term performance of these textured surfaces under real-world operating conditions, particularly in environments requiring high corrosion resistance, enhanced adhesion, or tailored wettability.

Author Contributions

Conceptualization, M.R., M.K., and A.M.; methodology, M.R. and M.K.; software, M.K. and N.C.; validation, M.R., M.K., and G.C.; formal analysis, M.R., M.K., and N.C.; investigation, M.R., M.K., and N.C.; resources, A.M.; data curation, M.R., M.K., and N.C.; writing—original draft preparation, M.R. and M.K.; writing—review and editing, M.R., M.K., N.C., G.C., and A.M.; visualization, M.K. and N.C.; supervision, A.M. and G.C.; project administration, A.M.; funding acquisition, A.M. All authors have read and agreed to the published version of the manuscript.

Funding

This work is part of Maria de Maeztu Units of Excellence Programme CEX2023-001300-M/funded by MCIN/AEI/10.13039/501100011033. Mohammad Rezayat acknowledges the financial support provided via an AGAUR Fellowship [(FI-SDUR-2020)] from the Generalitat de Catalunya.

Institutional Review Board Statement

Not applicable.

Informed Consent Statement

Not applicable.

Data Availability Statement

All data are contained within the article.

Conflicts of Interest

The authors declare no conflicts of interest.

References

  1. Ndeda, R.; Botes, A.; Olakanmi, E.O. Framework for Incorporating Machine Learning (ML) Driven Optimisation into Laser Materials Processing (LMP) Technologies for e-Mobility Applications towards Attaining Zero-Material Waste. Lasers Manuf. Mater. Process. 2024, 11, 77–108. [Google Scholar] [CrossRef]
  2. Karamimoghadam, M.; Rezayat, M.; Moradi, M.; Mateo, A.; Casalino, G. Laser Surface Transformation Hardening for Automotive Metals: Recent Progress. Metals 2024, 14, 339. [Google Scholar] [CrossRef]
  3. Pani, R.; Roy, S.; Behera, R.R.; Chakraborty, S.; Das, D.; Mahanta, K. Laser texturing for biomedical application: A state of art. In AIP Conference Proceedings, Proceedings of the14th International Conference on Materials Processing and Characterization 2023, Hyderabad, India, 24–26 March 2023; AIP Publishing: Melville, NY, USA, 2024; Volume 3007. [Google Scholar]
  4. Wang, J.; Xia, J.; Liu, Z.; Xu, L.; Liu, J.; Xiao, Y.; Gao, J.; Ru, H.; Jiao, J. A comprehensive review of metal laser hardening: Mechanism, process, and applications. Int. J. Adv. Manuf. Technol. 2024, 134, 5087–5115. [Google Scholar] [CrossRef]
  5. Tong, W.; Xiong, D. Direct laser texturing technique for metal surfaces to achieve super hydrophobicity. Mater. Today Phys. 2022, 23, 100651. [Google Scholar] [CrossRef]
  6. Zhang, L.; Tan, Z.; Zhang, C.; Tang, J.; Yao, C.; You, X.; Hao, B. Research on metal corrosion resistant bioinspired special wetting surface based on laser texturing technology: A Review. Micromachines 2022, 13, 1431. [Google Scholar] [CrossRef]
  7. Vlãdescu, S.C.; Tadokoro, C.; Miyazaki, M.; Reddyhoff, T.; Nagamine, T.; Nakano, K.; Sasaki, S.; Tsujii, Y. Exploiting the synergy between concentrated polymer brushes and laser surface texturing to achieve durable superlubricity. ACS Appl. Mater. Interfaces 2022, 14, 15818–15829. [Google Scholar] [CrossRef]
  8. Soltani-Kordshuli, F.; Miller, C.; Harris, N.; Zou, M. Laser surface texturing of both thin polytetrafluoroethylene coatings and stainless steel substrates for improving tribological properties. Polym. Test. 2023, 117, 107852. [Google Scholar] [CrossRef]
  9. Lei, P.; Zhang, P.; Song, S.; Liu, Z.; Yan, H.; Sun, T.; Lu, Q.; Chen, Y.; Gromov, V.; Shi, H. Research status of laser surface texturing on tribological and wetting properties of materials: A review. Optik 2023, 298, 171581. [Google Scholar] [CrossRef]
  10. Nsilani Kouediatouka, A.; Ma, Q.; Liu, Q.; Mawignon, F.J.; Rafique, F.; Dong, G. Design methodology and application of surface texture: A review. Coatings 2022, 12, 1015. [Google Scholar] [CrossRef]
  11. Rezayat, M.; Karamimoghadam, M.; Moradi, M.; Casalino, G.; Roa Rovira, J.J.; Mateo, A. Overview of Surface Modification Strategies for Improving the Properties of Metastable Austenitic Stainless Steels. Metals 2023, 13, 1268. [Google Scholar] [CrossRef]
  12. Butkus, S.; Jukna, V.; Kažukauskas, E.; Svirksas, Ž.; Paipulas, D.; Sirutkaitis, V. High-Contrast Marking of Stainless-Steel Using Bursts of Femtosecond Laser Pulses. Micromachines 2023, 14, 194. [Google Scholar] [CrossRef] [PubMed]
  13. Schkutow, A.; Frick, T. Laser Color Marking of Stainless Steel—Investigation of the Fluence-Dependent and Thermal Mechanisms in Generating Laser Induced Surface Modifications. Procedia CIRP 2024, 124, 661–664. [Google Scholar] [CrossRef]
  14. Pandey, M.; Doloi, B. Analysis on Fiber Laser Marking Characteristics of Elliptical Shaped Geometry Marked on SS 304. Adv. Mater. Process. Technol. 2024, 1–18. [Google Scholar] [CrossRef]
  15. Dong, J.; Liu, Y.; Pacella, M. Surface Texturing and Wettability Modification by Nanosecond Pulse Laser Ablation of Stainless Steels. Coatings 2024, 14, 467. [Google Scholar] [CrossRef]
  16. Soria-Biurrun, T.; Dorronsoro-Larbide, A.; Navarrete-Cuadrado, J.; Lozada-Cabezas, L.; Pan-Cabo, A.; Castaño-Carmona, E.; Alkorta, J.; Sánchez-Moreno, J.M. Surface texturing, residual stresses and edge treatment of hardmetal tools by means of femtosecond pulsed laser. Int. J. Refract. Met. Hard Mater. 2024, 118, 106442. [Google Scholar] [CrossRef]
  17. Narayanan, V.; Singh, R.; Marla, D. A 3D computational model of nanosecond pulsed laser texturing of metals for designing engineered surfaces. J. Manuf. Sci. Eng. 2024, 146, 1–12. [Google Scholar] [CrossRef]
  18. Velayuthaperumal, S.; Radhakrishnan, R. A novel nanosecond pulsed laser textured moat configurations for enhancing surface wettability, corrosion and tribology behaviour of Ti6Al4V implant material. Mater. Today Commun. 2024, 39, 108701. [Google Scholar] [CrossRef]
  19. Shi, Z.; Duan, X.; Chen, Z.; Liu, B.; Fu, H.; Ji, J.; Zhang, Y. Precision fabrication of micro-textures array for surface functionalization using picosecond pulse laser. Opt. Laser Technol. 2024, 177, 111200. [Google Scholar] [CrossRef]
  20. Tang, Y.; Fang, Z.; Fei, Y.; Wang, S.; Perrie, W.; Edwardson, S.; Dearden, G. Wettability Behaviour of Metal Surfaces after Sequential Nanosecond and Picosecond Laser Texturing. Micromachines 2024, 15, 1146. [Google Scholar] [CrossRef]
  21. Rezayat, M.; Morales, M.; Moradi, M.; Mateo, A. Laser wobbling surface texturing of AISI 301LN steel for enhancement of the corrosion resistance at high temperature. Opt. Laser Technol. 2024, 171, 110375. [Google Scholar] [CrossRef]
  22. Zawadzki, P.; Dobrotvorskiy, S.; Aleksenko, B.A.; Basova, Y.; Trubin, D.; Prykhodko, V.; Kościński, M. Features of Modification of the Roughness and Hardness of the Surface of AISI 321 Stainless Steel with Short-Pulse Laser Radiation. In Proceedings of the International Conference on Reliable Systems Engineering, Bucharest, Romania, 5–6 September 2024; Springer Nature: Cham, Switzerland, 2024; pp. 51–60. [Google Scholar]
  23. Lubig, K.; Wonneberger, R.; Picker, J.; Undisz, A.; Turchanin, A.; Müller, F.A.; Gräf, S. Ageing of commercial austenitic, martensitic and duplex stainless steel surfaces after formation of laser-induced periodic surface structures by fs-laser irradiation. Appl. Surf. Sci. 2025, 679, 161156. [Google Scholar] [CrossRef]
  24. Ralls, A.M.; Menezes, P.L. Realizing the tribological feasibility of novel laser surface texturing techniques for cold spray kinetically metallized stainless steel. Int. J. Adv. Manuf. Technol. 2024, 133, 3529–3547. [Google Scholar] [CrossRef]
  25. Cai, Y.; Luo, Y.; Zhang, F.; Peng, Y.; Yang, S.; Tang, F. Effect of pulsed laser energy on grain morphology and texture characteristics of stainless steel fabricated by laser-PTA additive manufacturing. Opt. Laser Technol. 2023, 158, 108799. [Google Scholar] [CrossRef]
  26. Zhao, K.; Pan, J.; Chen, X. Texture morphologies and residual stresses due to laser surface texturing on the 304 stainless steel. Appl. Therm. Eng. 2024, 255, 123951. [Google Scholar] [CrossRef]
  27. Lekube, B.M.; Badiola, J.H.; Larreategi, P.; Ares, F.; Chiminelli, A.; Valero, C.; Ozgur, T. Metal-composite hybrid joint adhesion and testing optimization for electric vehicle applications. J. Adhes. 2023, 101, 91–114. [Google Scholar] [CrossRef]
  28. Grigoriev, S.N.; Volosova, M.A.; Okunkova, A.A. Advances in Laser Materials Processing. Metals 2022, 12, 917. [Google Scholar] [CrossRef]
  29. Rezayat, M.; Karamimoghadam, M.; Dezaki, M.L.; Zolfagharian, A.; Casalino, G.; Mateo, A.; Bodaghi, M. Enhancing Corrosion Resistance and Mechanical Strength of 3D-Printed Iron Polylactic Acid for Marine Applications via Laser Surface Texturing. Adv Eng Mater 2024. [Google Scholar] [CrossRef]
  30. Rezayat, M.; Morales, M.; Zahrani, E.G.; Moradi, M.; Azarhoushang, B.; Mateo, A. Effect of Repetition Passes in the Laser Surface Texturing of AISI 301LN Steel on the Anticorrosion Properties in Molten Carbonate Salts. Materialia 2025, 39, 102365. [Google Scholar] [CrossRef]
  31. Ralston, J. Solid–Liquid Interactions and Functional Surface Wettability. Aust. J. Chem. 2005, 58, 644–654. [Google Scholar] [CrossRef]
  32. Mo, J.; Sha, J.; Li, D.; Li, Z.; Chen, Y. Fluid release pressure for nanochannels: The Young–Laplace equation using the effective contact angle. Nanoscale 2019, 11, 8408–8415. [Google Scholar] [CrossRef]
  33. Yuan, Y.; Lee, T.R. Contact angle and wetting properties. In Surface Science Techniques; Springer: Berlin/Heidelberg, Germany, 2013; pp. 3–34. [Google Scholar]
  34. Morales, M.; Rezayat, M.; Mateo, A. Enhancing the Corrosion Resistance of 2205 Duplex Stainless Steel in Molten Carbonate Salts by Laser-Surface Texturing. J. Energy Storage 2024, 78, 110053. [Google Scholar] [CrossRef]
  35. Rezayat, M.; Morales, M.; Moradi, M.; Mateo, A. Influence of Laser Heat Input on the Corrosion Mitigation of Laser Textured AISI 301LN Steel in Molten Carbonate Salts. Opt. Laser Technol. 2025, 186, 112692. [Google Scholar] [CrossRef]
Figure 1. A schematic of the laser marking process and output responses, showing (a) the laser marking process setup, (b) the average width calculation, and (c) the wettability angles.
Metals 15 00519 g001
Figure 2. Optical microscopy of laser marking on AISI 301LN stainless steel, showing surface features influenced by varying laser power and number of passes.
Metals 15 00519 g002
Figure 3. (a) Perturbation plot of roughness; (b) predicted vs. actual plot deviation; (c) response surface plot; (d) contour plot.
Metals 15 00519 g003
Figure 4. SEM images of laser marking on AISI 301LN stainless steel, showing surface morphology resulting from varying laser power and number of passes.
Metals 15 00519 g004
Figure 5. Linear roughness measurements for nine different samples of laser marking on AISI 301LN stainless steel.
Metals 15 00519 g005
Figure 6. Three-dimensional reconstructions of Samples #1 to #9, illustrating surface topography changes with varying laser power and number of passes.
Metals 15 00519 g006
Figure 7. (a) Perturbation plot of average width; (b) predicted vs. actual plot deviation; (c) response surface plot; (d) contour plot.
Metals 15 00519 g007
Figure 8. (a) SEM images showing the laser marking direction; (b) a magnified view of the laser track; and (c) the overlap calculations.
Metals 15 00519 g008
Figure 9. (a) Perturbation plot of wettability; (b) predicted vs. actual plot deviation of wettability; (c) response surface plot of wettability; (d) contour plot of wettability.
Metals 15 00519 g009
Figure 10. Column bar of wettability for Samples #1 to #9, showing variations in contact angles influenced by different laser power and number of passes.
Metals 15 00519 g010
Table 1. Level of variable parameters of design of experiment.
VariableUnitLevel
−101
Laser PowerW304560
Laser Pass#51015
Table 2. Configuration of experiments for laser processing and output responses. (± indicates the standard deviation of the measurements, the symbol ‘#’ is used to denote the number of repetitions).
Sample No.Input ParametersResponse
Laser Power (W)Laser Pass
(#)
Roughness Sa
(µm)
Average Width
(µm)
Wettability Contact Angle, (°)
#1601516.8 ± 1.8 5186.4 ± 0.9
#2601015.3 ± 1.74589.4 ± 0.9
#360514.9 ± 1.64290.2 ± 0.9
#4451515.8 ± 1.74888.4 ± 0.9
#5451014.9 ± 1.64190.2 ± 0.9
#645514.1 ± 1.53691.8 ± 1.0
#7301515.2 ± 1.74489.6 ± 0.9
#8301014.2 ± 1.63791.6 ± 1.0
#930513.8 ± 1.53592.4 ± 1.0
Table 3. Chemical composition of AISI 301LN stainless steel (wt.%).
ElementsFeMoCrMnNCNiSi
%Bal.0.0417.61.130.170.026.500.42
Table 4. ANOVA of roughness.
Source ModelSum of SquaresDfMean SquareF-Valuep-Value
6.8451.3749.010.0045significant
A-Laser Power2.4112.4186.270.0026
B-Laser Pass3.9613.96141.960.0013
AB0.063010.06302.260.2300
A20.186710.18676.690.0813
B20.180010.18006.450.0847
Residual0.083730.0279
Cor Total6.928
Adjusted R2 = 96.77%R2 = 98.79%
Table 5. ANOVA of average of width.
SourceSum of SquaresDfMean SquareF-Valuep-Value
Model237.22547.4438.780.0063significant
A-Laser Power80.67180.6765.930.0039
B-Laser Pass146.321146.32119.590.0016
AB0.107110.10710.08760.7866
A26.8816.885.620.0984
B25.5615.564.540.1229
Residual3.6731.22
Cor Total240.898
Adjusted R2 = 95.94%R2 = 98.48%
Table 6. ANOVA of wettability after laser marking process.
SourceSum of SquaresDfMean SquareF-Valuep-Value
Model27.2646.8265.430.0007significant
A-Laser Power9.6319.6392.420.0007
B-Laser Pass16.67116.67160.000.0002
AB0.250010.25002.400.1963
B20.720010.72006.910.0582
Residual0.416740.1042
Cor Total27.688
Adjusted R2 = 96.99%R2 = 98.49%
Disclaimer/Publisher’s Note: The statements, opinions and data contained in all publications are solely those of the individual author(s) and contributor(s) and not of MDPI and/or the editor(s). MDPI and/or the editor(s) disclaim responsibility for any injury to people or property resulting from any ideas, methods, instructions or products referred to in the content.

