
Machine Learning-Enabled Prediction and Mechanistic Analysis of Compressive Yield Strength–Hardness Correlation in High-Entropy Alloys


Abstract
1. Introduction
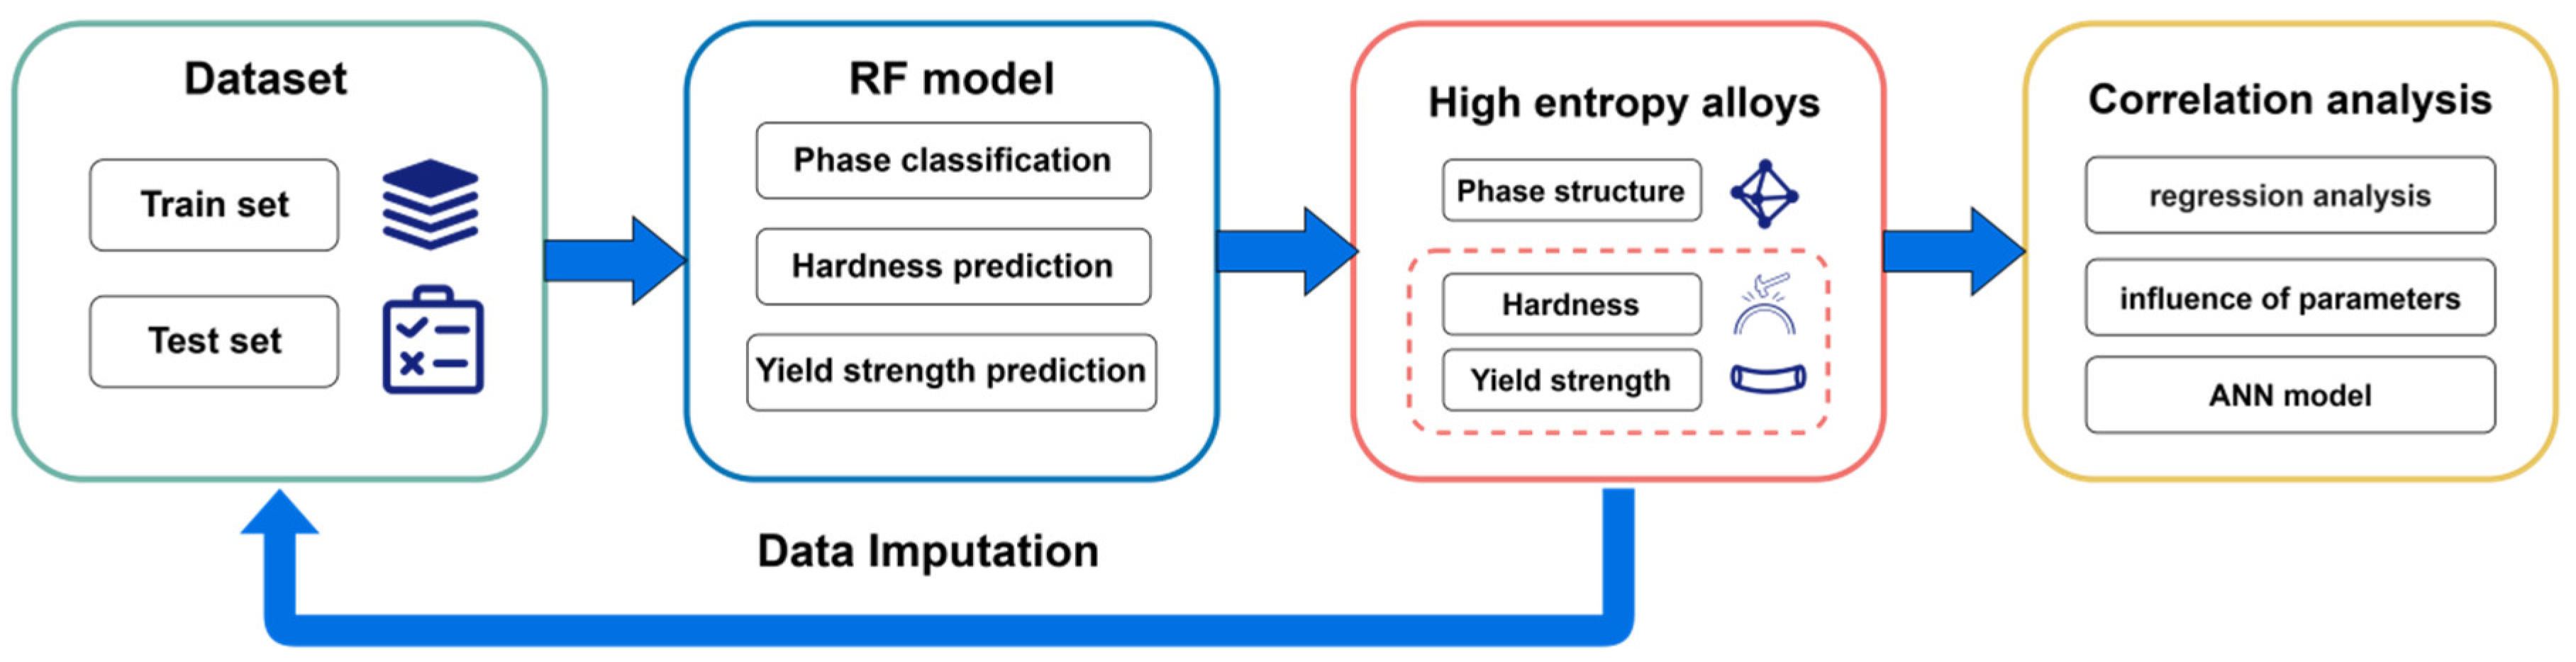
2. Methods
2.1. Dataset Construction and Description
2.2. Selection and Optimization of Input Features
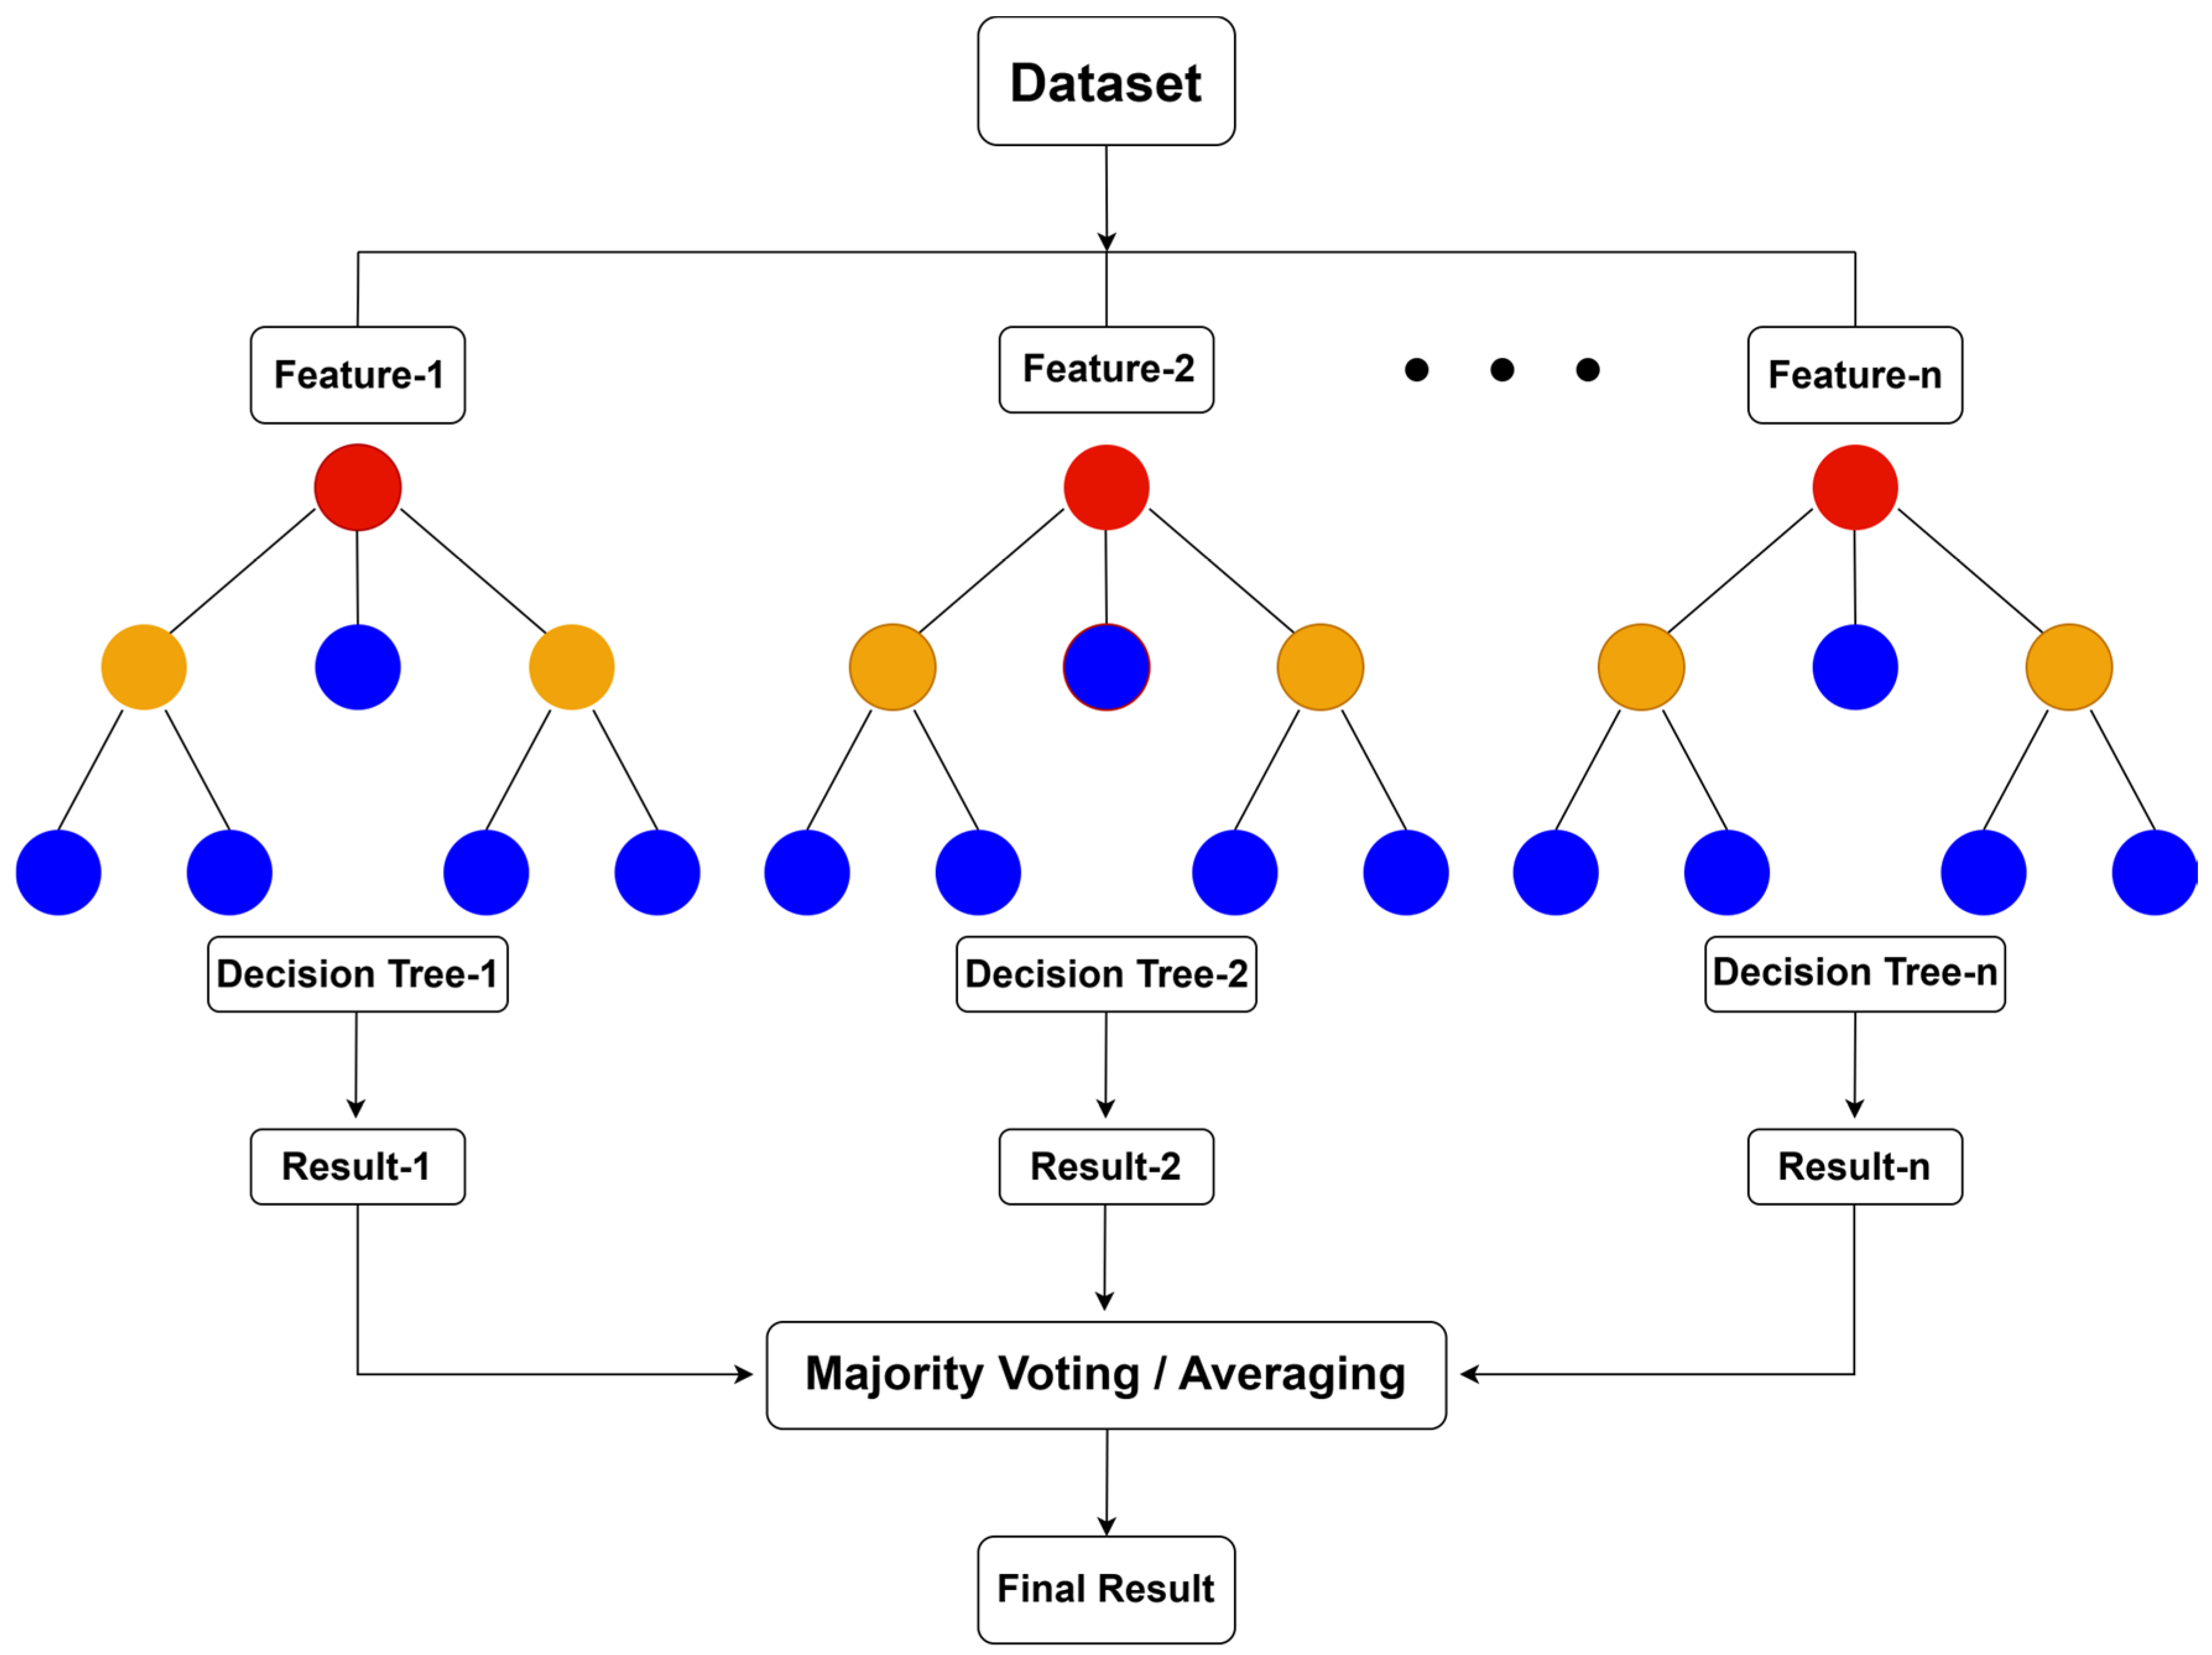
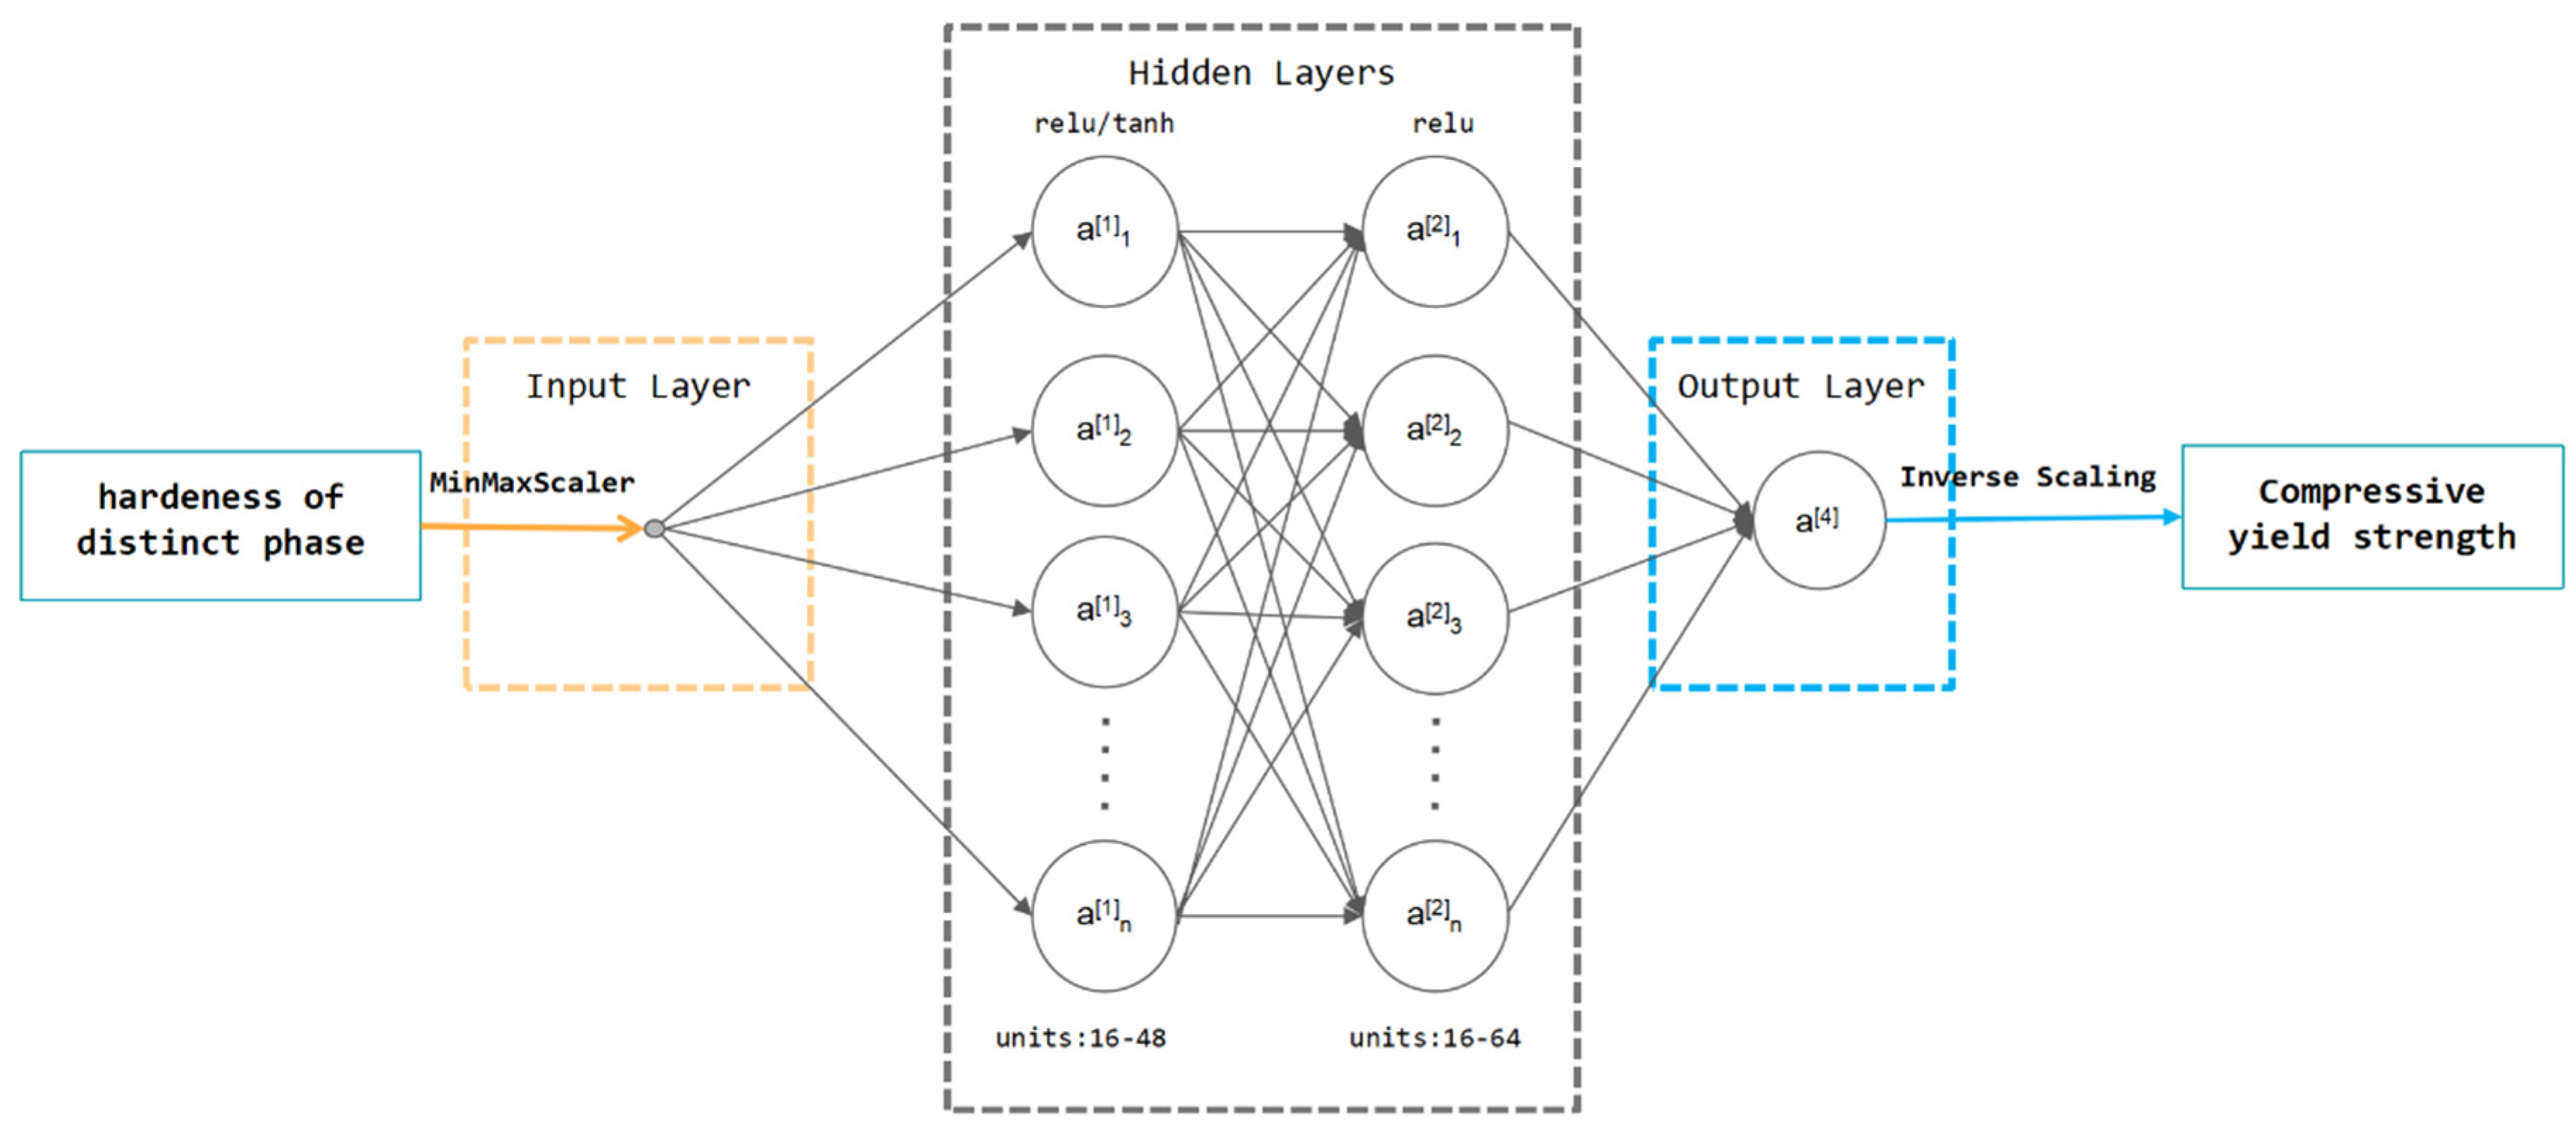
2.3. Machine Learning Model
- n_estimators: The number of decision trees in the forest.
- max_depth: This controls the maximum level allowed for each individual tree to prevent overfitting.
- min_samples_split: This meets the minimum number of samples required to split an internal node, influencing tree growth.
- min_samples_leaf: This defines the minimum number of samples required to be present at a leaf node, influencing generalization.
- max_features: This determines the number or fraction of input features considered when looking for the best split at each node, introducing diversity among the trees.
- bootstrap: This indicates whether samples are drawn with replacement.
3. Results and Discussion
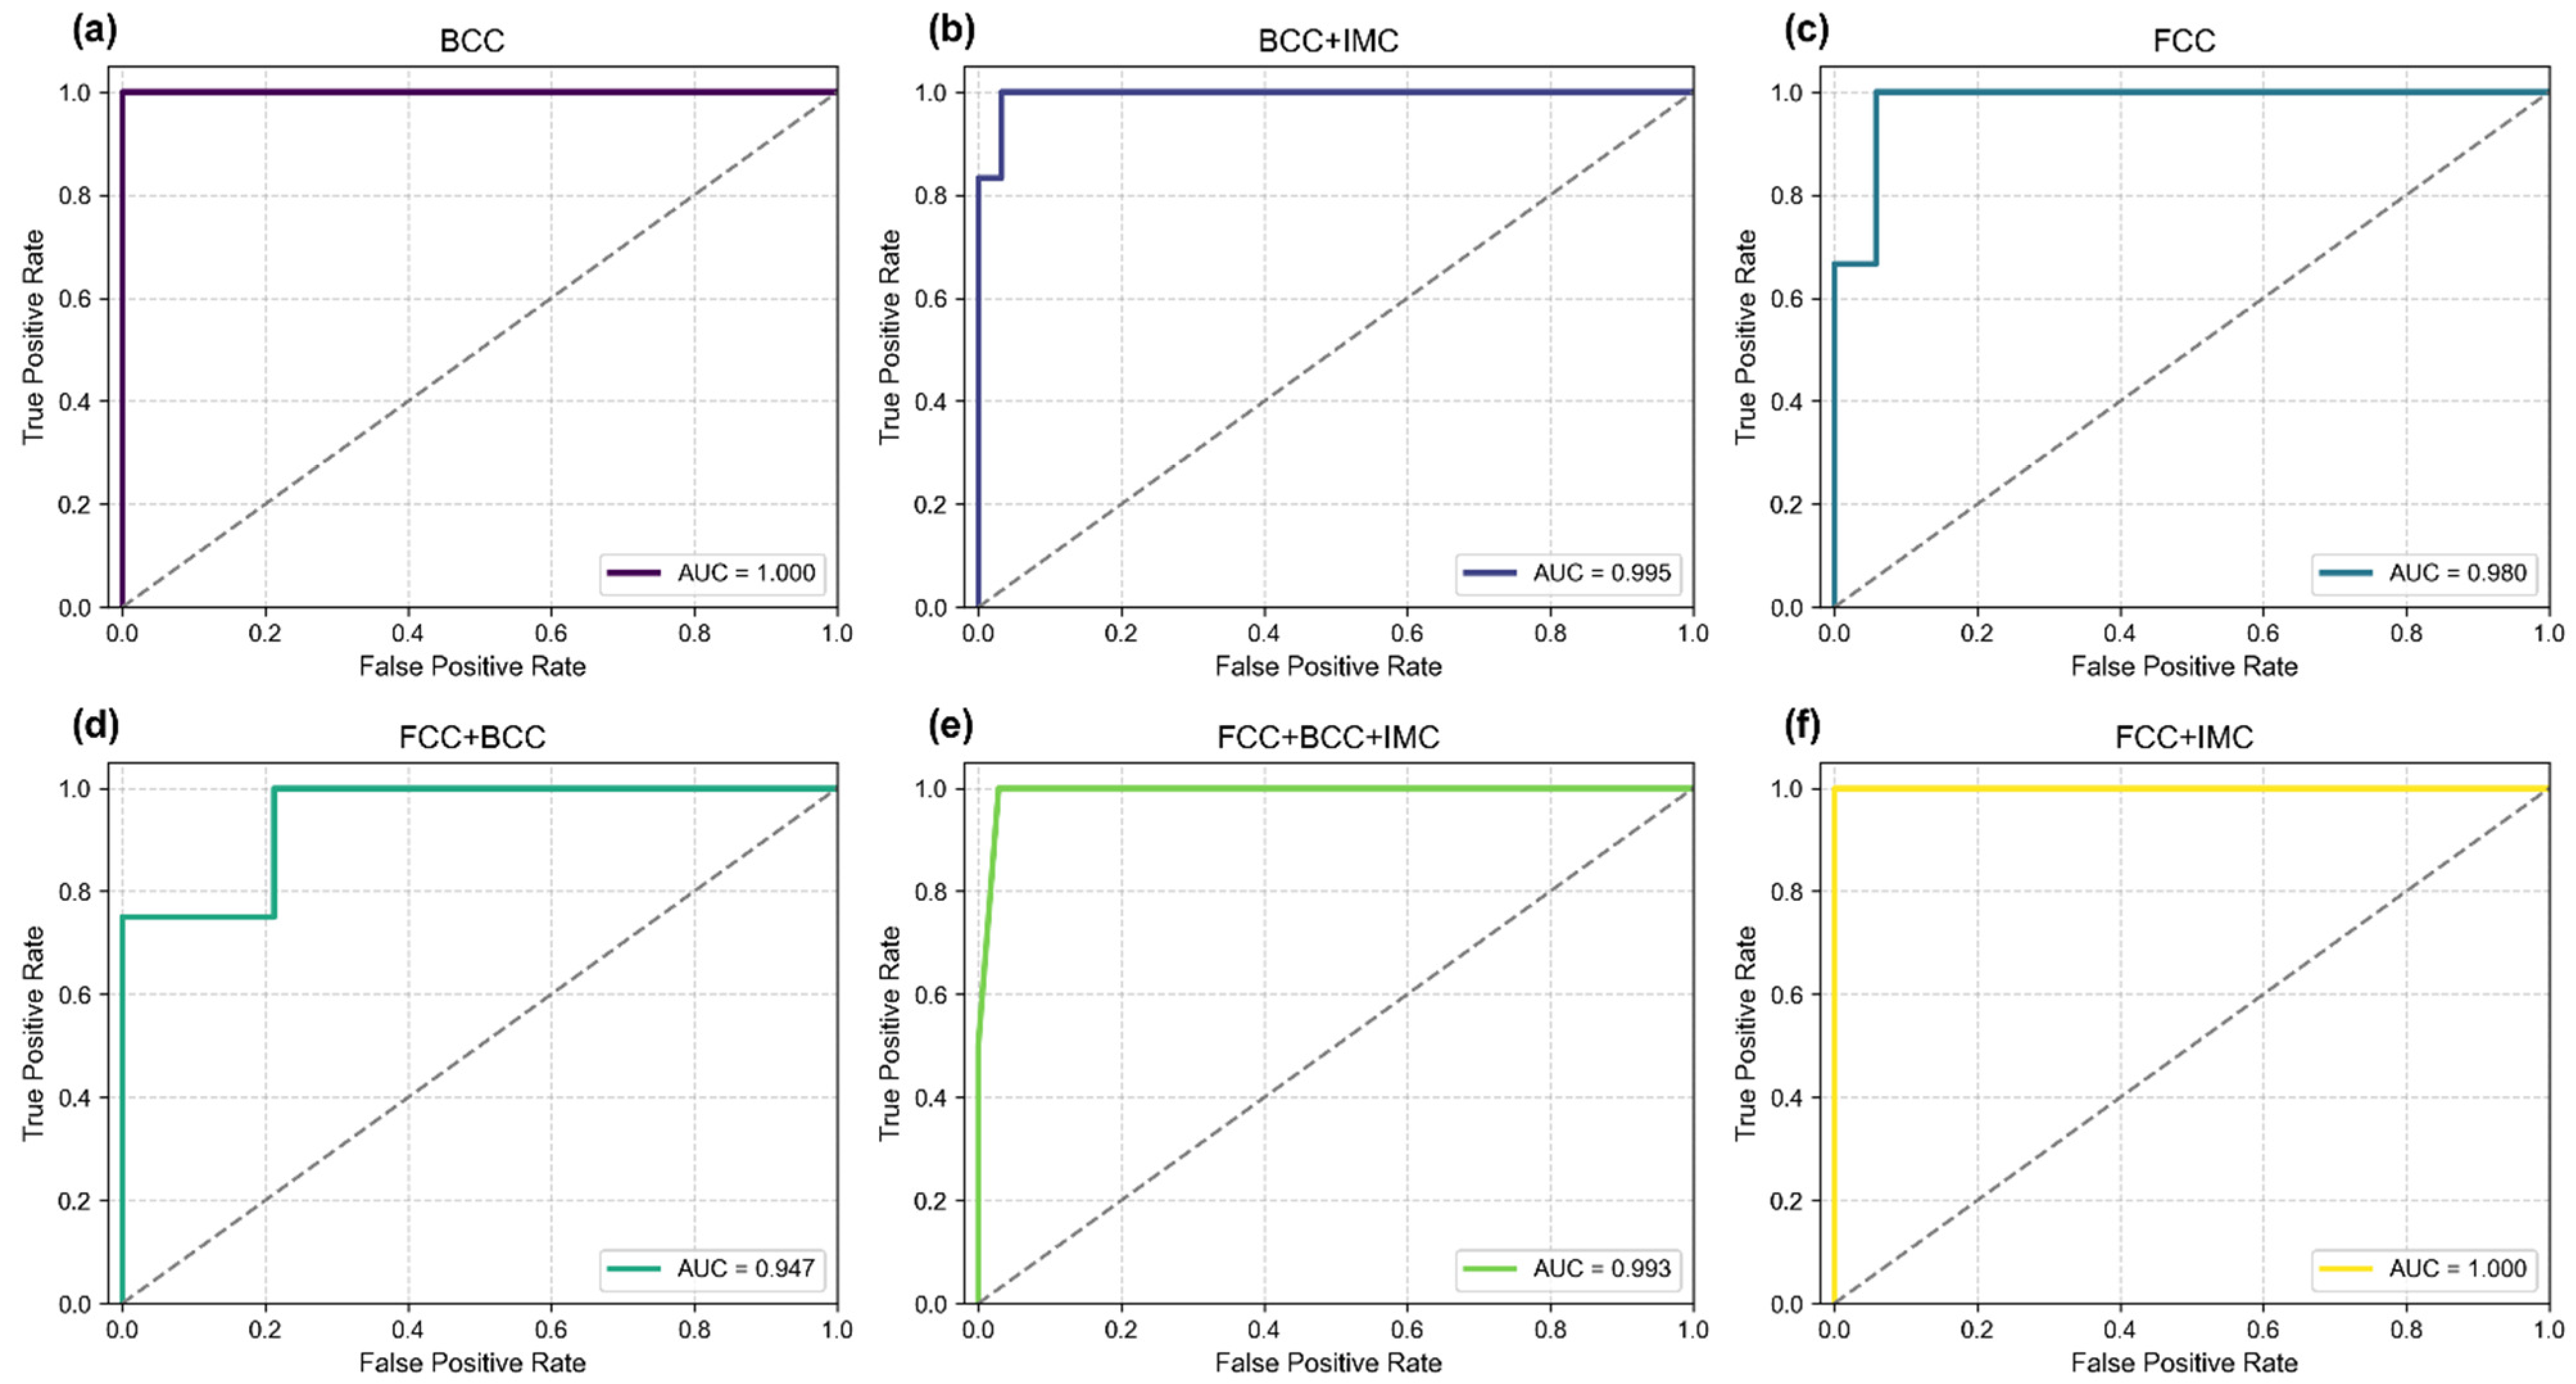
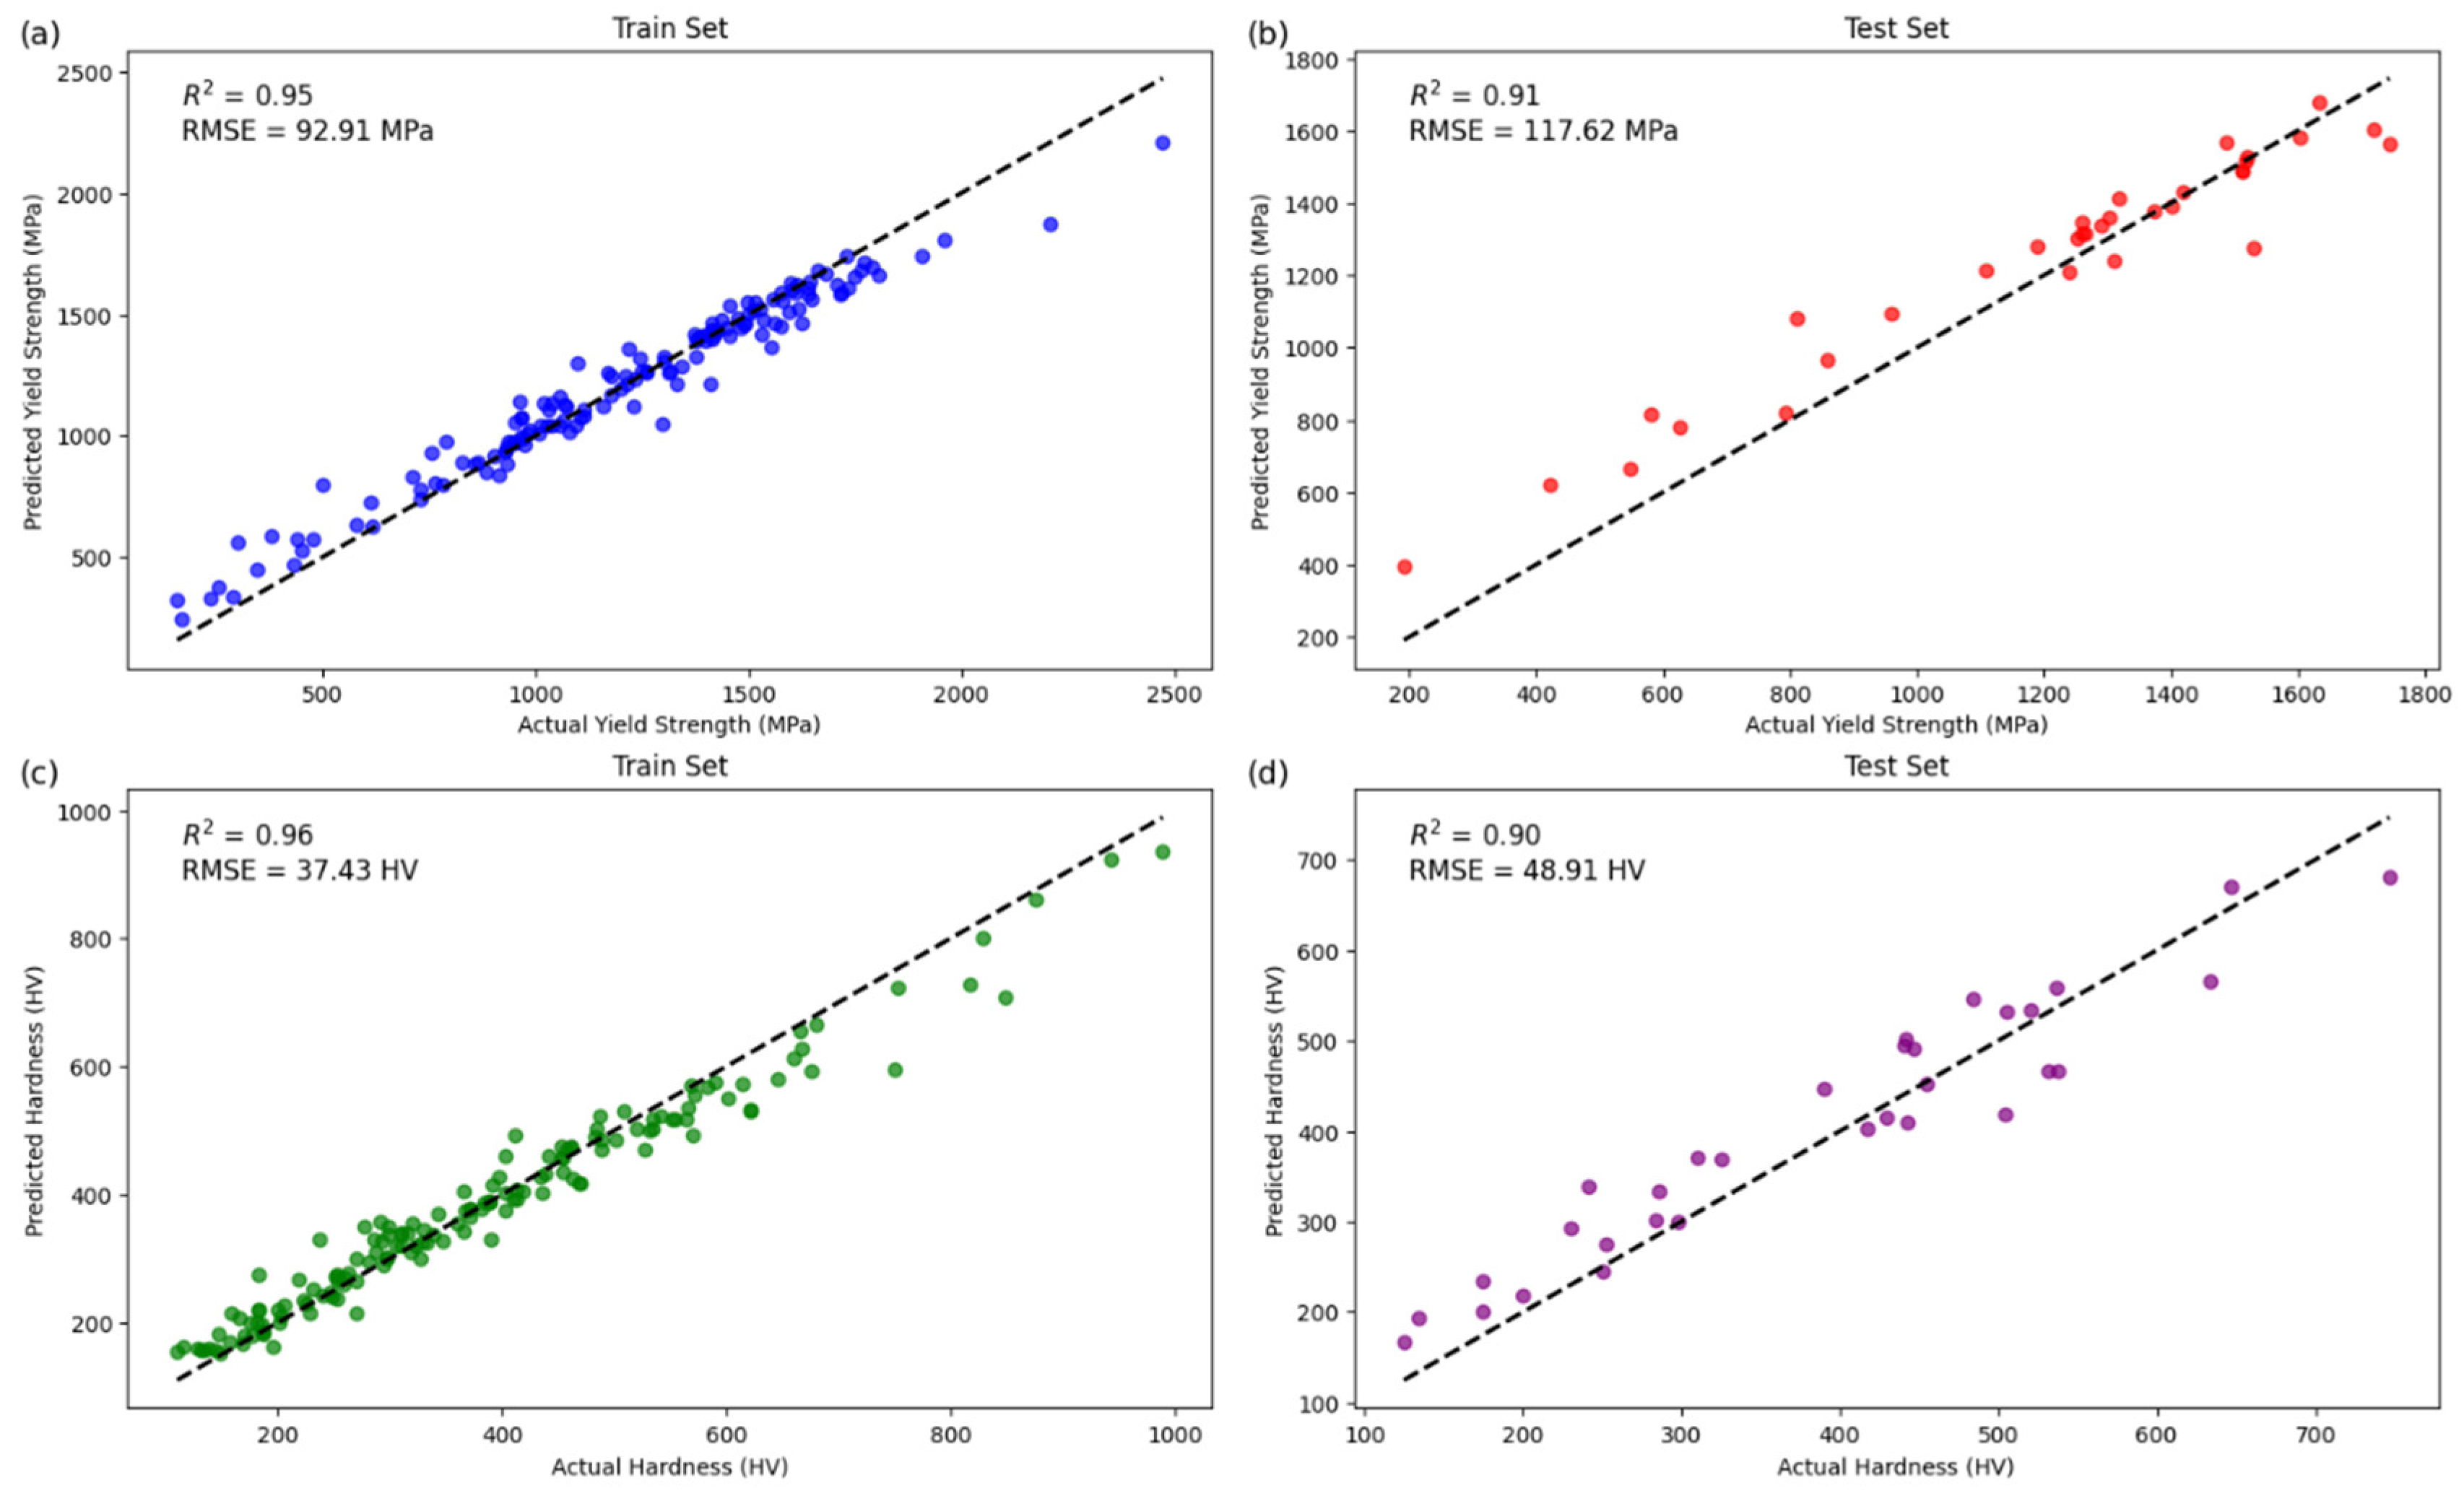
3.1. Robustness and Accuracy of Predictive Models
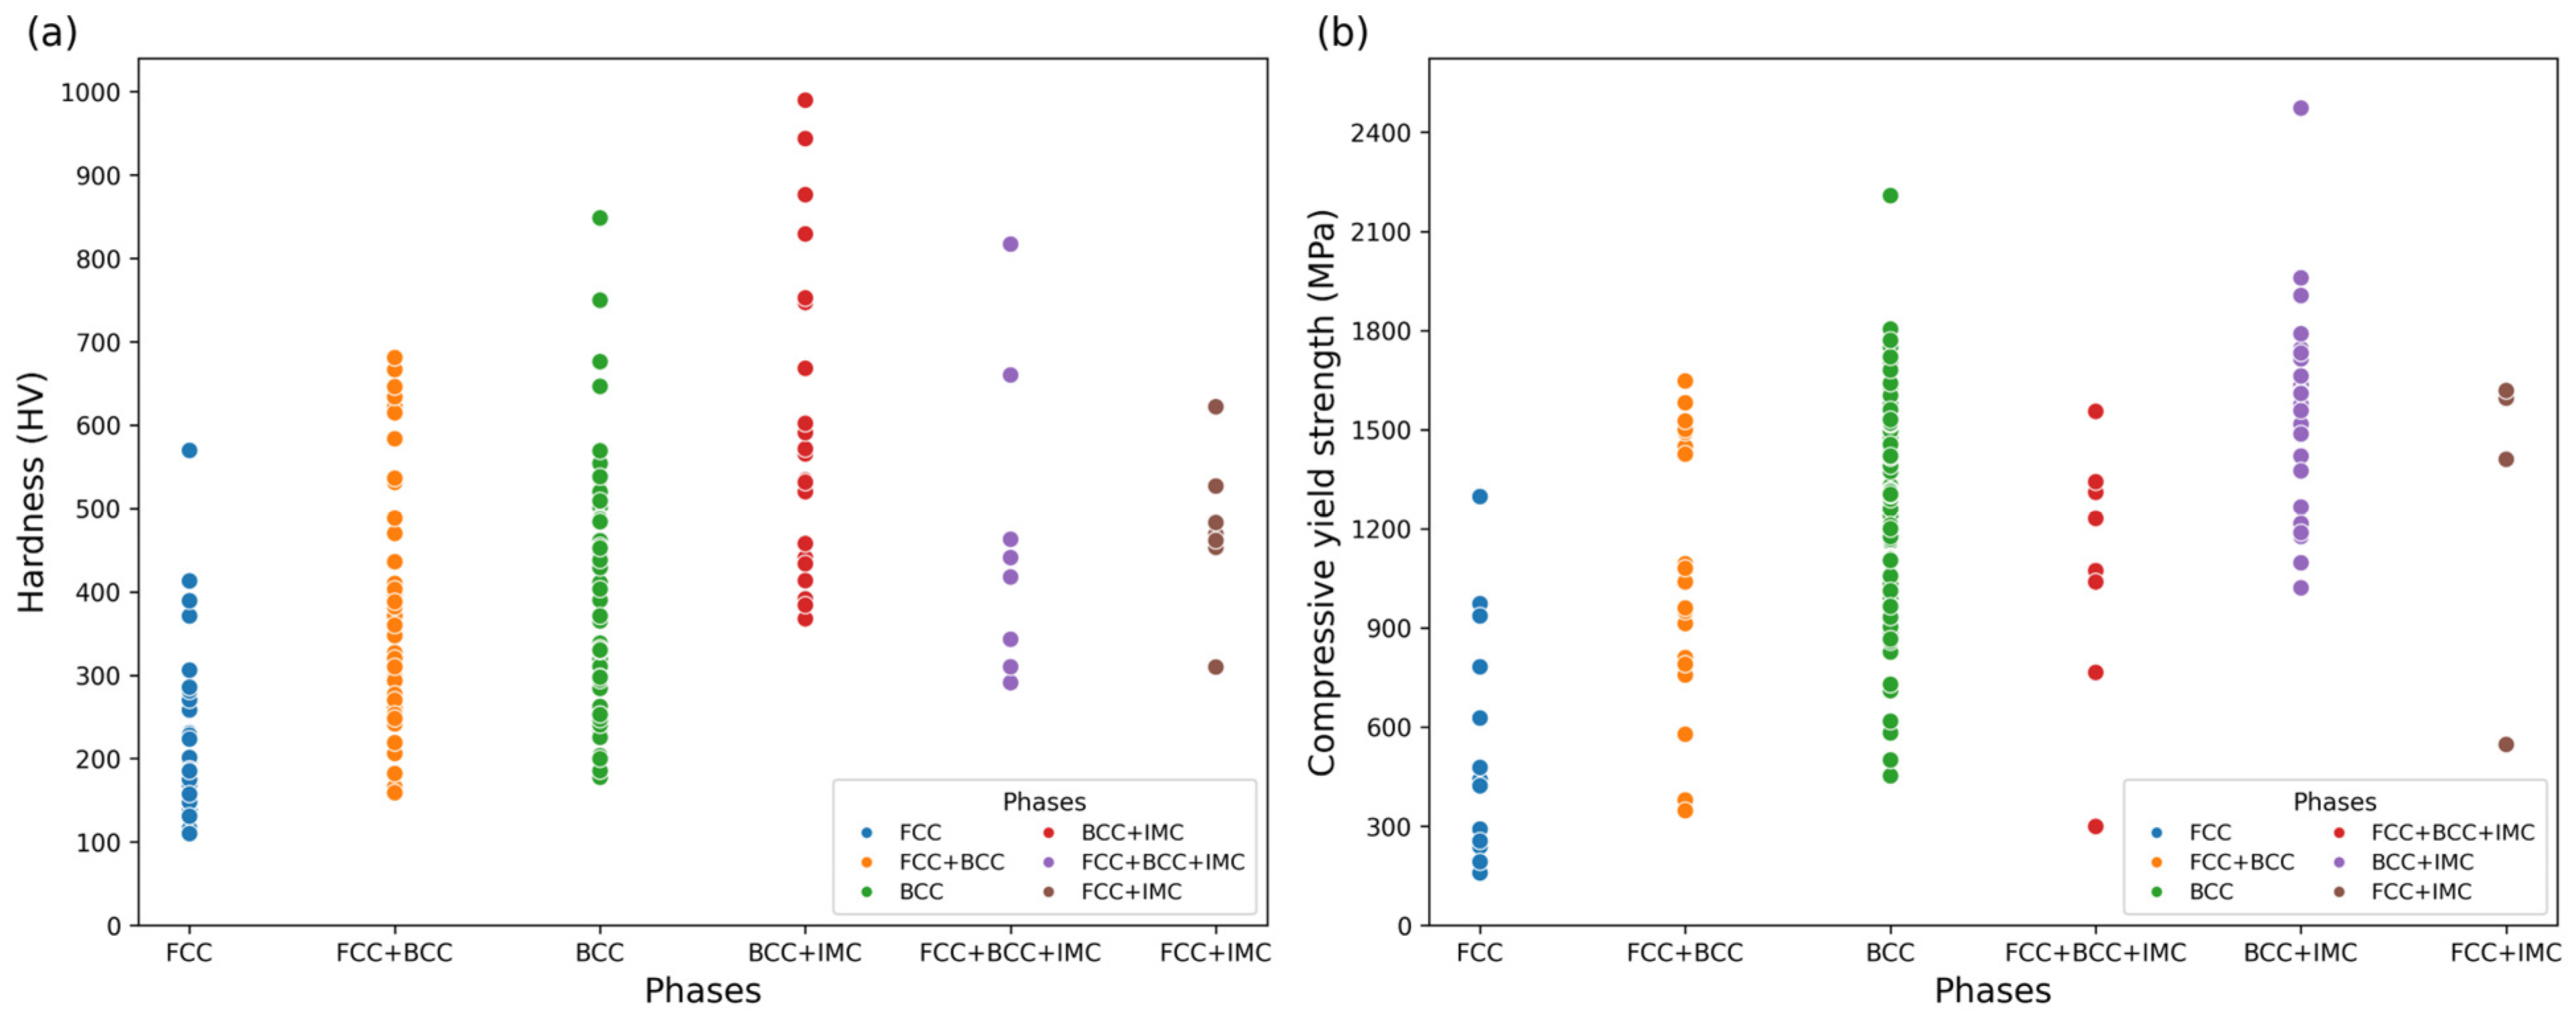
3.2. Analysis of Yield Strength and Hardness Predictions
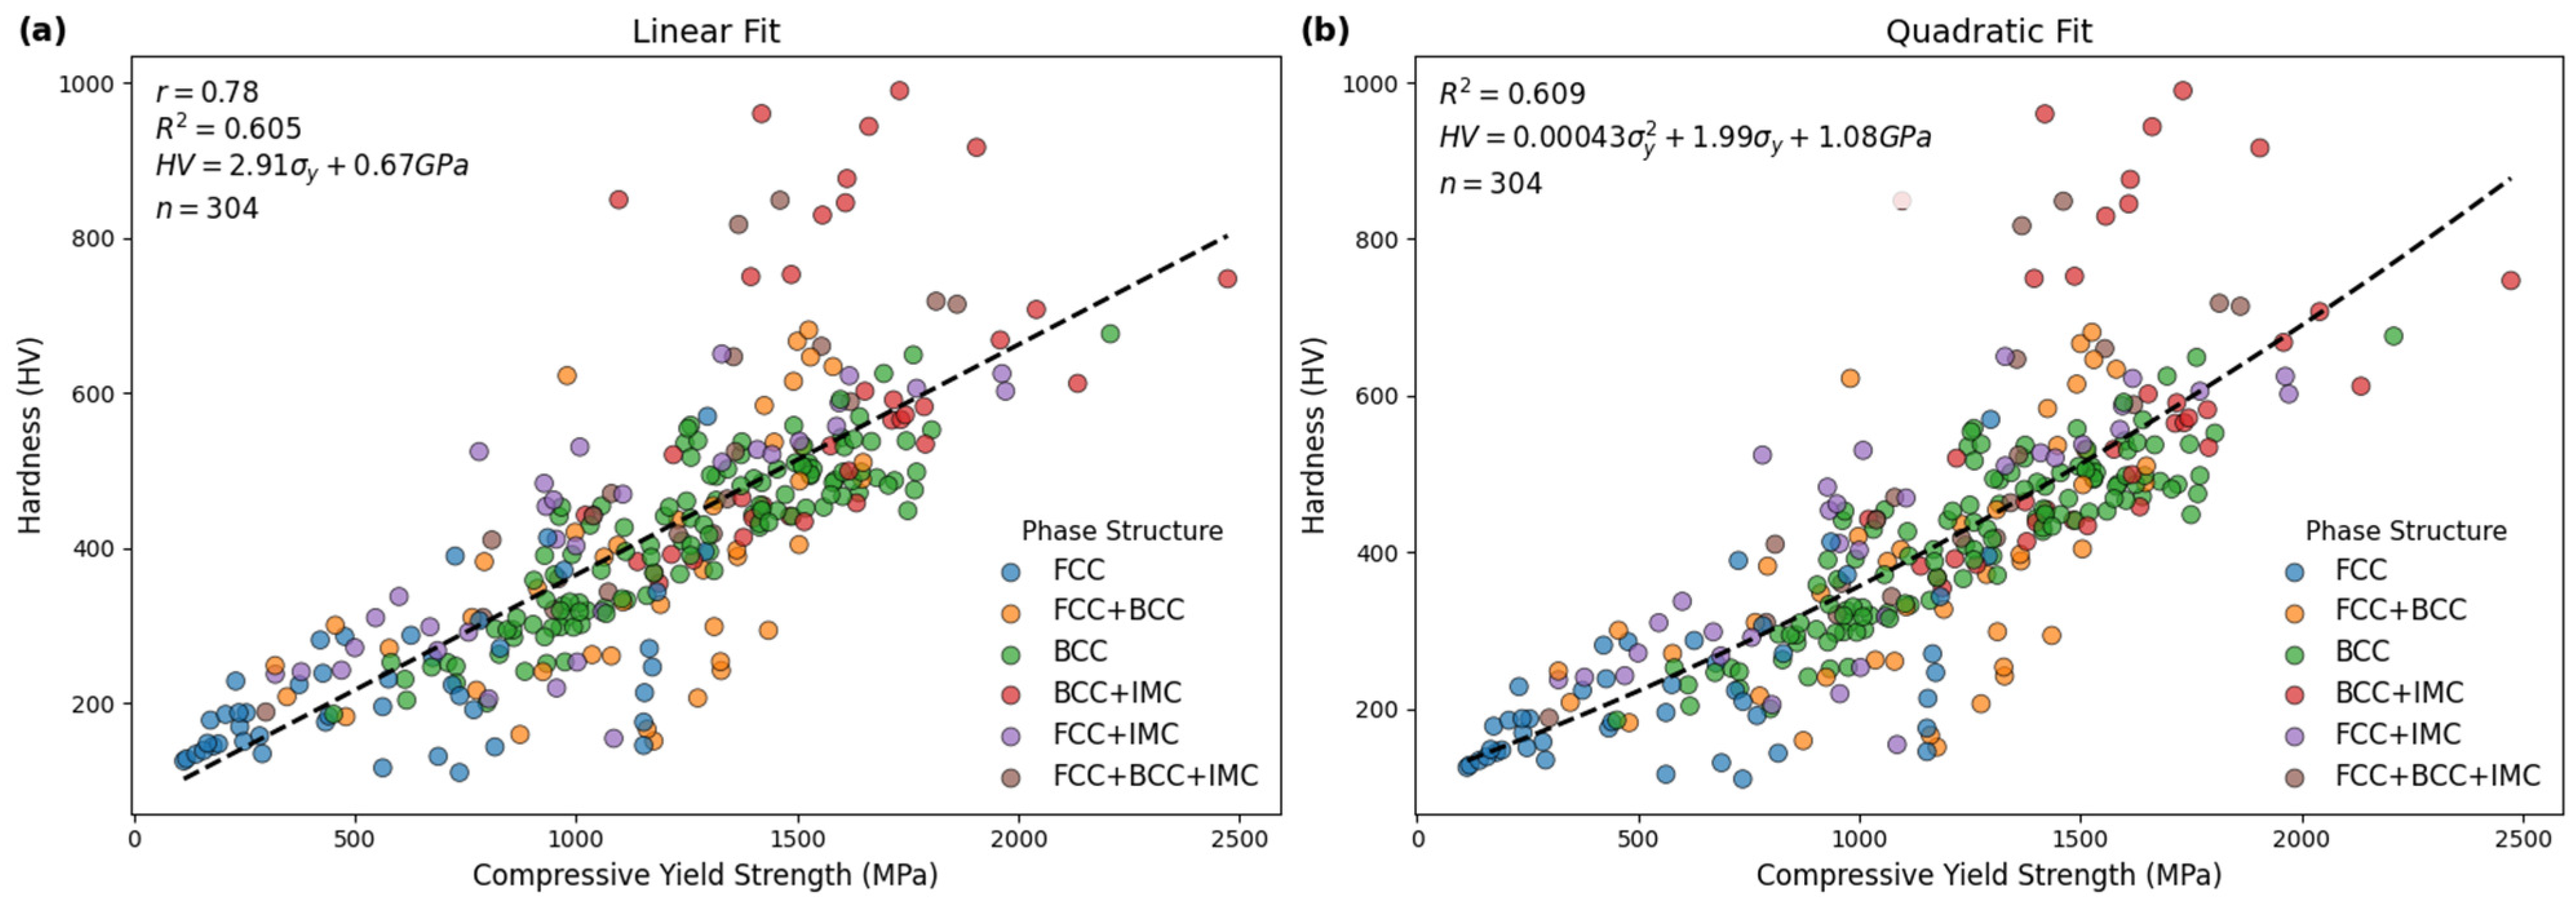
3.3. Underlying Mechanisms of Yield Strength–Hardness Correlation
4. Conclusions
- The ML models demonstrate strong predictive capabilities. The phase structure classification model achieves an accuracy of 0.92. The regression models achieve test R2 of 0.90 and 0.91 for yield strength and hardness, respectively, indicating reliable predictions of these key mechanical properties.
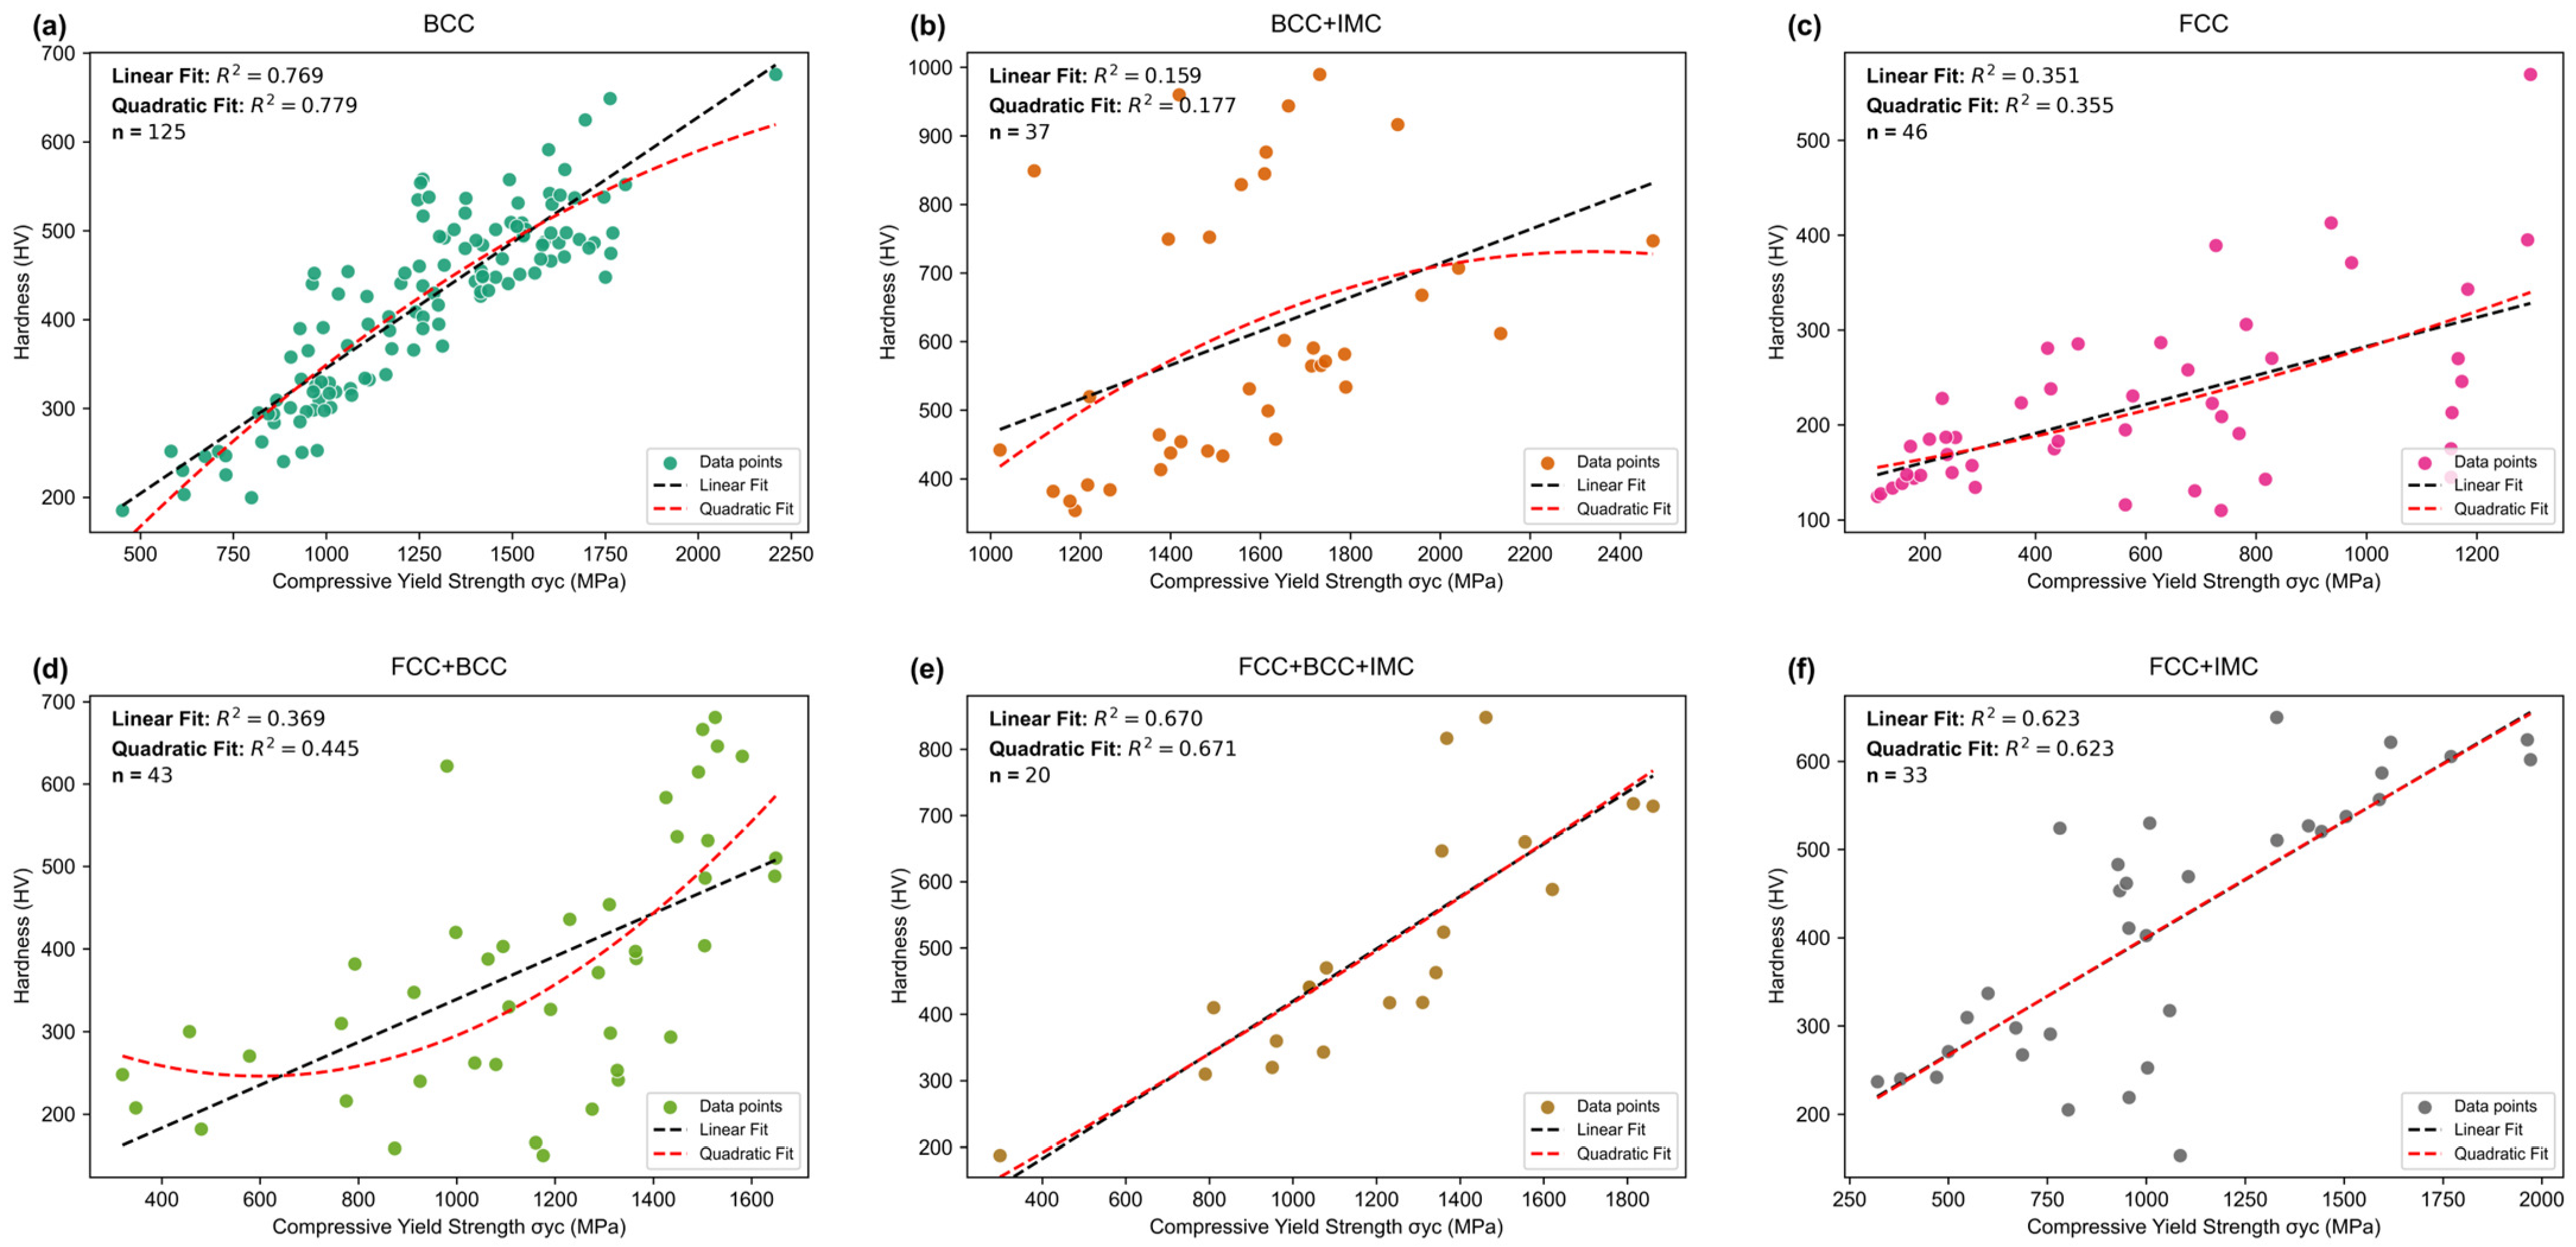
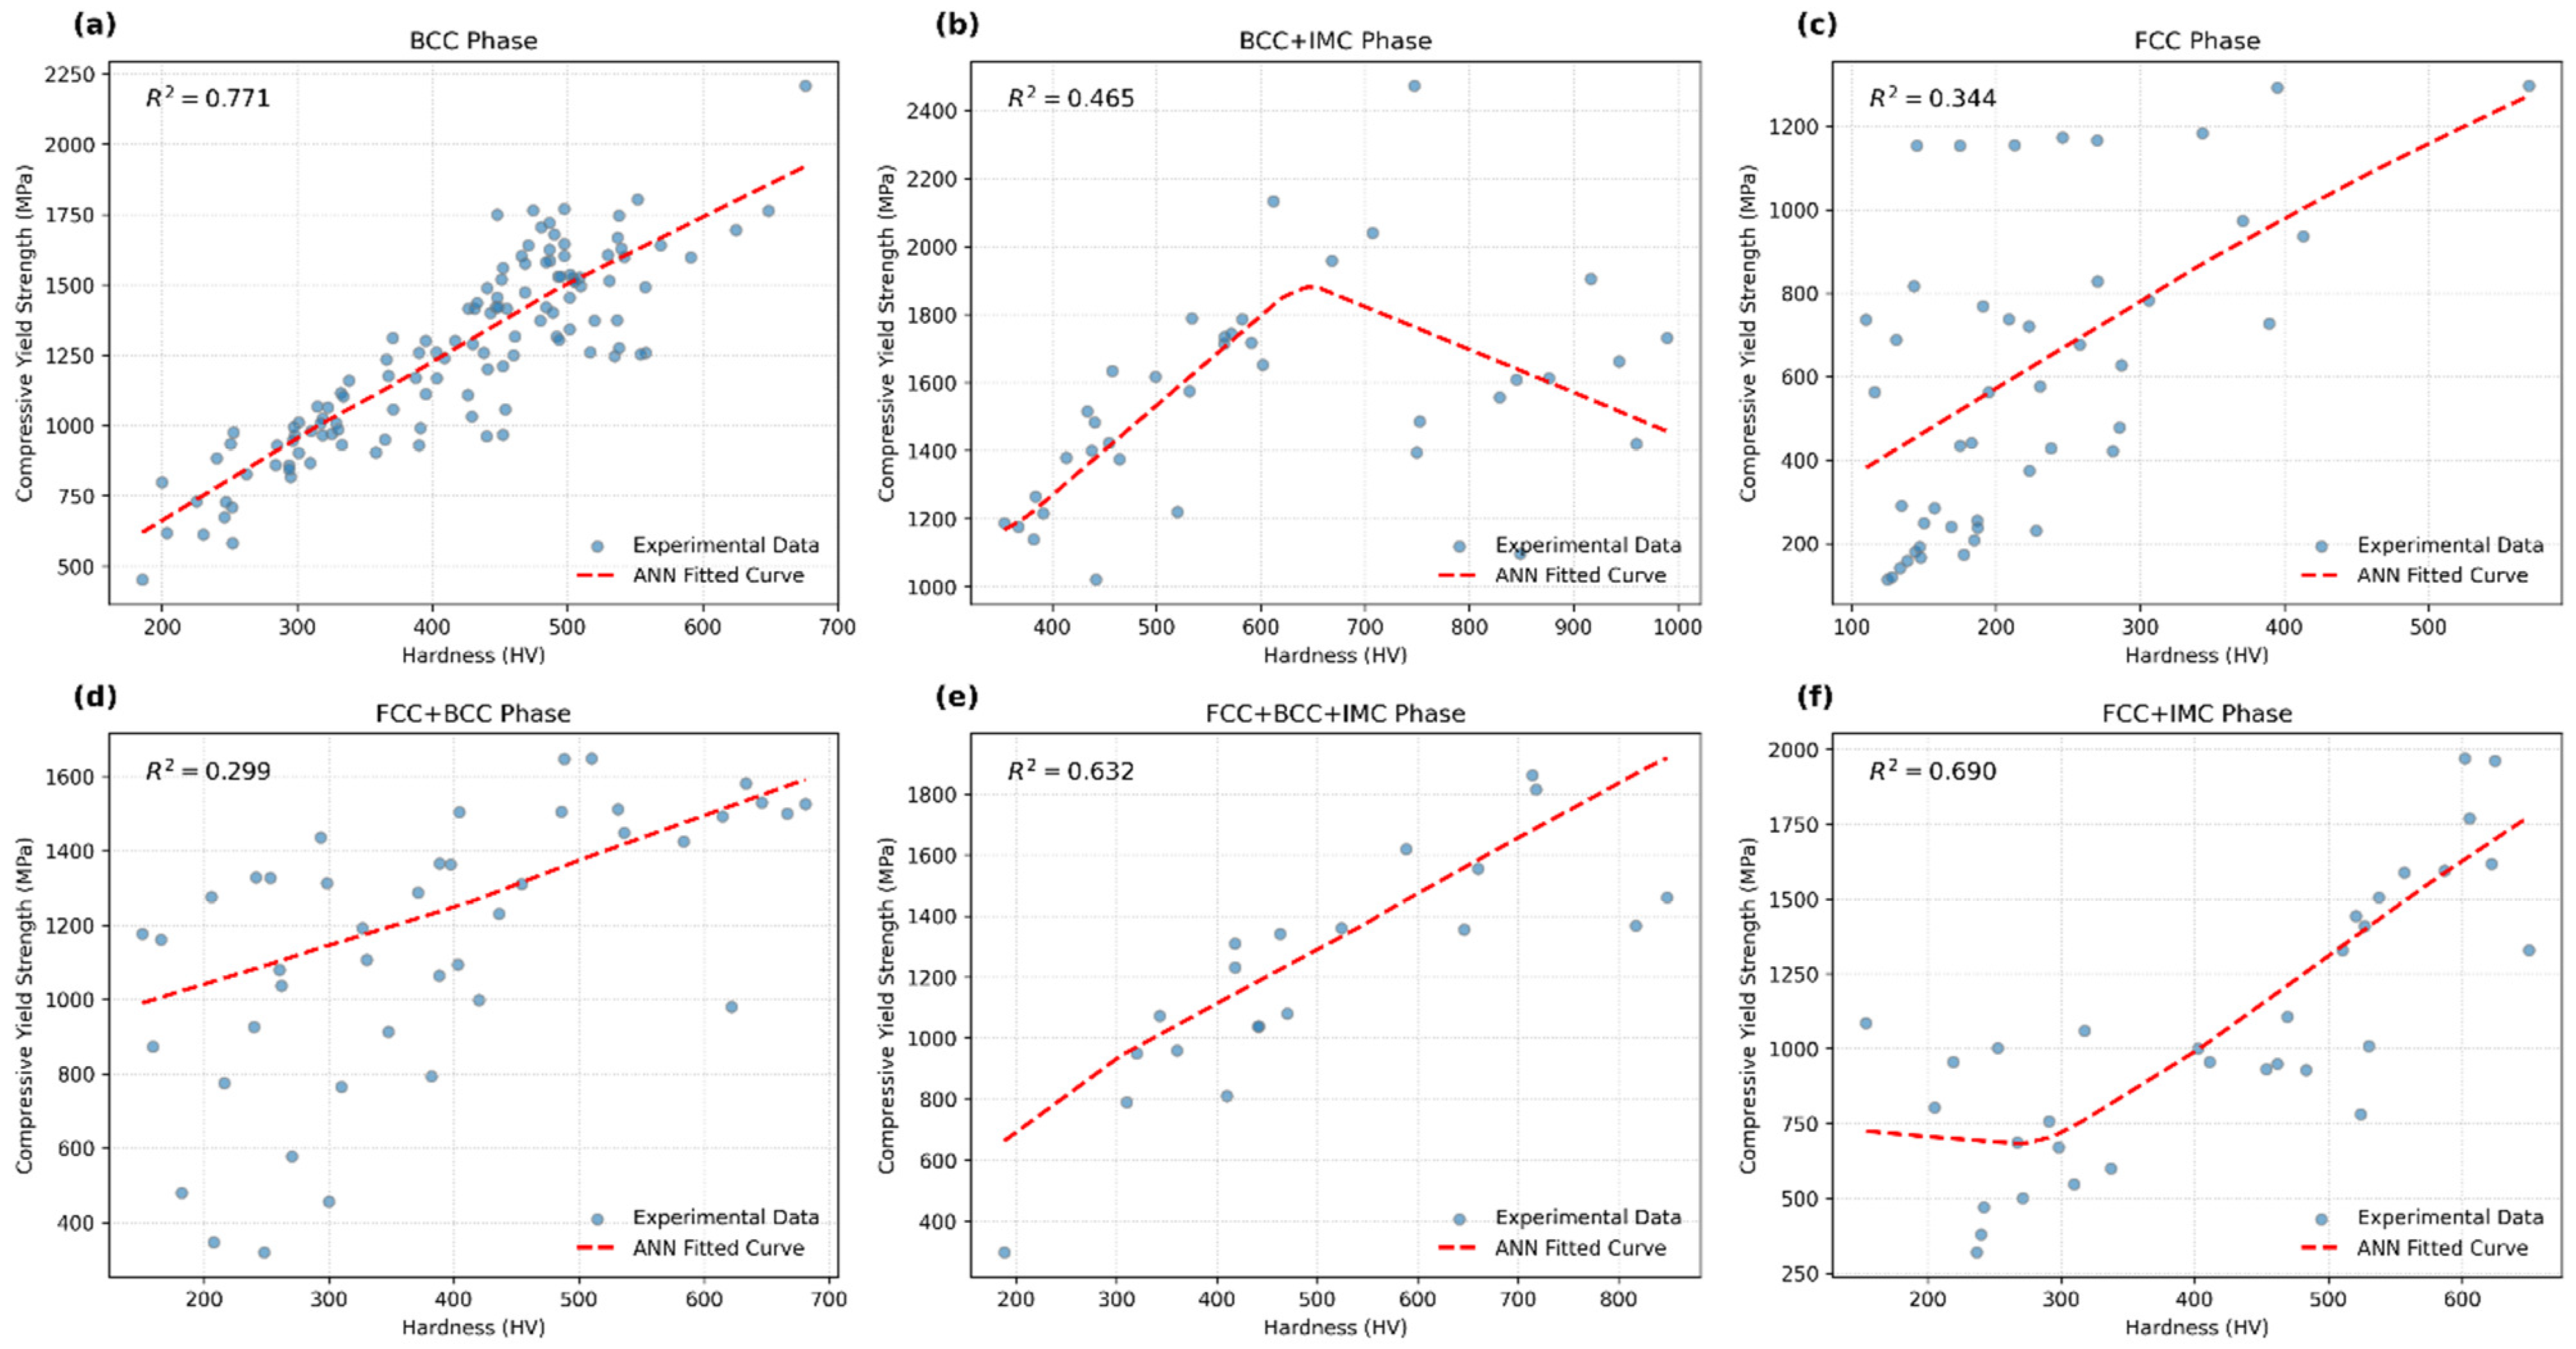
- While a general positive correlation exists between σy and HV across the dataset (overall Pearson r ≈ 0.75), the strength and nature of this relationship are highly dependent on the HEA’s phase constitution. Single-phase BCC HEAs demonstrate the strongest and most linear correlation (linear R2 = 0.77, r = 0.88). In contrast, FCC alloys showed a weaker correlation (linear R2= 0.35, r = 0.59), and multiphase systems (e.g., BCC + IMC, FCC + BCC) exhibited more complex behavior, sometimes better captured by non-linear (quadratic or ANN) models.
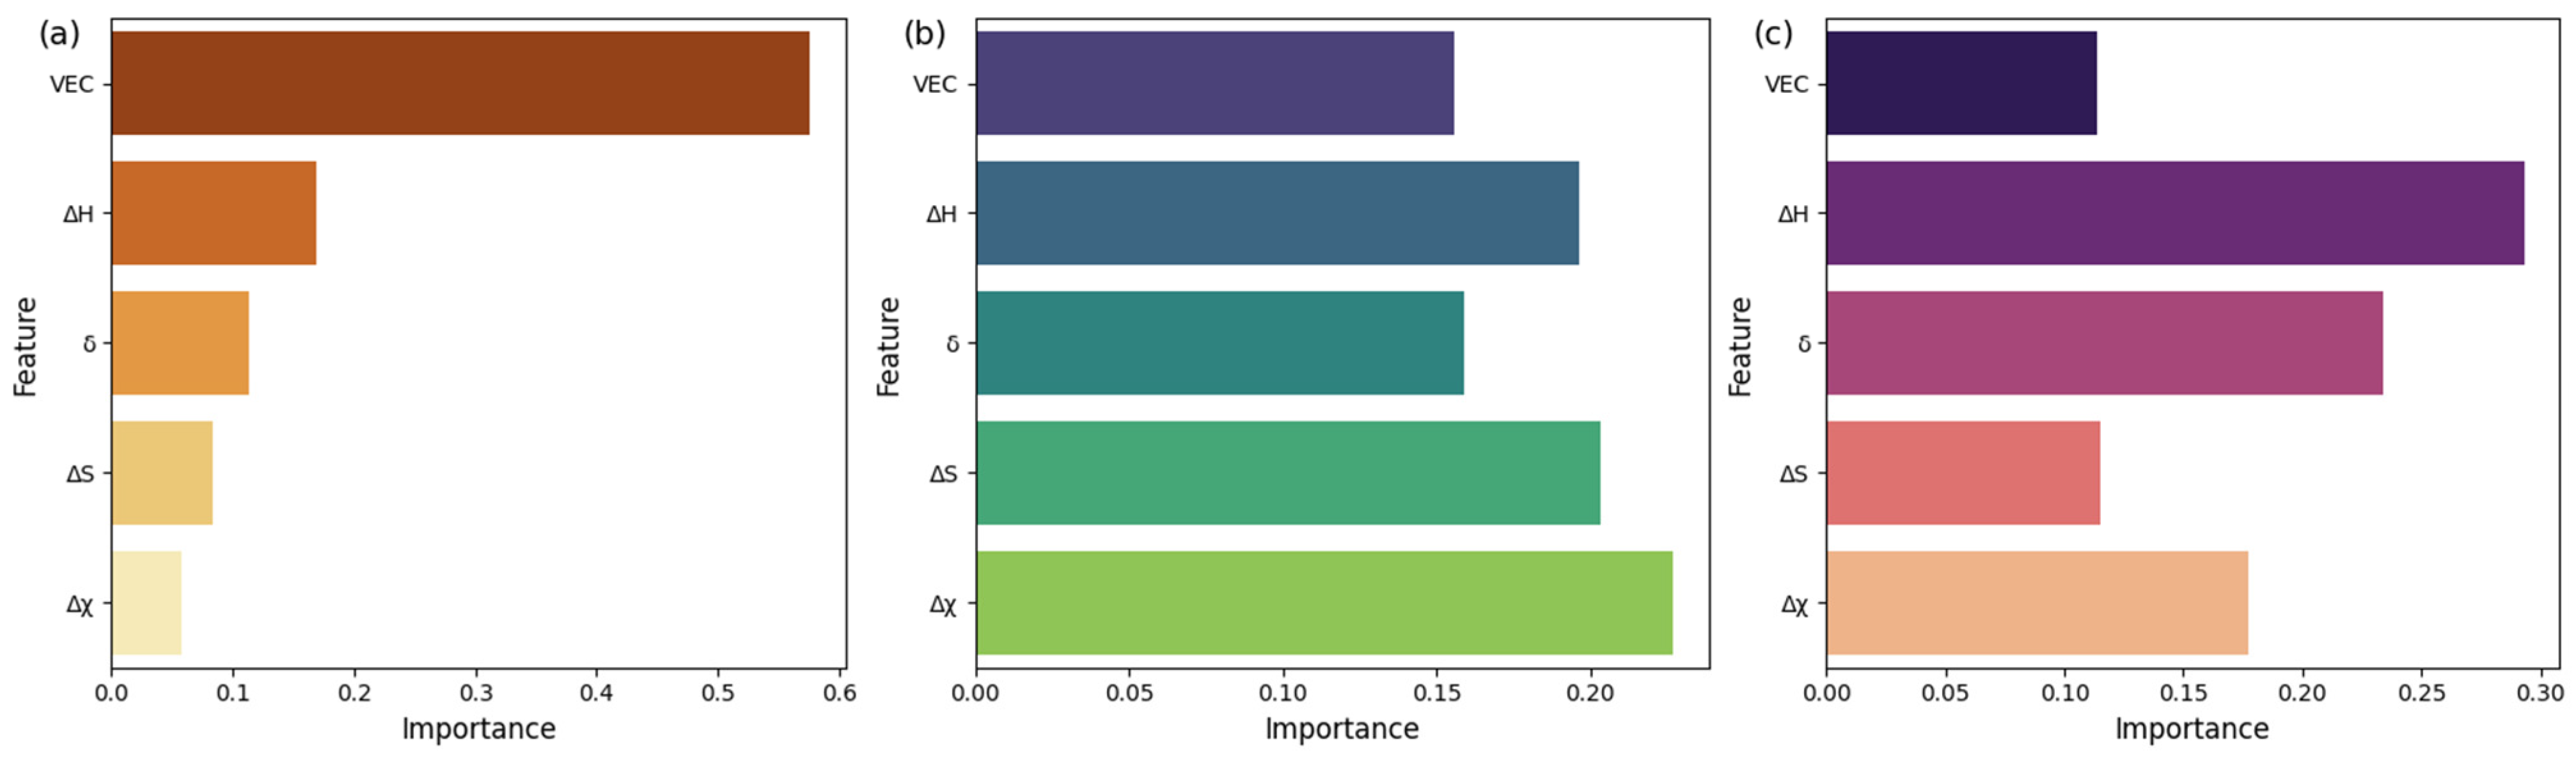
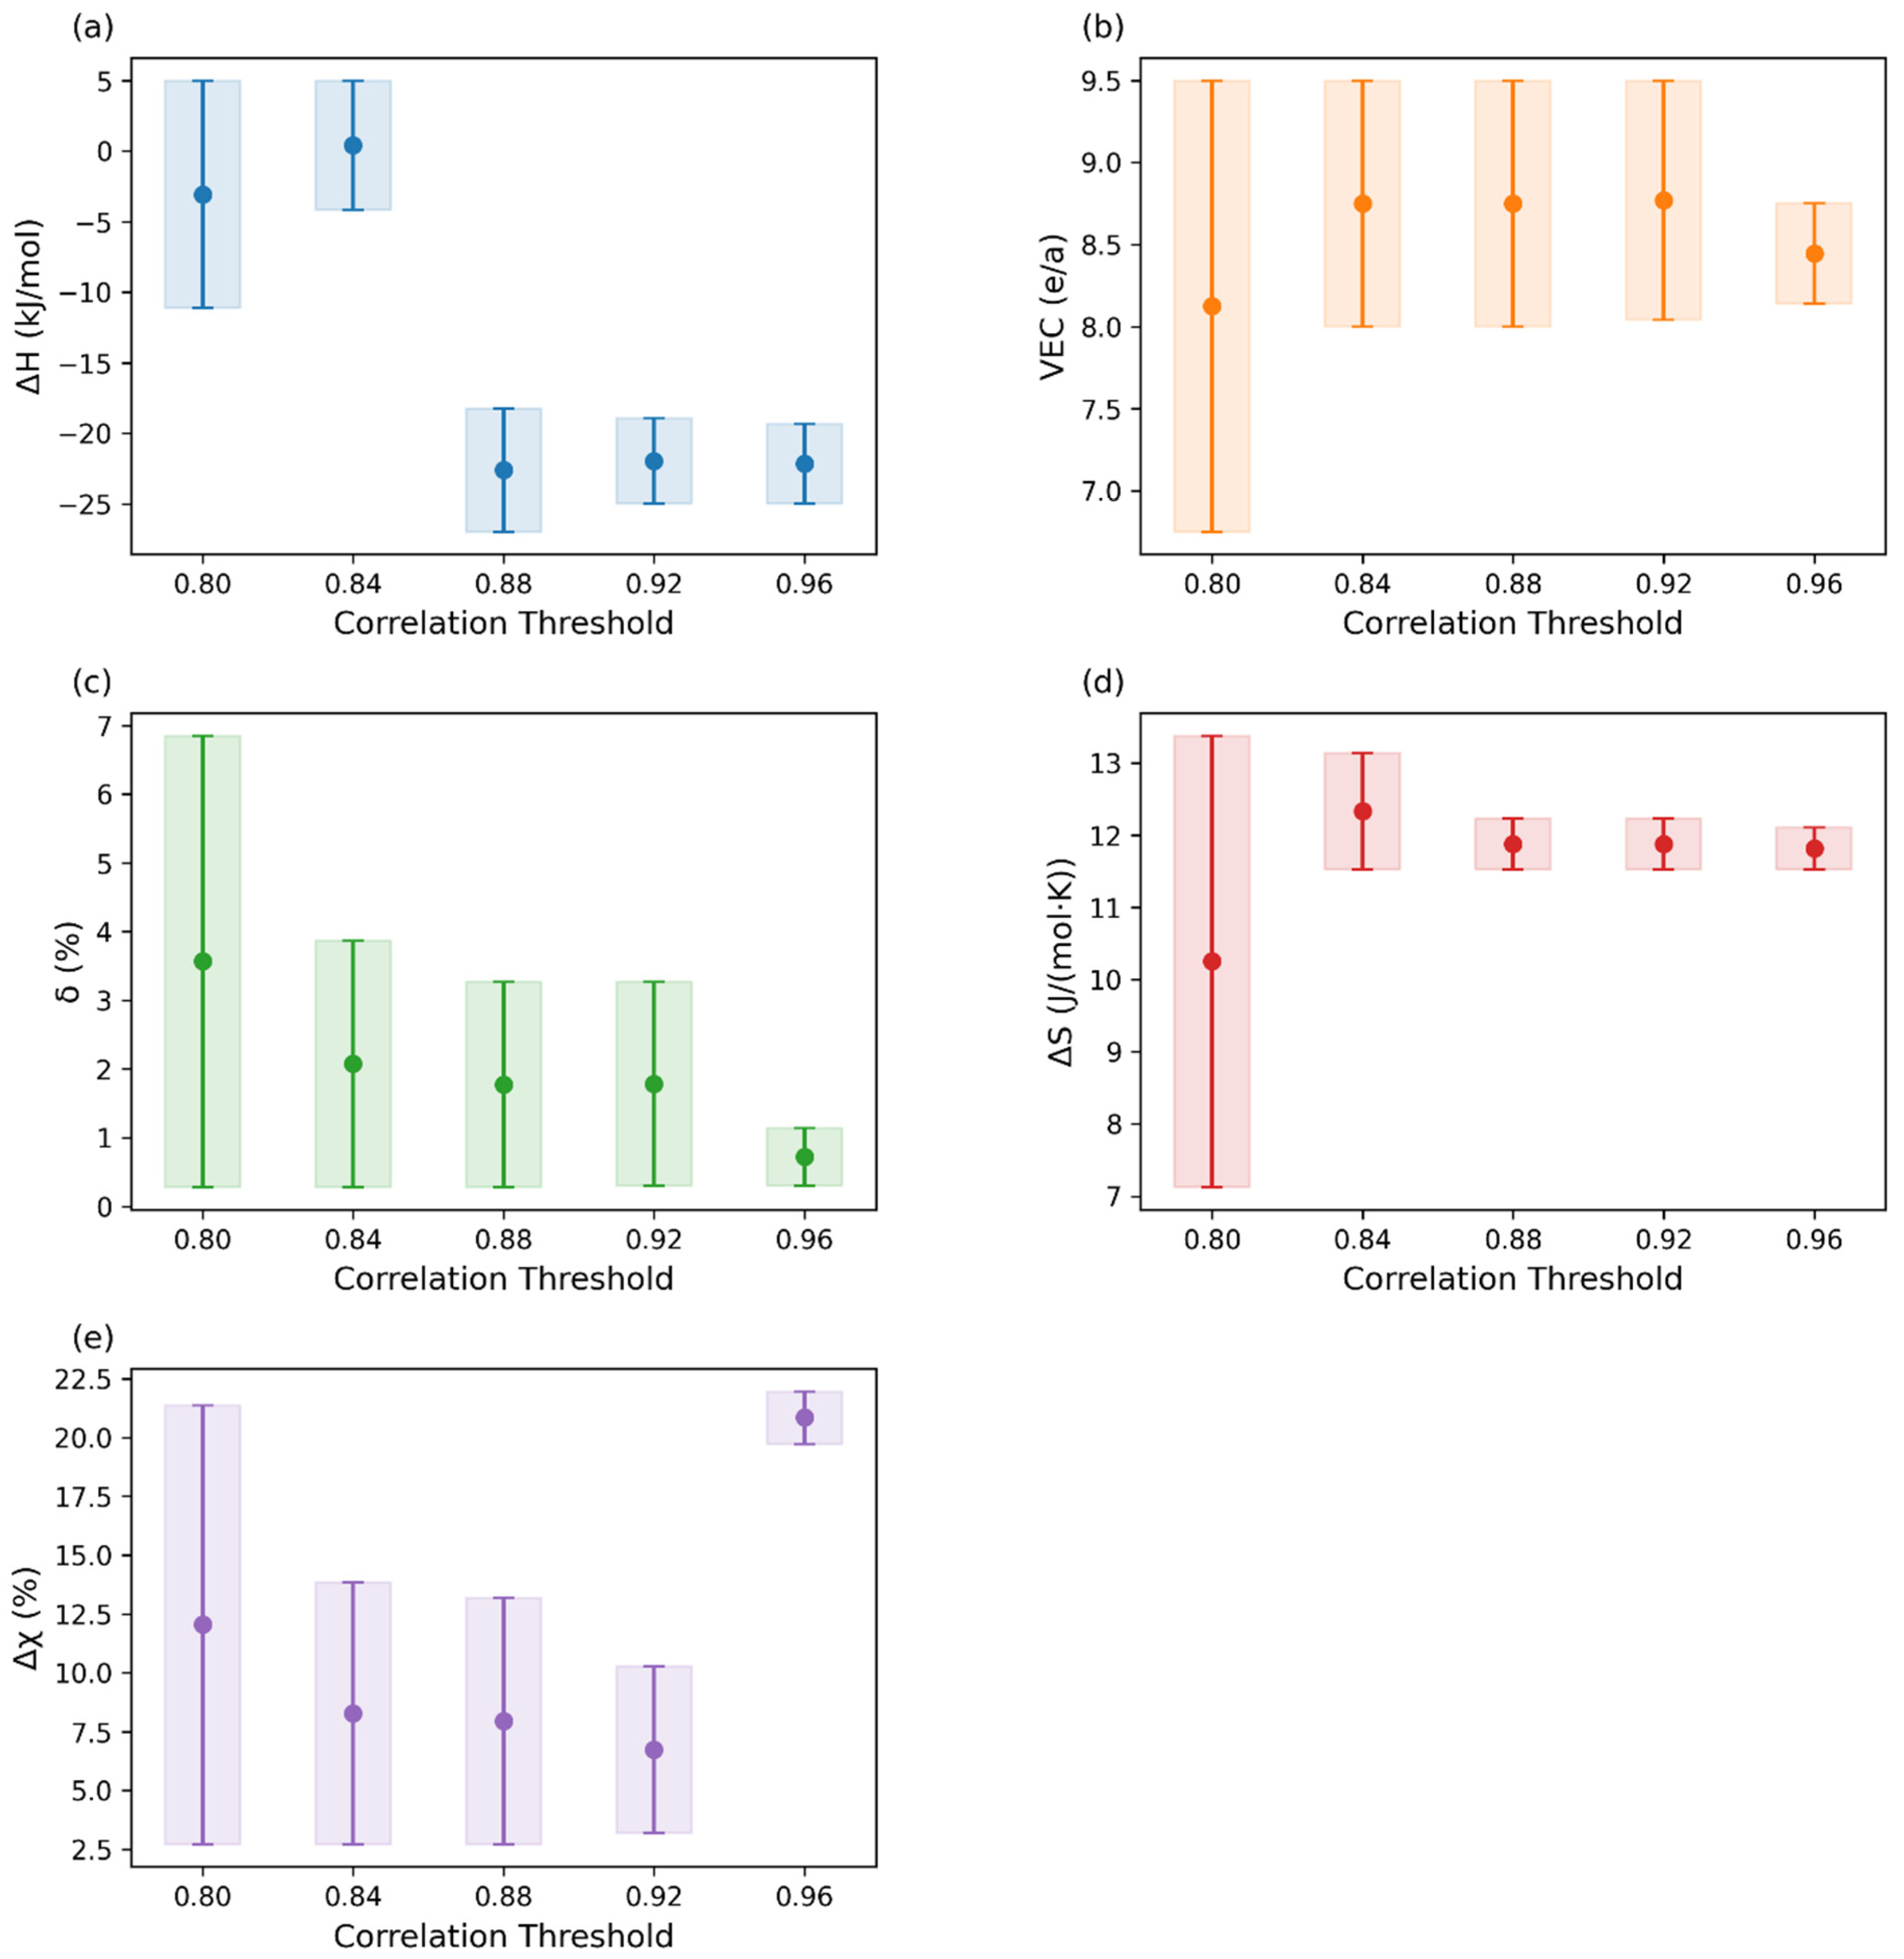
- The analysis identifies specific ranges of thermodynamic and electronic parameters (ΔH, VEC, δ, ΔS, Δχ) that favor a stronger correlation between σy and HV. Notably, achieving high correlation coefficients often requires combinations like highly negative ΔH, very low δ, and high ΔS, suggesting that microstructures promoting stable solid solutions might exhibit more predictable σy-HV relationships.
- Phase-specific ANN models further confirm the varying complexity. While ANNs significantly improve the fit for certain complex microstructures like BCC + IMC compared to linear/quadratic models, their advantage is less pronounced for phases like BCC or FCC, where simpler relationships appear dominant within the dataset.
Author Contributions
Funding
Data Availability Statement
Conflicts of Interest
References
- Yeh, J.W.; Chen, S.K.; Lin, S.J.; Gan, J.Y.; Chin, T.S.; Shun, T.T.; Tsau, C.H.; Chang, S.Y. Nanostructured High-Entropy Alloys with Multiple Principal Elements: Novel Alloy Design Concepts and Outcomes. Adv. Eng. Mater. 2004, 6, 299–303. [Google Scholar] [CrossRef]
- Cantor, B.; Chang, I.T.H.; Knight, P.; Vincent, A.J.B. Microstructural Development in Equiatomic Multicomponent Alloys. Mater. Sci. Eng. A 2004, 375–377, 213–218. [Google Scholar] [CrossRef]
- Yang, Y.F.; Hu, F.; Xia, T.; Li, R.H.; Bai, J.Y.; Zhu, J.Q.; Xu, J.Y.; Zhang, G.F. High Entropy Alloys: A Review of Preparation Techniques, Properties and Industry Applications. J. Alloys Compd. 2024, 1010, 177691. [Google Scholar] [CrossRef]
- Odetola, P.I.; Babalola, B.J.; Afolabi, A.E.; Anamu, U.S.; Olorundaisi, E.; Umba, M.C.; Phahlane, T.; Ayodele, O.O.; Olubambi, P.A. Exploring High Entropy Alloys: A Review on Thermodynamic Design and Computational Modeling Strategies for Advanced Materials Applications. Heliyon 2024, 1010, e39660. [Google Scholar] [CrossRef]
- Yernat, K.; Mazhyn, S.; Sherzod, K.; Gulzhaz, U.; Abil, K.; Aibar, K.; Nurken, M. High-Entropy Alloys: Innovative Materials with Unique Properties for Hydrogen Storage and Technologies for Their Production. Metals 2025, 15, 100. [Google Scholar] [CrossRef]
- Zhang, Y.; Zuo, T.T.; Tang, Z.; Gao, M.C.; Dahmen, K.A.; Liaw, P.K.; Lu, Z.P. Microstructures and Properties of High-Entropy Alloys. Prog. Mater. Sci. 2014, 61, 1–93. [Google Scholar] [CrossRef]
- George, E.P.; Raabe, D.; Ritchie, R.O. High-Entropy Alloys. Nat. Rev. Mater. 2019, 4, 515–534. [Google Scholar] [CrossRef]
- Jia, Y.; Wang, Z.; Wu, Q.; He, F.; Li, J.; Wang, J. Enhancing the Yield Strength of Ni–Co–Cr–Fe–al As-Cast Hypoeutectic High-Entropy Alloys by Introducing γ′ Precipitation. Mater. Sci. Eng. A 2022, 858, 144190. [Google Scholar] [CrossRef]
- Tsai, K.Y.; Tsai, M.H.; Yeh, J.W. Sluggish Diffusion in Co–Cr–Fe–Mn–Ni High-Entropy Alloys. Acta Mater. 2013, 61, 4887–4897. [Google Scholar] [CrossRef]
- Tabor, D. The Hardness of Metals; Clarendon Press: New York, NY, USA; Oxford, UK, 2007. [Google Scholar]
- Kumar, D.; Sharma, V.K.; Prasad, Y.V.S.S.; Kumar, V. Materials-Structure-Property Correlation Study of Spark Plasma Sintered AlCuCrFeMnWx (X = 0, 0.05, 0.1, 0.5) High-Entropy Alloys. J. Mater. Res. 2019, 34, 767–776. [Google Scholar] [CrossRef]
- Meyers, M.A.; Chawla, K.K. Mechanical Behavior of Materials, 2nd ed.; Cambridge University: Cambridge, UK, 2013. [Google Scholar]
- Fan, X.; Qu, R.; Zhang, Z. Relation between Strength and Hardness of High-Entropy Alloys. Acta Metall. Sin. 2021, 34, 1461–1482. [Google Scholar] [CrossRef]
- Tokarewicz, M.; Grądzka-Dahlke, M. Review of Recent Research on AlCoCrFeNi High-Entropy Alloy. Metals 2021, 11, 1302. [Google Scholar] [CrossRef]
- Wang, Q.; Zeng, L.; Gao, T.; Du, H.; Liu, X. On the Room-Temperature Tensile Deformation Behavior of a Cast Dual-Phase High-Entropy Alloy CrFeCoNiAl0.7. J. Mater. Sci. Technol. 2021, 87, 29–38. [Google Scholar] [CrossRef]
- Hong, Y.; Wang, C.; Lei, J.; Yang, T.; Ji, V.; Song, P.; Huang, T.; Zhang, X. Combined Effect of B2 Phase Transformation and FCC/BCC Lamellar Structure on the Mechanical Property of Heat Treated Dual-Phase Al0.7CoCrFeNi High Entropy Alloy. J. Alloys Compd. 2025, 1020, 179456. [Google Scholar] [CrossRef]
- Joseph, J.; Stanford, N.; Hodgson, P.; Fabijanic, D.M. Understanding the Mechanical Behaviour and the Large Strength/Ductility Differences between FCC and BCC AlxCoCrFeNi High Entropy Alloys. J. Alloys Compd. 2017, 726, 885–895. [Google Scholar] [CrossRef]
- Shen, L.; Chen, L.; Huang, J.; He, J.; Li, Z.; Pan, J.; Chang, F.; Dai, P.; Tang, Q. Predicting Phases and Hardness of High Entropy Alloys Based on Machine Learning. Intermetallics 2023, 162, 108030. [Google Scholar] [CrossRef]
- Zhao, D.Q.; Pan, S.P.; Zhang, Y.; Liaw, P.K.; Qiao, J.W. Structure Prediction in High-Entropy Alloys with Machine Learning. Appl. Phys. Lett. 2021, 118, 231904. [Google Scholar] [CrossRef]
- Ding, S.; Wang, W.; Zhang, Y.; Ren, W.; Weng, X.; Chen, J. A Yield Strength Prediction Framework for Refractory High-Entropy Alloys Based on Machine Learning. Int. J. Refract. Met. Hard Mater. 2024, 125, 106884. [Google Scholar] [CrossRef]
- Bhandari, U.; Rafi, M.R.; Zhang, C.; Yang, S. Yield Strength Prediction of High-Entropy Alloys Using Machine Learning. Mater. Today Commun. 2021, 26, 101871. [Google Scholar] [CrossRef]
- Dilshodbek, Y.; Hong, S.H.; Abbas, M.A.; Kang, G.C.; Park, H.J.; Jumaev, E.; Wang, W.-M.; Kim, K.B. Evolution of Microstructure and Mechanical Characteristics of (CrFeNiCu)100–XTix High-Entropy Alloys. Rare Met. 2023, 42, 3088–3098. [Google Scholar] [CrossRef]
- Fang, Y.; Hu, Z.; Ji, J.; Sun, L.; Wang, L.; Zhan, X. Preparation of a Novel High-Entropy Alloy AlNbTiVZr with Excellent Strength and Ductility: The Effect of Zr Composition on Microstructure and Properties. Mater. Sci. Eng. A 2024, 918, 147441. [Google Scholar] [CrossRef]
- Gan, Z.; Huang, Y.; Wu, C.; Yang, T.; Shen, S.; Luo, G.; Liu, J. Microstructural Evolution and Elevated-Temperature Strengthening Mechanism of Co-Free FeCrMnNiV0.2Alx High-Entropy Alloys during Annealing. Mater. Sci. Eng. A 2024, 895, 146213. [Google Scholar] [CrossRef]
- Qiao, D.X.; Jiang, H.; Jiao, W.N.; Lu, Y.P.; Cao, Z.Q.; Li, T.J. A Novel Series of Refractory High-Entropy Alloys Ti2ZrHf0.5VNbx with High Specific Yield Strength and Good Ductility. Acta Metall. Sin. 2019, 32, 925–931. [Google Scholar] [CrossRef]
- Yao, H.; Qiao, J.W.; Hawk, J.A.; Zhou, H.; Chen, M.; Gao, M. Mechanical Properties of Refractory High-Entropy Alloys: Experiments and Modeling. J. Alloys Compd. 2017, 696, 1139–1150. [Google Scholar] [CrossRef]
- Kao, Y.F.; Chen, T.J.; Chen, S.K.; Yeh, J.W. Microstructure and Mechanical Property of As-Cast, -Homogenized, and -Deformed AlxCoCrFeNi (0 ≤ X ≤ 2) High-Entropy Alloys. J. Alloys Compd. 2009, 488, 57–64. [Google Scholar] [CrossRef]
- Xu, C.; Chen, D.; Yang, X.; Liu, T.; Chen, R. Achieving Excellent Strength and Ductility of Ti2ZrNbHfV Refractory High-Entropy Alloys by v Addition. Int. J. Refract. Met. Hard Mater. 2024, 121, 106681. [Google Scholar] [CrossRef]
- Wang, E.; Dong, J.; Cao, Y.; Kang, F.; Liu, X.; Jiang, F.; Li, J.; Liu, Z.; Jiang, W.; Kang, K. Effects of Gd on the Microstructure and Mechanical Properties of GdxCoCrFeNiV0.4 High-Entropy Alloys. J. Mater. Res. Technol. 2024, 33, 714–724. [Google Scholar] [CrossRef]
- Shen, X.; Guo, Z.; Liu, F.; Dong, F.; Zhang, Y.; Liu, C.; Wang, B.; Luo, L.; Su, Y.; Cheng, J.; et al. Microstructural Evolution and Mechanical Behavior of Novel TiZrTaxNbMo Refractory High-Entropy Alloys. J. Alloys Compd. 2024, 990, 174459. [Google Scholar] [CrossRef]
- Yang, X.; Zhang, Y.; Liaw, P.K. Microstructure and Compressive Properties of NbTiVTaAlx High Entropy Alloys. Procedia Eng. 2012, 36, 292–298. [Google Scholar] [CrossRef]
- Nie, Q.; Liang, H.; Qiao, D.; Qi, Z.; Cao, Z. Microstructures and Mechanical Properties of Multi-Component AlxCrFe2Ni2Mo0.2 High-Entropy Alloys. Acta Metall. Sin. 2020, 33, 1135–1144. [Google Scholar] [CrossRef]
- Cheng, P.; Zhao, Y.; Xu, X.; Wang, S.; Sun, Y.; Hou, H. Microstructural Evolution and Mechanical Properties of Al0.3CoCrFeNiSix High-Entropy Alloys Containing Coherent Nanometer-Scaled Precipitates. Mater. Sci. Eng. A 2020, 772, 138681. [Google Scholar] [CrossRef]
- Yan, Y.; Fang, L.; Tan, Y.; Tao, X.; Ouyang, Y.; Du, Y. Mechanical Properties and Corrosion Resistance of AlxCoCuFeMn High-Entropy Alloys. J. Mater. Res. Technol. 2023, 24, 5250–5259. [Google Scholar] [CrossRef]
- Li, Y.; Wang, Z.; Sun, L.; Wang, X. Mechanical Properties and Wear Behaviors of FeCoNiCrMnTix High-Entropy Alloys Manufactured by Vacuum Arc Melting. J. Mater. Res. Technol. 2024, 30, 1962–1977. [Google Scholar] [CrossRef]
- Ma, S.G.; Zhang, Y. Effect of Nb Addition on the Microstructure and Properties of AlCoCrFeNi High-Entropy Alloy. Mater. Sci. Eng. A 2012, 532, 480–486. [Google Scholar] [CrossRef]
- Xiao, Y.; Peng, X. Design of Lightweight Ti3Zr1.5NbV Refractory High-Entropy Alloys with Superior Mechanical Properties. J. Mater. Res. Technol. 2023, 27, 330–341. [Google Scholar] [CrossRef]
- Wang, W.; Wang, J.; Yi, H.; Qi, W.; Peng, Q. Effect of Molybdenum Additives on Corrosion Behavior of (CoCrFeNi)100−XMox High-Entropy Alloys. Entropy 2018, 20, 908. [Google Scholar] [CrossRef]
- Zhang, M.; Yao, L.; Zhu, M.; Liu, Y.; Jian, Z. Structural Evolution and Mechanical and Magnetic Properties of Nonequiatomic CoFe2NiMn0.3Alx (0.25 ≤ X ≤ 1.00) High-Entropy Alloys. J. Mater. Eng. Perform. 2021, 30, 1472–1478. [Google Scholar] [CrossRef]
- Lin, C.M.; Juan, C.C.; Chang, C.H.; Tsai, C.W.; Yeh, J.W. Effect of al Addition on Mechanical Properties and Microstructure of Refractory AlxHfNbTaTiZr Alloys. J. Alloys Compd. 2015, 624, 100–107. [Google Scholar] [CrossRef]
- Qiao, D.X.; Jiang, H.; Chang, X.X.; Lu, Y.P.; Li, T.J. Microstructure and Mechanical Properties of VTaTiMoAlx Refractory High Entropy Alloys. Mater. Sci. Forum 2017, 898, 638–642. [Google Scholar] [CrossRef]
- Stepanov, N.D.; Yurchenko, N.Y.; Panina, E.S.; Tikhonovsky, M.A.; Zherebtsov, S.V. Precipitation-Strengthened Refractory Al0.5CrNbTi2V0.5 High Entropy Alloy. Mater. Lett. 2016, 188, 162–164. [Google Scholar] [CrossRef]
- Chen, G.; Yan, H.; Wang, Z.; Wang, K.; Yves, N.I.; Tong, Y. Effects of Mo Content on the Microstructure and Mechanical Properties of TiNbZrMox High-Entropy Alloys. J. Alloys Compd. 2022, 930, 167373. [Google Scholar] [CrossRef]
- Wang, N.; Ma, K.; Li, Q.; Yuan, Y.; Zhao, Y.; Feng, L. Effect of Mn Content on Microstructure and Properties of AlCrCuFeMnx High-Entropy Alloy. China Foundry 2024, 21, 147–158. [Google Scholar] [CrossRef]
- Zhang, L.; Tu, J.; Liang, Y.; Yang, W.; Zhang, X.; Zhou, Z.; Gu, Y.; Liu, Y.; Du, Y. Titanium Doping Levels and Their Effects on FeCoCrNi High-Entropy Alloys: From Microstructure to Performance. Mater. Charact. 2024, 215, 114136. [Google Scholar] [CrossRef]
- Chen, S.; Bao, L.; Yang, H.; Si, X.; Yu, Q. Effect of al Content on Microstructure and Mechanical Properties of Alx(Nb3TaTi3Zr)100-x Refractory High-Entropy Alloys. J. Phys. Conf. Ser. 2024, 2691, 012071. [Google Scholar] [CrossRef]
- Zhang, Y.; Yang, X.; Liaw, P.K. Alloy Design and Properties Optimization of High-Entropy Alloys. JOM 2012, 64, 830–838. [Google Scholar] [CrossRef]
- Ji, G.; Zhou, Z.; Meng, F.; Yang, X.; Sheng, R.; Qiao, J.; Liaw, P.K.; Li, M.; Jiang, L.; Chen, S.; et al. Effect of Zr Addition on the Local Structure and Mechanical Properties of Ti–Ta–Nb–Zr Refractory High-Entropy Alloys. J. Mater. Res. Technol. 2022, 19, 4428–4438. [Google Scholar] [CrossRef]
- Duan, S.; Zhang, Q.; Li, W.; Dong, Y.; Jiang, B.; Liu, S.; Li, C.; Zhang, Z. Effects of v Addition on Microstructural Evolution and Mechanical Properties of AlCrFe2Ni2 High-Entropy Alloys. Acta Metall. Sin. 2022, 36, 391–404. [Google Scholar] [CrossRef]
- Lei, H.; Ye, X.; Feng, J.; Chen, J.; Diao, Z.; Fang, D.; Li, B.; Zhao, G.; Liu, R. Microstructure and Mechanical Properties of CrFeNiBx Eutectic High Entropy Alloys. Mater. Sci. Eng. A 2023, 887, 145741. [Google Scholar] [CrossRef]
- Zhu, Z.G.; Ma, K.H.; Wang, Q.; Shek, C.H. Compositional Dependence of Phase Formation and Mechanical Properties in Three CoCrFeNi-(Mn/Al/Cu) High Entropy Alloys. Intermetallics 2016, 79, 1–11. [Google Scholar] [CrossRef]
- Chen, L.B.; Wei, R.; Tang, K.; Zhang, J.; Jiang, F.; Lin, H.; Sun, J. Heavy Carbon Alloyed FCC-Structured High Entropy Alloy with Excellent Combination of Strength and Ductility. Mater. Sci. Eng. A 2018, 716, 150–156. [Google Scholar] [CrossRef]
- Saad, A.S.; Samrand, S.; Hu, Q.; Johan, A.; Persson, C.; Jaroslav, V.; Jiří, Z.; Klement, U.; Guo, S. Alloy Design for Intrinsically Ductile Refractory High-Entropy Alloys. J. Appl. Phys. 2016, 120, 164902. [Google Scholar] [CrossRef]
- Fang, S.; Meng, L.; Ke, L.; Fu, W.; Qi, T. Mechanism of Gd Doping on Microstructure and Mechanical Properties of FeCrNiCuTi0.4 High Entropy Alloy. J. Alloys Compd. 2024, 1003, 175699. [Google Scholar] [CrossRef]
- Zuo, T.T.; Li, R.B.; Ren, X.J.; Zhang, Y. Effects of al and Si Addition on the Structure and Properties of CoFeNi Equal Atomic Ratio Alloy. J. Magn. Magn. Mater. 2014, 371, 60–68. [Google Scholar] [CrossRef]
- Chen, Y.; Liu, W.; Wang, H.; Xie, J.; Zhang, T.; Yin, L.; Huang, Y. Effect of Ti Content on the Microstructure and Properties of CoCrFeNiMnTix High Entropy Alloy. Entropy 2022, 24, 241. [Google Scholar] [CrossRef]
- Wu, M.; Yuan, J.; Diao, G.; Li, D. Achieving a Combination of Higher Strength and Higher Ductility for Enhanced Wear Resistance of AlCrFeNiTi0.5 High-Entropy Alloy by Mo Addition. Metals 2022, 12, 1910. [Google Scholar] [CrossRef]
- Xu, C.; Chen, D.; Yang, X.; Wang, S.; Fang, H.; Chen, R. Enhancing Mechanical Performance of Ti2ZrNbHfVAlx Refractory High-Entropy Alloys through Laves Phase. Mater. Sci. Eng. A 2024, 918, 147438. [Google Scholar] [CrossRef]
- Wang, E.; Li, J.; Kang, F.; Jiang, F.; Lv, L.; Dai, B.; Cao, Y.; Jiang, W. Balancing the Mechanical Properties of Al0.45CoCrFeNiTix High-Entropy Alloys by Tailoring Titanium Content. J. Mater. Res. Technol. 2023, 28, 967–979. [Google Scholar] [CrossRef]
- Ye, X.; Wang, T.; Xu, Z.; Liu, C.; Wu, H.; Zhao, G.; Fang, D. Effect of Ti Content on Microstructure and Mechanical Properties of CuCoFeNi High-Entropy Alloys. Int. J. Miner. Metall. Mater. 2020, 27, 1326–1331. [Google Scholar] [CrossRef]
- Liu, L.; Zhu, J.B.; Li, L.; Li, J.C.; Jiang, Q. Microstructure and Tensile Properties of FeMnNiCuCoSnx High Entropy Alloys. Mater. Des. 2012, 44, 223–227. [Google Scholar] [CrossRef]
- Salishchev, G.A.; Tikhonovsky, M.A.; Shaysultanov, D.G.; Stepanov, N.; Kuznetsov, A.; Kolodiy, I.V.; Tortika, A.S.; Senkov, O.N. Effect of Mn and v on Structure and Mechanical Properties of High-Entropy Alloys Based on CoCrFeNi System. J. Alloys Compd. 2014, 591, 11–21. [Google Scholar] [CrossRef]
- Zýka, J.; Málek, J.; Veselý, J.; Lukáč, F.; Čížek, J.; Kuriplach, J.; Melikhova, O. Microstructure and Room Temperature Mechanical Properties of Different 3 and 4 Element Medium Entropy Alloys from HfNbTaTiZr System. Entropy 2019, 21, 114. [Google Scholar] [CrossRef] [PubMed]
- Chen, S.; Yang, X.; Dahmen, K.; Liaw, P.; Zhang, Y. Microstructures and Crackling Noise of AlxNbTiMoV High Entropy Alloys. Entropy 2014, 16, 870–884. [Google Scholar] [CrossRef]
- Yao, H.; Qiao, J.W.; Gao, M.; Hawk, J.A.; Ma, S.; Zhou, H.; Zhang, Y. NbTaV-(Ti,W) Refractory High-Entropy Alloys: Experiments and Modeling. Mater. Sci. Eng. A 2016, 674, 203–211. [Google Scholar] [CrossRef]
- Guo, N.N.; Wang, L.; Luo, L.S.; Li, X.Z.; Chen, R.R.; Su, Y.Q.; Guo, J.J.; Fu, H.Z. Microstructure and Mechanical Properties of In-Situ MC-Carbide Particulates-Reinforced Refractory High-Entropy Mo0.5NbHf0.5ZrTi Matrix Alloy Composite. Intermetallics 2016, 69, 74–77. [Google Scholar] [CrossRef]
- Zhang, M.; Zhou, X.; Li, J. Microstructure and Mechanical Properties of a Refractory CoCrMoNbTi High-Entropy Alloy. J. Mater. Eng. Perform. 2017, 26, 3657–3665. [Google Scholar] [CrossRef]
- Zhang, M.; Zhang, L.; Fan, J.; Yu, P.; Li, G. Anomalous Microstructure and Excellent Mechanical Behaviors of (CoCrFeNi)6-x-YCrxAly High-Entropy Alloy Induced by Cr and al Addition. Mater. Sci. Eng. A 2019, 752, 63–74. [Google Scholar] [CrossRef]
- Fazakas, E.; Zadorozhnyy, V.; Varga, L.K.; Inoue, A.; Louzguine-Luzgin, D.V.; Tian, F.; Vitos, L. Experimental and Theoretical Study of Ti20Zr20Hf20Nb20X20 (X = v or Cr) Refractory High-Entropy Alloys. Int. J. Refract. Met. Hard Mater. 2014, 47, 131–138. [Google Scholar] [CrossRef]
- Wu, Y.; Cai, Y.; Chen, X.H.; Wang, T.; Si, J.; Wang, L.; Wang, Y.D.; Hui, X. Phase Composition and Solid Solution Strengthening Effect in TiZrNbMoV High-Entropy Alloys. Mater. Des. 2015, 83, 651–660. [Google Scholar] [CrossRef]
- Liu, Y.; Zhang, Y.; Zhang, H.; Wang, N.; Chen, X.; Zhang, H.; Li, Y. Microstructure and Mechanical Properties of Refractory HfMo0.5NbTiV0.5Six High-Entropy Composites. J. Alloys Compd. 2017, 694, 869–876. [Google Scholar] [CrossRef]
- Juan, C.C.; Tseng, K.K.; Hsu, W.L.; Tsai, M.H.; Tsai, C.W.; Lin, C.M.; Chen, S.K.; Lin, S.J.; Yeh, J.W. Solution Strengthening of Ductile Refractory HfMoxNbTaTiZr High-Entropy Alloys. Mater. Lett. 2016, 175, 284–287. [Google Scholar] [CrossRef]
- Han, Z.; Luan, H.; Liu, X.J.; Chen, N.C.; Li, X.; Shao, Y.; Yao, K.L. Microstructures and Mechanical Properties of Ti NbMoTaW Refractory High-Entropy Alloys. Mater. Sci. Eng. A 2018, 712, 380–385. [Google Scholar] [CrossRef]
- Han, Z.; Chen, N.C.; Zhao, S.J.; Fan, L.T.; Yang, G.-Y.; Shao, Y.; Yao, K.L. Effect of Ti Additions on Mechanical Properties of NbMoTaW and VNbMoTaW Refractory High Entropy Alloys. Intermetallics 2017, 84, 153–157. [Google Scholar] [CrossRef]
- He, J.Y.; Liu, W.H.; Wang, H.; Wu, Y.; Liu, X.J.; Nieh, T.G.; Lu, Z.P. Effects of al Addition on Structural Evolution and Tensile Properties of the FeCoNiCrMn High-Entropy Alloy System. Acta Mater. 2014, 62, 105–113. [Google Scholar] [CrossRef]
- Yang, W.; Pang, S.J.; Wang, G.; Liu, Y.; Liaw, P.K.; Zhang, T. Ti–Zr–Hf–Nb–Ta–Sn High-Entropy Alloys with Good Properties as Potential Biomaterials. Rare Met. 2022, 41, 2305–2315. [Google Scholar] [CrossRef]
- Gan, Y.; Duan, S.; Mo, Y.; Dong, Y.; Yi, J.; Hu, Y. Effects of al Addition on the Microstructure and Mechanical Properties of AlxCoCrFeNi2.1 High-Entropy Alloys. Intermetallics 2023, 166, 108172. [Google Scholar] [CrossRef]
- Xu, T.; Lu, Y.; Cao, Z.; Wang, T.; Li, T. Effects of Ta Addition on the Microstructure and Mechanical Properties of CoCu0.5FeNi High-Entropy Alloy. J. Mater. Eng. Perform. 2019, 28, 7642–7648. [Google Scholar] [CrossRef]
- Dong, Y.; Zhou, K.; Lu, Y.; Gao, X.; Wang, T.; Li, T. Effect of Vanadium Addition on the Microstructure and Properties of AlCoCrFeNi High Entropy Alloy. Mater. Des. 2014, 57, 67–72. [Google Scholar] [CrossRef]
- Cao, L.; Wang, X.; Wang, Y.; Zhang, L.; Yang, Y.; Liu, F.; Cui, Y. Microstructural Evolution, Phase Formation and Mechanical Properties of Multi-Component AlCoCrFeNix Alloys. Appl. Phys. A 2019, 125, 699. [Google Scholar] [CrossRef]
- Zhang, M.; Zhang, L.; Fan, J.; Li, G.; Liaw, P.K.; Liu, R. Microstructure and Enhanced Mechanical Behavior of the Al7Co24Cr21Fe24Ni24 High-Entropy Alloy System by Tuning the Cr Content. Mater. Sci. Eng. A 2018, 733, 299–306. [Google Scholar] [CrossRef]
- Jiang, L.L.; Cao, Z.; Jie, J.; Zhang, J.; Lu, Y.; Wang, T.; Li, T. Effect of Mo and Ni Elements on Microstructure Evolution and Mechanical Properties of the CoFeNixVMoy High Entropy Alloys. J. Alloys Compd. 2015, 649, 585–590. [Google Scholar] [CrossRef]
- Zhang, Y.; Zhou, Y.J.; Lin, J.P.; Chen, G.L.; Liaw, P.K. Solid-Solution Phase Formation Rules for Multi-Component Alloys. Adv. Eng. Mater. 2008, 10, 534–538. [Google Scholar] [CrossRef]
- GUO, S.; LIU, C.T. Phase Stability in High Entropy Alloys: Formation of Solid-Solution Phase or Amorphous Phase. Prog. Nat. Sci. Mater. Int. 2011, 21, 433–446. [Google Scholar] [CrossRef]
- Fang, S.; Xiao, X.; Xia, L.; Li, W.; Dong, Y. Relationship between the Widths of Supercooled Liquid Regions and Bond Parameters of Mg-Based Bulk Metallic Glasses. J. Non-Cryst. Solids 2003, 321, 120–125. [Google Scholar] [CrossRef]
- Ignatenko, V.; Surkov, A.; Sergei, K. Random forests with Parametric Entropy-Based Information Gains for Classification and Regression Problems. PeerJ Comput. Sci. 2024, 10, e1775. [Google Scholar] [CrossRef] [PubMed]
- Breiman, L. Bagging Predictors. Mach. Learn. 1996, 24, 123–140. [Google Scholar] [CrossRef]
- Ghate, V.; Hemalatha C, S. A Comprehensive Comparison of Machine Learning Approaches with Hyper-Parameter Tuning for Smartphone Sensor-Based Human Activity Recognition. Meas. Sens. 2023, 30, 100925. [Google Scholar] [CrossRef]
- Ahmadi, A.; Sharif, S.S.; Banad, Y.M. A Comparative Study of Sampling Methods with Cross-Validation in the FedHome Framework. IEEE Trans. Parallel Distrib. Syst. 2025, 36, 570–579. [Google Scholar] [CrossRef]
- Guo, S.; Ng, C.; Lu, J.; Liu, C.T. Effect of Valence Electron Concentration on Stability of Fcc or Bcc Phase in High Entropy Alloys. J. Appl. Phys. 2011, 109, 103505. [Google Scholar] [CrossRef]
- Dieter, G.E. Mechanical Metallurgy; Mcgraw-Hill Education: New Delhi, India, 2013. [Google Scholar]
- Yao, Y.; Cappola, J.; Zhang, Z.; Zhu, Q.; Cai, W.; Yu, X.; Li, L. Nanostructure and Dislocation Interactions in Refractory Complex Concentrated Alloy: From Chemical Short-Range Order to Nanoscale B2 Precipitates. Acta Mater. 2024, 281, 120457. [Google Scholar] [CrossRef]
- Lugovy, M.; Slyunyayev, V.; Brodnikovskyy, M. Solid Solution Strengthening in Multicomponent Fcc and Bcc Alloys: Analytical Approach. Prog. Nat. Sci. Mater. Int. 2021, 31, 95–104. [Google Scholar] [CrossRef]
- Zhu, X.; Yang, X.; Huang, W.; Liu, Y.; Qiu, W.; Wang, X.; Li, M. Influence of Precipitation on Geometrically Necessary Dislocations Distribution and Fracture Behavior in an Al-Cu-Li Alloy. J. Alloys Compd. 2025, 1013, 178561. [Google Scholar] [CrossRef]
- Li, Y.; Yu, L.; Pang, X.; Qin, G. Tuning Stacking Fault Energy and Enhancing Mechanical Properties of al through Mg and Sc Doping: Insights from Density Functional Theory. Mater. Today Commun. 2025, 43, 111639. [Google Scholar] [CrossRef]
- Huang, E.W.; Lam, T.N.; Aitken, Z.H.; Luo, M.Y.; Chiang, N.E.; Sun, Y.; Tseng, J.C.; Chiang, C.Y.; Hsieh, W.Z.; Lee, W.J.; et al. Mixing-Enthalpy Modulation on Phase Transformation in the Gradient Chemical Core/Shell High-Entropy Shape-Memory Alloys. Mater. Des. 2025, 251, 113623. [Google Scholar] [CrossRef]
- Agatonovic-Kustrin, S.; Beresford, R. Basic Concepts of Artificial Neural Network (ANN) Modeling and Its Application in Pharmaceutical Research. J. Pharm. Biomed. Anal. 2000, 22, 717–727. [Google Scholar] [CrossRef] [PubMed]


| Feature | Description of Feature | Reference |
|---|---|---|
| Mixing enthalpy | [83] | |
| Mixing entropy | [83] | |
| Difference in atomic radii | [83] | |
| Valence electron concentration | [84] | |
| Electronegativity difference | [85] | |
| FCC, BCC, IMC | Phase | [22,23,24,25,26,27,28,29,30,31,32,33,34,35,36,37,38,39,40,41,42,43,44,45,46,47,48,49,50,51,52,53,54,55,56,57,58,59,60,61,62,63,64,65,66,67,68,69,70,71,72,73,74,75,76,77,78,79,80,81,82] |
| Parameter | Phase Structure Model | Yield Strength Model | Hardness Model |
|---|---|---|---|
| n_estimators | 100 | 300 | 100 |
| max_depth | 10 | 20 | 10 |
| min_samples_split | 2 | 2 | 2 |
| min_samples_leaf | 1 | 1 | 1 |
| max_features | 0.8 | sqrt(features) | sqrt(features) |
| bootstrap | True | True | True |
| Cross-Validation | Stratified K-Fold (K = 3) | K-Fold (K = 4) | K-Fold (K = 5) |
| Model | Accuracy/R2 | RMSE |
|---|---|---|
| Phase structure | 0.92 | / |
| Yield strength | 0.91 | 117.62 MPa |
| Hardness | 0.90 | 48.91 HV |
| Phase | Linear Fit | Quadratic Fit |
|---|---|---|
| BCC | ||
| BCC + IMC | ||
| FCC | ||
| FCC + BCC | ||
| FCC + BCC + IMC | ||
| FCC + IMC |
| Phase | R2 of Linear Fit | R2 of Quadratic Fit | R2 of ANN Fit |
|---|---|---|---|
| BCC | 0.769 | 0.779 | 0.771 |
| BCC + IMC | 0.159 | 0.177 | 0.465 |
| FCC | 0.351 | 0.355 | 0.344 |
| FCC + BCC | 0.369 | 0.445 | 0.299 |
| FCC + BCC + IMC | 0.670 | 0.671 | 0.632 |
| FCC + IMC | 0.623 | 0.623 | 0.670 |
Disclaimer/Publisher’s Note: The statements, opinions and data contained in all publications are solely those of the individual author(s) and contributor(s) and not of MDPI and/or the editor(s). MDPI and/or the editor(s) disclaim responsibility for any injury to people or property resulting from any ideas, methods, instructions or products referred to in the content. |
© 2025 by the authors. Licensee MDPI, Basel, Switzerland. This article is an open access article distributed under the terms and conditions of the Creative Commons Attribution (CC BY) license (https://creativecommons.org/licenses/by/4.0/).
Share and Cite
Wan, H.; Xie, B.; Feng, H.; Li, J. Machine Learning-Enabled Prediction and Mechanistic Analysis of Compressive Yield Strength–Hardness Correlation in High-Entropy Alloys. Metals 2025, 15, 487. https://doi.org/10.3390/met15050487
Wan H, Xie B, Feng H, Li J. Machine Learning-Enabled Prediction and Mechanistic Analysis of Compressive Yield Strength–Hardness Correlation in High-Entropy Alloys. Metals. 2025; 15(5):487. https://doi.org/10.3390/met15050487
Chicago/Turabian StyleWan, Haiyu, Baobin Xie, Hui Feng, and Jia Li. 2025. "Machine Learning-Enabled Prediction and Mechanistic Analysis of Compressive Yield Strength–Hardness Correlation in High-Entropy Alloys" Metals 15, no. 5: 487. https://doi.org/10.3390/met15050487
APA StyleWan, H., Xie, B., Feng, H., & Li, J. (2025). Machine Learning-Enabled Prediction and Mechanistic Analysis of Compressive Yield Strength–Hardness Correlation in High-Entropy Alloys. Metals, 15(5), 487. https://doi.org/10.3390/met15050487