
Numerical Simulation of the Effect of Pre-Strain on Fatigue Crack Growth in AA2024-T351


Abstract
1. Introduction
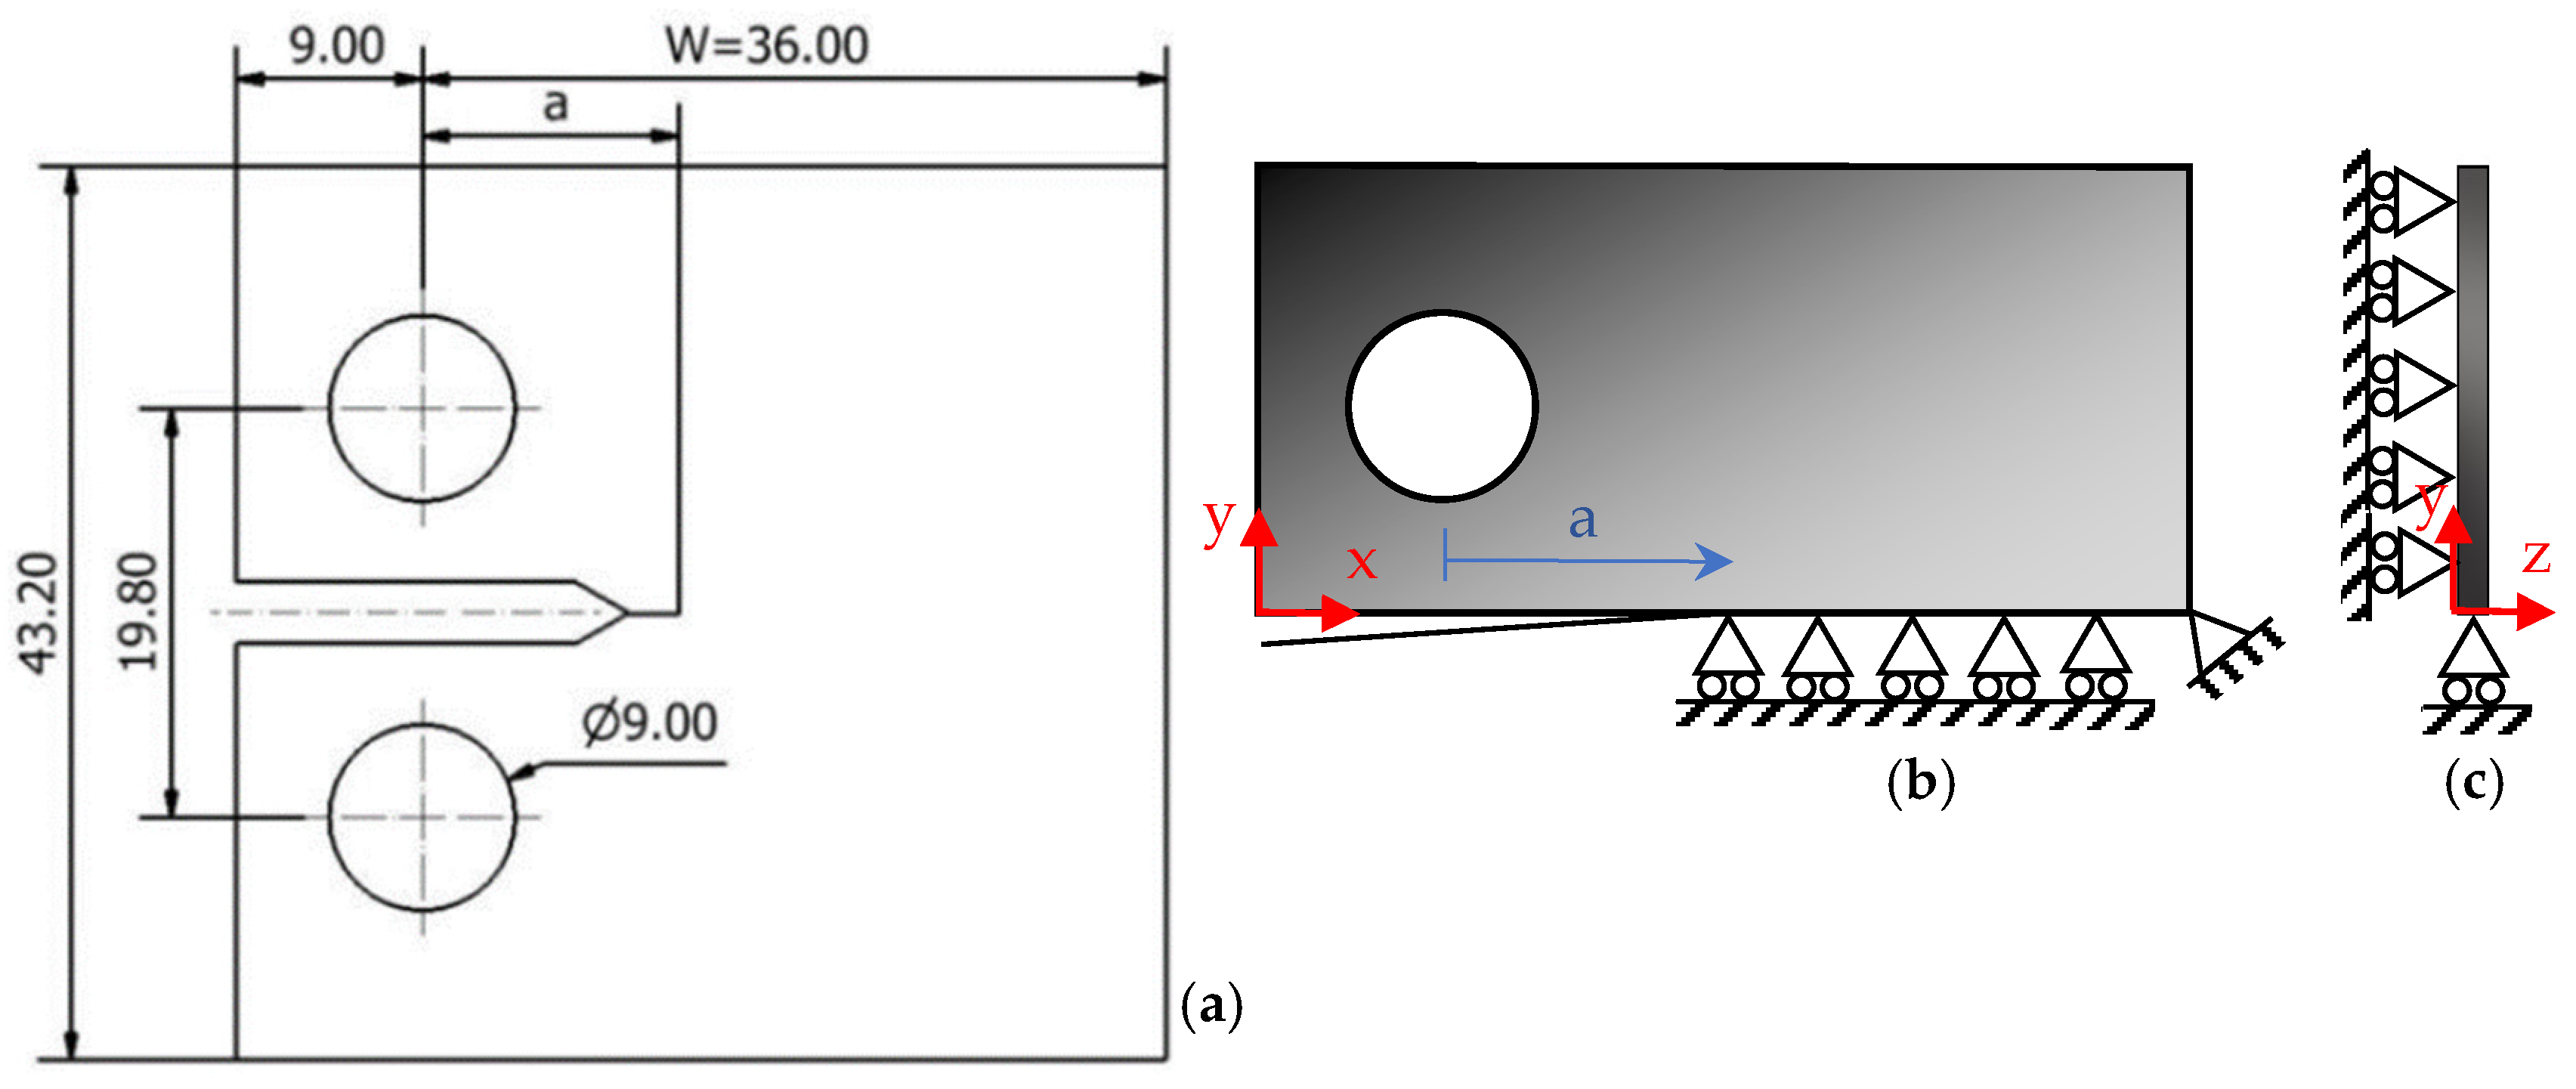
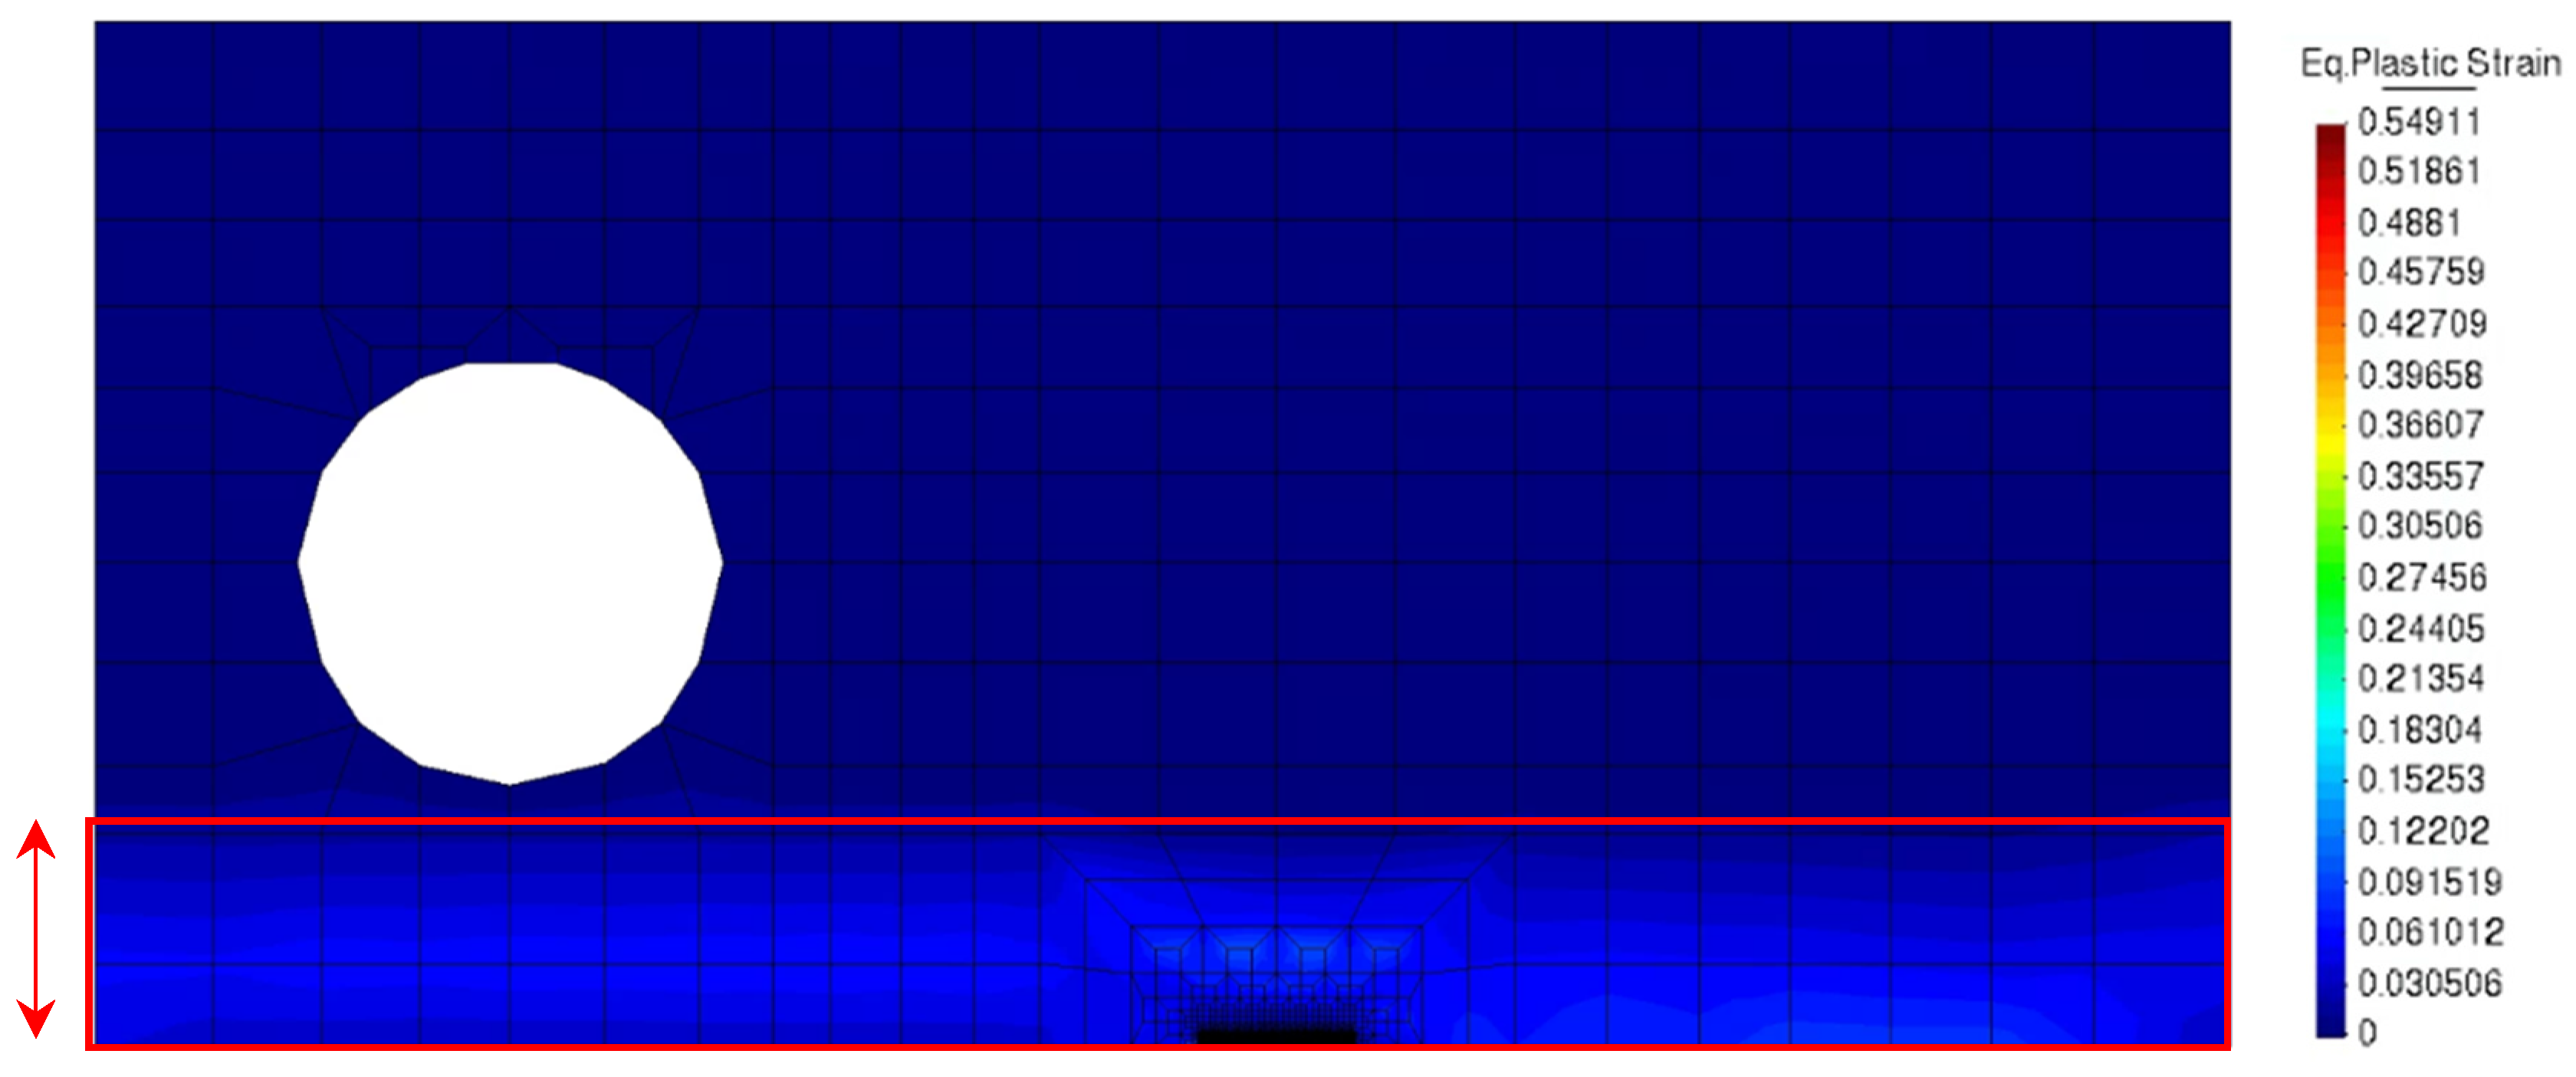
2. Numerical Model
3. Results
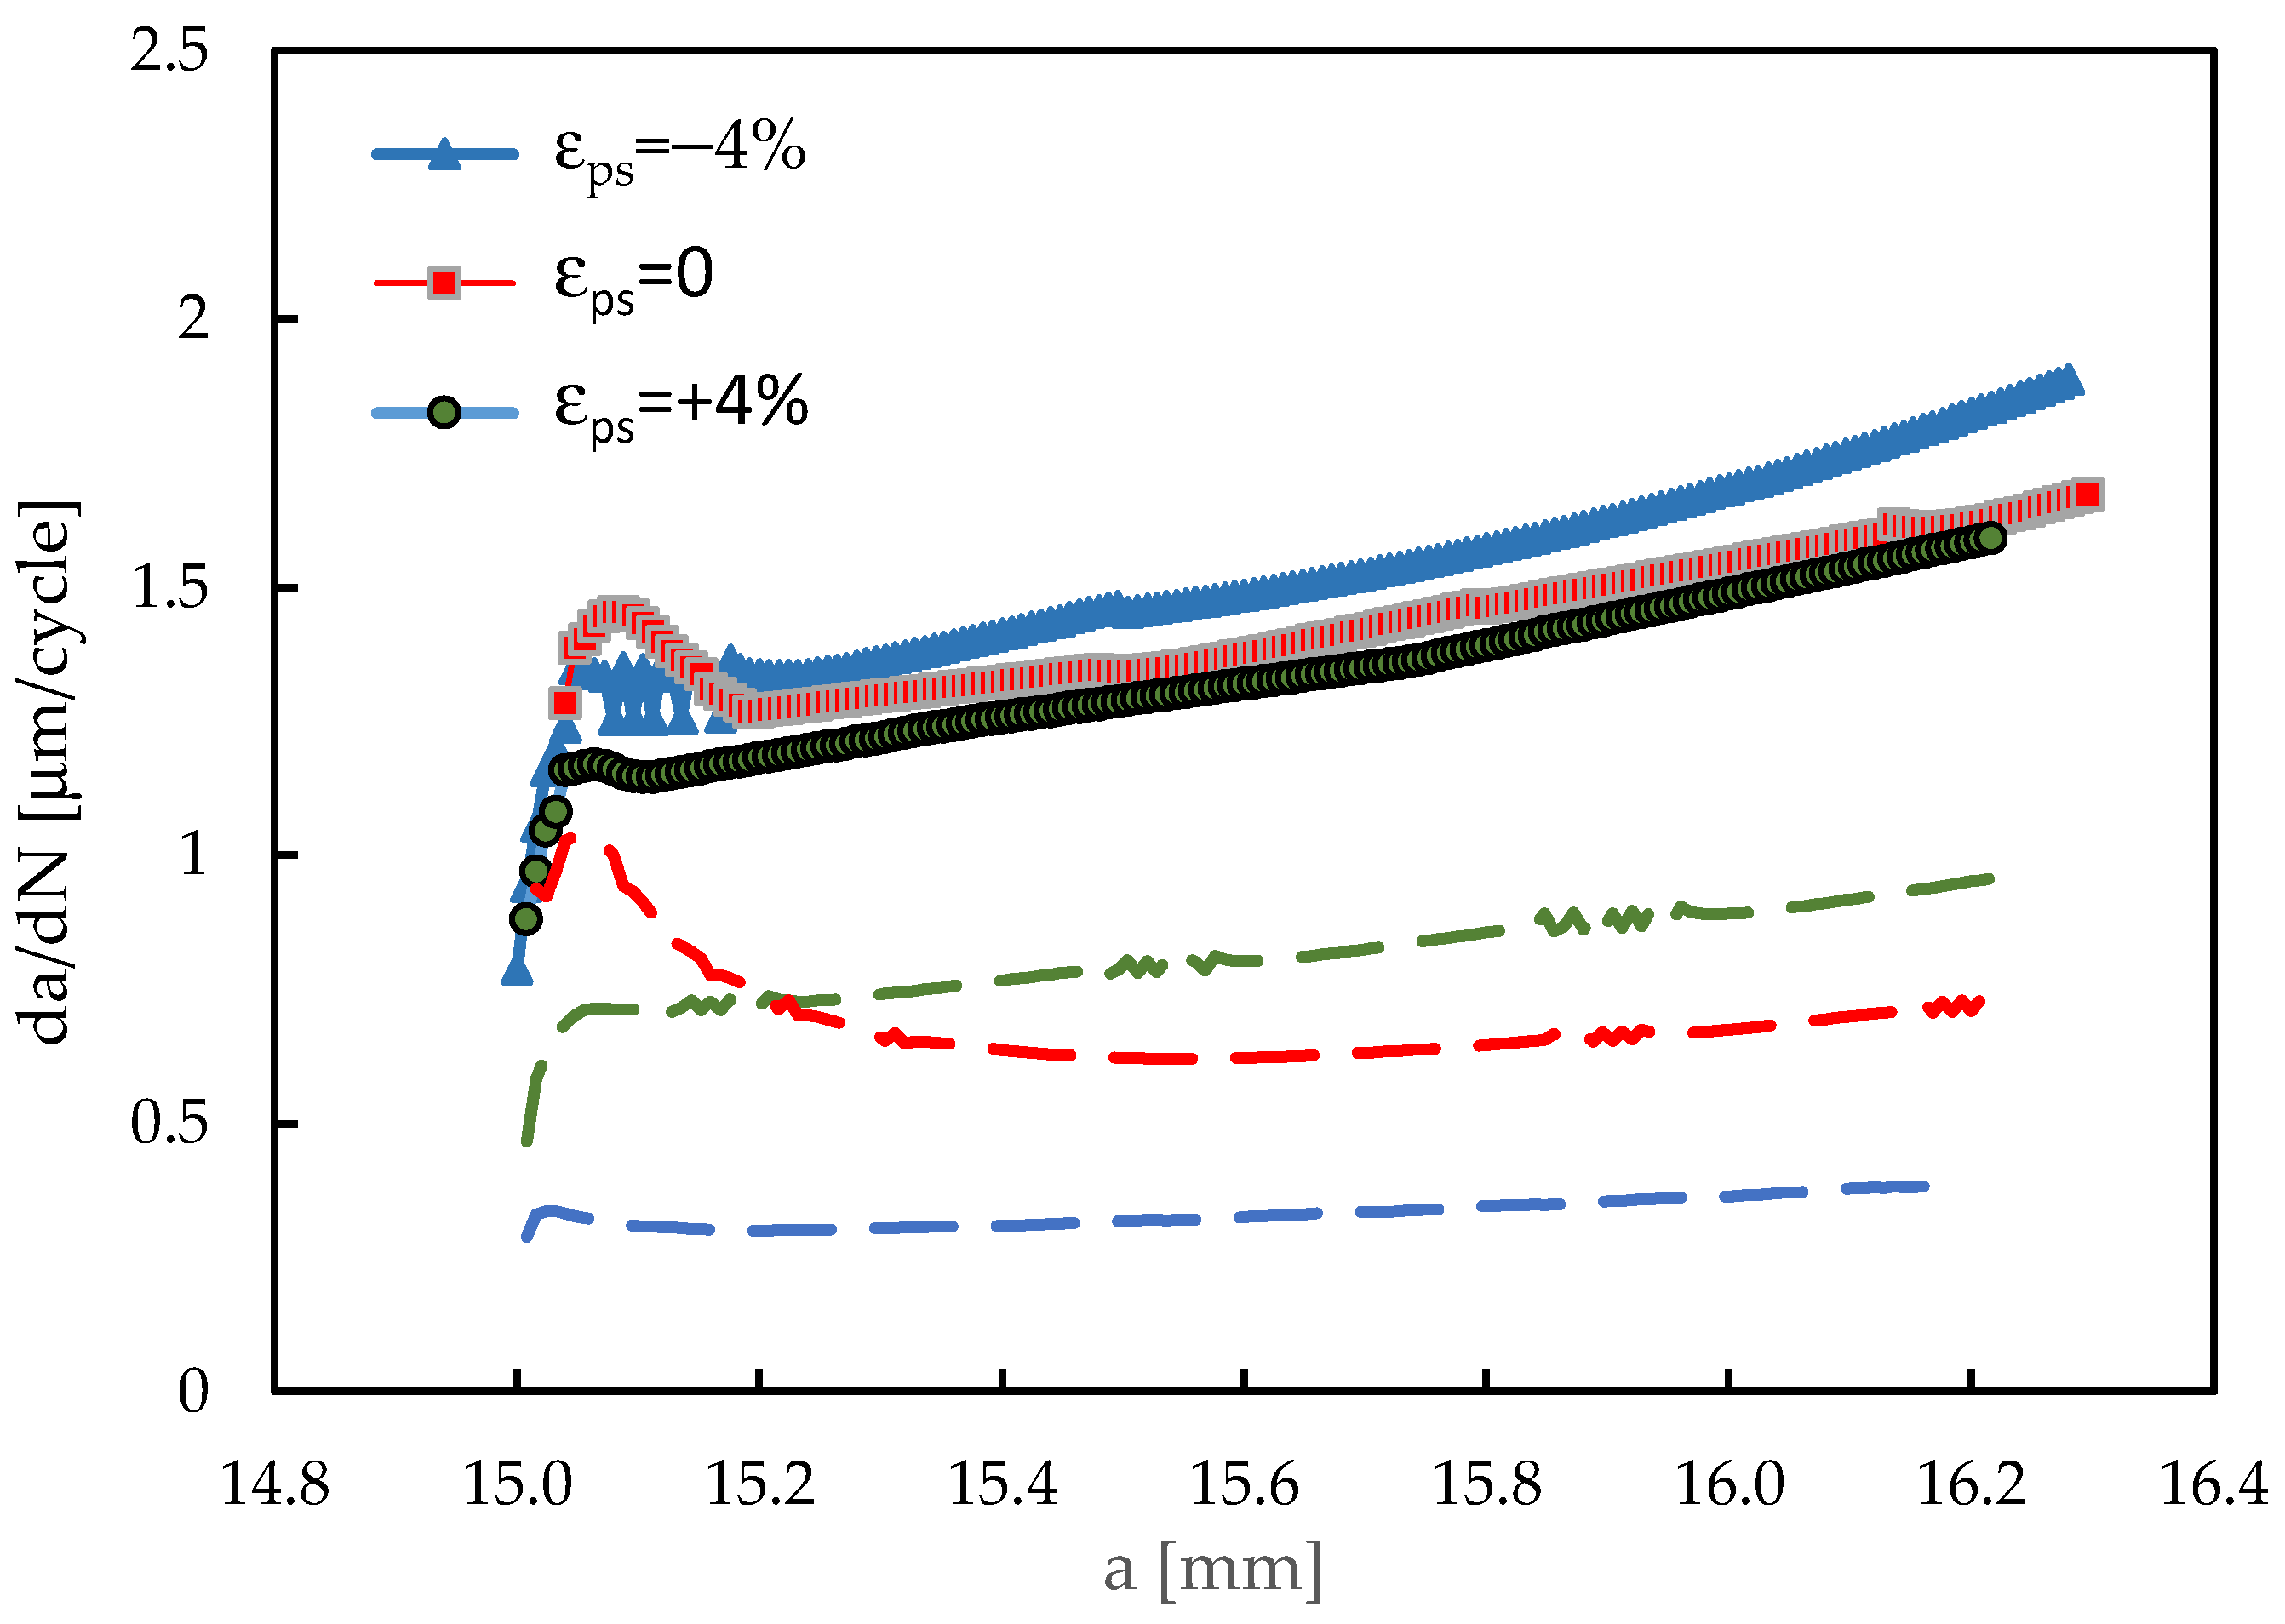
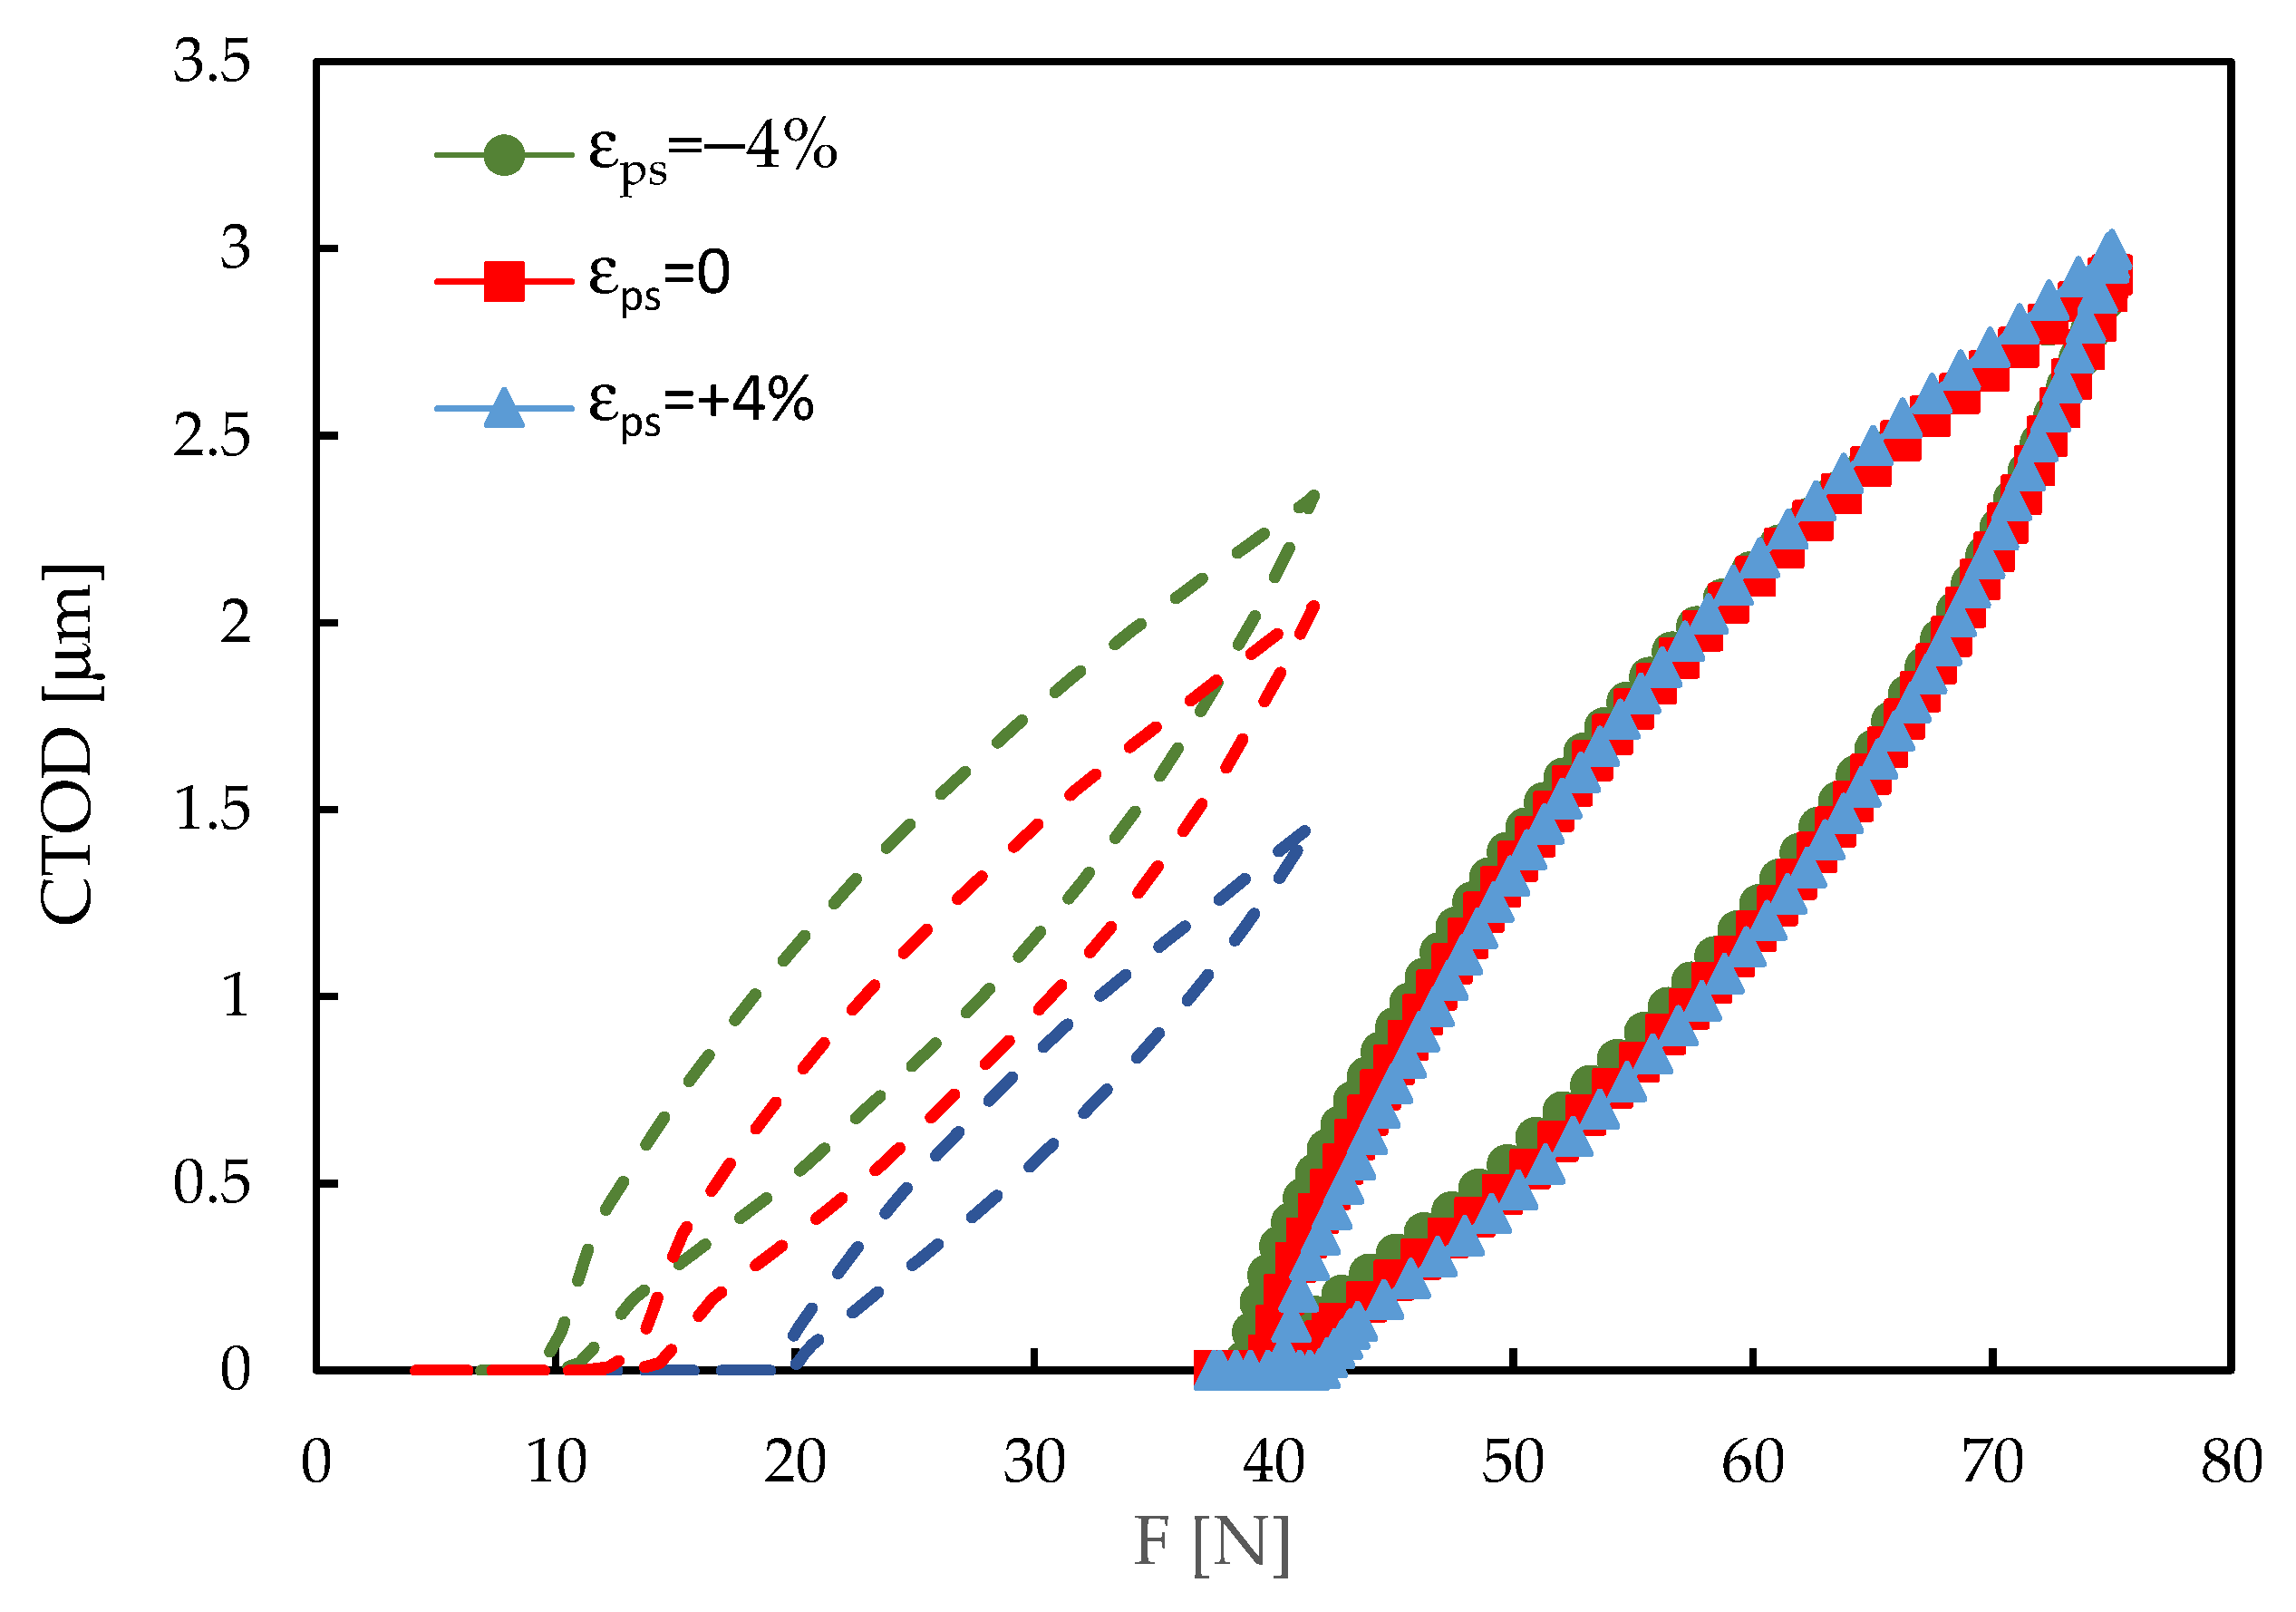
3.1. Effect of Pre-Strain on da/dN
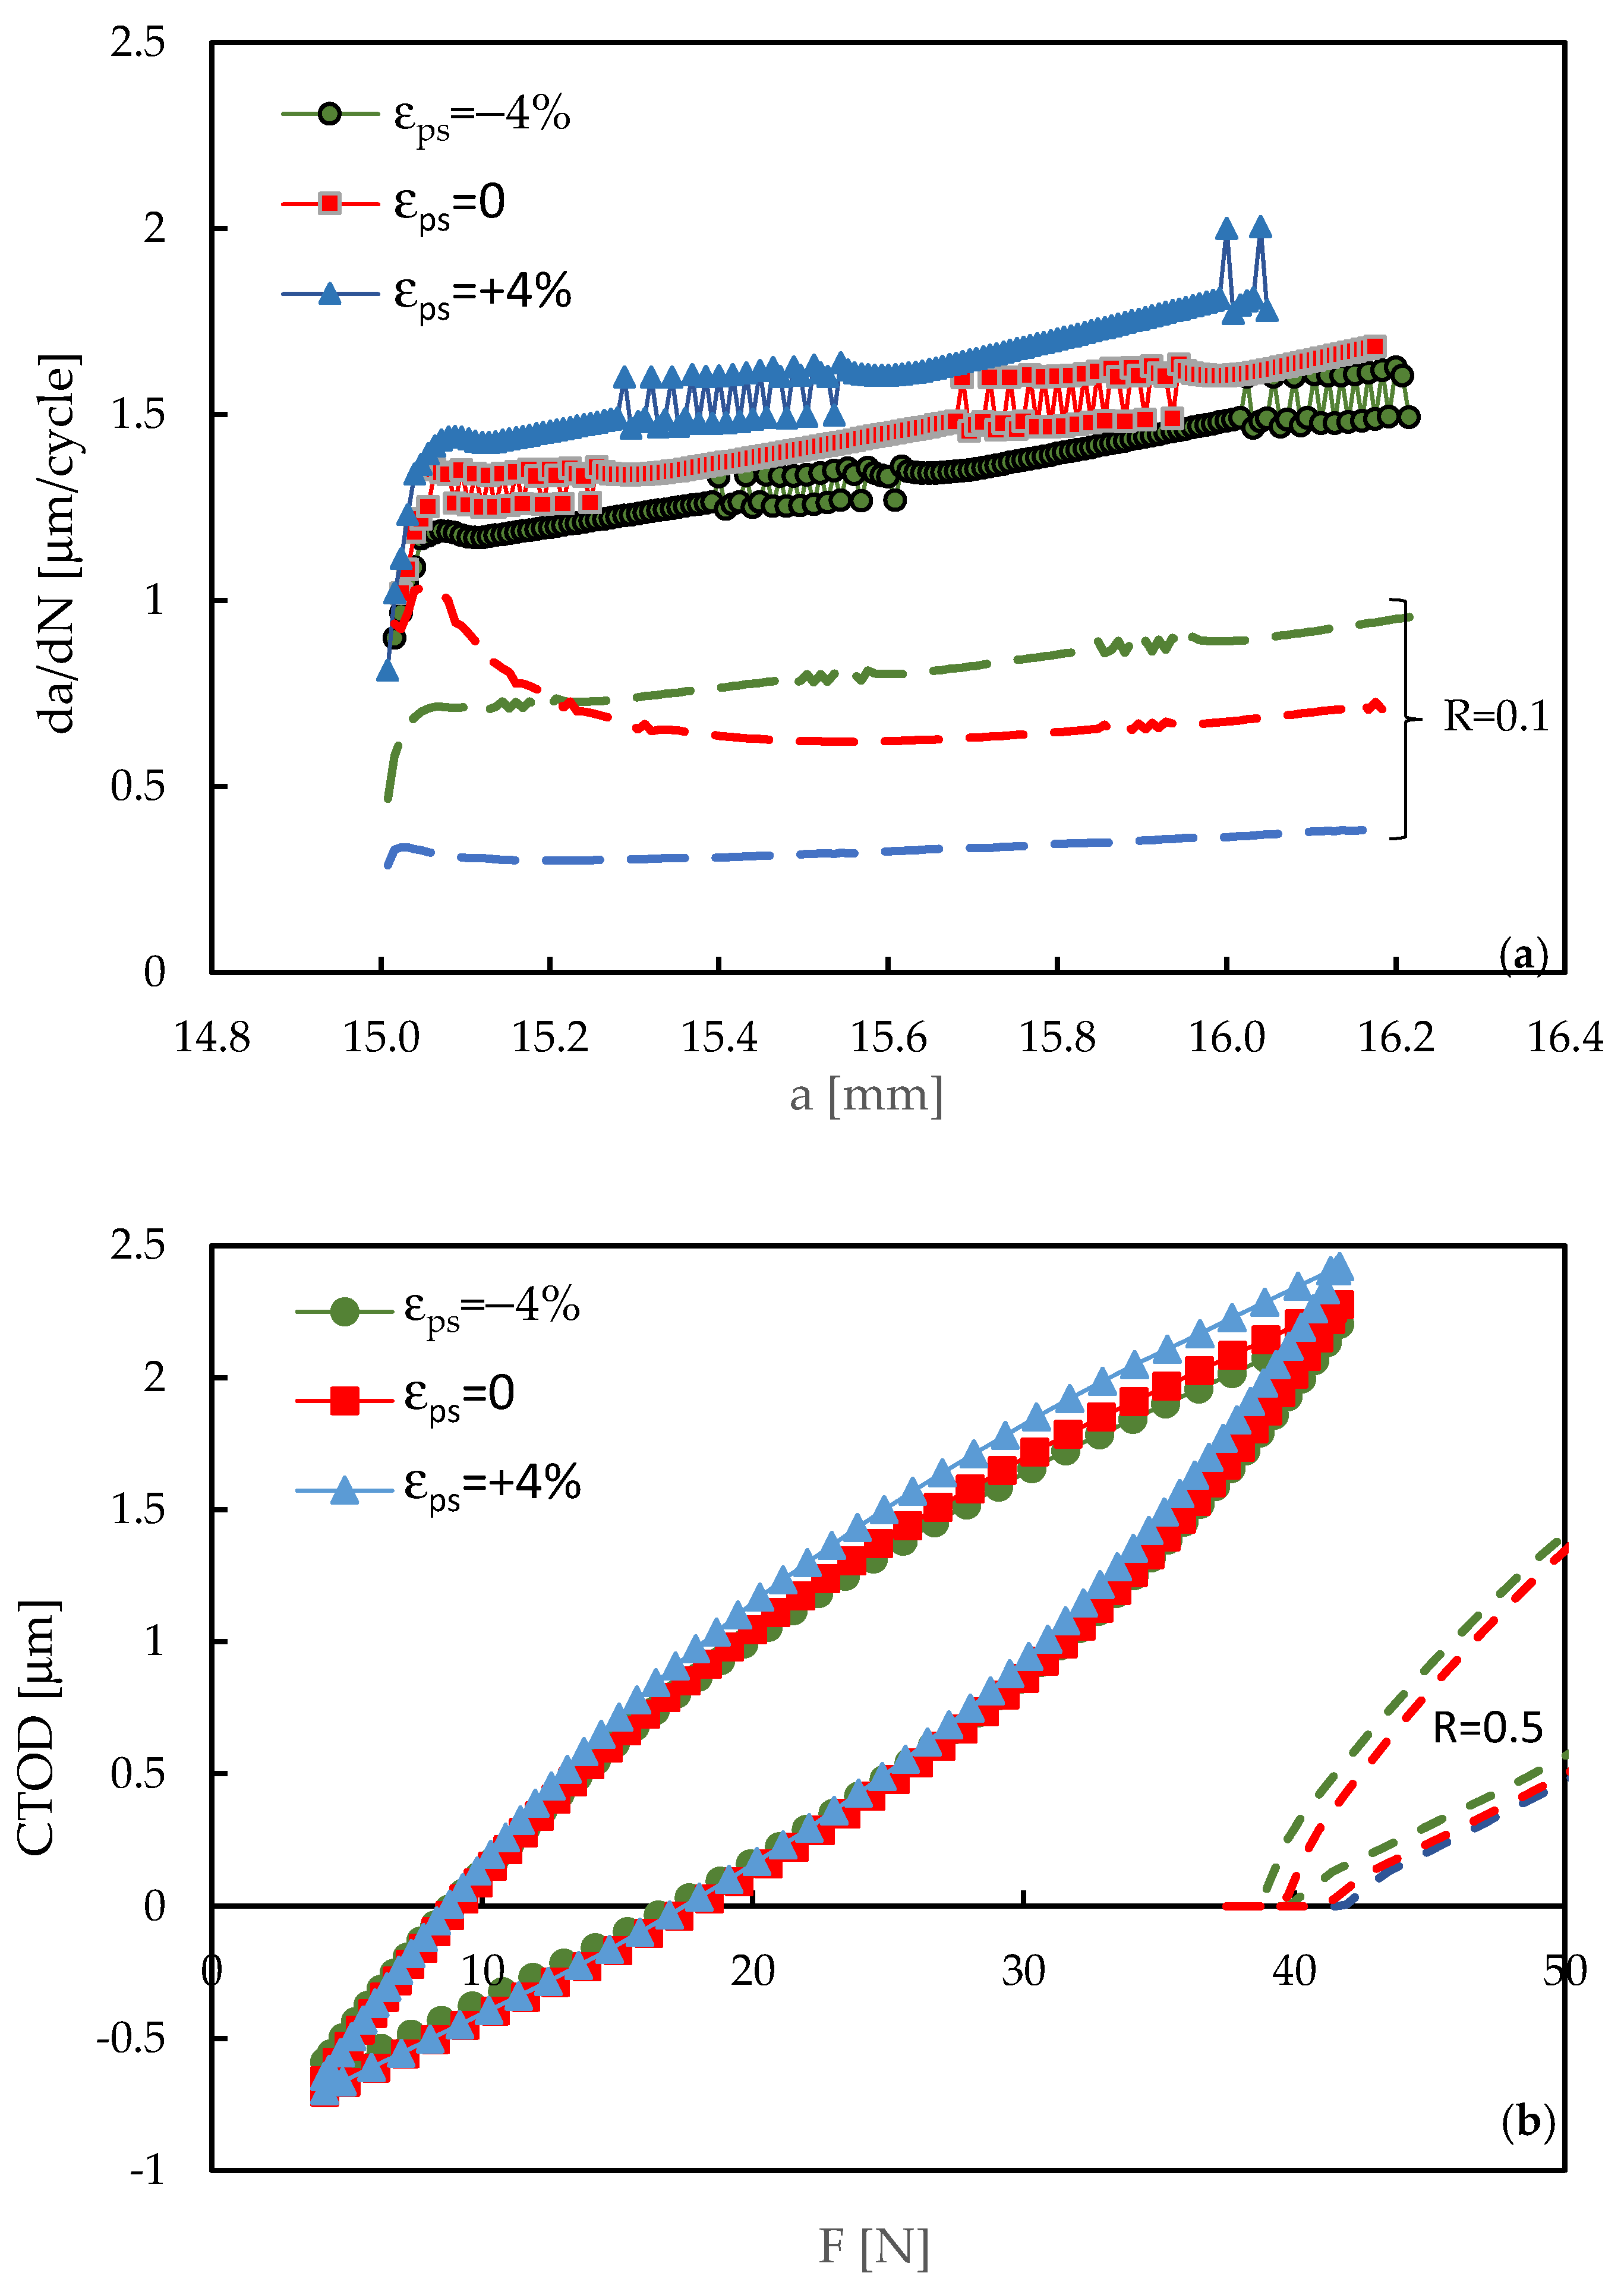
3.2. Influence of Stress Ratio on Pre-Strain Effect
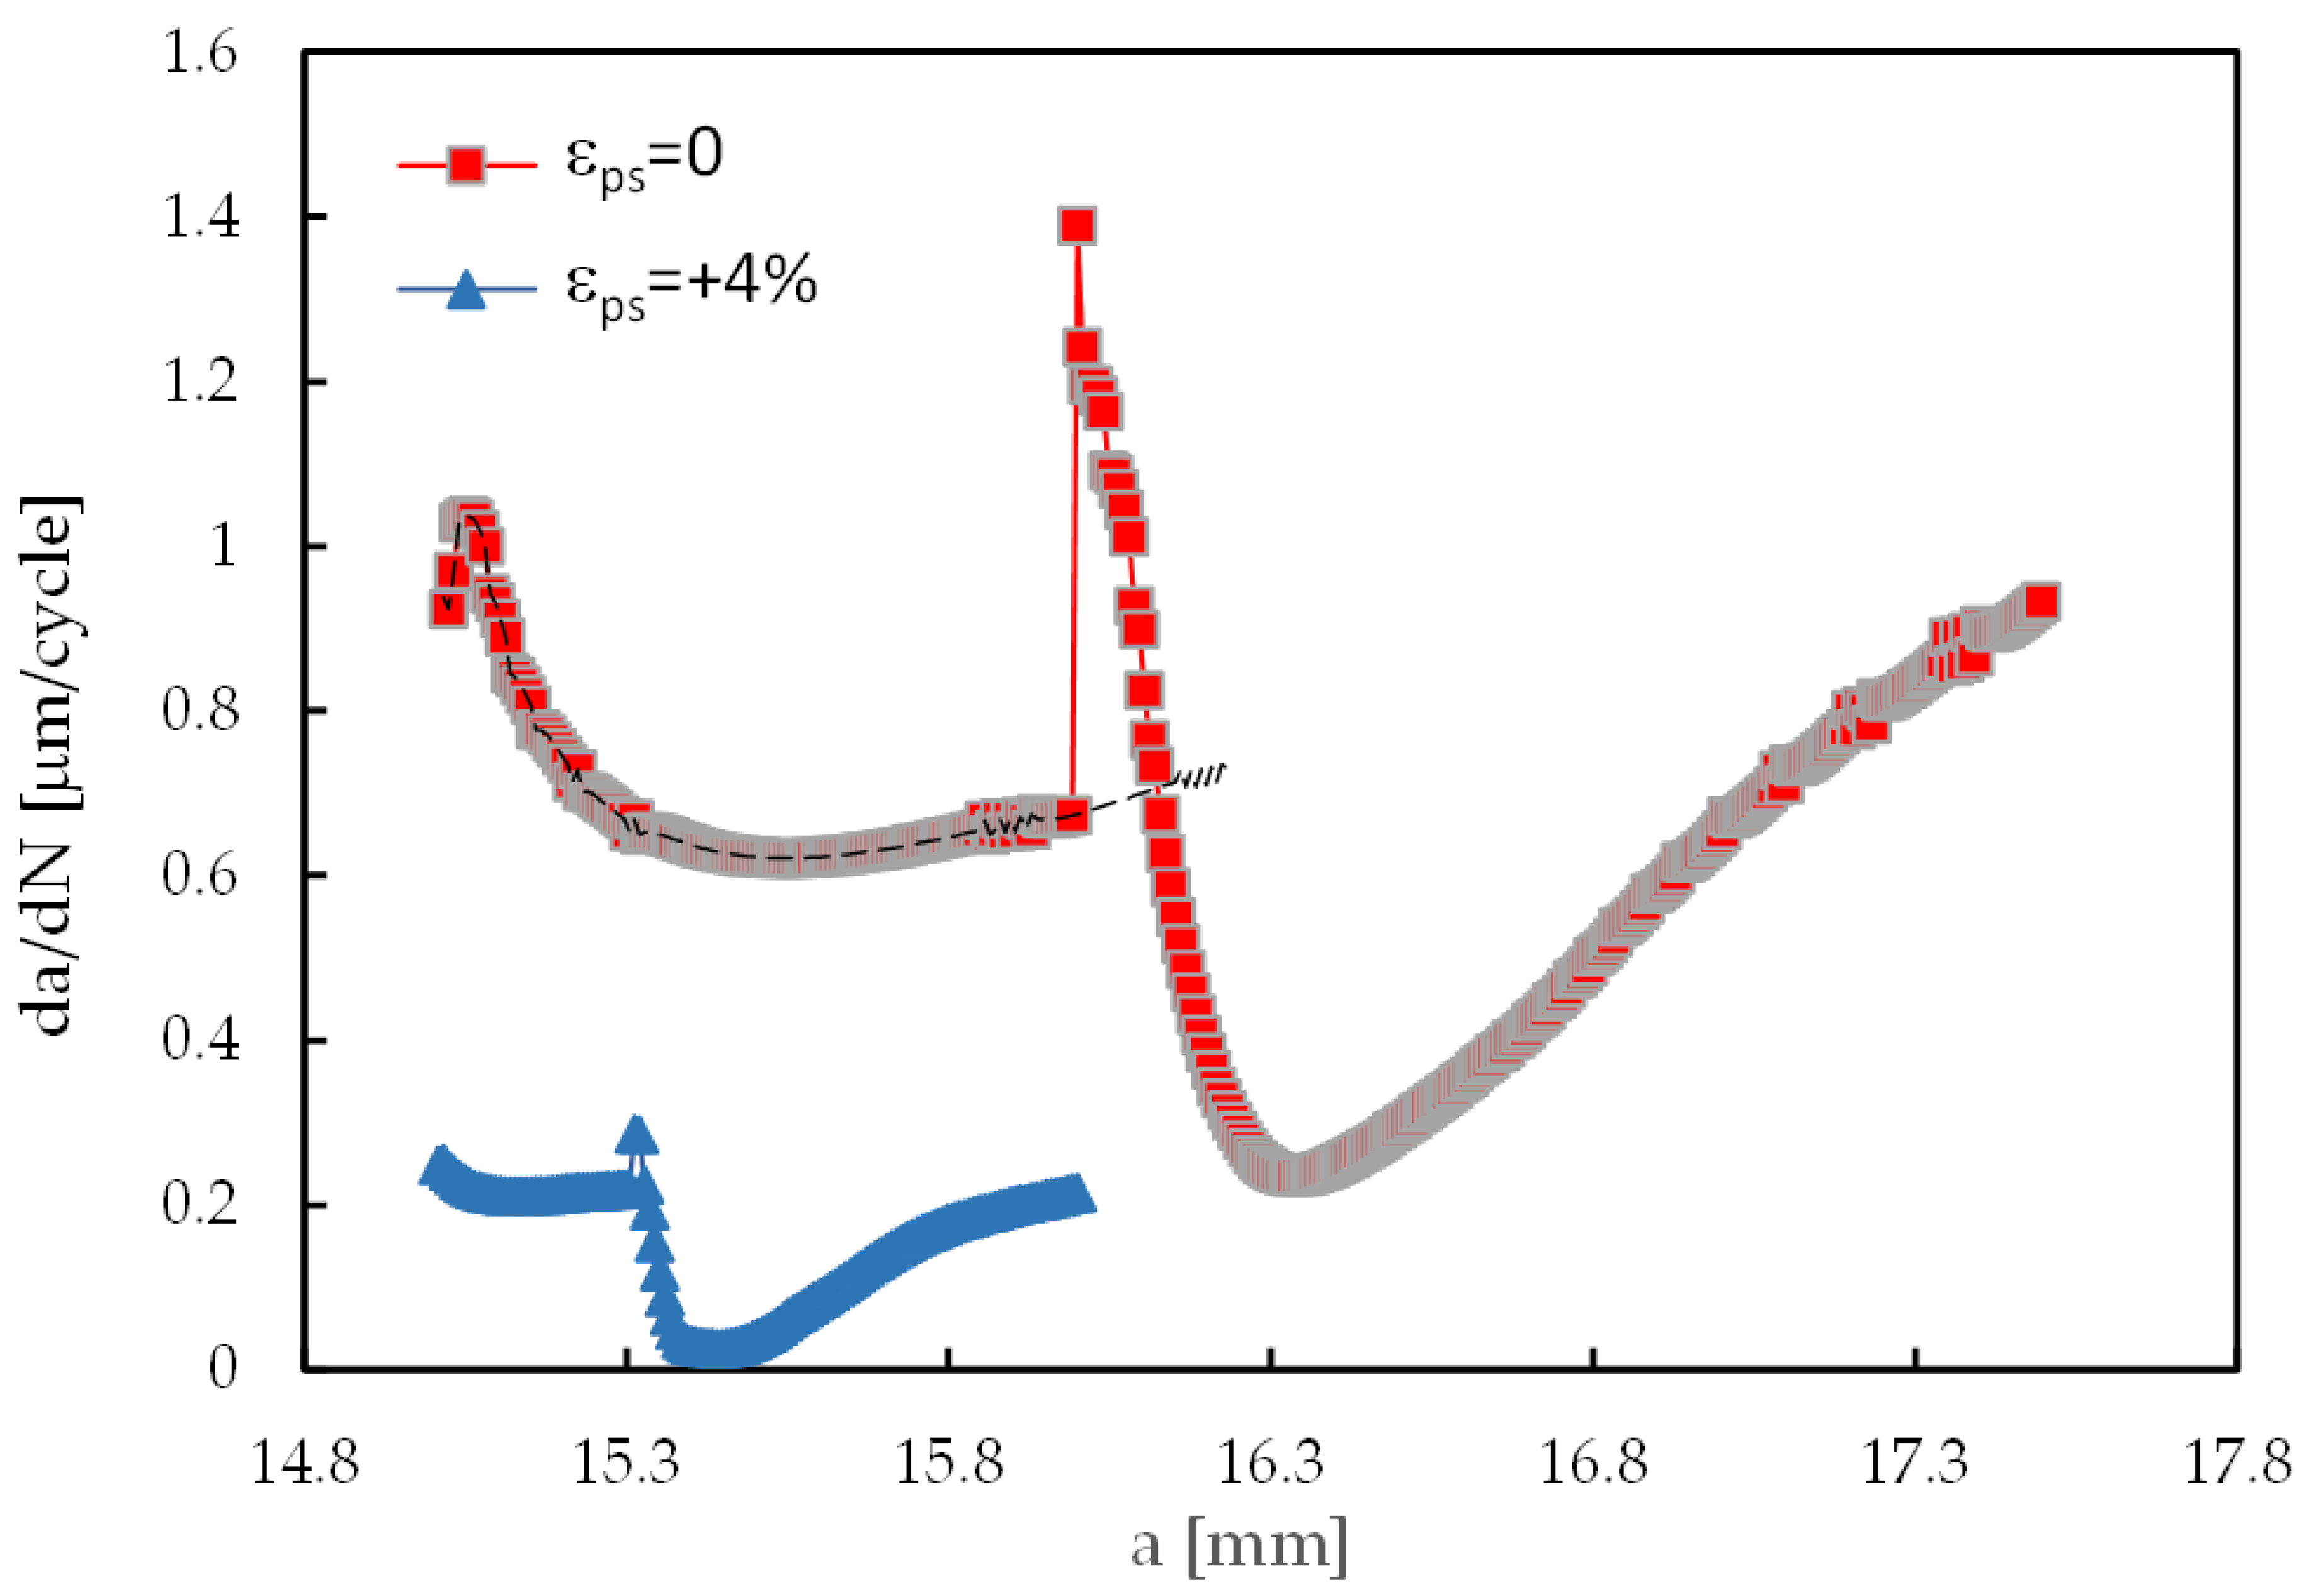
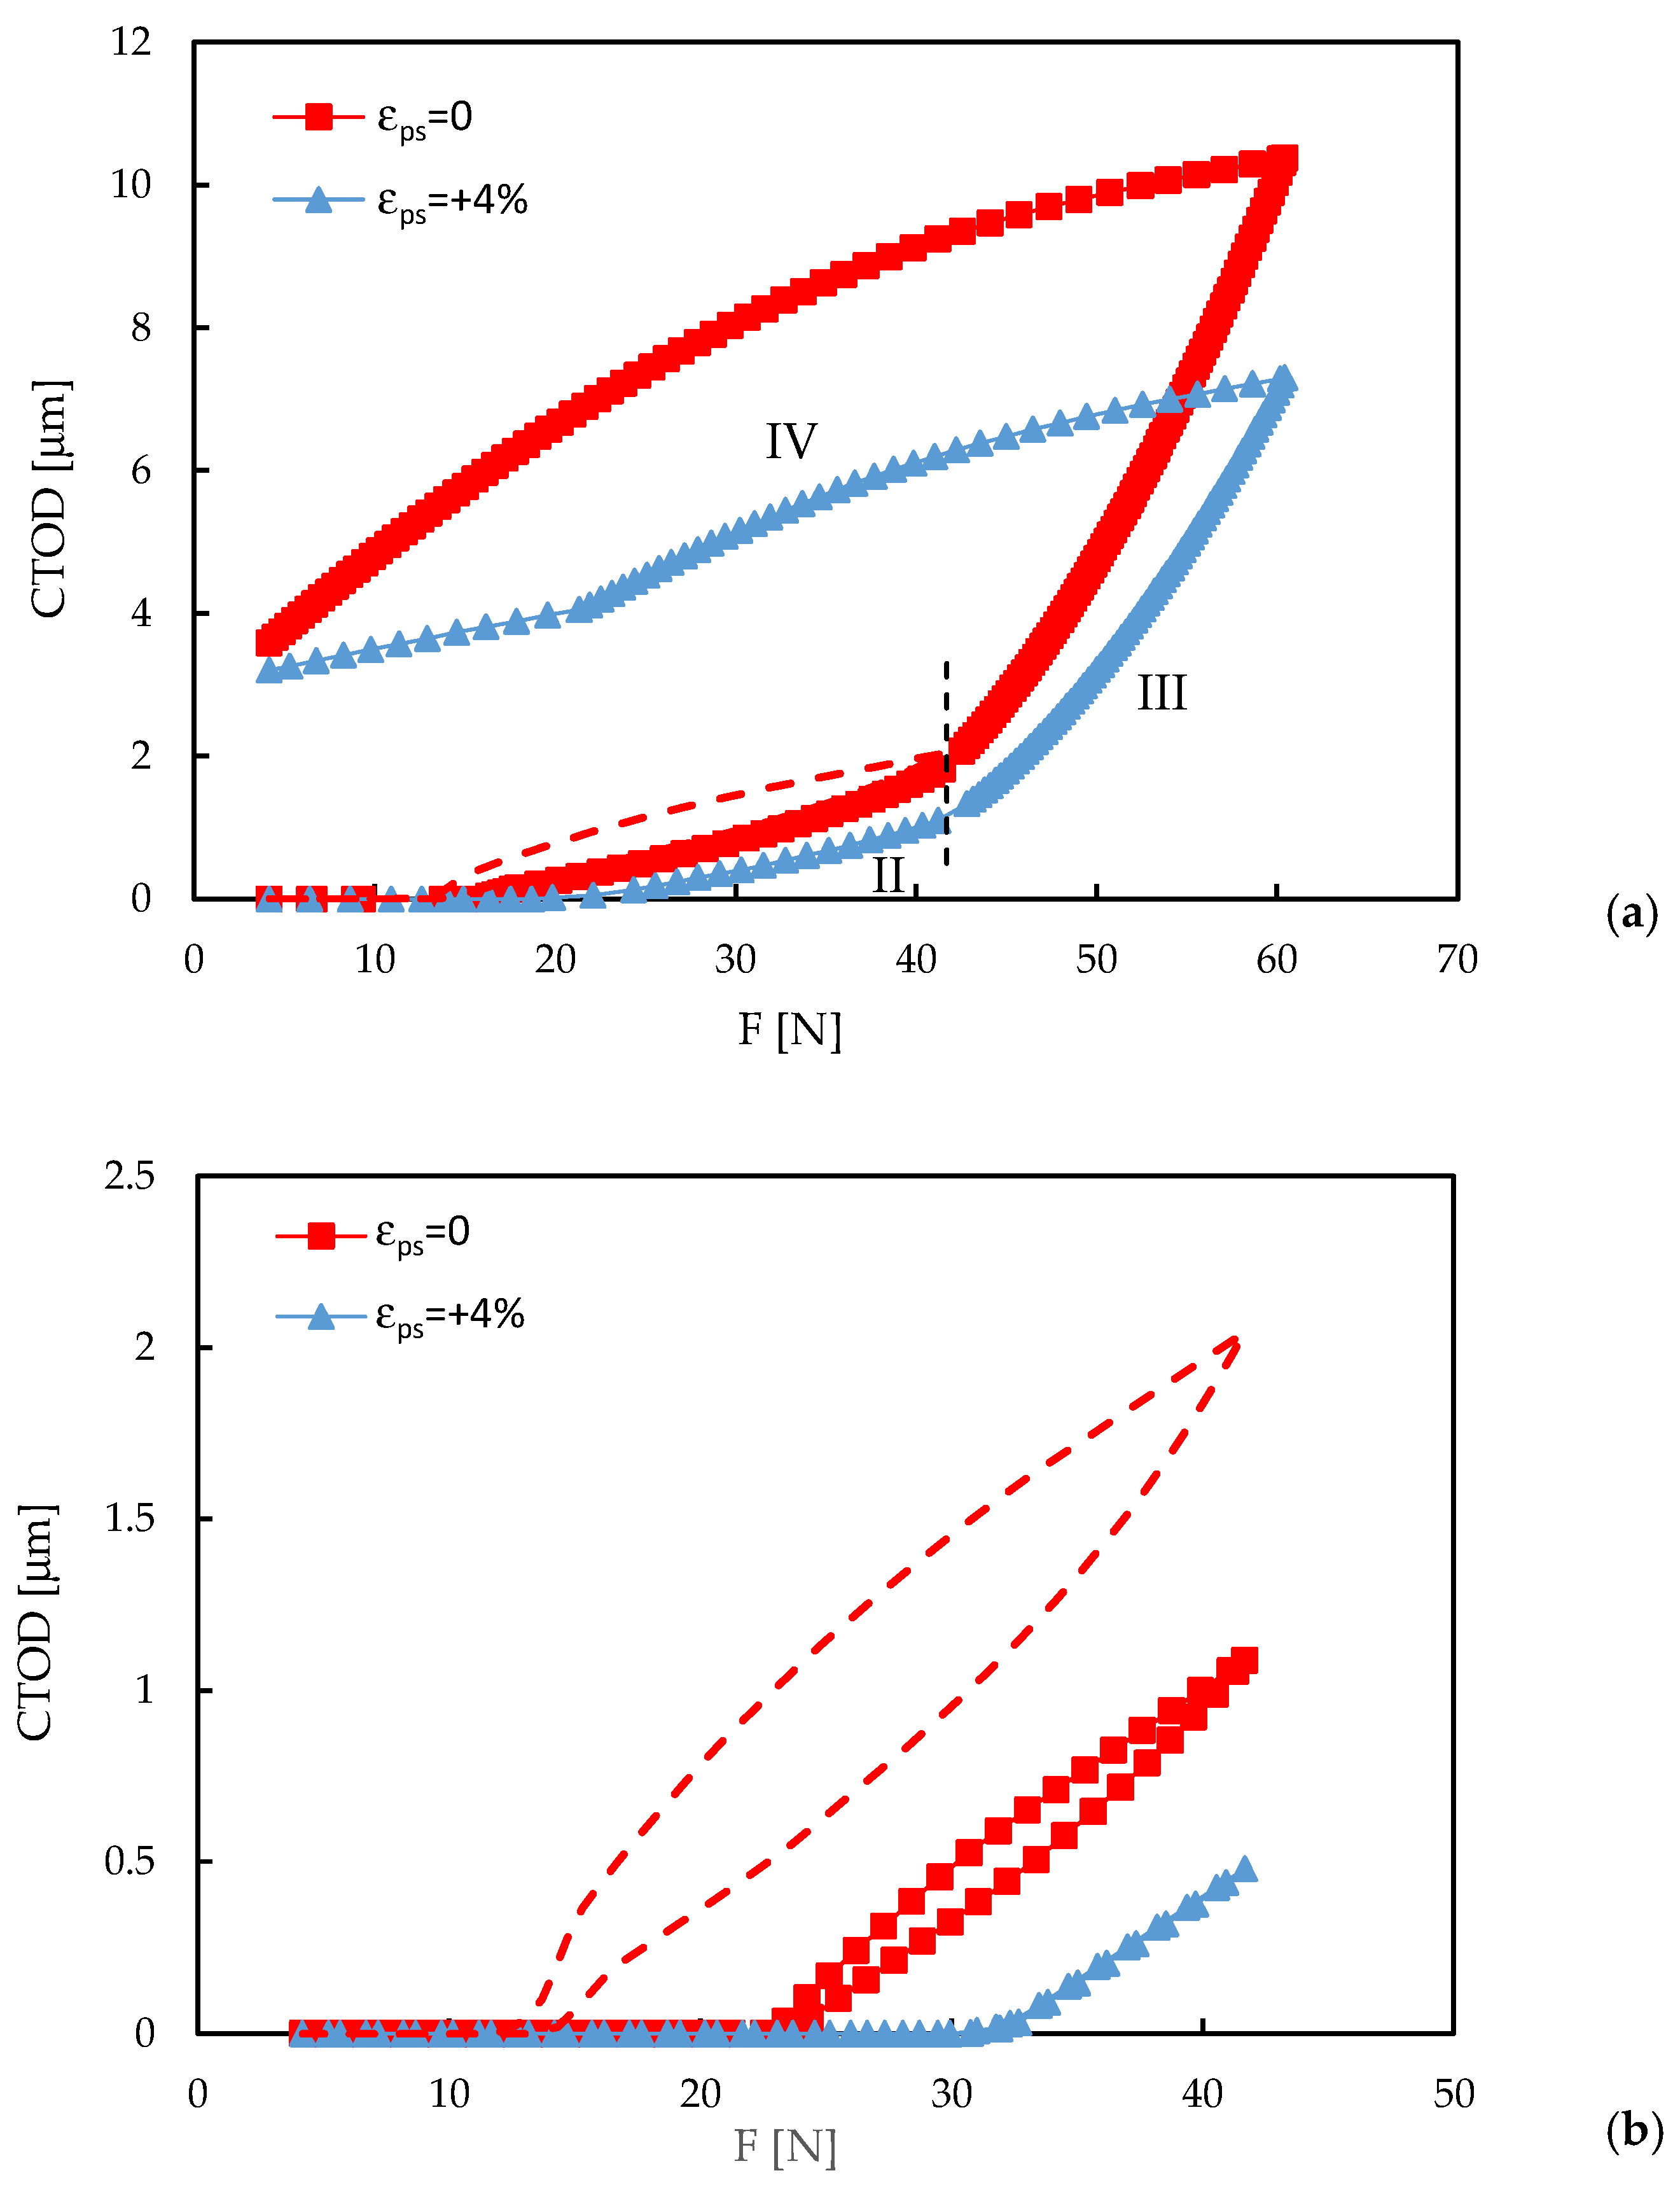
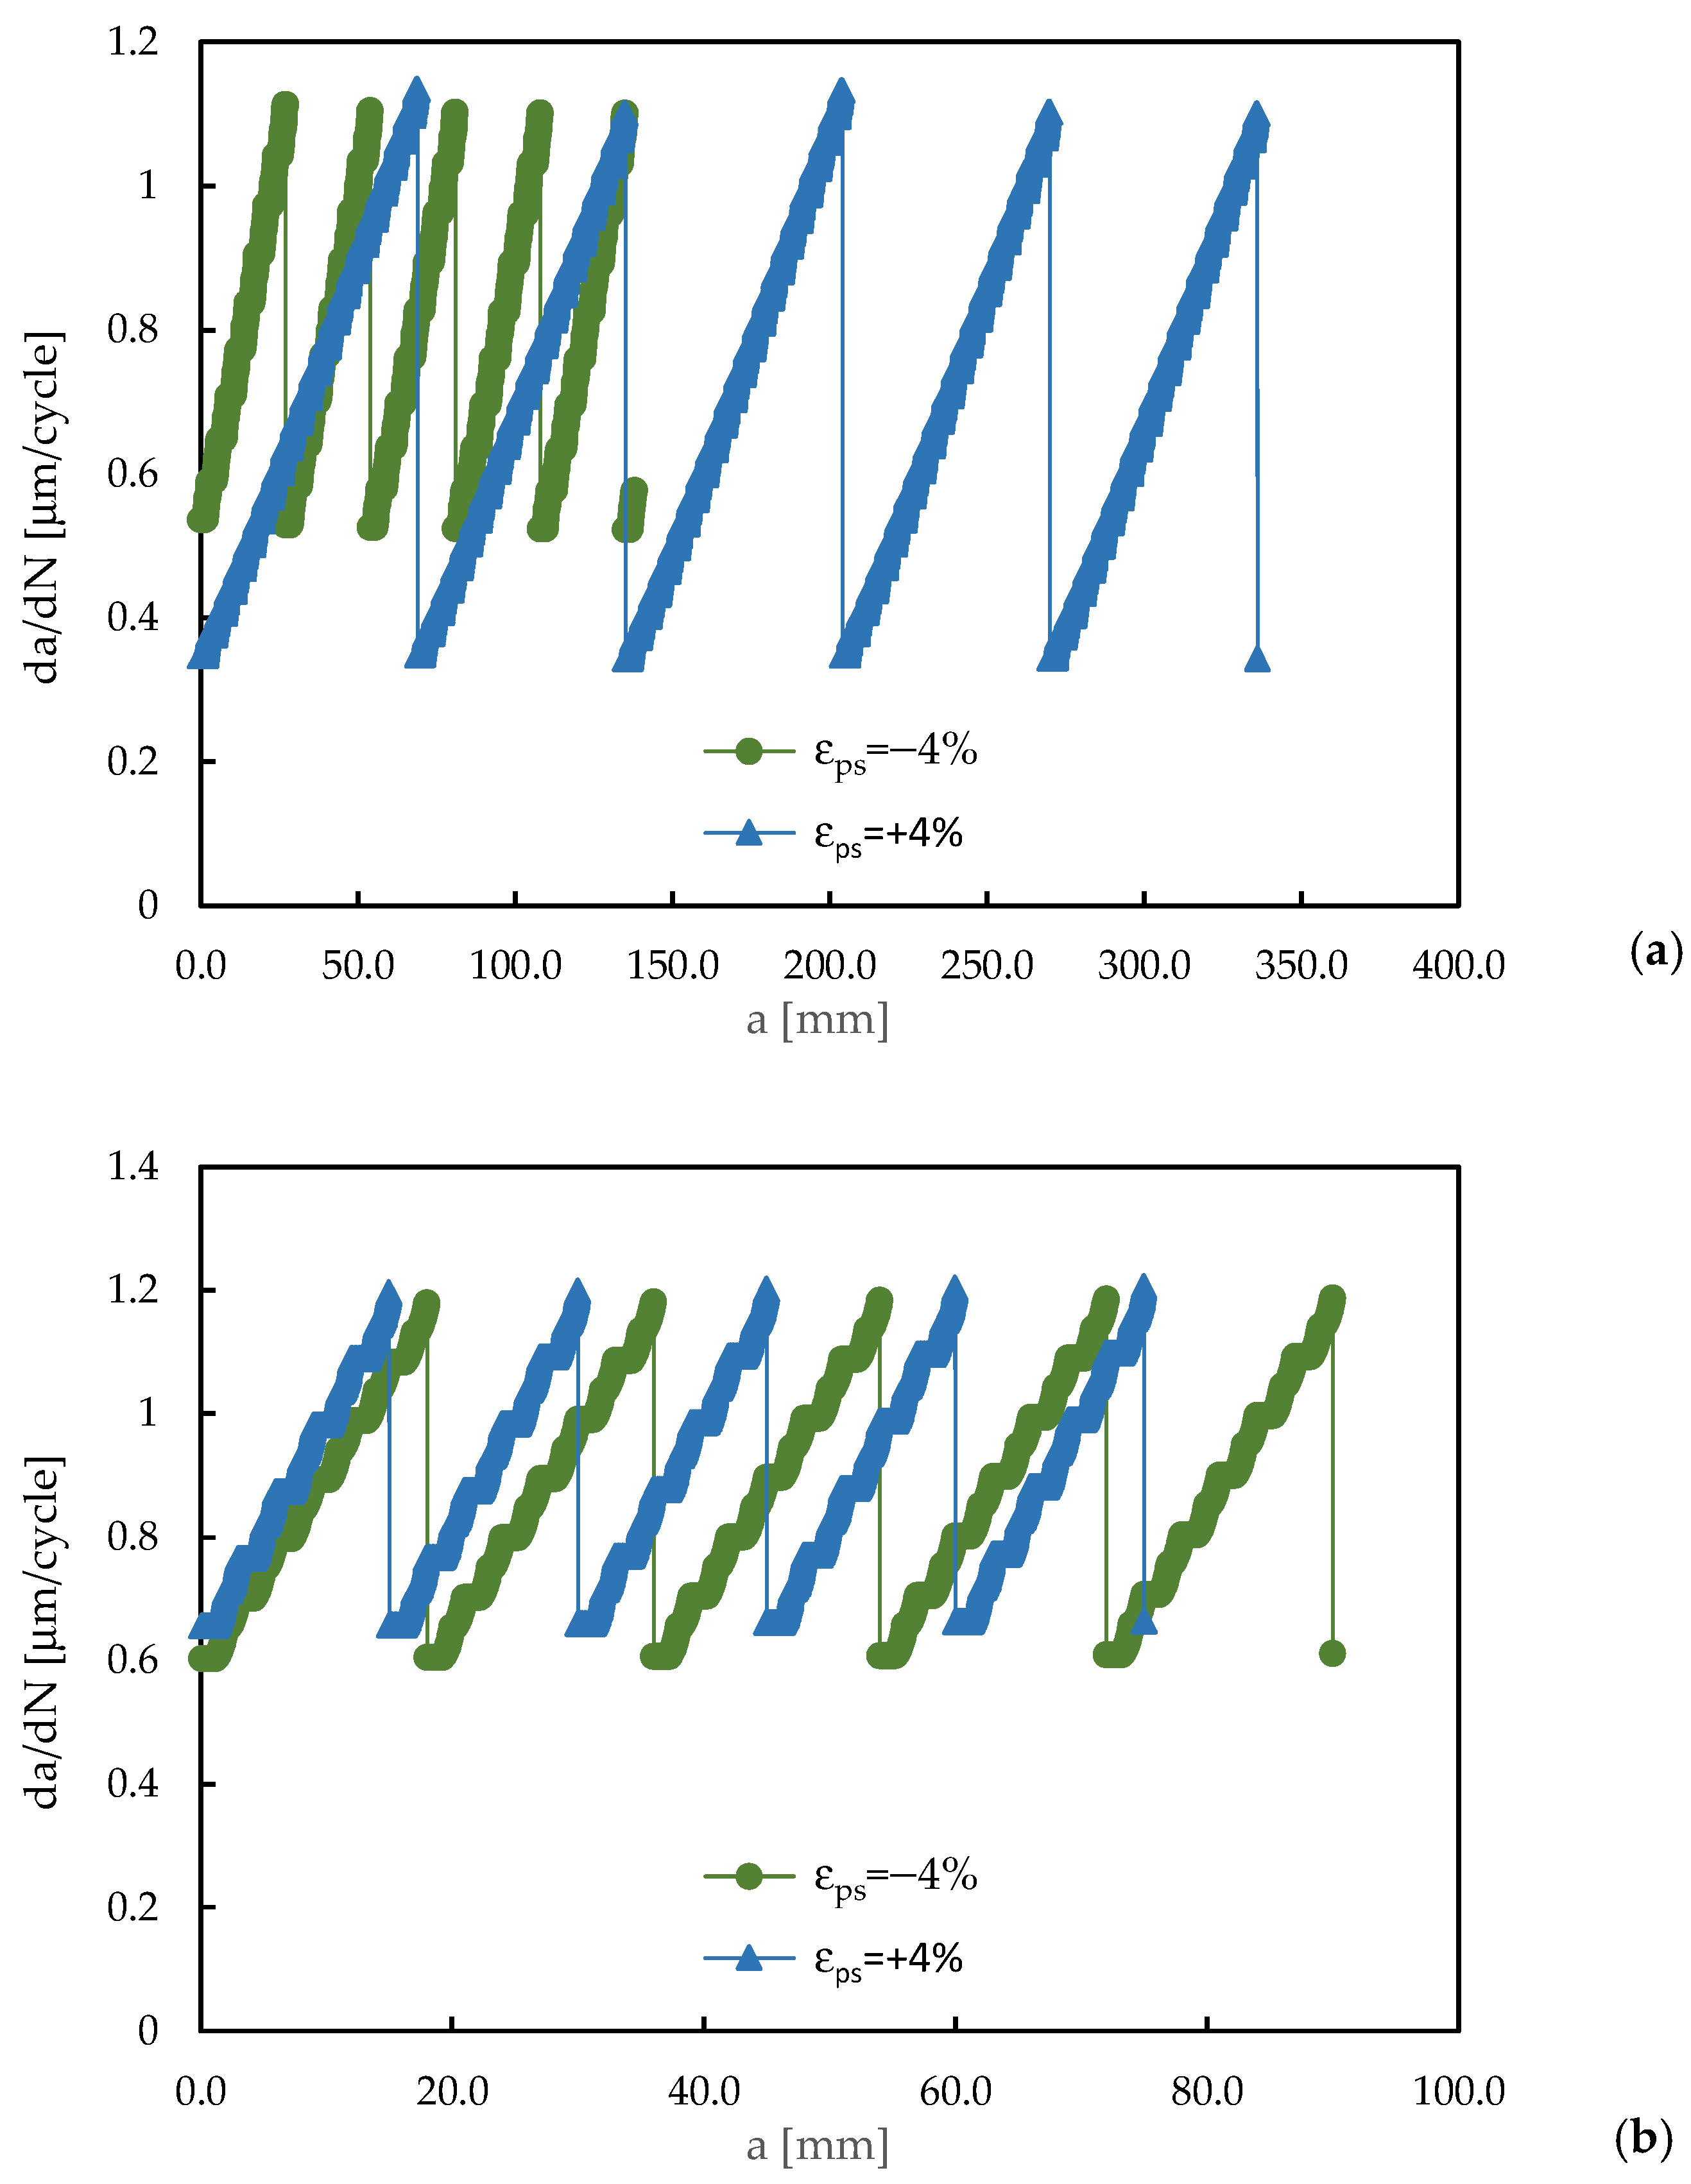
3.3. Effect of Pre-Strain on Variable Amplitude Loading
4. Discussion
5. Conclusions
Author Contributions
Funding
Data Availability Statement
Conflicts of Interest
Nomenclature
| a | Crack length |
| a0 | Initial crack length |
| AA | Aluminum alloy |
| CA | Constant amplitude |
| CT | Compact tension |
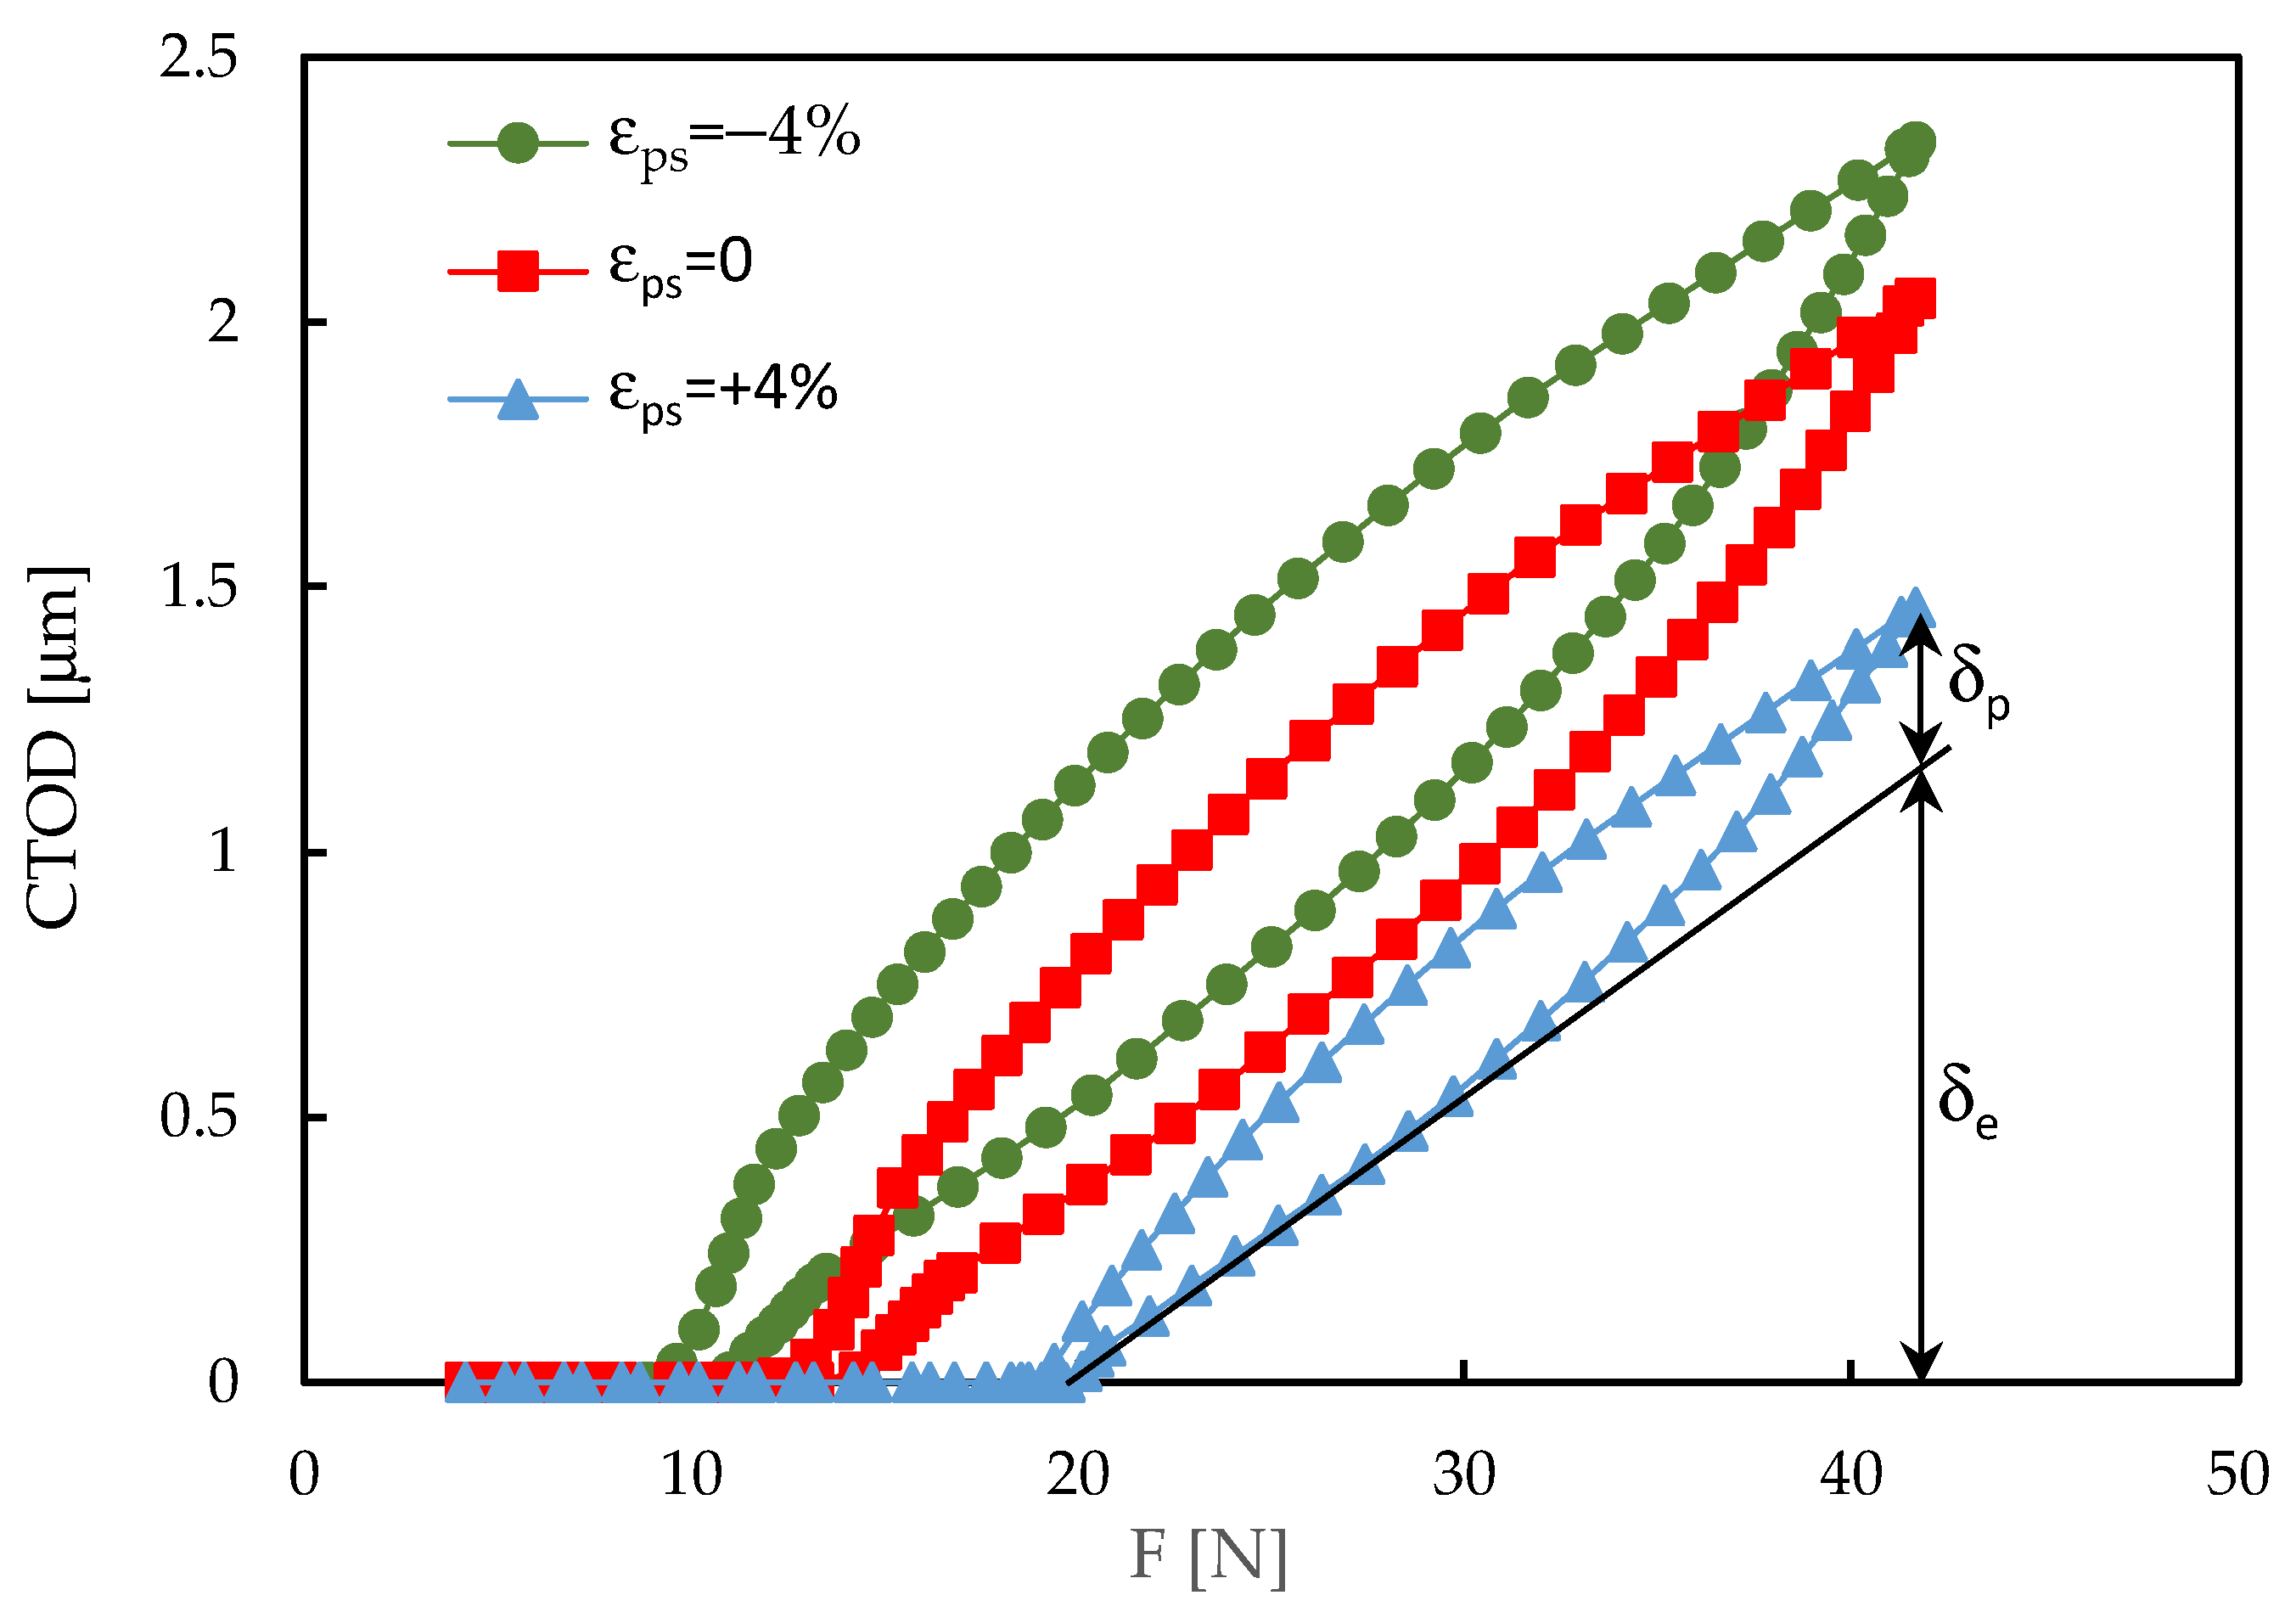
| CTOD | Crack tip opening displacement |
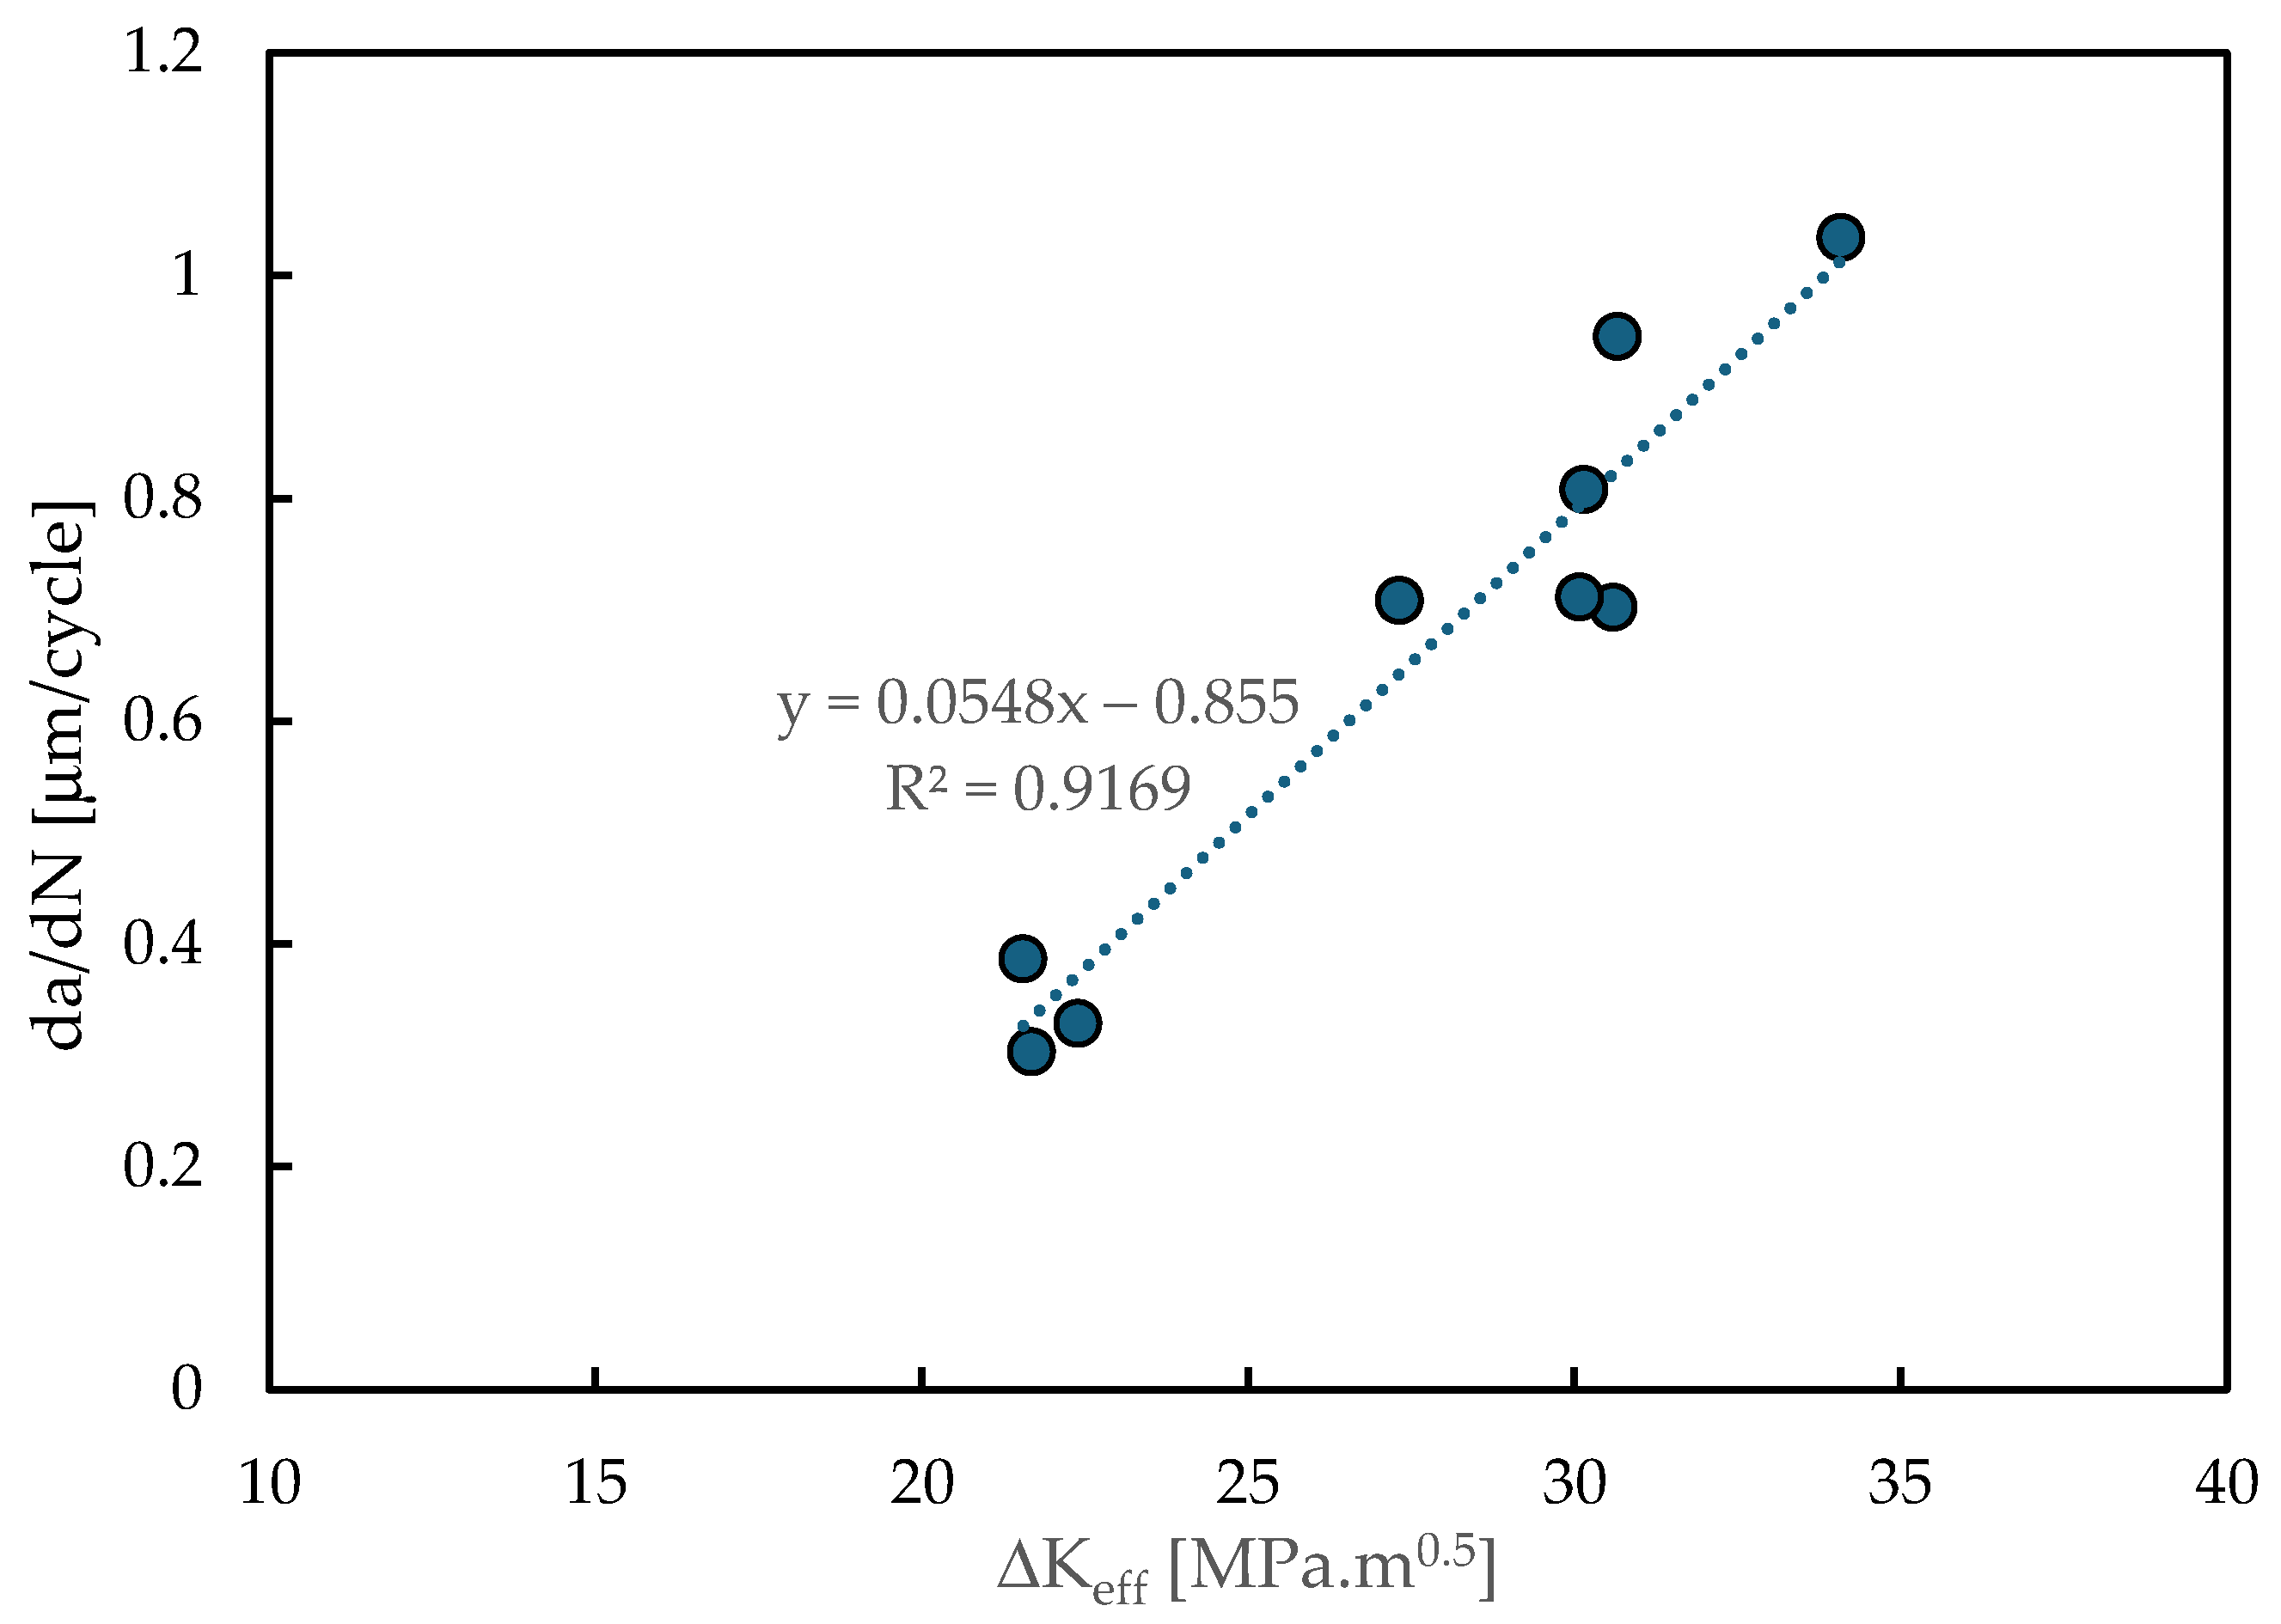
| da/dN | Fatigue crack growth rate |
| FCG | Fatigue crack growth |
| Fmax | Maximum force |
| Fmin | Minimum force |
| Fopen | Crack opening force |
| HCF | High-cycle fatigue |
| LCF | Low-cycle fatigue |
| OL | Overload |
| OLR | Overload ratio |
| R | Stress ratio |
| UTS | Ultimate tensile strength |
| U* | Crack opening level |
| W | Width of CT specimen |
| εps | Pre-strain deformation |
| ΔK | Range of stress intensity factor |
References
- Hariharan, K.; Prakash, R.V. Integrating effect of forming in fatigue life prediction: Review of present scenario and challenges. Proc. Inst. Mech. Eng. Part B J. Eng. Manuf. 2012, 226, 967–979. [Google Scholar] [CrossRef]
- Rex, A.V.; Paul, S.K.; Singh, A. Influence of uniaxial and equi-biaxial tensile pre-straining on the high cycle and notch fatigue behaviour of AA2024-T4 aluminium alloy. Theor. Appl. Fract. Mech. 2023, 128, 104176. [Google Scholar] [CrossRef]
- Zhou, Y.; Lin, M.; Liu, C.; Wang, L.; Chen, H.; Dan, C.; Ma, S.; Chen, Z.; Wang, H. Enhancing mechanical properties of uniformly distributed nano TiB2/2024 Al composite rolling sheet by pre-stretch aging. J. Alloys Compd. 2022, 913, 165172. [Google Scholar] [CrossRef]
- Baek, J.-H.; Kim, Y.-P.; Kim, C.-M.; Kim, W.-S.; Seok, C.-G. Effects of pre-strain on the mechanical properties of API 5L X65 pipe. Mater. Sci. Eng. A 2010, 527, 1473–1479. [Google Scholar] [CrossRef]
- Mehmanparast, A.; Davies, C.M.; Dean, D.W.; Nikbin, K. Effects of plastic pre-straining level on the creep deformation, crack initiation and growth behaviour of 316H stainless steel. Int. J. Press. Vessel. Pip. 2016, 141, 1–10. [Google Scholar] [CrossRef]
- Ghosal, P.; Raj, A.; Paul, S.K. Influence of uniaxial and biaxial pre-straining on the low cycle fatigue performance of DP590 steel. Int. J. Fatigue 2021, 149, 106260. [Google Scholar] [CrossRef]
- Ghosal, P.; Paul, S.K.; Raj, A. Influence of uniaxial and biaxial pre-straining on the notch fatigue performance of DP590 steel. Theor. Appl. Fract. Mech. 2021, 115, 103072. [Google Scholar] [CrossRef]
- Le, Q.; Kang, H.T.; Kridli, G.; Khosrovaneh, A.K.; Yan, B. Effect of prestrain paths on mechanical behavior of dual phase sheet steel. Int. J. Fatigue 2009, 31, 607–615. [Google Scholar] [CrossRef]
- Fredriksson, K.; Melander, A.; Hedman, M. Influence of prestraining and ageing on fatigue properties of high-strength sheet steels. Int. J. Fatigue 1988, 10, 139–151. [Google Scholar] [CrossRef]
- Wang, B.; Zhang, P.; Duan, Q.Q.; Zhang, Z.J.; Yang, H.J.; Pang, J.C.; Tian, Y.Z.; Li, X.W.; Zhang, Z.F. High-cycle fatigue properties and damage mechanisms of pre-strained Fe-30Mn-0.9 C twinning-induced plasticity steel. Mater. Sci. Eng. A 2017, 679, 258–271. [Google Scholar] [CrossRef]
- Walker, J.; Thomas, D.J.; Gao, Y. Effects of shot peening and pre-strain on the fatigue life of dual phase Martensitic and Bainitic steels. J. Manuf. Process. 2017, 26, 419–424. [Google Scholar] [CrossRef]
- Ji, D.; Zhang, M.; Zhu, D.; Luo, S.; Li, L. Influence of microstructure and pre-straining on the bake hardening response for ferrite-martensite dual-phase steels of different grades. Mater. Sci. Eng. A 2017, 708, 129–141. [Google Scholar] [CrossRef]
- Wu, H.; Hamada, S.; Noguchi, H. Pre-strain effect on fatigue strength characteristics of SUH660 plain specimens. Int. J. Fatigue 2013, 55, 291–298. [Google Scholar] [CrossRef]
- Froustey, C.; Lataillade, J.L. Influence of large pre-straining of Aluminium alloys on their residual fatigue resistance. Int. J. Fatigue 2008, 30, 908–916. [Google Scholar] [CrossRef]
- Le Roux, J.C.; Taheri, S.; Sermage, J.P.; Colin, J.; Fatemi, A. Cyclic deformation and fatigue behaviors of stainless steel 304L including mean stress and pre-straining effects. In Proceedings of the ASME Pressure Vessels and Piping Conference, Chicago, IL, USA, 27–31 July 2008; Volume 48265, pp. 411–420. [Google Scholar]
- Gustavsson, A.; Melander, A. Variable-amplitude fatigue of a dual-phase sheet steel subjected to pre-strain. Int. J. Fatigue 1994, 16, 503–509. [Google Scholar] [CrossRef]
- Parker, T.E.; Montgomery, G.L. Effect of Balanced Biaxial Stretching on the Low Cycle Fatigue Behavior of SAE 1008 Hot Rolled Low Carbon Steel. SAE Trans. 1975, 84, 308–318. [Google Scholar]
- Das, B.; Singh, A.; Paul, S.K. Low cycle fatigue performance of DP600 steel under various pre-straining paths. Int. J. Fatigue 2020, 132, 105331. [Google Scholar] [CrossRef]
- Rex, A.V.; Paul, S.K.; Singh, A. The influence of equi-biaxial and uniaxial tensile pre-strain on the low cycle fatigue performance of the AA2024-T4 Aluminium alloy. Int. J. Fatigue 2023, 173, 107699. [Google Scholar] [CrossRef]
- Branco, R.; Costa, J.D.; Borrego, L.P.; Wu, S.C.; Long, X.Y.; Antunes, F.V. Effect of tensile pre-strain on low-cycle fatigue behaviour of 7050-T6 Aluminium alloy. Eng. Fail. Anal. 2020, 114, 104592. [Google Scholar] [CrossRef]
- Schjjve, J. The effect of pre-strain on fatigue crack growth and crack closure. Eng. Fract. Mech. 1976, 8, 575–581. [Google Scholar] [CrossRef]
- Al-Rubaie, K.S.; Barroso, E.K.L.; Godefroid, L.B. Fatigue crack growth analysis of pre-strained 7475–T7351 Aluminum alloy. Int. J. Fatigue 2006, 28, 934–942. [Google Scholar] [CrossRef]
- Anandavijayan, S.; Mehmanparast, A.; Braithwaite, J.; Brennan, F.; Chahardehi, A. Material pre-straining effects on fatigue behaviour of S355 structural steel. J. Constr. Steel Res. 2021, 183, 106707. [Google Scholar] [CrossRef]
- Kang, T.S.; Liu, H.W. The effect of pre-stress cycles on fatigue crack growth-an analysis of crack growth mechanism. Eng. Fract. Mech. 1974, 6, 631–638. [Google Scholar] [CrossRef]
- Wasen, J.; Hamberg, K.; Karlsson, B. The influence of pre-strain and ageing on fatigue crack growth in a Dual-Phase Steel. Scr. Metall. 1984, 18, 621–624. [Google Scholar] [CrossRef]
- Arora, P.R.; Raghavan, M.R.; Prasad, Y.V.R.K. Effect of pre-strain on fatigue crack propagation in mild steel containing non-metallic inclusions. Eng. Fract. Mech. 1988, 29, 67–79. [Google Scholar] [CrossRef]
- Radhakrishnan, V.M.; Baburamani, P.S. An investigation of the effect of pre-straining on fatigue crack growth. Mater. Sci. Eng. 1975, 17, 283–288. [Google Scholar] [CrossRef]
- Kim, S.; Song, T.; Sung, H.; Kim, S. Effect of Pre-Straining on High Cycle Fatigue and Fatigue Crack Propagation Behaviors of Precipitation Hardened Steel. Met. Mater. Int. 2021, 27, 1383–1391. [Google Scholar] [CrossRef]
- Leitner, T.; Trummer, G.; Pippan, R.; Hohenwarter, A. Influence of severe plastic deformation and specimen orientation on the fatigue crack propagation behavior of a pearlitic steel. Mater. Sci. Eng. A 2018, 710, 260–270. [Google Scholar] [CrossRef]
- Wang, P.; Ye, L.; Li, Z.; Guo, X.; Tang, J.; Liu, S.; Zhang, Y. Influence of pre-deformation on the fatigue crack growth and fracture behav-ior of Al-Cu-Li-Sc alloy. Theor. Appl. Fract. Mech. 2025, 138, 104913. [Google Scholar] [CrossRef]
- Gao, Z.; Gan, J.; Liu, H.; Liu, X.; Wu, W. Fatigue crack growth prediction for shot-peened steel considering residual stress relaxation. Mater. Des. 2023, 234, 112301. [Google Scholar] [CrossRef]
- Ashkenazi, D. How aluminum changed the world: A metallurgical revolution through technological and cultural perspectives. Technol. Forecast. Soc. Chang. 2019, 143, 101–113. [Google Scholar] [CrossRef]
- Zhang, X.; Chen, Y.; Hu, J. Recent advances in the development of aerospace materials. Prog. Aerosp. Sci. 2018, 97, 22–34. [Google Scholar] [CrossRef]
- Dursun, T.; Soutis, C. Recent developments in advanced aircraft Aluminium alloys. Mater. Des. 2014, 56, 862–871. [Google Scholar] [CrossRef]
- Moreno, B.; Martin, A.; Lopez-Crespo, P.; Zapatero, J.; Dominguez, J. Estimations of fatigue life and variability under random loading in aluminum Al-2024T351 using strip yield models from NASGRO. Int. J. Fatigue 2016, 91, 414–422. [Google Scholar] [CrossRef]
- Borges, M.F.; Lopez-Crespo, P.; Antunes, F.V.; Moreno, B.; Prates, P.; Camas, D.; Neto, D.M. Fatigue crack propagation analysis in 2024-T351 aluminium alloy using nonlinear parameters. Int. J. Fatigue 2021, 153, 106478. [Google Scholar] [CrossRef]
- Swift, H.W. Plastic instability under plane stress. J. Mech. Phys. Solids 1952, 1, 1–18. [Google Scholar] [CrossRef]
- Lemaitre, J.; Chaboche, J.L. Mechanics of Solids Materials; Cambridge University Press: Cambridge, UK, 1985. [Google Scholar]
- Menezes, L.F.; Teodosiu, C. Three-dimensional numerical simulation of the deep drawing process using solid finite elements. J. Mater. Process. Technol. 2000, 97, 100–106. [Google Scholar] [CrossRef]
- Borges, M.F.; Neto, D.M.; Antunes, F.V. Numerical simulation of fatigue crack growth based on accumulated plastic strain. Theor. Appl. Fract. Mech. 2020, 108, 102676. [Google Scholar] [CrossRef]
- Mehrzadi, M.; Taheri, F. The influence of negative and positive stress ratios on crack growth rate in AM60B magnesium alloy. Mat. Sci. Eng. A 2012, 545, 68–77. [Google Scholar] [CrossRef]
- Seifi, R.; Hosseini, R. Experimental study of fatigue crack growth in raw and annealed pure copper with considering cyclic plastic effects. Theor. Appl. Fract. Mech. 2018, 94, 1–9. [Google Scholar] [CrossRef]
- Borrego, L.P.; Ferreira, J.M.; Costa, J.M. Fatigue crack growth and crack closure in an AlMgSi alloy. Fat. Fract. Eng. Mater. Struct. 2001, 24, 255–265. [Google Scholar] [CrossRef]
- Zheng, S.; Yu, Q.; Gao, Z.; Jiang, Y. Loading history effect on fatigue crack growth of extruded AZ31B magnesium alloy. Eng. Fract. Mech. 2013, 114, 42–54. [Google Scholar] [CrossRef]
- Baptista, J.B.; Antunes, F.V.; Correia, L.; Branco, R. A numerical study of the effect of single overloads on plasticity induced. Theor. Appl. Fract. Mech. 2017, 88, 51–63. [Google Scholar] [CrossRef]
- Neto, D.M.; Borges, M.F.; Antunes, F.V. Mechanisms of fatigue crack growth in single overloads. Theor. Appl. Fract. Mech. 2021, 114, 103024. [Google Scholar] [CrossRef]
- Neto, D.M.; Pedro, J.; Borges, M.F.; Borrego, L.F.P.; Sérgio, E.R.; Antunes, F.V. Numerical prediction of fatigue crack growth based on cumulative plastic strain versus experimental results for AA6082-T6. Int. J. Fract. 2023, 240, 167–181. [Google Scholar] [CrossRef]
- Neto, D.M.; Sérgio, E.R.; Borges, M.F.; Borrego, L.P.; Antunes, F.V. Effect of load blocks on fatigue crack growth. Int. J. Fatigue 2022, 162, 107001. [Google Scholar] [CrossRef]


| Si | Fe | Cu | Mn | Mg | Cr | Zn | Ti |
|---|---|---|---|---|---|---|---|
| 0.50 | 0.50 | 3.8–4.9 | 0.3–0.9 | 1.2–1.8 | 0.10 | 0.25 | 0.15 |
| Material | Y0 [MPa] | C [N] | n | Cx [mm] | XSat [MPa] |
|---|---|---|---|---|---|
| 2024-T351 | 288.96 | 389.00 | 0.056 | 138.80 | 111.84 |
| Test | Loading | R | εps [%] | Contact |
|---|---|---|---|---|
| 1 | CA | 0.1 | 0 | Yes |
| 2 | CA | 0.1 | +4 | Yes |
| 3 | CA | 0.1 | −4 | Yes |
| 4 | CA | 0.1 | 0 | No |
| 5 | CA | 0.1 | +4 | No |
| 6 | CA | 0.1 | −4 | No |
| 7 | CA | 0.5 | 0 | Yes |
| 8 | CA | 0.5 | +4 | Yes |
| 9 | CA | 0.5 | −4 | Yes |
| 10 | OL | 0.1 (BL) 1 | 0 | Yes |
| 11 | OL | 0.1 (BL) | +4 | Yes |
| Test | R | εps [%] | Contact | da/dN [μm/cycle] | %Variation |
|---|---|---|---|---|---|
| 1 | 0.1 | 0 | Yes | 0.67 | - |
| 2 | 0.1 | +4 | Yes | 0.36 | −46.3 |
| 3 | 0.1 | −4 | Yes | 0.89 | +32.8 |
| 4 | 0.1 | 0 | No | 1.61 | - |
| 5 | 0.1 | +4 | No | 1.81 | +12.4 |
| 6 | 0.1 | −4 | No | 1.48 | −8.0 |
| 7 | 0.5 | 0 | Yes | 1.54 | - |
| 8 | 0.5 | +4 | Yes | 1.49 | −3.2 |
| 9 | 0.5 | −4 | Yes | 1.68 | +9.1 |
Disclaimer/Publisher’s Note: The statements, opinions and data contained in all publications are solely those of the individual author(s) and contributor(s) and not of MDPI and/or the editor(s). MDPI and/or the editor(s) disclaim responsibility for any injury to people or property resulting from any ideas, methods, instructions or products referred to in the content. |
© 2025 by the authors. Licensee MDPI, Basel, Switzerland. This article is an open access article distributed under the terms and conditions of the Creative Commons Attribution (CC BY) license (https://creativecommons.org/licenses/by/4.0/).
Share and Cite
Neto, D.M.; Sérgio, E.; Agra, A.; Antunes, F.V. Numerical Simulation of the Effect of Pre-Strain on Fatigue Crack Growth in AA2024-T351. Metals 2025, 15, 481. https://doi.org/10.3390/met15050481
Neto DM, Sérgio E, Agra A, Antunes FV. Numerical Simulation of the Effect of Pre-Strain on Fatigue Crack Growth in AA2024-T351. Metals. 2025; 15(5):481. https://doi.org/10.3390/met15050481
Chicago/Turabian StyleNeto, Diogo M., Edmundo Sérgio, André Agra, and Fernando V. Antunes. 2025. "Numerical Simulation of the Effect of Pre-Strain on Fatigue Crack Growth in AA2024-T351" Metals 15, no. 5: 481. https://doi.org/10.3390/met15050481
APA StyleNeto, D. M., Sérgio, E., Agra, A., & Antunes, F. V. (2025). Numerical Simulation of the Effect of Pre-Strain on Fatigue Crack Growth in AA2024-T351. Metals, 15(5), 481. https://doi.org/10.3390/met15050481