Article

The Effect of Drag Finishing on Additively Manufactured Customized Dental Crowns

by
Cosmin Cosma
1,*,
Martin Melichar
2,
Stelian Libu
3,
Alexandru Popan
1,
Glad Contiu
1,
Cristina Teusan
1,
Petru Berce
1 and
Nicolae Balc
1,*
1
Department of Manufacturing Engineering, Technical University of Cluj-Napoca, 400641 Cluj-Napoca, Romania
2
Regional Technological Institute, University of West Bohemia, 30614 Pilsen, Czech Republic
3
Department of Digital Technology, Dental Design Lab, 18121 Athens, Greece
*
Authors to whom correspondence should be addressed.
Metals 2025, 15(5), 471; https://doi.org/10.3390/met15050471
Submission received: 28 February 2025 / Revised: 15 April 2025 / Accepted: 16 April 2025 / Published: 22 April 2025

Abstract

:
Cobalt–chromium (CoCr) alloys are frequently used to produce customized dental applications such as crowns, bridges, or prostheses. These medical products have anatomical forms, and can be effectively manufactured using the laser-based powder bed fusion (PBF-LB/M) technique. A major disadvantage of this approach is the extended time required to refine the resultant surface. The purpose of this research is to reduce the surface roughness of PBF-LB/M/CoCr dental crowns by adopting drag finishing (DF) technology. To evaluate the impact of this automatic post-processing, surface roughness measurements and geometrical investigations were undertaken. The microstructure was characterized using scanning electron microscopy (SEM), and the chemical composition was verified by energy-dispersive X-ray spectroscopy (EDAX). On outside surfaces, the DF post-processing decreased the initial surface roughness by 70–90%. The dental crown’s surface roughness value after DF post-processing was comparable to that of the basic form (cylinder). The lowest roughness was obtained with DF3 post-processing (Ra~0.60 μm). The inner surfaces were limitedly finished. The 3D surface texture showed that the DF method reduced the height of peaks, uniformizing the surfaces. CMM work compared the deviations between the virtual model and the printed samples before and after DF post-processing. This analysis revealed that dimensional deviations were reduced on the outside crown walls, ranging from +0.01 to +0.05 mm. The laser parameters and the heat treatment applied increased the hardness of CoCr crowns to 520 HV, but the proper DF conditions identified reduced the surface roughness and improved the accuracy.

1. Introduction

Nowadays, laser-based powder bed fusion (PBF-LB/M) is one of the most frequently used additive manufacturing (AM) methods, able to produce directly metallic prototypes from virtual models. The PBF-LB/M process rapidly penetrated the dental field, where for each patient, there is a need to manufacture a custom and anatomic prosthetic restoration [1]. CoCr alloys are frequently applied in dental applications to develop porcelain-fused-to-metal prostheses [2]. The main customized products made of CoCr powder via the PBF-LB/M process are dental crowns, bridges, prostheses, implant bars for over-dentures, and removable frames [3,4,5,6,7]. The advantages of applying CoCr alloys in prosthetic restorations as a substructure are the mechanical properties (e.g., high elastic modulus) that make it possible to reduce the dimensions of the framework, and the adequate bond strength between the porcelain and metal, providing corrosion resistance [8,9,10].
From a manufacturing point of view, a major disadvantage of PBF-LB/M parts is the extended time required to refine the resultant surface roughness of complex dental applications [11,12]. It is well known that PBF-LB/M components have a rough and uneven surface, influenced by the stair-step effect, semi-melted grains attached to surfaces, micro-pores, and adverse residual stresses [13,14,15]. In general, the surface roughness ranges from 5 to 15 µm in the case of the Ra parameter [16,17,18]. Often, the post-processing procedure of CoCr crowns or prostheses is performed manually by dental technicians using pneumatic straight grinders. A concern regarding this procedure relates to the fact that the dental technicians are susceptible to inhaling grinding dust during adjustments and polishing of the CoCr parts [19,20]. Moreover, the final surface roughness and accuracy of CoCr frameworks depend on dental technicians’ skills and abilities. These issues motivated the authors to explore the possibility of using an automatic system for finishing PBF-LB/M-processed dental applications.
Various researchers describe how the surfaces of PBF-LB/M-processed components can be finished by automatic techniques that are commonly used in industrial applications. The main methods that can be applied to metal AM parts are vibratory bowl abrasion, hot cutter machining, chemical and electromechanical polishing, and laser micro-machining [13,21,22,23,24]. For example, Lober et al. present four post-processing technologies and combinations of them applied to stainless PBF-LB/M-fabricated steel parts (grinding, sand blasting, electrolytic polishing, and plasma polishing) [17]. To reduce the roughness of titanium (Ti) specimens processed by AM, Ma et al. and Mohammad et al. tested a laser polishing technology [25,26]. However, most AM studies are based on basic shapes. Significant challenges remain in this field, because dental applications or customized implants frequently have high complexity and anatomical shapes, making it difficult to improve the surface quality.
Drag finishing (DF) is a mass finishing method, and a review of the literature reveals that only limited scientific research has been published on PBF-LB/M-processed components post-processed using this technology. Previous studies have focused mainly on Ti alloys [27] and stainless steel [28,29]. This emphasizes the need to evaluate the use of DF technology on hard metals like CoCr. Compared with other biocompatible dental alloys, such as Ti6Al4V [30], Ni-Cr [31], or stainless steel [32], CoCr is the hardest and most laborious for post-processing. To obtain a lower surface roughness on complex CoCr specimens, adapted DF conditions are still required. Moreover, it is also necessary to determine the influence of DF on dimensional deviations.
The main purpose of this research was to reduce the surface roughness of PBF-LB/M dental crowns by adapting the DF technology for use on CoCr alloys. Surface roughness measurements and geometrical investigations were undertaken to evaluate the dimensional deviations that occurred before and after DF post-processing. The microstructure was characterized by scanning electron microscopy (SEM), and the chemical composition was verified by energy-dispersive X-ray spectroscopy (EDAX). Additionally, 3D surface topography analyses and hardness measurements were considered. To evaluate the impact of this automatic post-processing, the PBF-LB/M specimen had a complex shape (dental crown) and a basic form (cylinder).

2. Experimental Section
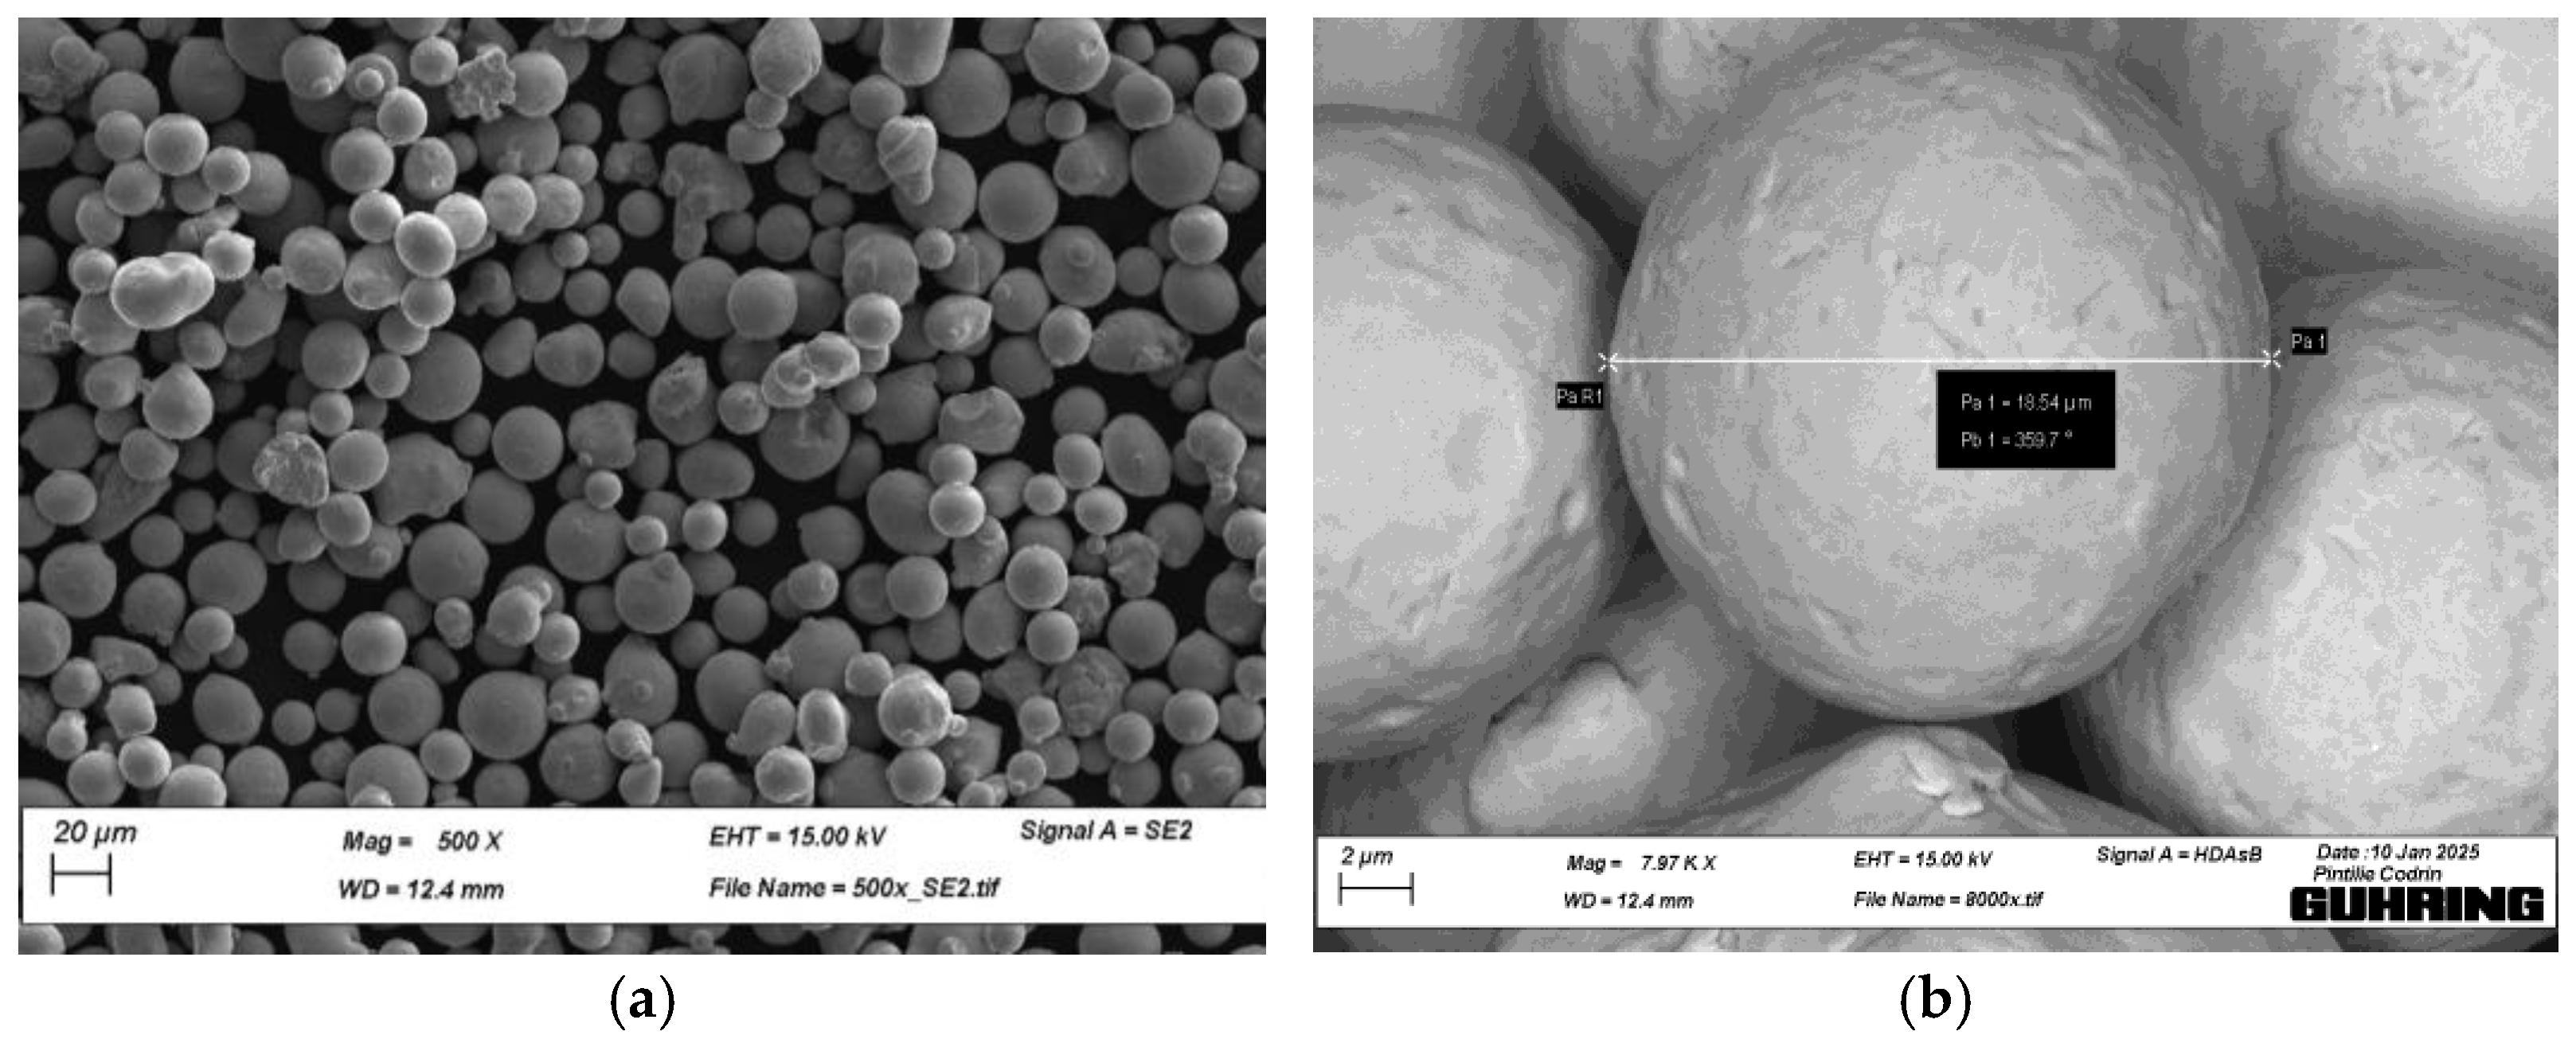
2.1. Material

The present investigation was carried out using CoCr alloy powder (commercially named Starbond CoS 30) produced by S & S Scheftner (Mainz, Germany). In general, the diameter of the grains was between 10 and 30 μm. SEM investigations revealed that the grains of this powder had a spherical shape, with a very limited amount of satellites (Figure 1a). Some deformed particles were also found in the powder feedstock. Because this powder was obtained through a gas atomization process, the topology of CoCr grain was rougher, with a moon-like surface (Figure 1b). The powder flowability corresponded to laser bed fusion requirements. The solidus–liquidus interval of this alloy was between 1305 °C and 1400 °C, and the printed samples were highly corrosion resistant. According to EDAX spectrometry, this powder had the chemical composition detailed in Table 1, which respects ISO 22674 for dental materials [33]. Beryllium, cadmium, and nickel were absent from the feedstock.

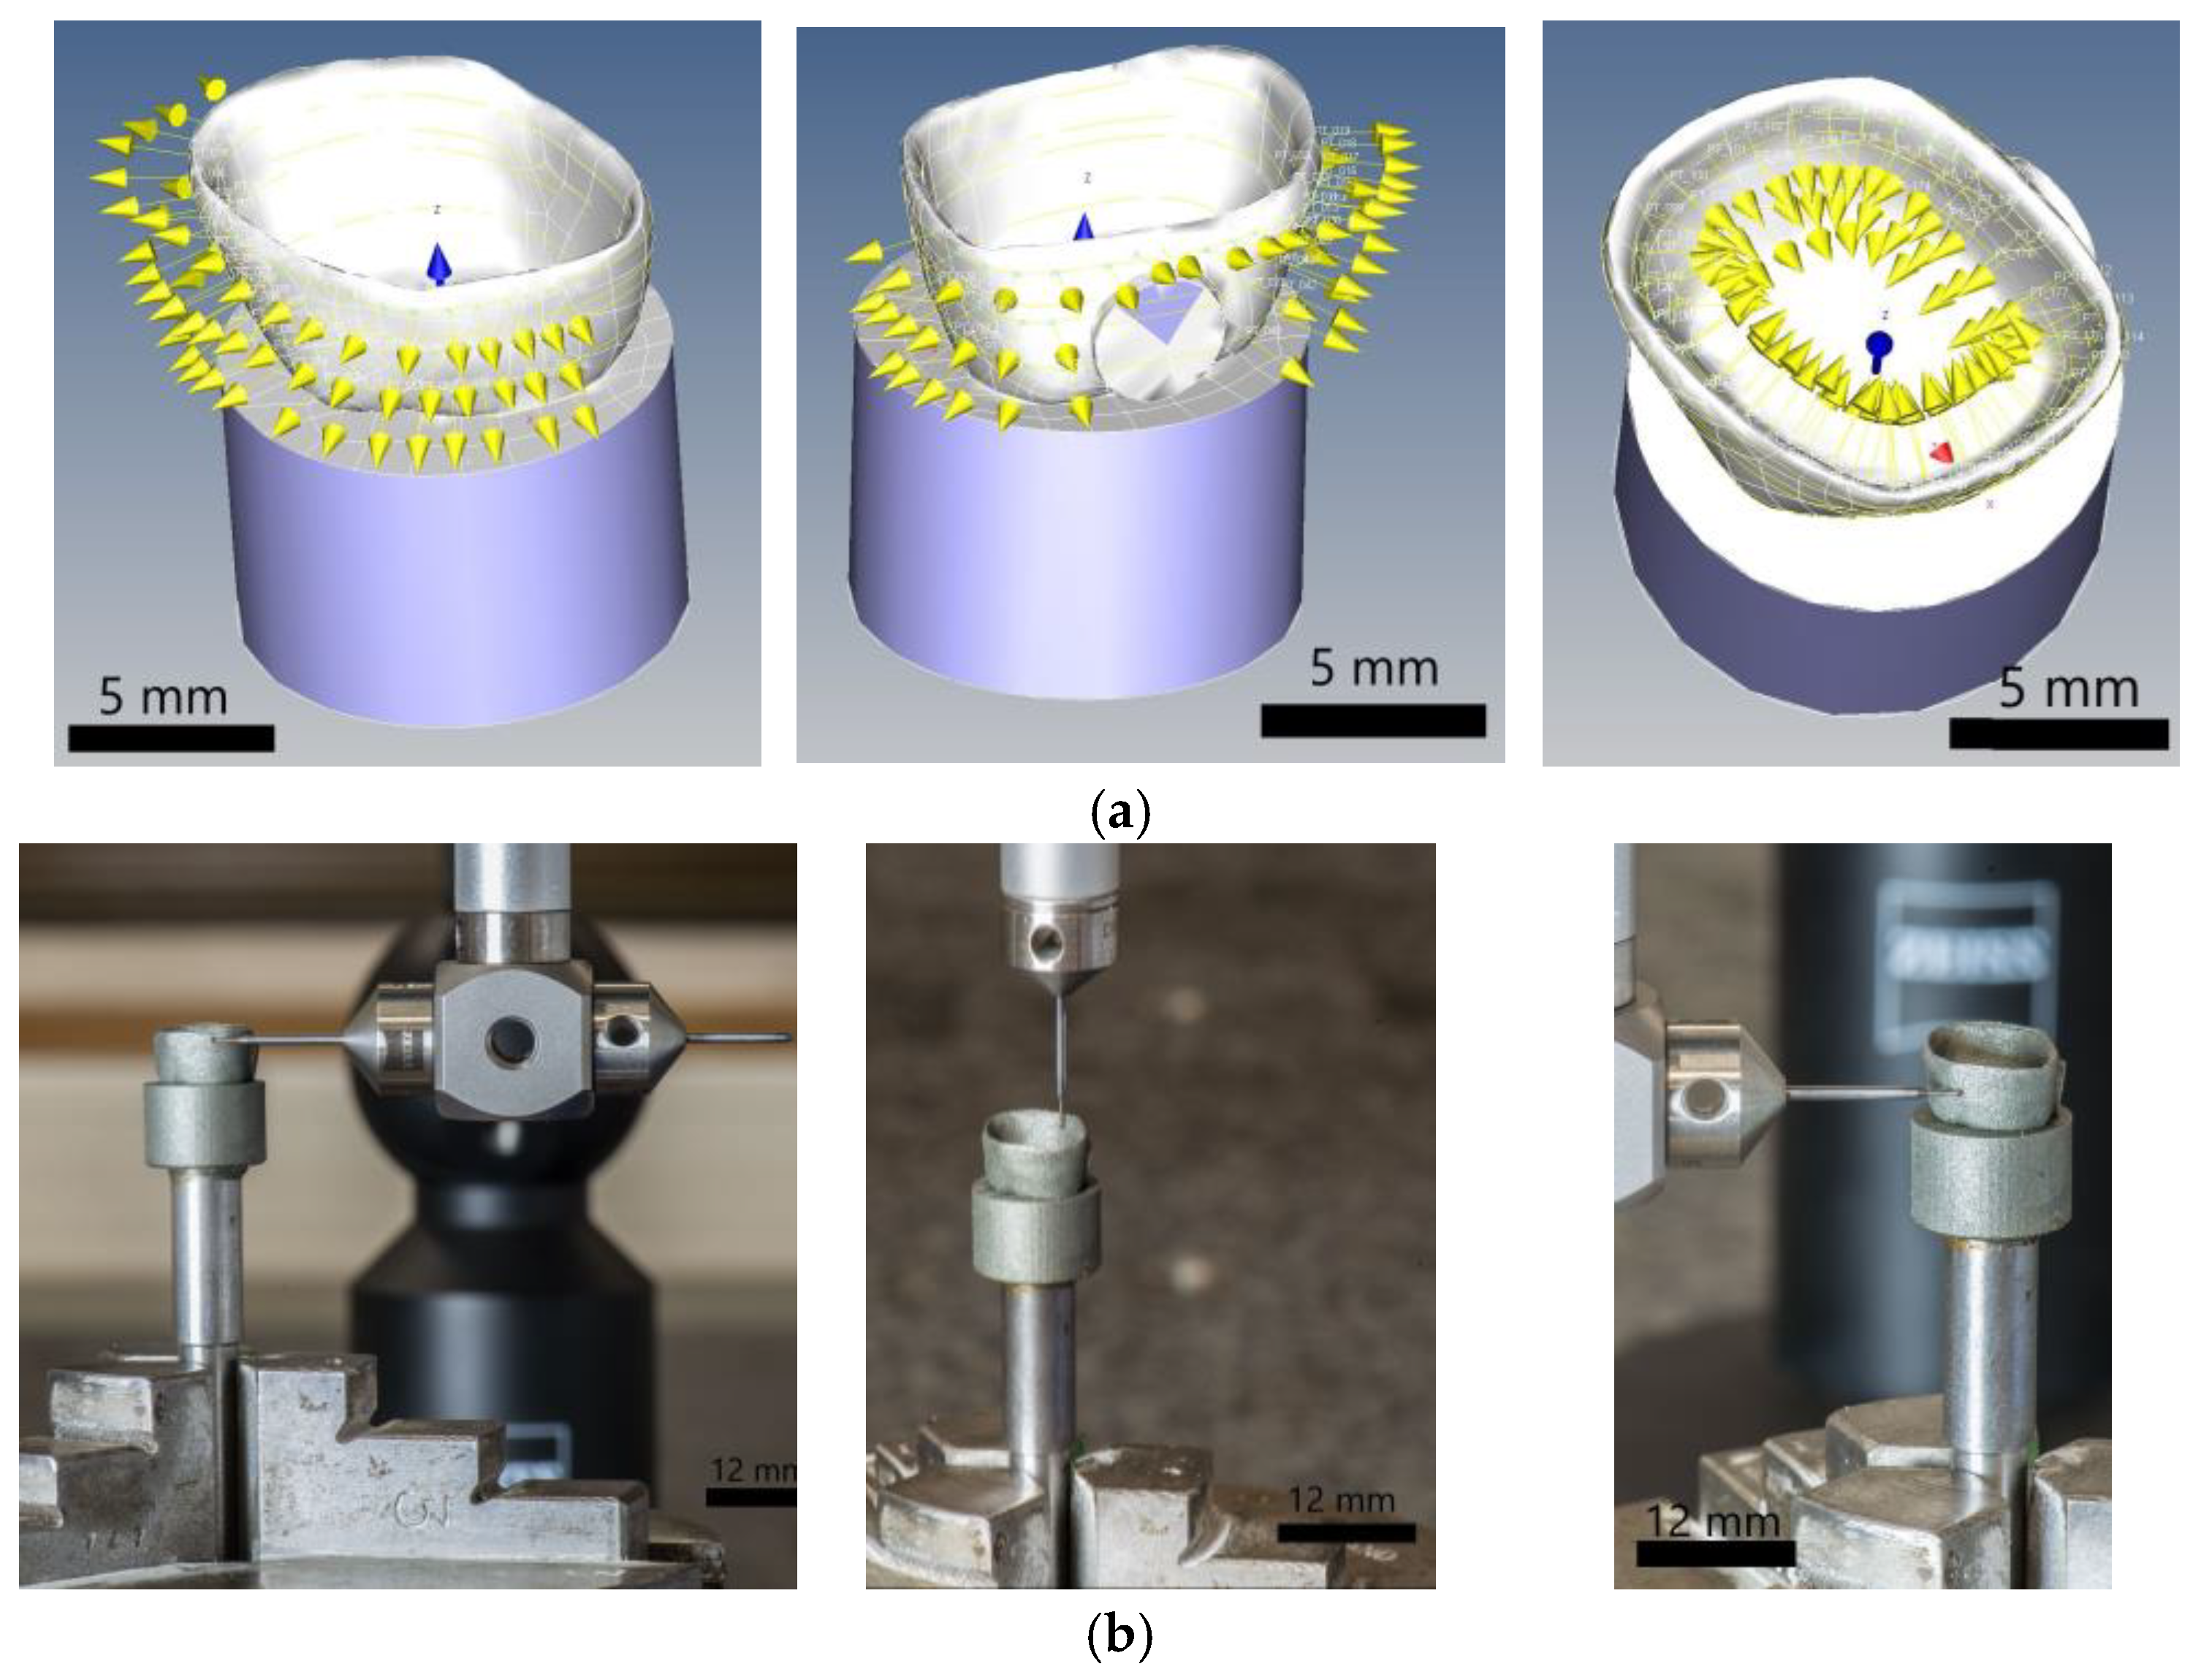
2.2. Specimen Design

The complex model considered was a customized dental crown containing multiple anatomical shapes, sharp internal corners, and uneven thicknesses (Figure 2a). The main steps undertaken to design this part are specific to the restorative dentistry field. Initially, intraoral digital scanning of a prepared maxillary first molar (known as “16”) was conducted using the Dental Wings IntraOral (DWIO) system (Dental Wings GmbH, Chemnitz, Germany). The resulting scan was modeled using DWOS Designing Dental Restorations software (version 8.1, Dental Wings GmbH, Chemnitz, Germany) to obtain the virtual metallic substructure of the dental crown. The virtual model was designed with thin walls, with a thickness between 0.50 and 0.70 mm (Figure 2). These surfaces were modeled according to patient tooth anatomy prepared by a dentist, tilted at angles normally varying between 55° and 88°. An example is illustrated in Figure 2b, where the wall angles are measured as 65° on the left side and 55° on the right side. Because crown margins are a critical factor in restoration fit, a chamfer finishing line was applied (see Figure 2b). This type of final margin is recommended for metal–ceramic restorations, and it has been demonstrated to exert the least stress on tooth dentine. Moreover, the dental crown was fixed on a cylindrical holder with a 12.00 mm diameter (see Figure 2a). The cylindrical holder was added to analyze the influence of the drag finishing process on complex shapes vs. basic shapes.

2.3. PBF-LB/M Manufacturing

Sample fabrication was carried out using a MySint 100 system (Sisma S.p.A., Vicenza, Italy), a PBF-LB/M machine equipped with a 150 W continuous-wave Nd:YAG fiber laser. Under the slice-by-slice principle, this laser metal fusion technology is capable of manufacturing complex and anatomical parts. The working parameters used, as shown in Table 2, were selected based on our PBF-LB/M manufacturing expertise [2,34,35] and relevant guidance from the literature [14,36,37,38]. These laser parameters were programmed to scan the outer and inner boundaries, respectively, of the hatch area. The scanning strategy chosen was a chessboard pattern (rotated islands), and the specimens were built up vertically (build orientation is shown in Figure 2b, cavities facing up). To sustain the specimens during the AM process, they were anchored with conic supports, modeled in AutoFab software according to best practices from the literature [39]. Under a high-purity nitrogen atmosphere and a limited oxygen level (under 1%), twenty dental crowns were manufactured at the same time. Hence, homogeneity of the test was ensured. To avoid any unfavorable effects of residual stress, the specimens were exposed to a stress relief treatment. The heat treatment was conducted in an electric oven (type N 31/H, Nabertherm GmbH, Lilienthal, Germany) in an air atmosphere. Firstly, the specimens were heated up to 860 °C at a rate of 6 °C/min. They were held at this temperature for one hour, followed by a cooling rate of 10 °C/min. After the temperature decreased to 300 °C, the oven door was opened for natural cooling. Finally, the specimens were cleaned off supports and randomly divided into 4 groups, one for control (as-built surfaces) and three for the drag finishing process (5 samples per group).

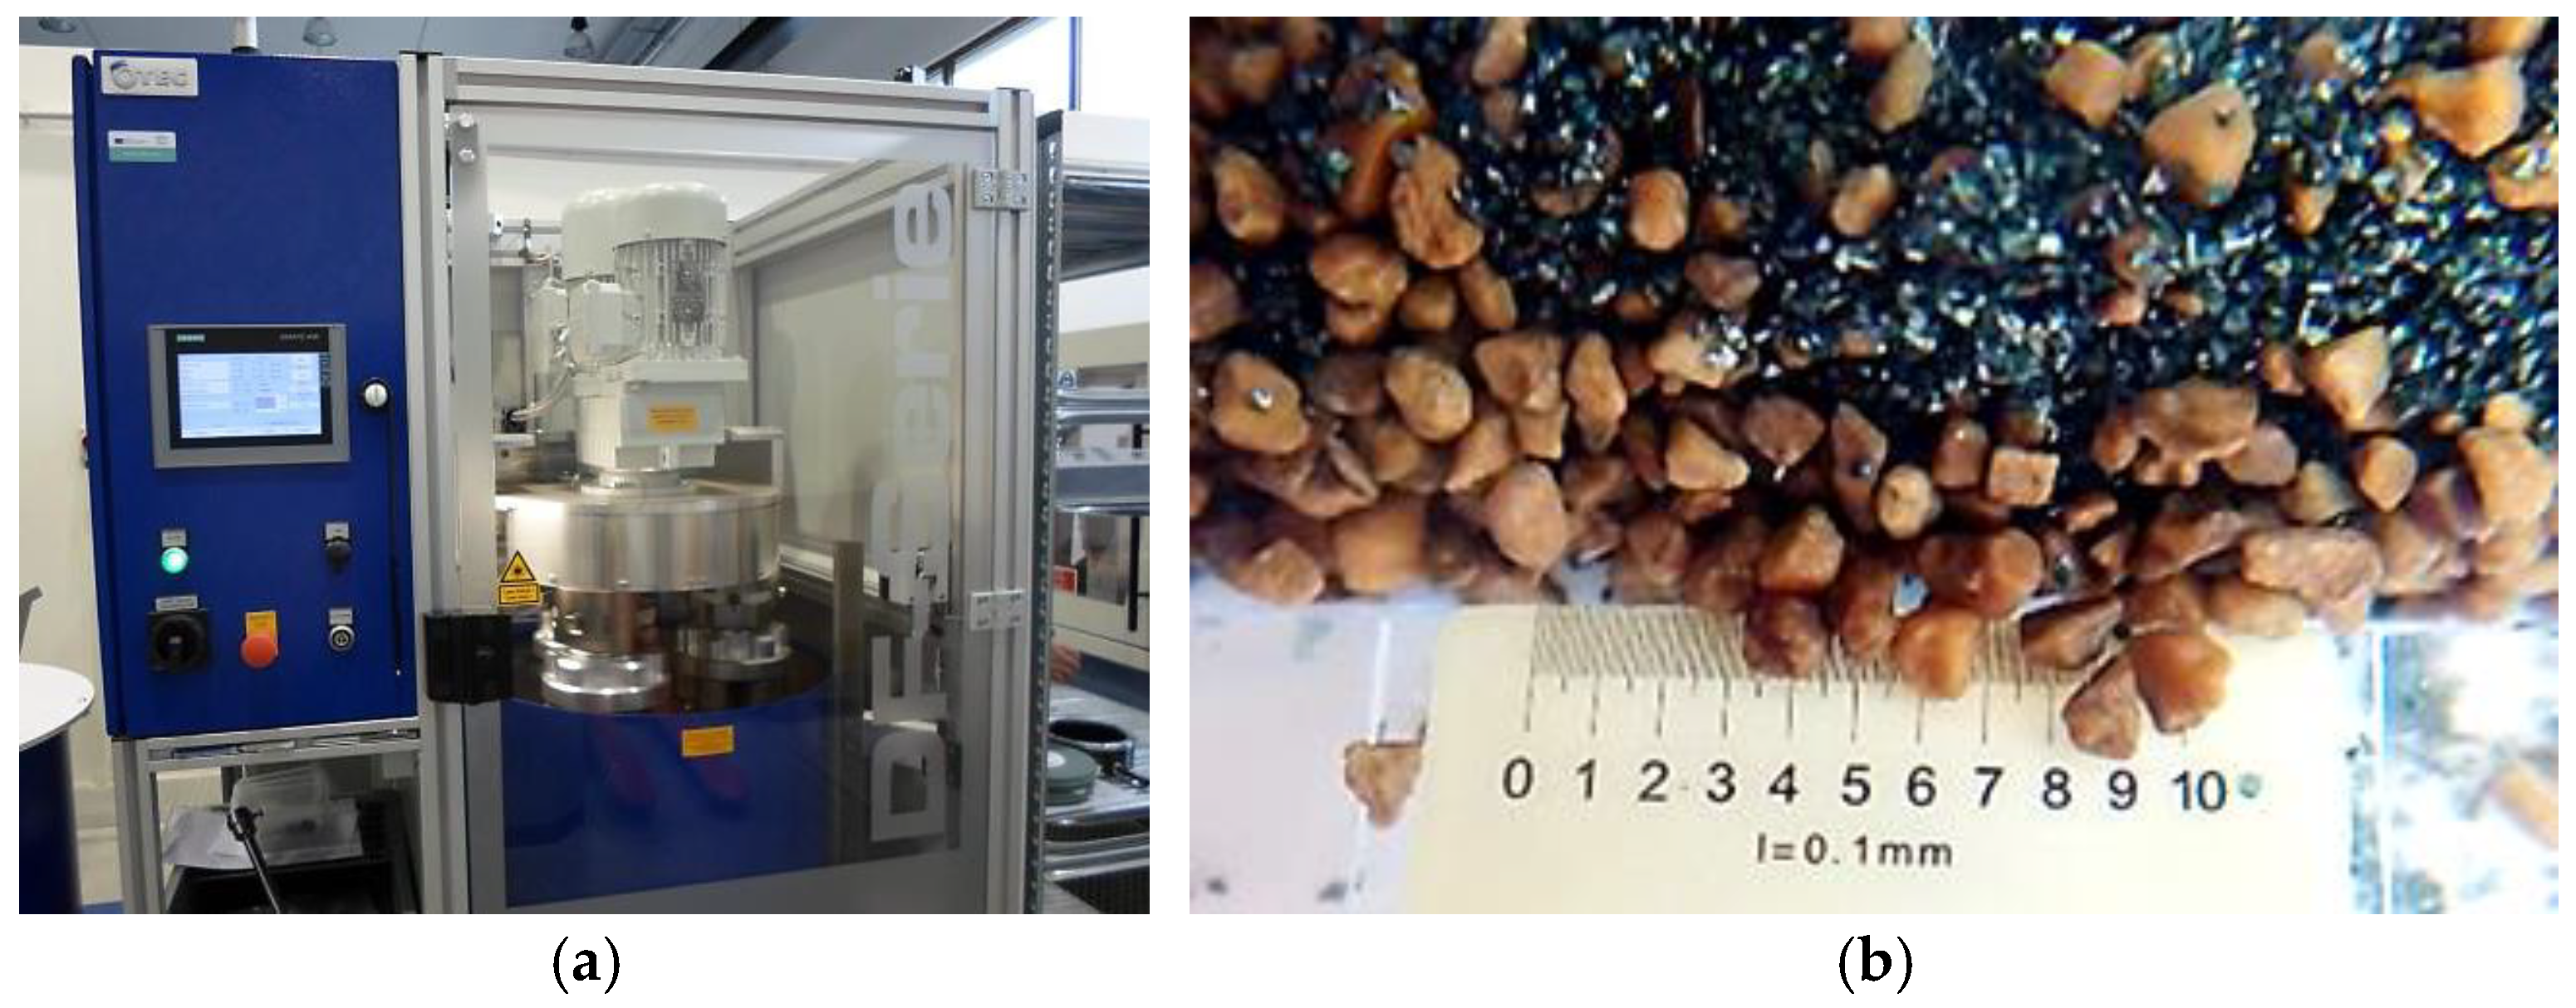
2.4. Drag Finishing Process

The equipment used for DF post-processing was the OTEC DF Series 3 (OTEC Präzisionsfinish GmbH, Straubenhardt, Germany), and it is illustrated in Figure 3a. To adapt the DF technology for hard metals such as CoCr alloys, a proper abrasive medium was identified and tested. The actual DF post-processing was carried out using the HSC 1/300 product impregnated with a type OTEC P28 polishing paste. HSC 1/300 is a mixture of 70% walnut shell granulate, 0.80–1.30 mm in size, and 30% silicon carbide (SiC) grains, with an approx. 200 µm diameter. This abrasive medium is illustrated in Figure 3b. The DF procedure was carried out in dry conditions. The workpieces were clamped in a rotary head sustained by a rod, and they were gradually immersed into the abrasive medium, which exerted pressure on them. To release the dental cavity from the grains during the DF process, they were quickly ejected (7 times). Varying the machining time and keeping the other parameters constant, the samples were post-processed. Table 3 details the DF process conditions considered for each group (DF1, DF2, and DF3). The actual DF parameters and abrasive medium were employed based on initial research carried out by the Regional Technological Institute (University of West Bohemia) in the Czech Republic [40,41].

2.5. Examination Methods

The roughness evaluation was conducted using an Alicona G4 Infinite Focus (Alicona Imaging, Graz, Austria) microscope. This optical profilometry system uses focus-variation technology to extract 3D morphology and depth information from curved surfaces [42,43]. In addition to the profile roughness parameters calculated according to ISO 4287 [44], this instrument offered topographical information about surface texture. The objective magnification was 20×, the cut-off wavelength was 250 μm (λc), the vertical resolution was 50 μm, and lateral resolution setup was 3.5 μm. Optical micrographs were recorded, and twelve roughness parameters were calculated. More than 10 measurements were carried out on each surface, with a profile length of approximately 3.5 mm, at 1 mm distance. The surface roughness profiles were measured perpendicular to the build layers, on outer surfaces.
The geometrical inspection was carried out with a coordinate measuring machine (CMM) type Carl Zeiss Navigator 7 (Carl Zeiss IQS Deutschland GmbH, Oberkochen, Germany) and Calypso 5.8 software (Zeiss, Maple Grove, MN, USA). This CMM made accurate determinations, comparing the deviations between the virtual model and the PBF-LB/M samples. The dimensions were evaluated using point-to-3D-model distance, according to ISO 10360 [45]. On the virtual model of the sample, 180 points were defined as follows: 80 points on the inner surfaces and 100 points on the outer surfaces (Figure 4a). The CNC travel paths were automatically generated. To position all the samples, a small cylinder was considered as a reference (horizontal cylinder, Figure 4a, left image). All these points were measured on PBF-LB/M samples using a star stylus with a Ruby ball tip (Ø 0.5 mm, Figure 4b). This scanning head measures with approx. 1 µm (0.9 + L/350 µm) precision, applying a light force of 0.1 N
Vickers hardness tests were completed with a Wilson Tukon 1102 (Buehler, Lake Bluff, IL, USA) instrument, applying a force of 1 kg across the CoCr surfaces, and the dwell time was 15 s. Several trials were conducted on each sample, in accordance with ISO 6507 (n = 15) [46], and the mean microhardness was calculated. All these examinations were conducted on the initial surface and after the DF post-processing.
Microstructural aspects, as well as the chemical composition, were investigated by scanning electron microscopy (SEM) and energy dispersive X-ray analysis (EDAX). The analyses were performed using a Sigma Gemini Zeiss microscope (Carl Zeiss Microscopy Deutschland GmbH, Oberkochen, Germany). Before the SEM investigations, the specimens are cleaned by ultrasound, while sunken into isopropyl alcohol at 35 °C for 30 min at a frequency of 17 kHz. Finally, the samples were washed with distilled water and dried with hot air. During the SEM investigations, the morphological characteristics of the surfaces were recorded and analyzed. EDAX spectrometry was used for elemental mapping of the CoCr surfaces.

2.6. Statistical Analysis

To test the significance of the data obtained, statistical analysis was performed in TIBCO Statistica software solution (version 14.1.0, StatSoft GmbH, Hamburg, Germany). Consistency of the samples was achieved by using uniform production technology under constant conditions. Analysis of variance (ANOVA) was used to verify data homogeneity. ANOVA is a mathematical–statistical method that allows for verification of whether the value of a random variable for a particular individual is statistically significantly affected by the value of any feature that can be observed individually. This feature must have only a finite number of possible values (at least two), and is used to divide individuals into groups of comparison. However, the quantitative value of a feature does not have the character of a measurement. If a specific quantitative value must also be considered as a measurement of a particular feature, a linear model must be used instead of variance analysis. The ANOVA was based on a regression function. A mathematical model was created to evaluate the significance level of the parameter (p < α, where α = 0.05 or 5%).

3. Results

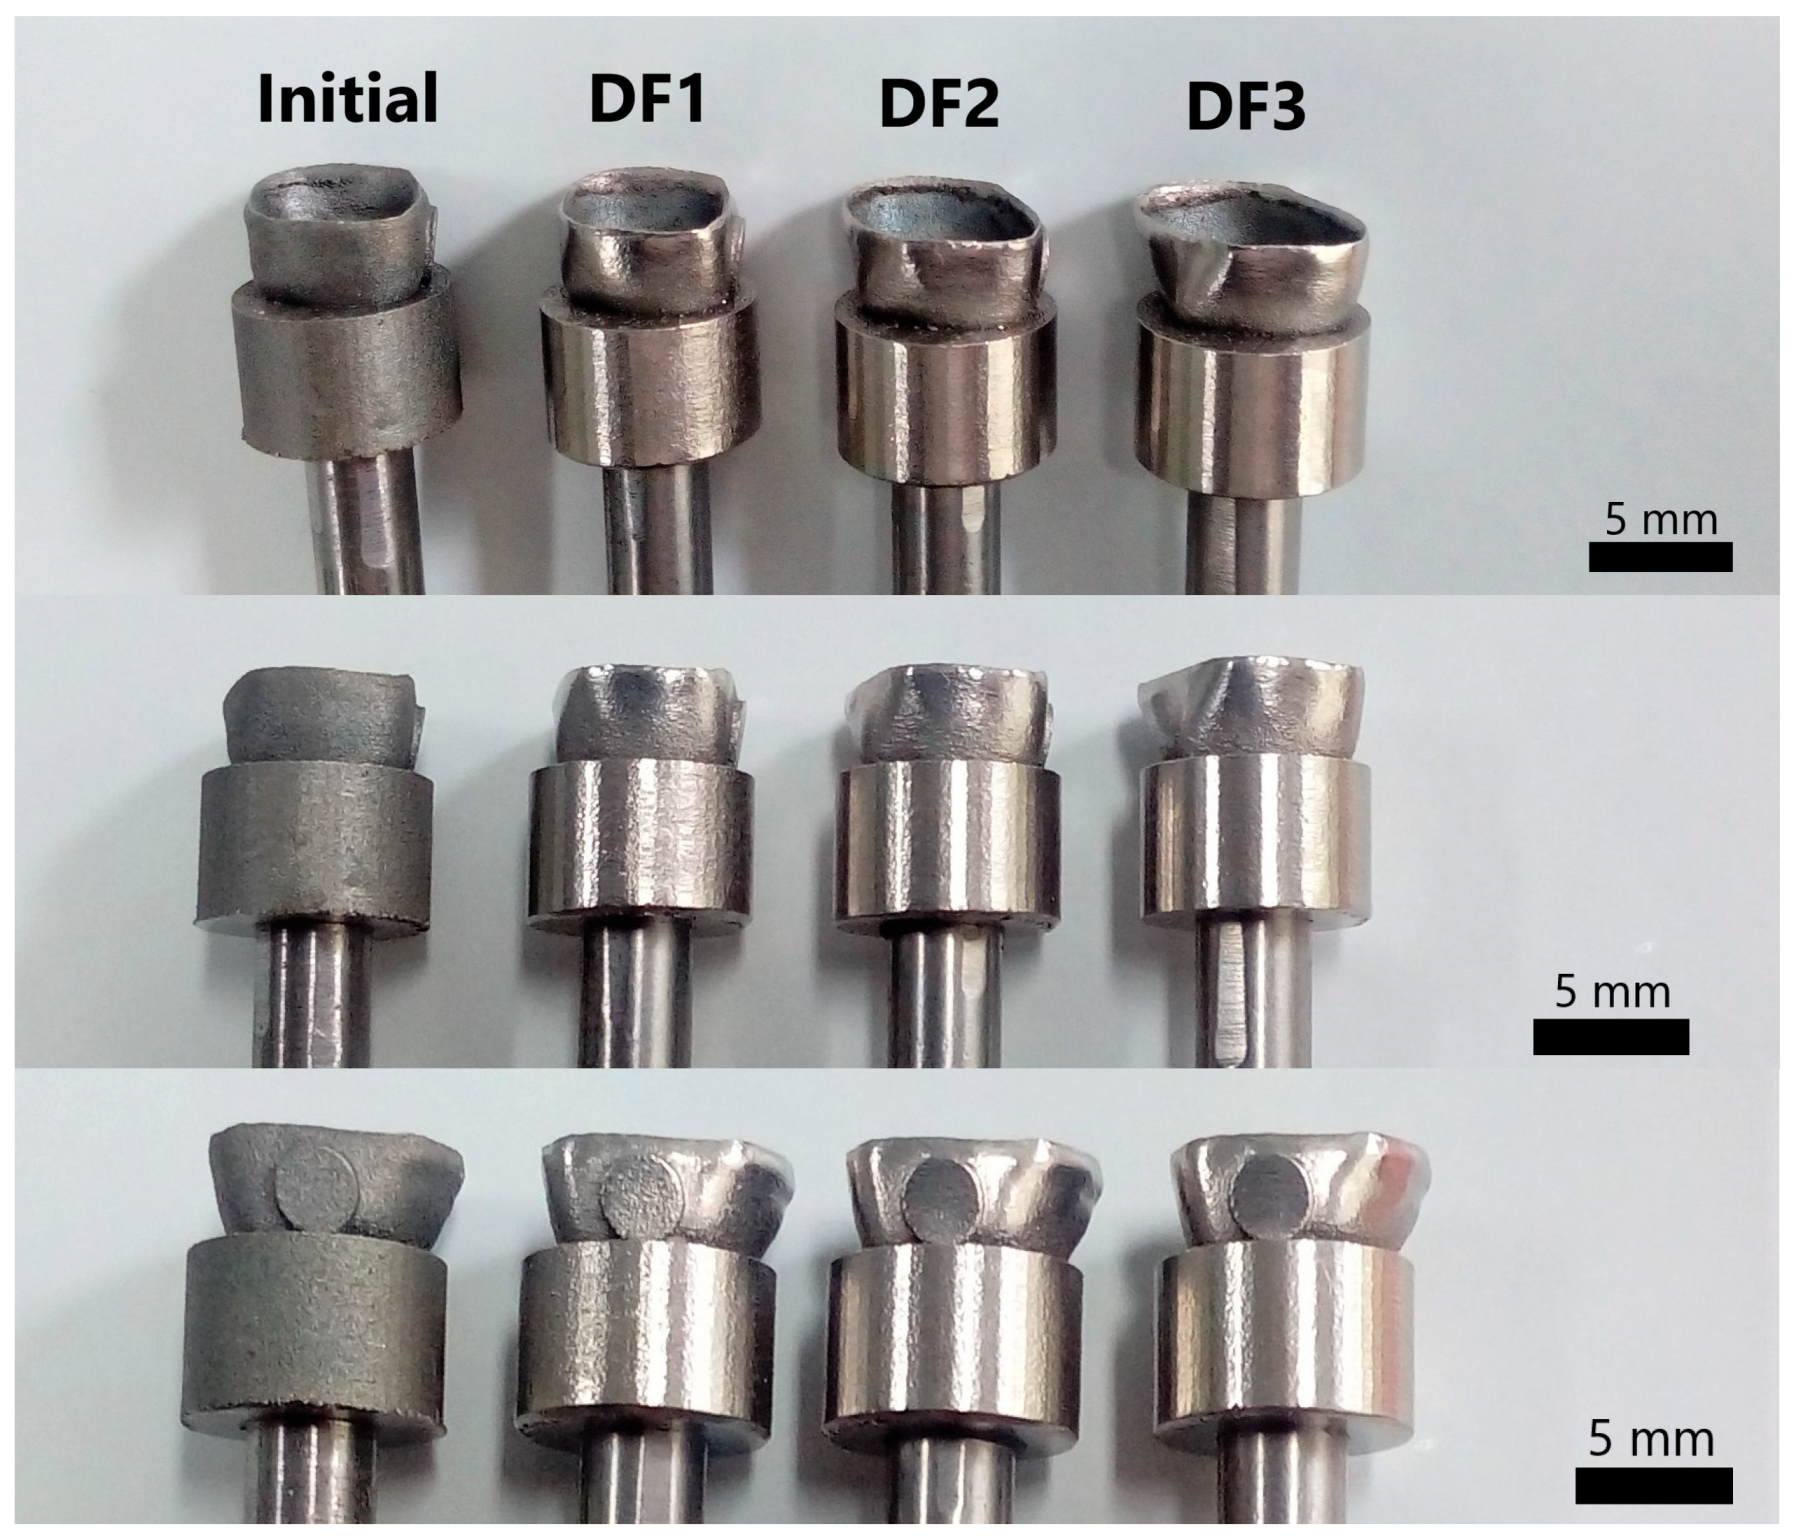
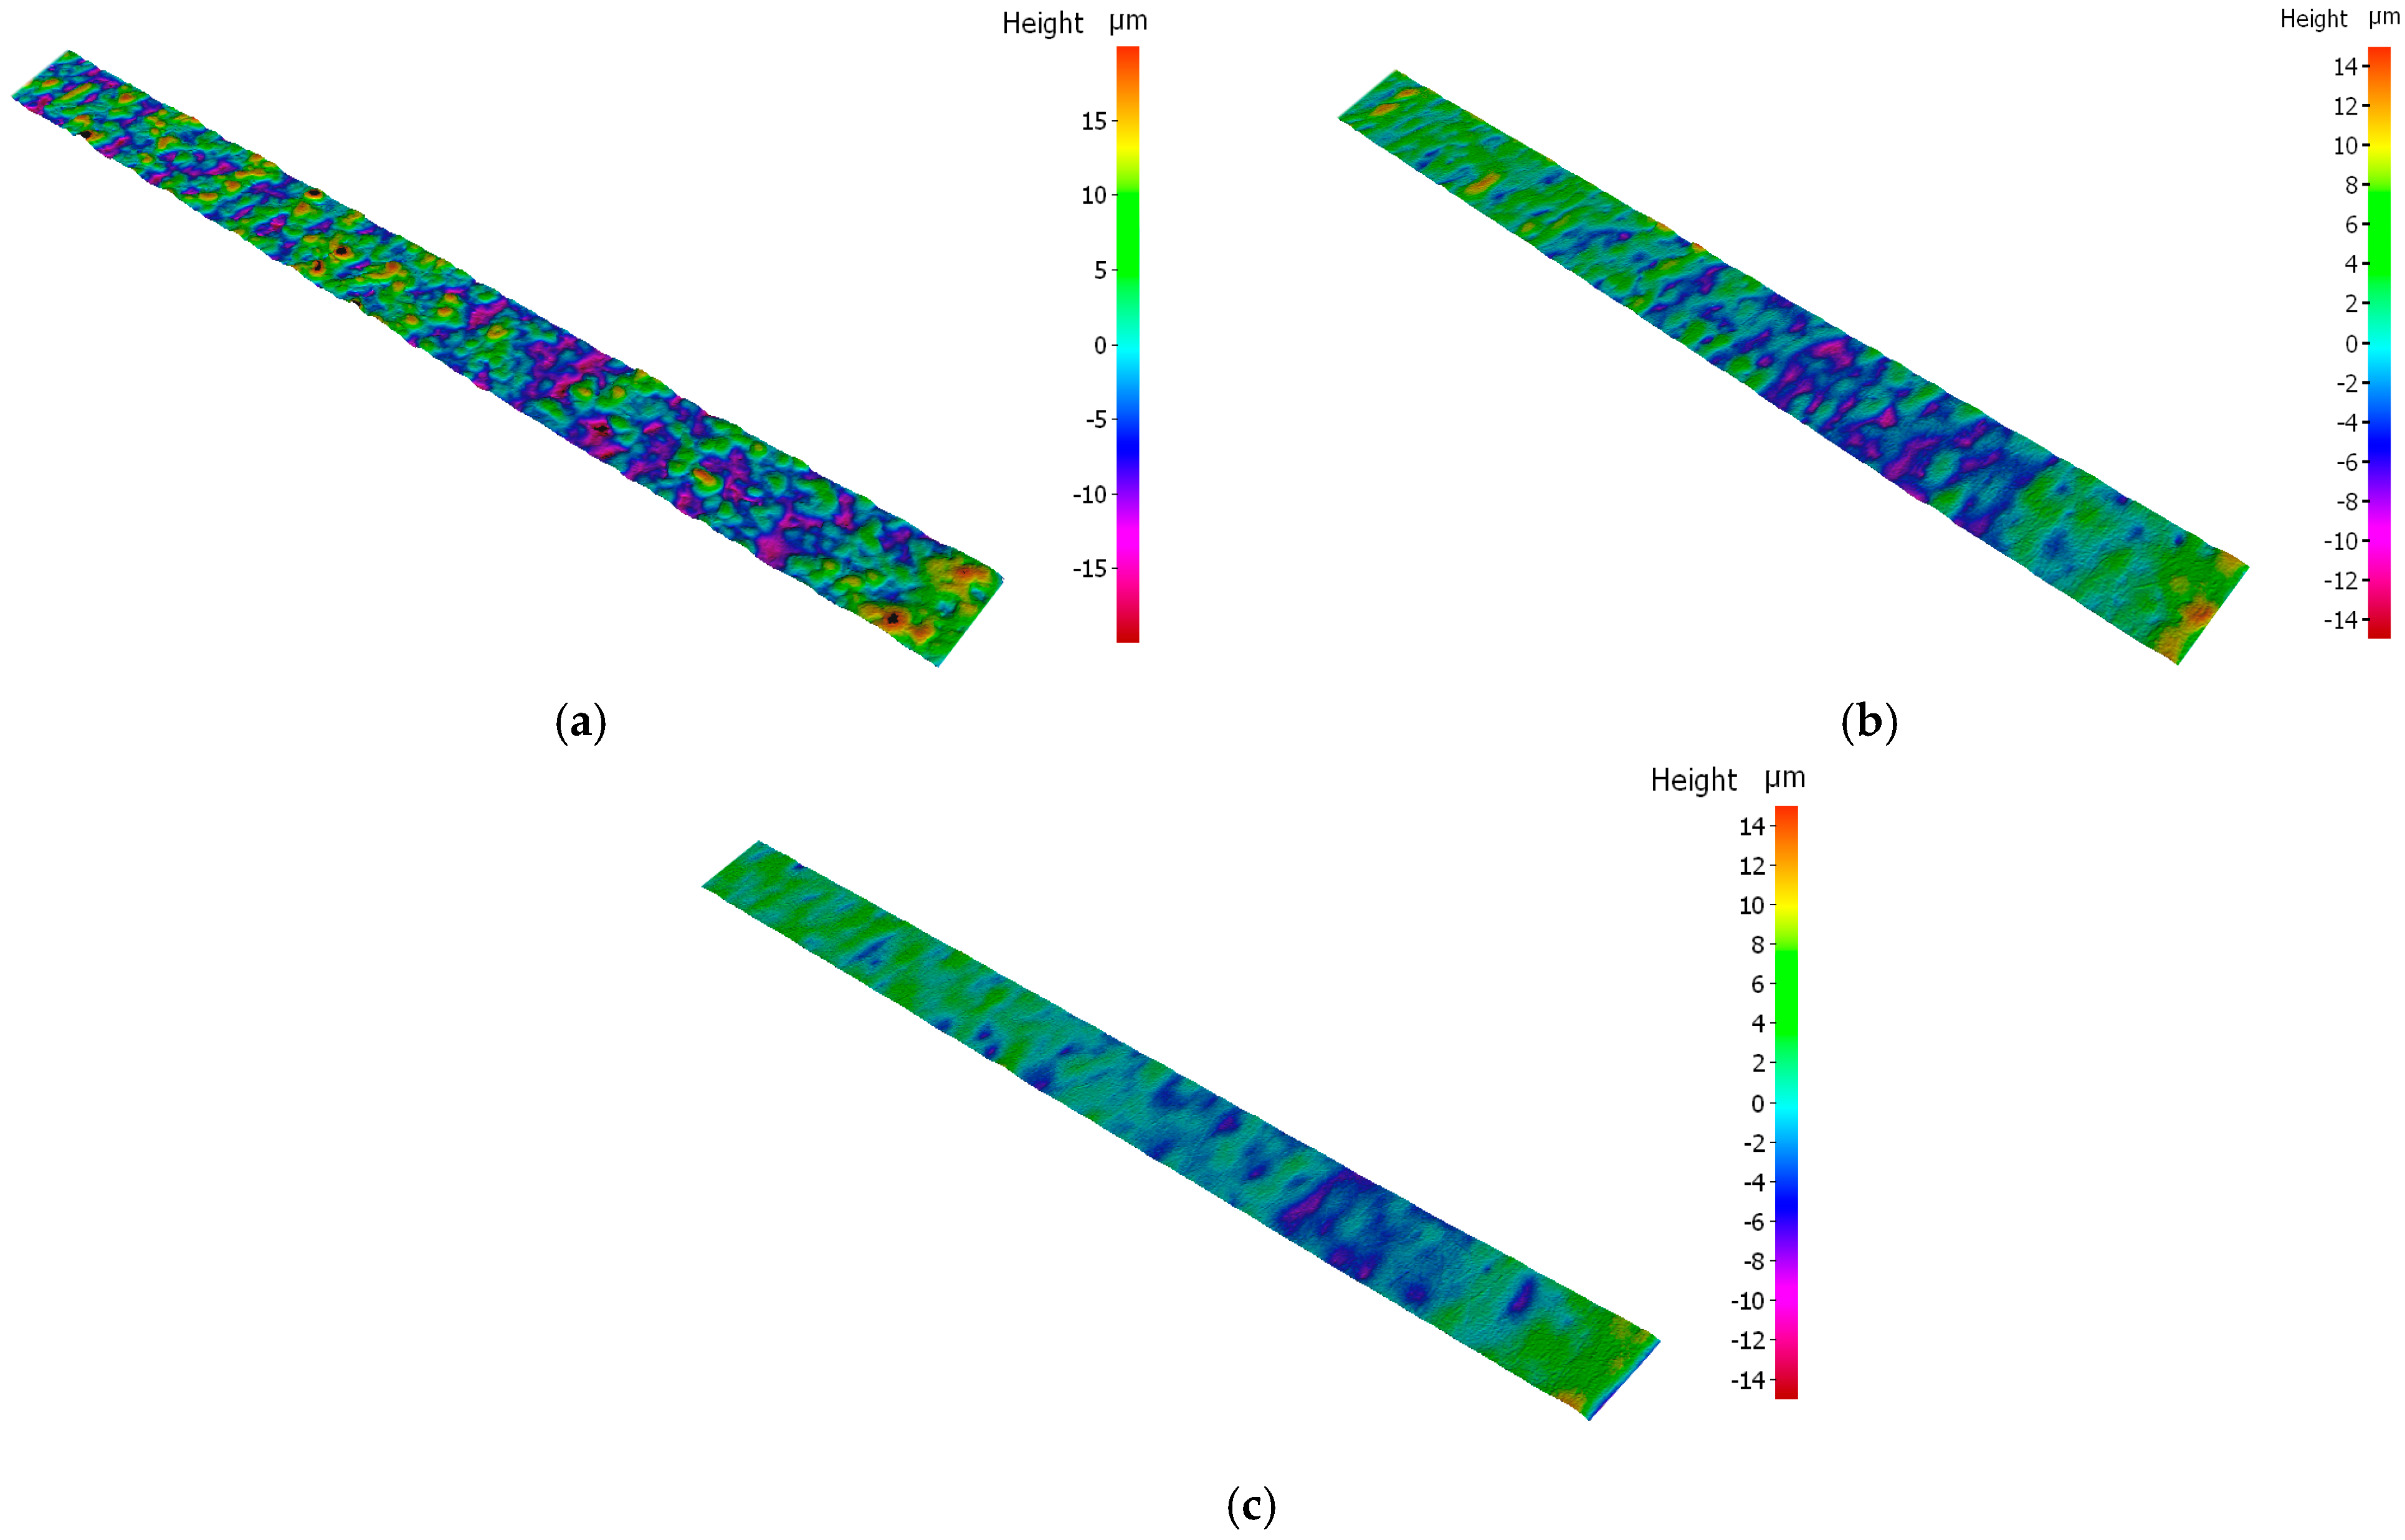
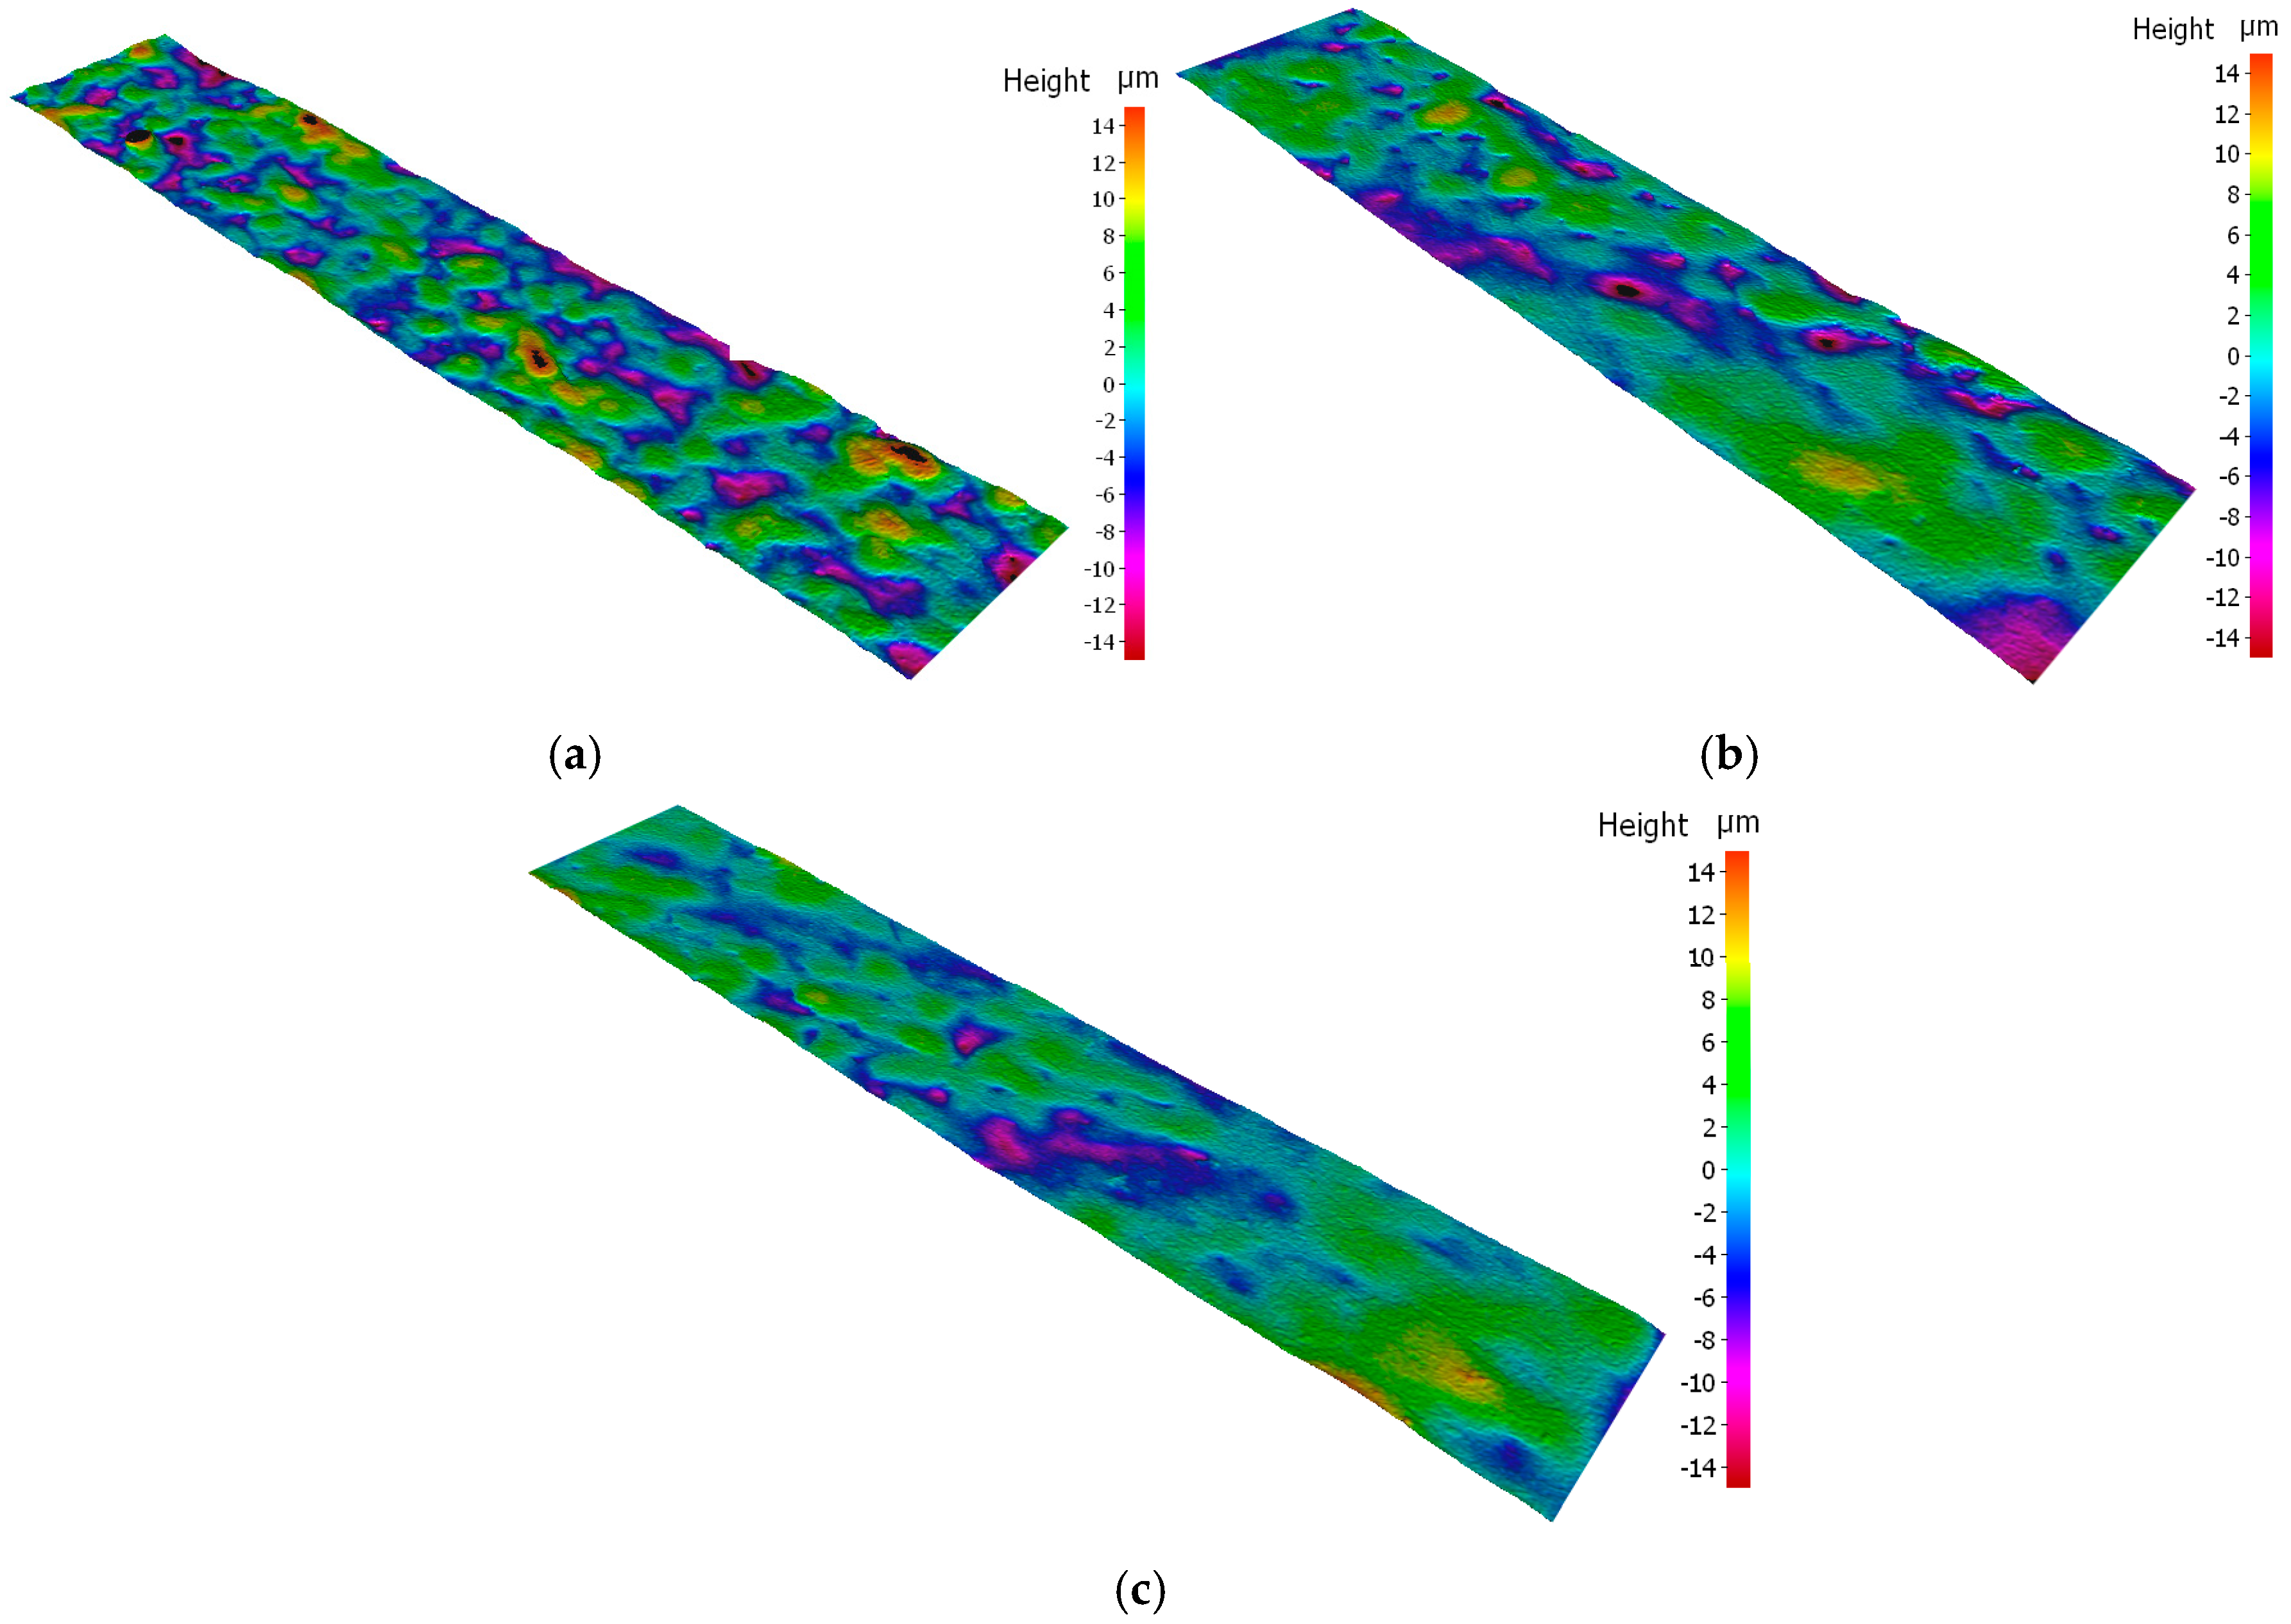
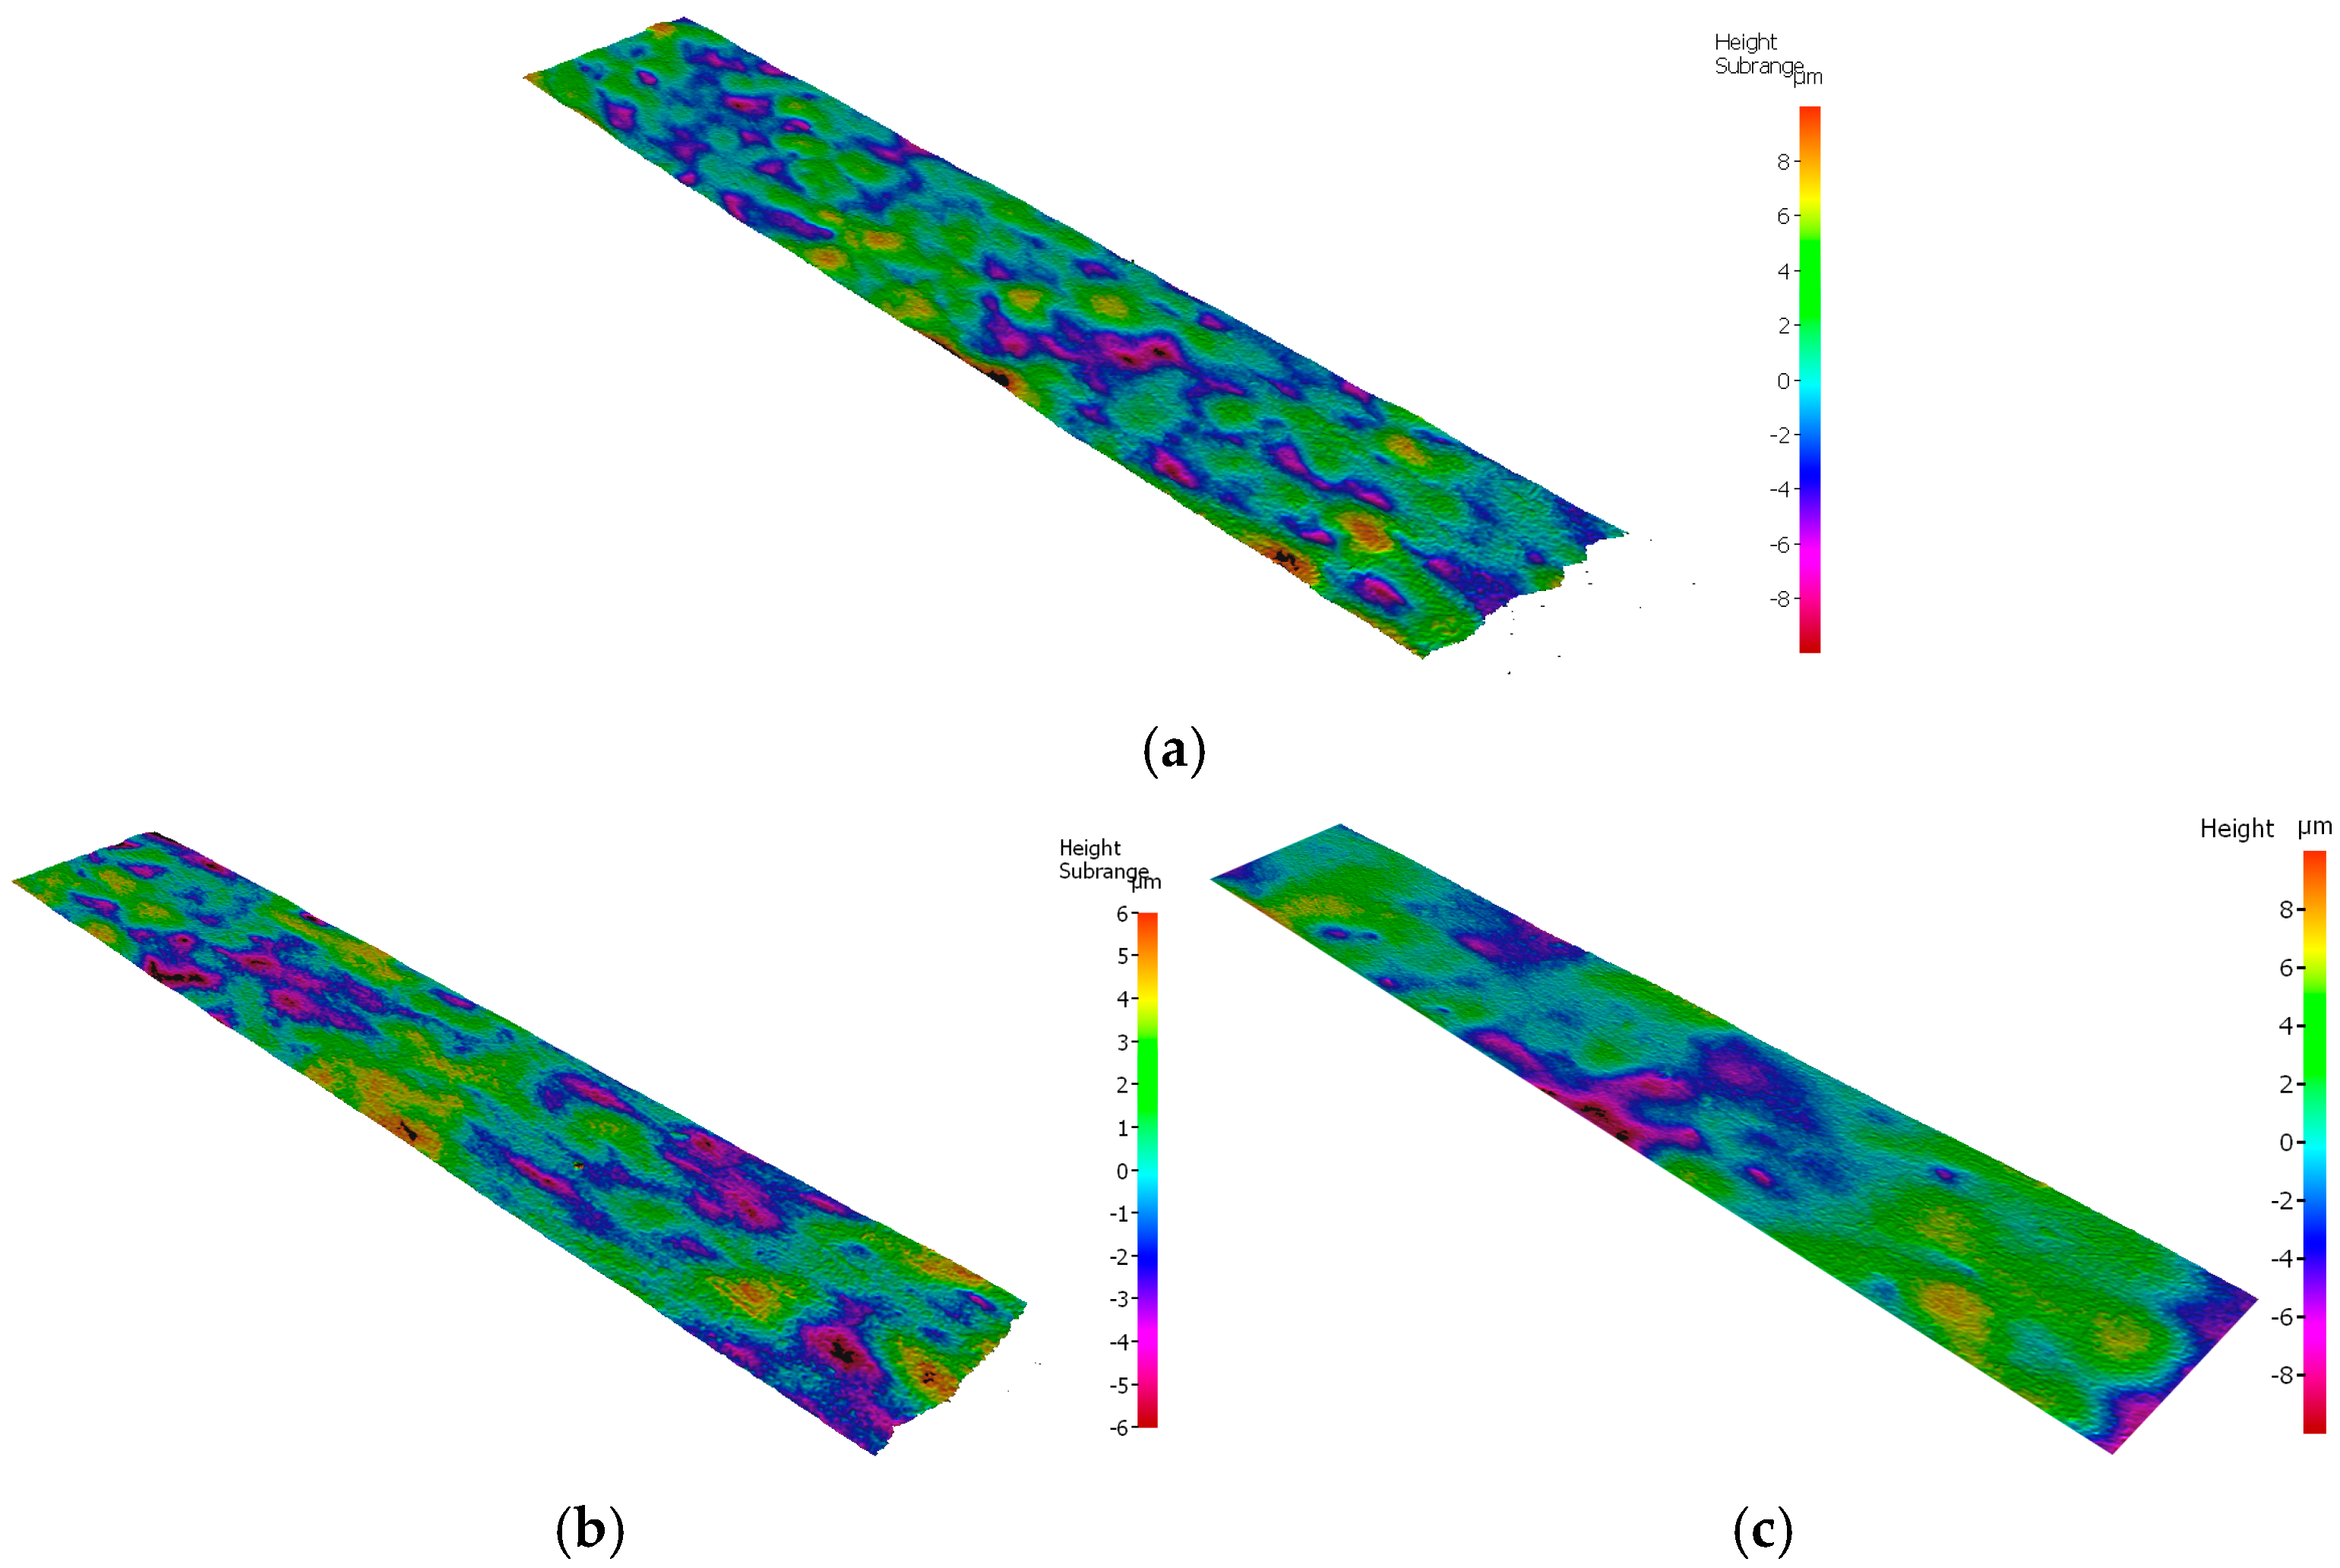
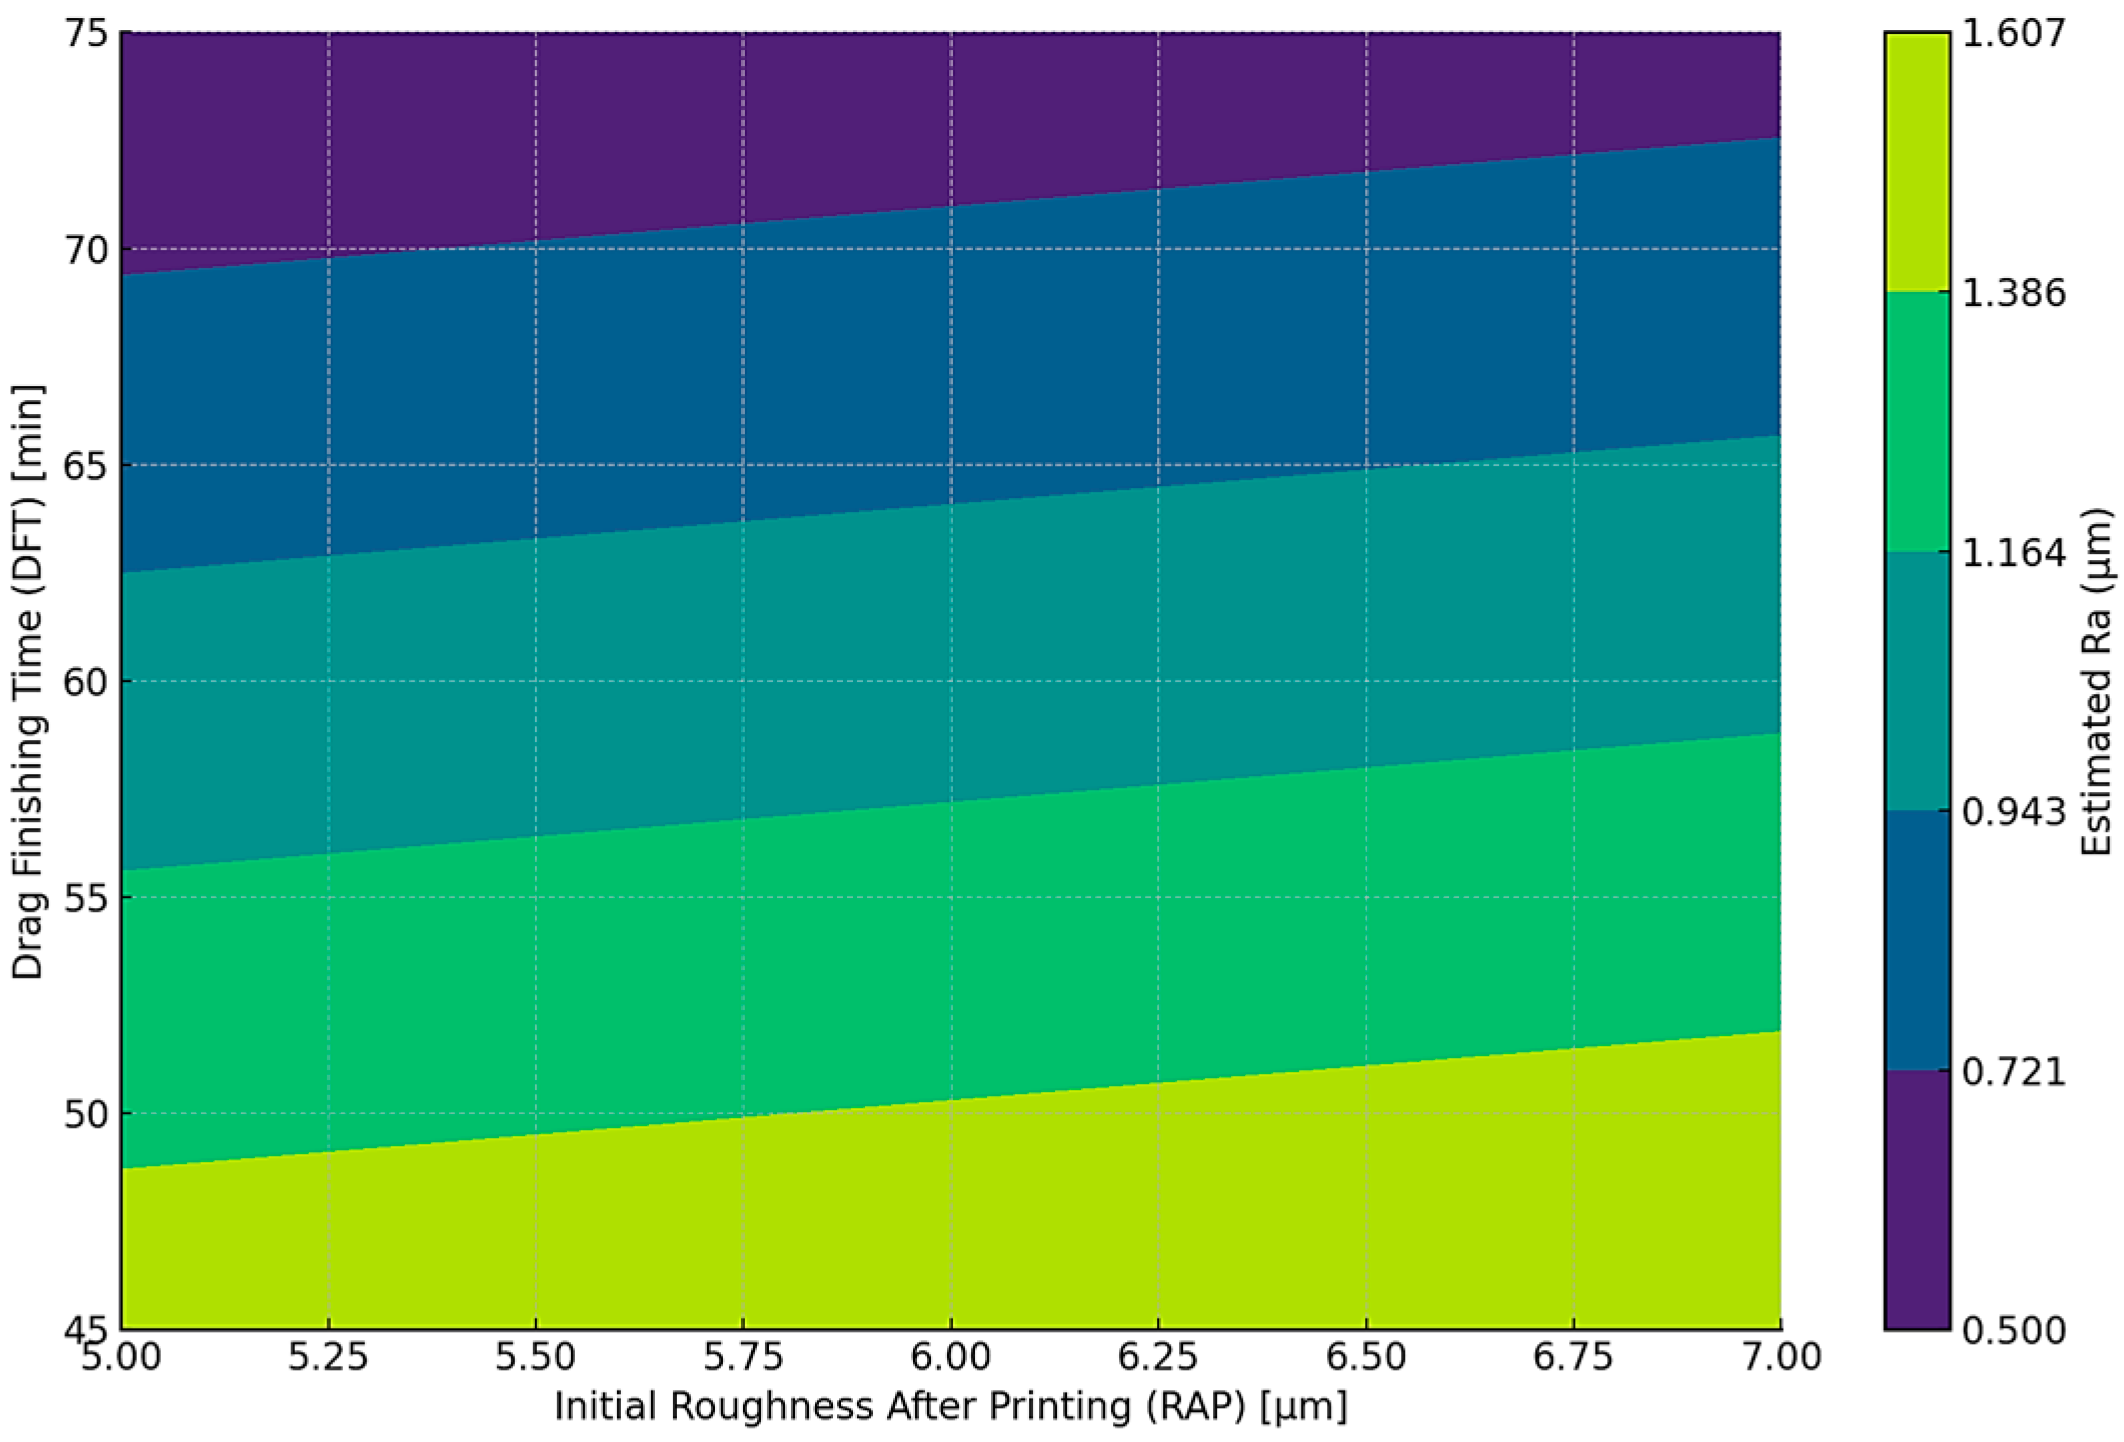
3.1. Surface Roughness

Figure 5 shows the sample surfaces before and after they were post-processed with DF for 45–75 min. The initial CoCr samples were covered by a thin oxide layer, as can be seen in Figure 5. The oxidation layer appeared because the stress relief treatment was performed without a protective gas environment. The inner surface roughness was reduced by less than 25%, indicating a reduced impact of DF post-processing on the inside walls (see Table 5). Since DF post-processing had a limited effect on the inner surfaces, the outer surfaces were analyzed in greater detail. The DF post-processing was able to deburr, smooth, and polish the outer surfaces in one operation. On the external surfaces, the DF post-processing firstly deburred the CoCr surfaces, secondly cleaned the surfaces of attached partially melted grains, and thirdly polished the surfaces. All the DF conditions completely removed the oxide layer and the undesirable grains attached to the outer surfaces (Figure 5). Differences in polishing were seen according to the DF time (45, 60, and 75 min).
To quantify the effect of DF parameters on the CoCr outer surfaces, Table 4 and Table 5 summarize the Ra and Rz values measured on dental crowns with a basic cylindrical form and with anatomical shapes (inner, outer surfaces, and chamfer margin). The as-built Ra roughness varies between 5.20 and 6.95 µm, and in the case of Rz, between 23.80 and 53.32 µm (Table 4 and Table 5). Analyzing the profiles recorded, they are non-periodic, with specific peaks and valleys. Significant differences were recorded in the surface roughness before and after the DF process. Overall, DF post-processing reduced both Ra and Rz roughness values by 73–91% for basic shapes (cylinders), 70–90% for outer surfaces, and 76–93% for the chamfer margin. The lowest roughness was obtained on samples post-processed with the DF3 condition (see Table 4 and Table 5). These results indicate that the DF surface is more suitable for future applications, because the peaks were removed from the surface. These peaks can concentrate stress, so they could cause the dental crown to crack.
To establish the impact of DF post-processing on outer surfaces made of CoCr powder, the present study details various roughness parameters, as follows: Ra, Rq, Rku, Rsk, Rz, Rp, Rv, Rc, Rt, Rsm, Rdq, and Rmax. To gain a complete perspective of the DF surfaces, Table 6 presents the mean values of these roughness parameters. Non-contact 3D surface characterization allowed us to calculate various roughness profile parameters, grouped into average amplitude parameters, amplitude parameters (peak and valley), and others. The average amplitude parameters included the arithmetical mean height (Ra), the root mean square deviation (Rq), the kurtosis (Rku), and the skewness roughness profiles (Rsk). The amplitude parameters included the maximum height of the peak and valley (Rz), the maximum profile peak height (Rp), the maximum profile valley depth (Rv), the mean height (Rc), and the total height (Rt). Other parameters considered were the mean spacing of profile irregularities of the roughness profile (Rsm), the root mean square slope (Rdq), the maximum peak-to-valley height of the roughness profile within a sampling length (Rmax), and the ratio of Rt/Rz extreme scratch/peak values. All the roughness parameters were calculated using the specific profile recorded and according to ISO 4287 equations and filters [44]. Their significance has also been well explained previously [47]. Table 6 details all the roughness parameters measured on each drag-finished surface. Because the Rsk values are less than 0, the height distribution is above the mean line. The Rku relates to the tip geometry of peaks and valleys, and the DF1 surfaces have an even height distribution (Rku < 3). DF2 and DF3 surfaces have a sharp height distribution (Rku > 3). Regarding the amplitude parameters, Table 6 provides evidence of the fact that the DF3 conditions significantly limited the peak’s height (Rp) and the valley’s depth (Rv), making a uniform surface. The hybrid Rdq parameter represents the numerical steepness, which was reduced to 0.08 μm for the DF3 surface. It is confirmed that after DF3, the lowest surface roughness value among all conditions was achieved.
In addition to roughness measurements, 3D images of the surface topography were collected using height-based coloring, both on the cylinder shape and on the dental crown outer surfaces. The depth information from curved surfaces was recorded, and height map visualizations are shown in Figure 6, Figure 7, Figure 8 and Figure 9. The initial surface is presented in Figure 6, where the peaks and valleys are between −30 µm and +30 µm. In some areas, they were beyond this scale. The typical topography for each DF surface is illustrated in Figure 7, Figure 8 and Figure 9 for basic and complex shapes. The map scale was reduced to ±14 µm for outer surfaces. As can be seen from the 3D surface texture, the DF method reduced the height of peaks, uniformizing the surfaces. Compared with as-built surfaces, the parameters of DF3 finishing could significantly improve the quality of basic and anatomical shapes (i.e., Figure 6b vs. Figure 8c). The chamfer area of the dental crown was smoother, and the surface texture has value of ±8 µm on the map scale (Figure 9). The results confirm the feasibility of employing the DF3 conditions for finishing dental applications made from CoCr.

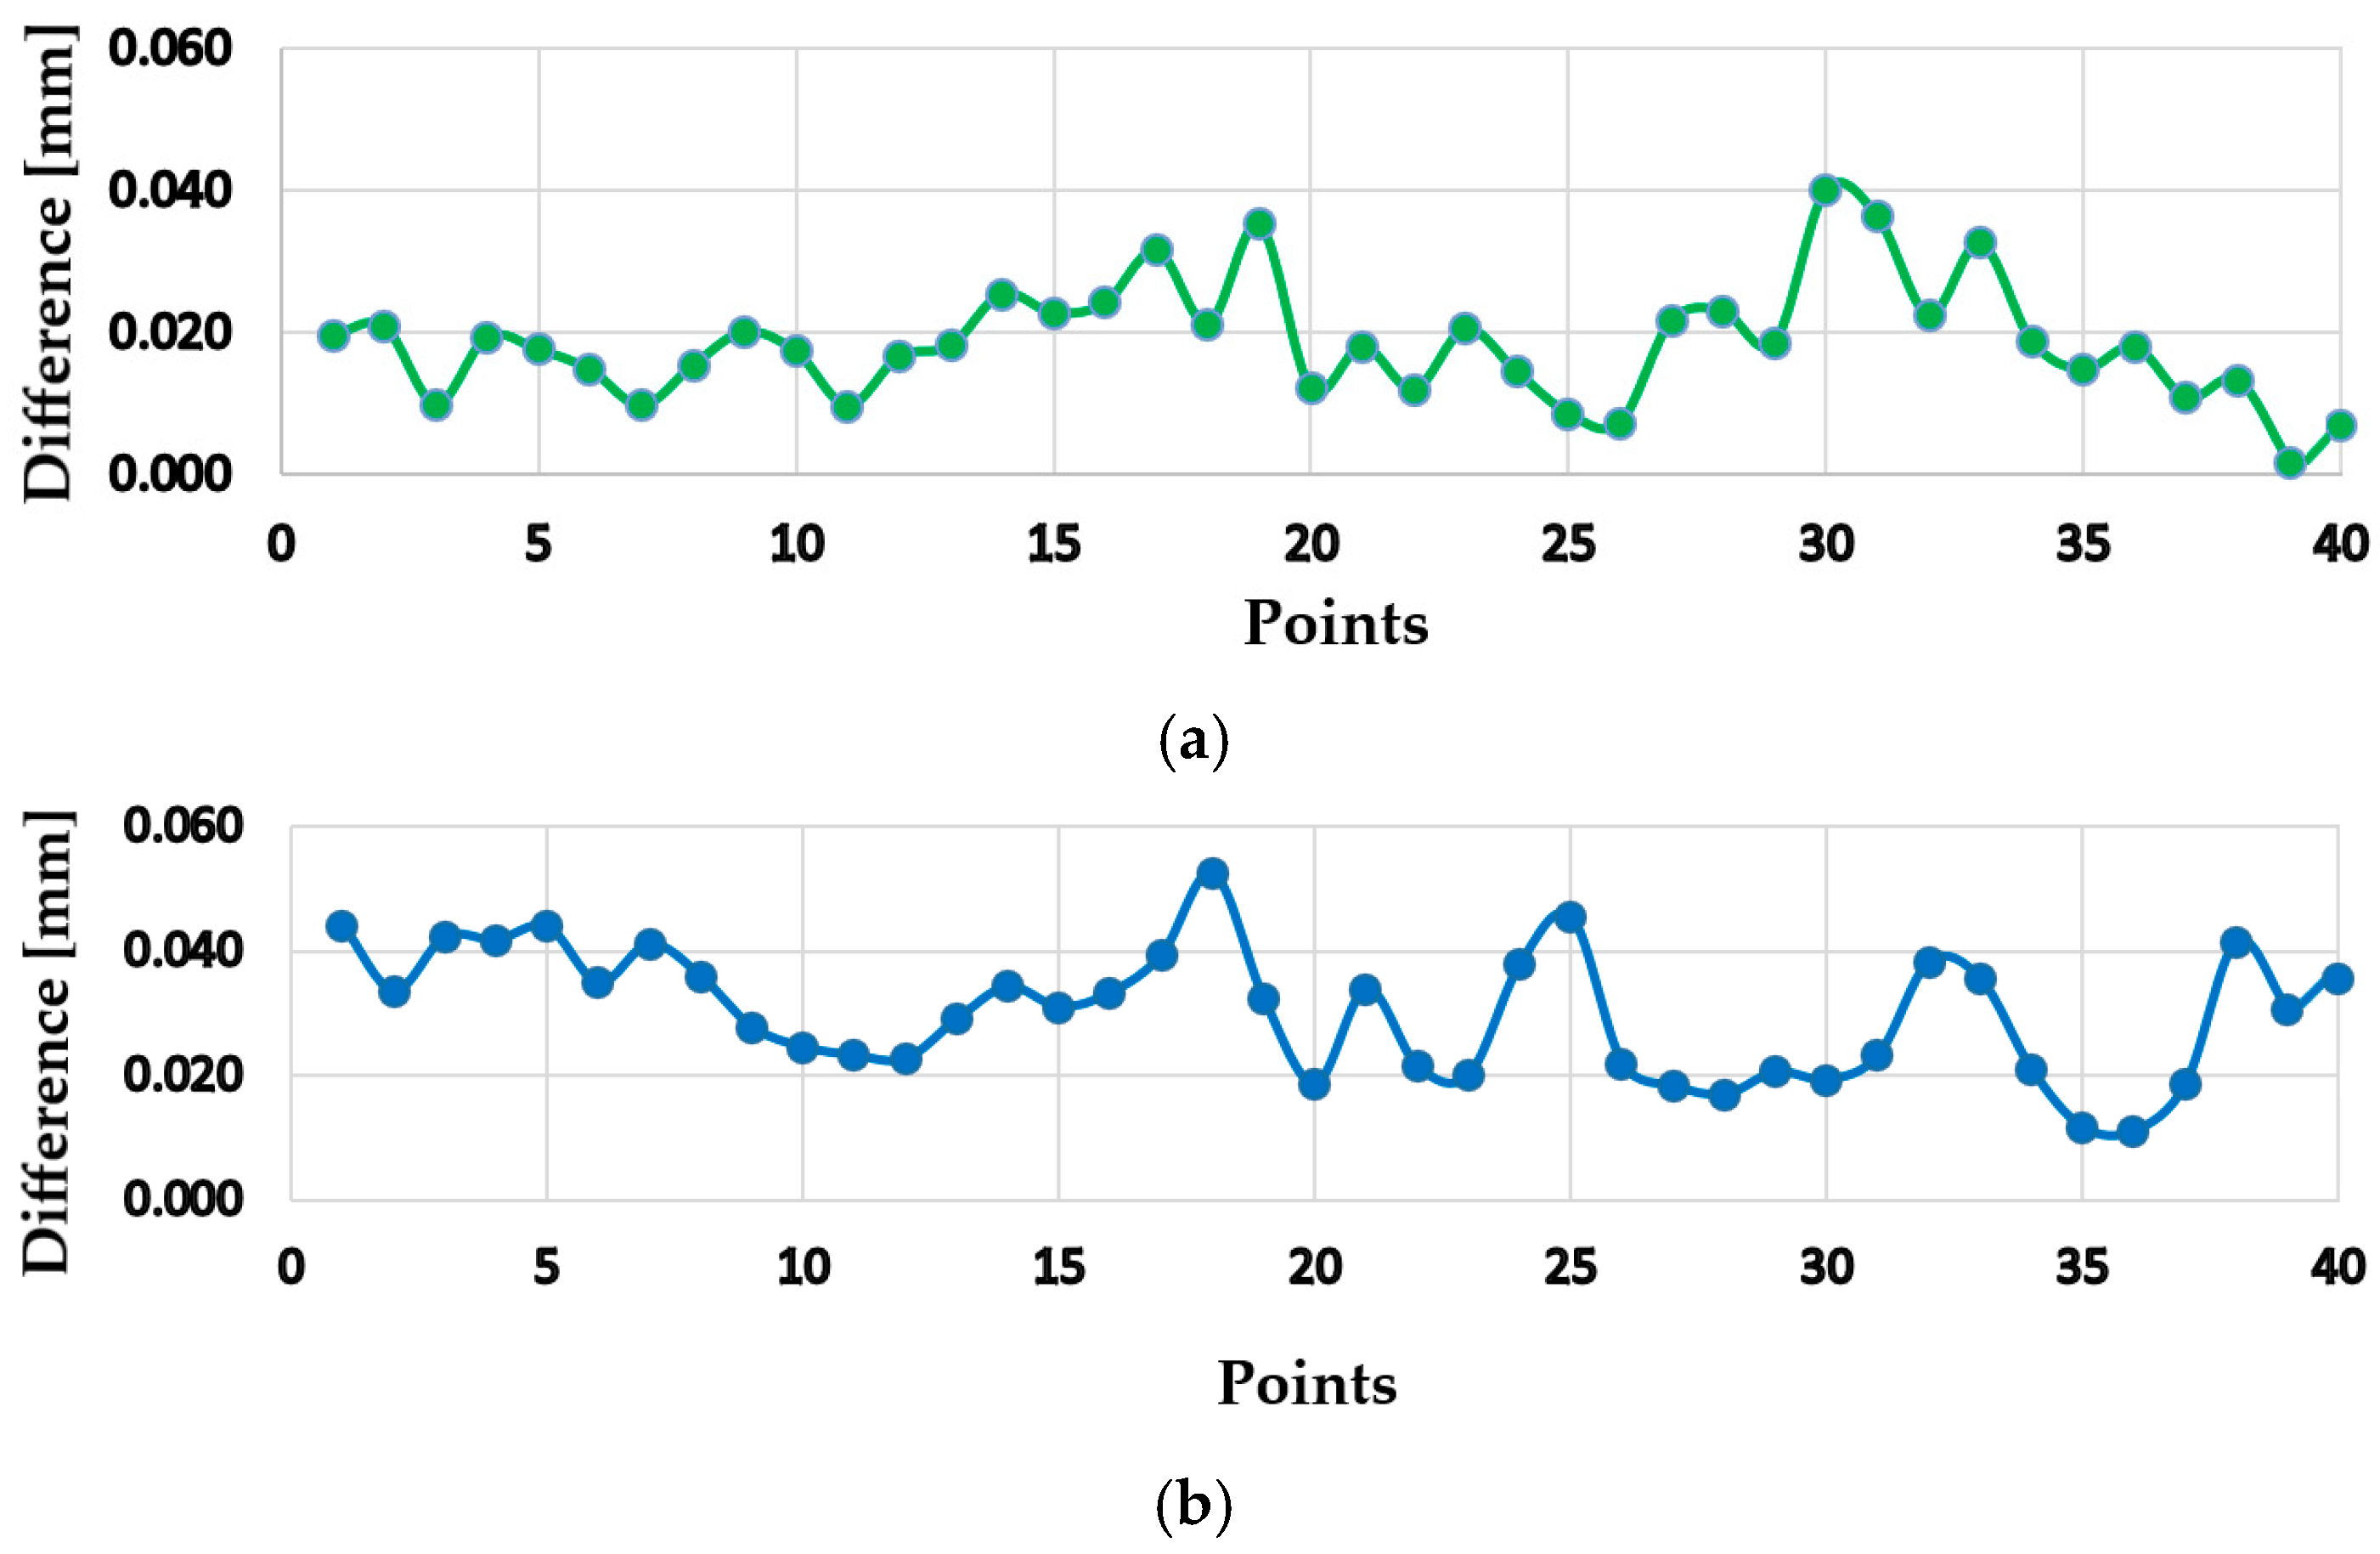
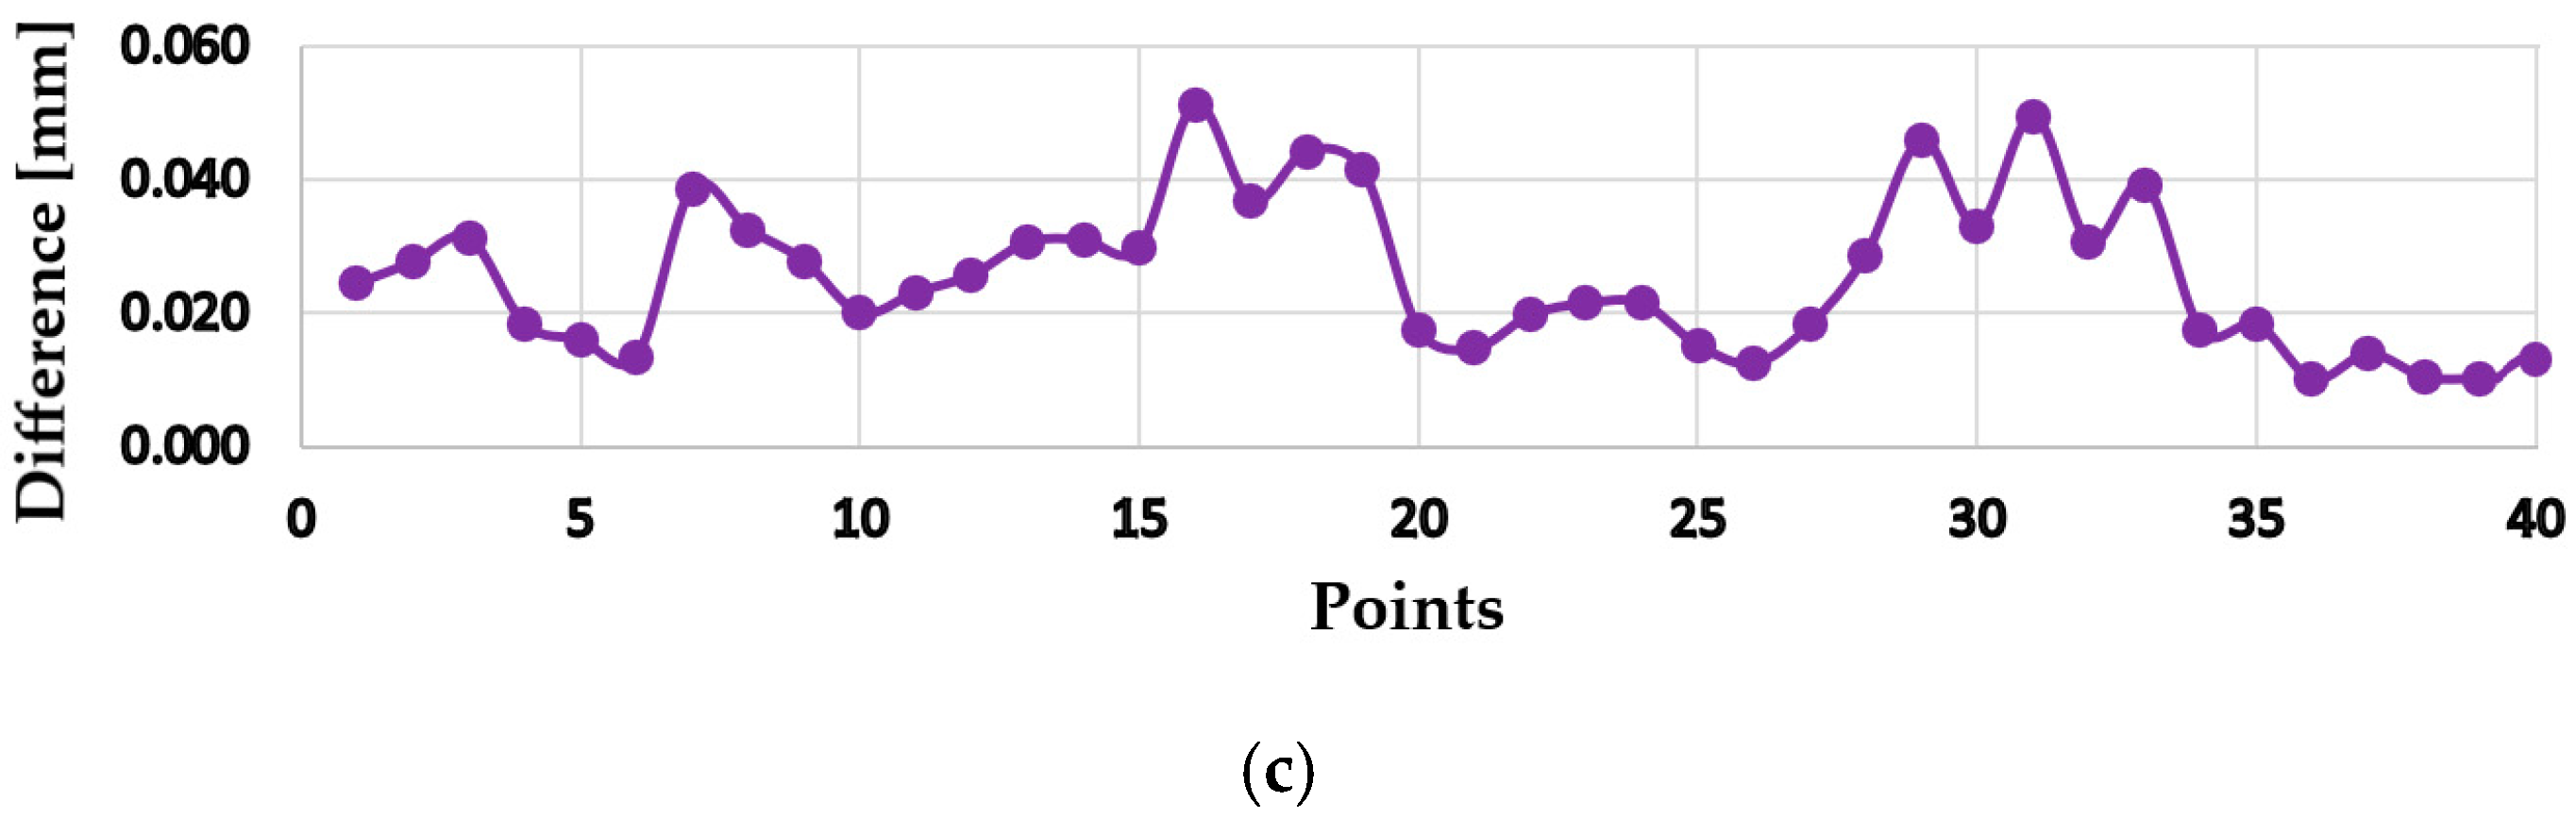
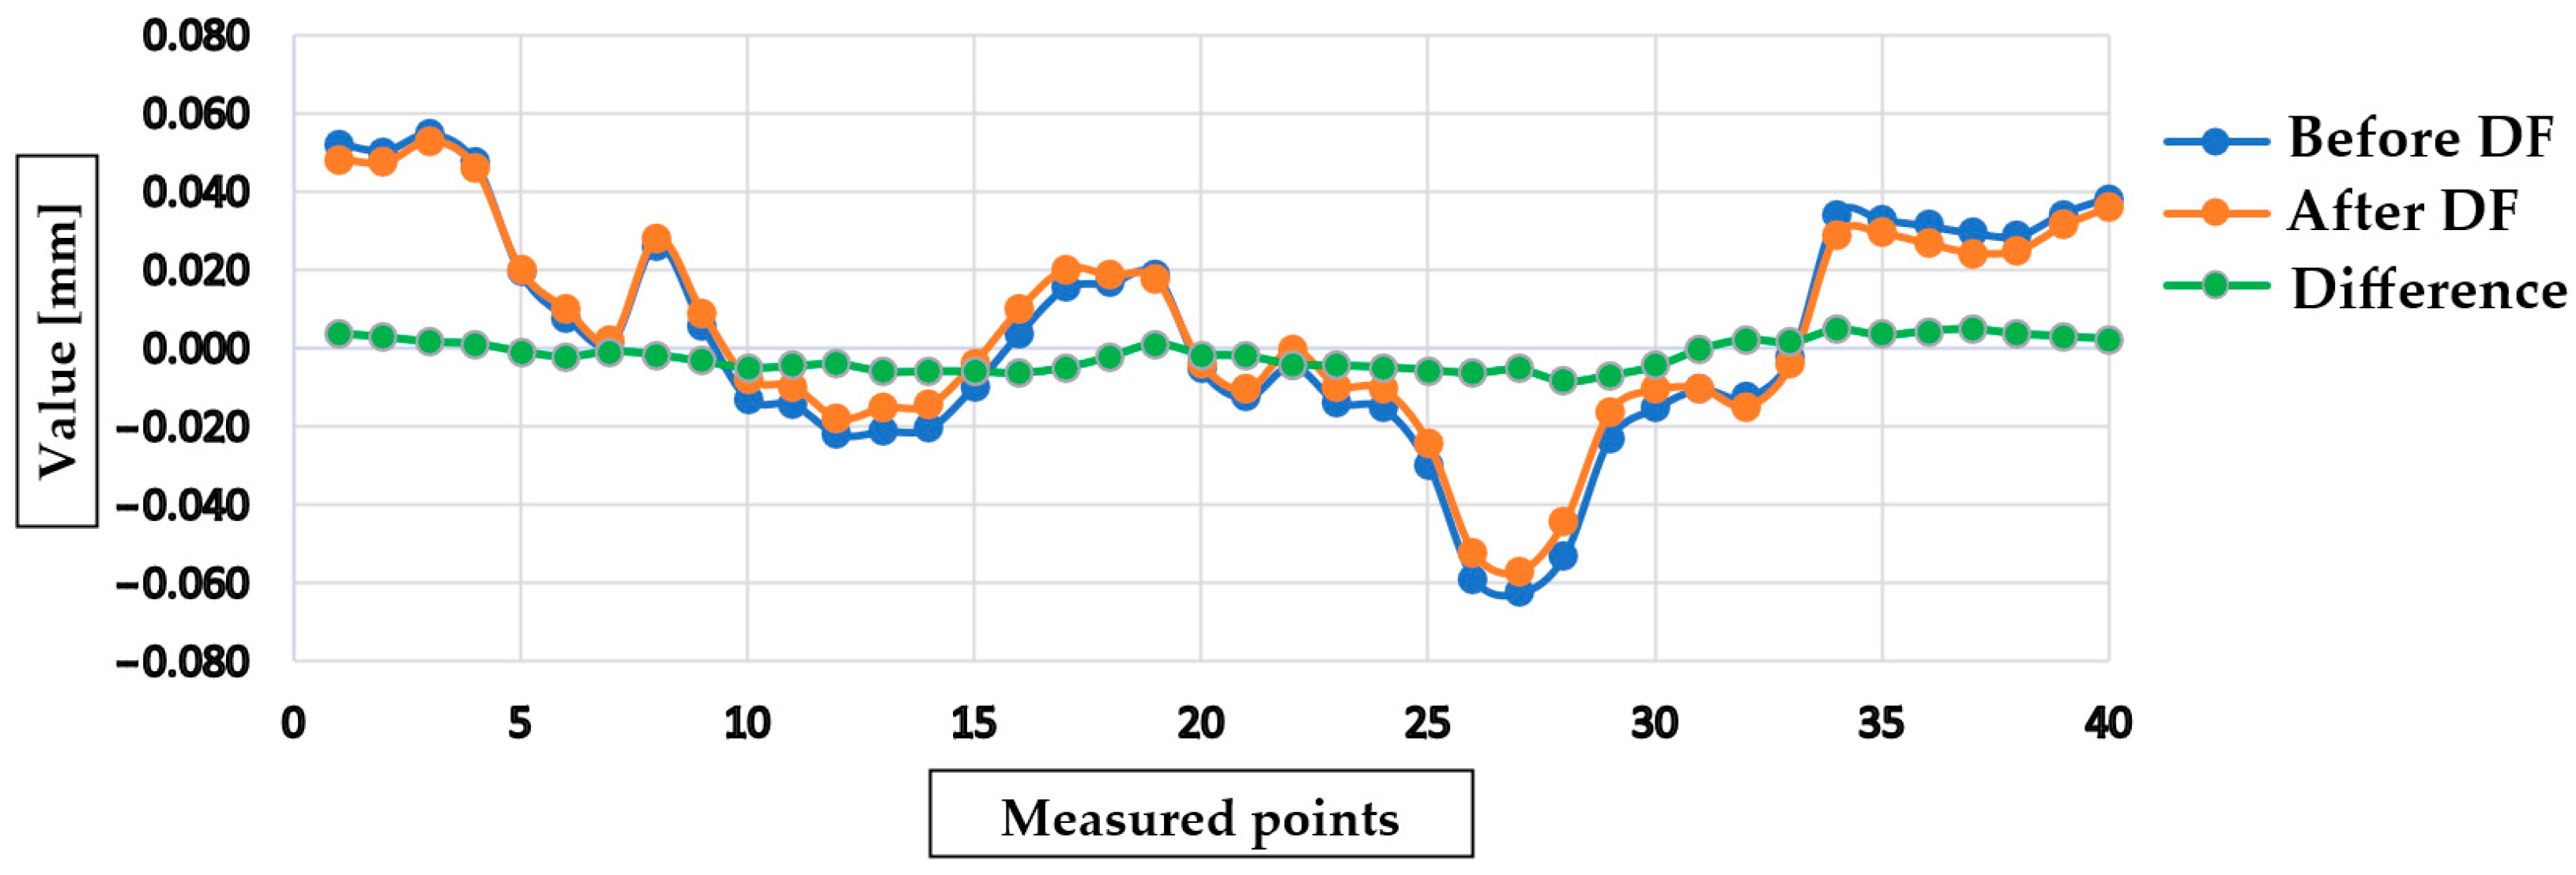
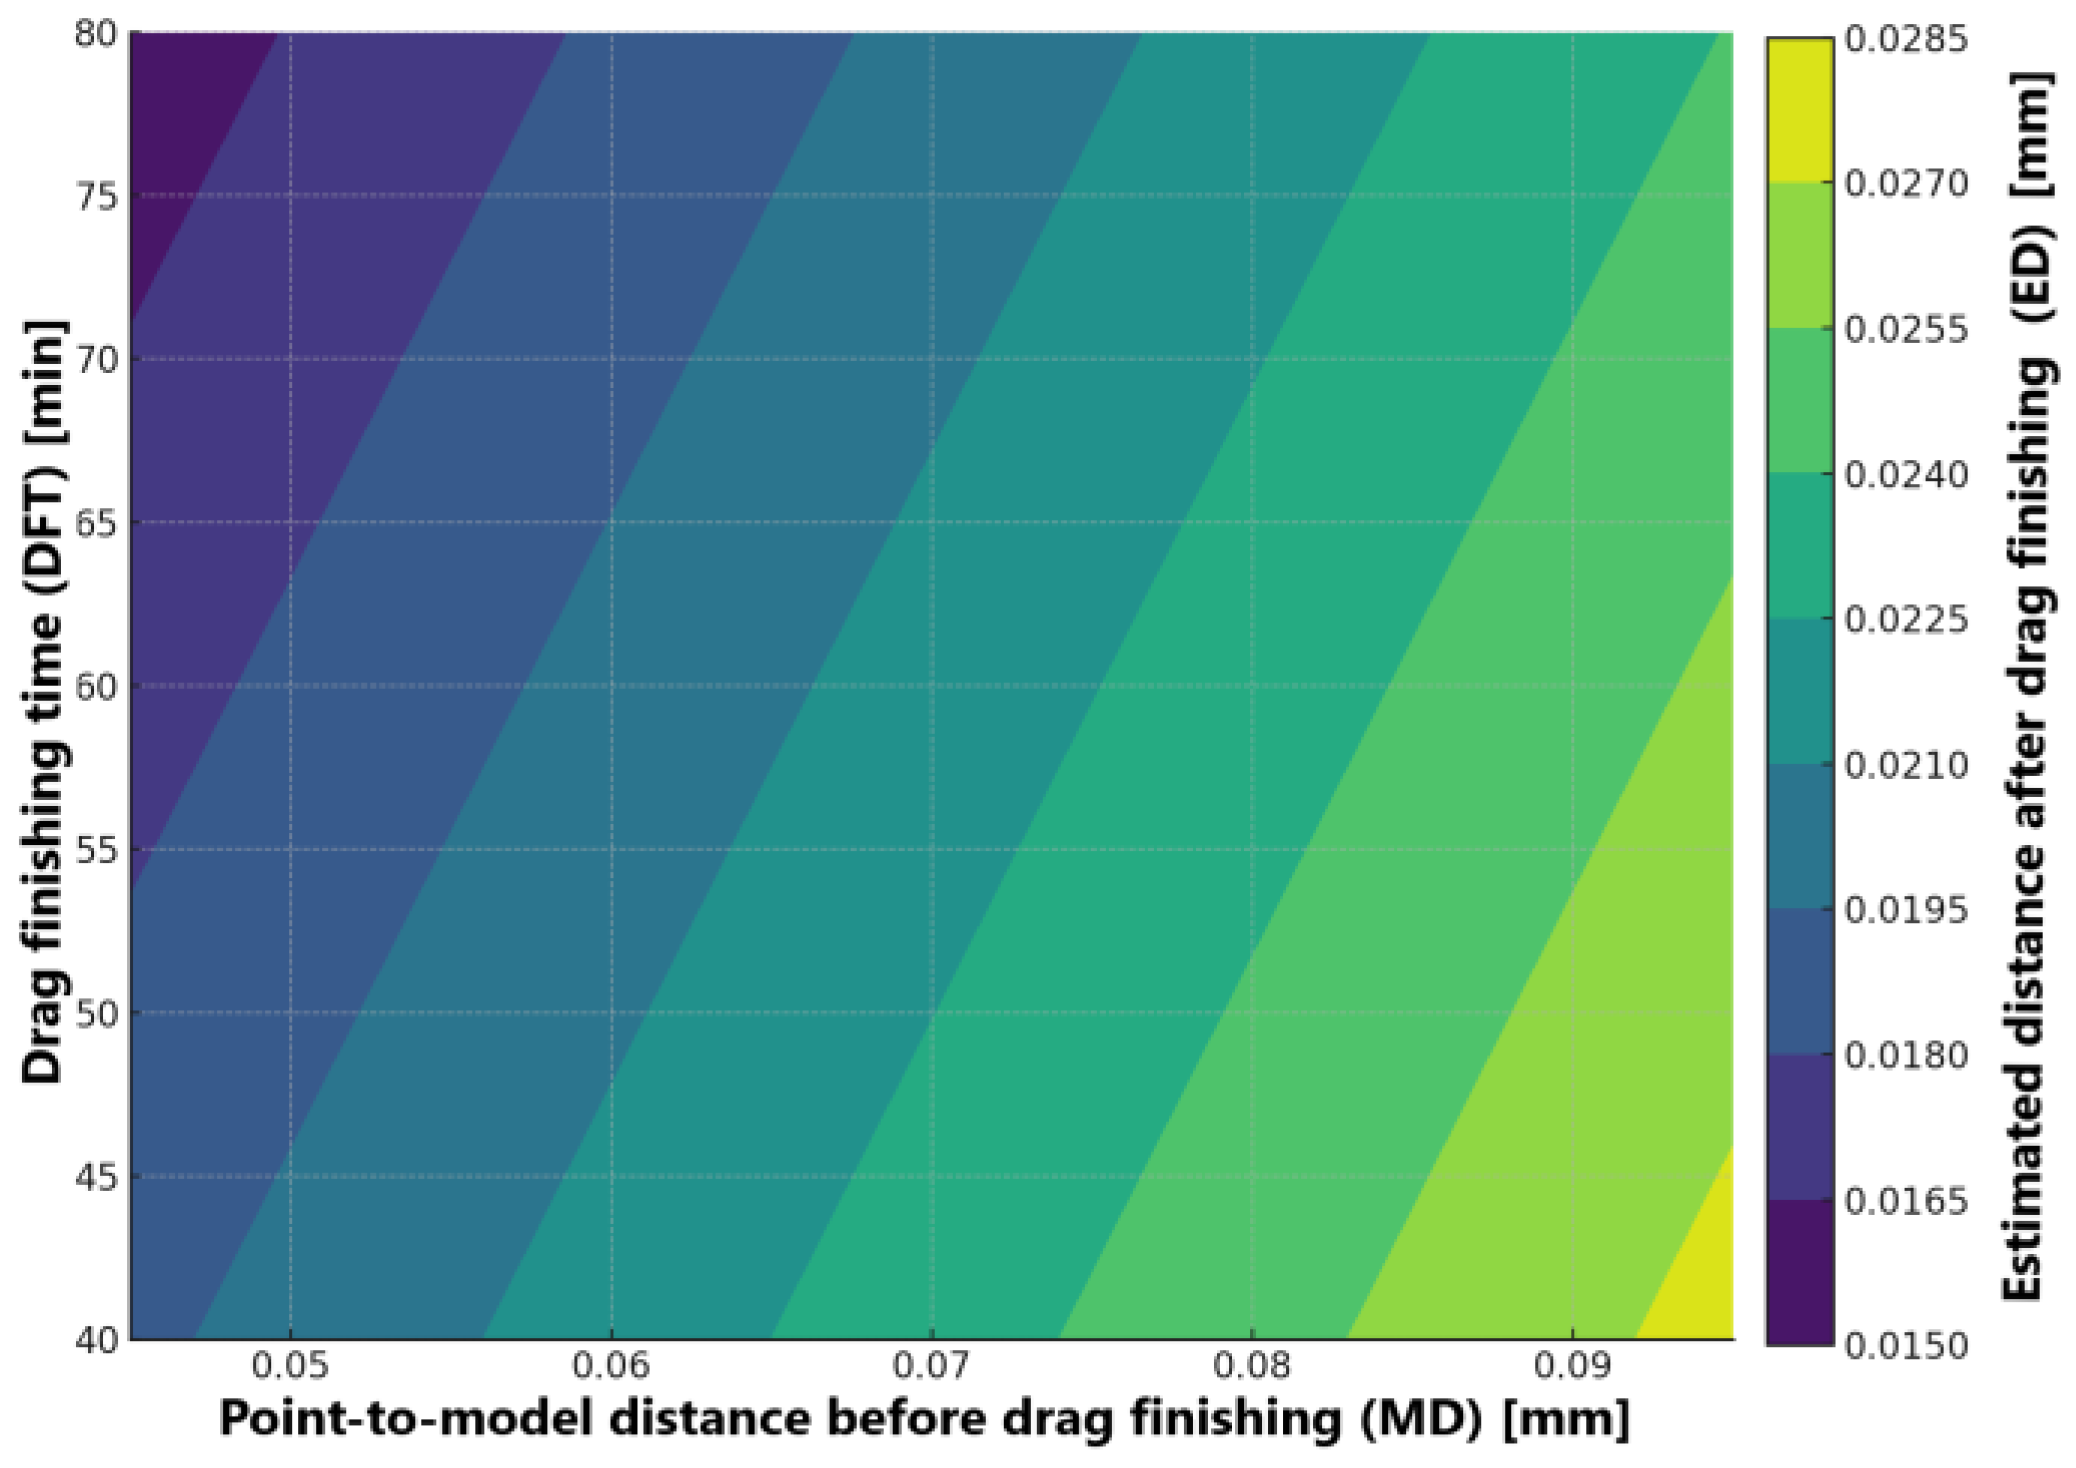
3.2. Dimensional Deviations—Accuracy

The graphs shown in Figure 10 summarize the CMM work, where the difference values between the virtual model points and the actual ones located on DF surfaces are depicted (point-to-3D-model distance measurements). In Figure 10, the measured points considered are from the outside of the dental crown. To gain a deeper comprehension, values around the 0.00 difference level mean that the DF parameters improve the accuracy of the PBF-LB/M crown, and dimensional deviations are very limited. For example, DF3 finishing reduced the dimensional deviations on the outside crown walls, and the difference values between the virtual model and the surfaces range from +0.010 to +0.050 mm. Because in all the cases, the difference in distance has predominantly positive values, this means that the DF process did not polish the surfaces too much and affect the thin walls of the crown. After DF post-processing, each sample had reduced geometrical deviations.
Figure 11 shows a representative CMM graph obtained from the measurements recorded inside of the crown cavity (intaglio surface). Forty points are considered, and the difference between them, before and after DF, is marked with a green line (Figure 11). In general, the green line of difference is ±0.005 mm from the 0.000 level, which means that the post-processing did not remove material from the inner surfaces of the crown. To release abrasive grains from the cavity during the DF process, the crowns were ejected seven times. When the crowns were immersed in abrasive media, their cavity was very rapidly filled with abrasive grains, which limited the removal mechanism. Moreover, the reduced size of the crown cavity restricted the movement of the abrasive (11.40 × 8.60 mm).
Point-to-3D-model distance measurements were performed on the inner surfaces of crown (as-built vs. DF surface).

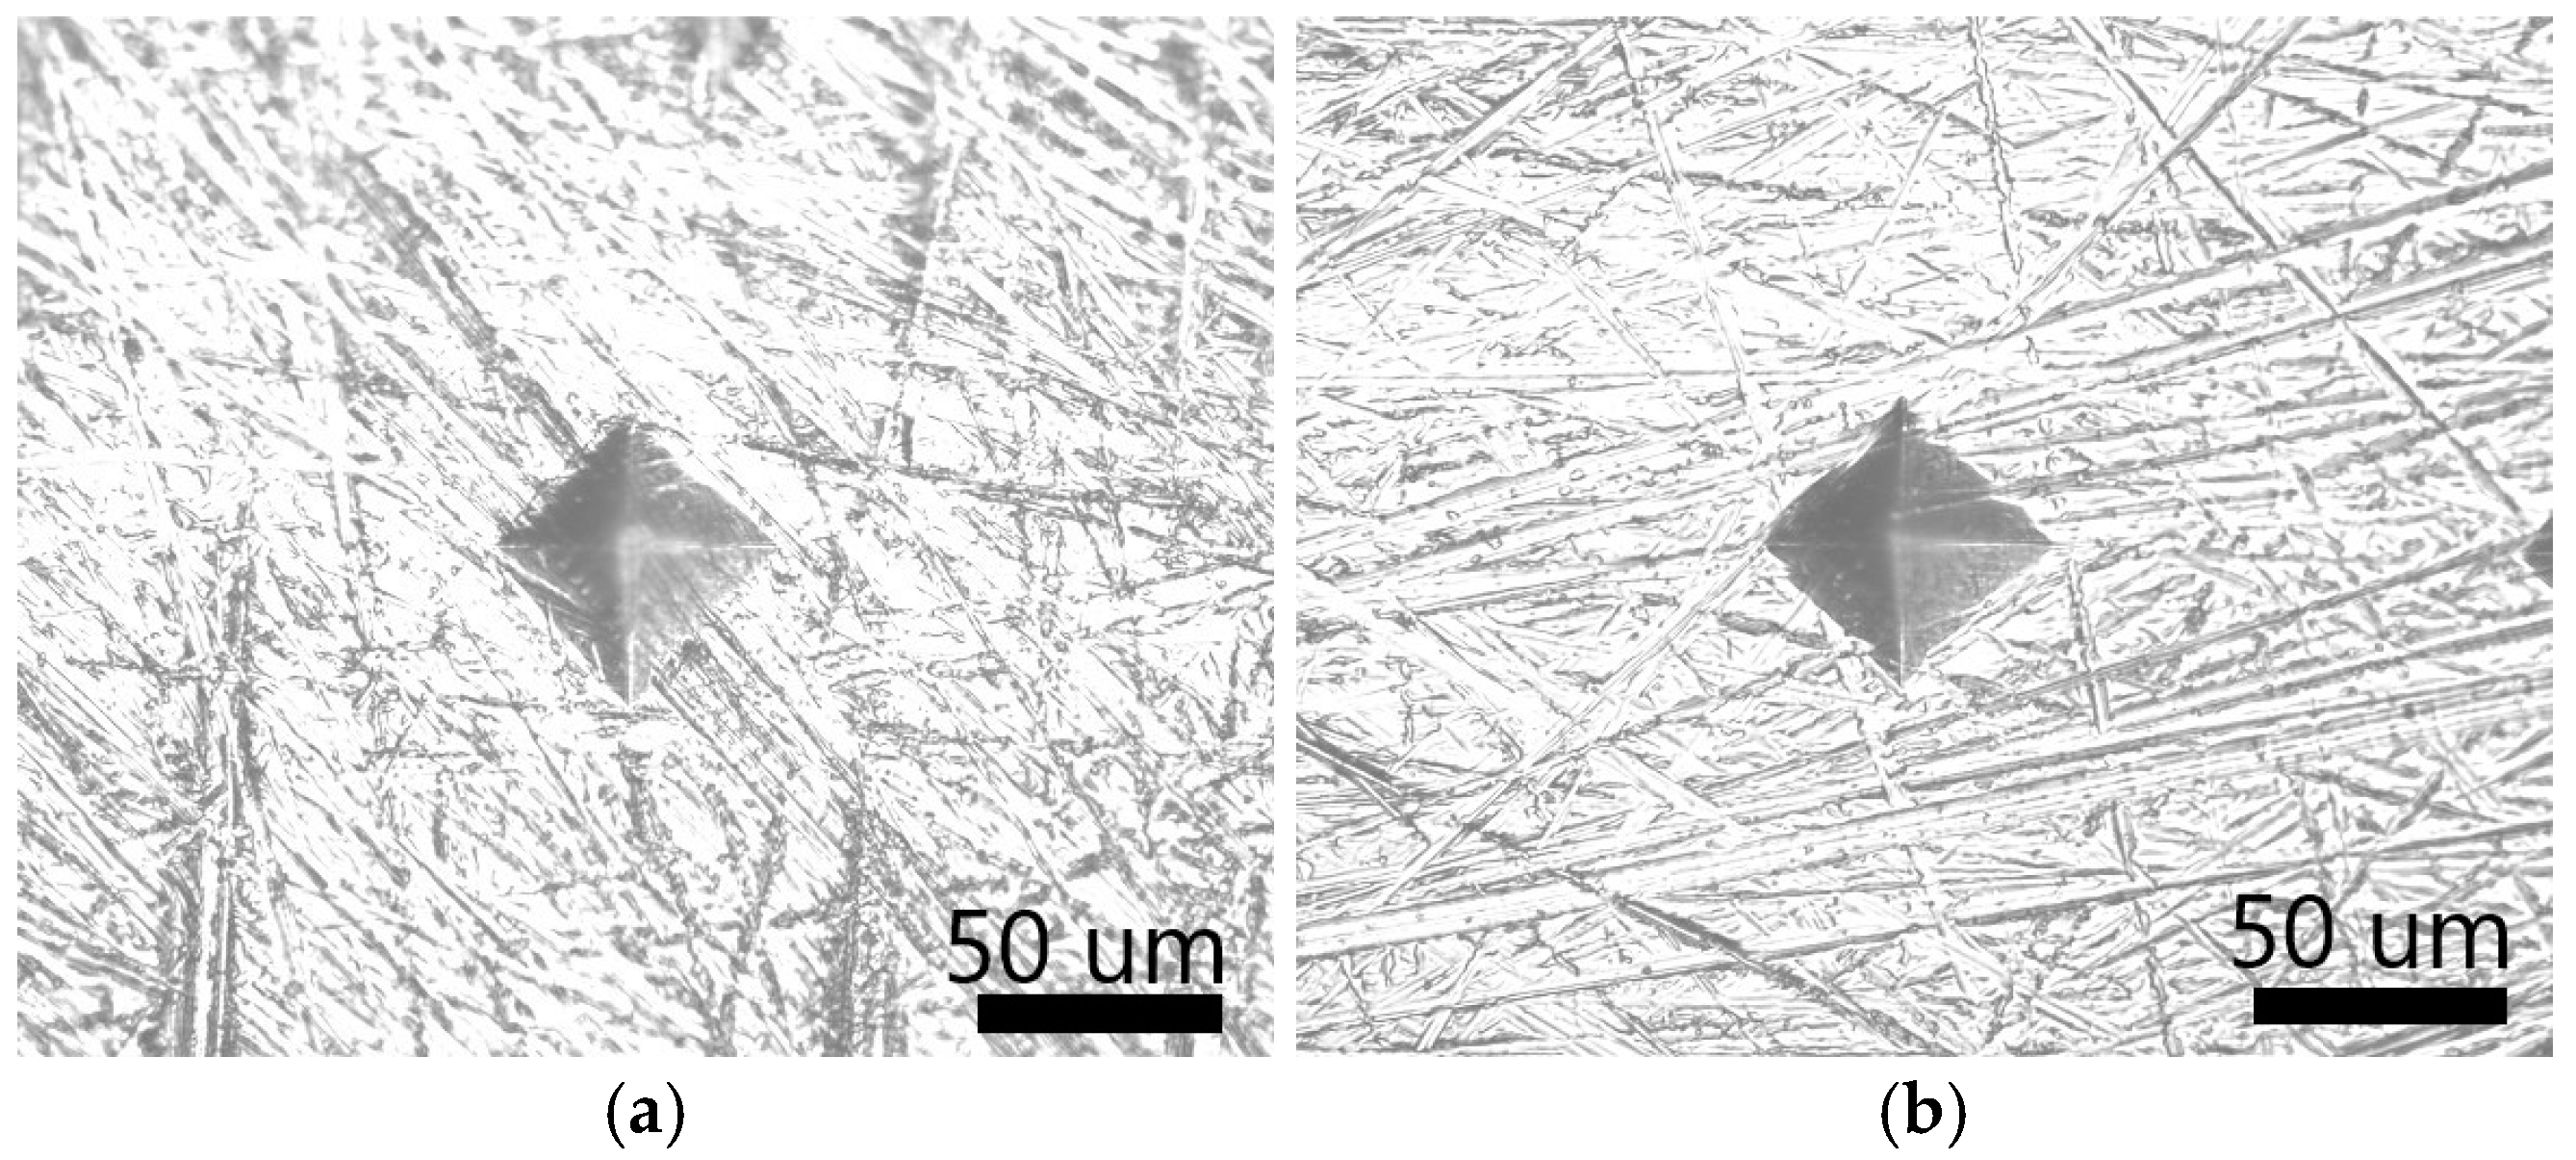
3.3. Surface Hardness

Figure 12 displays representative micrographs of Vickers indentations. The indentation impression shape was a little distorted because of elastic recovery, which is common for anisotropic materials [2]. This effect is more pronounced on as-built surfaces (Figure 12a). The Vickers hardness scores are depicted in Table 7. The CoCr specimens post-processed with DF had a hardness between 524 HV1 and 530 HV1. The DF3 parameters reduced the standard deviation of the mean value to ±27 HV1.

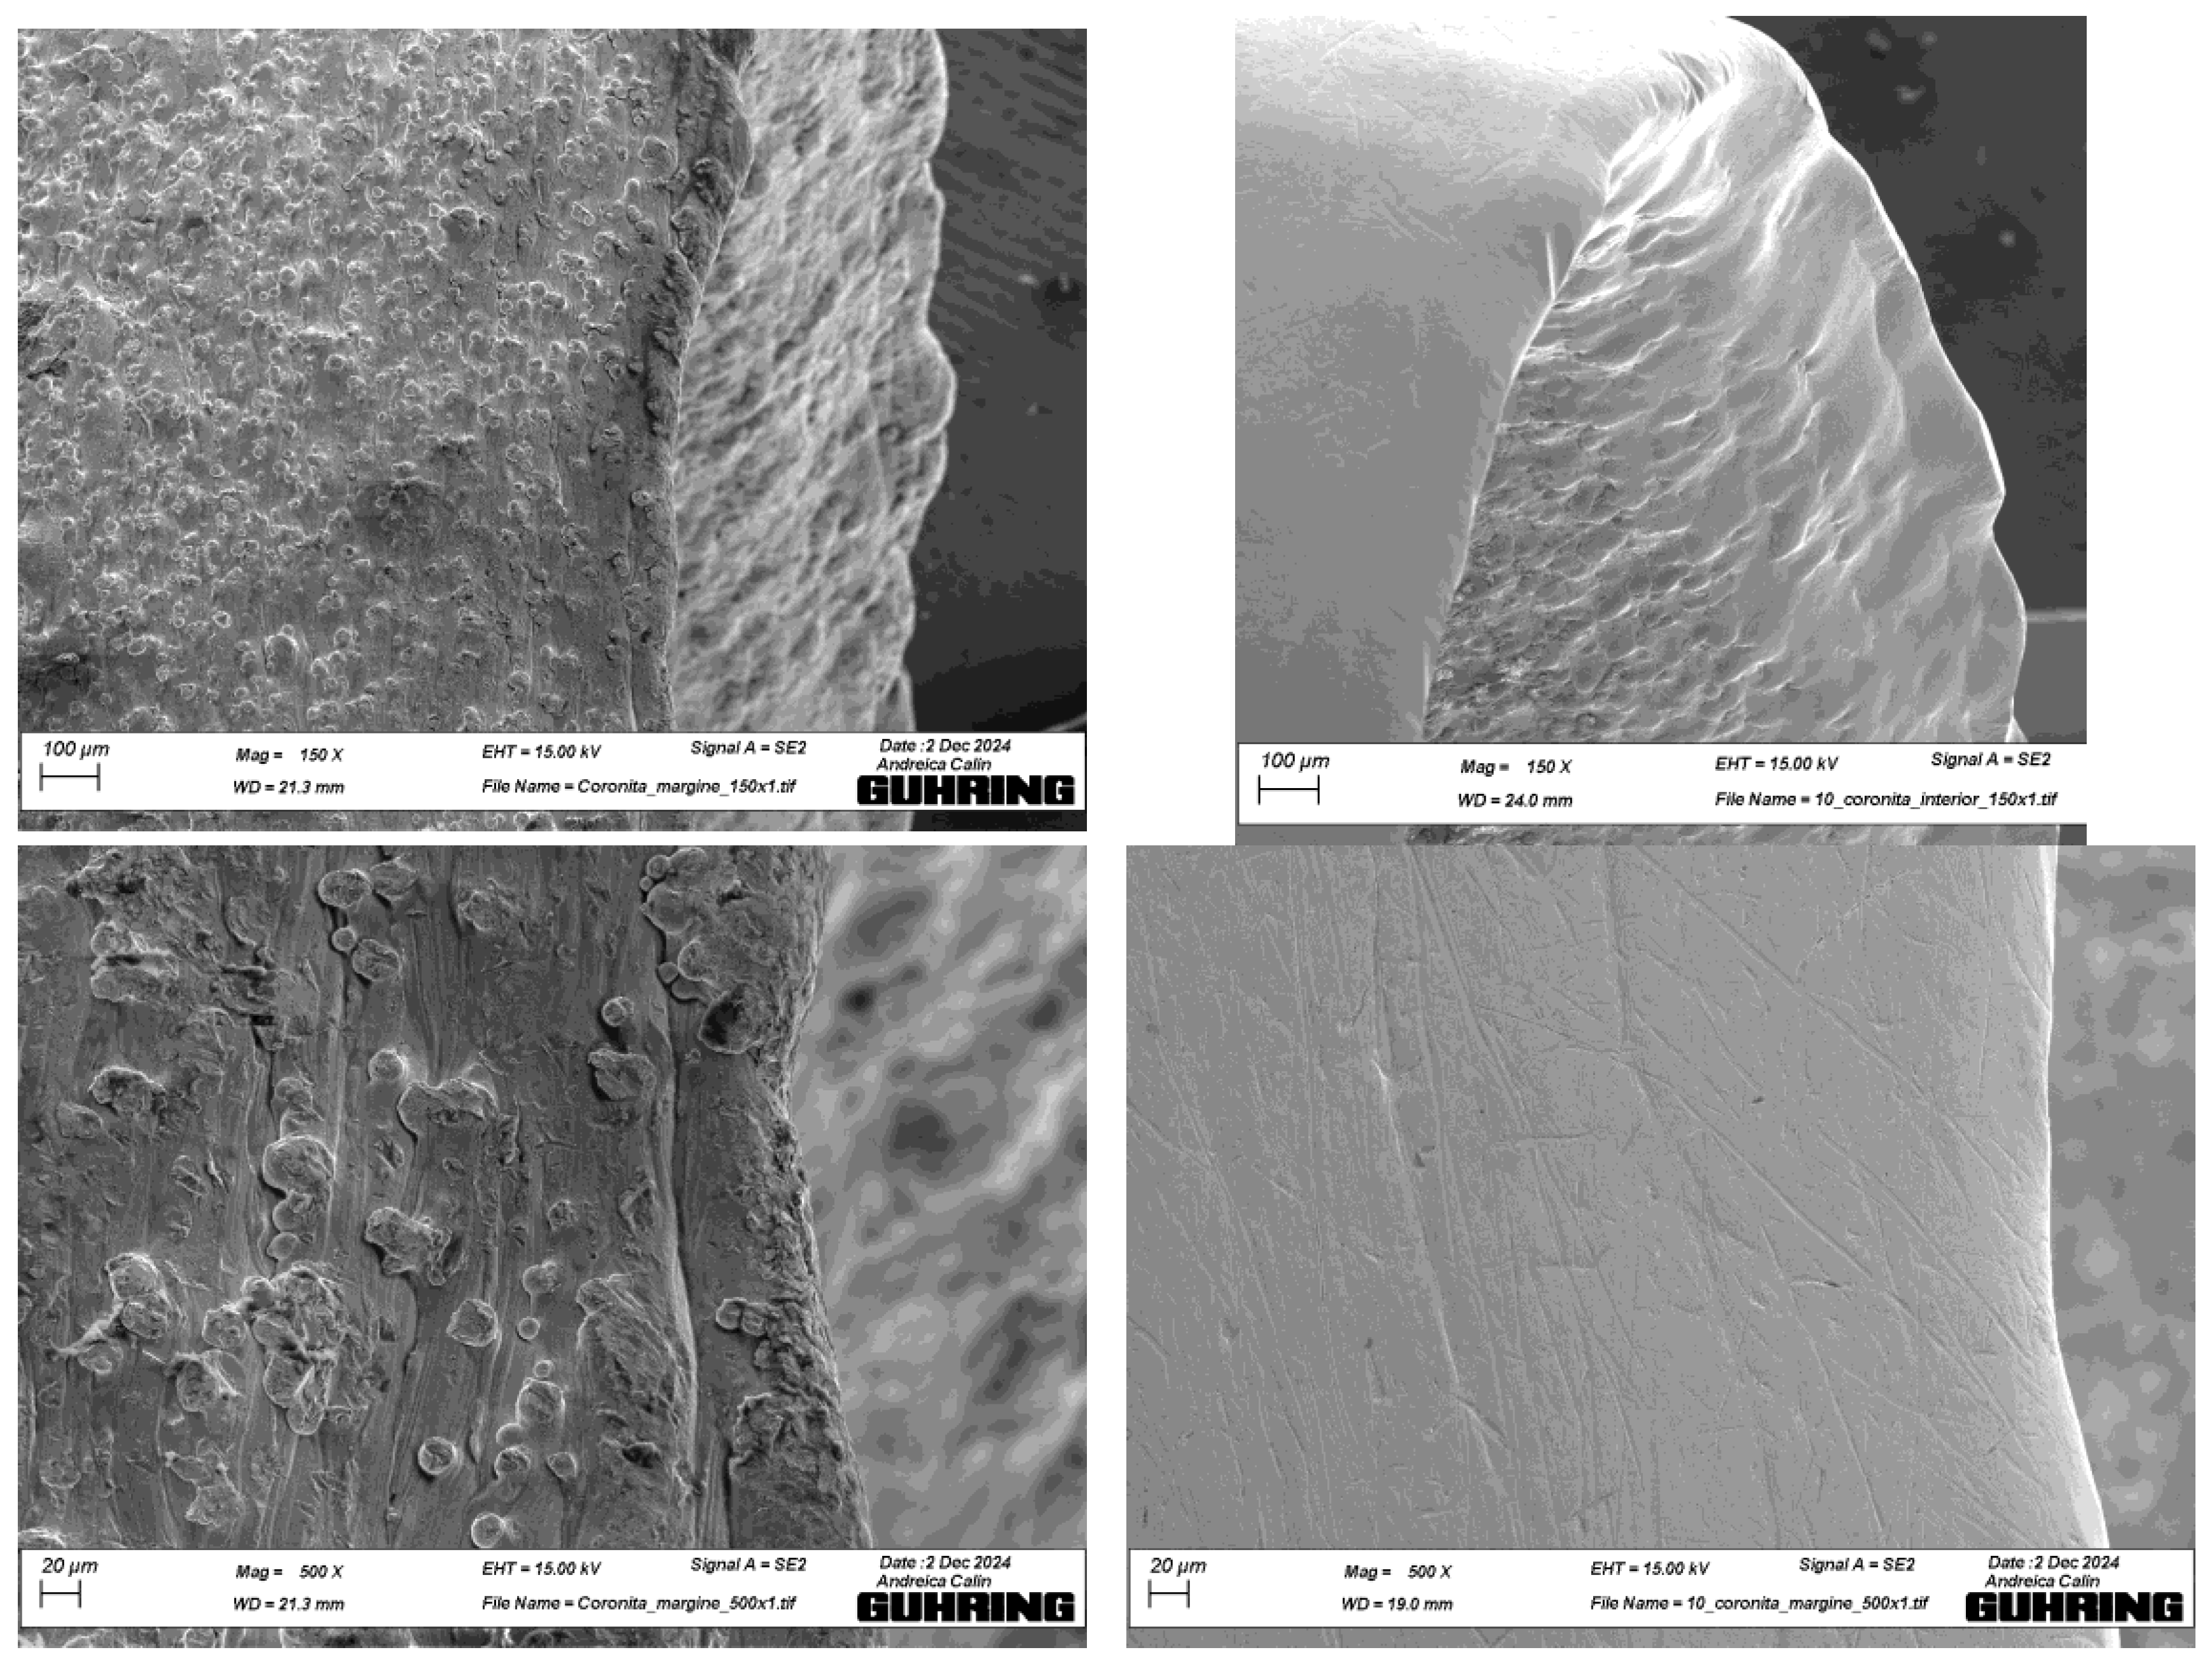
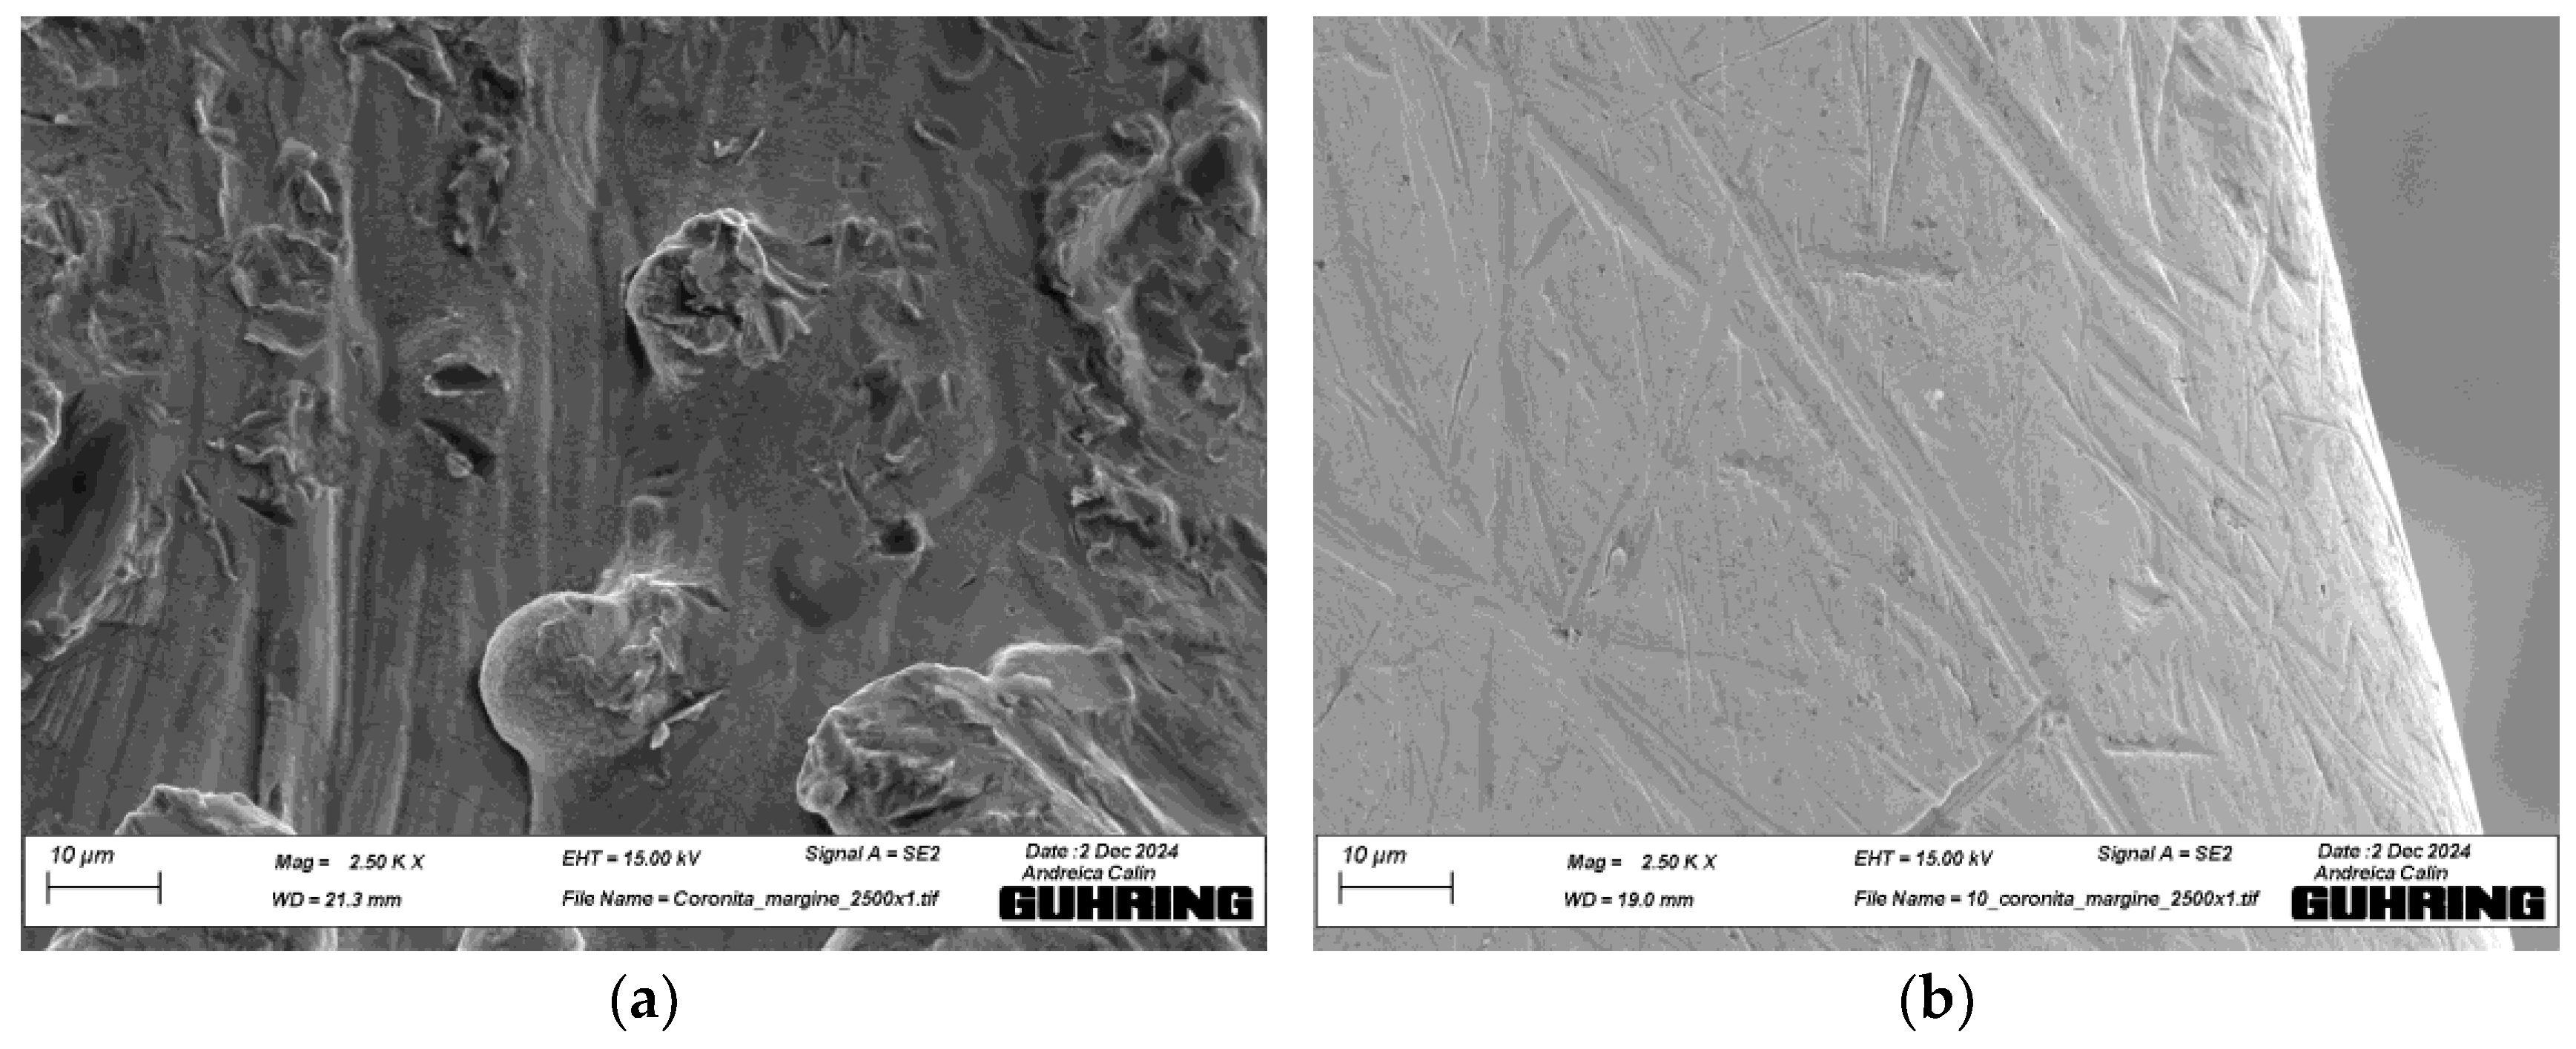
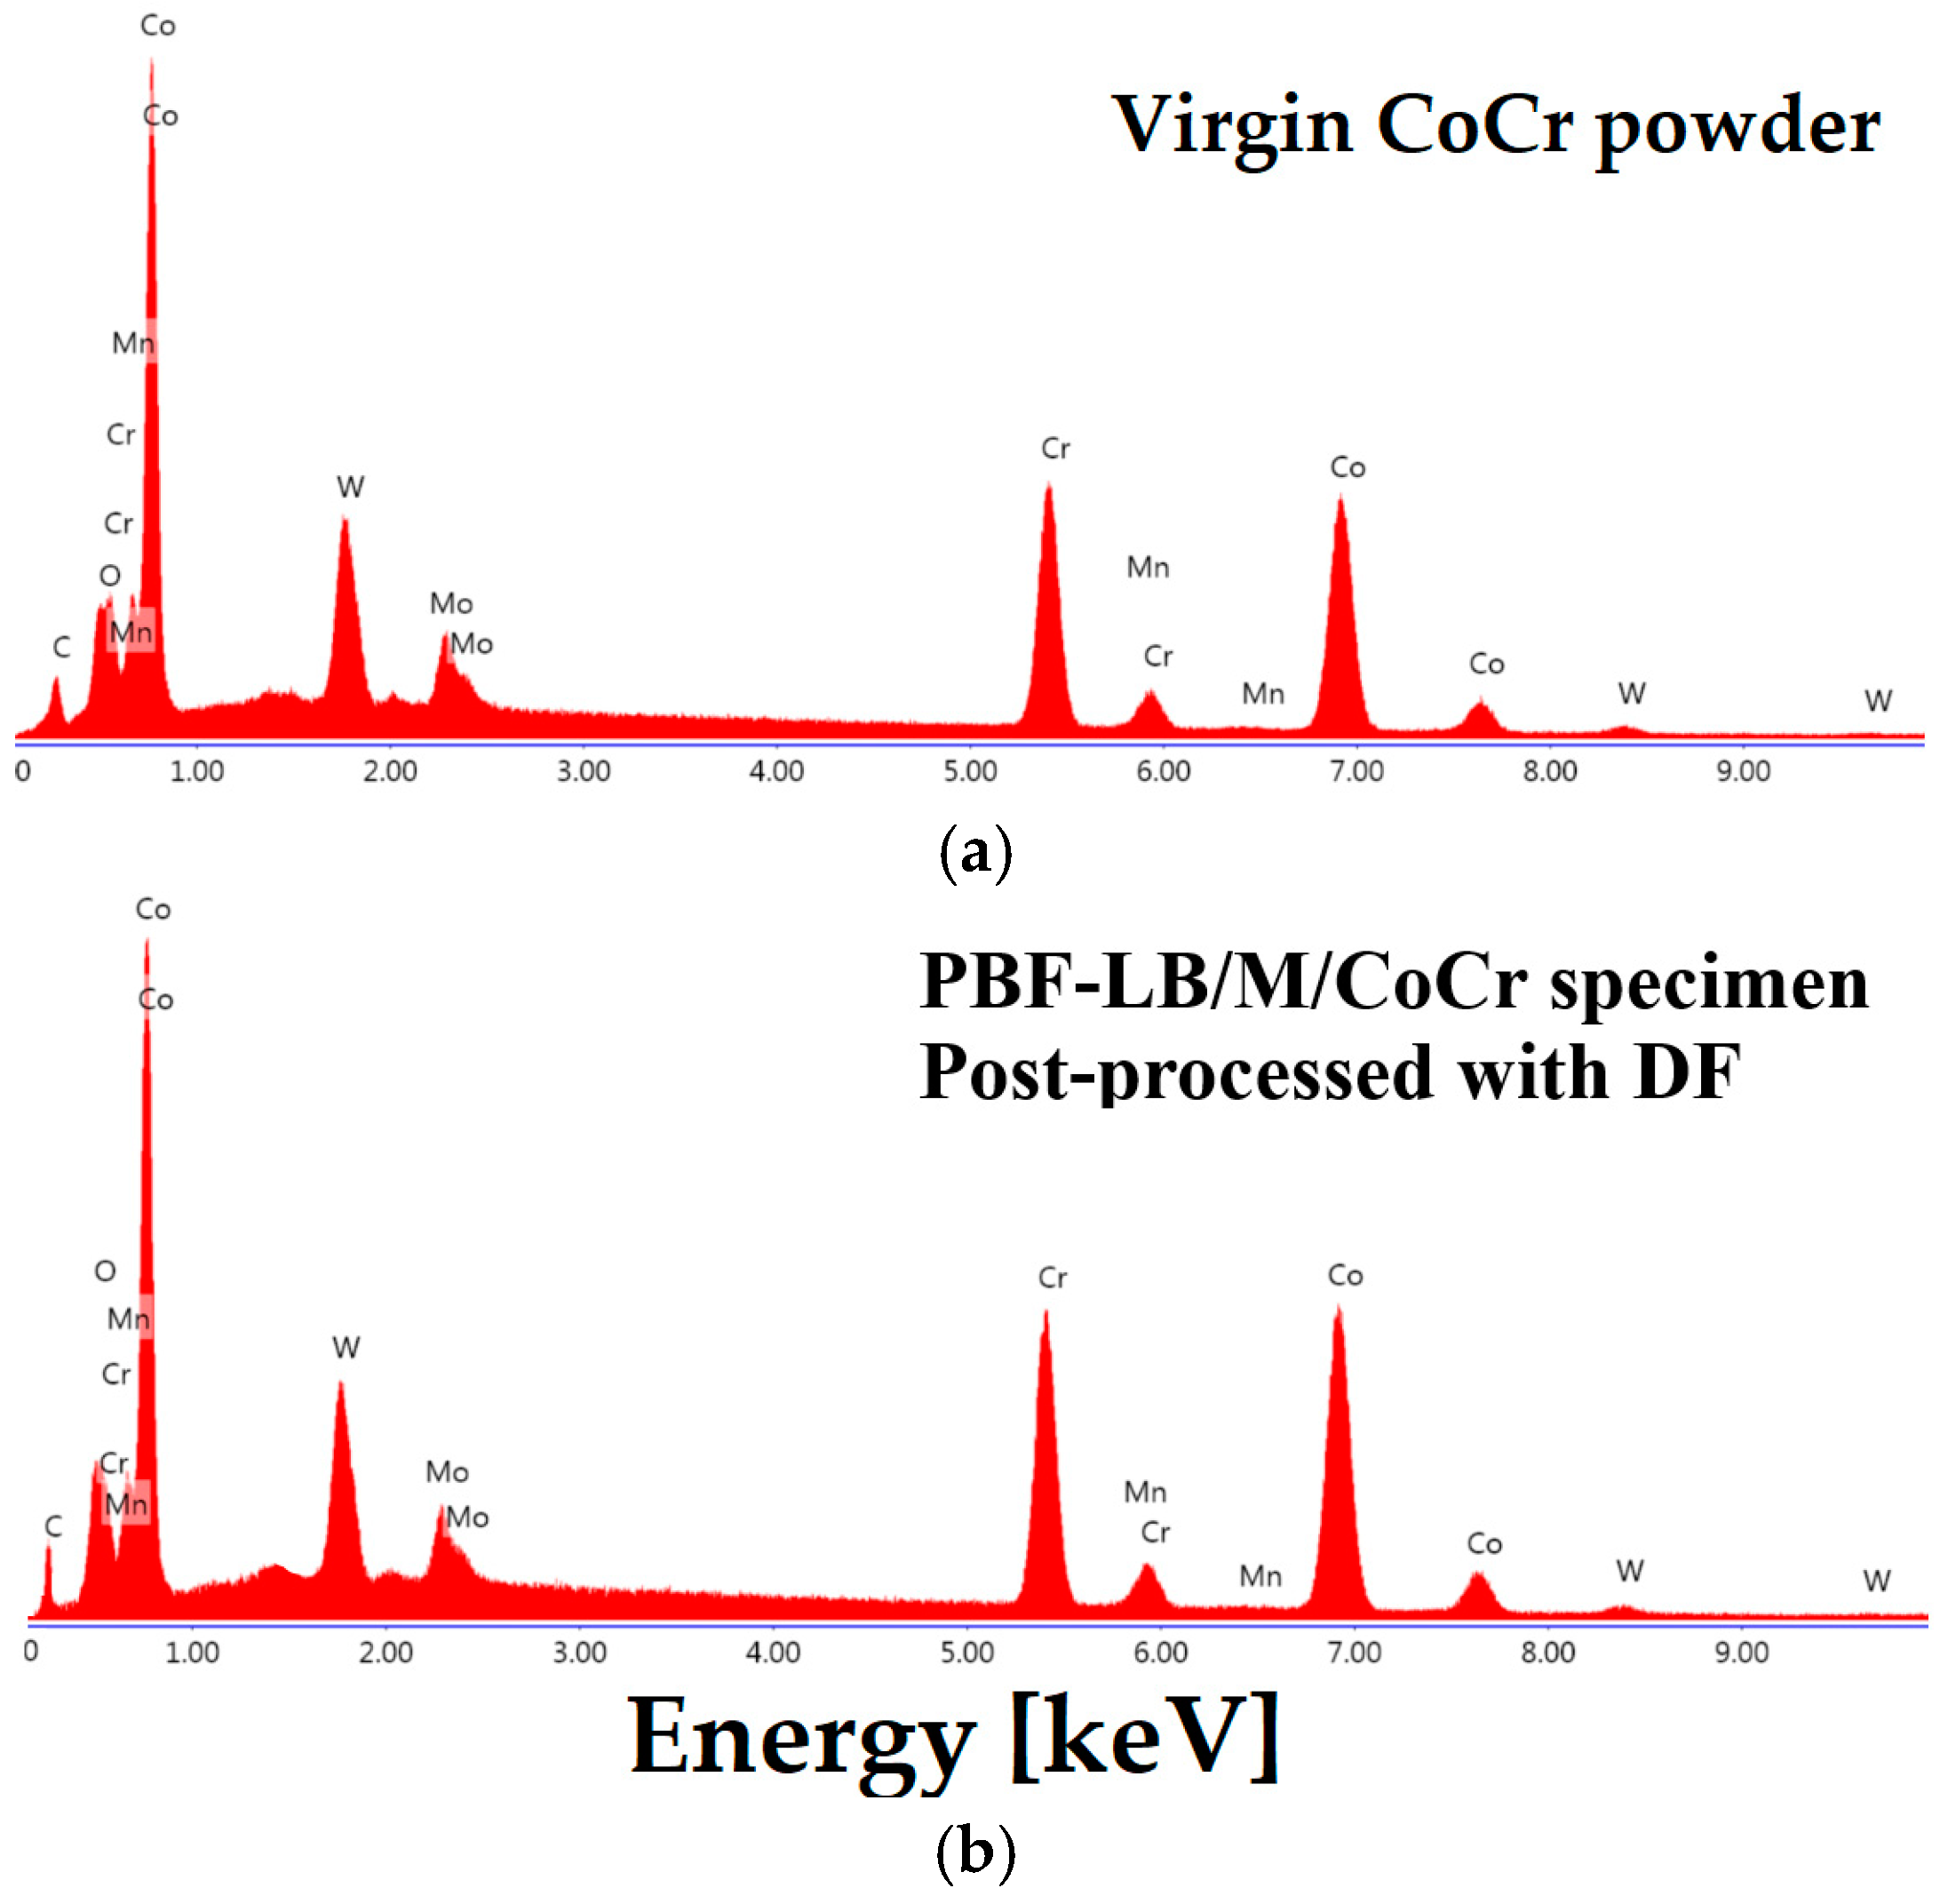
3.4. SEM Analysis of Microstructure

Representative SEM images for the analysis of surface morphology prior to and following DF post-processing are presented in Figure 13. On as-built surfaces, a large amount of unmelted or partially melted grains were adhered to the surfaces, and tightly spaced straight contours were found (Figure 13a). Due to layering, the microtopography of surfaces contains specific waviness (Figure 13a). The initial surface was rough. However, after DF post-processing, a significant improvement on the outer surfaces was achieved, as can be seen in Figure 13b. Large droplets and sintered particles were removed. A smooth, uniform, and dense geometry can be observed across the entire outer surfaces. Grinding tracks are visible, caused by the solid abrasive particles (HSC 1/300). It can also be observed that the underlying surface is free of cracks. The chamfer margins were polished on both the intaglio (inner) and external (outer) surfaces (Figure 13b). An accurate and polished chamfer is beneficial for the long-term stability of a dental crown. The inner surfaces were limitedly polished, as can be seen in Figure 13b (top-right image). To reduce the surface roughness of the inner surfaces, a finer abrasive powder should be considered. On the other hand, micro-roughness of the inner surfaces can increase the adhesion of luting cement. Luting cement is used to bond a CoCr dental crown onto a prepared tooth (dentine tissue), and its thickness is between 25 μm and 40 μm. For clinical application, future in vitro studies will evaluate the shear bond strength of different cements applied to CoCr parts fabricated by the PBF-LB/M method and post-processed with DF.
In the as-built state, the PBF-LB/M microstructures exhibited specific fine cellular or columnar dendritic structures [48]. Compared with conventional casting, finer grains were obtained through the PBF-LB/M process, which contributed to excellent mechanical properties. Because the samples were exposed to heat treatment at 860 °C for 1 h to release residual stress, the specific fine dendritic structures were found to disappear, and grain boundaries became decorated with precipitates. A similar microstructure was reported for CoCr samples heat-treated at 750–900 °C for stress relief [48,49]. Moreover, the highest mechanical resistance was obtained when the heat treatment was performed at 850 °C for 1 h [49]. Previous research has shown that after heat treatment, the composition segregations caused by non-equilibrium solidification are gradually eliminated, so both the molten pool and cellular boundaries vanish [49]. After heat treatment, intermetallic compounds gradually precipitated. As the SEM images in Figure 14 show, many fine intermetallic compounds were densely precipitated in the CoCr specimens.
To test whether the DF method contaminated or changed the chemical composition of surfaces, EDAX spectrometry was used to compare the original powder and post-processed specimens. Within the limitations of the EDAX analyses, no variation in elemental composition was identified (Figure 15).

3.5. Statistical Analysis

A model was created to evaluate the significance level (p < α, α = 0.05). The model was created according to the methodology described. Using this model, the effects of initial surface roughness and DF duration were tested. The p-value was less than 0.05 (or 5%). This means that no other influences or selected parameters had any influence on the tests performed. By confirming the homogeneity of the tested samples, it was possible to construct a linear model. The model was created to estimate the Ra roughness of the outer surface after the drag finishing procedure. In this linear model, the following parameters were substituted into the Regression Equation (1):
ER = 2.695 + 0.0512 × RAP − 0.03214 × DFT
where ER is the estimated Ra roughness of outer surfaces after drag finishing (μm), RAP is the initial roughness after printing (μm), and DFT is the drag finishing time (min).
This equation suggests that for every 1 μm increase in initial roughness, the final Ra increases by 0.0512 μm, assuming the same drag finishing time. On the other hand, if the DF time increases by 1 min, the Ra decreases by 0.03214 μm. Another way to predict the surface roughness is by using the graph created from this regression function. To construct a graphical model, it is necessary to know the input values—in our case, the initial surface roughness after the printing process (RAP) and the drag finishing time (DFT). The intersection of these values is the resulting surface roughness. The graphical model is shown in Figure 16.
In the case of statistical processing of data from the measurement of the point-to-model distance, the same procedure was used. The linear model was calculated, and the following parameters were substituted into Equation (2):
ED = 0.0151 + 0.1669 × MD − 0.0000861 × DFT
where ED is the estimated distance between the outer CMM point and the 3D model after the DF procedure (μm); MD is the point-to-model distance, or the measured distance between the determinate CMM point and the 3D model, measured before the DF procedure (μm); and DFT is the drag finishing time (min).
MD is the dominant factor influencing the ED value, and the DF time can help to reduce the distance between the CMM points and the 3D model, but its effect is much smaller. In other words, ED values could predict material loss on outer surfaces after the DF procedure. Next, a graphical model was created, where based on the point-to-model value of the printed crown and the drag finishing time, the expected material removed is determined by the color spectrum in the graph (Figure 17). For example, if the CoCr crowns are post-processed for 75 min, their accuracy could be improved, reducing the dimensional deviations from 0.07 mm to 0.02 mm.
It should be noted that these two equations are valid only when respecting the DF conditions detailed in Table 2 and for CoCr dental applications.
To test and validate Equations (1) and (2), five other samples were PBF-LB/M-fabricated and post-processed using drag finishing, as described in Section 2. Table 8 below summarizes the results, with analysis focused on the outer surfaces. The first model can accurately predict the Ra surface roughness after the DF procedure, considering the initial roughness and the drag finishing time. The difference between the estimated and the measured Ra is lower than 0.05 µm. The results confirm the close match between the estimated and measured Ra values, supporting the validation of Equation (1). The coefficient of determination (R2) is 0.991, indicating a strong fit of the predicted outcome. For the second equation, the model’s average prediction error is around 2–5 microns, which may be acceptable, depending on required manufacturing tolerance. The model has a good fit for practical use, with a high R2 (0.947). It can predict material loss following the DF procedure and how the dimensional deviations of external surfaces may be minimized.

4. Discussion

Every dental application produced by the PBF-LB/M process requires two essential steps—finishing and polishing. The quality of polishing largely depends on the dental technician’s experience and manual skill, as these tasks are still performed freehand. While numerous studies have investigated the efficiency of finishing and polishing CoCr surfaces, research on fully automated post-processing methods remains limited. To reduce the workload on dental technicians and enhance surface quality, DF post-processing was considered in this study.
Unfinished surfaces of components processed by PBF-LB/M not only present appearance issues, but can also lead to problems such as reduced mechanical properties. Rough surfaces can be the source of crack initiation, and can decrease fatigue strength. The DF post-processing method was adapted to reduce surface roughness and to create uniform height distribution. In this work, the DF3 conditions significantly reduced the roughness of outer surfaces (see Table 3, Table 4, Table 5 and Table 6). The DF method improved the quality of CoCr dental applications, providing reliable, repeatable, and controlled results. On the other hand, the DF1 conditions provided a micro-rough surface that may be suitable for medical implants (Ra 1.52–1.60 µm). If the surface of a PBF-LB/M-processed implant is cleaned and has micro-roughness, this can positively influence its biocompatibility. Herrero-Climen et al. demonstrate that micro-rough surfaces can promote the biological response and improve the osseointegration process [50].
The inner surfaces were limitedly polished, but this micro-rough surface of the dental crown can increase the adhesion of luting cement. Future in vitro studies should evaluate the shear bond strength of different cements applied to CoCr dental crowns fabricated by the PBF-LB/M method and DF3 post-processed.
Table 9 summarizes some reported works focused on how post-processing methods can reduce the roughness of CoCr, Ti, and PBF-LB/M-fabricated stainless steel parts. In general, the as-built surfaces have a roughness ranging from 6 to 15 µm in the case of the Ra parameter. The main post-processing methods used to reduce the PBF-LB/M surface roughness are drag finishing, vibratory finishing, sandblasting, electro-polishing, and laser polishing. Because medical applications fabricated by PBF-LB/M are complex, studies also focused on complex surfaces, not just on basic shapes, were identified (see Table 9). Jamal et al. demonstrate that if the Ti6Al4V parts are DF post-processed, the Ra surface roughness can be reduced from 7.5 µm to 0.6 µm (see Table 9). This value was obtained on angled surfaces, and the parts were maintained for 120 min in a wet environment (SC15), immersed in a ceramic medium (universal compound SC15). Due to the abrasive medium (mixture of walnut shells and SiC) and polishing paste used, the current study shows a similar value for surface roughness, but a reduced time for the DF process (75 min). Other PBF-LB/M studies demonstrate that the surface roughness of 316L samples can be reduced by 60–70% if DF post-treatment is applied for 120–240 min (see results of Kaynak et al. [29] and Behjat et al. [51], depicted in Table 9). The findings of the present study demonstrate that it is feasible to reduce the surface roughness by 87% in 75 min.
The effect of the operating parameters on the quality of the laser polishing process has been studied by several researchers [22,25,53]. A recent review focused on this topic highlights a significant reduction in Ra, down to 0.10 µm, obtained for printed Inconel 718 parts with an initial surface roughness of 7.5 µm [54]. After laser polishing, the hardness of the polished surface could increase by at least 27.5%. Ma et al. studied the execution of a polishing process with a pulsed fiber laser on a Ti alloy, and found that the surface roughness was reduced from 7.2 to 0.7 µm (Table 9), but the study was limited to the basic shape [25]. Gora et al. [22] performed laser polishing on CoCr parts manufactured using PBF-LB/M, and reported a reduction in surface roughness from 12.8 µm to 0.6 µm. This study was also limited to the basic shape. Furthermore, the Fraunhofer Institute for Laser Technology conducted extensive research on PBF-LB/M processing of medical implants made from CoCr [53]. The fabricated knee implants were subsequently post-processed using laser polishing, resulting in an average surface roughness of Ra 0.3 µm (see Table 9). However, laser polishing of custom complex parts is expensive because the equipment needs to be programmed, an action that will generate supplementary costs for each part. Laser polishing can change the microstructure phase on polished surfaces [25], which may contribute to different biocompatibility behavior, and it can also affect corrosion resistance. The actual DF process provides a fine surface finish with a high degree of uniformity across the CoCr samples, but the final result may not always match the ultra-smooth finish achievable with laser polishing (Ra 0.10 µm, [54]) or plasma electrolytic polishing (Ra 0.10–0.20 nm [52]).
Depending on the material type, post-processing method, and shape complexity, the Ra surface roughness of PBF-LB/M parts can be reduced to less than 1.60 µm. Some examples are detailed in Table 9. This Ra value is typical for CNC-machined parts fabricated with finishing cutting parameters. Moreover, the combination of two automated post-processing techniques has emerged as a promising approach. In a recent study, Mizokoshi et al. employed a combination of barrel finishing (25 min) followed by magnetic polishing using stainless steel needles (2 h), achieving an Ra surface roughness of approximately 1.76 µm. The lowest Ra value of 0.05 µm was attained by combining barrel finishing (25 min) with dry electrolyte polishing using plastic resin media (15 min) [55]. This level of surface smoothness was comparable to results obtained through freehand finishing (10 min) and polishing (10 min) by a highly experienced dental technician with over 30 years of laboratory practice [55]. However, a significant drawback of combining two automated post-processing machines is the increased labor and equipment cost, which may limit their widespread adoption in routine dental manufacturing.
The present study indicates that the finishing approach contributed to surface quality, and the DF method is feasible for reducing the roughness of CoCr dental applications, being similar to mechanical polishing (i.e., grinding with SiC papers P300, Ra 0.52 μm) [17]. The DF parameters and abrasive materials tested improved the surface quality of PBF-LB/M-fabricated parts, meeting the surface requirements (Ra < 0.8 µm).
On the other hand, the DF process has some disadvantages that must be considered. These include limitations in processing large parts and holes, a slow speed compared with laser polishing or electro-polishing, a relatively low material removal rate, and medium-induced wear. For example, Valentinčič et al. showed that additively manufactured CoCr parts polished with plasma electrolytic polishing using a 0.3 M (NH4)2SO4 aqueous solution could achieve a final Ra roughness of 20 nm [52]. This post-processing result was obtained in just 8 min. Moreover, DF post-processing is not feasible for lattice scaffolds or cardiovascular stents, because it is impossible to polish the thin struts, and electro-polishing is a suitable solution. Understanding these limitations is crucial when determining whether the DF process is the most suitable option for a given application, or whether alternative finishing processes might provide better results.
Compared with other biocompatible dental alloys such as Ti6Al4V, Ni-Cr, and stainless steel, CoCr is the hardest and most laborious for post-processing. For example, in Rockwell tests, CoCr had a hardness between 43 and 52 HRC [56,57], the Ti6Al4V alloy had 34 HRC [30], the Ni-Cr alloy had around 41 HRC [31], and 316L stainless steel had approx. 30 HRC [17,32]. In the literature, various PBF-LB/M studies have been described, providing information about the Vickers hardness of CoCr. Table 10 summarizes the Vickers hardness results of CoCr, measured on both PBF-LB/M-fabricated and cast specimens. Depending on the laser parameter setup, the scanning strategy adopted, and the heat treatment conditions, the CoCr specimens could possess a Vickers hardness between 325 HV and 550 HV (see Table 10). Only a limited number of PBF-LB/M studies have reported Vickers hardness values above 550 HV for CoCr alloys [2,9], indicating exceptionally high hardness. From a manufacturing perspective, the hardness of cast CoCr ranges from 280 HV to 385 HV (Table 10). Compared with the hardness obtained with the casting method, the hardness of the present PBF-LB/M surfaces was superior by 36% (Table 10). According to ASTM F75 [58] and ASTM F90 requirements [59], the hardness of the present specimens increased by 33% (Table 10).
In this work, the laser parameters and the heat treatment applied increased the hardness to 530 HV, higher than that achieved in other PBF-LB/M studies [57,60,61]. The PBF-LB/M process was able to provide this improved hardness because the melt pool cooled down rapidly after the laser beam had passed, and this procedure was repeated in cycles, affecting the previous layer. As has been reported, the higher microhardness encountered can be attributed to a finer microstructure (small cell size) [2,64,65,66]. Moreover, Ayyıldız et al. demonstrated that the atmospheric conditions of heat treatment could increase the hardness of PBF-LB/M surfaces [57]. Because the heat treatment in the present study was performed in a normal atmosphere with oxygen, it could contribute to this increased hardness. Improvement in the hardness of PBF-LB/M surfaces could improve the service life of metal–ceramic restorations, but future studies are needed to evaluate this achievement.
Porcelain-fused-to-metal crowns are frequently used in dental prosthetics to protect the remaining tooth structure (dentine tissue). Due to their good clinical performance, with low failure rates, these metal–ceramic restorations are developed using CoCr as a metallic substructure (see ISO 22764, [33]). Many countries, such as the United States of America, have decided to replace NiCr alloys with CoCr to prepare porcelain-fused-to-metal dentures [67]. This alloy is considered a highly corrosion-resistant and biocompatible material in dentistry [1,2,3,4,5,67]. To prepare metal–ceramic restorations, the outer surfaces of CoCr are covered by veneering ceramic materials. The inside of the CoCr-ceramic crown is luted with cement (thin layer between 50 μm and 120 μm) onto host dentine. Based on the EDAX results, the post-processed CoCr crowns may be suitable for use in fixed metal–ceramic prostheses. Future studies should analyze corrosion potential, pitting potential, and electrochemical impedance to confirm the biocompatibility of CoCr crowns post-processed with DF.
From a clinical implication perspective, the reduced roughness achieved when crowns are post-processed using DF may allow this to be considered a promising alternative to deburring, smoothing, and polishing the outer side of PBF-LB/M-fabricated surfaces. It is a feasible solution to automate the post-processing of PBF-LB/M/CoCr components. Currently, CoCr crowns manufactured using this technology are manually post-processed by dental technicians using pneumatic straight grinders.
Moreover, the current work demonstrates that even if the surface hardness has high values up to 530 HV, it is possible to identify the proper DF condition to reduce the Ra roughness of CoCr dental crowns from approx. 6 µm to 0.6 µm. The results regarding the post-processing of CoCr can contribute to expanding automatic post-processing of complex PBF-LB/M-fabricated parts. Future research is required to evaluate the fatigue resistance and metal–ceramic bonding of CoCr dental crowns that have been PBF-LB/M-manufactured and post-processed via DF3. According to the ISO 9693 standard, the minimum adhesion strength should be 25 MPa [68].

5. Conclusions

The findings of this study support the following conclusions:
  • DF is an effective and feasible method for improving both the surface quality and dimensional accuracy of CoCr dental crowns manufactured via PBF-LB/M, offering a viable pathway for automating post-processing procedures.
  • The outer surface roughness of CoCr crowns could be reduced by up to 90% when the DF processing time was increased from 45 to 75 min, achieving values of Ra 0.6 µm, Rz 4.5 µm, and Rq 1.0 µm. However, the effectiveness of the post-processing was limited on the inner surfaces.
  • Three-dimensional surface topography analyses after DF revealed a notable reduction in peak heights, resulting in smoother, more uniform surfaces and effective removal of residual particles.
  • The DF method enhanced dimensional accuracy, with minimal deviations (+0.010 to +0.050 mm) observed on the outer surfaces, indicating that delicate features, such as thin crown walls, were preserved and not over-polished during the process.
  • The empirical equations developed were validated through experimental results, demonstrating their ability to accurately predict both surface roughness and material loss following the DF process.
  • Despite the high hardness of CoCr crowns (530 HV), the DF3 method produced high-quality surface finishes within a shorter processing time, offering a more time-efficient alternative compared to other DF works that recommend longer times.
  • To fully understand the clinical significance of these results, further studies are necessary to evaluate the bonding strength between ceramic veneering materials applied to CoCr crowns that have undergone DF3 post-processing.

Author Contributions

Conceptualization, C.C. and N.B.; methodology, M.M. and A.P.; validation, M.M., S.L., G.C. and C.T.; formal analysis, C.T., M.M. and A.P.; investigation, C.C., M.M., S.L., G.C. and C.T.; resources, S.L., A.P. and P.B.; data curation, A.P. and P.B.; writing—original draft preparation, C.C., M.M. and A.P.; writing—review and editing, C.C. and N.B.; visualization, C.T., G.C. and S.L.; supervision, N.B. and P.B.; project administration, N.B. and G.C.; funding acquisition, C.C. and P.B. All authors have read and agreed to the published version of the manuscript.

Funding

This work was supported by the Central European Exchange Program for University Studies (CEEPUS) and by the OpTi-DeP Project (no. BG101/2016), financed by the Executive Unit for Financing Higher Education, Research, Development, and Innovation (UEFISCDI) of the Romanian Government.

Data Availability Statement

The original contributions presented in this study are included in the article. Further inquiries can be directed to the corresponding author.

Acknowledgments

The authors thank Guhring Company for helping with the scanning electron microscopy.

Conflicts of Interest

The authors declare no conflicts of interest.

Abbreviations

The following abbreviations are used in this manuscript:
15-5PHPrecipitation-hardening stainless steel alloy
316LStainless steel alloy
AMAdditive manufacturing
ANOVAAnalysis of variance, statistical method
ASTMAmerican Society for Testing and Material standard
CMMCoordinate measuring machine
CNCComputer numerical control
CoCrCobalt–chromium alloy
DFDrag finishing process
DF1, DF2, DF3Drag finishing process with different finishing times
DFTDrag finishing total time
DWIODental Wings IntraOral system
EDEstimated distance between CMM point and 3D model after DF procedure
EDAXEnergy-dispersive X-ray spectroscopy (EDAX)
HRCRockwell hardness scale C
HSCMixture of 70% walnut shell granulates and 30% silicon carbide
HVVickers surface hardness
Inconel 718Nickel-based superalloy
ISOInternational organization for standardization
MDPoint-to-model distance or measured distance between determinate CMM point and 3D model, measured before DF procedure
NiCrNickel–chromium alloy
Nd:YAGNeodymium-doped Yttrium Aluminum Garnet, solid-state laser
R2R squared or coefficient of determination
RaSurface roughness parameter
Rp, Rv, Rc, RtAmplitude parameters, peak and valley
Rq, Rku, RskAverage amplitude parameters
Rsm, Rdq, RmaxOther surface roughness parameters
RzSurface roughness parameter
PBF-LB/MScanning electron microscopy
SiCSilicon carbide
TiTitanium
Ti6Al4VTitanium alloy
WWatts

References

  1. Dawood, A.; Marti, B.; Sauret-Jackson, V.; Darwood, A. 3D printing in dentistry. Nat. Br. Dent. J. 2015, 219, 521–529. [Google Scholar] [CrossRef] [PubMed]
  2. Cosma, C.; Moldovan, M.; Simion, M.; Balc, N. Impact of laser parameters on additively manufactured cobalt-chromium restorations. J Prosthet. Dent. 2022, 128, 421–429. [Google Scholar] [CrossRef] [PubMed]
  3. Yager, S.; Ma, J.; Ozcan, H.; Kilinc, H.I.; Elwany, A.; Karaman, I. Mechanical Properties and Microstructure of Removable Partial Denture Clasps Manufactured Using Selective Laser Melting. Addit. Manuf. 2015, 8, 117–123. [Google Scholar] [CrossRef]
  4. Hedberg, Y.; Hedberg, Y.; Qian, B.; Shen, Z.; Virtanen, S.; Odnevall Wallinder, I. In Vitro Biocompatibility of CoCrMo Dental Alloys Fabricated by Selective Laser Melting. Dent. Mater. 2014, 30, 525–534. [Google Scholar] [CrossRef]
  5. Al Jabbari, Y.S. Physico-Mechanical Properties and Prosthodontic Applications of Co-Cr Dental Alloys: A Review of the Literature. J. Adv. Prosthodont. 2014, 6, 138–145. [Google Scholar] [CrossRef]
  6. Oltean-Dan, D.; Dogaru, G.-B.; Tomoaia-Cotisel, M.; Apostu, D.; Mester, A.; Benea, H.-R.-C.; Paiusan, M.-G.; Jianu, E.-M.; Mocanu, A.; Balint, R.; et al. Enhancement of Bone Consolidation Using High-Frequency Pulsed Electromagnetic Short-Waves and Titanium Implants Coated with Biomimetic Composite Embedded into PLA Matrix: In Vivo Evaluation. Int. J. Nanomed. 2019, 14, 5799–5816. [Google Scholar] [CrossRef]
  7. Munteanu, L.; Iancu, I.; Breazu, C.; Cioltean, C.; Brânzilă, S.; Odainii, A.; Furda, P.; Bocşe, H.; Herdean, A.; Bartoş, D.; et al. Rare Causes of Gastrointestinal Bleeding: Focus on Pancreatic Pathology and Visceral Artery Aneurysms. Chirurgia 2021, 116, S5–S15. [Google Scholar]
  8. Kassapidou, M.; Franke Stenport, V.; Hjalmarsson, L.; Johansson, C.B. Cobalt-Chromium Alloys in Fixed Prosthodontics in Sweden. Acta Biomater Odontol. Scand. 2017, 3, 53–62. [Google Scholar] [CrossRef]
  9. Lu, Y.; Wu, S.; Gan, Y.; Li, J.; Zhao, C.; Zhuo, D.; Lin, J. Investigation on the microstructure, mechanical property and corrosion behavior of the selective laser melted CoCrW alloy for dental application. Mater. Sci. Eng. C Mater. Biol. Appl. 2015, 49, 517–525. [Google Scholar] [CrossRef]
  10. Soporan, V.S.; Lehene, T.R.; Pădureţu, S.; Gabor, T. Engineering of circular economy and good management of industrial material resources. IOP Conf. Ser. Mater. Sci. Eng. 2019, 572, 012086. [Google Scholar] [CrossRef]
  11. Mitić, J.; Vitković, N.; Trajanović, M.; Górski, F.; Păcurar, A.; Borzan, C.; Sabău, E.; Păcurar, R. Utilizing Artificial Neural Networks for Geometric Bone Model Reconstruction in Mandibular Prognathism Patients. Mathematics 2024, 12, 1577. [Google Scholar] [CrossRef]
  12. Charles, A.; Elkaseer, A.; Thijs, L.; Hagenmeyer, V.; Scholz, S. Effect of Process Parameters on the Generated Surface Roughness of Down-Facing Surfaces in Selective Laser Melting. Appl. Sci. 2019, 9, 1256. [Google Scholar] [CrossRef]
  13. Băilă, D.I.; Doicin, C.V.; Cotruț, C.M.; Ulmeanu, M.E.; Ghionea, I.G.; Tarbă, C.I. Sintering the beaks of the elevator manufactured by direct metal laser sintering (DMLS) process from Co-Cr alloy. Metalurgija 2016, 55, 663–666. [Google Scholar]
  14. Hong, M.-H.; Min, B.; Kwon, T.-Y. The Influence of Process Parameters on the Surface Roughness of a 3D-Printed Co–Cr Dental Alloy Produced via Selective Laser Melting. Appl. Sci. 2016, 6, 401. [Google Scholar] [CrossRef]
  15. Martin, A.A.; Calta, N.P.; Khairallah, S.A.; Wang, J.; Depond, P.J.; Fong, A.Y.; Thampy, V.; Guss, G.M.; Kiss, A.M.; Stone, K.H.; et al. Dynamics of pore formation during laser powder bed fusion additive manufacturing. Nat. Commun. 2019, 10, 1987. [Google Scholar] [CrossRef]
  16. Demir, A.G.; Previtali, B. Additive manufacturing of cardiovascular CoCr stents by selective laser melting. Mater. Des. 2017, 119, 338–350. [Google Scholar] [CrossRef]
  17. Löber, L.; Flache, C.; Petters, R.; Kühn, U.; Eckert, J. Comparison of different post processing technologies for SLM generated 316l steel parts. Rapid Prototyp. J. 2013, 19, 173–179. [Google Scholar] [CrossRef]
  18. Buican, G.R.; Oancea, G.; Martins, R.F. Study on SLM manufacturing of teeth used for dental tools testing. MATEC Web Conf. 2017, 94, 03002. [Google Scholar] [CrossRef]
  19. Luca, A.; Balc, N.; Popan, A.; Ceclan, V.; Panc, N. Improving the quality of the parts made by rapid metal casting process. Acad. J. Manuf. Eng. 2014, 12, 82–86. [Google Scholar]
  20. Selden, A.I.; Persson, B.; Bornberger-Dankvardt, S.I.; Winstrom, L.E.; Bodin, L.S. Exposure to cobalt chromium dust and lung disorders in dental technicians. Thorax 1995, 50, 769–772. [Google Scholar] [CrossRef]
  21. Kumbhar, N.N.; Mulay, A.V. Post Processing Methods used to Improve Surface Finish of Products which are Manufactured by Additive Manufacturing Technologies: A Review. J. Inst. Eng. (India) Ser. C 2016, 99, 481–487. [Google Scholar] [CrossRef]
  22. Gora, W.S.; Tian, Y.; Cabo, A.P.; Ardron, M.; Maier, R.R.J.; Prangnell, P.; Weston, N.J.; Hand, D.P. Enhancing Surface Finish of Additively Manufactured Titanium and Cobalt Chrome Elements Using Laser Based Finishing. Phys. Procedia 2016, 83, 258–263. [Google Scholar] [CrossRef]
  23. Duval-Chaneac; Han, S.; Claudin, C.; Salvatore, F.; Bajolet, J.; Rech, J. Experimental study on finishing of internal laser melting (SLM) surface with abrasive flow machining (AFM). Precis. Eng. 2018, 54, 1–6. [Google Scholar] [CrossRef]
  24. Conțiu, G.; Popa, M.S.; Socaciu, L.; Pop, G. Fuzzy analytical hierarchy process applied to determine the material machinability in EDM process. Acta Tech. Napoc. Ser. Appl. Math. Mech. Eng. 2015, 58, 385–394. [Google Scholar]
  25. Ma, C.P.; Guan, Y.C.; Zhou, W. Laser polishing of additive manufactured Ti alloys. Opt. Lasers Eng. 2017, 93, 171–177. [Google Scholar] [CrossRef]
  26. Mohammad, A.; Mohammed, M.K.; Alahmari, A.M. Effect of laser ablation parameters on surface improvement of electron beam melted parts. Int. J. Adv. Manuf. Technol. 2016, 87, 1033–1044. [Google Scholar] [CrossRef]
  27. Jamal, M.; Morgan, M. Design Process Control for Improved Surface Finish of Metal Additive Manufactured Parts of Complex Build Geometry. Inventions 2017, 2, 36. [Google Scholar] [CrossRef]
  28. Zanger, F.; Kacaras, A.; Neuenfeldt, P.; Schulze, V. Optimization of the stream finishing process for mechanical surface treatment by numerical and experimental process analysis. CIRP Ann. 2019, 68, 373–376. [Google Scholar] [CrossRef]
  29. Kaynak, Y.; Kitay, O. The effect of post-processing operations on surface characteristics of 316L stainless steel produced by selective laser melting. Addit. Manuf. 2018, 26, 84–93. [Google Scholar] [CrossRef]
  30. Koike, M.; Greer, P.; Owen, K.; Lilly, G.; Murr, L.E.; Gaytan, S.M.; Martinez, E.; Okabe, T. Evaluation of Titanium Alloys Fabricated Using Rapid Prototyping Technologies—Electron Beam Melting and Laser Beam Melting. Materials 2011, 4, 1776–1792. [Google Scholar] [CrossRef]
  31. Wang, X.; Gong, X.; Chou, K. Review on powder-bed laser additive manufacturing of Inconel 718 parts. Proc. Inst. Mech. Eng. Part B J. Eng. Manuf. 2016, 231, 1890–1903. [Google Scholar] [CrossRef]
  32. Tan, C.; Zhou, K.; Kuang, M.; Ma, W.; Kuang, T. Microstructural characterization and properties of selective laser melted maraging steel with different build directions. Sci. Technol. Adv. Mater. 2018, 19, 746–758. [Google Scholar] [CrossRef]
  33. ISO 22674:2022; Dentistry—Metallic Materials for Fixed and Removable Restorations and Appliances. ISO: Geneva, Switzerland, 2022.
  34. Cuc, S.; Burde, A.; Cosma, C.; Leordean, D.; Rusu, M.; Balc, N.; Prodan, D.; Moldovan, M.; Ene, R. Adhesion between Biocomposites and Different Metallic Structures Additive Manufactured. Coatings 2021, 11, 483. [Google Scholar] [CrossRef]
  35. Leordean, D.; Dudescu, C.; Marcu, T.; Berce, P.; Balc, N. Customized implants with specific properties, made by selective laser melting. Rapid Prototyp. J. 2015, 21, 98–104. [Google Scholar] [CrossRef]
  36. Ucar, Y.; Ekren, O. Effect of layered manufacturing techniques, alloy powders, and layer thickness on mechanical properties of Co-Cr dental alloys. J. Prosthet. Dent. 2018, 120, 762–770. [Google Scholar] [CrossRef]
  37. Cho, H.H.W.; Takaichi, A.; Kajima, Y.; Htat, H.L.; Kittikundecha, N.; Hanawa, T.; Wakabayashi, N. Effect of Post-Heat Treatment Cooling Conditions on Microstructures and Fatigue Properties of Cobalt Chromium Molybdenum Alloy Fabricated through Selective Laser Melting. Metals 2021, 11, 1005. [Google Scholar] [CrossRef]
  38. Roudnicka, M.; Bigas, J.; Molnarova, O.; Palousek, D.; Vojtech, D. Different Response of Cast and 3D-Printed Co-Cr-Mo Alloy to Heat Treatment: A Thorough Microstructure Characterization. Metals 2021, 11, 687. [Google Scholar] [CrossRef]
  39. Zhang, K.; Fu, G.; Zhang, P.; Ma, Z.; Mao, Z.; Zhang, D.Z. Study on the Geometric Design of Supports for Overhanging Structures Fabricated by Selective Laser Melting. Materials 2018, 12, 27. [Google Scholar] [CrossRef]
  40. Lee, S.; Shao, S.; Wells, D.N.; Zetek, M.; Kepka, M.; Shamsaei, N. Fatigue behavior and modeling of additively manufactured IN718: The effect of surface treatments and surface measurement techniques. J. Mater. Process. Technol. 2022, 302, 117475. [Google Scholar] [CrossRef]
  41. Pätoprstý, B.; Vozár, M.; Pokorný, P.; Vopát, T.; Buranský, I.; Zetek, M.; Cajthamlová, Š.; Laudát, V. Development of cutting edge radius size of solid carbide mills when drag finishing. In Lecture Notes in Mechanical Engineering; Springer: Singapore, 2020; pp. 95–100. [Google Scholar] [CrossRef]
  42. Cook, R.B.; Shearwood-Porter, N.R.; Latham, J.M.; Wood, R.J.K. Volumetric assessment of material loss from retrieved cemented metal hip replacement stems. Tribol. Int. 2015, 89, 105–108. [Google Scholar] [CrossRef]
  43. Panc, N.; Contiu, G.; Bocanet, V. Comparative Analysis of Surface Finishing for Different Cutting Strategies of Parts Made from POM C. In Lecture Notes in Mechanical Engineering; Springer: Singapore, 2018; pp. 324–332. [Google Scholar] [CrossRef]
  44. ISO 4278:1997; Geometrical Product Specifications (GPS)—Surface Texture: Profile Method—Terms, Definitions and Surface Texture Parameters. ISO: Geneva, Switzerland, 1997.
  45. ISO 10360:2000; Acceptance and Re-Verification Tests for Coordinate Measuring Machines. ISO: Geneva, Switzerland, 2000.
  46. ISO 6507-1:2018; Metallic Materials—Vickers Hardness Test—Part 1: Test Method. ISO: Geneva, Switzerland, 2018.
  47. Surface Roughness Measurement-Parameters, OLYMPUS, Tokyo, Japan. Available online: www.olympus-ims.com/en/metrology/surface-roughness-measurement-portal/parameters/ (accessed on 23 March 2024).
  48. Takaichi, A.; Kajima, Y.; Jialin, D.; Wakabayashi, N. Metal Additive Manufacturing Technology for Digital Dentistry. Health Care Curr Rev. 2024, 12, 407. Available online: https://www.walshmedicalmedia.com/open-access/metal-additive-manufacturing-technology-for-digital-dentistry.pdf (accessed on 4 February 2025).
  49. Wei, W.; Zhou, Y.; Sun, Q.; Li, N.; Yan, J.; Li, H.; Liu, W.; Huang, C. Microstructures and mechanical properties of dental Co-CR-MO-W alloys fabricated by selective laser melting at different subsequent heat treatment temperatures. Metall. Mater. Trans. A 2020, 51, 3205–3214. [Google Scholar] [CrossRef]
  50. Herrero-Climent, M.; Lázaro, P.; Rios, J.V.; Lluch, S.; Marqués, M.; Guillem-Martí, J.; Gil, F.J. Influence of acid-etching after grit-blasted on osseointegration of titanium dental implants: In vitro and in vivo studies. J. Mater. Sci. Mater. Med. 2013, 24, 2047–2055. [Google Scholar] [CrossRef] [PubMed]
  51. Behjat, A.; Lannunziata, E.; Gadalińska, E.; Iuliano, L.; Saboori, A. Improving the surface quality and mechanical properties of additively manufactured AISI 316L stainless steel by different surface post-treatment. Procedia CIRP 2023, 118, 771–776. [Google Scholar] [CrossRef]
  52. Valentinčič, J.; Koroth, J.E.; Zeidler, H. Advancements in surface finish for additive manufacturing of metal parts: A comprehensive review of plasma electrolytic polishing (PEP). Virtual Phys. Prototyp. 2024, 19, e2364222. [Google Scholar] [CrossRef]
  53. Shen, L.; Ross, I. Implant Manufacture out of CoCr by Means of SLM and Laser Polishing. Annual Report Fraunhofer Institute for Laser Technology ILT 2014. Available online: www.ilt.fraunhofer.de (accessed on 19 May 2020).
  54. Gisario, A.; Barletta, M.; Veniali, F. Laser polishing: A review of a constantly growing technology in the surface finishing of components made by additive manufacturing. Int. J. Adv. Manuf. Technol. 2022, 120, 1433–1472. [Google Scholar] [CrossRef]
  55. Mizokoshi, N.; Sakurai, T.; Shimpo, H.; Kawamura, N.; Ohkubo, C. Finishing efficiencies of additive-manufactured Co-Cr alloy and Ti alloy clasps. Dent. Mater. J. 2025, 2024-356. [Google Scholar] [CrossRef]
  56. Monroy, K.P.; Delgado, J.; Sereno, L.; Ciurana, J.; Hendrichs, N.J. Effects of the Selective Laser Melting manufacturing process on the properties of CoCrMo single tracks. Met. Mater. Int. 2014, 20, 873–884. [Google Scholar] [CrossRef]
  57. Ayyıldız, S.; Soylu, E.H.; İde, S.; Kılıç, S.; Sipahi, C.; Pişkin, B.; Gökçe, H.S. Annealing of Co-Cr dental alloy: Effects on nanostructure and Rockwell hardness. J. Adv. Prosthodont. 2013, 5, 471. [Google Scholar] [CrossRef]
  58. ASTM F75-18; Standard Specification for Cobalt-28 Chromium-6 Molybdenum Alloy Castings and Casting Alloy for Surgical Implants (UNS R30075). ASTM International: West Conshohocken, PA, USA, 2018.
  59. ASTM F90-14; Standard Specification for Wrought Cobalt-20Chromium-15Tungsten-10Nickel Alloy for Surgical Implant Applications (UNS R30605). ASTM International: West Conshohocken, PA, USA, 2014.
  60. Kotila, J.; Syvänen, T.; Hänninen, J.; Latikka, M.; Nyrhilä, O. Direct Metal Laser Sintering—New Possibilities in Biomedical Part Manufacturing. Mater. Sci. Forum 2007, 534–536, 461–464. [Google Scholar] [CrossRef]
  61. Lapcevic, A.R.; Jevremovic, D.P.; Puskar, T.M.; Williams, R.J.; Eggbeer, D. Comparative analysis of structure and hardness of cast and direct metal laser sintering produced Co-Cr alloys used for dental devices. Rapid Prototyp. J. 2016, 22, 144–151. [Google Scholar] [CrossRef]
  62. Zhou, Y.; Li, N.; Yan, J.; Zeng, Q. Comparative analysis of the microstructures and mechanical properties of Co-Cr dental alloys fabricated by different methods. J. Prosthet. Dent. 2018, 120, 617–623. [Google Scholar] [CrossRef] [PubMed]
  63. Tunthawiroon, P.; Chiba, A. Effects of Si concentrations on microstructure and mechanical properties of as-cast CoCrMo alloys. IOP Conf. Ser. Mater. Sci. Eng. 2019, 635, 012006. [Google Scholar] [CrossRef]
  64. Monkova, K.; Monka, P.P.; Pantazopoulos, G.A.; Toulfatzis, A.I.; Šmeringaiová, A.; Török, J.; Papadopoulou, S. Effect of Crosshead Speed and Volume Ratio on Compressive Mechanical Properties of Mono- and Double-Gyroid Structures Made of Inconel 718. Materials 2023, 16, 4973. [Google Scholar] [CrossRef]
  65. Ibrahim, M.; Hulme, C.; Grasmo, G.; Aune, R.E. Preliminary Evaluation of Nickel Silicide (NiSi12-wt%) Laser Cladding for Enhancing Microhardness and Corrosion Resistance of S355 Steel. Metals 2024, 14, 1389. [Google Scholar] [CrossRef]
  66. Grobelny, P.; Legutko, S.; Habrat, W.; Furmanski, L. Investigations of surface topography of titanium alloy manufactured with the use of 3D print. IOP Conf. Ser. Mater. Sci. Eng. 2018, 393, 012108. [Google Scholar] [CrossRef]
  67. Fratila, A.; Jimenez-Marcos, C.; Mirza-Rosca, J.C.; Saceleanu, A. Mechanical properties and biocompatibility of various cobalt chromium dental alloys. Mater. Chem. Phys. 2023, 304, 127867. [Google Scholar] [CrossRef]
  68. ISO 9693:2019; Dentistry—Compatibility Testing for Metal-Ceramic and Ceramic-Ceramic Systems. ISO: Geneva, Switzerland, 2019.
Figure 1. SEM investigation of CoCr powder: (a) feedstock; (b) grain morphology.
Metals 15 00471 g001
Figure 2. (a) Virtual design of dental crown fixed on cylindrical holder and its main surfaces (inner, outer, and chamfer margin); (b) typical angled walls of dental crown designed with chamfer margin.
Metals 15 00471 g002
Figure 3. (a) Drag finishing equipment (OTEC DF Series 3); (b) HSC 1/300 abrasive medium containing walnut shells and SiC grains.
Metals 15 00471 g003
Figure 4. (a) Measured points on dental crowns; (b) CMM investigation on initial surface of CoCr dental crown.
Metals 15 00471 g004
Figure 5. Dental crowns fabricated by PBF-LB/M/CoCr, before and after drag finishing of different durations.
Metals 15 00471 g005
Figure 6. Height map visualization of initial surface topography: (a) cylinder; (b) crown outer surfaces.
Metals 15 00471 g006
Figure 7. Height map visualization of cylinder surface topography after DF post-processing: (a) DF1, (b) DF2, (c) DF3.
Metals 15 00471 g007
Figure 8. Height map visualization of crown outer surface topography after DF post-processing: (a) DF1, (b) DF2, (c) DF3.
Metals 15 00471 g008
Figure 9. Height map visualization of chamfer surface topography after DF post-processing: (a) DF1, (b) DF2, (c) DF3.
Metals 15 00471 g009
Figure 10. Typical graphs regarding the difference between the virtual model and the PBF-LB/M/CoCr crown after DF post-processing. The point-to-3D-model distance on outer surface after (a) DF1, (b) DF2, and (c) DF3.
Metals 15 00471 g010aMetals 15 00471 g010b
Figure 11. Typical graphs regarding the difference before and after DF post-processing.
Metals 15 00471 g011
Figure 12. Micrographs of Vickers hardness indentation: testing performed on (a) initial surface and (b) after DF3 post-processing.
Metals 15 00471 g012
Figure 13. Representative surface morphology of CoCr crn outer surfaces and chamfer margin: (a) as-built surfaces with unmelted or partially melted grains attached; (b) after DF3 post-processing with grinding tracks. Magnification ×150, ×500, and ×2500.
Metals 15 00471 g013aMetals 15 00471 g013b
Figure 14. SEM micrographs of CoCr crown walls post-processed with DF; magnification ×10,000.
Metals 15 00471 g014
Figure 15. EDAX spectrum of original CoCr powder and PBF-LB/M/CoCr specimens.
Metals 15 00471 g015
Figure 16. A graphical model derived from the regression function illustrating the effect of initial roughness (post-printing) and drag finishing duration on the outer surface roughness.
Metals 15 00471 g016
Figure 17. Effect of DF time on estimated distance after DF procedure (thickness of material removed). Initial point-to-model CMM measurements were considered.
Metals 15 00471 g017
Table 1. Chemical composition of CoCr powder.
Chemical ElementCoCrWMoSiMnOOther Elements (C, Fe, N)
Maximum weight percentage [%]59.325.19.43.41.20.90.5Max. 1
Table 2. Technological parameters of PBF-LB/M/CoCr manufacturing.
Laser Power (W)Laser Scanning Speed (mm/s)Hatch Spacing (μm)Layer Thickness (μm)Laser Spot Diameter (μm)Scanning Strategy
85960602530Chessboard
Table 3. Process conditions of DF method.
Code of DF ConditionMain Heat Speed [rpm]Spindle Speed [rpm]Immersion Depth [mm]Clockwise Rotation [min]Counter-Clockwise Rotation [min]Total Finishing Time [min]
DF1356042022.522.545
DF2303060
DF337.537.575
Table 4. Surface roughness of cylindrical surfaces before and after different DF post-processing (mean values).
Code of DF Condition Ra Surface Roughness [µm]Rz Surface Roughness [µm]
As-BuiltAfter DFDifference [%]As-BuiltAfter DFDifference [%]
DF15.201.5273.1923.807.6567.86
DF25.541.0582.8434.095.3884.22
DF36.050.5191.5729.814.0586.41
Table 5. Roughness of outer and inner surfaces and chamfer margins of dental crowns before and after DF post-processing (mean values).
Code of DF ConditionRa Surface Roughness [µm]Rz Surface Roughness [µm]
As-BuiltAfter DFDifference [%]As-BuiltAfter DFDifference [%]
Outer surfacesDF15.951.6070.4527.838.2070.54
DF26.251.1084.3853.326.5987.64
DF36.140.6190.0732.494.5386.06
ChamferDF16.291.4876.4736.487.4079.72
DF26.010.9883.6935.465.3984.80
DF36.670.4992.6540.022.7993.02
Inner surfacesDF16.955.2424.6040.3131.6521.48
DF25.854.9715.0429.8723.0722.77
DF36.775.4819.0535.3831.1112.07
Table 6. Mean values of profile roughness measurements on CoCr outer surfaces after different drag finishing conditions.
Code of DF ConditionAmplitude Average ParametersAmplitude Parameters
(Peak and Valley)
Others
Ra
[µm]
Rq
[µm]
Rsk
[µm]
Rku
[µm]
Rz
[µm]
Rp
[µm]
Rv
[µm]
Rc
[µm]
Rt
[µm]
Rsm
[µm]
Rmax
[µm]
Rdq [µm]Rt/Rz Ratio
DF11.601.99−0.192.878.205.316.676.0711.98178.1411.230.121.46
DF21.101.52−0.686.576.594.717.765.7512.47280.0812.470.111.89
DF30.611.04−1.297.974.532.415.793.968.20292.478.200.081.80
Table 7. Vickers hardness measurements of CoCr surfaces after applications of different DF conditions (mean value ± standard deviation).
Surface ConditionInitialDF1DF2DF3
Vickers hardness [HV1]520 ± 56524 ± 42527 ± 38530 ± 27
Table 8. Testing trails to validate Equations (1) and (2) for CoCr dental crowns after DF post-processing.
Sample No.Ra After Printing (µm)Drag
Finishing Time (min)
Ra
After DF,
Estimated a (µm)
Ra
After DF, Measured (µm)
Difference b
(µm)
Point-to-Model Distance Before DF (mm)ED
After DF c (mm)
Measured Distance
After DF (mm)
Difference (mm) d
15.92451.551.590.040.0700.0230.0250.002
25.75451.541.580.040.0810.0250.0280.003
36.34601.091.120.030.0520.0180.0220.004
46.18750.600.640.040.0620.0190.0240.005
55.97750.590.640.050.0910.0240.0270.003
a The Ra surface roughness after DF post-processing was predicted with Equation (1), considering the initial Ra and DF timing (outer surfaces were considered). b The difference between the measured Ra and the estimated value predicted by Equation (1). c The ED after DF post-processing was predicted by Equation (2), considering the initial point-to-model distance and DF timing. d The difference between the distance from the measured CMM point to the 3D model and the estimated one (ED), predicted by Equation (2).
Table 9. Comparison regarding the surface roughness obtained on PBF-LB/M-fabricated parts after different post-processing techniques.
MaterialSpecimen Shape
[Basic/Complex]
Post-Processing MethodRa of as-Built Specimen [μm]Ra After
Post-Processing [μm]
Vickers Hardness
[HV]
Source
CoCrComplexDF, 75 min.6.10.6530This study
Ti6Al4VComplexDF, 90–120 min.7.50.6–0.8~400Jamal et al. [27]
316LBasicDF, 120–240 min.62–3280Kaynak et al. [29]
316LBasicDF, 180 min.125~220Behjat et al. [51]
Inconel 718BasicDF, 240 min.4.32.2-Lee et al. [40]
Inconel 718BasicGrinding + DF, 240 min.4.30.5-Lee et al. [40]
316LBasicVibratory
surface finishing
64280Kaynak et al. [29]
CoCrComplexElectro-polishing9.11.4-Demir et al. [16]
CoCrBasicElectro-polishing200.02-Valentinčič et al. [52]
316L * BasicElectro-polishing15.19.2~250Lober et al. [17]
316L *BasicPlasma-polishing15.18.5~250Lober et al. [17]
316L *BasicBlasted with sand
(90–250 μm)
15.13.8~250Lober et al. [17]
CoCrComplexLaser polishing70.3-Fraunhofer Inst. Laser Tech. [53]
CoCrBasicLaser polishing12.80.6-Gora et al. [22]
Ti6Al4VBasicLaser polishing5.20.4345Ma et al. [25]
Inconel 718BasicLaser polishing7.50.1440Gisario et al. [54]
316L *BasicLaser polishing4.60.3~302Gisario et al. [54]
15-5PH *ComplexAbrasive flow machining
(150 cycles)
13.92.5650Duval-Chaneac et al. [23]
* Stainless steel alloy; DF—drag finishing post-processing method.
Table 10. Comparison of CoCr Vickers hardness obtained on PBF-LB/M and cast specimens.
Manufacturing MethodVickers Hardness [HV]Source
PBF-LB/M524–530Present study after DF post-processing
400–460[60]
325–482[57]
440[61]
564–570[9]
498–618 *[2]
Casting280–385[5]
323[62]
287–295 **[63]
266–345Standard of CoCr alloy for surgical implants [58]
300–400Standard of CoCr alloy for surgical implants [59]
* Laser remelting of boundary surfaces; ** different Si concentrations (0.1–1%).
Disclaimer/Publisher’s Note: The statements, opinions and data contained in all publications are solely those of the individual author(s) and contributor(s) and not of MDPI and/or the editor(s). MDPI and/or the editor(s) disclaim responsibility for any injury to people or property resulting from any ideas, methods, instructions or products referred to in the content.

