

Local Structure Analysis of Heavy Fermion Ce2Pt6Ga15 with a Honeycomb Structure Using Extended X-Ray Absorption Fine Structure

 , , , , and
Abstract
1. Introduction
2. Experimental
3. Results and Discussion
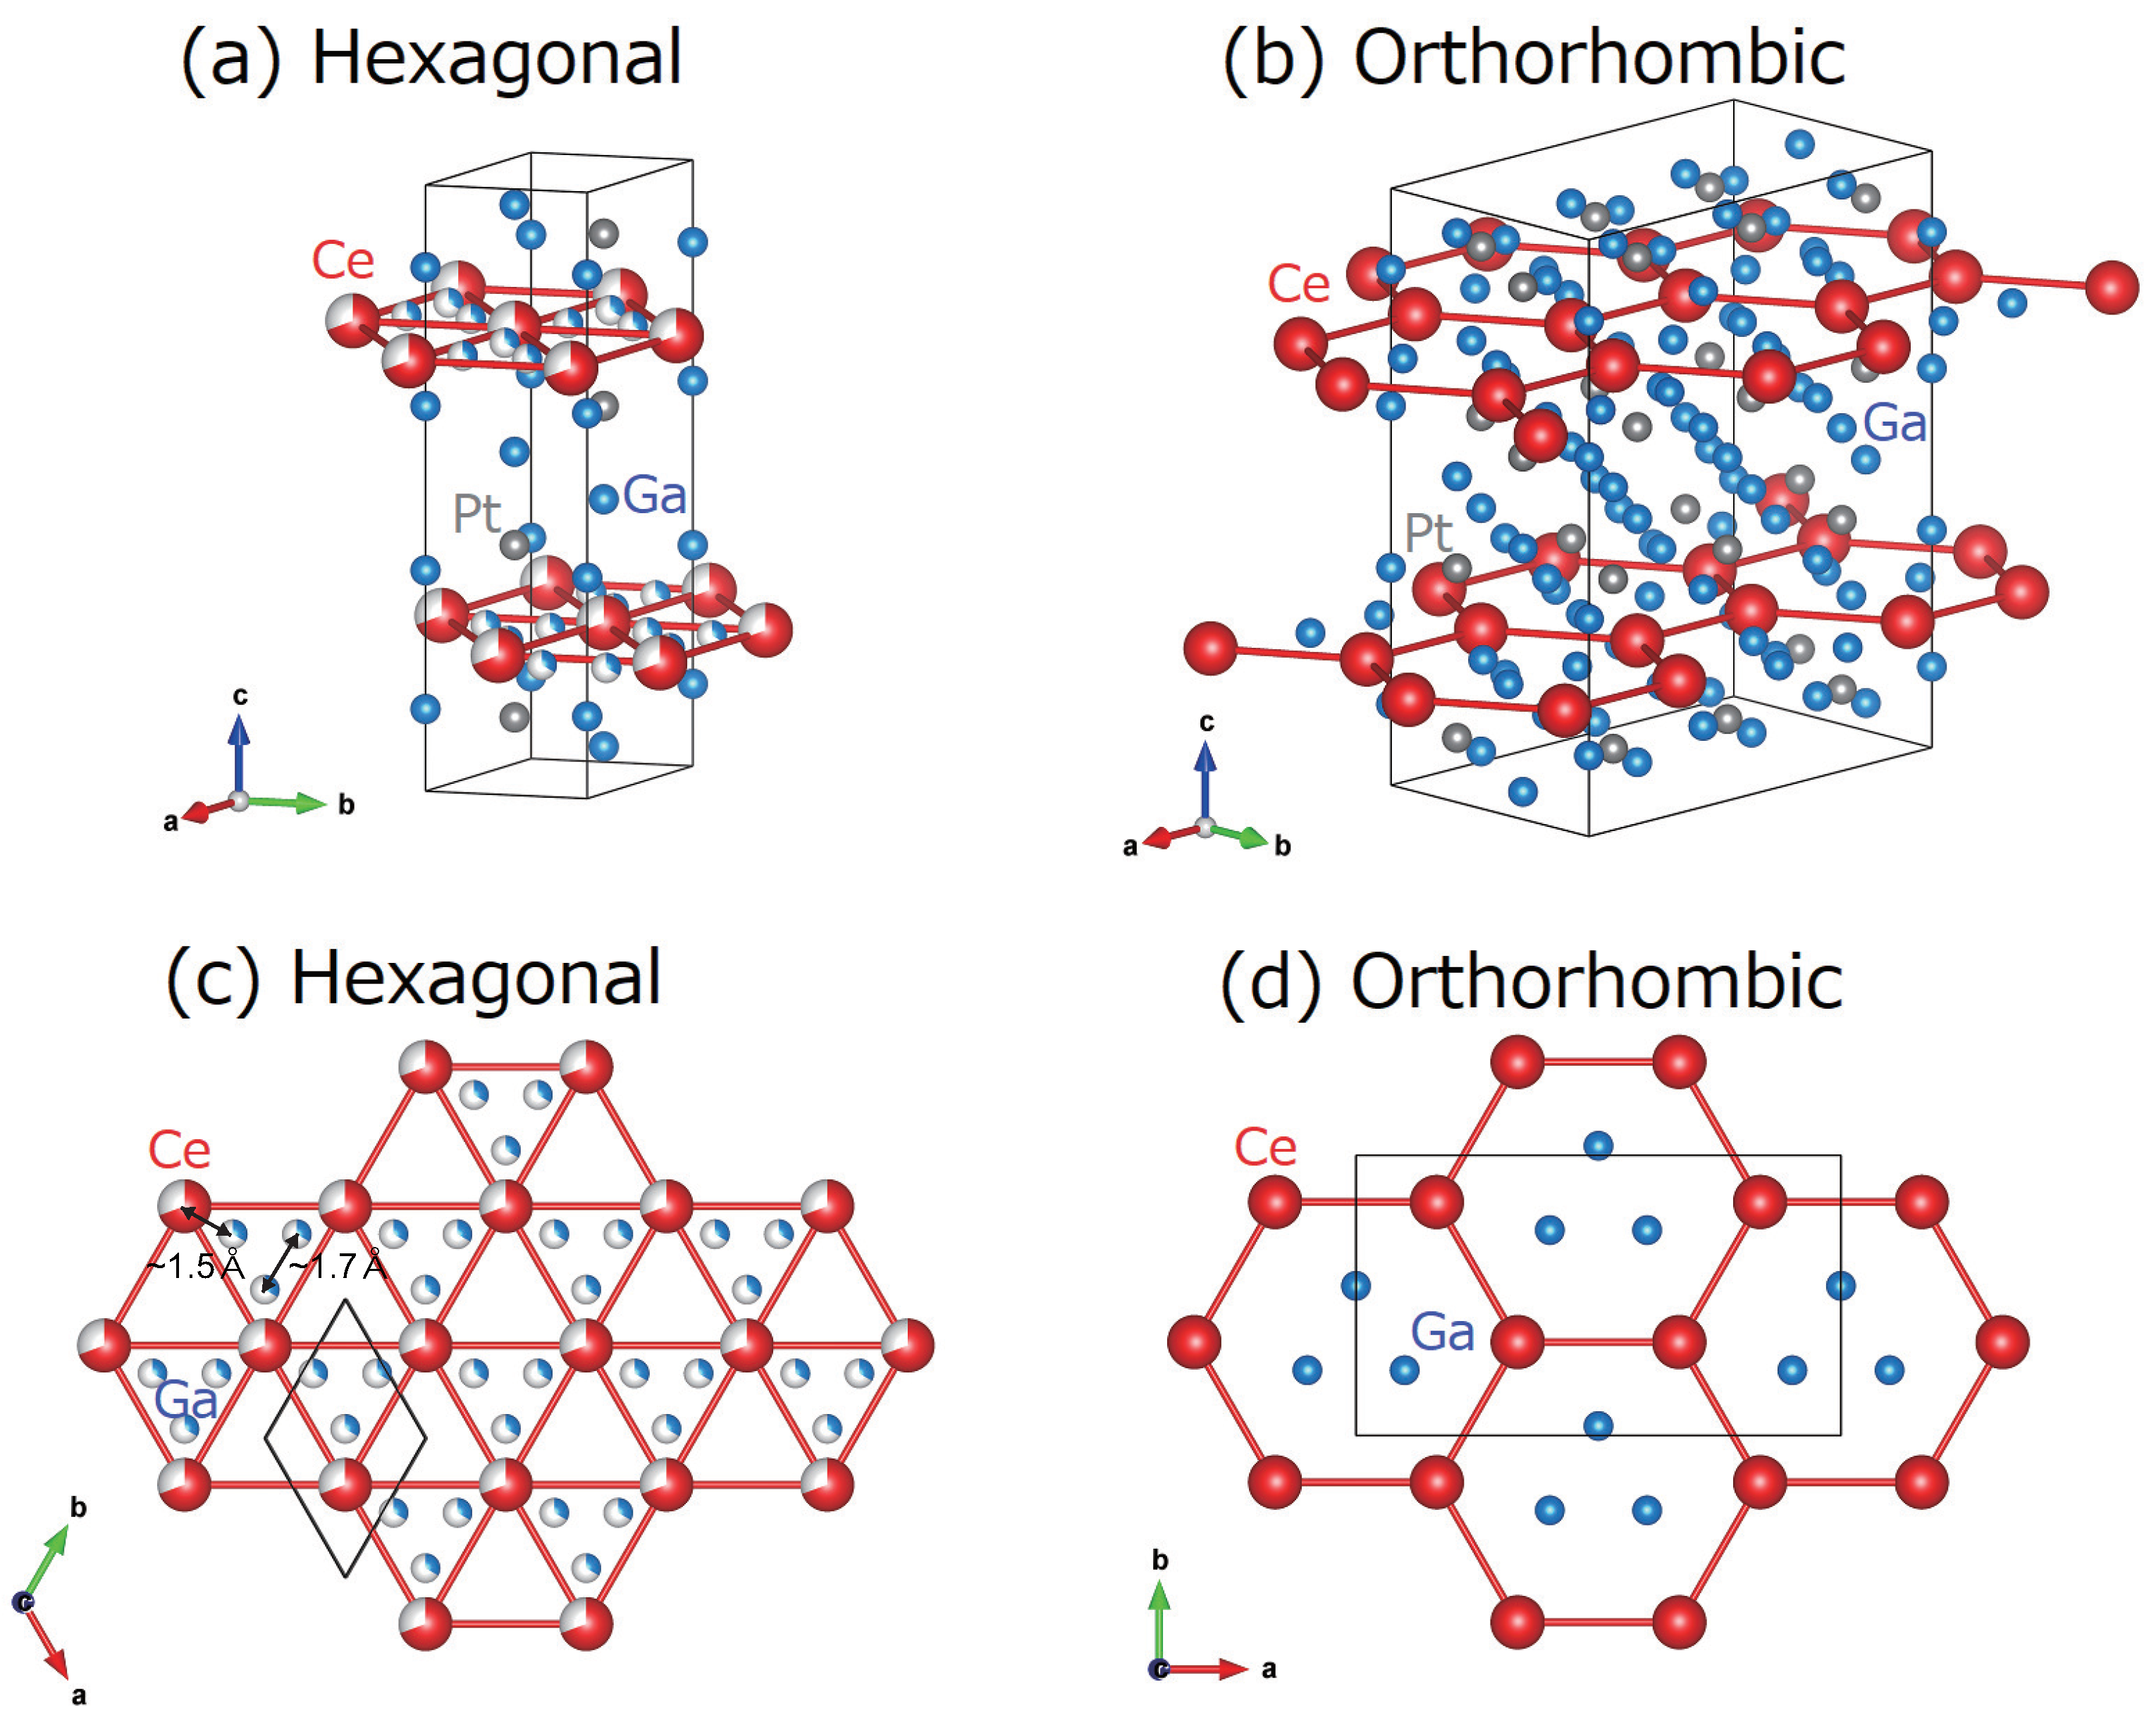
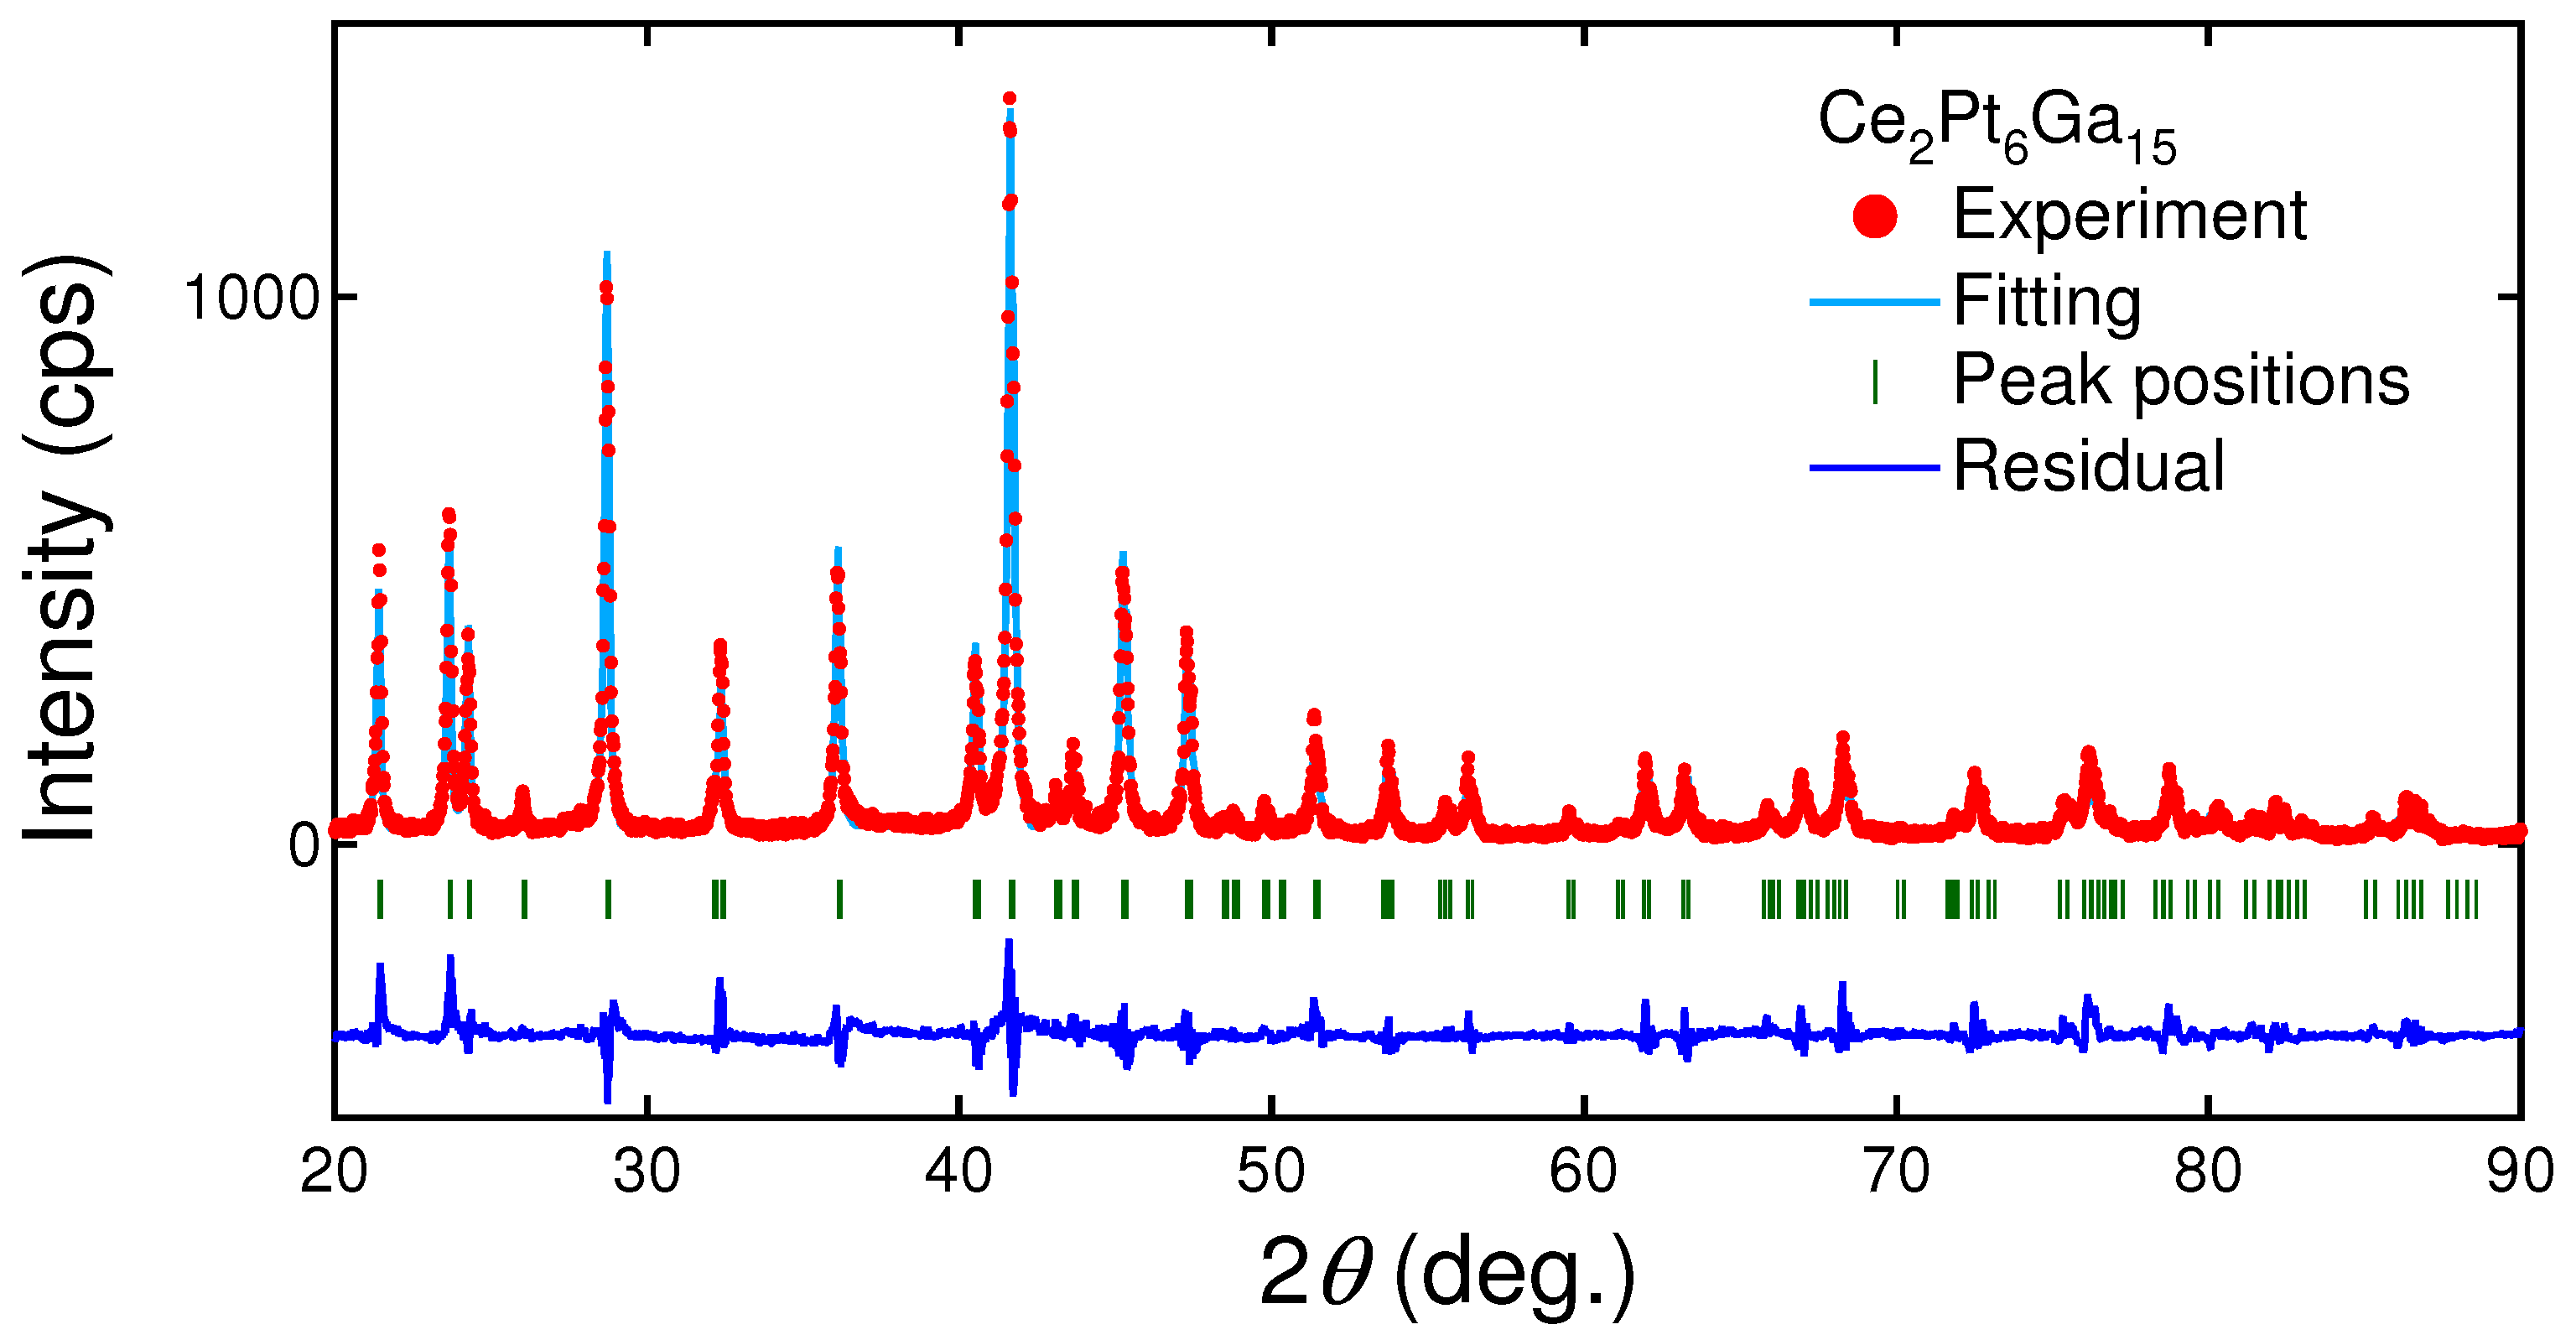
3.1. Powder X-Ray Diffraction
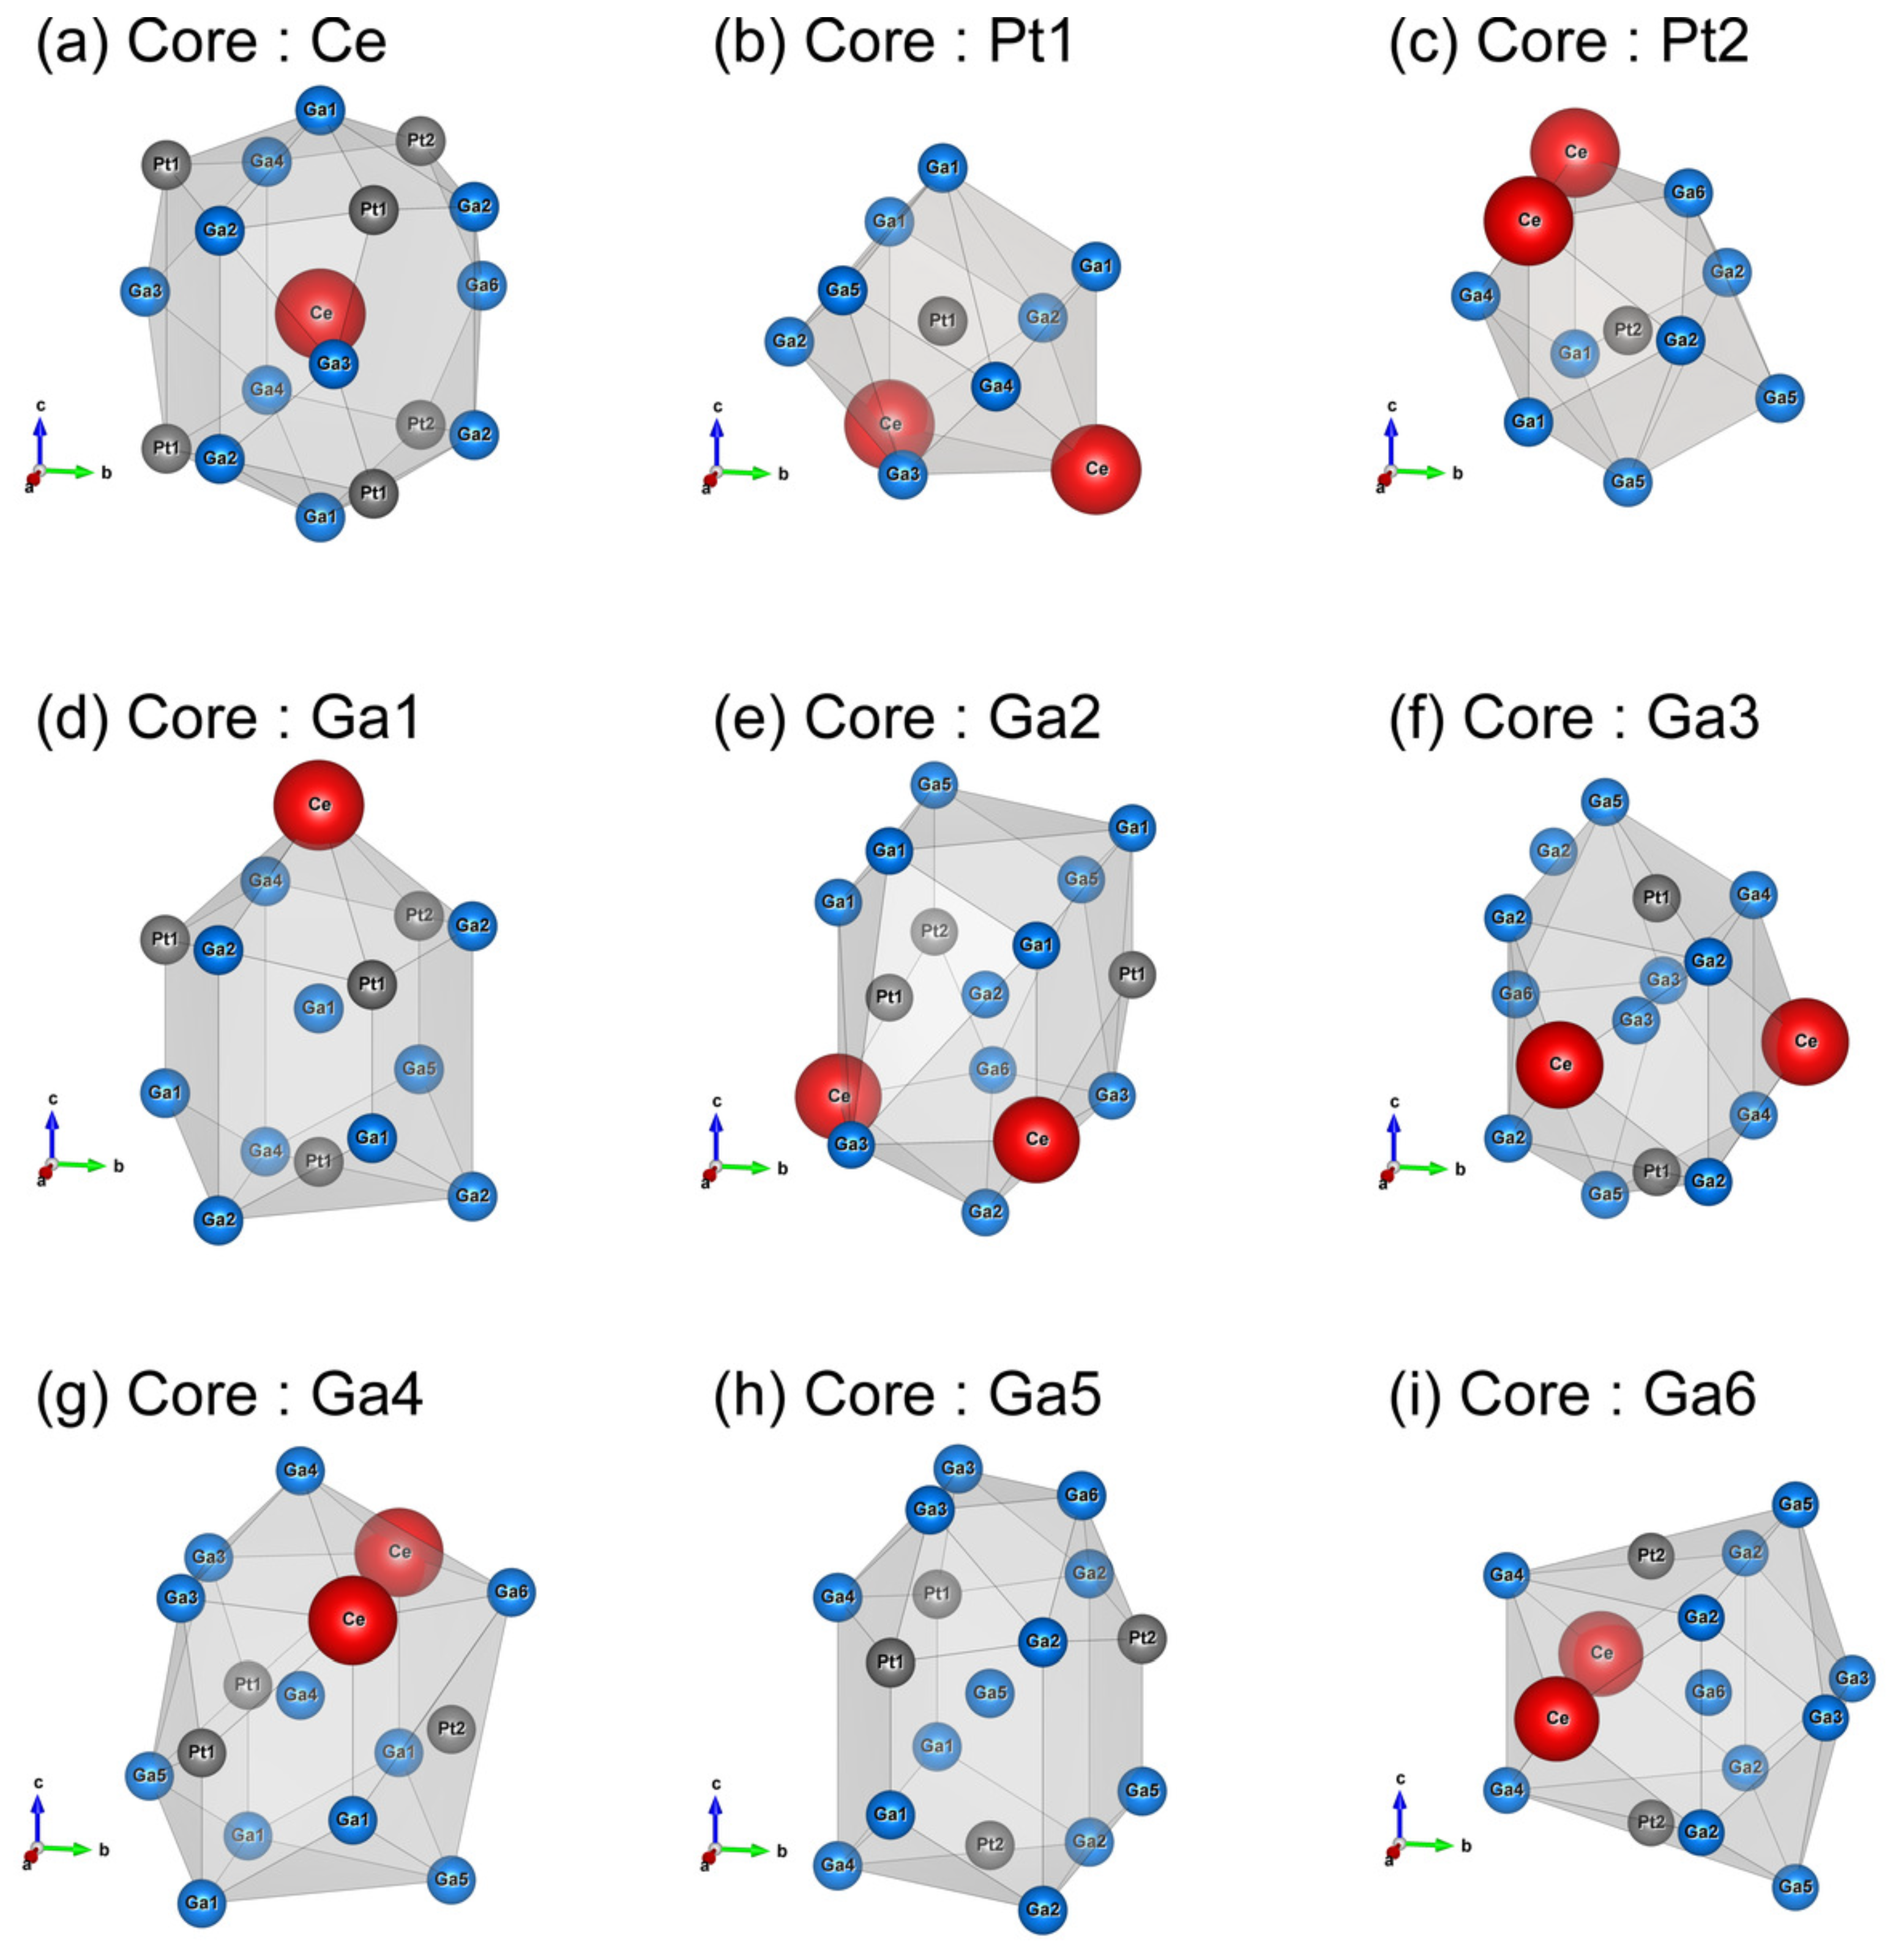
3.2. Single-Crystal X-Ray Diffraction
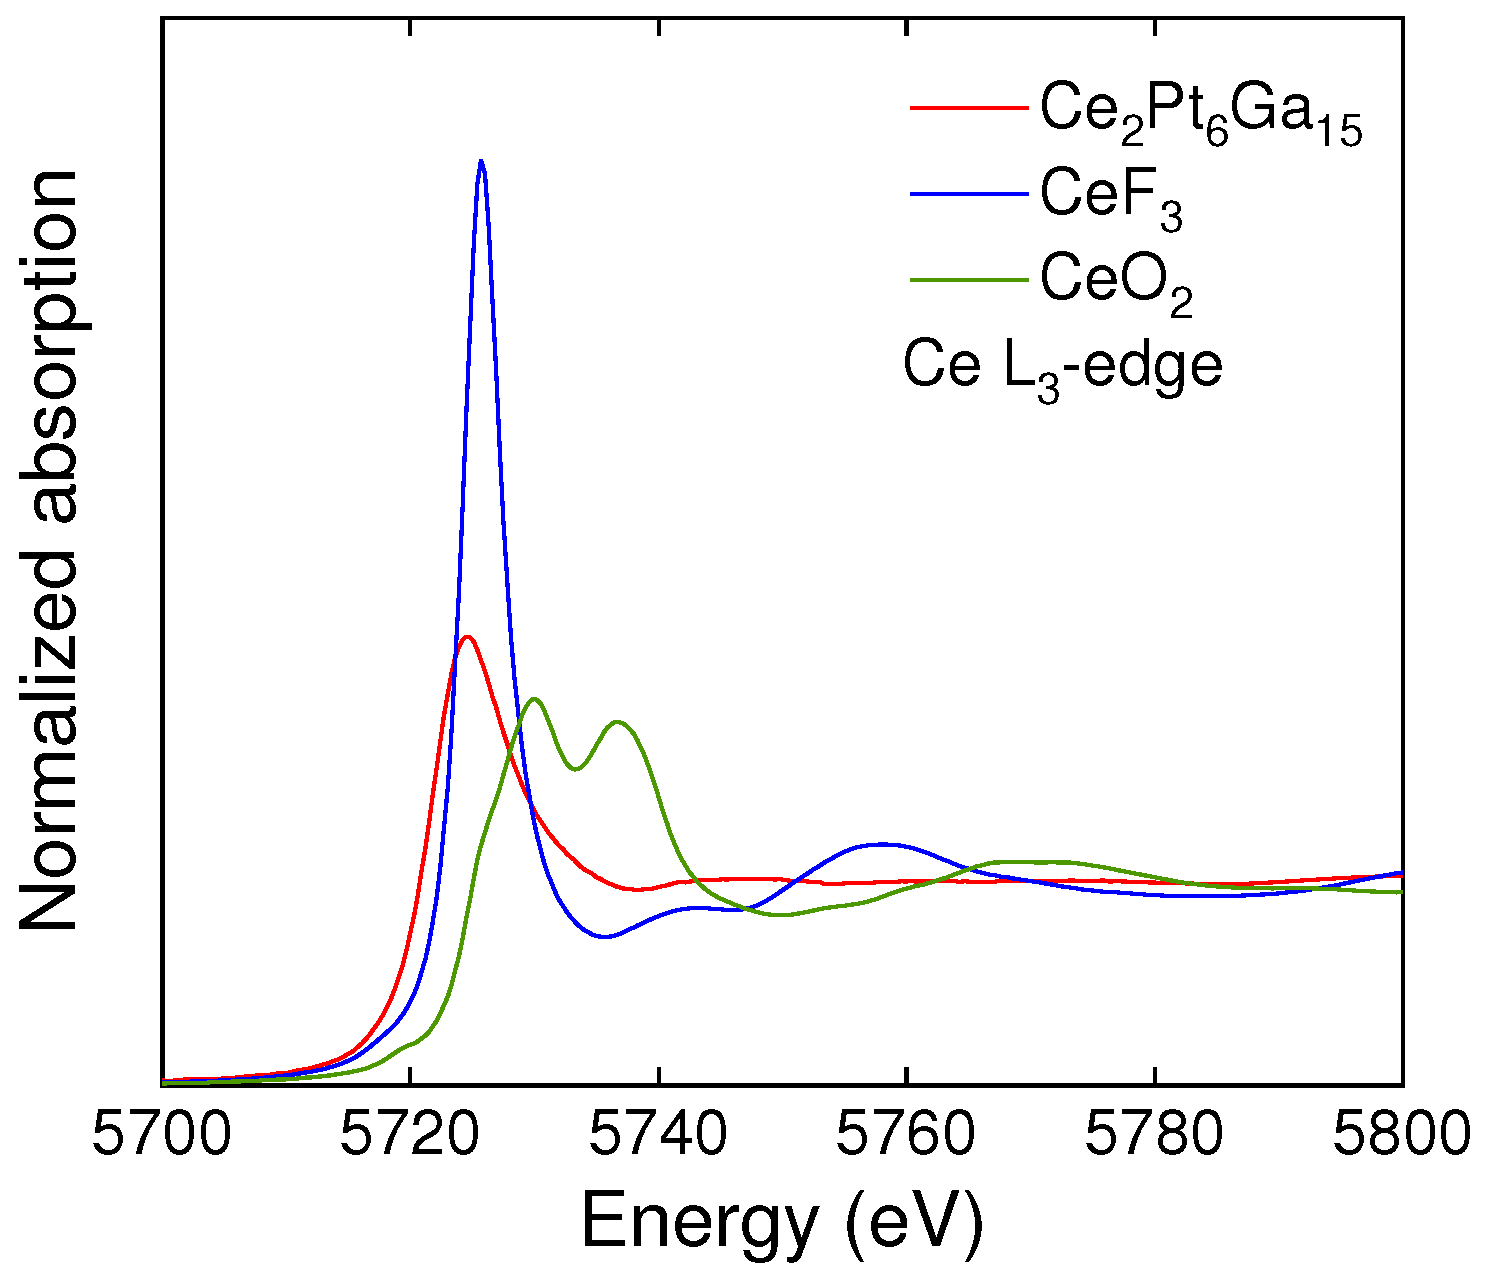
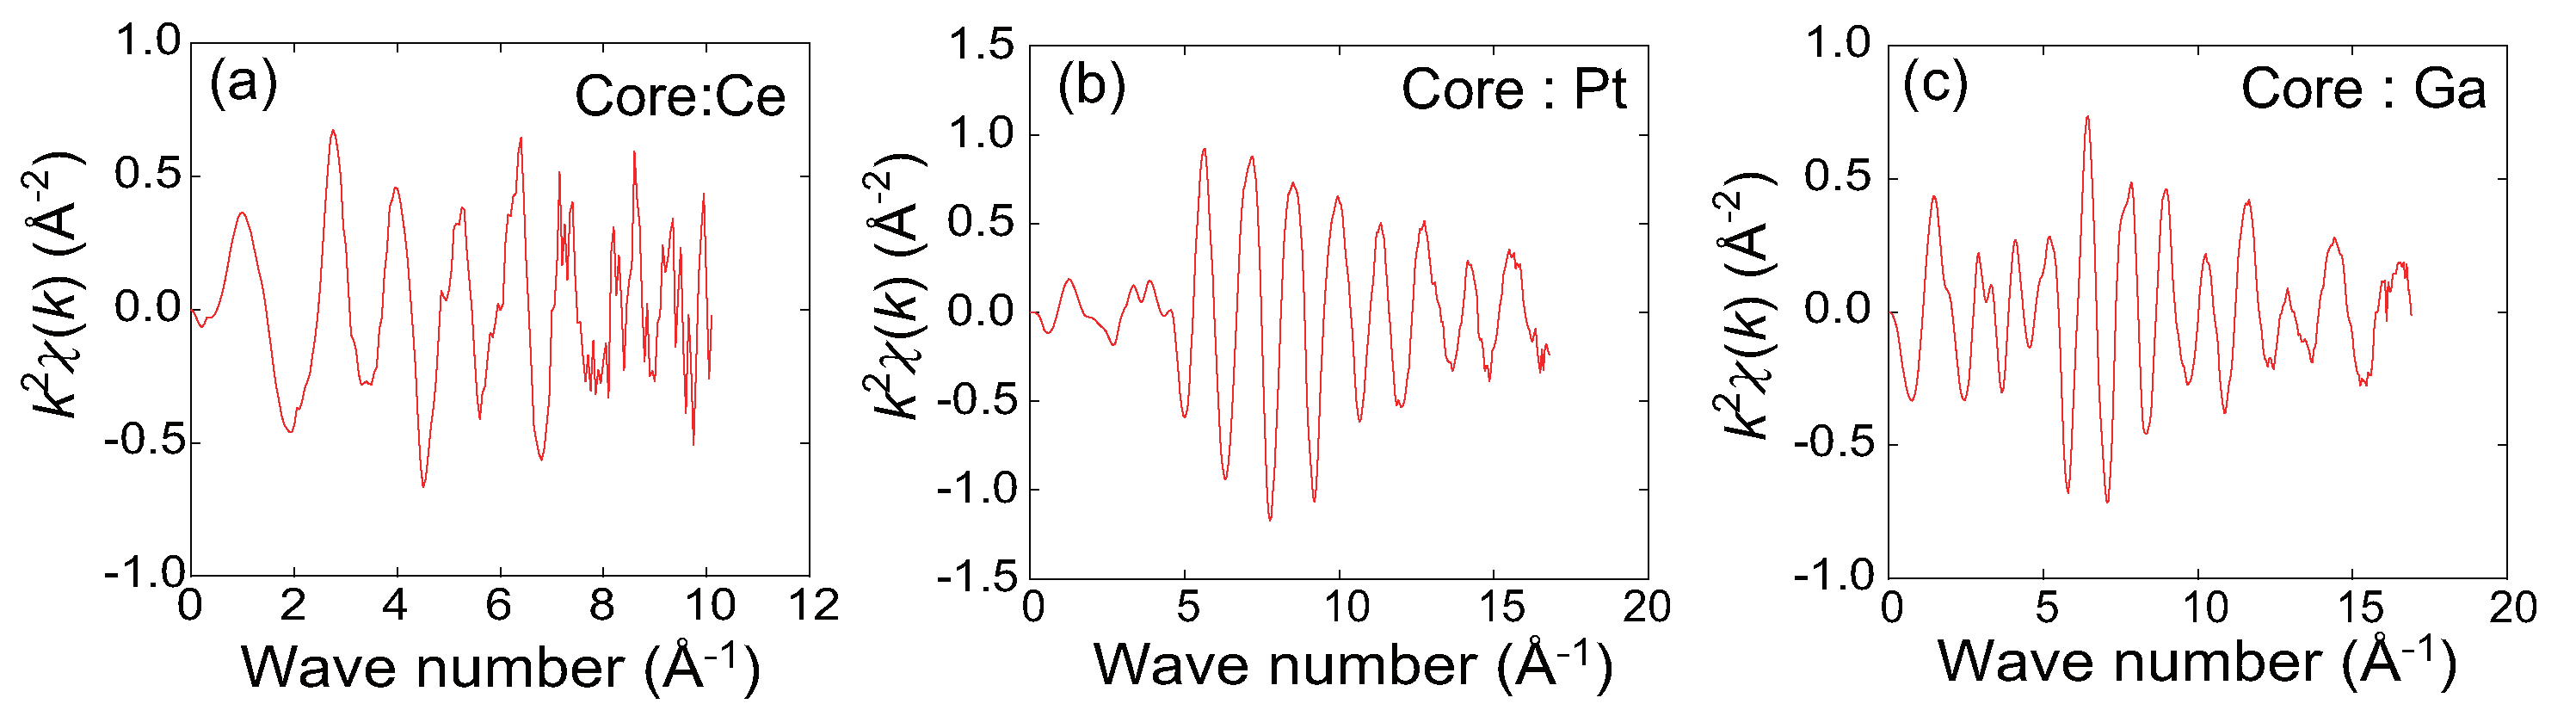
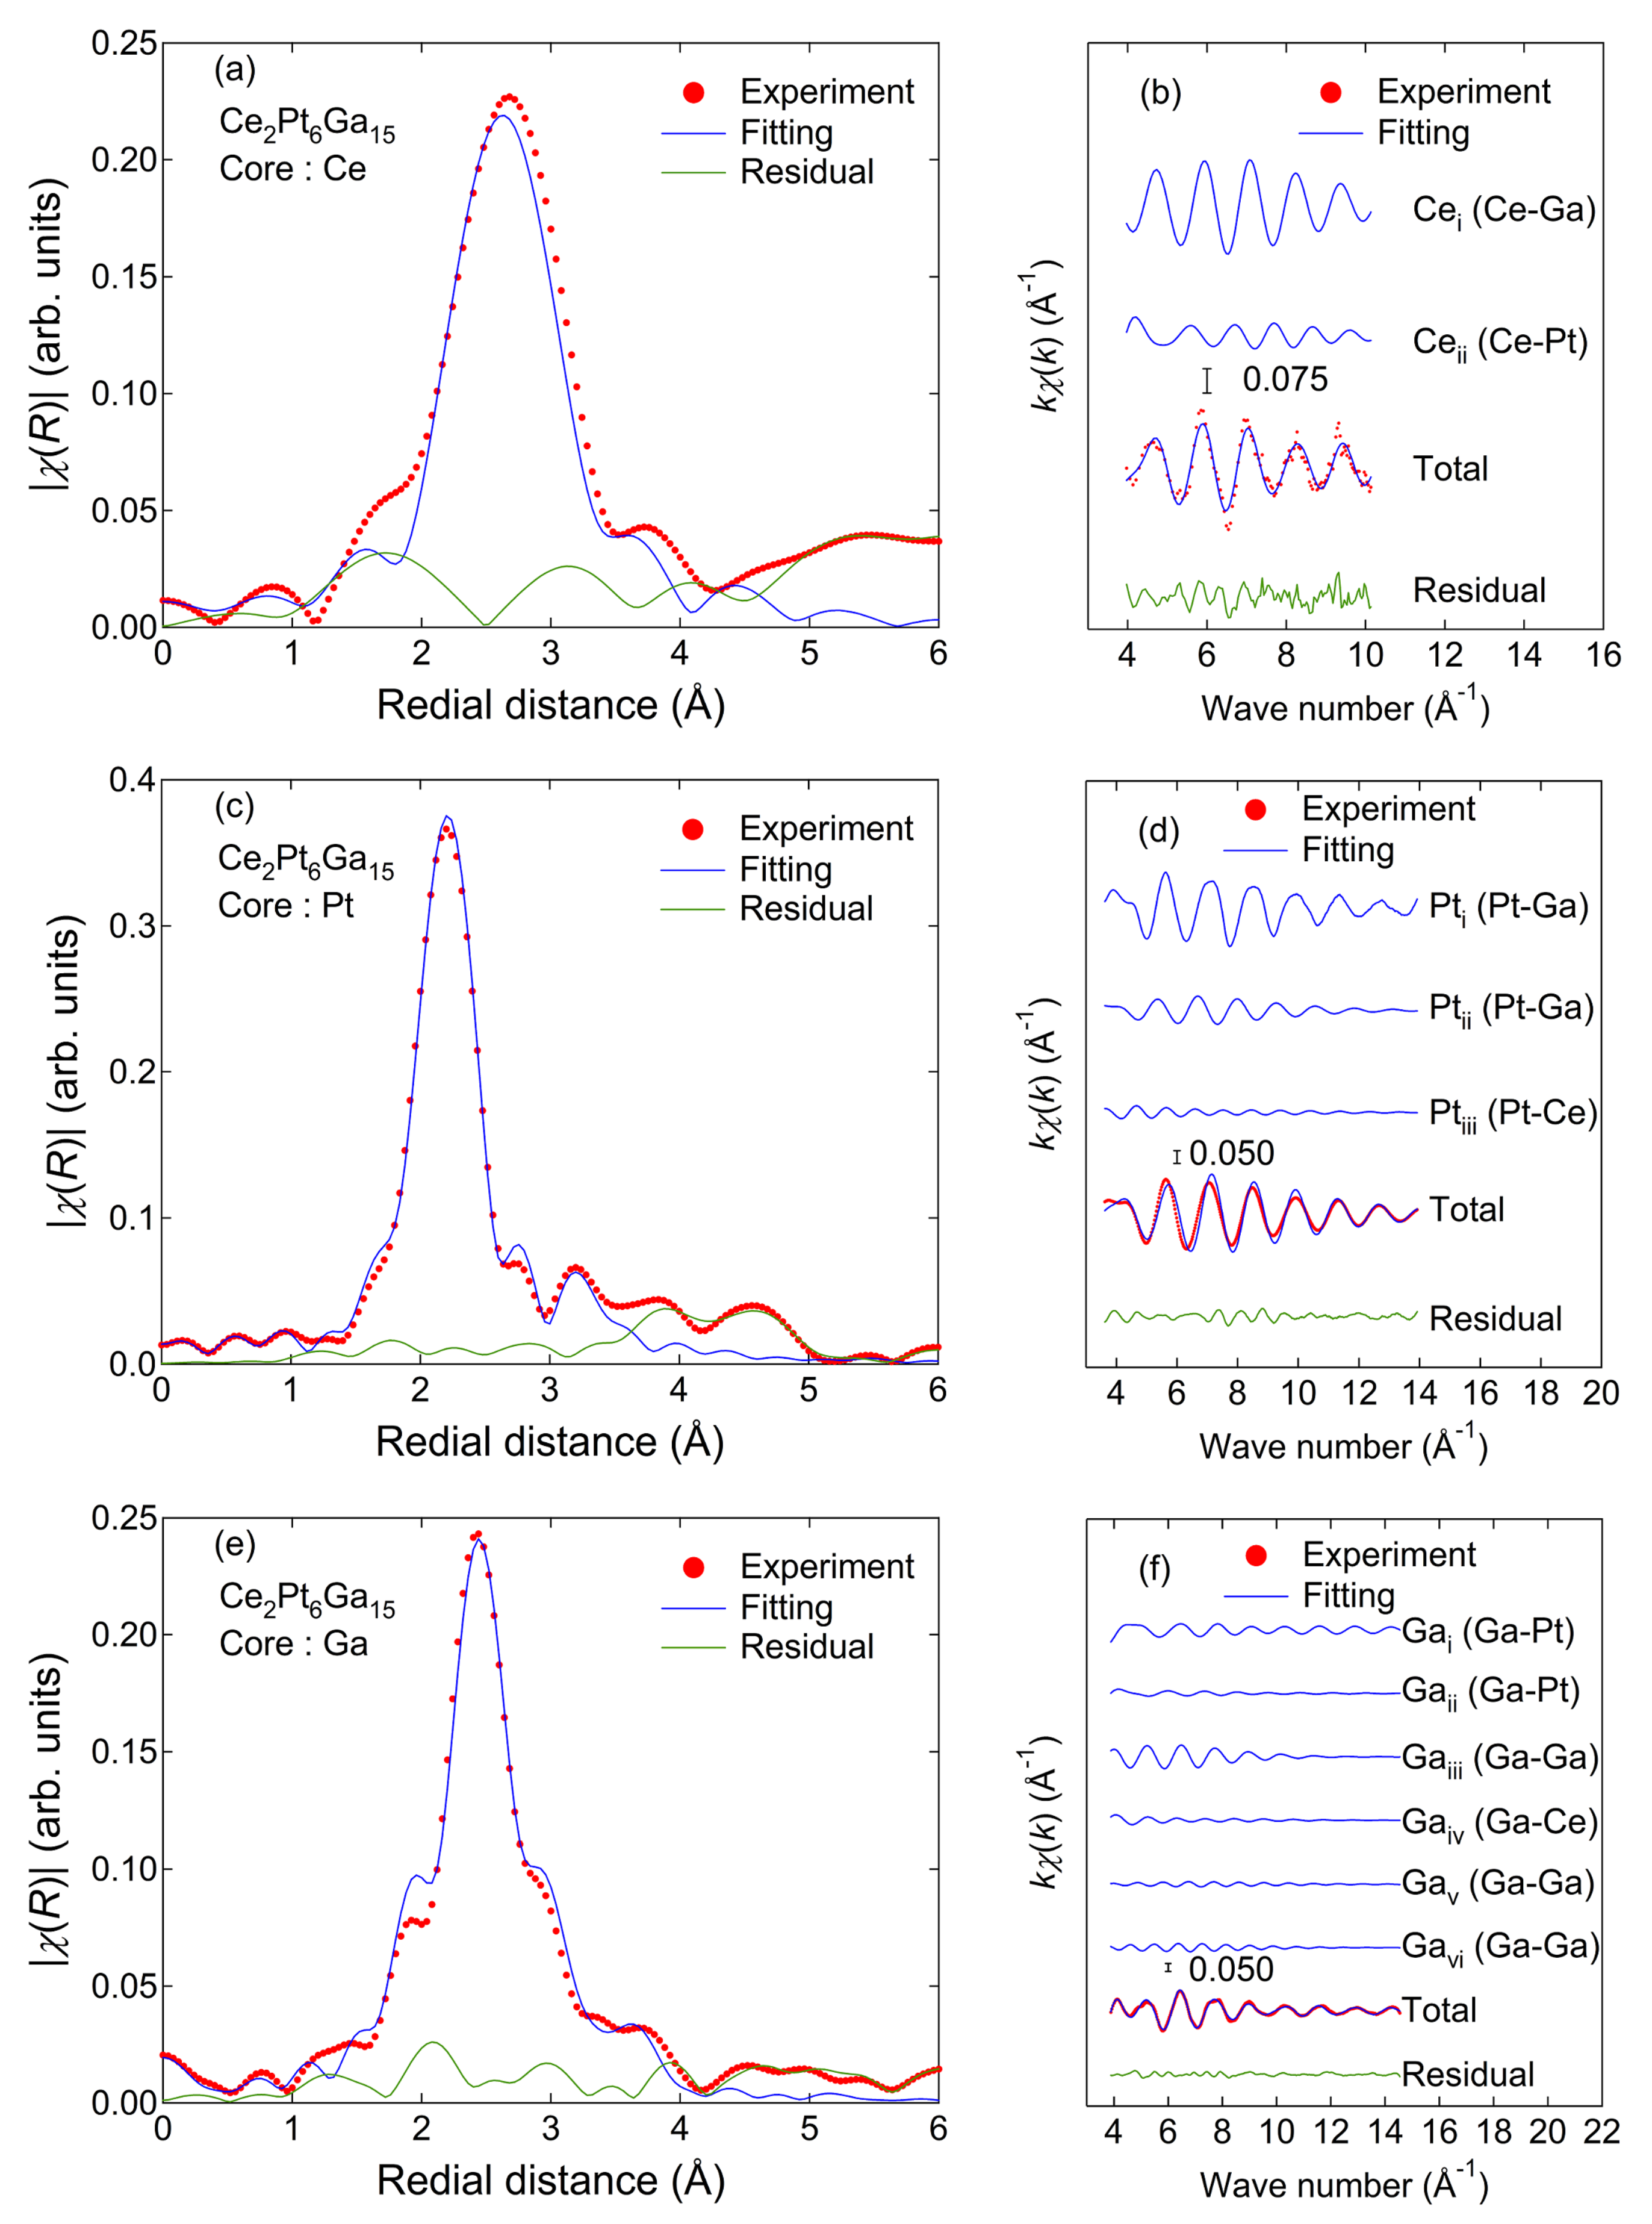
3.3. X-Ray Absorption Spectroscopy
4. Conclusions
Author Contributions
Funding
Data Availability Statement
Acknowledgments
Conflicts of Interest
Abbreviations
| BCS | Bardeen–Cooper–Schrieffer |
| LQC | local quantum criticality |
| HMM | Herts–Millis–Moriya |
| RKKY | Ruderman–Kittel–Kasuya–Yosida |
| QCP | quantum critical point |
| XAS | X-ray absorption spectroscopy |
| EXAFS | extended X-ray absorption fine structure |
| XANES | X-ray absorption near-edge structure |
| NFL | non-Fermi liquid |
| FT | Fourier transform |
References
- Mathur, N.D.; Grosche, F.M.; Julian, S.R.; Walker, I.R.; Freye, D.M.; Haselwimmer, R.K.W.; Lonzarich, G.G. Magnetically mediated superconductivity in heavy fermion compounds. Nature 1998, 394, 39–43. [Google Scholar] [CrossRef]
- Petrovic, C.; Pagliuso, P.G.; Hundley, M.F.; Movshovich, R.; Sarrao, J.L.; Thompson, J.D.; Fisk, Z.; Monthoux, P. Heavy-fermion superconductivity in CeCoIn5 at 2.3 K. J. Phys. Condens. Matter 2001, 13, L337. [Google Scholar]
- Kittaka, S.; Kono, Y.; Tsunashima, K.; Kimoto, D.; Yokoyama, M.; Shimizu, Y.; Sakakibara, T.; Yamashita, M.; Machida, K. Modulation vector of the Fulde-Ferrell-Larkin-Ovchinnikov state in CeCoIn5 revealed by high-resolution magnetostriction measurements. Phys. Rev. B 2023, 107, L220505. [Google Scholar] [CrossRef]
- Lee, S.; Kim, D.Y.; Rosa, P.F.S.; Bauer, E.D.; Ronning, F.; Thompson, J.D.; Lin, S.Z.; Movshovich, R. Normal Fermi Surface in the Nodal Superconductor CeCoIn5 Revealed via Thermal Conductivity. Phys. Rev. Lett. 2024, 132, 236002. [Google Scholar] [CrossRef]
- Chen, W.; Breiø, C.N.; Massee, F.; Allan, M.P.; Petrovic, C.; Davis, J.C.S.; Hirschfeld, P.J.; Andersen, B.M.; Kreisel, A. Interplay of hidden orbital order and superconductivity in CeCoIn5. Nat. Commun. 2023, 14, 2984. [Google Scholar] [CrossRef]
- Aoki, D.; Brison, J.P.; Flouquet, J.; Ishida, K.; Knebel, G.; Tokunaga, Y.; Yanase, Y. Unconventional superconductivity in UTe2. J. Phys. Condens. Matter 2022, 34, 243002. [Google Scholar] [CrossRef]
- Bae, S.; Kim, H.; Eo, Y.S.; Ran, S.; Liu, I.; Fuhrman, W.T.; Paglione, J.; Butch, N.P.; Anlage, S.M. Anomalous normal fluid response in a chiral superconductor UTe2. Nat. Commun. 2021, 12, 2644. [Google Scholar] [CrossRef]
- Duan, C.; Baumbach, R.E.; Podlesnyak, A.; Deng, Y.; Moir, C.; Breindel, A.J.; Maple, M.B.; Nica, E.M.; Si, Q.; Dai, P. Resonance from antiferromagnetic spin fluctuations for superconductivity in UTe2. Nature 2021, 600, 636–640. [Google Scholar] [CrossRef] [PubMed]
- Doniach, S. The Kondo lattice and weak antiferromagnetism. Physica B+C 1977, 91, 231–234. [Google Scholar] [CrossRef]
- Hertz, J.A. Quantum critical phenomena. Phys. Rev. B 1976, 4, 1165–1184. [Google Scholar] [CrossRef]
- Millis, A.J. Effect of a nonzero temperature on quantum critical points in itinerant fermion systems. Phys. Rev. B 1993, 48, 7183–7196. [Google Scholar] [CrossRef] [PubMed]
- Moriya, T.; Takimoto, T. Anomalous Properties around Magnetic Instability in Heavy Electron Systems. J. Phys. Soc. Jpn. 1995, 64, 960–969. [Google Scholar] [CrossRef]
- Custers, J.; Gegenwart, P.; Wilhelm, H.; Neumaier, K.; Tokiwa, Y.; Trovarelli, O.; Geibel, C.; Steglich, F.; Pépin, C.; Coleman, P. The break-up of heavy electrons at a quantum critical point. Nature 2003, 424, 524–527. [Google Scholar] [CrossRef]
- Schuberth, E.; Wirth, S.; Steglich, F. Nuclear-Order-Induced Quantum Criticality and Heavy-Fermion Superconductivity at Ultra-low Temperatures in YbRh2Si2. Front. Electron. Mater. 2022, 2, 869495. [Google Scholar] [CrossRef]
- Nakatsuji, S.; Kuga, K.; Machida, Y.; Tayama, T.; Sakakibara, T.; Karaki, Y.; Ishimoto, H.; Yonezawa, S.; Maeno, Y.; Person, E.; et al. Superconductivity and quantum criticality in the heavy-fermion system β-YbAlB4. Nat. Phys. 2008, 4, 603–607. [Google Scholar] [CrossRef]
- Sakaguchi, Y.; Ikeda, S.; Kawamura, N.; Mizumaki, M.; Kuga, K.; Suzuki, S.; Sone, K.; Nakatsuji, S.; Kobayashi, H. Pressure-induced changes of valence fluctuation in β-YbAlB4 probed by X-ray absorption spectroscopy. Phys. Rev. B 2022, 105, 155129. [Google Scholar] [CrossRef]
- Si, Q.; Rabello, S.; Ingersent, K.; Smith, J.L. Locally critical quantum phase transitions in strongly correlated metals. Nature 2001, 413, 804–808. [Google Scholar] [CrossRef] [PubMed]
- Lutsyshyn, Y.; Tokaychuk, Y.; Gladyshevskii, R. Crystal structure of the compound Tb0.67Pt2Al5. Chem. Met. Alloys 2009, 2, 75–82. [Google Scholar] [CrossRef]
- Prots, Y.; Deppe, M.; Cardoso-Gil, R.; Cervellino, A.; Ormeci, A.; Geibel, C.; Grin, Y. Yb2Al15Pt6—The most ordered variety of the Sc1.2Fe4Si9.8 aristotype. Chem. Met. Alloys 2014, 7, 85–99. [Google Scholar] [CrossRef]
- Niermann, J.; Jeitschko, W. Ternary Aluminides with the Ideal Composition A2Pt6Al15(A = Y, Gd-Tm, Zr). Z. Anorg. Alleg. Chem. 2004, 630, 361–368. [Google Scholar] [CrossRef]
- Murashova, E.V.; Tursina, A.I.; Bukhan’ko, N.G.; Gribanov, A.V.; Chernyshev, I.V.; Seropegin, Y.D. Ternary compounds Ce0.67Pt2Al5 and Ce1.33Pt3Al8. J. Alloys Compd. 2005, 398, 100–105. [Google Scholar] [CrossRef]
- Lacerda, A.; Canfield, P.C.; Beyermann, W.P.; Hundley, M.F.; Thompson, J.D.; Sparn, G.; Fisk, Z.; Burns, C.; Barnhart, D.; Lawson, A.C.; et al. Possible heavy-fermion behavior and field-induced transitions in new R-Pt-Ga compounds. J. Alloys Compd. 1992, 181, 191–196. [Google Scholar] [CrossRef]
- Deppe, M.; Hartmann, S.; Macovei, M.E.; Oeschler, N.; Nicklas, M.; Geibel, C. Investigation of Yb2Pt6Al15 single crystals:heavy fermion system with a large local moment degeneracy. New J. Phys. 2008, 10, 093017. [Google Scholar] [CrossRef]
- Matsumoto, Y.; Ueda, T.; Ohara, S. Single crystal growth and heat capacity measurements of triangular lattice R2Pt6Ga15 (R = rare earth). J. Phys. Conf. Ser. 2016, 683, 012035. [Google Scholar] [CrossRef]
- Bobev, S.; Bauer, E.D.; Sarrao, J.L. Uranium and aluminium order-disorder in U1-xPt2Al7-6x [x = 0.33 (1)]. Acta Cryst. 2006, E62, i77–i79. [Google Scholar]
- Kwei, G.H.; Lawson, A.C.; Larson, A.C.; Morosin, B.; Larson, E.M.; Canfield, P.C. Structure of Ce2Pt6Ga15: Interplanar Disorder from the Ce2Ga3 Layers. Acta Cryst. 1996, B52, 580–585. [Google Scholar] [CrossRef]
- Yamashita, T.; Ohara, S. Non-Fermi liquid behavior on heavy-fermion system Ce2Pt6Ga15. J. Phys. Conf. Ser. 2012, 400, 042074. [Google Scholar] [CrossRef]
- Radzieowski, M.; Stegemann, F.; Block, T.; Stahl, J.; Johrendt, D.; Janka, O. Abrupt Europium Valence Change in Eu2Pt6Al15 around 45 K. J. Am. Chem. Soc. 2018, 140, 8950–8957. [Google Scholar] [CrossRef]
- Radzieowski, M.; Stegemann, F.; Hoffmann, R.-D.; Janka, O. The monoclinic superstructure of the M2Pt6Al15 series (M = Ca, Sc, Y, La, Lu). Z. Kristallogr. 2017, 232, 2050. [Google Scholar]
- Macaluso, R.T.; Shatruk, M.; Chai, P.; Hong, H.; Wangeline, C.; Ryan, K.; Holton, P.; Allaz, J.; Morrison, G.; Fulfer, B.; et al. Synthesis, structure, and magnetic behavior of (LaxCe1-x)1.33Pt4Ga10 (0 ≤x≤ 1). J. Alloys Compd. 2014, 600, 193–198. [Google Scholar] [CrossRef]
- Nguyen, S.D.; Ryan, K.; Chai, P.; Shatruk, M.; Xin, Y.; Chapman, K.W.; Chupas, P.J.; Fronczek, F.R.; Macaluso, R.T. Pr1.33Pt4Ga10: Superstructure and magnetism. J. Solid State Chem. 2014, 220, 9–16. [Google Scholar] [CrossRef]
- Radzieowski, M.; Stegemann, F.; Janka, O. Magnetic Properties of the RE2Pt6X15 (RE = Y, La-Nd, Sm, Gd-Lu; X = Al, Ga) Series. Eur. J. Inorg. Chem. 2020, 2020, 1199–1210. [Google Scholar] [CrossRef]
- Matsumoto, Y.; Haga, Y.; Yamamoto, E.; Takeuchi, T.; Miyake, A.; Tokunaga, M. Anisotropic Physical Properties of Layered Antiferromagnet U2Pt6Ga15. J. Phys. Soc. Jpn. 2021, 90, 074707. [Google Scholar] [CrossRef]
- Tabata, C.; Kon, F.; Ota, K.; Hibino, R.; Matsumoto, Y.; Amitsuka, H.; Nakao, H.; Haga, Y.; Kaneko, K. Magnetic order in honeycomb layered U2Pt6Ga15 studied by resonant X-ray and neutron scattering. Phys. Rev. B 2024, 109, 134403. [Google Scholar] [CrossRef]
- Ota, K.; Matsumoto, Y.; Watabe, Y.; Kaneko, K.; Tabata, T.; Haga, Y. Neutron Scattering Study of Antiferromagnet U2Pt6Al15. New Phys. Sae Mulli 2023, 73, 1170–1173. [Google Scholar] [CrossRef]
- Ota, K.; Watabe, Y.; Haga, Y.; Iesari, F.; Okajima, T.; Matsumoto, Y. Synthesis, Crystal Structure, Local Structure, and Magnetic Properties of Polycrystalline and Single-Crystalline Ce2Pt6Al15. Symmetry 2023, 15, 1488. [Google Scholar] [CrossRef]
- Engel, S.; Schumacher, L.; Janka, O. Modifying the valence phase transition in Eu2Al15Pt6 by the solid solutions Eu2Al15(Pt1-xTx)6 (T = Pd, Ir, Au; x = 1/6). Z. Naturforsch. B 2024, 79, 21–27. [Google Scholar] [CrossRef]
- Izumi, F.; Momma, K. Three-Dimensional Visualization in Powder Diffraction. Solid State Phenom. 2007, 130, 15–20. [Google Scholar] [CrossRef]
- Sheldrick, G.M. A short history of SHELX. Acta Cryst. A 2008, 64, 112–122. [Google Scholar] [CrossRef]
- Filipponi, A.; Cicco, A.D.; Natoli, C.R. X-ray-absorption spectroscopy and n-body distribution functions in condensed matter. I. Theory. Phys. Rev. B 1995, 52, 122–134. [Google Scholar] [CrossRef]
- Filipponi, A.; Cicco, A.D. X-ray-absorption spectroscopy and n-body distribution functions in condensed matter. II. Data analysis and applications. Phys. Rev. B 1995, 52, 135–149. [Google Scholar] [CrossRef] [PubMed]

| Space group | P63/ (194) |
| Lattice constants (Å) | a = 4.3334(9) |
| c = 16.5473(15) | |
| Formula units per cell, Z | 1 |
| Formula mass | 2496.58 |
| Calculated density (g ) | 15.405 |
| Absorption coefficient () | 1223.124 |
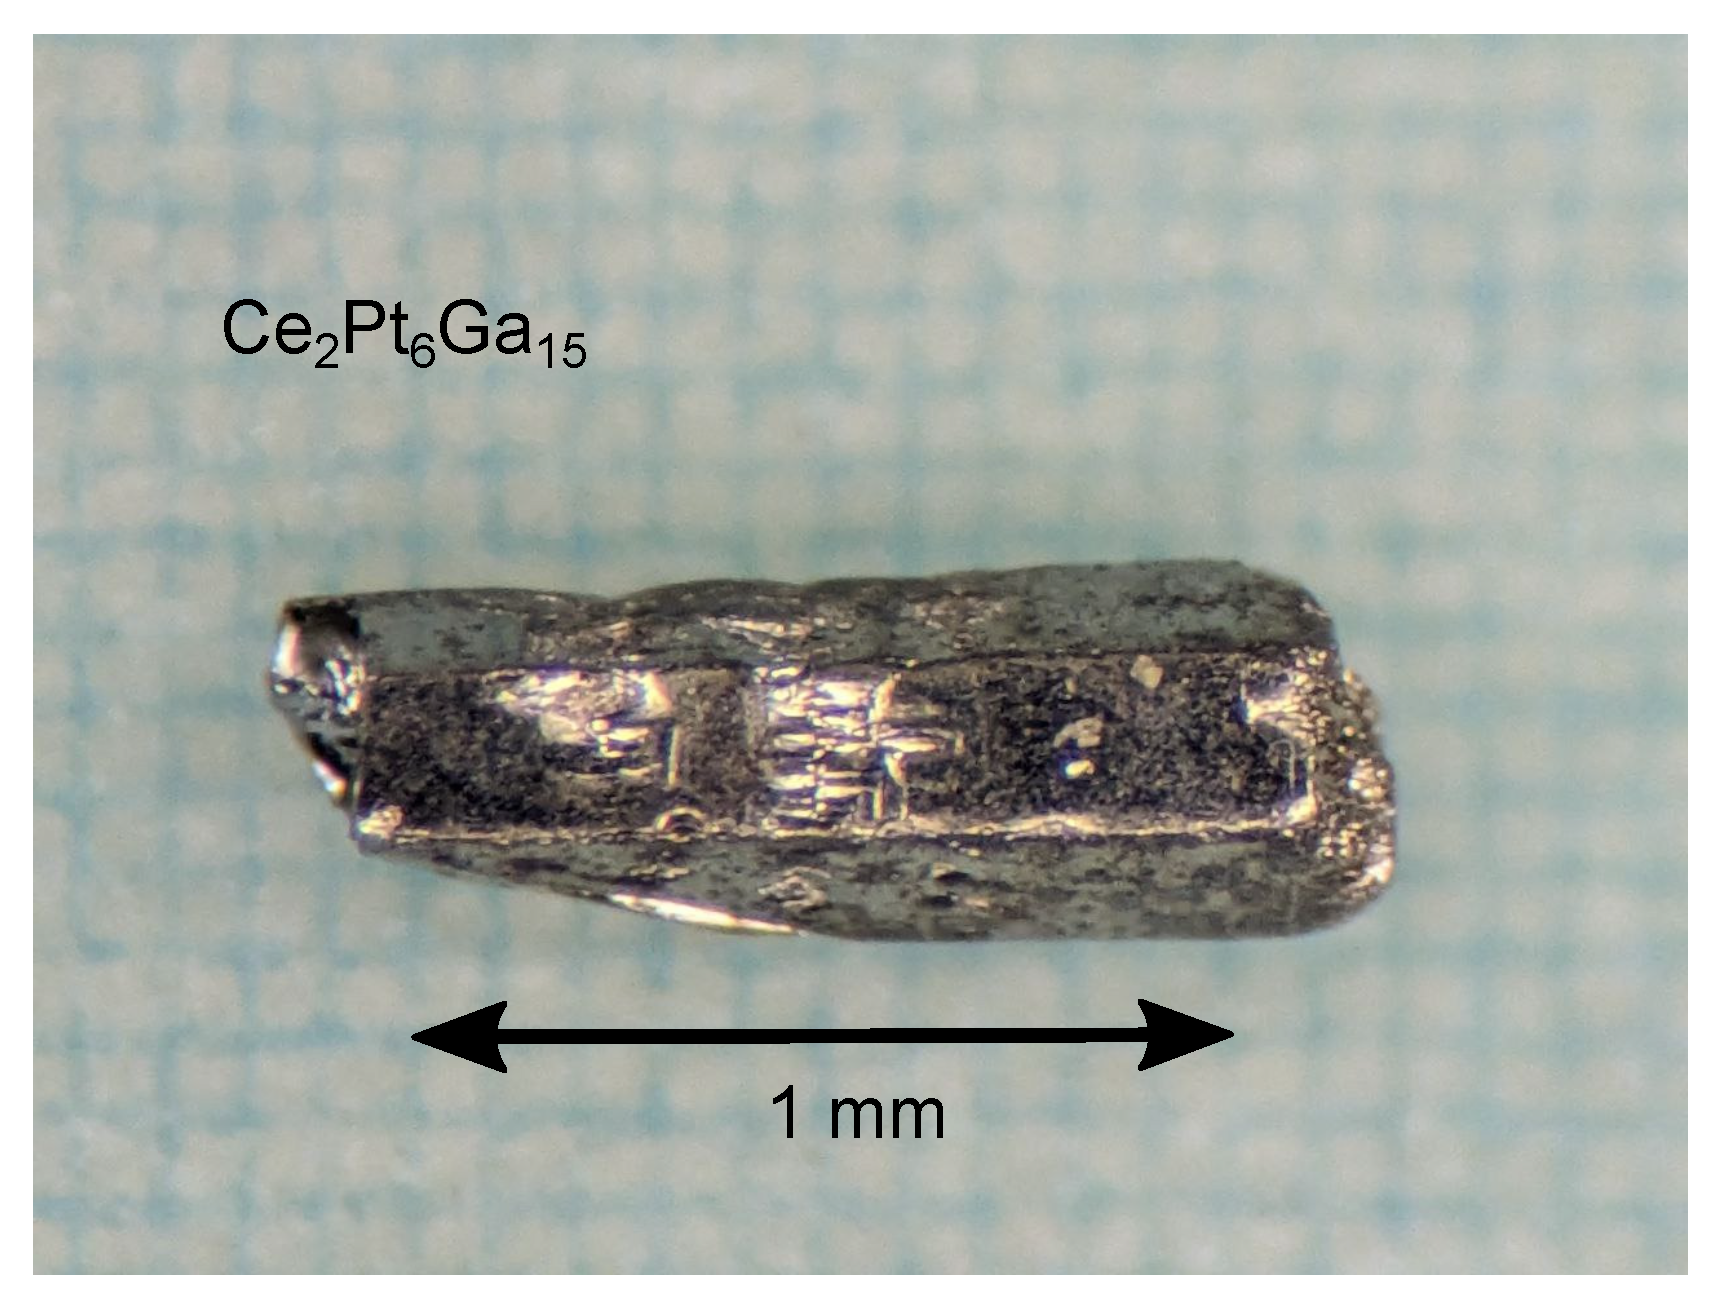
| Crystal dimensions (mm) | 0.038 × 0.025 × 0.022 |
| Diffractometer | R-AXIS RAPID |
| Radiation | MoK ( = 0.71075 Å) |
| Detector distance (mm) | 127.40 |
| Exposure rate (s/deg.) | 90.0 |
| range (deg.) | 2.46–34.73 |
| Range in | −6 < h < 6 |
| −6 < k < 6 | |
| −26 < l < 22 | |
| Total no. reflections | 5892 |
| Unique reflections | 265 |
| Reliability factor | 0.0384 |
| Reflection/parameter ratio | 12.62 |
| Goodness of fit | 1.412 |
| Reflections with I > 2(I) | 257 |
| (I > 2(I)) | 0.0133 |
| R (All reflection) | 0.0143 |
| (All reflection) | 0.0265 |
| Residual electron density (/ e Å−3) | 0.84/−1.23 |
| Temperature (K) | 291 |
| Atom | Wyckoff Symbol | x | y | z | (Å2) | Occupancy |
|---|---|---|---|---|---|---|
| Ce | 2c | 1/3 | 2/3 | 1/4 | 0.0060(2) | 0.693(3) |
| Pt | 4f | 1/3 | 2/3 | 0.60788(2) | 0.00676(9) | 1 |
| Ga1 | 6h | 0.5340(2) | 0.0680(5) | 1/4 | 0.0073(4) | 0.332(3) |
| Ga2 | 4e | 0 | 0 | 0.13562(4) | 0.0092(2) | 1.030(4) |
| Ga3 | 4f | 1/3 | 2/3 | 0.04606(4) | 0.0088(2) | 1.027(4) |
| Atom | x | y | z |
|---|---|---|---|
| Ce | 1/6 | 1/6 | 1/4 |
| Pt1 | 1/3 | 1/3 | 0.1079 |
| Pt2 | 0 | 1/3 | 0.1079 |
| Ga1 | 1/6 | 1/6 | 0.0461 |
| Ga2 | 1/3 | 0 | 0.1356 |
| Ga3 | 0.3997 | 0.2670 | 1/4 |
| Ga4 | 0 | 0 | 0.1356 |
| Ga5 | 0 | 1/3 | 0.5461 |
| Ga6 | 0 | 0.4660 | 1/4 |
| Ce | Pt1 | Pt2 | |||||||||
|---|---|---|---|---|---|---|---|---|---|---|---|
| Use | Site | (Å) | Use | Site | (Å) | Use | Site | (Å) | |||
| ○ | Ga3 | 3.121 | 2 | ○ | Ga2 | 2.544 | 2 | ○ | Ga4 | 2.544 | 1 |
| ○ | Ga6 | 3.121 | 1 | ○ | Ga4 | 2.544 | 1 | ○ | Ga2 | 2.544 | 2 |
| ○ | Ga2 | 3.137 | 4 | ○ | Ga1 | 2.547 | 1 | ○ | Ga5 | 2.547 | 1 |
| ○ | Ga4 | 3.137 | 2 | ○ | Ga3 | 2.554 | 1 | ○ | Ga6 | 2.554 | 1 |
| Ga1 | 3.375 | 2 | ○ | Ga1 | 2.703 | 2 | ○ | Ga1 | 2.703 | 2 | |
| ○ | Pt1 | 3.434 | 4 | ○ | Ga5 | 2.703 | 1 | ○ | Ga5 | 2.703 | 1 |
| ○ | Pt2 | 3.434 | 2 | ○ | Ce | 3.434 | 2 | ○ | Ce | 3.434 | 2 |
| Ga1 | Ga2 | Ga3 | |||||||||
| Use | Site | (Å) | Use | Site | (Å) | Use | Site | (Å) | |||
| ○ | Pt1 | 2.547 | 1 | ○ | Pt1 | 2.544 | 2 | ○ | Pt1 | 2.554 | 2 |
| ○ | Pt1 | 2.703 | 2 | ○ | Pt2 | 2.544 | 1 | Ga3 | 2.609 | 1 | |
| ○ | Pt2 | 2.703 | 1 | ○ | Ga6 | 2.888 | 1 | Ga6 | 2.609 | 1 | |
| ○ | Ga4 | 2.908 | 1 | ○ | Ga3 | 2.888 | 1 | ○ | Ga4 | 2.888 | 2 |
| ○ | Ga2 | 2.908 | 2 | ○ | Ga1 | 2.908 | 2 | ○ | Ga2 | 2.888 | 2 |
| ○ | Ga5 | 2.93 | 1 | ○ | Ga5 | 2.908 | 1 | ○ | Ce | 3.121 | 2 |
| ○ | Ga1 | 2.93 | 2 | ○ | Ce | 3.137 | 2 | ○ | Ga5 | 3.696 | 2 |
| Ce | 3.375 | 1 | ○ | Ga2 | 3.785 | 1 | ○ | Ga2 | 3.977 | 2 | |
| ○ | Ga4 | 3.911 | 1 | ○ | Ga1 | 3.911 | 2 | ||||
| ○ | Ga2 | 3.911 | 2 | ○ | Ga5 | 3.911 | 1 | ||||
| ○ | Ga3 | 3.977 | 1 | ||||||||
| Ga4 | Ga5 | Ga6 | |||||||||
| Use | Site | (Å) | Use | Site | (Å) | Use | Site | (Å) | |||
| ○ | Pt2 | 2.544 | 1 | ○ | Pt2 | 2.547 | 1 | ○ | Pt2 | 2.554 | 2 |
| ○ | Pt1 | 2.544 | 2 | ○ | Pt1 | 2.703 | 2 | Ga3 | 2.609 | 2 | |
| ○ | Ga3 | 2.888 | 2 | ○ | Pt2 | 2.703 | 1 | ○ | Ga2 | 2.888 | 4 |
| ○ | Ga1 | 2.908 | 2 | ○ | Ga2 | 2.908 | 2 | ○ | Ce | 3.121 | 2 |
| ○ | Ga5 | 2.908 | 1 | ○ | Ga4 | 2.908 | 1 | ○ | Ga5 | 3.696 | 2 |
| ○ | Ce | 3.137 | 2 | ○ | Ga1 | 2.93 | 2 | ○ | Ga4 | 3.977 | 2 |
| ○ | Ga4 | 3.785 | 1 | ○ | Ga5 | 2.93 | 1 | ||||
| ○ | Ga1 | 3.911 | 2 | ○ | Ga3 | 3.696 | 2 | ||||
| ○ | Ga5 | 3.911 | 1 | ○ | Ga6 | 3.696 | 1 | ||||
| ○ | Ga6 | 3.977 | 1 | ○ | Ga2 | 3.911 | 2 | ||||
| ○ | Ga4 | 3.911 | 1 |
| Ce | Pt | Ga | |||||||||
|---|---|---|---|---|---|---|---|---|---|---|---|
| Path | Atom | (Å) | Path | Atom | (Å) | Path | Atom | (Å) | |||
| Ga | 3.132 | 9 | Ga | 2.547 | 5 | Pt | 2.547 | 2 | |||
| Pt | 3.434 | 6 | Ga | 2.703 | 3 | Pt | 2.703 | 1.2 | |||
| Ce | 3.434 | 2 | Ga | 2.907 | 5.2 | ||||||
| Ce | 3.132 | 1.2 | |||||||||
| Ga | 3.726 | 1.2 | |||||||||
| Ga | 3.928 | 3.2 |
| Ce | ||||
|---|---|---|---|---|
| Path | Atom | (Å) | (Å2) | |
| Ga | 9 | 3.11(3) | 0.010(4) | |
| Pt | 6 | 3.43(1) | 0.010(2) | |
| Pt | ||||
| Path | Atom | (Å) | (Å2) | |
| Ga | 5 | 2.557(2) | 0.0043(3) | |
| Ga | 3 | 2.721(6) | 0.008(1) | |
| Ce | 2 | 3.43(1) | 0.010(2) | |
| Ga | ||||
| Path | Atom | (Å) | (Å2) | |
| Pt | 2 | 2.557(2) | 0.0043(3) | |
| Pt | 1.2 | 2.721(6) | 0.008(1) | |
| Ga | 5.2 | 2.868(5) | 0.0120(4) | |
| Ce | 1.2 | 3.11(3) | 0.010(2) | |
| Ga | 1.2 | 3.70(2) | 0.005(2) | |
| Ga | 3.2 | 3.91(1) | 0.009(1) |
Disclaimer/Publisher’s Note: The statements, opinions and data contained in all publications are solely those of the individual author(s) and contributor(s) and not of MDPI and/or the editor(s). MDPI and/or the editor(s) disclaim responsibility for any injury to people or property resulting from any ideas, methods, instructions or products referred to in the content. |
© 2025 by the authors. Licensee MDPI, Basel, Switzerland. This article is an open access article distributed under the terms and conditions of the Creative Commons Attribution (CC BY) license (https://creativecommons.org/licenses/by/4.0/).
Share and Cite
Matsumoto, Y.; Watabe, Y.; Iesari, F.; Osumi, M.; Ota, K.; Haga, Y.; Hatada, K.; Okajima, T. Local Structure Analysis of Heavy Fermion Ce2Pt6Ga15 with a Honeycomb Structure Using Extended X-Ray Absorption Fine Structure. Metals 2025, 15, 436. https://doi.org/10.3390/met15040436
Matsumoto Y, Watabe Y, Iesari F, Osumi M, Ota K, Haga Y, Hatada K, Okajima T. Local Structure Analysis of Heavy Fermion Ce2Pt6Ga15 with a Honeycomb Structure Using Extended X-Ray Absorption Fine Structure. Metals. 2025; 15(4):436. https://doi.org/10.3390/met15040436
Chicago/Turabian StyleMatsumoto, Yuji, Yuki Watabe, Fabio Iesari, Masakatsu Osumi, Kyugo Ota, Yoshinori Haga, Keisuke Hatada, and Toshihiro Okajima. 2025. "Local Structure Analysis of Heavy Fermion Ce2Pt6Ga15 with a Honeycomb Structure Using Extended X-Ray Absorption Fine Structure" Metals 15, no. 4: 436. https://doi.org/10.3390/met15040436
APA StyleMatsumoto, Y., Watabe, Y., Iesari, F., Osumi, M., Ota, K., Haga, Y., Hatada, K., & Okajima, T. (2025). Local Structure Analysis of Heavy Fermion Ce2Pt6Ga15 with a Honeycomb Structure Using Extended X-Ray Absorption Fine Structure. Metals, 15(4), 436. https://doi.org/10.3390/met15040436