1. Introduction
Determining the fracture mechanics parameters is a key segment in the assessment and enhancement of the safety and longevity of materials and structures, especially when they are exposed to extreme load conditions in the presence of damage. In this research, one group of such structures considered is thin-walled pipelines, which are used in practically all the process industry branches. Since the standard procedures prescribed by ASTM and ISO standards are not the most relevant if one of the criteria is not met, which is the testing of materials in a plane strain state, it is necessary to develop a complete procedure for the determination of fracture mechanics parameters for thin-walled pipelines.
The integrity and reliability of pipelines are critical for the safe transport of fluids and gases in various industries. Standard fracture mechanics testing methods often fail to address the specific challenges posed by thin-walled pipelines. To overcome these limitations, recent research has explored non-standard procedures and specimen geometries for determining the fracture mechanics parameters. This introduction contains reviews of the key studies that have contributed to the development of such methods, while
Figure 1 contains some of the specimen geometries.
One significant approach in the pipeline design is the leak-before-break (LBB) concept, which is based on the fracture resistance curve obtained from various specimens. Koo et al. introduced the compact pipe (CP) geometry for fracture toughness testing, demonstrating that
Q-stress values from these specimens were more representative of real-world conditions. By controlling the length of welded levers, different stress conditions could be simulated [
4].
Mahajan et al. conducted numerical calculations on CP specimens to study the impact of parameters such as wall thickness and crack type. Their results highlighted the utility of the CP specimens in providing insights into the fracture mechanics of pipeline materials under different stress conditions [
1]. Another attempt to define a method for evaluating the fracture behavior of thin-walled pipes involved the creation of curved CT specimens, as proposed by Gajdos and Sperl [
3]. They tested two types of specimens, curved CT specimens and flattened CT specimens (cut from pipes and then plastically deformed), achieving circumferential loading crucial for axial damage simulation. Bergant et al. developed geometries similar to standard fracture mechanics specimens made from two segments of thin-walled pipe, including SENB (single edge notched bending), CT (compact tension), and MT (middle crack tension) geometries. Their research included experimental determination of resistance curves and geometric factors like
ηpl, showing these geometries are suitable for fracture mechanics testing and pipeline integrity assessment [
2].
Rais et al. developed the pin loading tension (PLT) test for assessing the behavior of cracks in thin-walled pipe materials, particularly 9Cr ODS steel pipes [
5]. They used the finite element calculations to determine geometric functions and elastic and plastic components of the
J-integral, highlighting the methodology’s potential for irradiated materials testing. They also calculated the
ηpl factor using different methods, including the separation parameter method, to ensure the accuracy of their result. Sanyal et al. focused on predicting
J-R curves of thin-walled fuel pin specimens, which are essential for evaluating the integrity of nuclear fuel cladding. Their research provided critical insights into the fracture mechanics of these specialized materials under operational conditions. They also calculated the
ηpl factor to better understand the plastic zone development at the crack tip [
6]. Some specimen geometries have been developed specifically to address the influence of the environment. In the study [
7], Boot et al. dealt with pipeline steels in a hydrogen gas (H
2) environment, proposing a miniature hollow pipe-like tensile specimen.
Rodolfo and Vanderely compared four geometries with varying thicknesses to evaluate the suitability of ring-type specimens for determining stress intensity factors in plastic materials. Their research confirmed the suitability of ring-shaped specimens for fracture mechanics examination, despite some limitations due to elastic energy storage during testing [
8].
Matvienko and Gubeljak developed a ring-shaped specimen with a sharp notch subjected to bending, known as PRNB (pipe ring notched bending). Their research, based on experimental and numerical analysis, showed comparable fracture toughness for PRNB, CT, and SENB specimens, suggesting the viability of ring-shaped specimens for pipeline material testing [
9,
10].
The studies of Musrati et al. involved experimental and micromechanical model analysis of crack growth in PRNB specimens, considering different notch dimensions and shapes. Their results indicated that specimen dimensions and initial crack sizes did not significantly impact crack growth curves, assuming a constant width-to-thickness ratio [
11].
Further research by Damjanović et al. examined the influence of residual stresses, which are often a result of manufacturing processes, on the fracture behavior of PRNB specimens. Their study concluded that residual stresses had a negligible effect on the fracture behavior of PRNB specimens. Recent studies have also explored the impact of twisting on fracture behavior, with numerical models indicating significant torsional effects on PRNB specimen fracture behavior [
12,
13].
Figure 1 contains examples of non-standard specimens from the literature mentioned previously in this section. Stress concentrator (pre-crack or sharp notch) in some of these specimens is positioned in the circumferential direction, while the other geometries have axially positioned stress concentrators, like in this study.
The development of new methodologies for determining the fracture mechanics parameters includes the use of elastic–plastic fracture mechanics. This approach considers the plastic deformation that occurs at the crack tip, providing a more accurate representation of the fracture process in ductile materials, which are typically used for pipelines (a possible exception is exploitation at low temperatures). Elastic–plastic fracture mechanics involves parameters such as the J-integral, which quantifies the energy release rate, and the crack tip opening displacement (CTOD). These parameters are critical for understanding the fracture behavior of materials that exhibit significant plastic deformation before failure.
Research on the behavior of pipeline materials in the hoop direction highlights the importance of developing specific methodologies for evaluating mechanical properties based on previous experience [
14]. Travica et al. developed a procedure for determining the stress–strain behavior of pipe ring tensile specimens (PRTSs) in the hoop direction using the digital image correlation (DIC) method. The aim of this study was to investigate the influence of specimen geometry, infill percentage, and printing method on 3D-printed polymer material behavior, utilizing a specially designed tool with D-blocks. The results demonstrated that the DIC method is effective in mapping complete strain fields in PRTS, enabling reliable characterization of pipeline mechanical properties. Experiments revealed that specimens with 90% and 100% infill exhibit similar mechanical properties, whereas specimens with 60% infill show more pronounced differences in behavior. Those differences are reflected in stress–strain curves and cross-sectional dimensions after fracture, indicating that specimens with higher infill percentages provide more consistent and reliable results. In addition to testing the polymer pipes, there are also proposals for specimen geometry for examination of polymer pipe butt joints; two of them are presented in [
15].
To further advance methodologies for evaluating the fracture mechanics parameters, Trajković et al. [
16] proposed a new specimen geometry called a pipe ring notched tension (PRNT) specimen, designed for assessing the fracture resistance of thin-walled pipelines. The PRNT specimens were fabricated using the selective laser sintering (SLS) method, and the testing involved applying internal pressure simulated by a specially designed tool with D-blocks. Experimental results showed that PRNT specimens allow precise measurement of parameters, such as crack mouth opening displacement (CMOD), crack tip opening displacement (CTOD), and the
J-integral, while the DIC method enabled the evaluation of force-CMOD and force-CTOD curves [
17].
Numerical analysis, utilizing the domain integral technique, enabled the determination of
J-integral values along the crack front. A comparison between PRNT and SENT (single edge notch tension) specimens revealed an asymmetric distribution of the
J-integral for PRNT specimens due to their cylindrical geometry, whereas SENT specimens showed a symmetric distribution. These findings emphasize the importance of considering specimen geometry when determining fracture mechanics parameters [
16]. More details about the numerical analysis of fracture mechanics problems, based on the finite element method, are shown in [
18,
19].
Building on previous studies, new contributions arise from the research of Trajković et al., where the geometry of PRNT specimens with sharp notches or cracks was developed. The aim of this research was to define a methodology for testing the fracture resistance of pipeline materials using non-standard specimens fabricated by selective laser sintering (SLS) from PA12 polyamide. Experimental investigations included monitoring deformations using the DIC method and employing a specially designed tool for loading specimens in the hoop direction. The results indicated that PRNT specimens provide reliable data on the fracture resistance of materials and enable the determination of parameters such as the stress intensity factor (
KI) and the
J-integral [
16].
By comparing the PRNT and SENT specimens, it was observed that specimen geometry and loading conditions caused differences in the force-CMOD curves, but similar trends were identified when considering the influence of crack length. A key advantage of PRNT specimens is their suitability for application on specimens cut directly from pipelines, ensuring a more direct correlation with operational conditions [
16,
17].
The PRNT specimen represents advancement over conventional fracture mechanics testing methods, as it enables the testing of thin-walled pipes without the need for standard specimens that require substantial material thickness, ensuring greater relevance of the results to real operating conditions. An additional advantage of PRNT specimens is their ability to be directly extracted from in-service pipelines used in the oil, gas, and chemical industries, eliminating the need for additional flattening of specimens, which often introduces residual stresses and can affect the accuracy of testing results. This methodology allows for more reliable assessments of pipeline integrity under actual operating conditions, contributing to the precise determination of fracture mechanics parameters and enhancing the safety of industrial pressure systems.
Moreover, this method is particularly suitable for evaluating the axial crack propagation in pipelines, which can result from external mechanical damage, such as third-party interference, corrosion-induced defects, or pressure fluctuations in operational environments. It can be used for the selection of material for a new pipeline, along with other mechanical tests, or for determining the degradation level of a pipe withdrawn from exploitation. In comparison with some other non-standard methodologies, the PRNT specimen does not require a complex fabrication and/or testing procedure.
The focus in this paper is on a recently proposed ring-shaped specimen (PRNT) with a sharp stress concentrator and testing its fracture mechanics properties using both experimental and numerical methods. The methodology aimed to address the advantages and limitations of existing procedures, particularly for the thin-walled pipelines. The new specimen and testing procedure are expected to provide more accurate and reliable data for assessing pipeline material fracture resistance, enhancing the safety and integrity of industrial pipeline systems.
2. Materials and Methods
The materials used in this study were P235TR1 and P235GH steels, which are commonly applied in the manufacturing of pipelines. These materials were selected not only for their widespread usage in pipeline systems but also because specimens can be directly obtained from pipelines in service. Their mechanical properties make them suitable for a wide range of industrial applications, including the transport of liquids and gases under varying pressure conditions. It should be noted that tests on all specimen geometries are performed on P235TR1 pipe specimens (seam pipes), while results for P235GH pipe specimens (seamless) are given only to illustrate the difference of tensile properties.
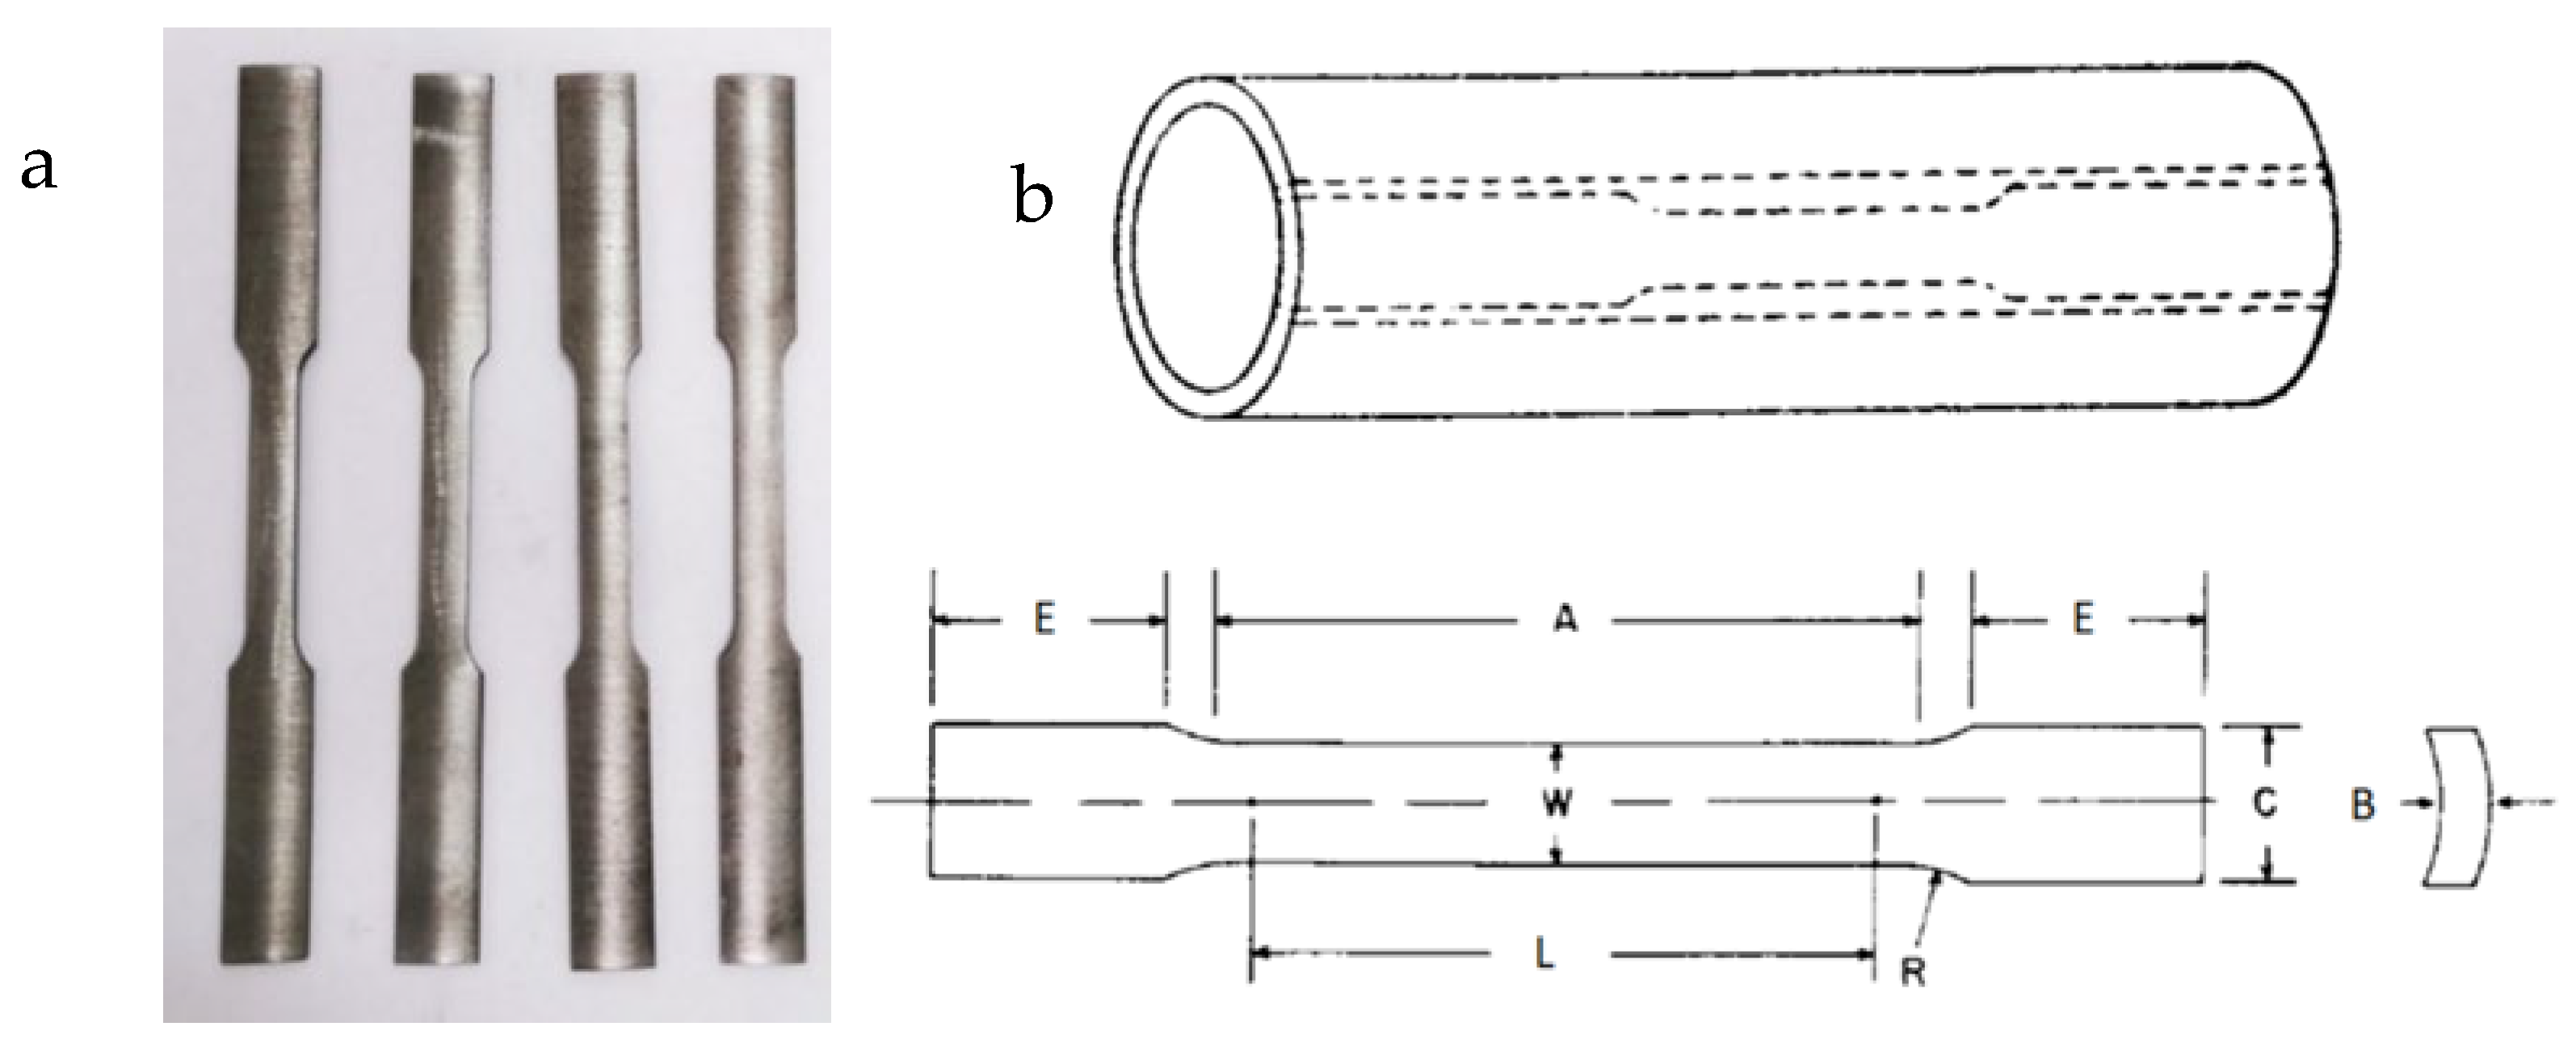
The first group of specimens consisted of standard tensile specimens prepared according to ASTM E8/E8M [
20]. Two specimens were tested for each material (P235TR1 and P235GH). The dimensions of the specimens are presented in
Table 1, with the corresponding geometry shown in
Figure 2.
To examine the fracture resistance of the pipeline material, three pipe ring notched tensile specimens (PRNTs) are made from P235TR1 steel by using the CNC laser cutting machine with a notch width of 0.35 mm. Dimensions of PRNT specimens are shown in
Table 2, with the geometry illustrated in
Figure 3. This specimen geometry has been proposed and applied in our previous studies [
16,
17], where the specimens were additively manufactured from polymer materials.
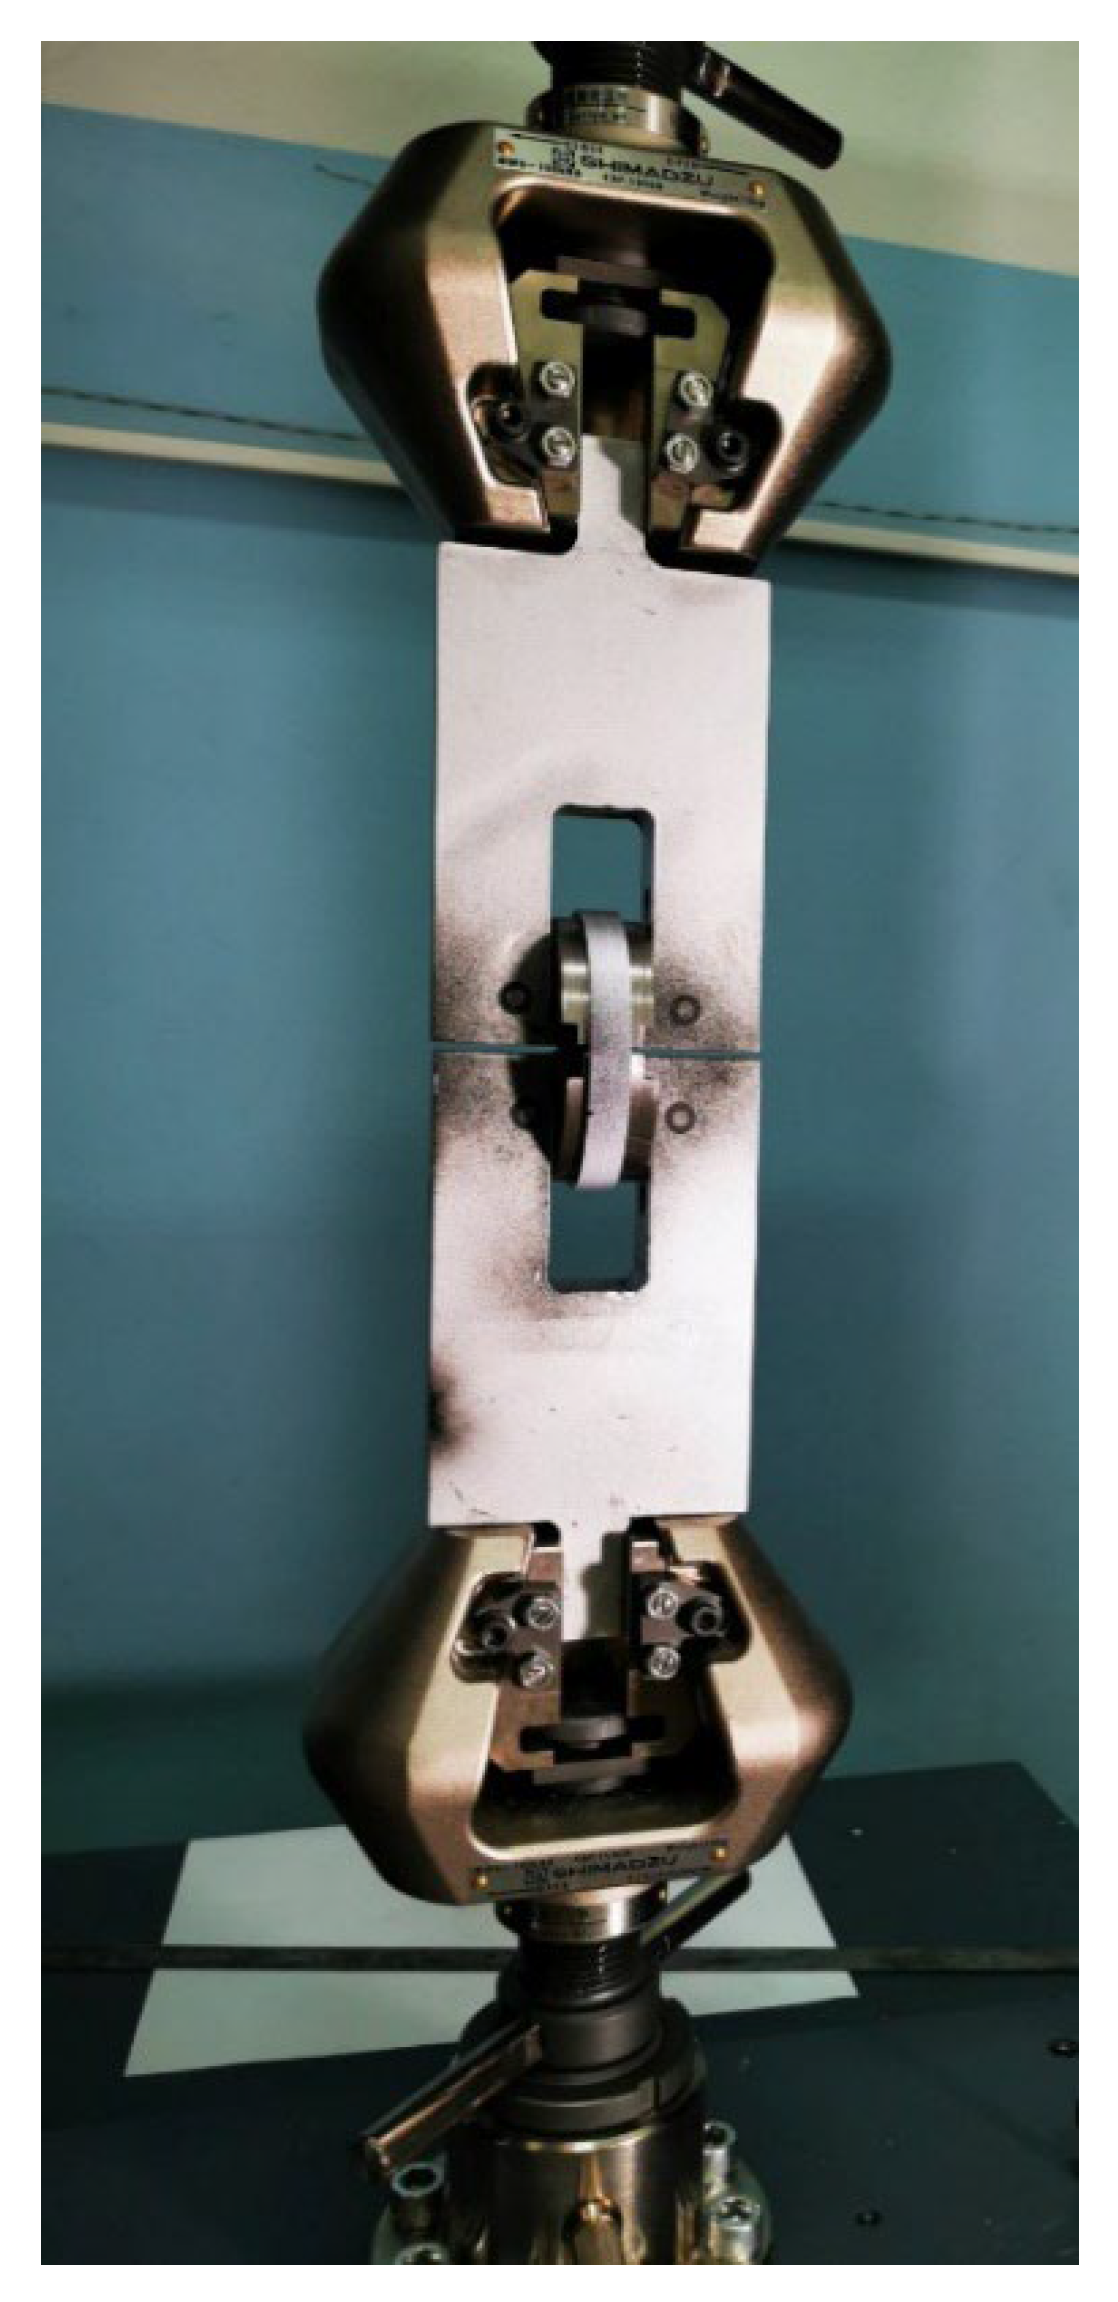
For the standard tensile testing, the Shimadzu AGS-X universal testing machine (Kyoto, Japan) with a maximum load capacity of 100 kN was employed, along with an Axial Extensometer (Model 3542, gauge length 50 mm); see
Figure 4. The tests were conducted at a loading speed of 1 mm/min, ensuring compliance with the relevant standard.
A specially designed and patented tool was used for testing the PRNT specimens. This tool ensures precise loading in the hoop direction and simulates internal pressure conditions (
Figure 5). For measuring displacements and calculating strains on the PRNT specimens with a sharp notch, the digital image correlation (DIC) method was used with a 3D stereometric system, Aramis 2M (GOM, Braunschweig, Germany) [
21,
22,
23]. This system proved to be highly reliable for measuring displacements and strains on pressure equipment and during standard testing procedures, as demonstrated in previous studies [
16,
17].
The dimensional tolerances between the supporting cylinder (D-block) and the PRNT specimen are minimal, within ±0.2 mm, ensuring sufficient clearance for the D-block to fit into the ring while maintaining a secure and repeatable testing setup. This clearance, along with other tolerances within the assembly, primarily affects the initial portion of the force–displacement curve, which appears as a plateau. This plateau represents the stabilization phase of the specimen within the fixture before the actual loading response is recorded.
Numerical analysis using Simulia Abaqus software v. 2018 (Dassault Systèmes, Paris, France) was used to calculate the
J-integral and to provide data for the force vs. CMOD (
F-CMOD) curves. The conducted analyses are based on the finite element models of half of the PRNT specimen and the D-block model (half-symmetry models). For the purposes of this analysis, the properties of the P235TR1 material obtained from experimental analysis of standard tensile specimens were used.
Table 3 shows the dimensions of the models; it can be seen that the crack length is varied.
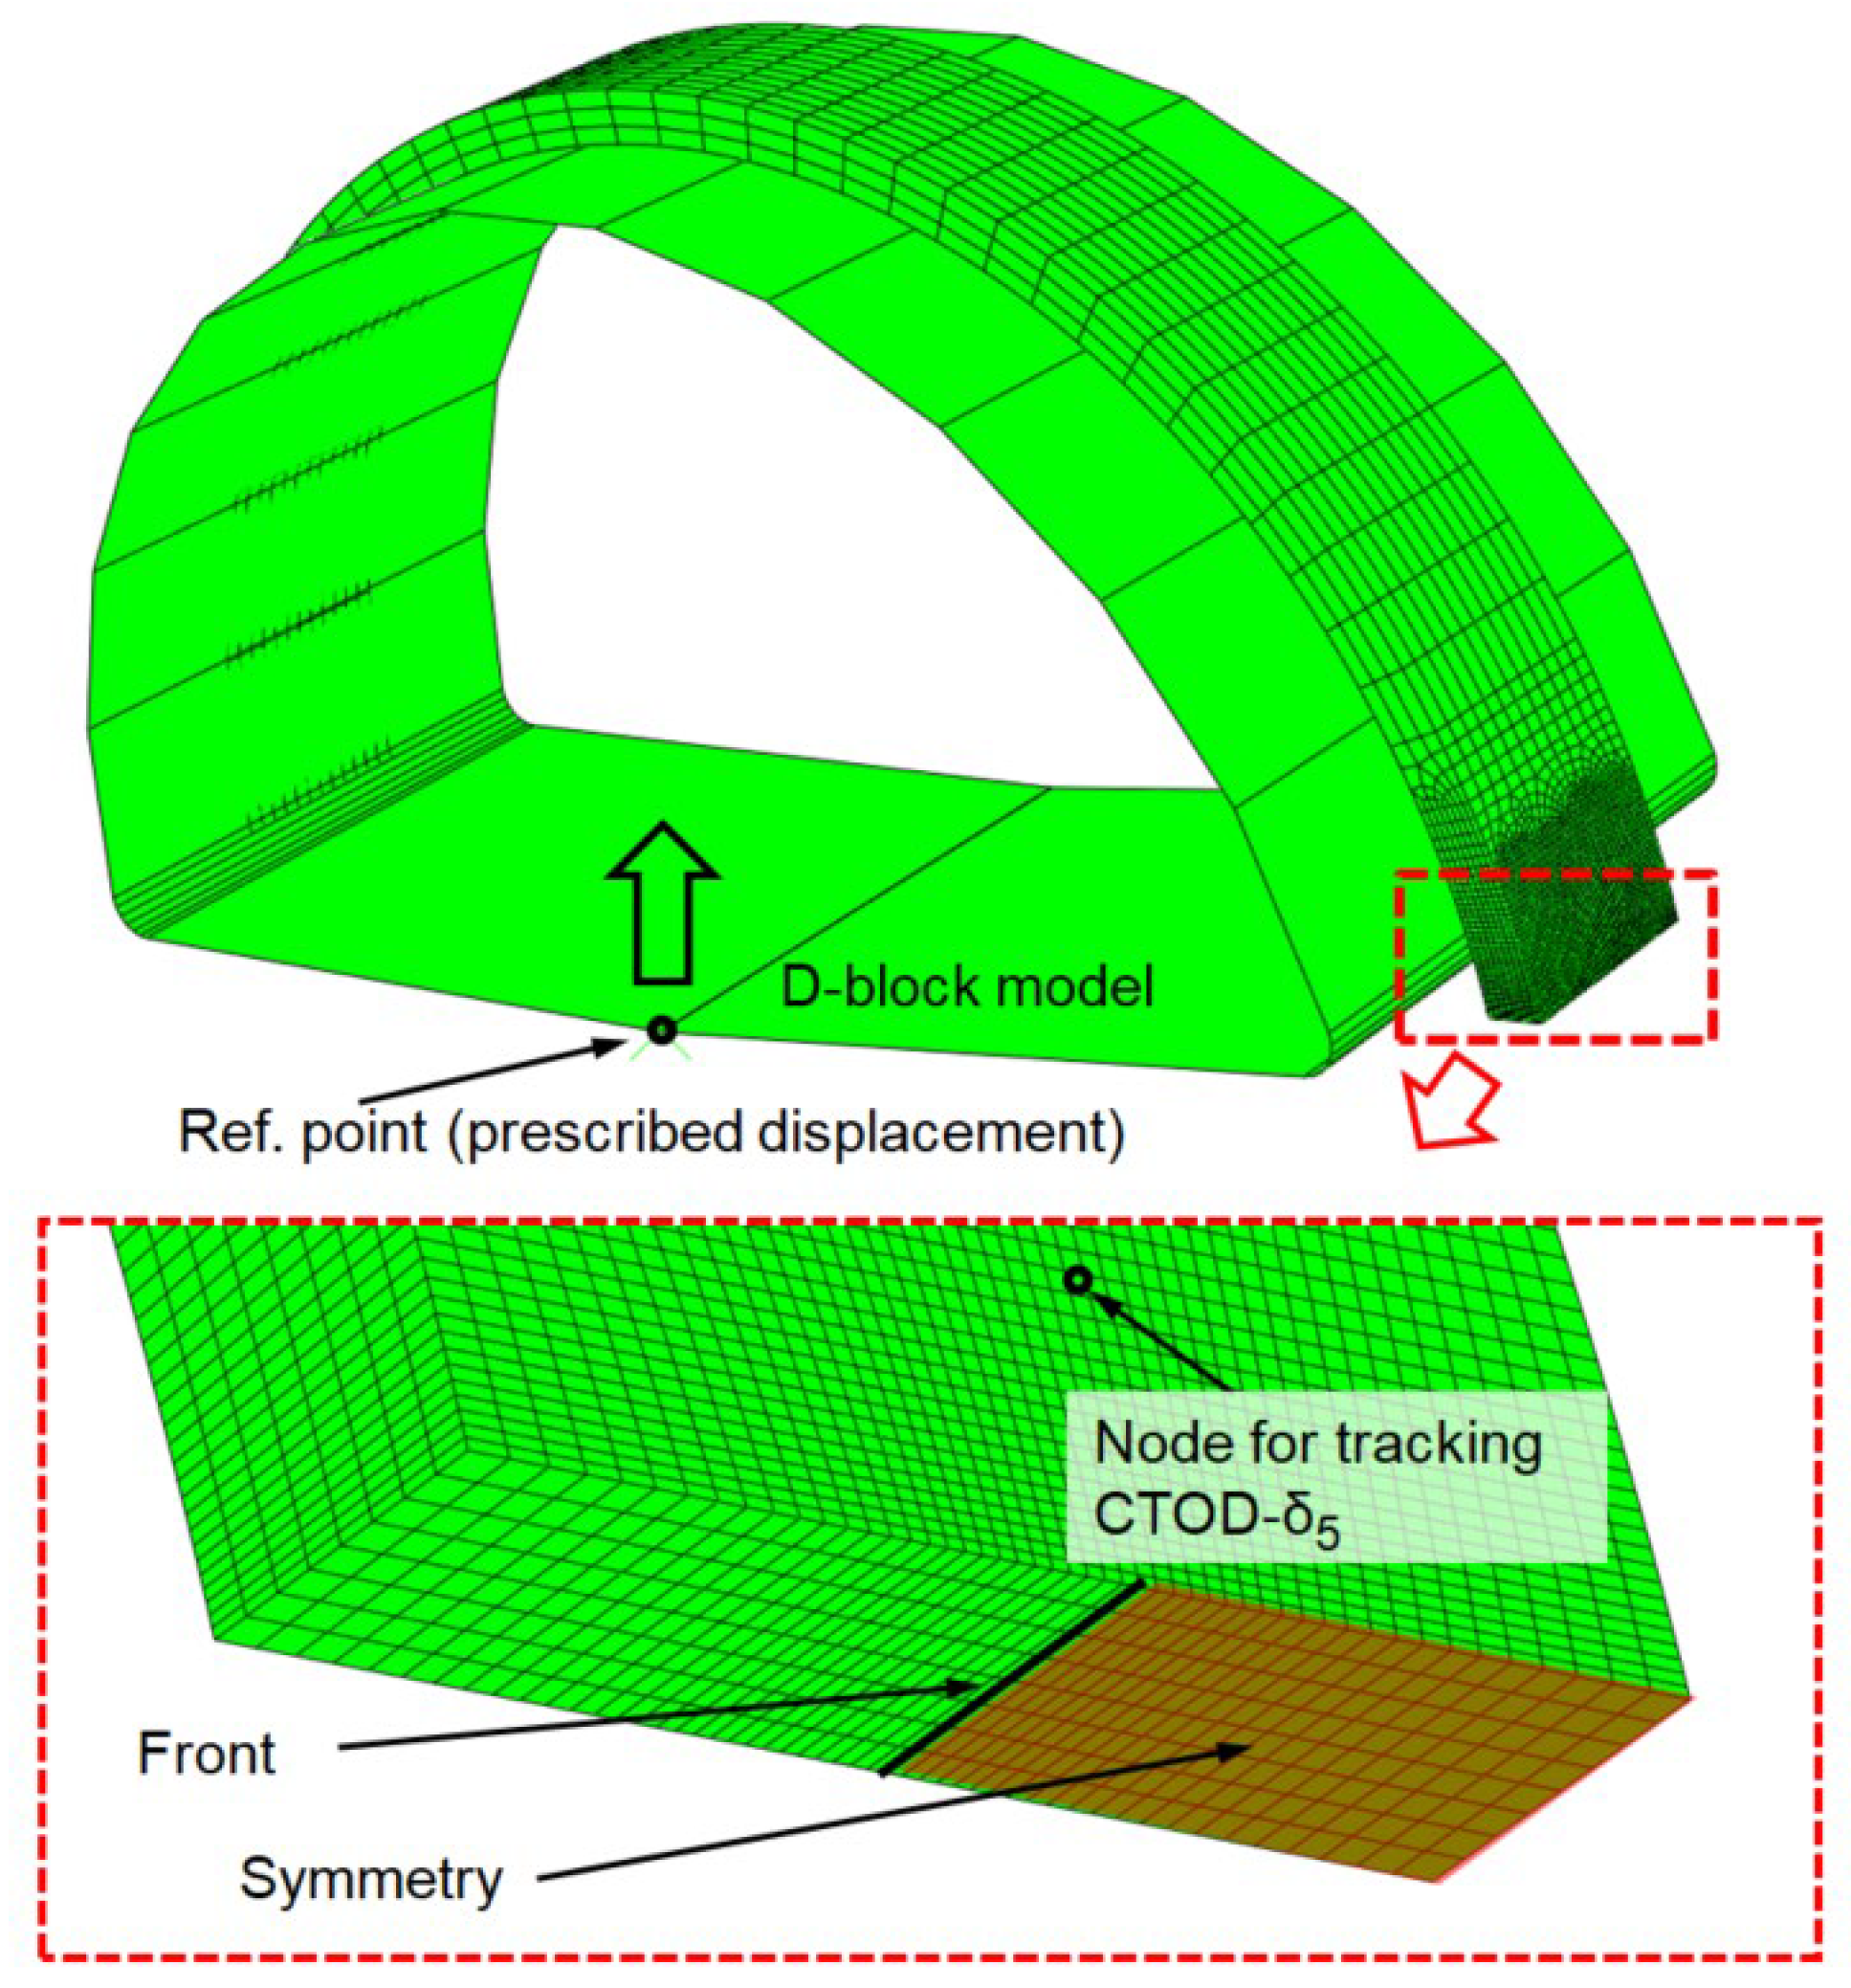
The test tool, or D-block, is modeled as a rigid body, while half of the PRNT test specimen is defined as an isotropic elastic–plastic component. The mesh is defined with quadratic (20 nodes) finite elements with reduced integration. In the zone of interest (around the crack), mesh is refined with elements of size 0.15 mm,
Figure 6.
To ensure the accuracy and reliability of the numerical results, a mesh convergence study was conducted. The study involved sequentially refining the mesh by using element sizes of 0.3 mm, 0.25 mm, 0.2 mm, and finally 0.15 mm. The J-integral values were compared at each refinement step, and the difference between the results obtained with 0.15 mm and 0.2 mm element sizes was found to be below 5%. Based on this, the element size of 0.15 mm around the crack was deemed appropriate, balancing computational efficiency and result accuracy.
For the model load to simulate the load applied during the experimental test, the displacement of the D-block in the Y direction (in the direction of the load) was set to 2 mm. Displacements in other directions are disabled. Based on the definition of the length of the crack, the symmetry conditions are also defined. On the cross-sectional surface of the PRNT model, symmetry is defined on those surfaces that do not belong to the initial length of the crack.
3. Results and Discussion
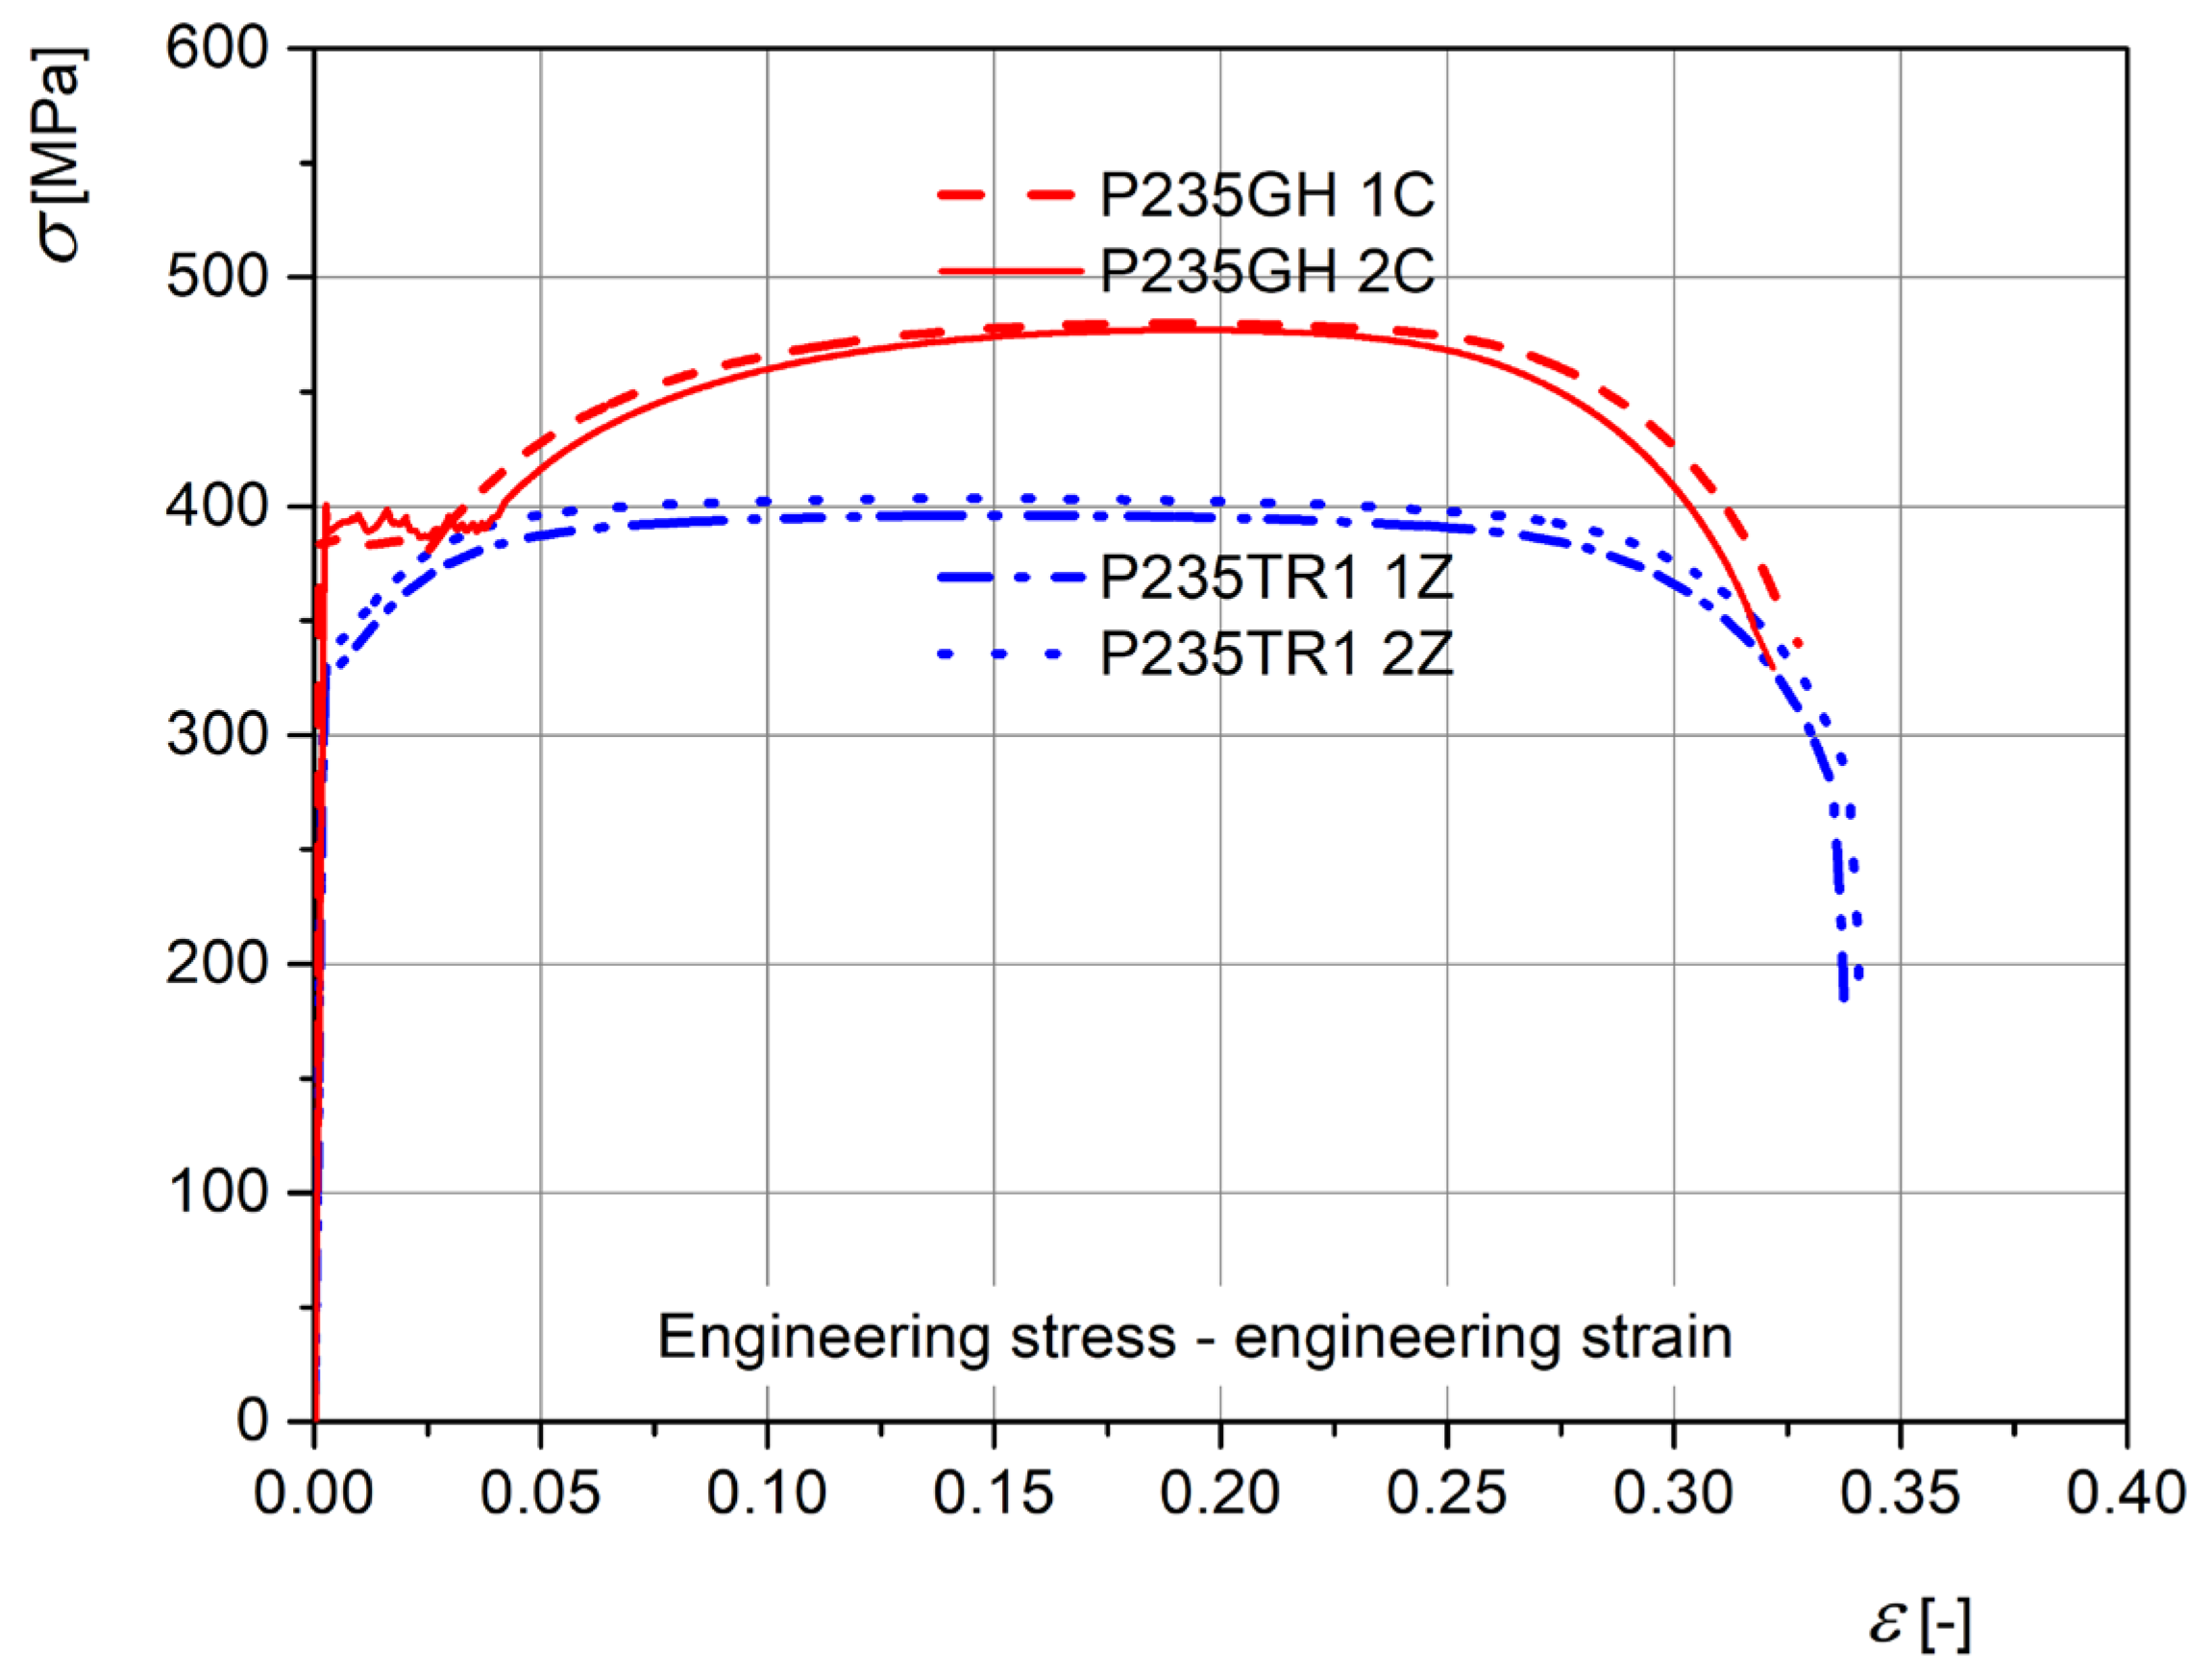
Tensile stress–strain curves are shown in
Figure 7 for the specimens made of seamless pipes (P235GH steel), which are shown for comparison purposes only, since they are not used in the analysis presented here, as well as for the seam pipes made of P235TR1 steel, which are used as the input data for the finite element calculations. Relevant yield strength (
Rp0.2) and tensile strength (
Rm) values are 330 MPa and 402 MPa, respectively. The modulus of elasticity is 180 GPa, and Poisson’s ratio is 0.3.
By testing the three PRNT specimens with an approximately same ratio of sharp notch length to specimen width, force–displacement curves were obtained and are shown in
Figure 8. The results indicate relatively good repeatability, and the diagrams are presented without modifications. The small force increments within the first 0.3 mm are a result of the stabilization of the PRNT specimen on the D-block of the testing tool (establishing the contact between the tool and the specimen). This phenomenon is observed in all three specimens and can be considered a consistent behavior for the tested geometry.
In the following figures, results obtained from numerical models of PRNT specimens with sharp notches are presented; material P235TR1 is considered.
Figure 9 shows the results of the dependence of the force on the plastic component of the crack mouth opening displacement (CMOD) for three models with different initial crack lengths. It is important to mention that this diagram corresponds to three
a0/
W ratios: 0.45, 0.5, and 0.55, just to present the general influence of this ratio on results. However, two more ratios were used for the calculation of
ηpl, which will be emphasized later.
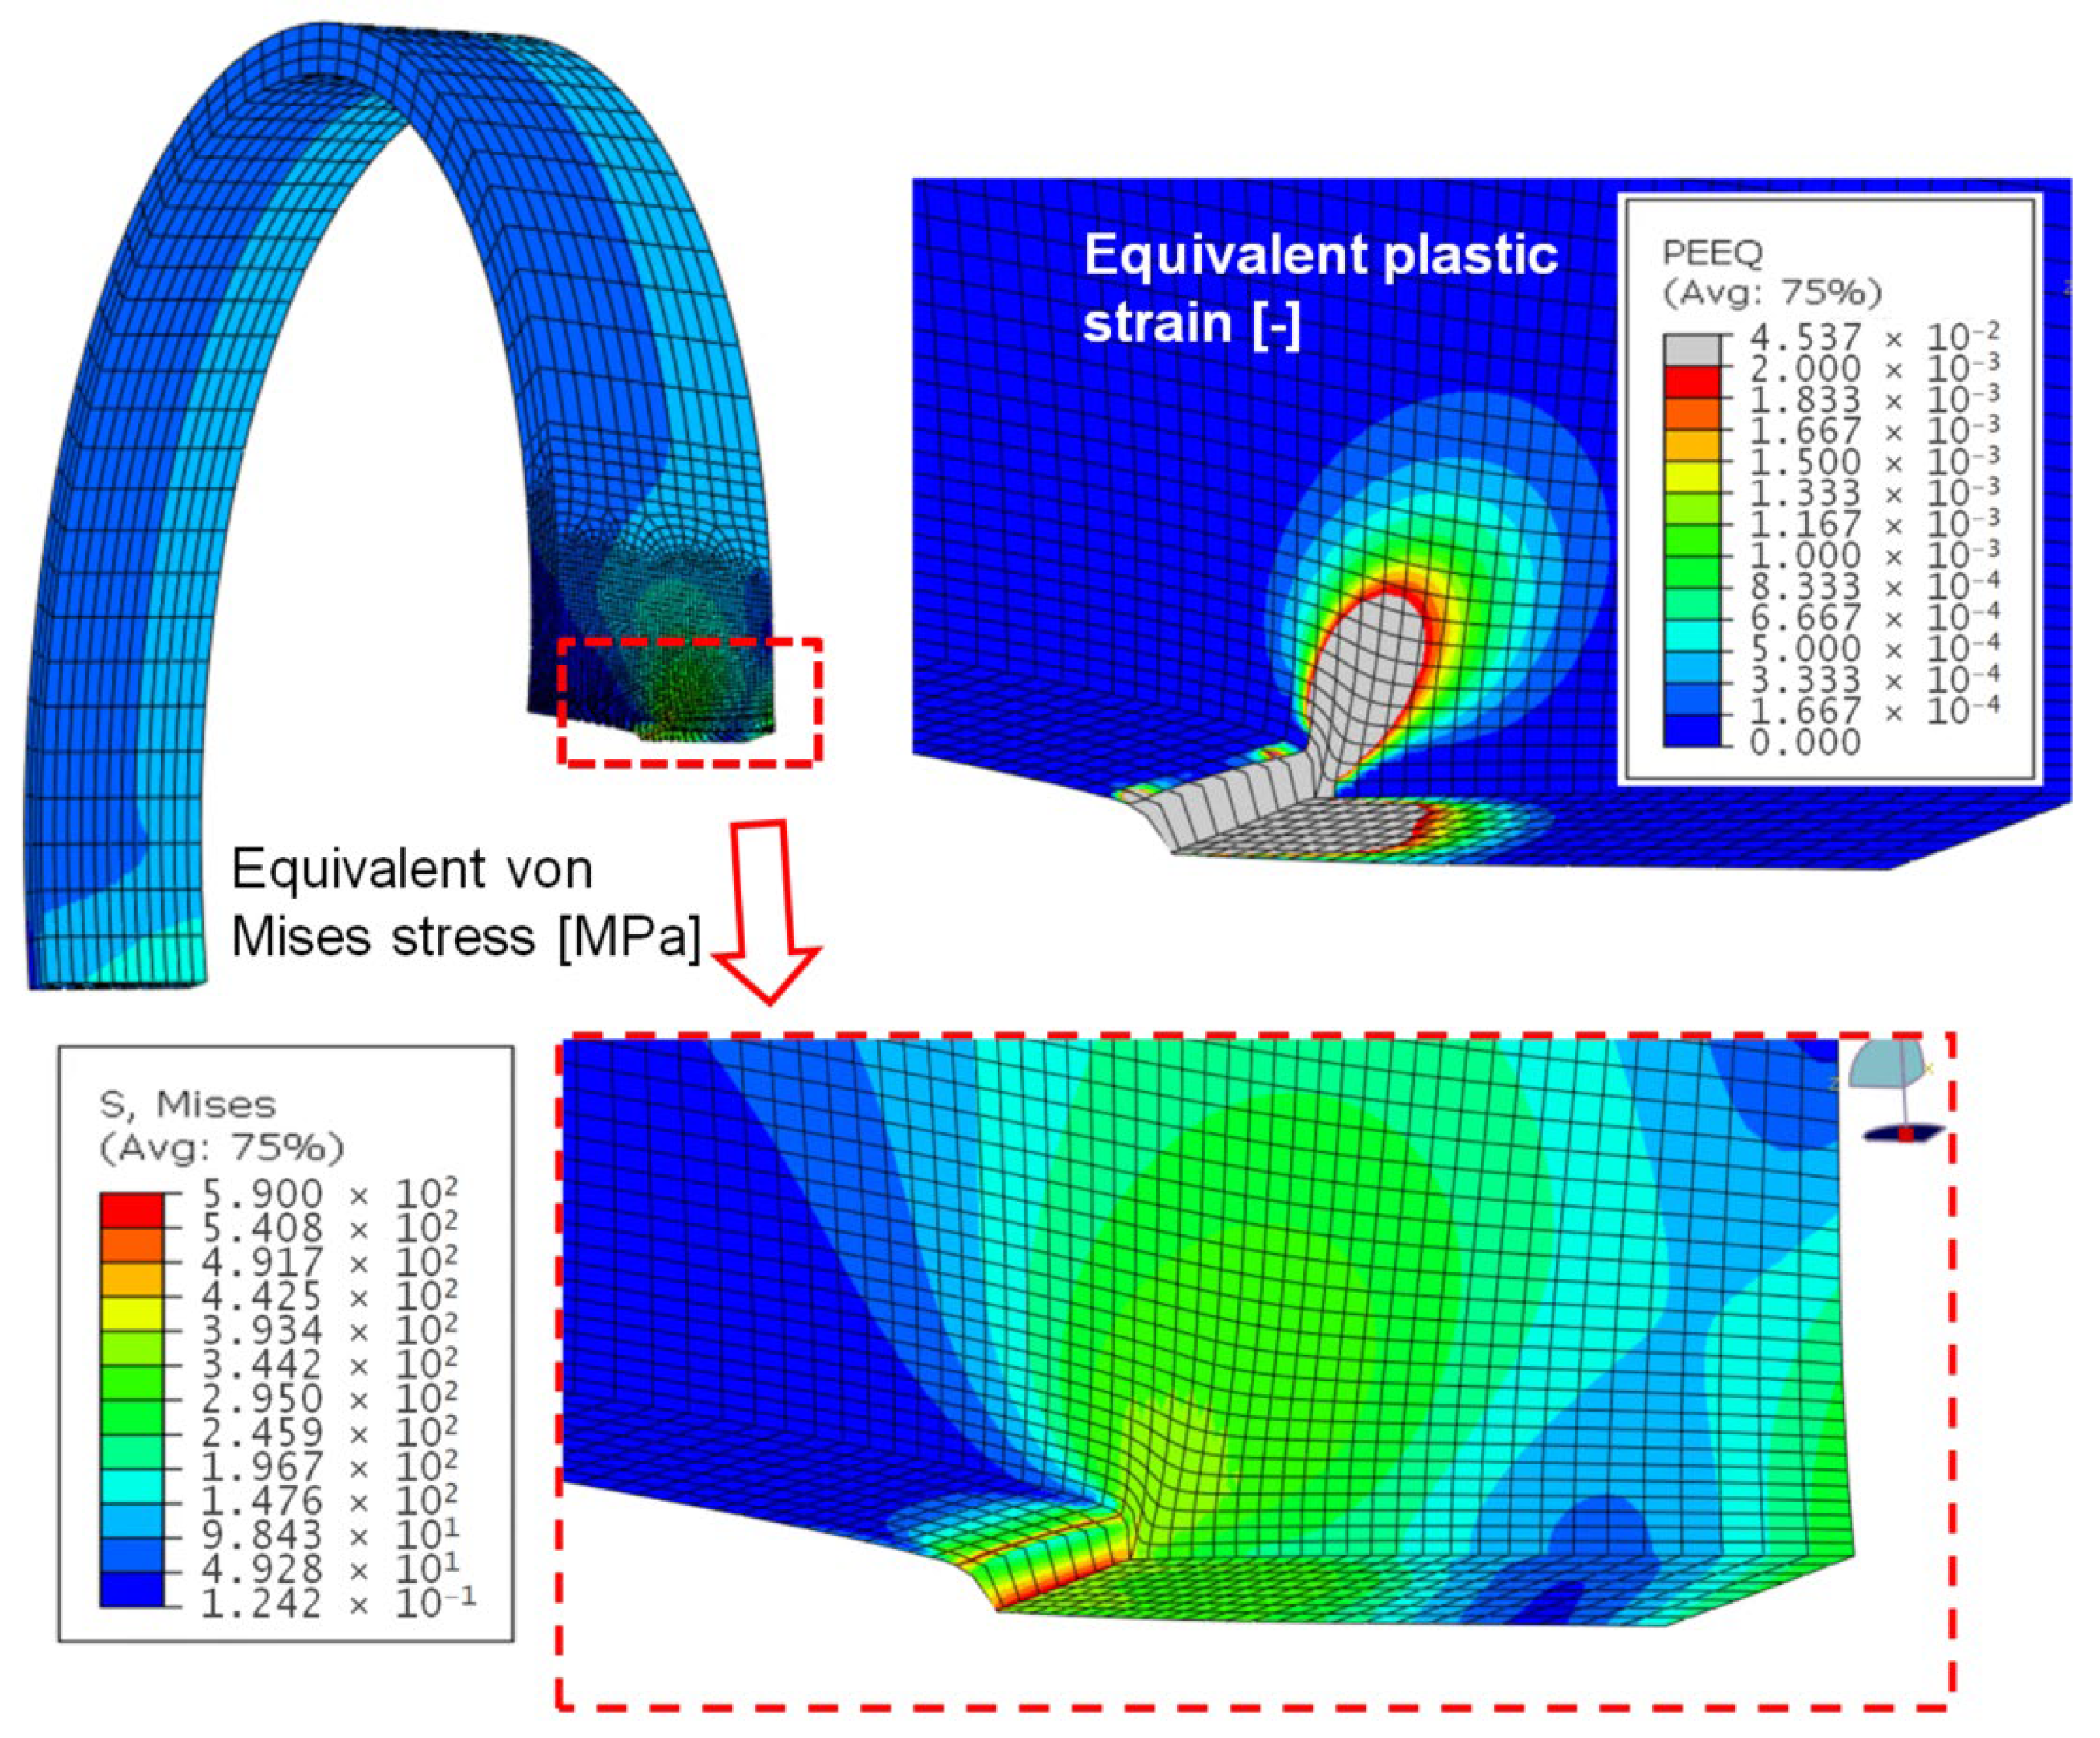
The distribution of the equivalent von Mises stress and equivalent plastic strain are shown in
Figure 10; the concentration of both quantities is very pronounced in the zone of the crack front, as expected.
The
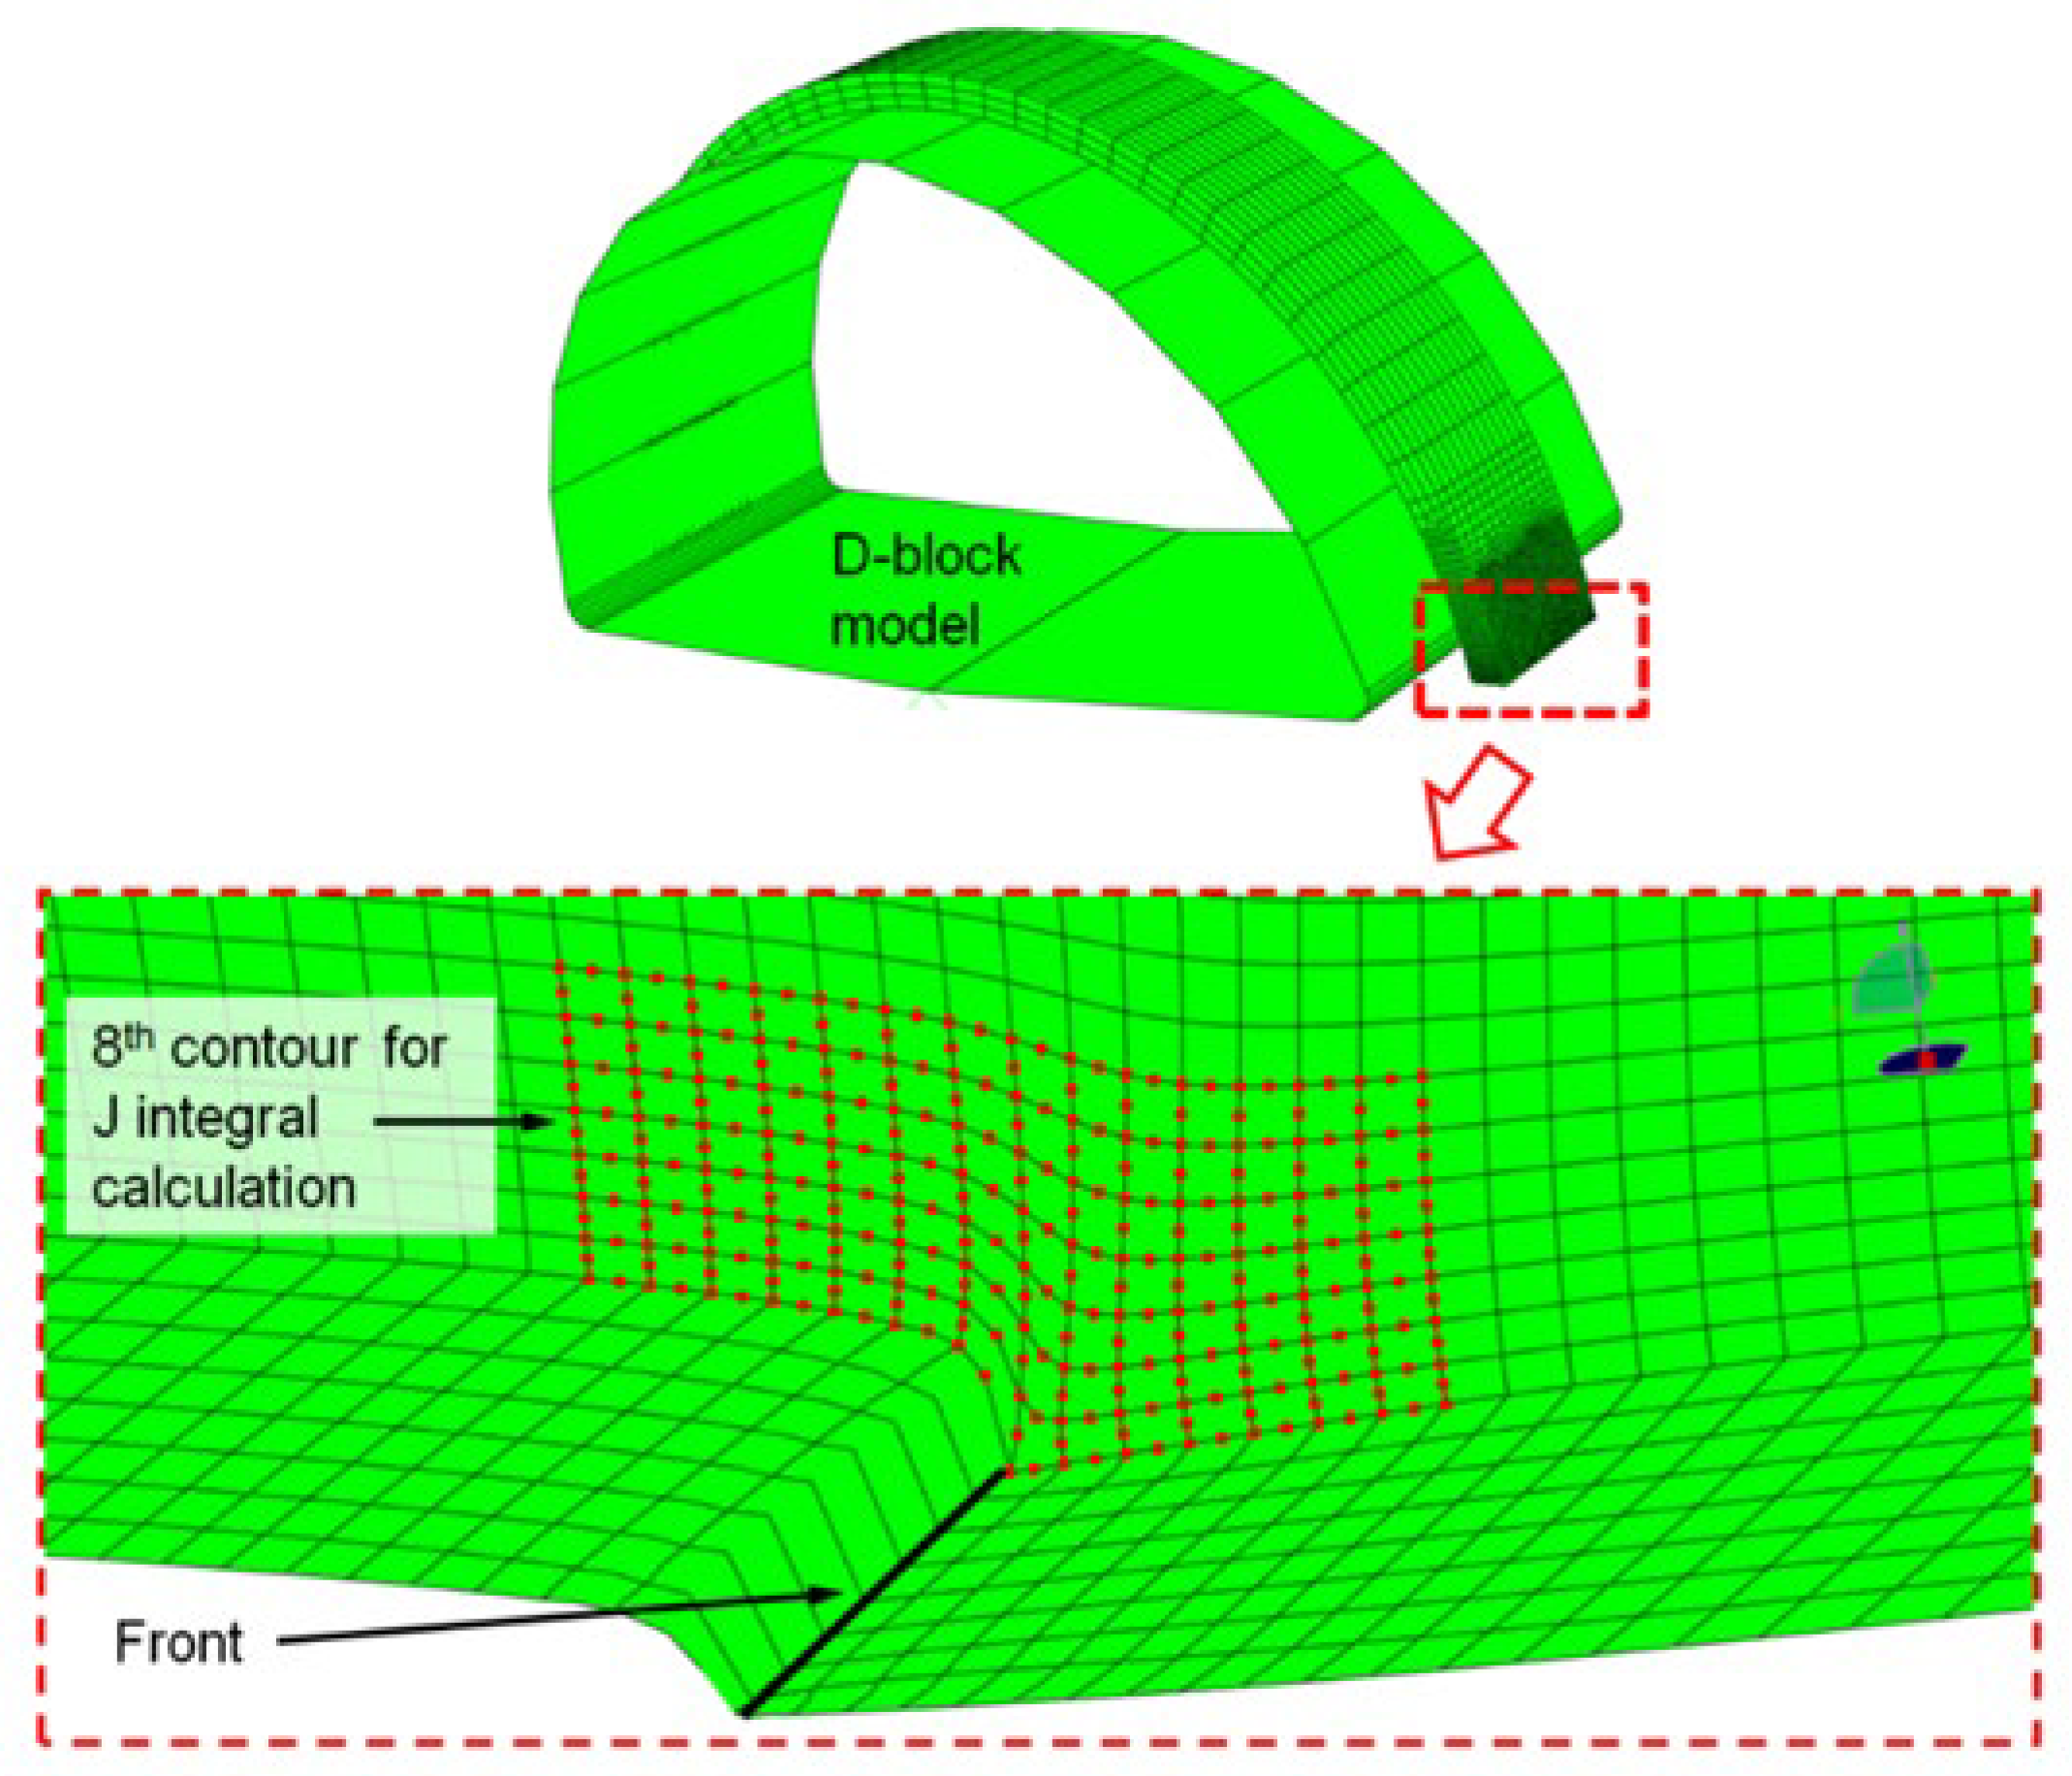
J-integral was extracted from the finite element models by application of the domain integral method in Simulia Abaqus.
Figure 11 shows the eighth contour, which was applied in the analysis as sufficient for obtaining convergent results, i.e., the
J-integral values. It is important to note that the figure contains only the contour on the surface of the specimen. However, the values of the
J-integral are determined from all contours, on the surface and inside the material along the entire crack front, and the maximum value is taken as appropriate. In all analyzed models, the
J-integral values were extracted from the third layer from the inner wall towards the outer surface, as this layer exhibited the highest
J-integral values across the entire crack front.
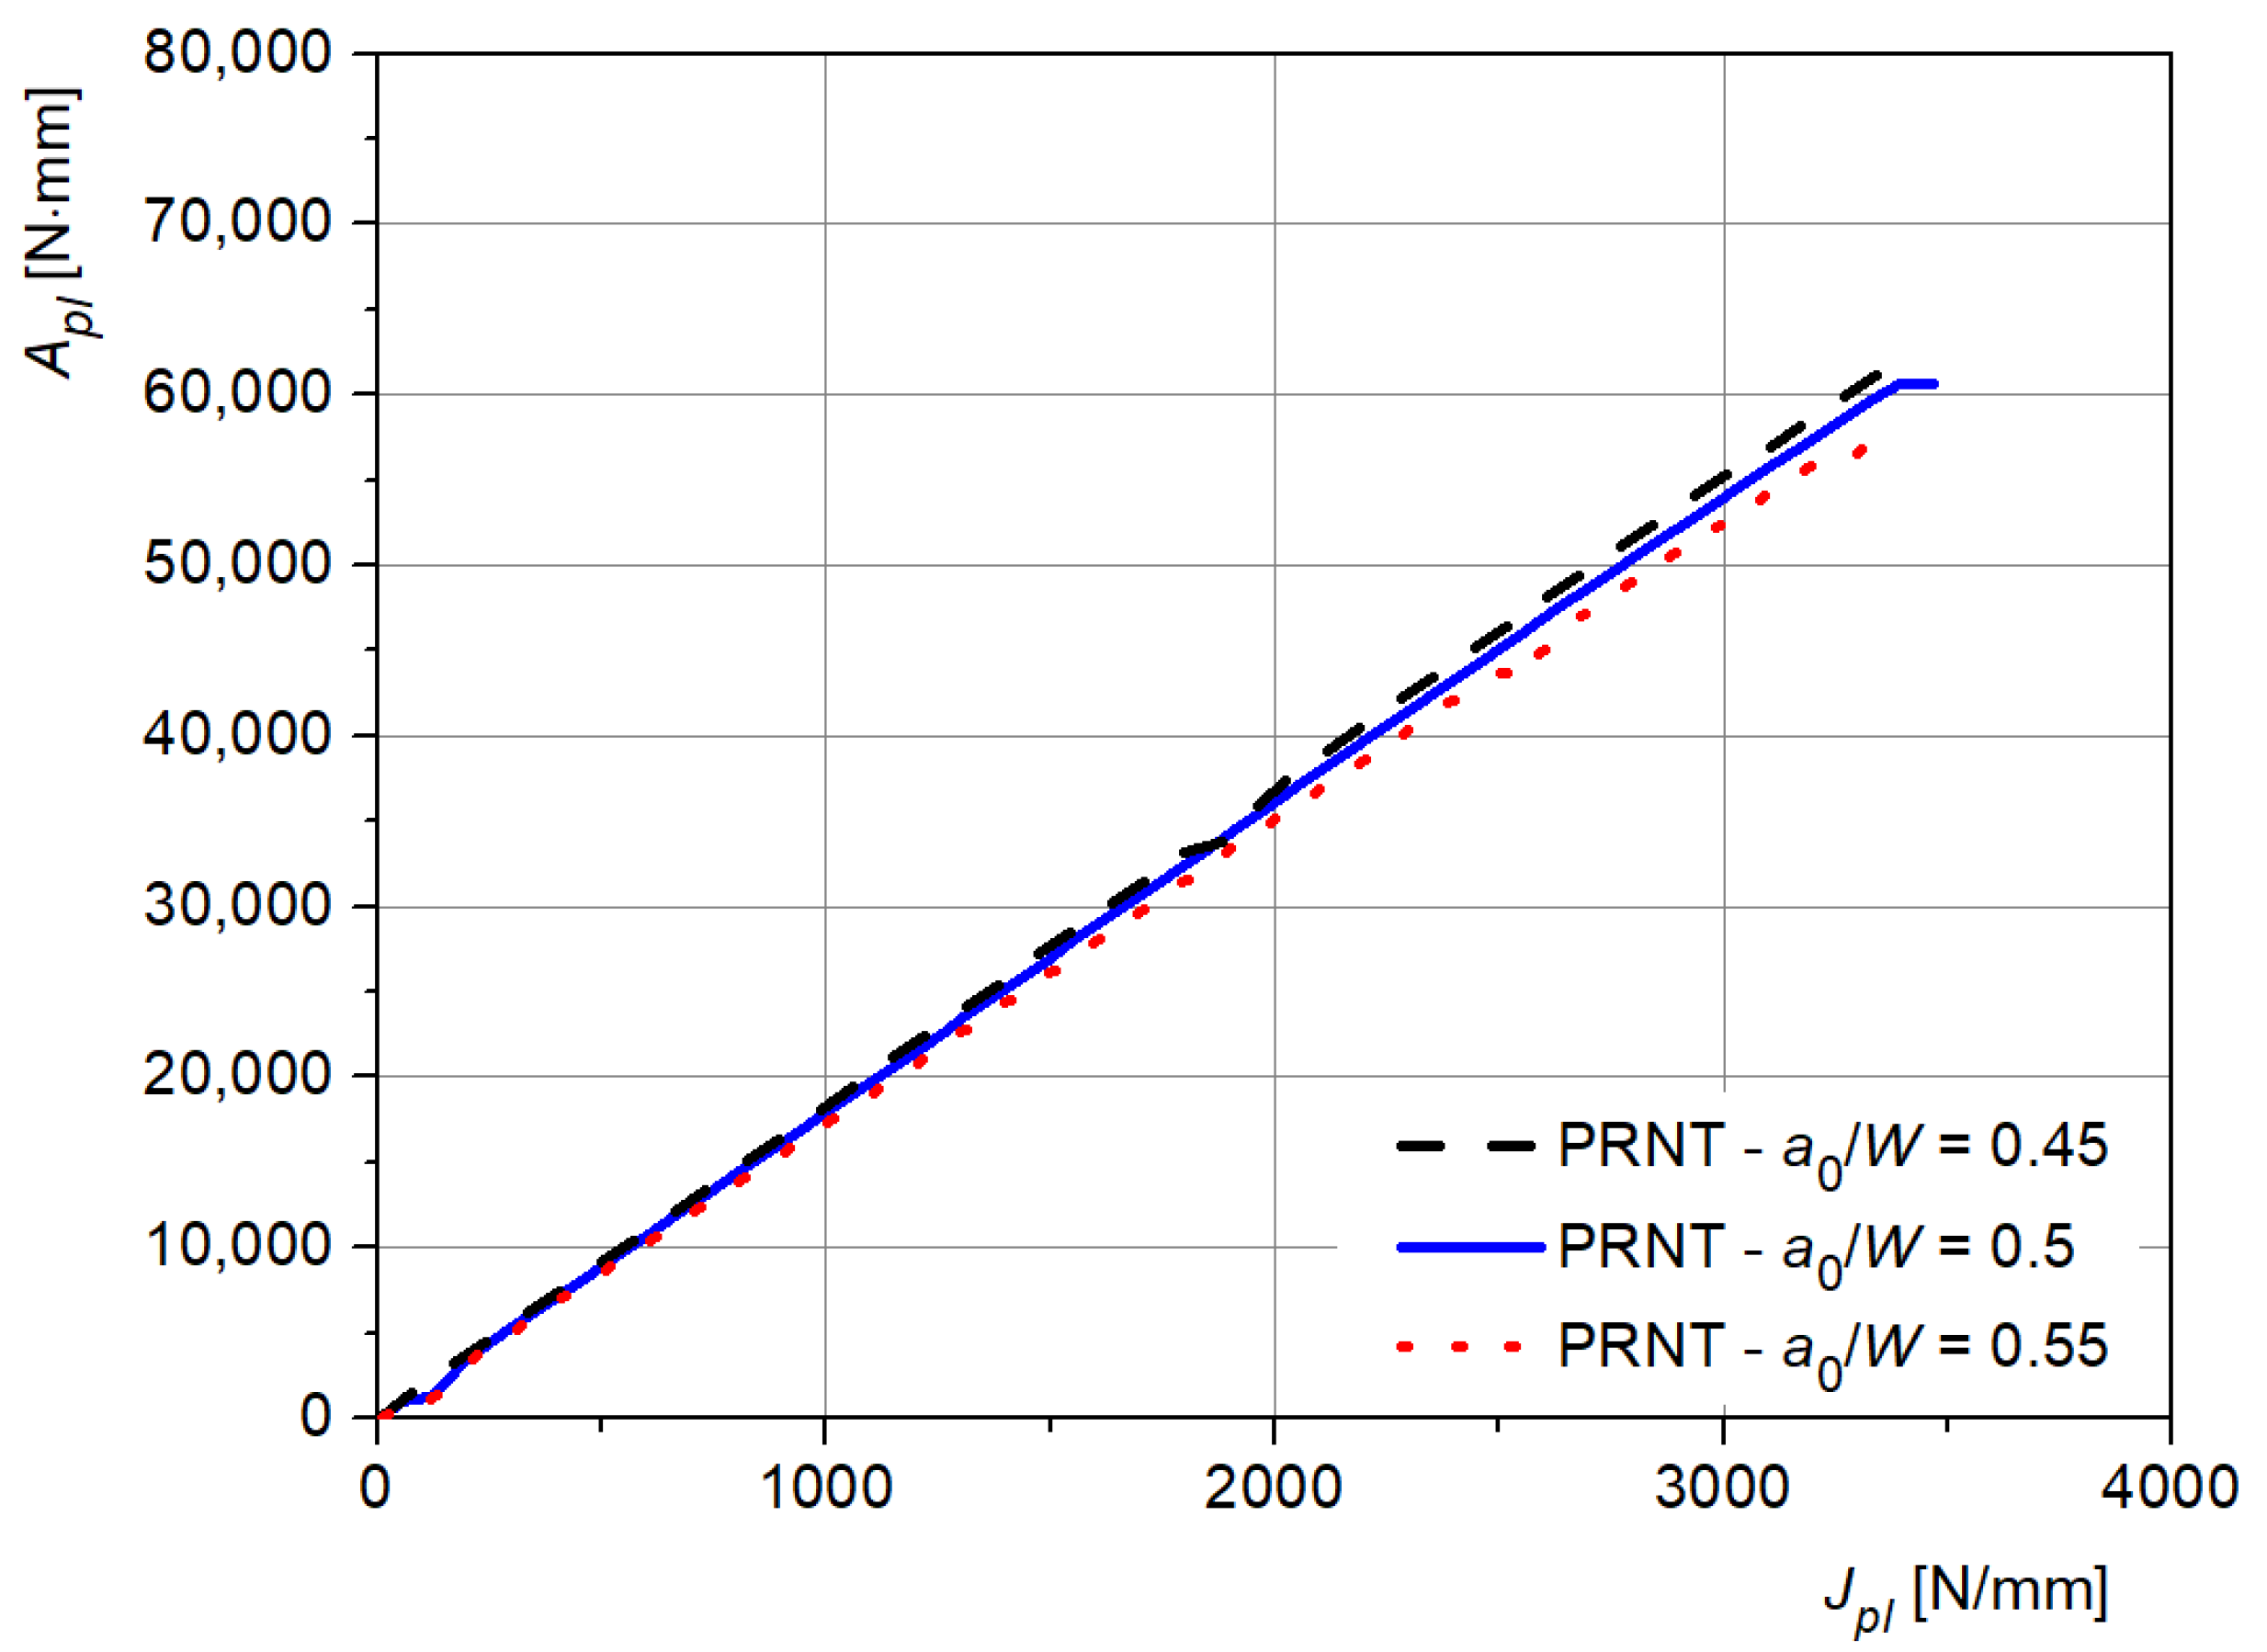
Next, the dependence of the surface area
Apl on the plastic component of the
J-integral is extracted from the series of models with different crack lengths,
Figure 12. The area
Apl is determined from the curve
F-CMOD
pl, i.e., from the dependence of force on the plastic component of the CMOD,
Figure 12.
The geometric coefficient
ηpl determination procedure is based on the well-known Equation (1).
where
b0 is initial length of the ligament,
ηpl is geometric coefficient,
Apl is area under the curve
F-CMOD
pl (
Figure 13), and
BN is reduced specimen thickness. In this case, it is equal to the specimen thickness
B; this value can be smaller than
B in case the side grooves are fabricated, which is sometimes performed for thick specimens.
This equation is typically used for the calculation of the plastic component of the
J-integral for standard specimen geometries, such as CT or SENB. For these specimens, the value of the geometric coefficient can be determined in accordance with standard procedures. However, this relation is used in a different manner here, Equation (2), to determine the coefficient
ηpl for the PRNT specimen with different crack lengths, based on the numerically determined values of
Jpl and
Apl.
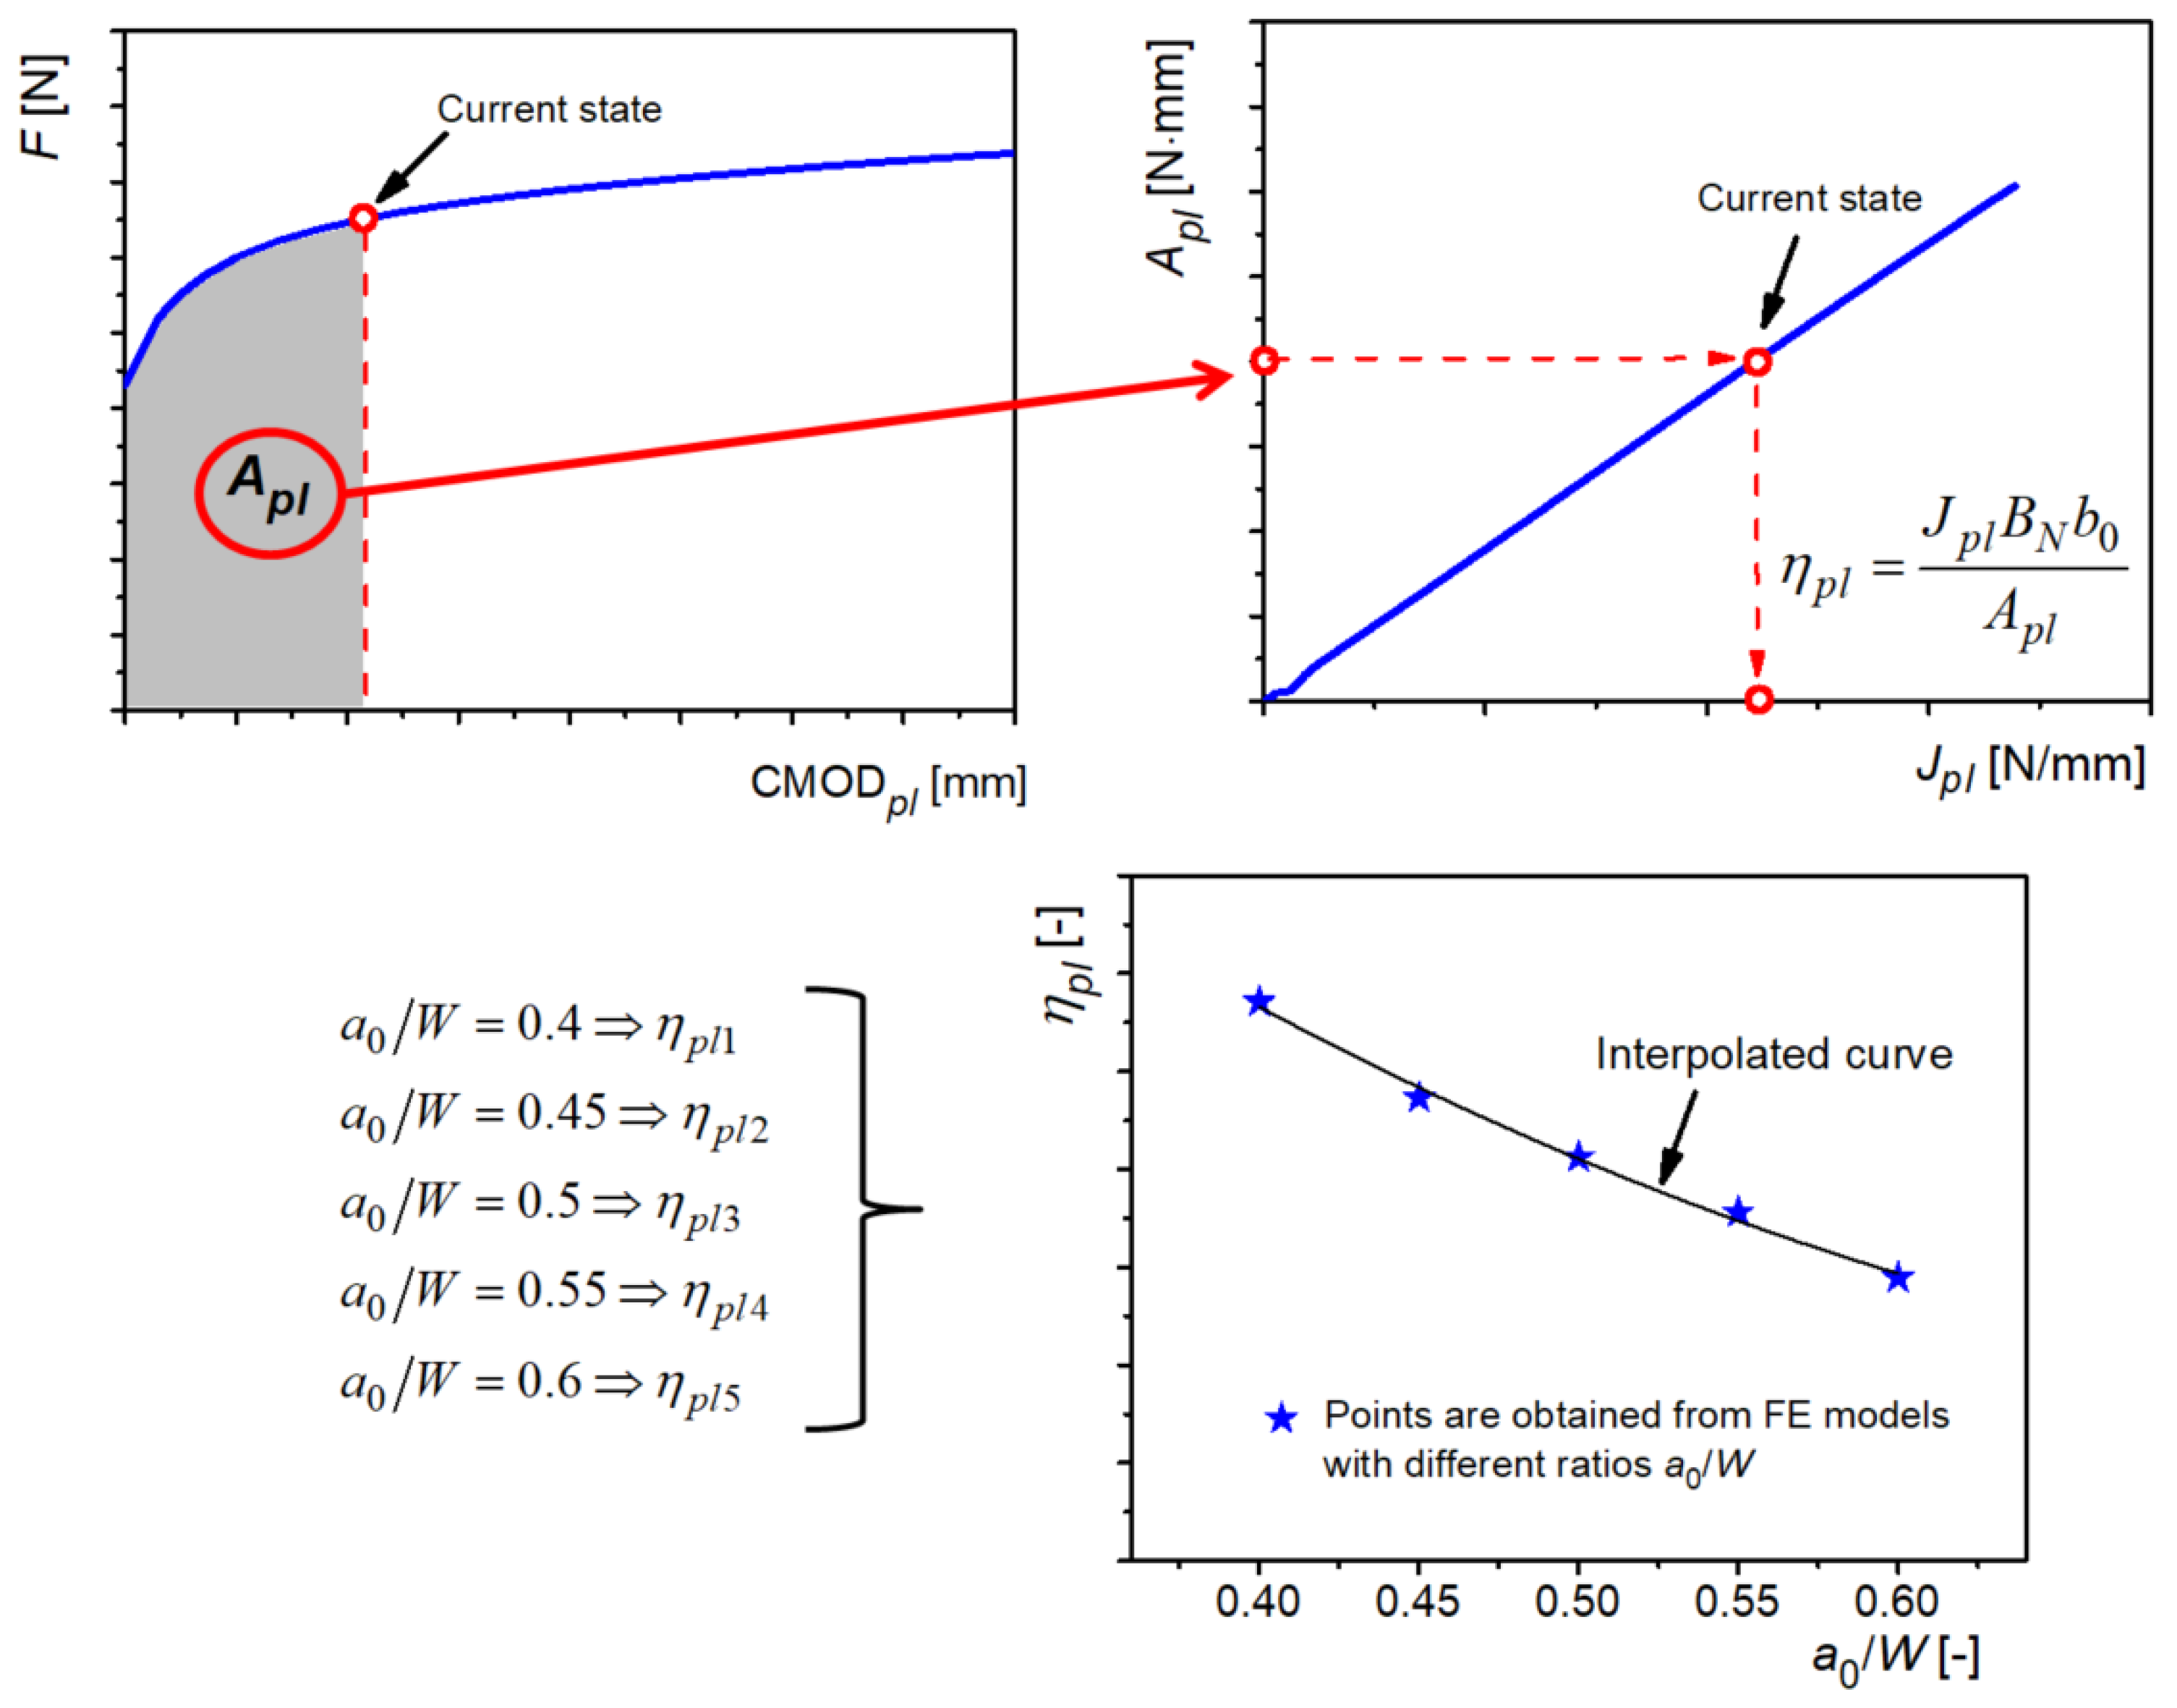
Figure 13 contains a general graphical overview of the applied procedure. The starting point is the diagram
F-CMOD
pl obtained from the numerical model of a PRNT specimen. For a selected point on this diagram, one can calculate the surface area
Apl, shaded in
Figure 13. In this way, dependence of this surface area on the plastic component of the
J-integral can be formed. From Equation (2), it can be seen that this diagram can be used to calculate
ηpl. Further, when the same procedure is repeated for different
a0/
W ratios, the dependence of
ηpl on
a0/
W is obtained. The points corresponding to each
a0/
W ratio are marked by symbols on the diagram, and finally a quadratic interpolation curve is fitted.
The values of the geometric coefficient
ηpl for all the five
a0/
W ratios used in this study, determined by the procedure illustrated in
Figure 13, are shown in
Table 4. One detail should be emphasized here: the values in the table are determined for a single value of the plastic component of the
J-integral (1300 N/mm). Varying this value (2000 and 3200 N/mm) gave almost no difference. This can be seen as a consequence of the linear shape of each line in
Figure 12; determination of the slope from the diagram gives almost identical results as
Table 4 (deviation is less than 1%). Essentially, this means that
ηpl can be considered as independent on the
J-integral value and therefore also independent on the loading level, which is very important for practical application.
According to the values of geometric factor
ηpl one can make the following relation with the ratio
a0/W:
which can be used to calculate the geometric factor
ηpl values in the range of ratios
a0/W (0.4 ÷ 0.6).
The obtained relationship between the geometric factor
ηpl and the ratio
a0/
W follows a predictable trend. Specifically, as the ratio
a0/
W increases, the value of
ηpl exhibits a decrease, which aligns with trends observed in some previous studies on fracture mechanics specimens. However, the values and trends in the literature (e.g., [
24,
25,
26,
27,
28]) are not the same, or even comparable among them, keeping in mind that the geometric factor strongly depends on the specimen geometry.
Future research will focus on determining the material fracture resistance curve through additional experimental investigations and numerical simulations, considering variations in specimen thickness, width, and diameter. In addition, it should be mentioned that the determination of parameters influencing the
J integral for non-standard geometries is very problematic to explicitly validate. There is a possibility to verify the numerical model itself by using some damage model (e.g., Gurson–Tvergaard–Needleman model GTN [
29,
30], or complete Gurson model CGM [
31]) for comparison to the experiment, which might be an interesting topic for future analyses.

