Article

A Finite Element Analysis Framework for Assessing the Structural Integrity of Aero-Engine Ceramic Matrix Composite Component Coatings

1
College of Science and Engineering, Nuclear Engineering, University of Derby, Markeaton Street Campus, Derby DE22 3AW, UK
2
Department of Industrial Engineering, University of Salerno, Via Giovanni Paolo II, 132, 80084 Fisciano, SA, Italy
*
Author to whom correspondence should be addressed.
Metals 2025, 15(3), 328; https://doi.org/10.3390/met15030328
Submission received: 31 January 2025 / Revised: 14 March 2025 / Accepted: 16 March 2025 / Published: 18 March 2025
(This article belongs to the Special Issue Surface Modification and Coatings of Metallic Materials)

Abstract

Ceramic Matrix Composites (CMCs), and, in particular, SiC/BN/SiC, are currently being investigated to replace Nickel alloys in the manufacturing of aero-engine high-pressure turbine system components. Although superior to traditional metallic solutions in terms of resistance to high temperatures, CMCs are prone to oxidation and environmental degradation. For this reason, a multi-layer coating system is used to protect the CMC substrate. The aim of this paper is to define a Finite Element (FE) thermo-mechanical procedure to assess the integrity of the multi-layer coating. Among the four main failure mechanisms, vertical transverse cracking (denoted as “mud cracking”) and the thermally grown oxide (TGO) formation were numerically investigated. The FE (Finite Elements) procedure described in this paper, fully automated with the auxilium of MATLAB and Abaqus, is holistic and offers a simplified tool for the preliminary lifing of coating systems. TGO growth in the bond layer leads to the failure of the coating after 15,200 h, when its thickness reaches 0.02 mm, circa 20% of the bond layer (BND), and the stiffness and the strength of the BND drop to zero. The procedures and outcomes from the work are relevant for aero-engine designers and system engineers.

1. Introduction

In recent years, SiC/BN/SiC Ceramic Matrix Composites (CMCs) have started to be used as replacements for Ni-based superalloys in commercial aero-engines for the design and manufacturing of high-pressure turbine seal segments, also called shrouds [1,2,3]. The seal segment controls the gap between the tip of the blade and the casing, and therefore has an influence on the turbomachinery performance and local temperature [4]. CMCs can work at higher temperatures than their metallic counterparts and they are lighter (approximately one third of the density of Nickel alloys). In addition, CMC components do not require internal cooling, adding further simplification and weight reduction to the air system. However, at temperatures higher than 1200 degrees Celsius, CMCs tend to embrittle in oxygen and/or water-rich environments [5]. They also tend to have defects (lack of slurry infiltration, porosity, debonding), making the material/strength properties subject to a higher scatter compared to their metallic counterparts [6,7]. CMC surfaces exposed to high temperatures therefore have to be protected by an environmental barrier coating (EBC) system. Several coating systems have been used through the years of development of CMC materials, from mullite and BSAS to Rare Earth silicates [4,8]. To date, multi-layer coatings have become the standard for CMCs in aero-engine applications, as described in [
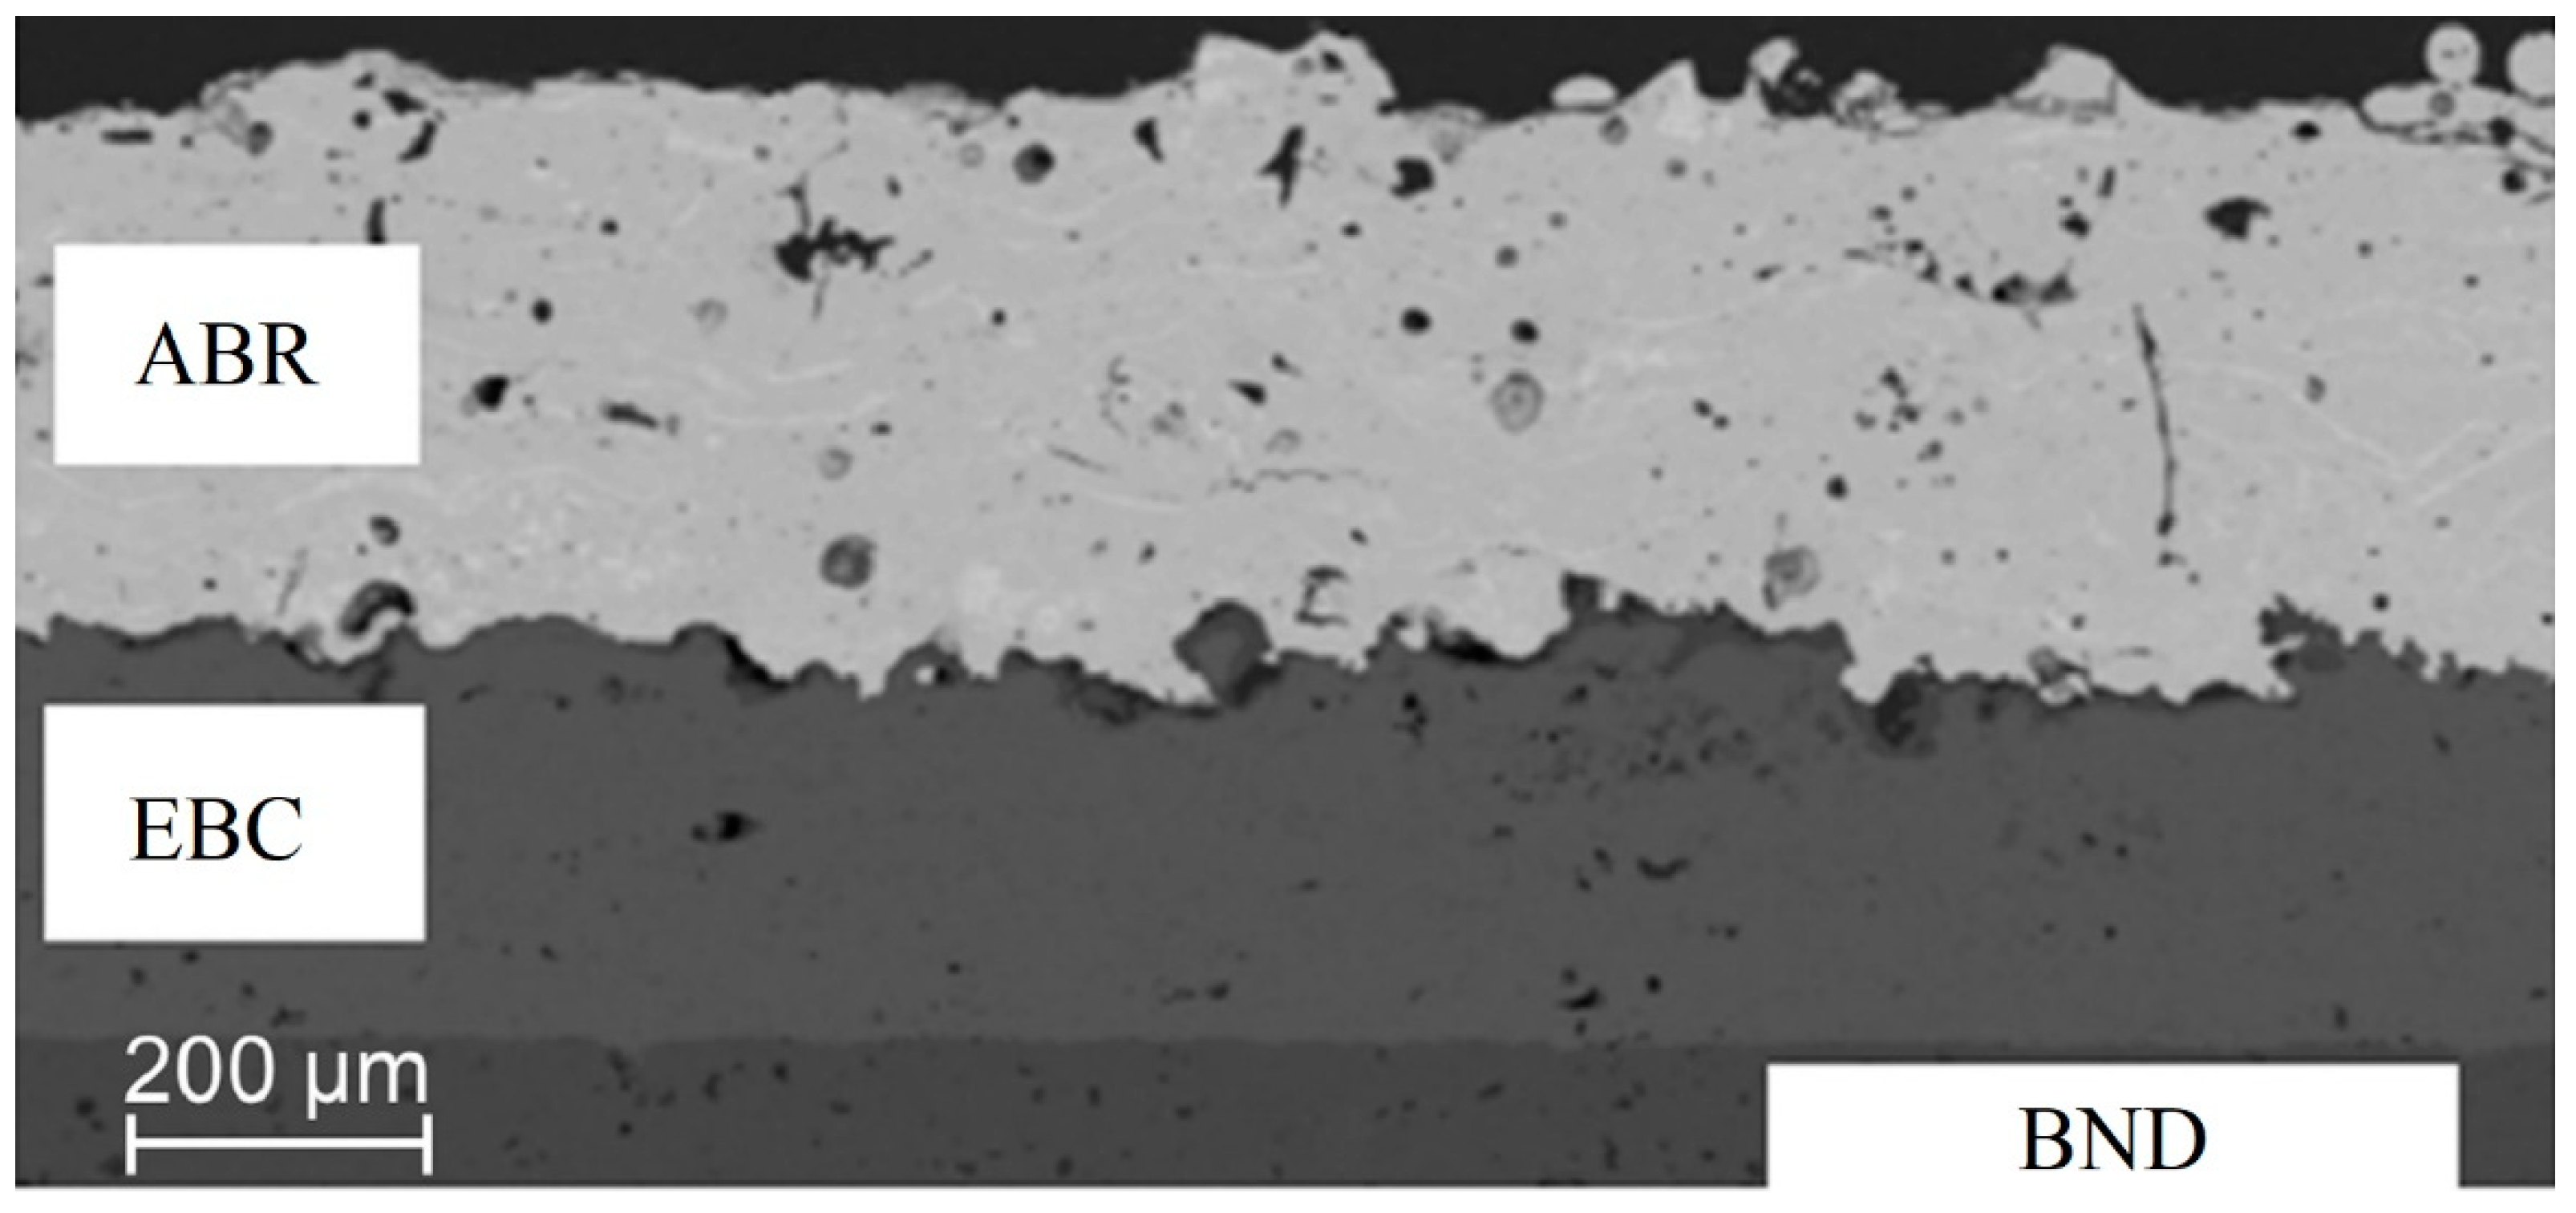
9]. A silicon layer exists directly in contact with the CMC substrate, and it is denoted as a bond line (BND). Then, an ytterbium disilicate environmental barrier coating (EBC) is deposited above the BND. Lastly, directly on the flow path (annulus line) exposed surface, an abradable layer (ABR) mainly made of ytterbium disilicate is placed. The ABR is a sacrificial layer to control the passage of the tip of the turbine blade and maximize aerodynamic efficiency [10]. The ABR is less stiff than the EBC since controlled porosity is induced [10]. The three-layer coating used in this work is shown in Figure 1 [9].
The seal segment (or shroud) is subjected to thermal gradients as the gas flow is at a high temperature on one side of the component and cool air (cooling system) flows on the other side. Consequently, the coating is subjected to thermal gradients, both in plane and through the thickness. There are four main failure mechanisms of this kind of coating for this specific component: (i) vertical cracking, (ii) thermally grown oxide (TGO), (iii) steam degradation and consequent thickness reduction, and (iv) calcium–magnesium–alumina silicate (CMAS) attacks [11,12].
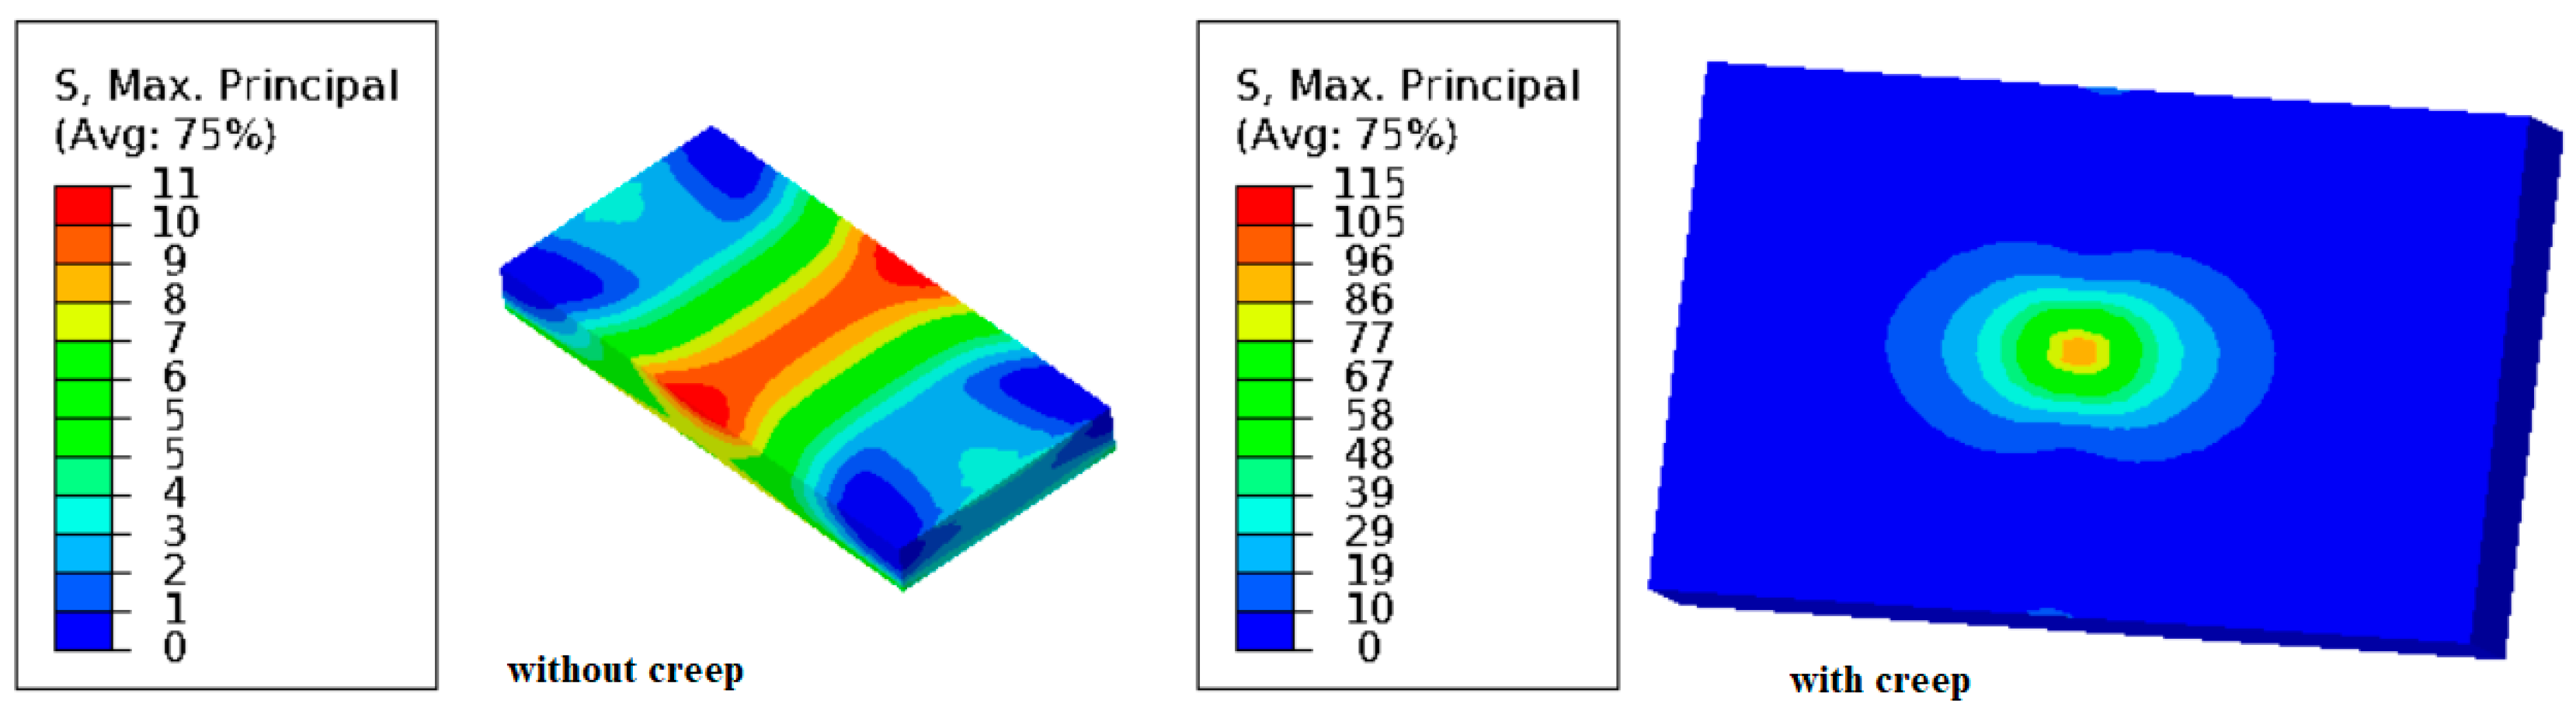
Vertical cracking (also known as “mud” cracking) of ytterbium disilicate (ABR and, potentially, EBC layers) is caused by in-plane and through-the-thickness thermal gradients, residual stresses, and creep. These cracks can be seen after coating deposition with a plasma spray due to the change in the composition of the materials caused by the manufacturing processes, as detailed in [13], or simply during the thermal transients. Vertical cracks arise in the ABR (and, eventually, in the EBC) to relieve the stress that is caused by a different expansion coefficient of the constituents when subjected to elevated temperatures. These vertical cracks are equally spaced in a uniform-porosity material and uniform thermal gradient. The stress field may be affected by the presence of residual stress, caused by the coating deposition and consequent cooling [14]. Zhao et al. [14] measured the residual stresses by a photoluminescence technique and observed that the stresses arise from the mismatch between the substrate and coating and change when moving from the interface to the top of the coating, leading to a variation in the mechanical properties of the coating. That said, residual stress maps (initial strains) should be added as input to a Finite Element model when lifing the coating. Crack formation is affected by creep; therefore, it is also fundamental to include creep deformation as a part of the analysis.
The second mechanism is the TGO. The presence of mud cracks through the ABR and EBC layers could provide a preferential transport path, oxidizing species with a gas phase to the BND, resulting in the rapid growth of an ab-cristobalite (SiO2) phase on the outer silicon surface. The same mechanism is also seen at the edge of the coating [11], directly exposed to external elements. The thermally grown oxide (TGO) is subjected to a significant reduction in volume (~4.5%) during its cubic-to-tetragonal (inversion type) β/α phase transformation when cooled down, resulting in severe TGO microcracking and delamination (spallation) of the EBC [
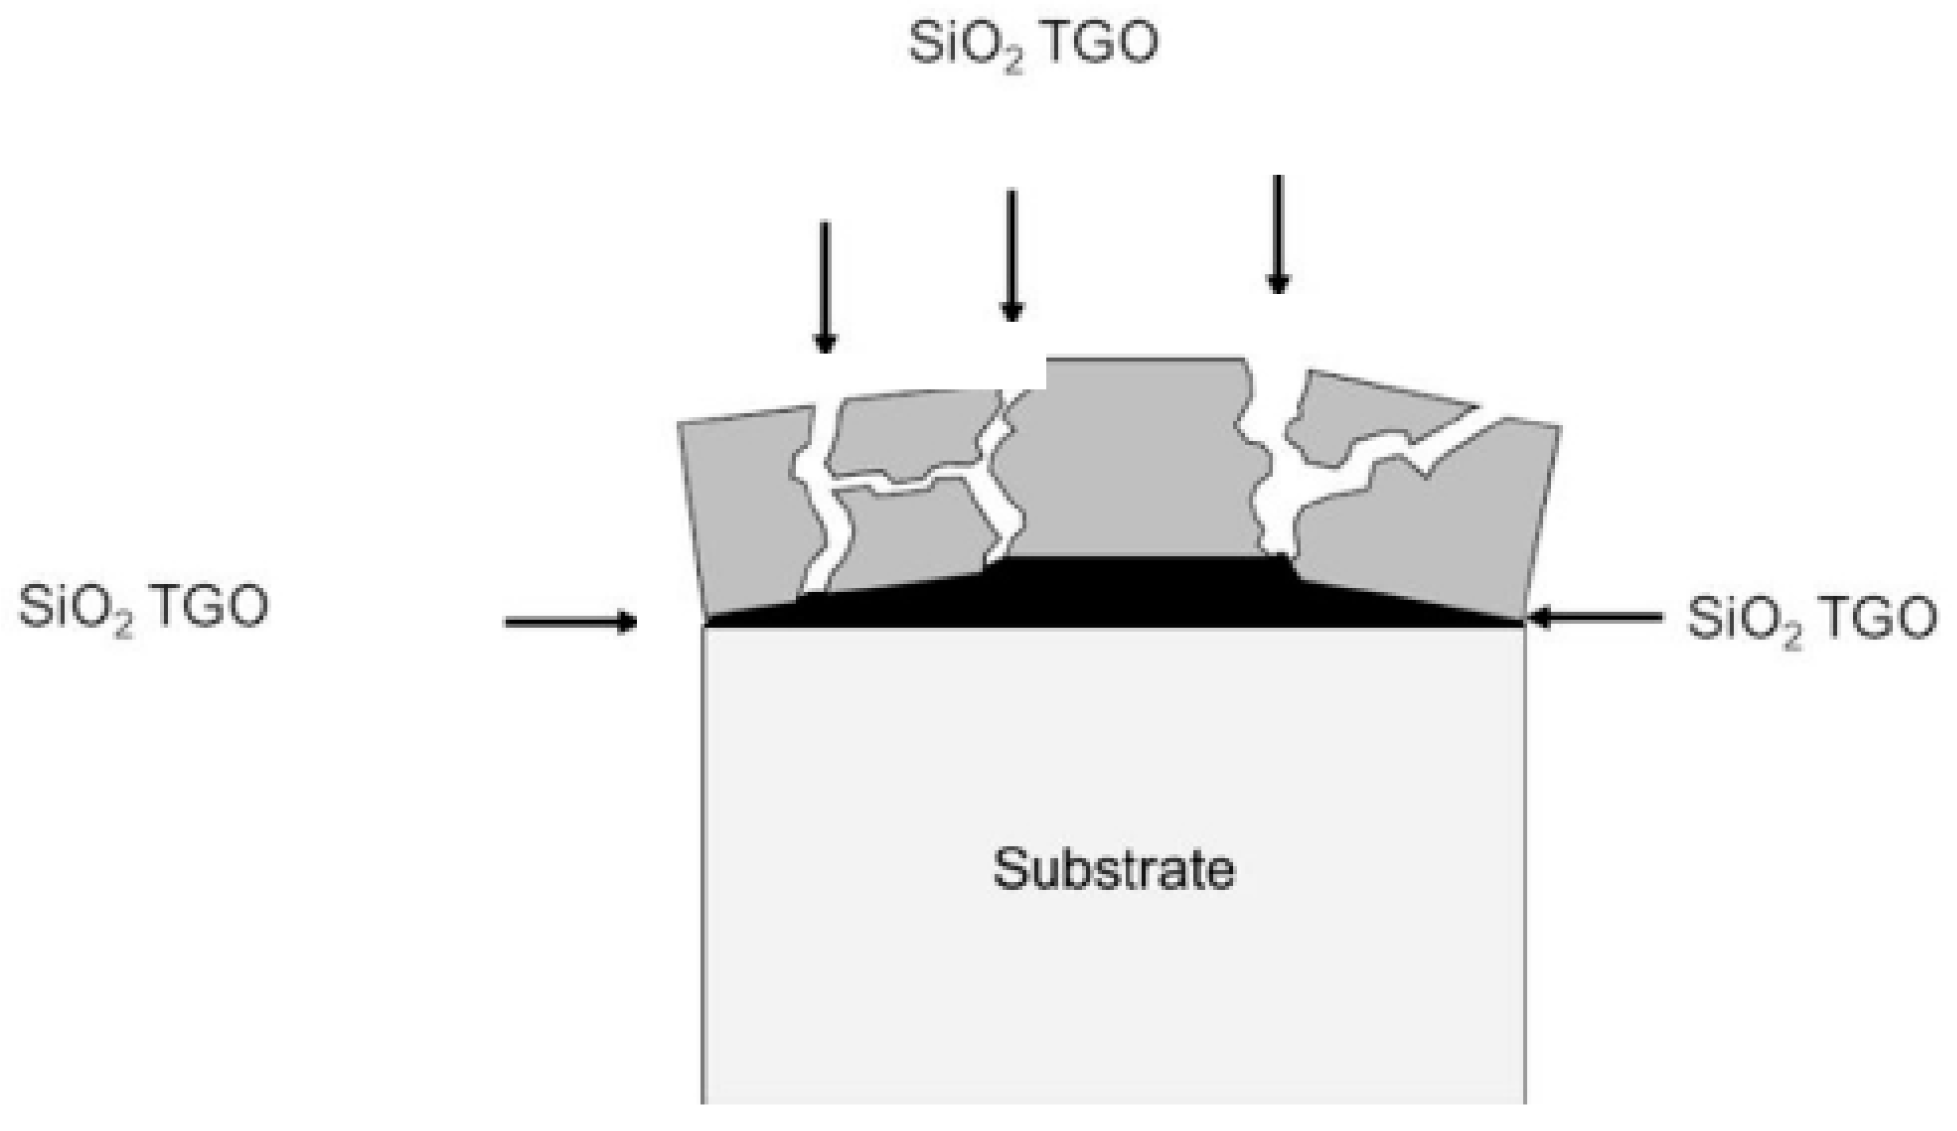
15]. A visual example of TGO formation (and therefore of BND degradation and progressive failure) is shown in Figure 2. Sullivan [15] developed a model to predict the oxidation of silicon particles when they are exposed to oxygen at an elevated temperature and simulate the oxidation and the oxidation rate progressions as a function of the morphology of the coating and influenced by the type of oxidant (dry oxygen or vapor, for example). From the outcomes of this study, it can be argued that, in terms of structural mechanics and damage progression, the delamination can therefore start at the edge of the coating, or underneath a vertical crack that progressed from the top (ABR, EBC), although no experimental evidence exists of this potential path to TGO formation.
The third mechanism is silica volatilization, caused by an elevated-temperature steam environment [16]. This phenomenon is faster with the increase in temperature, especially around 1400 degrees Celsius. The top layers of the coating, made of ytterbium disilicate, when exposed to hot stream [17], were found to be depleted of silica, leaving ytterbium mono-silicate. The chemical reaction is given in Equation (1) [17]:
Yb2Si2O7 + 2H2O→Yb2SiO5 + Si(OH)4 (g),
From the structural integrity point of view, silica volatilization has multiple effects, the most crucial one being the reduction in coating thickness. This affects the thermal field (a thinner coating has a different behavior in terms of being a thermal barrier), the stiffness, and the strength of the coating. The thermal stress field of the coating and the substrate thus can lead to potential cracking. Golden and Opila [18] experimentally investigated the volatilization kinetics of silicon, titanium, and ytterbium oxides by subjecting the materials to a steam jet furnace to simulate the real turbine engine environment and evaluated the speed of recession. The authors observed a recession rate of 4.1 µm/h and 0.92 µm/h for SiO2 and TiO2, respectively, while the Ytterbium oxide (Y2O3) showed a higher stability, registering a recession rate of less than 0.01 µm/h at the test temperature of 1500 °C. Richards [19] investigated the failure mechanisms of different EBCs applied by an atmospheric plasma spray (APS) process, with particular attention to ytterbium monosilicate (Yb2SiO5) and disilicate (Yb2Si2O7), evaluating the influence of the spray conditions. Under optimized deposition conditions, the ytterbium-based EBC, manufactured by the author and tested in his steam furnace cyclic test, registered a remarkable value of 44.65 nm/h. This value is an indication of the speed of the process. The number, however, needs to be scaled with an Arrhenius-type equation to take into account the temperature, flow speed, and steam partial pressure during the flight profile. The work of Richards [15] paved the way for further works, explicitly indicating the critical aspects that need to be addressed, namely, the influence of the bond coat on the stress between the EBC and substrate, the presence of multiple layers (environmental and thermal barrier layers), and the design constraint in EBCs (CTE, elastic modulus, strength, toughness, and creep).
The fourth damage mechanism is CMAS degradation. Under the presence of steam (a naturally occurring combustion product) or corrosive species, CMC coatings can show accelerated corrosion. The presence of corrosive species is caused by the ingestion of debris during take-off and landing, when flying over arid environments, or due to the presence of airborne volcanic ash. Due to the varied nature and composition of these corrosive species, generally containing CaO, MgO, Al2O3, and SiO2 in different proportions, the term CMAS (calcium–magnesium–alumina silicates) was coined as an umbrella designation for these corrosive species. Such external agents can penetrate the ytterbium disilicate, affecting the thermal and mechanical properties of the coating. Cracking and coating loss are facilitated as a function of time.
In this work, a computational framework is proposed to assess two categories of coating damage: vertical cracks (mud cracking) caused by thermal stress and TGO damage. Concerning mud cracking, several analyses have been already proposed in the open literature [12,20,21,22]. In [20], the authors developed a numerical model to analyze the influence of the roughness interface on the thermal stresses arising between the EBC and substrate induced by the mismatch in the thermal expansion. The authors developed a micromechanical FE model to account for the curvatures of the rough interface at the microscale level. The outcomes of the work highlighted the influence of roughness (i.e., peaks and valley on the surface) on the intensity and distribution of thermal residual stresses, which caused the occurrence of vertical cracks in the EBC and delamination cracks at the interface. Arthur et al. [21] proposed FE models to predict thermal residual stresses within the multi-layer EBC (consisting of a bond coat, interlayer, and topcoat) during specific service conditions. The authors observed that the intensity of the thermal residual stress in the coating is affected by the thickness of each layer (in particular, the topcoat); the thicker the layers, the lower the residual stress field. Wang et al. proposed a numerical model to investigate the thermal and mechanical behavior of a composite coating, evaluating the influence of the content percentage, aspect ratio, and orientation of mullite whiskers in silicon-oxide- and alumina-based coatings. The authors observed that the addition of a second phase within the thermal barrier coating can mitigate the mismatch in thermal expansion, reducing the stress variation between the substrate and ceramic coating and thus improving the thermal stability. In the contributions mentioned, the properties of the materials, once defined, were considered constant during the analysis. In the present work, on the other hand, the authors propose a different approach which considers the total stiffness degradation of the coating. Indeed, the approach, described in Section 2, aims to assess the damage evolution of the coating by considering the evaluation of the global damage extent, defined as the volume of coating with cracks related to the total coating volume, instead of the crack propagation inside the coating. The approach will be able to deal with large component models.
TGO FE modeling has been recently proposed in [23,24,25]. Li et al. [24] developed a model to analyze the influence of the thickness and composition of TGO on the stress field at the interface between the topcoat and bond coat in a thermal barrier coating (TBC). The authors observed that the type of oxide layer can significantly influence the behavior of the TBC and, under specific circumstances, can even improve the service life of the TBCs. Alumina-based TGO, for example, can act as an oxygen barrier, slowing down the oxidation rate and improving the thermal resistance as its thickness increases. In [25], the model developed by the authors served to analyze the crack evolution by accounting for crack size, morphology, and the composition of the composite coating, and thermal exposure conditions. Summarizing the outcomes of the devoted literature, two main categories of models can be found: coupled diffusion–stress simulation and stress simulations only [23]. The former is based on the diffusion analysis of oxidizing elements, which can be used to predict TGO formation, its location, and its thickness as a function of time, coupled with a prediction of the stress field induced by different material properties in the TGO region. The latter focuses on describing the final stress and strain state after the growth of a specific TGO rather than the complete growth processes of TGO. The TGO mechanical properties are affected in two different ways. The first change in TGO layer material properties is given by the swelling of the BND (crystal phase change). The second change is driven by the chemical composition of the TGO, different from the original silicon bond line. The model proposed in this work is described in Section 2. The TGO formation is considered with time-dependent stiffness and strength of the BND line as a function of time and as a function of the crack front.
The proposed modeling framework is suitable for designers and stress integrity engineers in the turbine system industry. The proposed models are suitable for monitoring the damage progression in models of an industrial scale.

2. Modeling the Vertical Cracks and TGO Progressive Damage

Vertical cracks are mainly observed during thermal transients, during the heating up of the component from ambient temperature to operational temperature and during cooling down. There are three proposed strategies to model this vertical cracking and its consequence in the EBC softening:
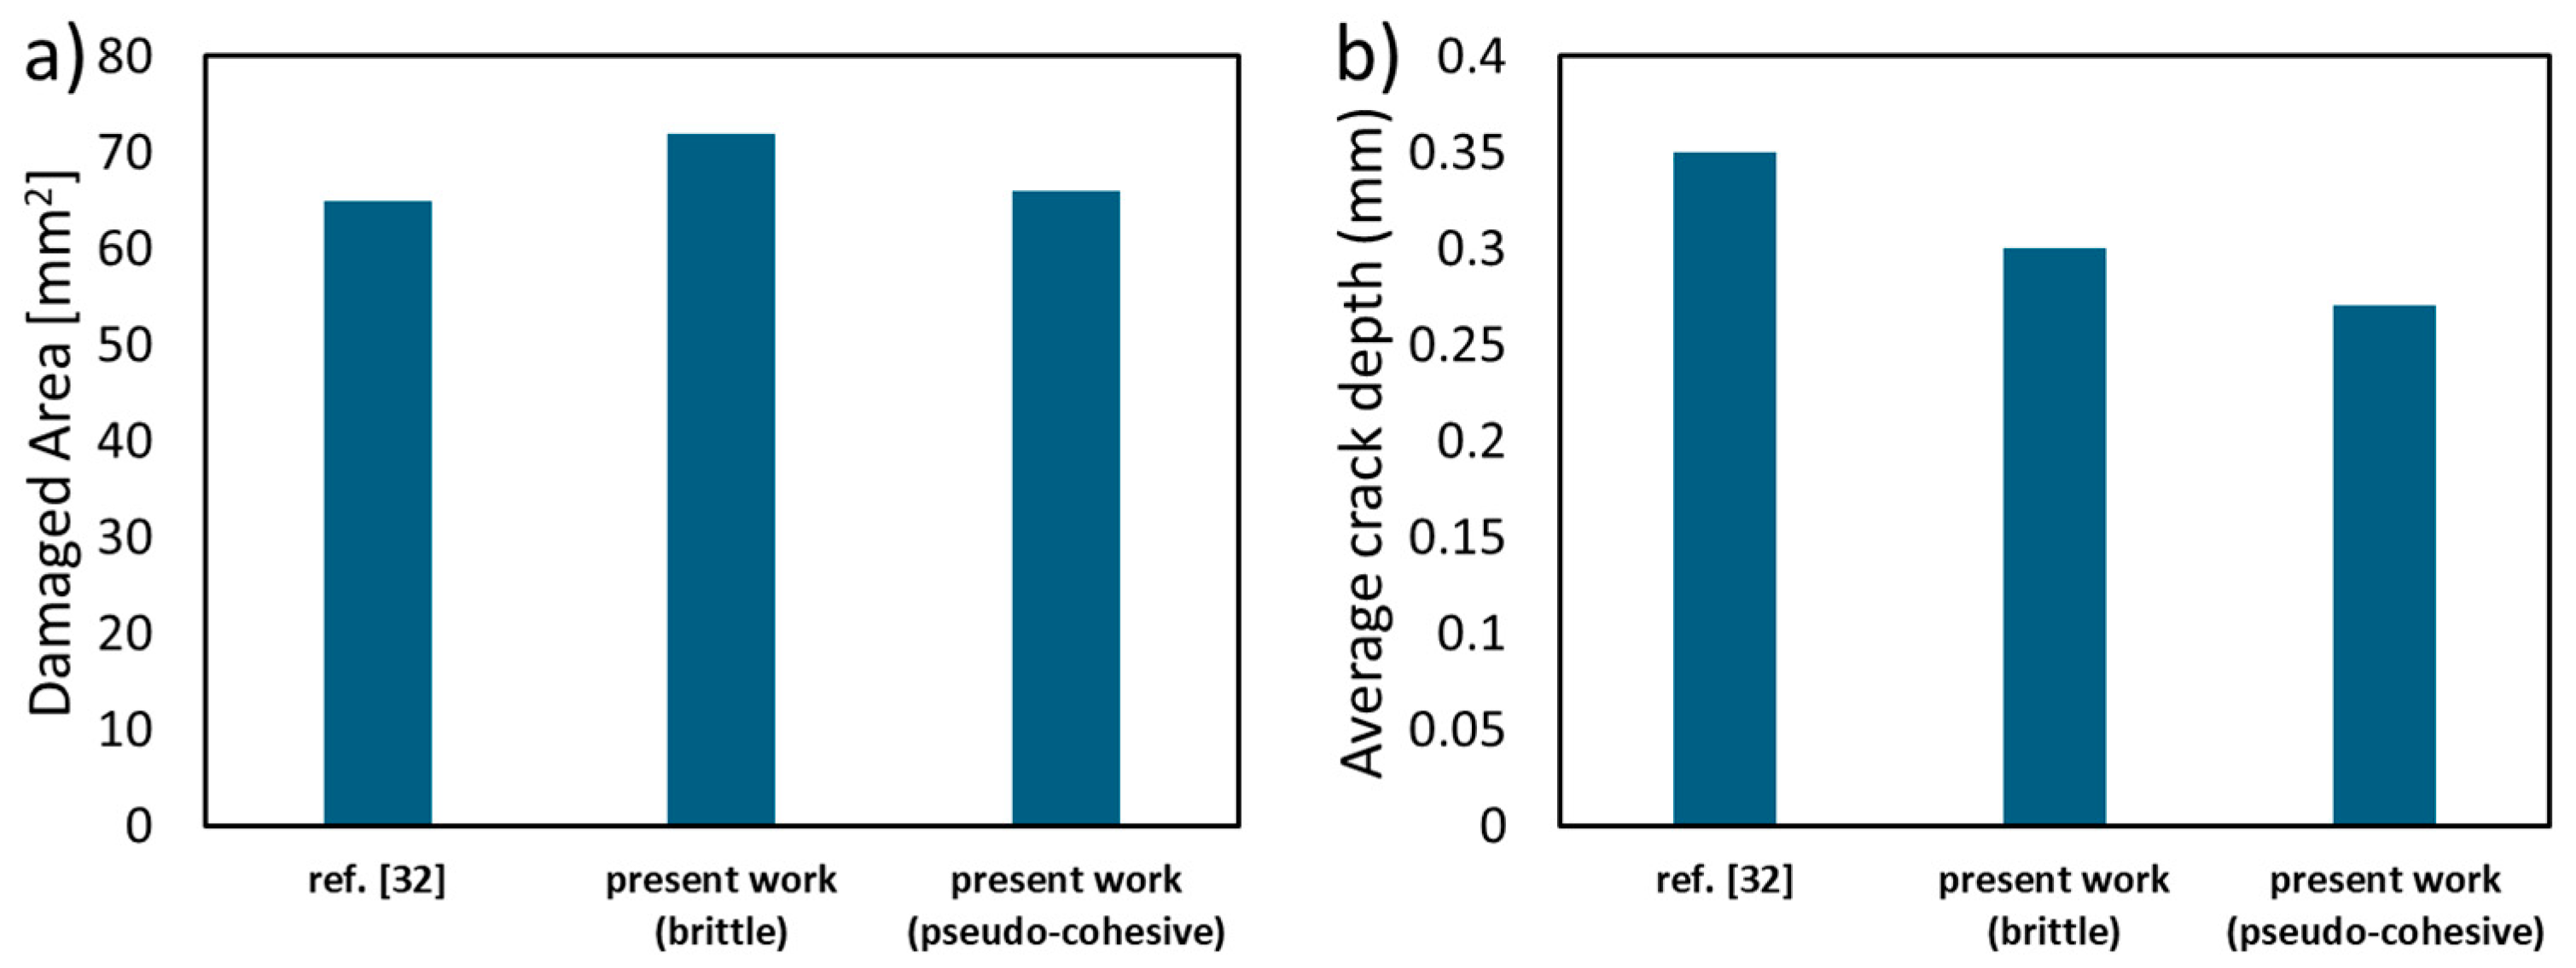
Brittle failure. Once the element’s centroid worst principal stress reaches a critical value σu, the element is deleted and the stress re-calculated. This approach can give information on the final stress re-distribution and potential final extension of the damage. The parameter σu is the only calibration variable when tailoring the model with experimental data.
Pseudo-cohesive behavior. The damage initiates at a level of worst principal total strain εi. After the damage initiates, the EBC stiffness is linearly decreased until a worst principal strain εu is reached. At this level of strain, the element affected will keep an elastic module Ef, a fraction of the original Young’s modulus. The calibration parameters of the model are εi, εu, Ef. The damage is cumulative, and it is stored in a damage variable Dt for each element, which is updated at each step of the simulation. Once the damage starts, it cannot decrease in value.
Full cohesive behavior. A series of standard cohesive element layers [26] are inserted to mimic the potential vertical crack paths. Damage progression can be followed in this way. This approach is not new and is computationally expensive, and it will not be used in the present work.
TGO FE modeling has been recently proposed in [21,22,23]. Two main categories of models can be found: coupled diffusion–stress simulation and stress simulations only. The former is based on the diffusion analysis of oxidizing elements, which can be used to predict TGO formation, its location, and its thickness as a function of time, coupled with a prediction of the stress field induced by different material properties in the TGO region. The latter focuses on describing the final stress and strain state after the growth of a specific TGO rather than the complete growth processes of TGO. The TGO mechanical properties are affected in two different ways: The first change in TGO layer material properties is given by the swelling of the BND (crystal phase change). The second change is driven by the chemical composition of the TGO, different from the original silicon bond line. The TGO formation is considered with the time-dependent stiffness and strength of the BND as a function of time and as a function of the crack front.
Iterative progressive damage is also proposed. TGO formation as a function of time, temperature, and activation energy has the form given in Equation (2) [23].
The TGO thickness h is given by the following:
h = A 0 t n e x p G R 1 T 0 1 T ,
where
  • h is the thickness of the TGO. In other words, the thickness of the BND starts to degrade into a TGO layer;
  • A0 is the proportionality constant;
  • n is the material constant;
  • ΔG is the activation energy;
  • t is the running time;
  • T is the temperature;
  • T0 is the temperature constant value.
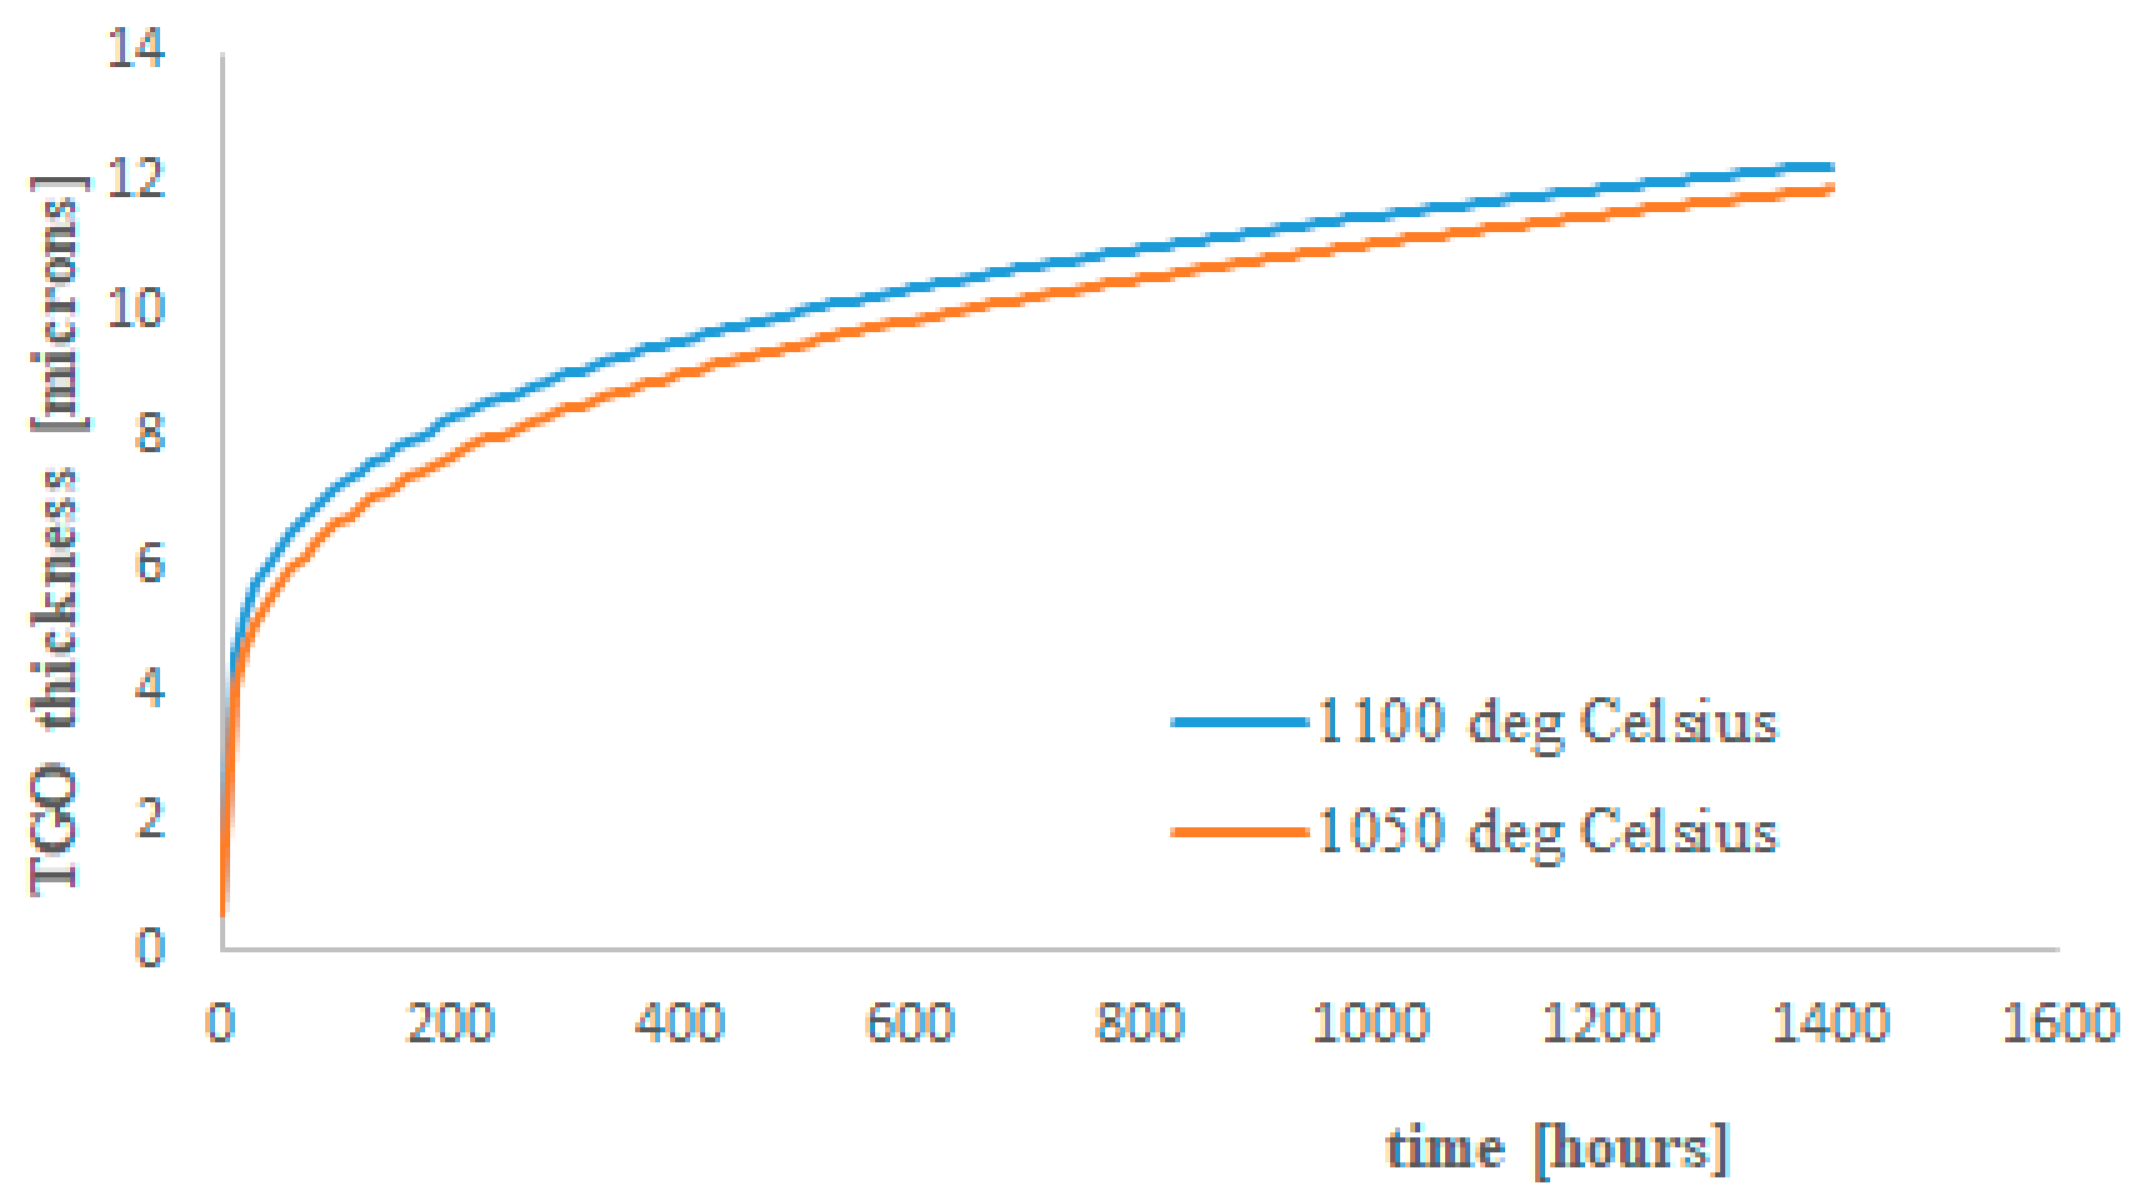
Equation (2) is fitted at a constant temperature into a simplified set of equations (Equations (3) and (4)) that is provided in [27]. These equations can be used with linear interpolation for temperatures close to the ones at which they are evaluated (1100 and 1050 degrees Celsius).
h = 2.505 t 0.2128 + 0.56     at   T   =   1100   C ,
h = 2.072 t 0.2344 + 0.56     at   T   =   1050   C ,
In Equations (3) and (4), the TGO thickness is expressed in microns and the time in hours. A graphic representation of Equations (3) and (4) is shown in Figure 3. The fitting curves are valid only in the close range of the two temperatures.
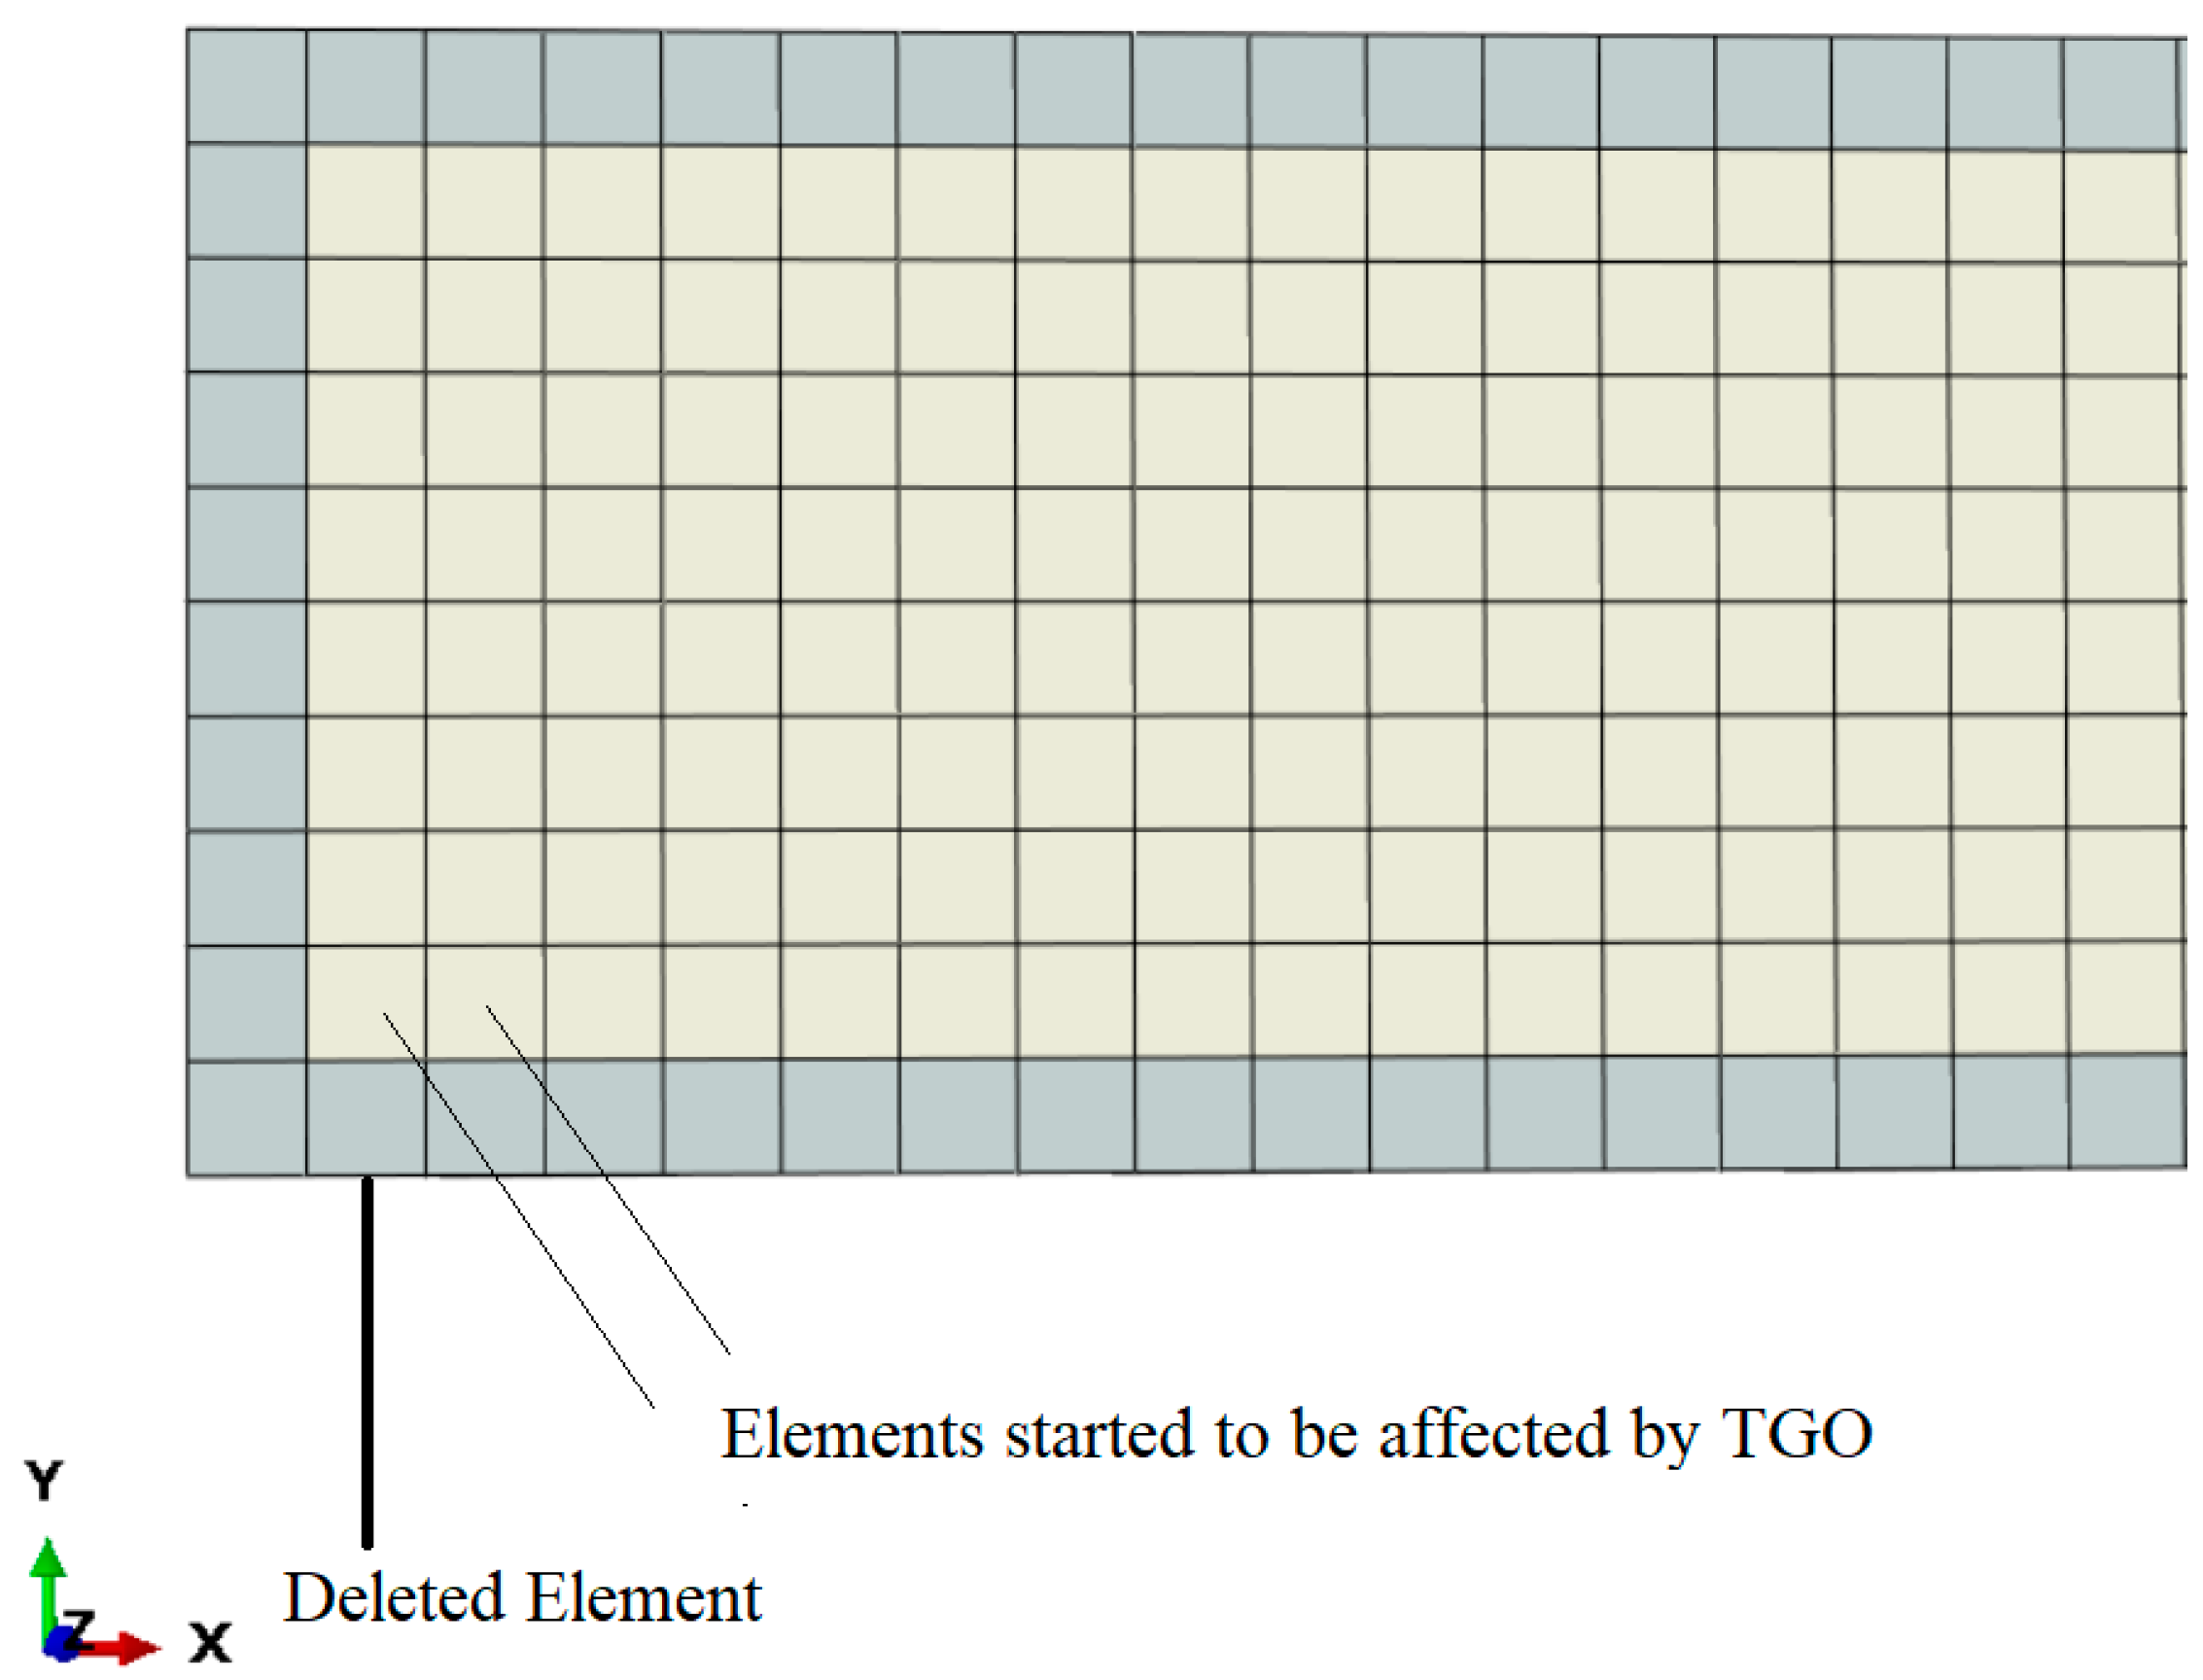
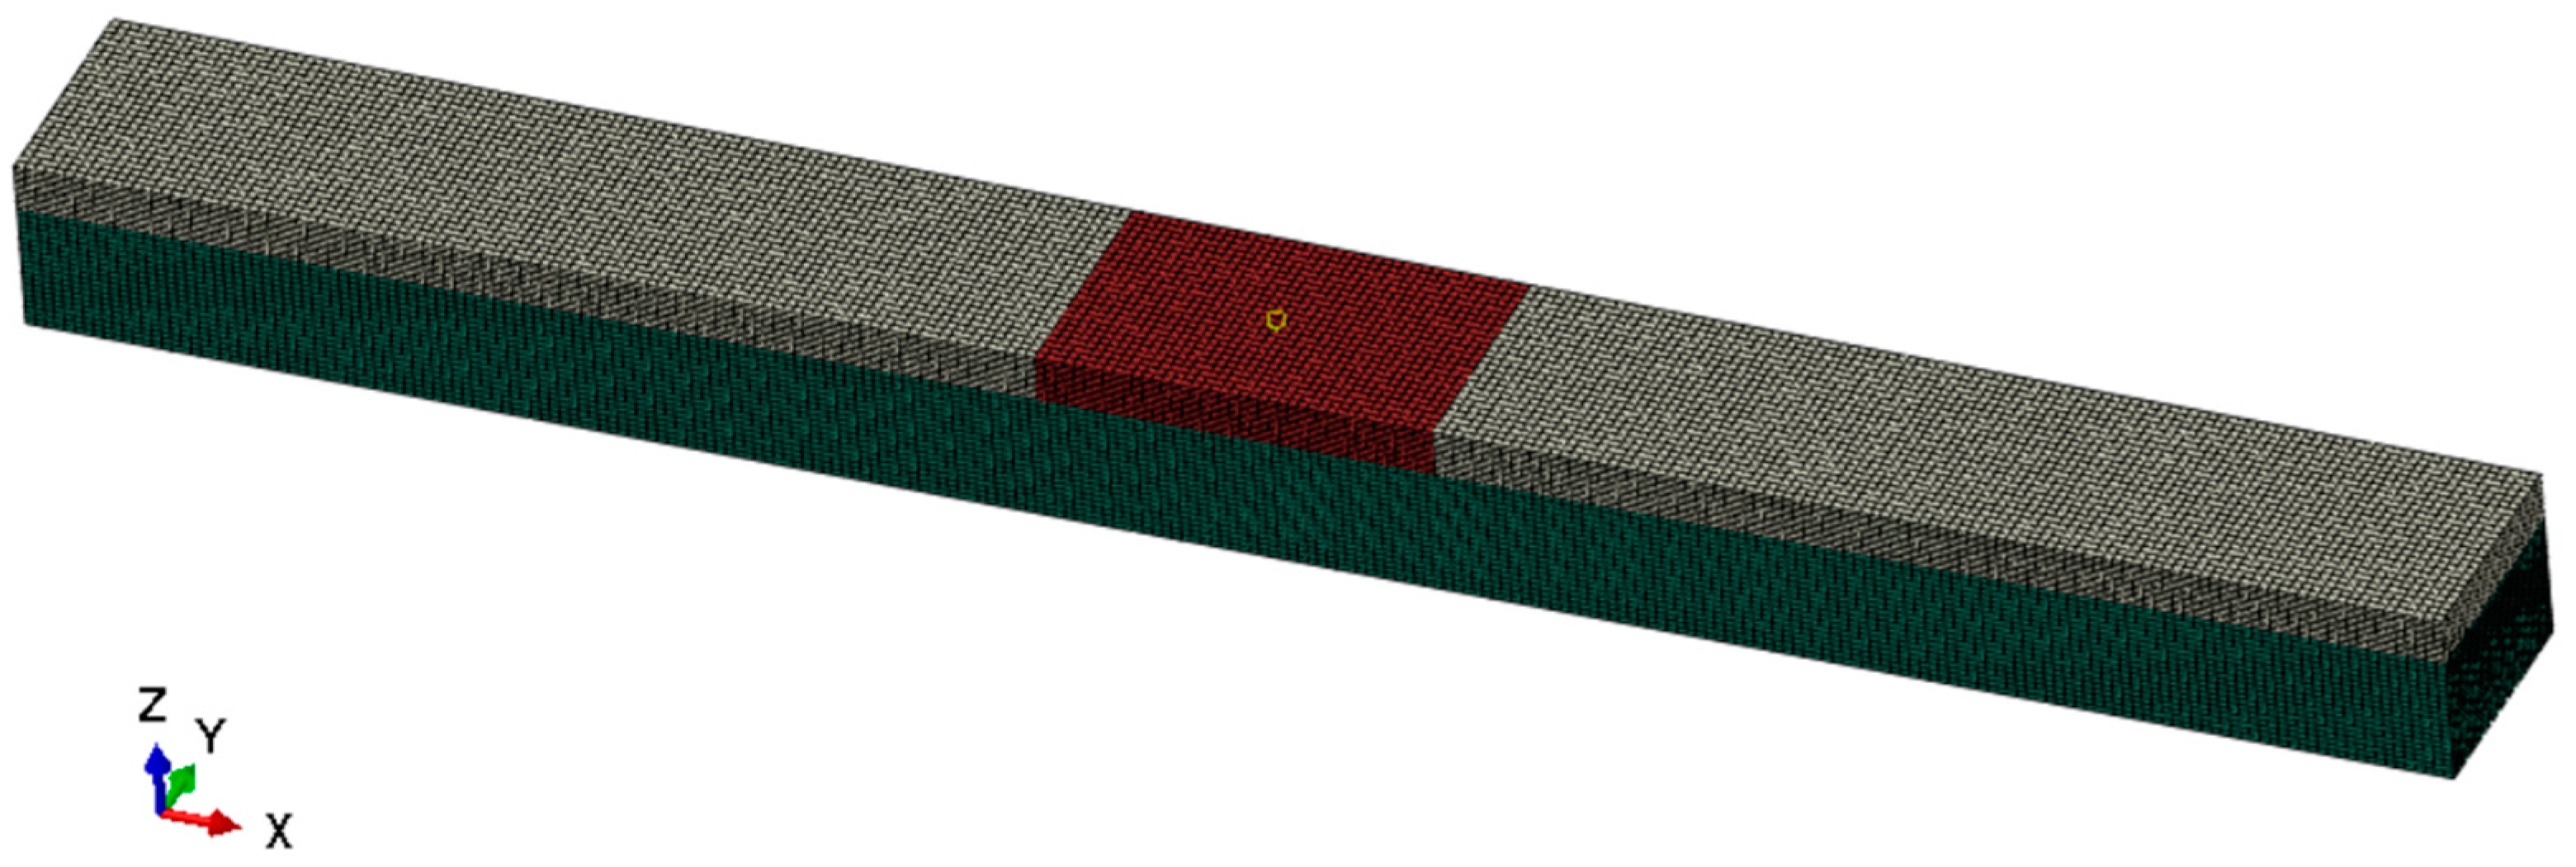
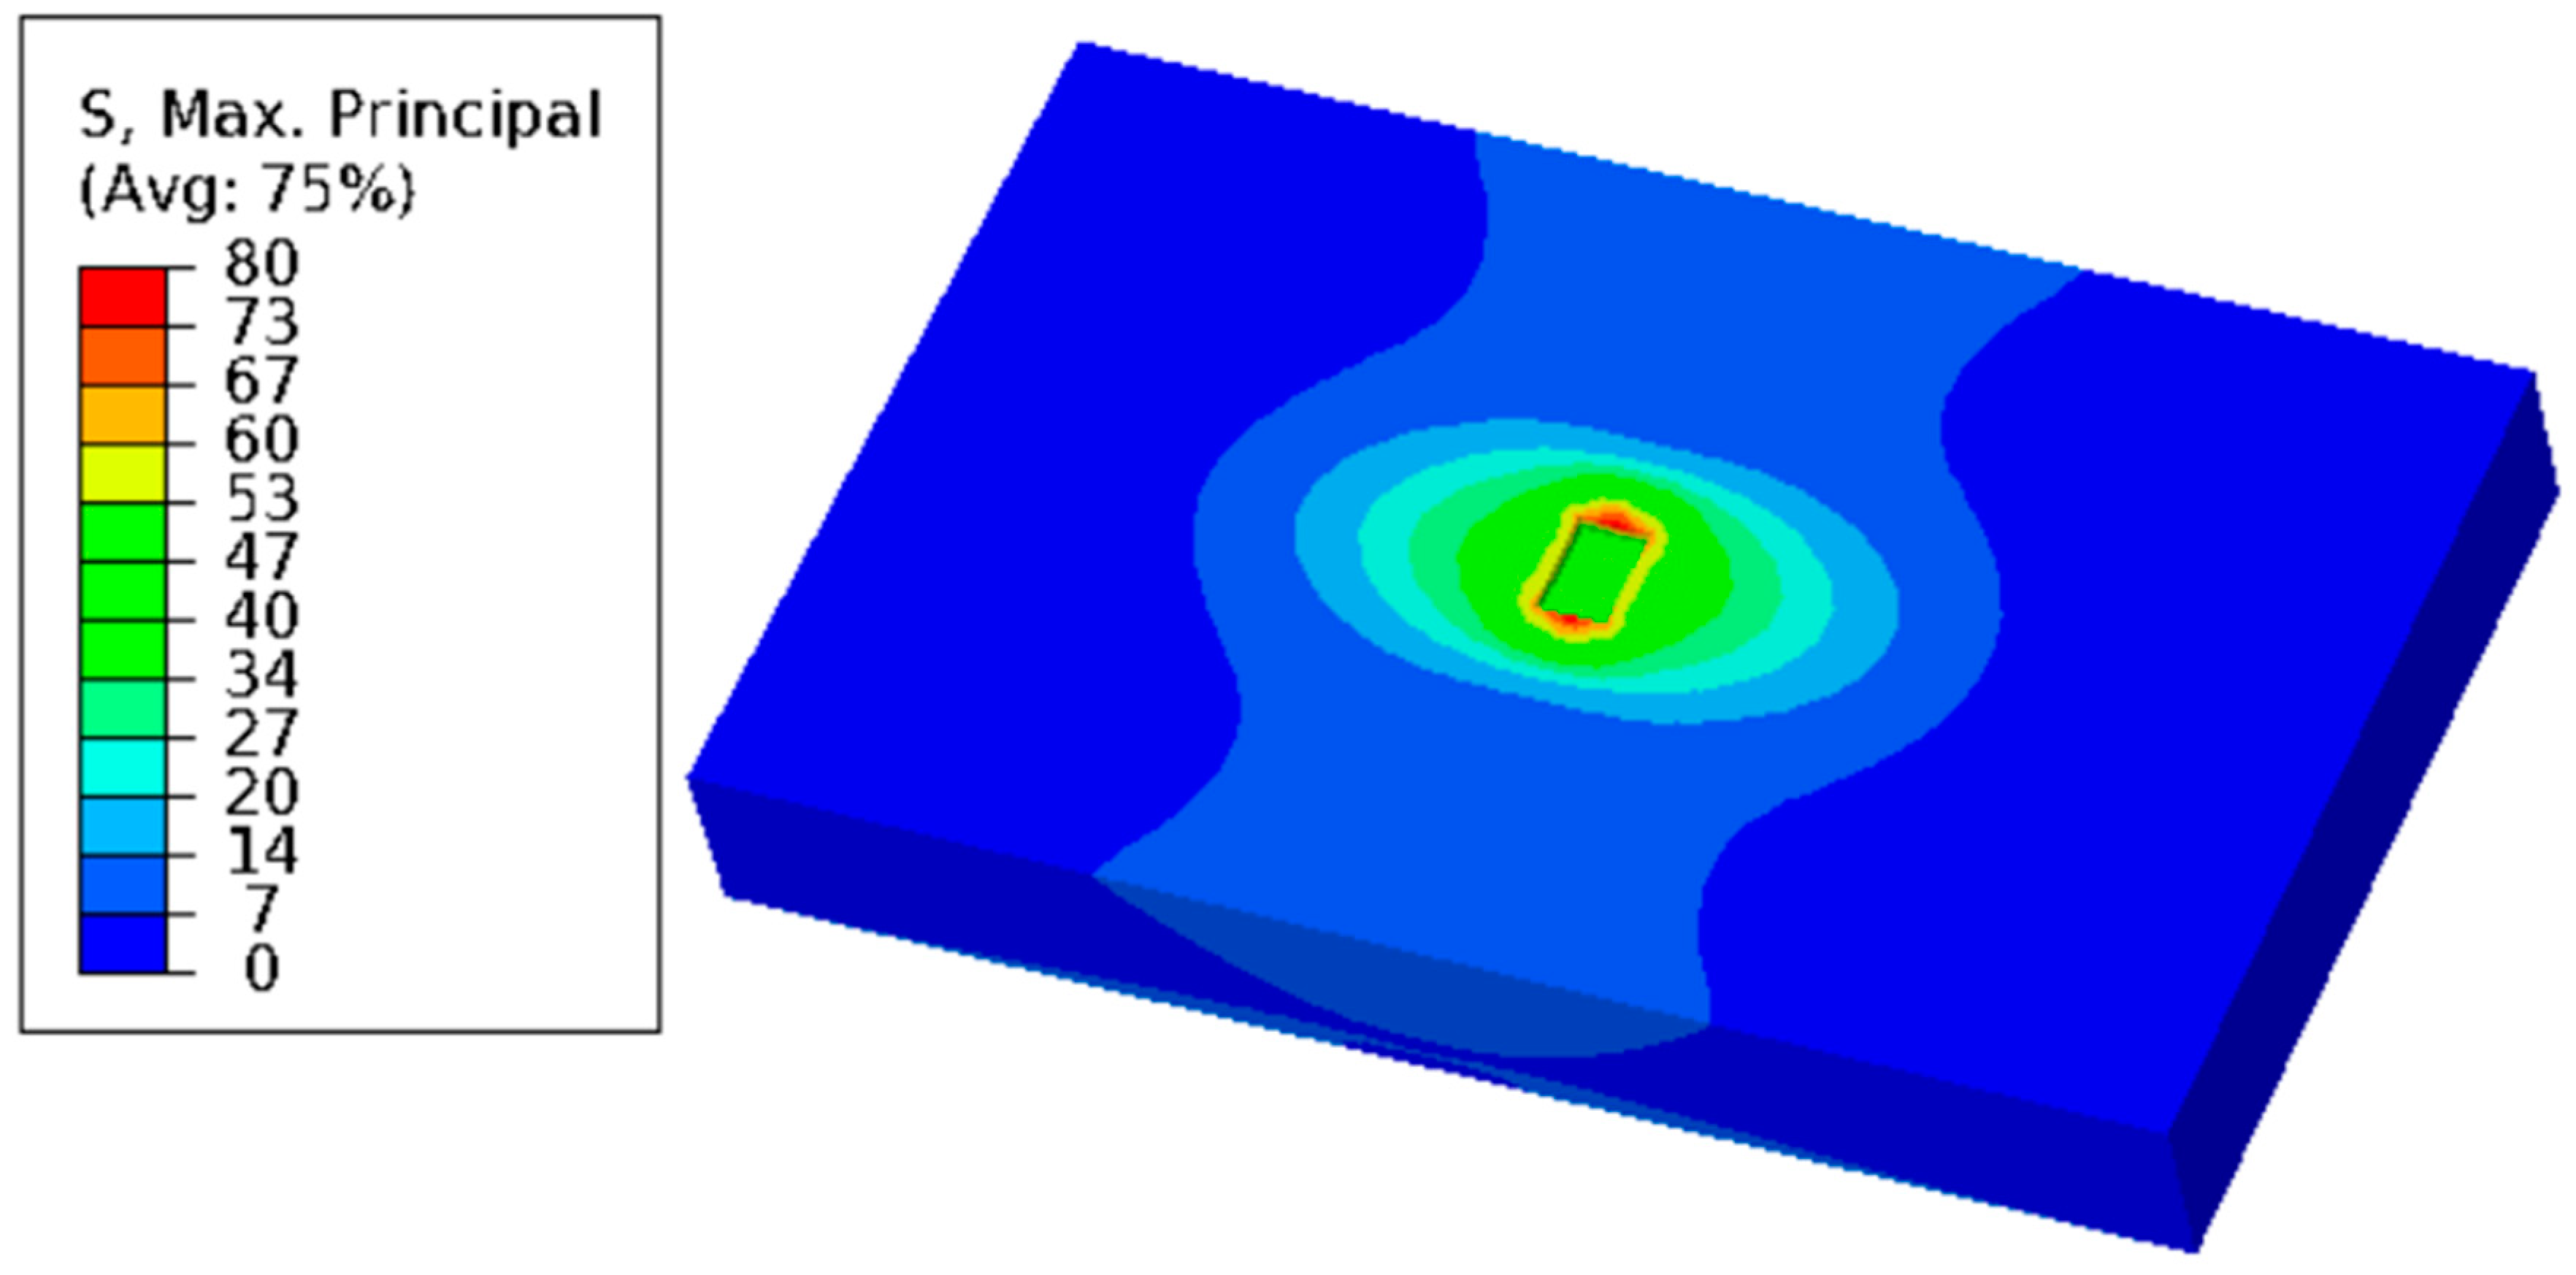
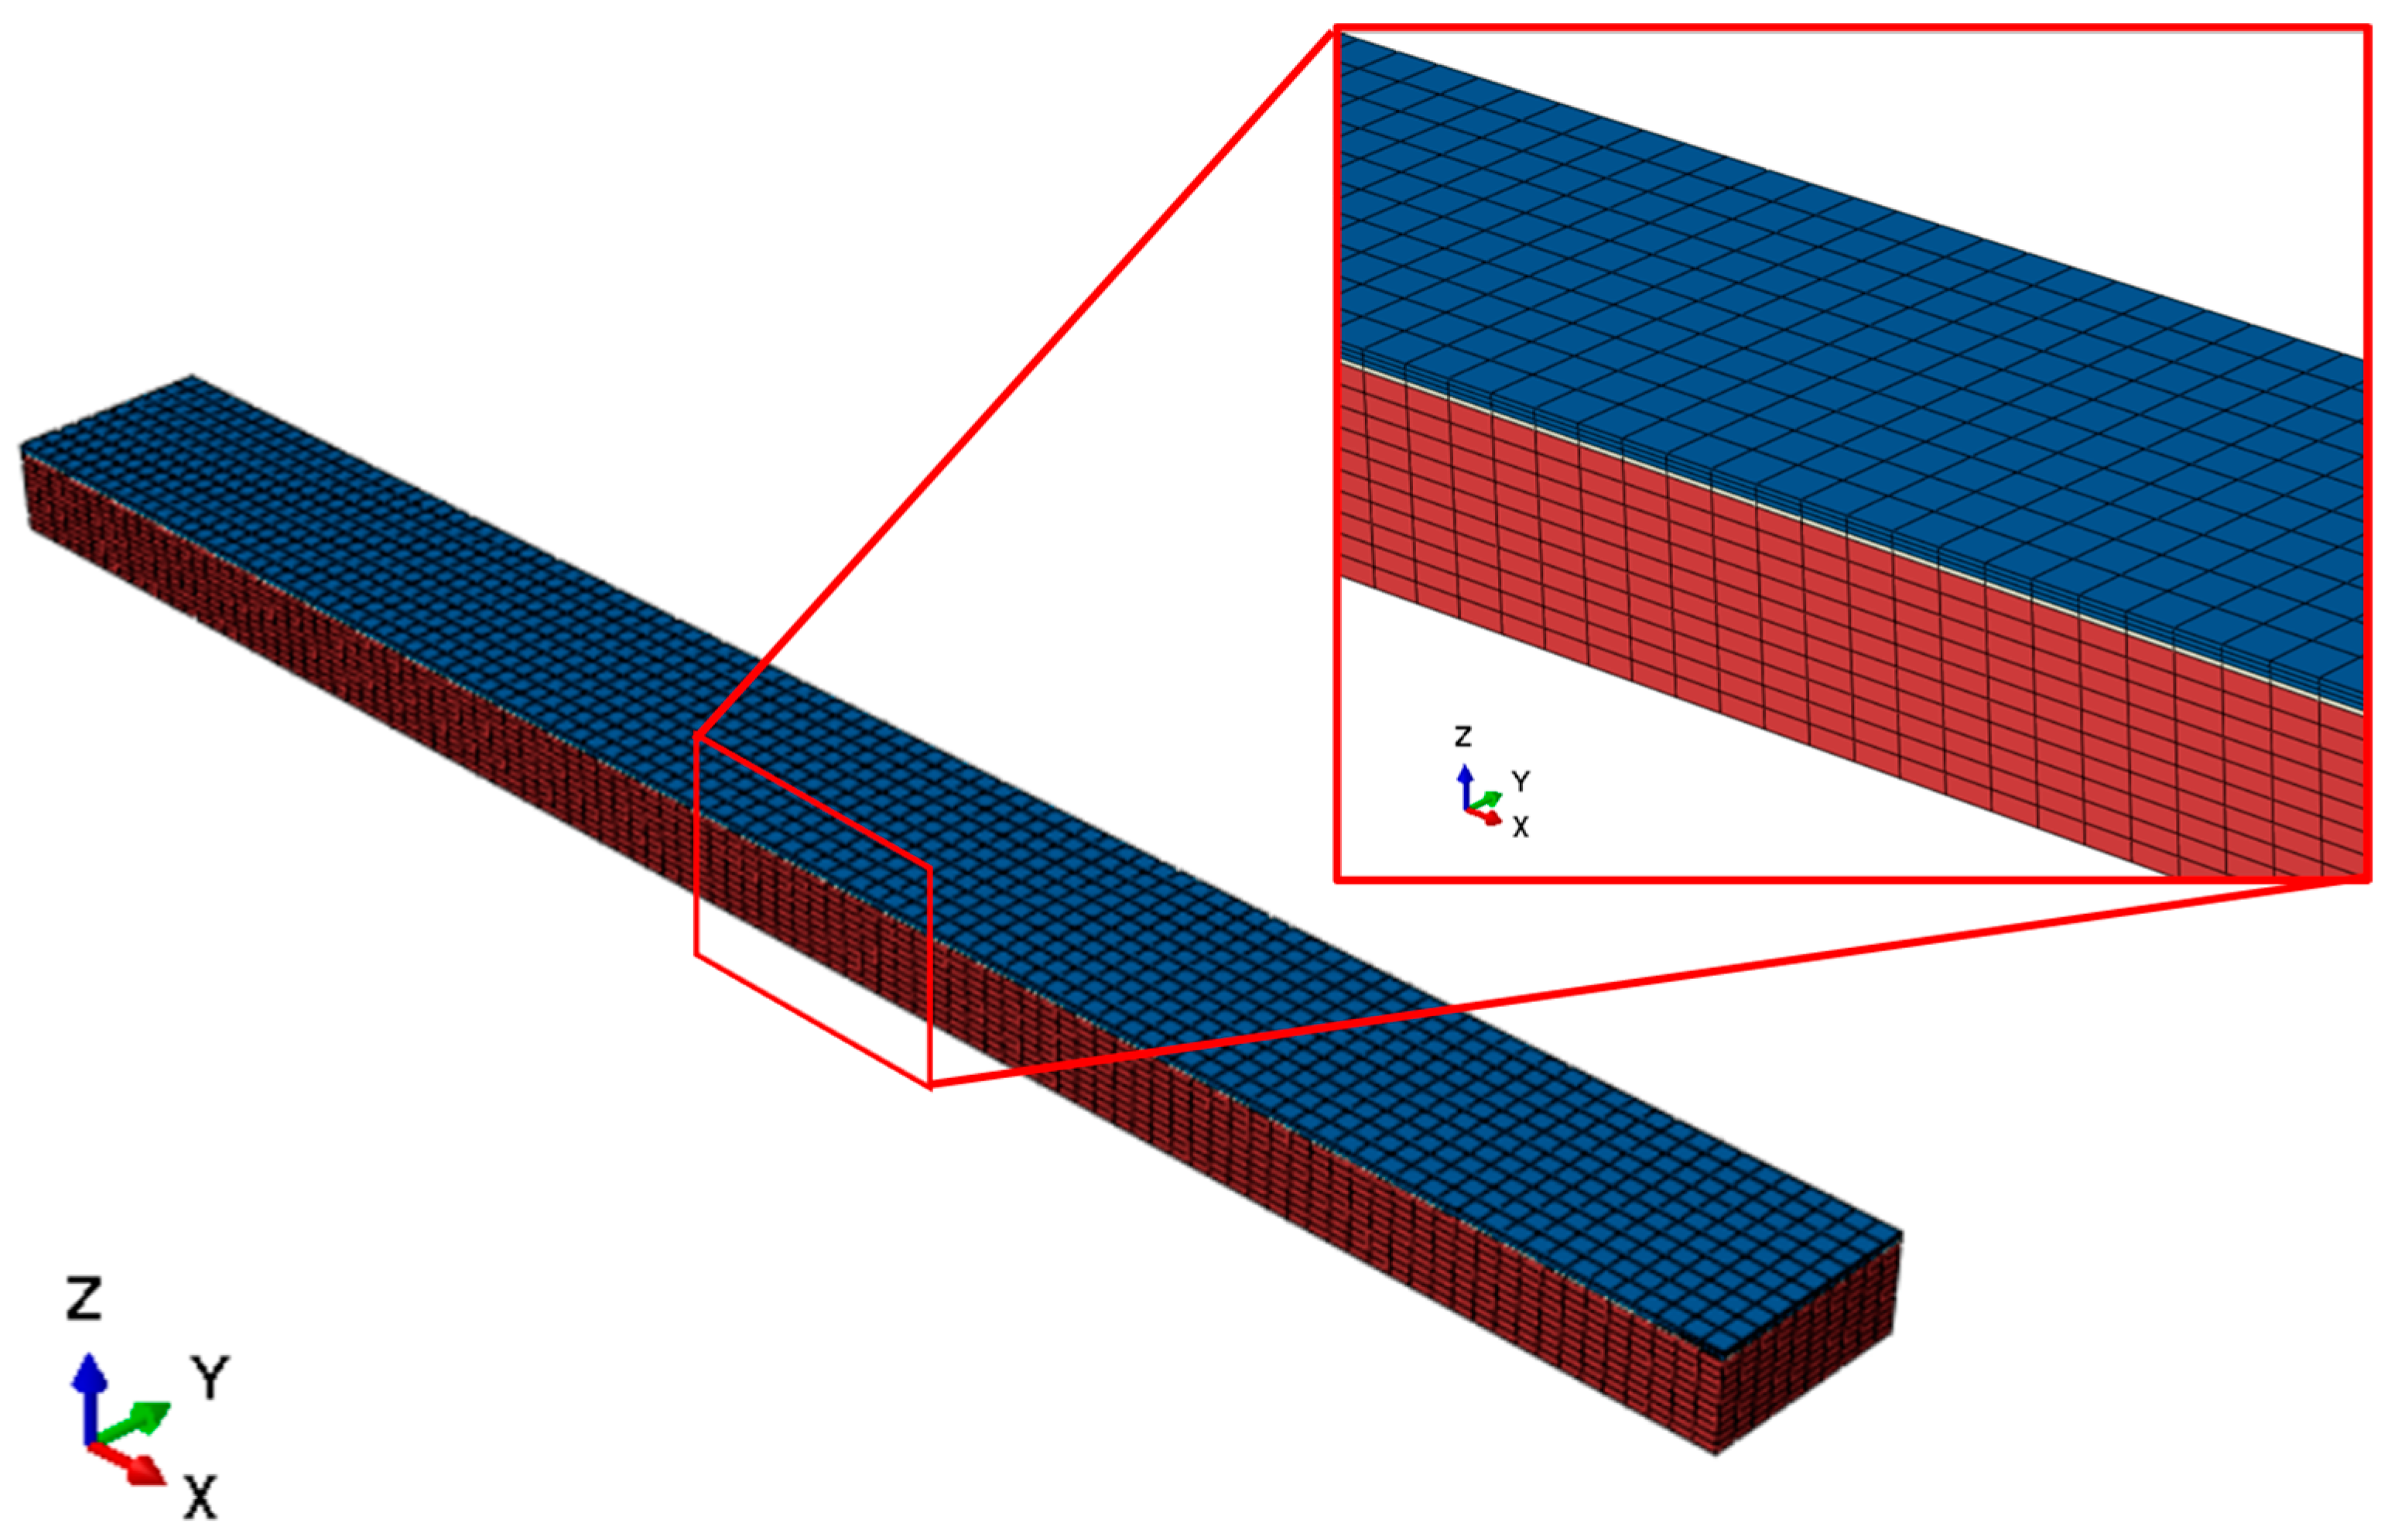
The TGO formation starts at the elements at the edge of the BND, as shown in Figure 4 in a three-point bending specimen example. Only one through-the-thickness element is used to model the thickness of the edge, balancing the need for an adequate representation of the system and the computational cost.
As the running time of the simulation progresses, the TGO thickness increases at the edge elements of the BND. The TGO growth will increase as the local temperature increases. As the TGO thickness increases, the material properties of the BND elements affected are changed according to the rule of mixture. Let the stiffness and coefficient of thermal expansions be denoted as follows:
EBND is the Young’s modulus of the BND;
ETGO is the Young’s modulus of the TGO;
αBND is the coefficient of thermal expansion (CTE) of the BND;
αTGO is the CTE of the TGO.
As a function of the increasing TGO thickness, the CTE and E of the BND elements will be evaluated as follows (Equation (5)):
α t = A α B N D + B α T G O , E t = A E B N D + B E T G O
where
  • αt is the CTE to be applied to the BND element affected by TGO as a function of time;
  • Et is the elasticity modulus to be applied to the BND element affected by TGO as a function of time;
  • A is the fraction of BND element thickness unaffected by TGO (value equals 1 when the element is unaffected);
  • B is the fraction of BND element thickness affected by TGO. It must be noted that A + B = 1.
The element is failed once the TGO thickness reaches 0.02 mm [28]. This means that the element will be deleted by the simulation. When an element of the edge is deleted, meaning that delamination has started occurring, the neighbor elements of the failed elements start to be affected by TGO formation in the simulation. For this reason, the proposed modeling technique needs the implementation of a neighboring algorithm in which each element will establish the element number of the adjacent. An example is shown in Figure 5.
The aim of the simulation is to provide damage progression and stress re-distribution as a function of time. The simulation stops when the surface extension of the BND spallation (delamination) reaches a critical value, which is not necessarily an unstable delamination and fracture but a design criterion (even visual damage acceptance). BND elements (either unaffected or affected by TGO) must also have the worst principal stress and an out-of-plane shear stress below the failure threshold in order not to be deleted. The vertical crack and TGO proposed FE procedures will be illustrated with numerical examples in Section 3.
Concerning silica depletion and CMAS, no FE procedure is implemented as a part of this work. ABR thickness reduction could be modeled by simply changing the nodal coordinates of the top surface nodes to take into account a small thickness reduction (mesh morphing). With the same rule for a mixture implemented for TGO, the existing mixing between YDS and YMS can be modeled in terms of the averaged Young’s modulus and CTE. The temperature increase due to an increased tip clearance should be considered. Thermic and structural simulations should be iteratively performed to re-calculate the temperature and stress field as the silica depletion advances as a function of time. Silica depletion is a function of temperature, flow speed, and activation energy [29].
Material properties used for the simulations are reported in the Section Material Properties.

Material Properties

The material properties of the CMC substrate [9] at different temperatures are given in Table 1.
The material properties of the EBC [9] at different temperatures are given in Table 2 and Table 3 (creep).
The material properties of the BND [9] at different temperatures are given in Table 4 and Table 5.
The material properties of the TGO layer [28] at different temperatures are given in Table 6. No creep deformation is assumed for the TGO layer [28].

3. Results and Discussion

Two different numerical examples are proposed. They both use the specimen geometry of the test performed by Hamadouche et al. [30]. For the mud cracking damage model, the same load and temperature conditions as in [30] are reproduced. Regarding the TGO damage model example, a uniform temperature load of 1100 degrees Celsius is applied. The vertical crack damage model experiment is reported in Section 3.1. The TGO damage example is reported in Section 3.2.

3.1. Vertical Crack Damage Model Test Case

The specimen used for this experiment and simulation is shown in Figure 5. The prismatic geometry is 50 mm long, 5 mm wide, and 3.7 mm thick. It is made of two layers, a CMC substrate that is 2.7 mm thick and a 1 mm thick EBC. In Figure 6, three zones are visible. In white is the EBC, undamaged. In red is the EBC volume where the damage model is applied. In green is the CMC substrate.
To reproduce the results reported in [30], a thermal analysis and a stress analysis are conducted separately. The temperature field is first calculated as a function of time and then applied to a stress model. There is no need for a coupled thermal–stress analysis as the inertia effects are negligible. HEX8 elements of 0.2 mm are used. In the thermal analysis, three different heat fluxes are applied to simulate the effect of a burner. They are as follows: HF1 = 2000 mW/mm2; HF2 = 1700 mW/mm2; HF3 = 1200 mW/mm2. The load applied to the thermal model is shown in Figure 7.
The remaining exposed surfaces are subjected to a film convection boundary condition with a 0.01 coefficient and to a radiation emission boundary condition with a 0.85 emissivity coefficient. Two different analysis steps are defined. The first step is a 130 s heating-up condition. The steady-state thermal equilibrium is reached, and it is verified with a dedicated steady-state thermal analysis. In the second step, the heat flux, i.e., the energy going into the system, is set to zero, and the specimen is therefore cooled down. Only 10 s of the cooling down is monitored, as the temperature field may induce cracking at the beginning of the cooling, as suggested in [30].
The steady-state temperature field is shown in Figure 8. This temperature field is close to the one found in [30].
Once the thermal maps are calculated, a stress model is prepared. It is shown in Figure 9.
The applied load is 10 kg, applied in the form of equivalent pressure. The supports (Z displacement restrained to mimic a four-point bending test) are placed symmetrically with respect to the center line of the specimen at a 12.5 mm distance and 37.5 mm distance from the center. As per the thermal model, two steps are defined. A heat-up condition where the thermal maps are read from the thermal analysis with a 1s interval is set. A cooling-down step follows, where the thermal maps are read with a 0.1 s interval.
The worst stress field of the cooling step is shown in Figure 10. Two simulations are performed: with and without creep.
Including EBC creep is fundamental to obtaining the failure (or high stresses in general) in the right location. Damage models (proposed in Section 2) are implemented to replicate the areas of damage of this specific test [30] and calculate the stress re-distribution. To implement option 1 (brittle damage), an ultimate stress of σu = 90 MPa is considered. After three iterations, all the stress values in the EBC are below the ultimate strength. The final stress configuration is shown in Figure 11.
The graphic representation gives the image of the missing elements. In those elements, the vertical cracking goes through the entire thickness of the element. The presence of multiple cracks does not significantly affect the thermal conduction of the material. A thermo-mechanical iteration is therefore not needed as temperatures are considered the same as the uncracked material. When creep strain has more time at an elevated temperature (the dwell time of the experiment is longer), it is believed that the depth of the vertical cracks will be longer, as shown in [30].
The pseudo-ductile modeling technique proposed is tried with the parameters reported in Table 7.
At the end of three cycles, to make a back-to-back comparison with the brittle damage model, the damage variable of the pseudo-ductile model is plotted in Figure 12.
Unitary damage would give a crack passing through the whole thickness of the element. The brittle damage has only one calibration parameter: the stress to failure. The nature of the material is expected to follow this behavior. The pseudo-ductility damage model provides the analyst with three calibration parameters. It is therefore more flexible for calibration to a more complex set of data.
The model is calibrated on experimental data from Hamadouche et al. [30]. The comparison with [30] is based on two parameters: the surface affected by the damage and the average crack depth. The damage surface in Ref. [30] was approximately 65 mm2, while, in the present work, it is approximately 72 mm2 in the case of brittle failure (hence, the developed model is conservative) and 66 mm2 in the case of the pseudo-cohesive approach. Regarding the crack depth, the experimental value was approximately 0.35 mm [30], while the values from the present model are 0.3 mm in the case of brittle failure and 0.27 mm for the pseudo-cohesive approach. The graph in Figure 13 below reports the calibration of the present model for the damage surface and the crack depth.

3.2. TGO Damage Model Test Case

TGO formation and damage progression are still not well established, and multiple research programs are currently focused on this aspect. The same specimen used to describe the mud cracking FE procedure is used for the TGO. From the modeling perspective, the only difference is that a 0.1 mm thick BND layer is added to the model (Figure 14). Therefore, the overall dimensions of the prismatic geometry are 50 mm long, 5 mm wide, and 3.8 mm thick.
Only one load case is considered, in which the temperature is uniformly applied from the ambient temperature (20 °C) to 1100 °C. The TGO damage, as detailed in Section 2, is first applied to the BND elements of the edge (the ones directly exposed to external agents). The BND stress field at 1100 °C at the start of the procedure, meaning zero time to exposure and zero damage, is shown in Figure 15 and Figure 16. Hereinafter, S13 and S13 will represent the shear components in directions 1–3 (S13) and 2–3 (S23).
Both the worst principal stress and out-of-plane shear are simultaneously monitored since, at this stage of the research, it is still unclear whether the brittle failure of the BND is caused by one component of these stresses or a combination of them.
The TGO formation is calculated every 50 h. At approximately 650 h, a TGO layer of 0.01 mm is formed (Equation (3)). The new stiffness and CTE properties are calculated according to Equation (4). The stress distribution is shown in Figure 17 and Figure 18.
By comparing Figure 15 and Figure 16 with Figure 17 and Figure 18, it can be seen that the stress distribution is only slightly different. In addition to the changing stiffness and CTE properties, the TGO formation affects the BND layer strength, and changes in stiffness and CTE should be expected. However, since, to the best of author’s knowledge, the potential relationship between strength and TGO is not experimentally known, in the modeling approach proposed, instead of degrading the strength as a function of TGO, a TGO thickness threshold is used. When it is reached, the element is affected and, therefore, coating spallation initiates.
Once the TGO reaches 0.02 mm thickness, after 15,200 h according to Equation (3), the elements of the BND edge fail. They are deleted from the simulation desk. It is important to remark that, although the timescales of TGO are longer than the mud cracking, Equation (3) seems unconservative in predicting TGO formation. Equation (3) may be, according to analysts’ experience, too optimistic in predicting the rate of TGO formation. Furthermore, no stress dependency exists in this equation. Once the BND edge fails, the stress field re-distributes, as shown in Figure 19 and Figure 20. All the elements of the edge fail at the same time since they are exposed to the same temperature, and TGO formation is only time dependent, and no stress dependency exists in TGO formation according to Equation (3).
It can be clearly seen that the worst principal stress re-distributes, but its peak value is lower. An increase is, on the other hand, measured in the out-of-plane shear. The remaining BND elements are therefore subjected to a shear stress much closer to the shear strength (approximately 80 MPa). If the procedure is continued, BND elements may also fail, not only because the TGO formation reaches its threshold, but also because the shear strength is reached. In this example, a further inner element BND layer is affected by TGO formation. The procedure is stopped when a critical spallation area is reached. This critical spallation is not necessarily defined by an instable propagation of the delamination, but by a simple design criterion (unacceptable visible damage).

4. Conclusions and Future Work

Damage mechanisms of an aero-engine high-pressure turbine system CMC component multi-layer coating (Rare Earth ytterbium silicates) have been described in this paper.
  • Two different FE procedures have been proposed for assessing vertical crack damage. One is a brittle progressive damage failure where the elements are erased once a critical ultimate strength is reached. This does not mean that the coating is removed, but rather that the element has vertical cracks throughout its whole thickness. The second one is a pseudo-cohesive behavior, where the stiffness of the affected element is linearly degraded. For both these novel approaches, including creep data in the FE analysis is of fundamental importance to calculating a stress field able to reproduce the experimental results.
  • One FE damage progression procedure has been proposed to assess TGO affecting the silicon bond line, whose function is to join the CMC substrate to the coating system. In the proposed approach, the TGO formation only affects the elements at the edge of the silicon bond line first. Hypotheses have been made on the TGO formation potentially existing at the vertical crack tips formed on the layers above the silicon bond. To the author’s knowledge, there is still no experimental evidence of this potential phenomenon. The proposed procedures have been demonstrated with examples, based on existing experimental data.
These methodologies will be assessed with actual engine component models. The TGO FE procedure will be tried with different TGO formation time-dependent (and possibly stress-dependent) equations as a part of future work. TGO layer swelling due to crystal phase change, and potentially causing EBC cracking, will be investigated as a part of the future work.

Author Contributions

Conceptualization, G.C. and F.R.; methodology, G.C.; validation, F.R., G.C. and V.E.; formal analysis, G.C. and V.E.; investigation, G.C. and V.E.; data curation, F.R., G.C. and V.E.; writing—original draft preparation, G.C., V.E. and F.R.; writing—review and editing, G.C., V.E. and F.R.; visualization, V.E. and F.R. All authors have read and agreed to the published version of the manuscript.

Funding

This research received no external funding.

Data Availability Statement

The raw data supporting the conclusions of this article will be made available by the authors on request.

Acknowledgments

The authors would like to thank Stephen Pattison, Jun Shi, and Weizhou Li (Rolls-Royce) for their precious advice.

Conflicts of Interest

The authors declare no conflicts of interest.

References

  1. Detwiler, K.N.; Opila, E.J. Oxidation of SiC/BN/SiC Ceramic Matrix Composites in Dry and Wet Oxygen at Intermediate Temperatures. J. Eur. Ceram. Soc. 2022, 42, 4110–4120. [Google Scholar] [CrossRef]
  2. Rolls Royce. The Jet Engine, 5th ed.; Wiley: Hoboken, NJ, USA, 2015; Volume 1. [Google Scholar]
  3. Steibel, J. Ceramic Matrix Composites Taking Flight at GE Aviation. Am. Ceram. Soc. Bull. 2019, 98, 30–33. [Google Scholar]
  4. Tejero-Martin, D.; Bennett, C.; Hussain, T. A Review on Environmental Barrier Coatings: History, Current State of the Art and Future Developments. J. Eur. Ceram. Soc. 2021, 41, 1747–1768. [Google Scholar] [CrossRef]
  5. Canale, G.; Citarella, R. Oxidation Driven Damage on SiC/BN/SiC Ceramic Matrix Composite Aero-Engine Structures: An Iterative Computational Framework. Materials 2024, 17, 3034. [Google Scholar] [CrossRef]
  6. Gowayed, Y.; Ojard, G.; Prevost, E.; Santhosh, U.; Jefferson, G. Defects in Ceramic Matrix Composites and Their Impact on Elastic Properties. Compos. B Eng. 2013, 55, 167–175. [Google Scholar] [CrossRef]
  7. Singh, S.; Yin, J.; Lun, F.; Mondal, D.P.; Kim, D.; Lee, S.-H. Significance of Modification of Slurry Infiltration Process for the Precursor Impregnation and Pyrolysis Process of SiCf/SiC Composites. J. Eur. Ceram. Soc. 2020, 40, 2245–2251. [Google Scholar] [CrossRef]
  8. Fang, G.; Gao, X.; Song, Y. A Review on Ceramic Matrix Composites and Environmental Barrier Coatings for Aero-Engine: Material Development and Failure Analysis. Coatings 2023, 13, 357. [Google Scholar] [CrossRef]
  9. Canale, G.; Rubino, F.; Citarella, R. Design Aspects of a CMC Coating-like System for Hot Surfaces of Aero Engine Components. Forces Mech. 2024, 14, 100251. [Google Scholar] [CrossRef]
  10. Huang, J.; Liu, R.; Hu, Q.; Guo, X.; Li, G.; Tu, Y.; Lu, X.; Xu, M.; Deng, L.; Jiang, J.; et al. High Temperature Abradable Sealing Coating for SiCf/SiC Ceramic Matrix Composites. Ceram. Int. 2023, 49, 1779–1790. [Google Scholar] [CrossRef]
  11. Richards, B.T.; Young, K.A.; de Francqueville, F.; Sehr, S.; Begley, M.R.; Wadley, H.N.G. Response of Ytterbium Disilicate–Silicon Environmental Barrier Coatings to Thermal Cycling in Water Vapor. Acta Mater. 2016, 106, 1–14. [Google Scholar] [CrossRef]
  12. Richards, B.T.; Sehr, S.; de Franqueville, F.; Begley, M.R.; Wadley, H.N.G. Fracture Mechanisms of Ytterbium Monosilicate Environmental Barrier Coatings during Cyclic Thermal Exposure. Acta Mater. 2016, 103, 448–460. [Google Scholar] [CrossRef]
  13. Di Iorio, G.; Paglia, L.; Pedrizzetti, G.; Genova, V.; Marra, F.; Bartuli, C.; Pulci, G. Ytterbium Disilicate/Monosilicate Multilayer Environmental Barrier Coatings: Influence of Atmospheric Plasma Spray Parameters on Composition and Microstructure. Coatings 2023, 13, 1602. [Google Scholar] [CrossRef]
  14. Zhao, X.; Xiao, P. Residual Stresses in Thermal Barrier Coatings Measured by Photoluminescence Piezospectroscopy and Indentation Technique. Surf. Coat. Technol. 2006, 201, 1124–1131. [Google Scholar] [CrossRef]
  15. Sullivan, R.M. On the Oxidation of the Silicon Bond Coat in Environmental Barrier Coatings. J. Eur. Ceram. Soc. 2021, 41, 557–562. [Google Scholar] [CrossRef]
  16. Rohbeck, N.; Morrell, P.; Xiao, P. Degradation of Ytterbium Disilicate Environmental Barrier Coatings in High Temperature Steam Atmosphere. J. Eur. Ceram. Soc. 2019, 39, 3153–3163. [Google Scholar] [CrossRef]
  17. Maier, N.; Nickel, K.G.; Rixecker, G. High Temperature Water Vapour Corrosion of Rare Earth Disilicates (Y,Yb,Lu)2Si2O7 in the Presence of Al(OH)3 Impurities. J. Eur. Ceram. Soc. 2007, 27, 2705–2713. [Google Scholar] [CrossRef]
  18. Golden, R.A.; Opila, E.J. A Method for Assessing the Volatility of Oxides in High-Temperature High-Velocity Water Vapor. J. Eur. Ceram. Soc. 2016, 36, 1135–1147. [Google Scholar] [CrossRef]
  19. Richards, B. Ytterbium Silicate Environmental Barrier Coatings; University of Virginia: Charlottesville, VA, USA, 2015. [Google Scholar]
  20. Fang, G.; Ren, J.; Shi, J.; Gao, X.; Song, Y. Thermal Stress Analysis of Environmental Barrier Coatings Considering Interfacial Roughness. Coatings 2020, 10, 947. [Google Scholar] [CrossRef]
  21. Arthur, E.K.; Ampaw, E.; Azeko, S.T.; Danyuo, Y.; Agyei-Tuffour, B.; Kan-Dapaah, K.; Obayemi, J.D. Design of Thermally Reliable Environmental Barrier Coating for a SiC/SiC Ceramic Matrix Composites. Int. J. Compos. Mater. 2013, 3, 191–197. [Google Scholar]
  22. Wang, Y.; Wang, C.; You, Y.; Cheng, W.; Dong, M.; Zhu, Z.; Liu, J.; Xie, W.; Wang, L.; Zhang, X.; et al. Finite Element Simulations of Thermal Stress Distribution in Thermal Barrier Coatings with Different Mullite Whisker Arrangements. Ceram. Int. 2024, 50, 43397–43413. [Google Scholar] [CrossRef]
  23. Wen, Q.; Jing, F.; Zhang, C.; Tang, S.; Yang, J. Review of Numerical Simulation of TGO Growth in Thermal Barrier Coatings. Comput. Model. Eng. Sci. 2022, 132, 361–391. [Google Scholar] [CrossRef]
  24. Li, Z.; Zheng, R.; Lin, X.; Lian, Y.; Jin, K. Finite Element Analysis of TGO Thickness on Stress Distribution and Evolution of 8YSZ Thermal Barrier Coatings. J. Am. Ceram. Soc. 2023, 106, 789–804. [Google Scholar] [CrossRef]
  25. Nguyen, S.T.; Nakayama, T.; Suematsu, H.; Iwasawa, H.; Suzuki, T.; Otsuka, Y.; He, L.; Takahashi, T.; Niihara, K. Self-Healing Behavior and Strength Recovery of Ytterbium Disilicate Ceramic Reinforced with Silicon Carbide Nanofillers. J. Eur. Ceram. Soc. 2019, 39, 3139–3152. [Google Scholar] [CrossRef]
  26. Smith, M. ABAQUS/Standard User’s Manual, Version 6.9; Dassault Systèmes Simulia Corp: Providence, RI, USA, 2009. [Google Scholar]
  27. Hu, D.; Lv, Z.; Liu, H.; Jing, F.; Zhao, Y.; Zhang, S.; Du, H.; Wang, R. Characterization and Mechanical Modeling of Interfacial Damage in EB-PVD Thermal Barrier Coatings Considering Multiple Failure Factors. J. Mater. Sci. Technol. 2024, 190, 42–55. [Google Scholar] [CrossRef]
  28. Mital, S.K.; Ricks, T.M.; Arnold, S.M.; Harder, B.J. Modelling of the Influence of Thermally Grown Oxide (TGO) Layers on the Driving Forces in Environmental Barrier Coating Systems; Glenn Research Center: Cleveland, OH, USA, 2021. [Google Scholar]
  29. Tejero-Martin, D.; Bai, M.; Romero, A.R.; Wellman, R.G.; Hussain, T. Steam Degradation of Ytterbium Disilicate Environmental Barrier Coatings: Effect of Composition, Microstructure and Temperature. J. Therm. Spray Technol. 2023, 32, 29–45. [Google Scholar] [CrossRef]
  30. Hamadouche, I.; Archer, T.; Beauchêne, P.; Vandellos, T.; Hild, F. Fracture Mechanisms of an Environmental Barrier Coating under Thermomechanical Loadings. J. Eur. Ceram. Soc. 2024, 44, 116737. [Google Scholar] [CrossRef]
Figure 1. Three-layer coating used in this work. BND is a silicon bond line. EBC is an ytterbium disilicate environmental barrier, and ABR is a sacrifice layer (abradable) based on porosity-induced ytterbium disilicate. Adapted from Ref. [9].
Metals 15 00328 g001
Figure 2. TGO formed underneath vertical cracks and from the coating edges. Reprinted from Ref. [4].
Metals 15 00328 g002
Figure 3. TGO thickness as a function of time at two different temperatures.
Metals 15 00328 g003
Figure 4. Elements at the edges of the BND first affected by TGO.
Metals 15 00328 g004
Figure 5. Neighbor elements of a failed element of the edge starting to be affected by TGO damage.
Metals 15 00328 g005
Figure 6. Specimen used to assess the vertical cracking damage model.
Metals 15 00328 g006
Figure 7. Heat fluxes (HF1, HF2, HF3) applied to the thermal model to match the temperature fields observed during the burner test in [30].
Metals 15 00328 g007
Figure 8. Steady-state nodal temperature (NT11) field in the mid-section of the EBC (the temperature values are reported in °C).
Metals 15 00328 g008
Figure 9. Stress model boundary conditions and loads.
Metals 15 00328 g009
Figure 10. Worst principal stress plot at the end of cooling. Simulations with and without creep (the stress components are reported in MPa).
Metals 15 00328 g010
Figure 11. Final stress equilibrium after 3 cycles (the stress components are reported in MPa).
Metals 15 00328 g011
Figure 12. Damage variable for the central part of the EBC. (The mid-portion of the specimen is shown. At the top surface, a damage distribution (max value 0.9) is registered).
Metals 15 00328 g012
Figure 13. (a) Damage surface calibration; (b) average crack depth calibration.
Metals 15 00328 g013
Figure 14. FE model with a 0.1 mm BND layer added (in white). This is to consider TGO damage.
Metals 15 00328 g014
Figure 15. Worst principal stress at t = 0. The BND edge is undamaged (the stress components are reported in MPa).
Metals 15 00328 g015
Figure 16. Out-of-plane shear at t = 0. The BND edge is undamaged (the stress components are reported in MPa).
Metals 15 00328 g016
Figure 17. Worst principal stress at t = 650 h. BND edge with a 0.01 mm TGO (the stress components are reported in MPa).
Metals 15 00328 g017
Figure 18. Out-of-plane shear at t = 650 h. BND edge with a 0.01 mm TGO (the stress components are reported in MPa).
Metals 15 00328 g018
Figure 19. Worst principal stress at BND edge with a 0.02 mm TGO (the stress components are reported in MPa).
Metals 15 00328 g019
Figure 20. Out-of-plane shear at BND edge with a 0.02 mm TGO (the stress components are reported in MPa).
Metals 15 00328 g020
Table 1. Material properties of the CMC substrate.
SymbolDescription20 °C1300 °C
ρ [Mg/mm3]Density 2.8 × 10−92.8 × 10−9
Ex [MPa]Stiffness in x direction345,000320,850
Ey [MPa]Stiffness in y direction345,000320,850
Ez [MPa]Stiffness in z direction251,850193,601
vxyPoisson’s ratio xy0.150.15
vxzPoisson’s ratio xz0.150.15
vyzPoisson’s ratio yz0.150.15
Gxy [MPa]Shear modulus xy151,800141,174
Gxz [MPa]Shear modulus xz110,000102,300
Gyz [MPa]Shear modulus yz110,000102,300
αx [1/°C]Coefficient of thermal expansion in x3.9 × 10−64.6 × 10⁻⁶
αy [1/°C]Coefficient of thermal expansion in y3.9 × 10−64.6 × 10⁻⁶
αz [1/°C]Coefficient of thermal expansion in z4.1 × 10−64.8 × 10⁻⁶
kx [mW/mm/K]Thermal conductivity—x4534
kx [mW/mm/K]Thermal conductivity—y4534
kx [mW/mm/K]Thermal conductivity—z3325
Cp [mJ/Mg/K]Specific heat5.5 × 1086 × 108
Table 2. Material properties of the EBC.
SymbolDescription20 °C1300 °C
ρ [Mg/mm3]Density5.6 × 10−95.6 × 10⁻⁹
E [MPa]Stiffness150,000120,000
vPoisson’s ratio0.20.2
α [1/°C]Coefficient of thermal expansion3.5 × 10−65.5 × 10⁻⁶
k [mW/mm/K]Thermal conductivity [mW/mm/K]21.5
Cp [mJ/Mg/K]Specific heat5.5 × 1086.08 × 108
Table 3. Creep properties of the EBC.
Power Law MultiplierEq. Stress OrderTime Order (Time in Hours)Temperature [°C]
5.15 × 10−101.04−0.45800
4.96 × 10−91.04−0.45900
2.01 × 10−81.04−0.451000
4.40 × 10−81.04−0.451100
2.35 × 10−71.04−0.451200
1.43 × 10−71.04−0.451300
1.67 × 10−61.04−0.451400
Table 4. Material properties of the BND.
SymbolDescription20 °C1300 °C
ρ [Mg/mm3]Density3 × 10−92.93 × 10⁻⁹
E [MPa]Stiffness97,00089,046
vPoisson’s ratio0.210.21
α [1/°C]Coefficient of thermal expansion3.5 × 10−65 × 10−6
k [mW/mm/K]Thermal conductivity [mW/mm/K]2015
Cp [mJ/Mg/K]Specific heat7 × 1087.7 × 108
Table 5. Creep properties of the BND.
Power Law MultiplierEq. Stress OrderTime Order (Time in Hours)Temperature [°C]
6.19 × 10−101.04−0.45800
5.95 × 10−91.04−0.45900
2.41 × 10−81.04−0.451000
5.28 × 10−81.04−0.451100
2.35 × 10−81.04−0.451200
1.71 × 10−71.04−0.451300
2.01 × 10−61.04−0.451400
Table 6. Structural properties of TGO (relevant for a Stress Implicit Analysis).
SymbolDescription20 °C1300 °C
E [MPa]Stiffness35,00032,550
vPoisson’s ratio0.170.17
α [1/°C]Coefficient of thermal expansion1 × 10−51 × 10−5
Table 7. Values of damage parameters used for the pseudo-cohesive simplified approach.
εiεuEf
0.0010.0020.2
Disclaimer/Publisher’s Note: The statements, opinions and data contained in all publications are solely those of the individual author(s) and contributor(s) and not of MDPI and/or the editor(s). MDPI and/or the editor(s) disclaim responsibility for any injury to people or property resulting from any ideas, methods, instructions or products referred to in the content.

