Abstract
The aim of the research was to study the torrefaction processes of wood biomass, compare the product characteristics at different torrefaction temperatures, and assess both moisture adsorption on raw and torrefied samples, as well as metal (Cu(II) and Ni(II)) adsorption on torrefied biomass. The novelty of the research was to investigate whether the presence of adsorbed metals in torrefied biomass significantly affects the energetic properties of the torrefied biomass, compared to torrefied biomass without metals. First, wood samples were torrefied at temperatures of 250 °C, 350 °C, and 400 °C. Following torrefaction, thermogravimetric analysis (TGA) was performed to evaluate mass loss and thermal stability. Next, changes in surface functional groups were examined, and higher heating values (HHV) were measured to assess the energy content. The results showed that torrefaction significantly increased the hydrophobicity of the biomass, leading to reduced moisture adsorption and enhanced material properties. Additionally, the adsorption of Cu(II) and Ni(II) ions on torrefied biomass was investigated. The results showed that the adsorption efficiency for Cu(II) was higher, reaching 62.4%, compared to Ni(II) at 21.2%. The adsorption process followed a pseudo-second-order kinetic model, which indicated that chemisorption was the dominant mechanism.
1. Introduction
Adsorption is the process in which a substance (gas, liquid, or solid) binds to the surface of another substance. It involves two components: the adsorbate and the adsorbent. The adsorbate is the substance that binds to the surface of the adsorbent, such as gases like H2, N2, and O2, or materials like charcoal, silicone gel, and aluminum oxide [1]. By altering the properties of the liquid phase, such as concentration, temperature, or pH, adsorbed substances can be released back from the surface into the liquid phase in a process known as desorption [2]. Adsorption can be classified into two types: physical and chemical. If the attractive forces between the adsorbate and the adsorbent result from chemical bonding, the process is called chemical adsorption or chemisorption. If the interaction is physical, it is referred to as physical adsorption or physisorption. Adsorption has a wide range of applications, including in metallurgy, ion exchange, water treatment, and moisture removal. The adsorption process can be modeled using various kinetic models, including the pseudo-first-order reaction, pseudo-second-order reaction, Weber–Morris model, and the Elovich model [3].
The presence of Cu(II) in water is a concern due to its common occurrence in various industrial processes, while the electroplating industry is one of the major sources of Ni(II) pollution [4]. Both Cu(II) and Ni(II) can pose significant health risks at elevated concentrations, with the WHO setting tolerable levels at 2 mg/L and 20 µg/L, respectively, for drinking water [5]. Interestingly, leachate residues from processing deep-sea nodules have been found to be effective adsorbents for heavy metals like Cu(II) and Ni(II). However, adsorption is most effective when carried out at normal temperatures. In mixed systems containing multiple metals, adsorption capacity tends to be lower compared to systems with individual metals. Additionally, the high concentration of ions like K+, Na+, Ca2+, and Mg2+ in water can compete with metal cations, reducing the efficiency of metal ion adsorption [3].
Biomass, while a renewable energy source, presents several challenges due to its high moisture and oxygen content, low energy density, hydrophilic nature, and heterogeneity. These characteristics lead to high energy consumption during grinding and pelletizing, low combustion temperatures, inefficient combustion, and the production of smoke and flue gases. The hydrophilic nature of biomass also creates storage issues as it is prone to biodegradation. These disadvantages impact its energy density and stability. Therefore, pre-treatment methods are required to enhance its properties and make biomass more efficient for use. The conversion of biomass has garnered increasing attention from researchers due to the significant improvements in its properties when compared to raw biomass [6]. Among the various methods, torrefaction has emerged as an effective process.
Torrefaction is a controlled carbonization process that transforms biomass into a product with properties similar to coal. This process involves heating biomass to temperatures ranging from 200 °C to 300 °C in an oxygen-free environment or in the presence of minimal oxygen. Nitrogen is typically used as a carrier gas to maintain a non-oxidizing atmosphere [7]. During torrefaction, hemicellulose decomposes, releasing water, CO2, CO, and various organic acids. As a result, the mass of the biomass is reduced by approximately 30%, and its energy density or heating value is decreased by around 20% [8]. Thermal methods at temperatures below 200 °C are generally used for wood preservation, while higher temperatures, as in torrefaction, are used for energy purposes.
In addition to temperature, the duration of the torrefaction process plays an important role as it can last anywhere from a few minutes to several hours. Torrefaction increases the hydrophobicity of biomass, making it more resistant to moisture adsorption and improving storage control. The reduction in water content also makes biomass lighter and less prone to decomposition [9]. With these enhanced properties, torrefied biomass requires less storage capacity and has the potential to reduce transport costs.
The research aimed to highlight the improved properties of torrefied biomass compared to raw wood, particularly in terms of hydrophobicity, energy content, and adsorption capacity. The study was divided into three main objectives:
- To examine the effect of temperature on the properties of torrefied biomass, with a focus on moisture adsorption differences between raw biomass and torrefied biomass at temperatures of 250, 350, and 400 °C. The study investigated how torrefaction influences mass loss, thermal stability, functional group composition, and higher heating values (HHV).
- To evaluate the hydrophobicity of torrefied biomass and identify the materials with the best adsorption properties. These materials were then tested for their ability to adsorb metals such as copper (Cu(II)) and nickel (Ni(II)) in model solutions.
- To assess the potential of torrefied biomass with adsorbed metals as an energy source. Specifically, the study investigated whether the presence of bound metals significantly affects the energy properties of the material, especially its higher calorific value.
2. Materials and Methods
2.1. The Torreefaction Process and Analyses
The whole torrefaction process involves five steps:
- Initial heating: Biomass is heated up to 100 °C.
- Pre-drying: The biomass is heated at a constant temperature of 100 °C to evaporate free water, continuing until a stable weight is achieved.
- Post-drying and intermediate heating: The biomass temperature rises to 200 °C. Weight loss can occur during this phase.
- Torrefaction: This phase begins when the temperature reaches 200 °C and ends when the biomass cools down again from a certain temperature to 200 °C. The torrefaction temperature is defined as the highest constant temperature. During this period, most of the biomass mass is lost.
- Cooling: The torrefied product is additionally cooled to the desired final temperature [10].
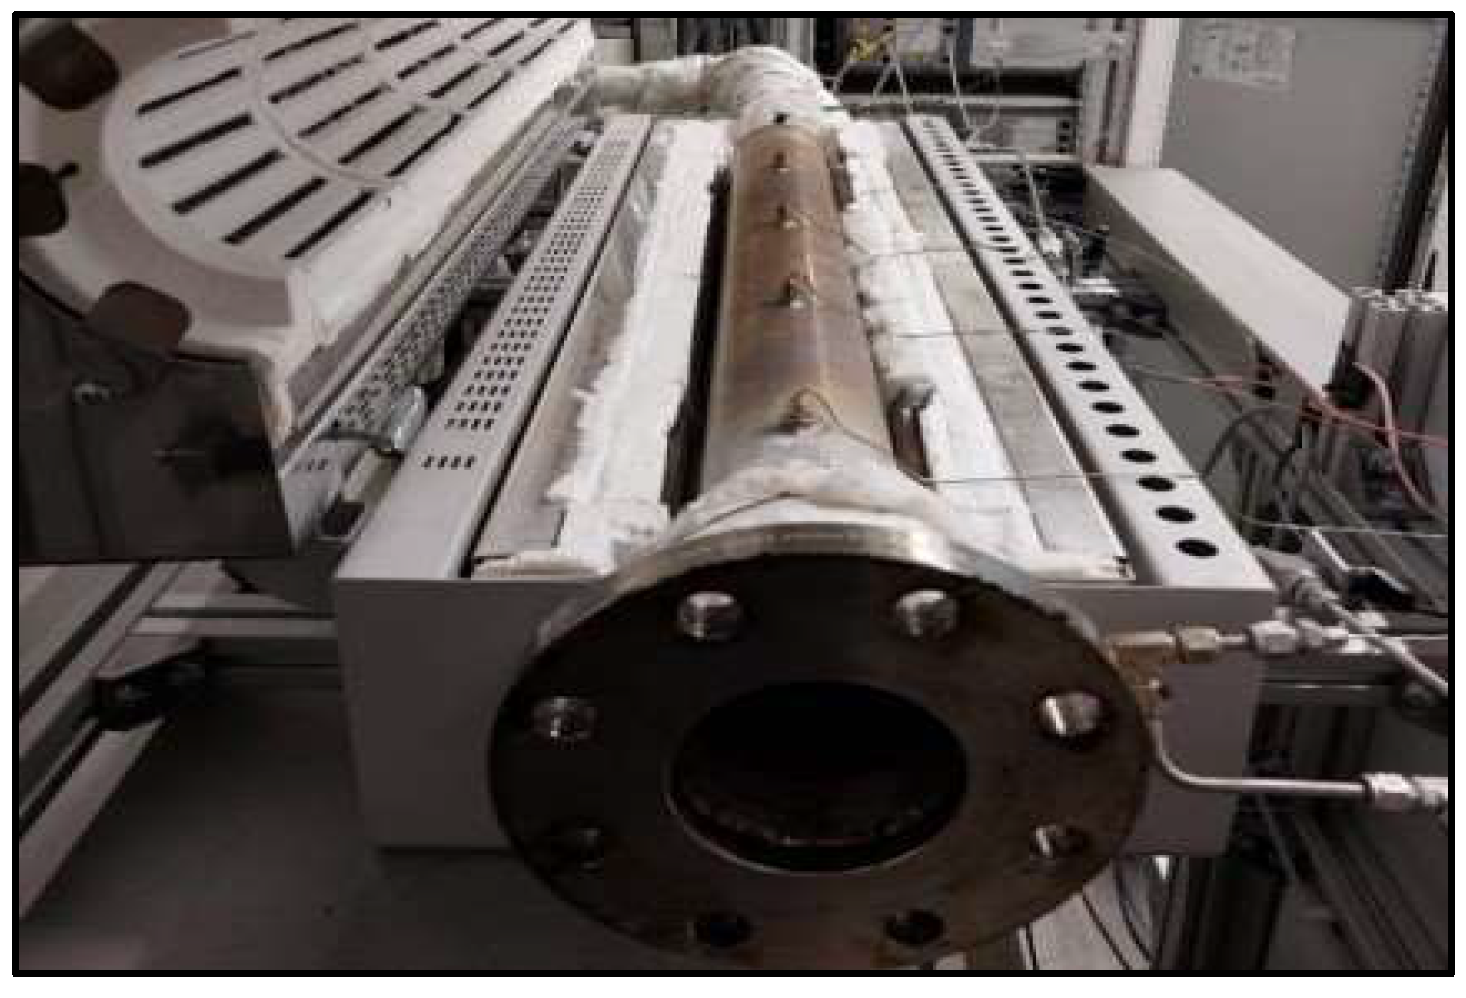
The torrefaction process was conducted using a Gradient Tube Furnace (Carbolite Gero, Bubsheim,,Germany) tube furnace equipped with a removable trough in the working tube. Sensors were placed on the working tube to monitor the temperature in each chamber (Figure 1). The samples underwent torrefaction at three different temperatures: 250 °C, 350 °C and 400 °C. The torrefaction was performed in a nitrogen atmosphere (N2, 3 L/min). The inlet gas was preheated to 50 °C. The duration of torrefaction under N2 atmosphere was determined based on the initial gas composition, whereas during the torrefaction process, gases are produced, and their concentration was analyzed with an ABB AO2020 gas analyzer (ABB, Zurich, Switzerland). The volume fractions of CO2, CO, CH4, and oxygen were measured. A cooled impinger train was installed upstream of the gas analyzer to ensure that the gas remains tar-free and dry.
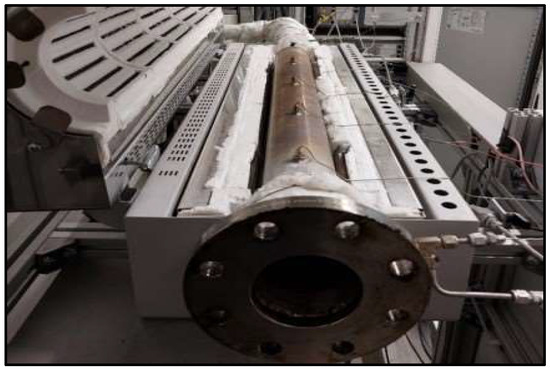
Figure 1.
Schematic presentation of the process.
The mass loss WL was calculated following Equation (1):
where
WL—mass loss (%);
m0—initial sample mass (g);
mk—final sample mass (g).
The ratio of energy density (EDR) and efficiency of energy EY was calculated according to Equations (2) and (3) [11]:
where
EDR—the ratio of energy density (%);
HHVtor—HHV of torrefied sample (MJ/kg);
HHVs—HHV raw sample (MJ/kg).
where
EY—efficiency of energy (%).
Thermogravimetric (TGA) and derivative thermogravimetric (DTG) analyses were performed. The TGA/DTG measurements were performed using Mettler Toledo TGA/DSC3+ (Mettler Toledo, Ljubljana, Slovenia) in oxygen atmosphere. The measurement was set as follows: the sample was heated from 30 °C to 105 °C with 20 K/min rate, then the heating was at a constant temperature of 105 °C for 5 min. Then, the temperature increased from 105 °C to 550 °C at 25 K/min rate. At 550 °C, the sample was heated for 20 min. Finally, the temperature was increased to 815 °C, and the sample was heated for 20 min at 25 K/min rate.
Infrared spectroscopy with Fourier transform (FTIR) was used to record the infrared absorption spectrum of a substance, and Fourier transform was used for data processing. The FTIR was determined using the NICOLET iS50 FT-IR apparatus (Omega, Ljubljana, Slovenia). The spectra of the samples were recorded using the classic ATR method, namely in the range from 400 cm–1 to 4000 cm–1.
The higher heating value (HHV) was determined using the IKA Isoperibol 6000 bomb calorimeter (Kefo, Ljubljana, Slovenia) according to the standardized method.
The Modular Humidity Generator was attached to Mettler Toledo TGA/DSC3+ for humidity control. Moisture adsorption was performed with four different samples, which included raw wood, as well as torrefied wood, at 250 °C, 350 °C, and 400 °C. Four measurement segments were set. The relative humidity was measured up to 30% for 90 min in the first segment, from 30% to 45% for 90 min in the second segment, from 60% for 90 min in the third segment, and up to 75% for 90 min in the last one. Moisture adsorption was performed at 30 °C 100 mL/min flow in nitrogen atmosphere.
2.2. The Adsorption of Cu(II) and Ni(II)
The sample used was wood torrefied at 400 °C, and adsorption of two metals, Cu(II) and Ni(II), was performed.
Two stock solutions of Cu(II) and Ni(II) ions (with concentration of 1 g/L) were obtained by dissolving exact amounts of high-purity CuSO4 (Merck, Darmstadt, Germany) and high-purity NiSO4 (Merck, Darmstadt, Germany) in 1 L of distilled water, respectively. The working solutions of 100 mL were obtained by diluting the appropriate amount of each stock solution with the Millipore water sample, in which the initial mass of adsorbent varied between 1 and 0.1 g (1 g, 0.5 g, 0.2 g in 0.1 g). The adsorption experiments were performed in 300-mL Erlenmeyer flasks with 100 mL of working solutions stirred by a magnetic stirrer at 250 rpm. All tests were conducted at room temperature (22.0 ± 1.0).
The samples for the analysis of metal content were collected at the beginning of the adsorption and then at different time intervals, of 30, 60, 120, and 1440 min, when equilibrium was reached. pH value change was followed. Prior to the analysis, the samples were filtered through glass fiber filters (0.45 µm). The metal content in the solutions was subsequently analyzed using a photometer PF-12 PLUS (Micro+Polo, Maribor, Slovenia).
The effect of contact time on the biosorption of Cu(II) ions caused by torrefied material was studied at an initial metal concentration of 50 mg/L (pH = 5), and the contact time increased from 0 min up to 180 min, based on the literature [12].
In our study, pseudo-first-order reaction and pseudo-second-order reaction were studied. Equation (4) shows pseudo-first-order reaction, while Equation (5) shows model’s pseudo-second-order reaction.
where
qe—amount of adsorbed matter in equilibrium (mg/g);
qt—amount of adsorbed matter at time t (mg/g);
k1—rate constant of pseudo-first-order reaction (1/min);
t—time (min).
where
k2—rate constant at pseudo-second-order reaction (g/(mg∙min));
Equations (6) and (7) show the calculation of adsorbed amount qt (mg/g) and adsorption efficiency E (%).
where
c0—initial concentration (mg/L);
ct—concentration at time t (mg/L);
mtore—mass of torrefied material (g);
V—volume of solution (mL).
Factors affecting metal adsorption are initial concentration, pH, temperature, and coexisting ions. The influence of the initial concentration is shown in a certain concentration range, where the adsorption capacity of heavy metals increases with the increase in the initial concentration until the carbon adsorbent reaches saturation. At lower pH values below 6, metal ions are usually in the cationic form, while at higher pH values above 9 they may appear in the anionic form. When the pH value is lower than the point of zero charge value where the zeta potential of adsorbents is equal to zero, there is a greater exchange of H+ ions with metal cations and an increase in the number of positive charges on the surface of carbon materials. In our previous work, the optimum pH value for Cu(II) and Ni(II) adsorption was determined to be pH = 5 [12].
After the adsorption, the samples of torrefied biomass together with the adsorbed Cu(II) and Ni(II) ions were torrefied once again in order to assess the energy properties of torrefied biomass with adsorbed metals compared with those of torrefied material without adsorbed metals.
3. Results
3.1. Torrefaction Process Results
Torrefaction of wood material was performed in the N2 atmosphere at temperatures of 250 °C, 350 °C, and 400 °C. The samples are seen in Figure 2. As the temperature increased, the color of torrefied material changed from light to dark, reflecting alternations in its chemical composition. Several chemical reactions occurred during torrefaction, including the degradation of the cellulose, hemicellulose, oxidation, and reduction processes of lignin, and the enzymatically controlled Maillard reaction [13]. The interaction between proteins and polysaccharides through the Maillard reaction can alter the structure of proteins and enhance the functional properties of the material. The oxidative reaction of extracts in wood contributed to the darkening of the material, indicating the progression of carbonization on the wood’s surface.

Figure 2.
Samples of wood: (a) raw; (b) torrefied at 250 °C; (c) torrefied at 300 °C; (d) torrefied at 400 °C.
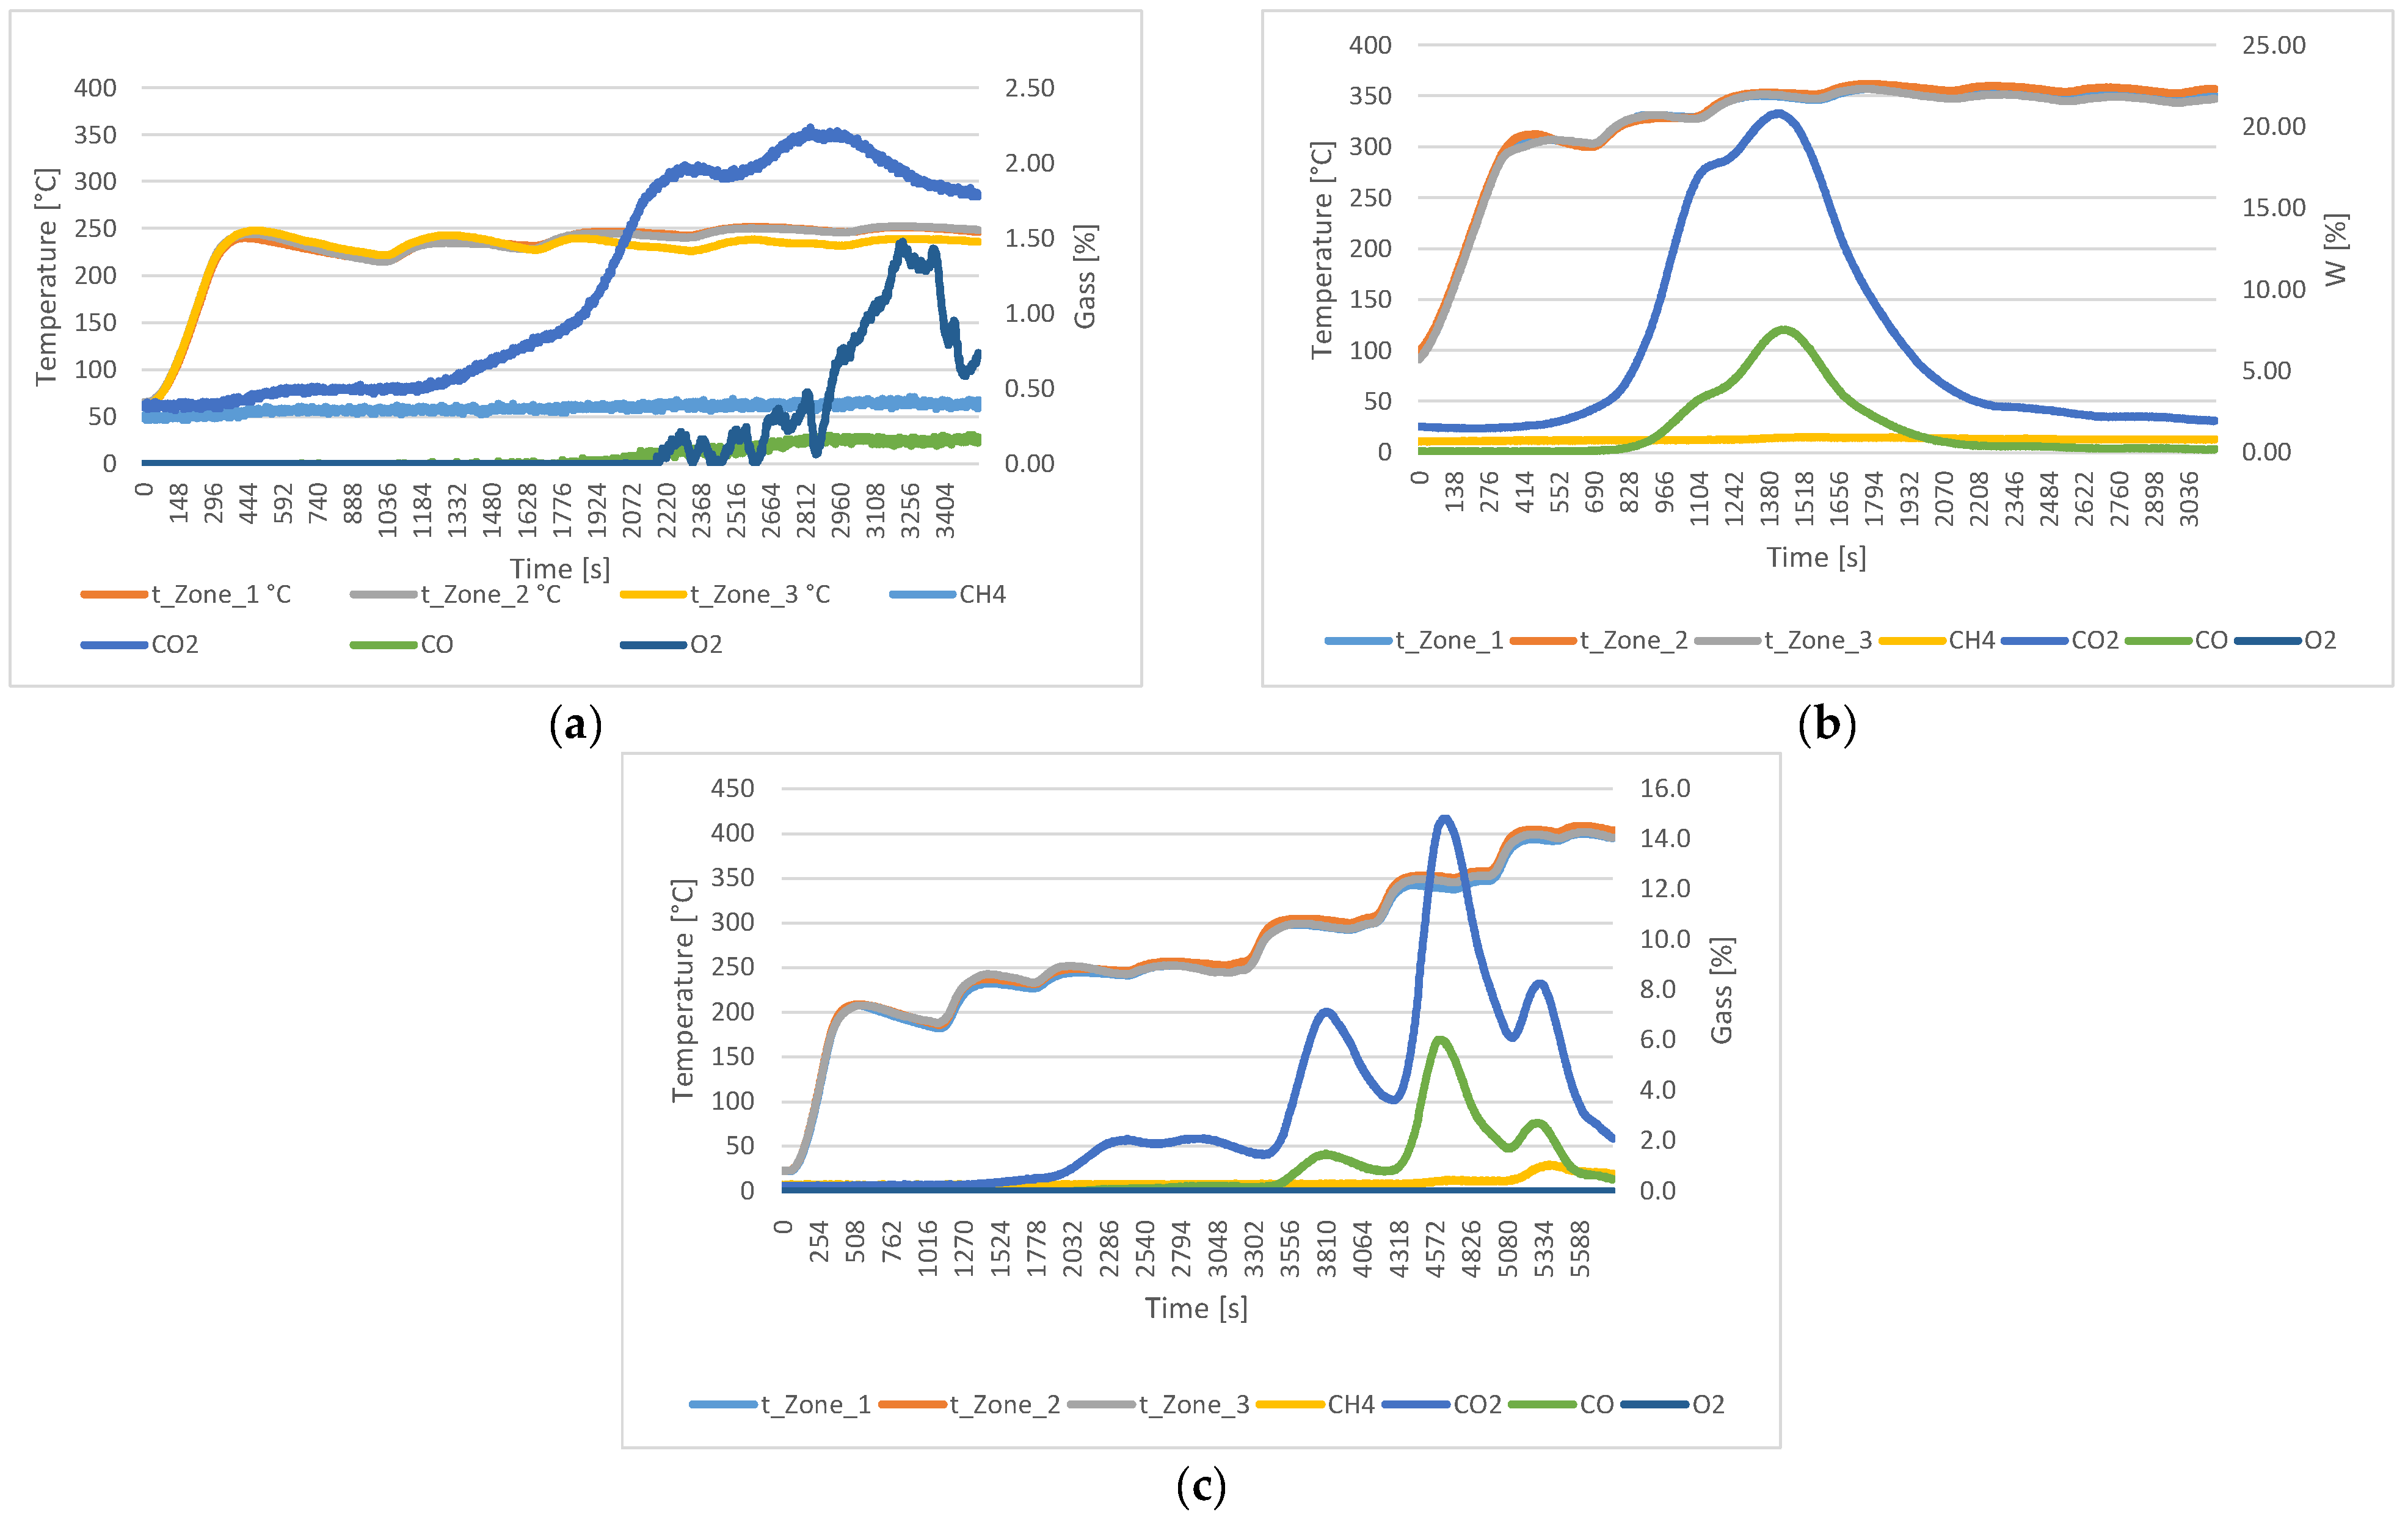
Figure 3 shows the gas analyses of torrefied material at different temperatures in N2 atmosphere with a flow rate of 3 L/min. The analyses of material torrefied up to 250 °C showed the highest production of CO2 (2.2%), while the oxygen release peaked at 1.5% after 53.8 min. Methane levels remained stable at 0.4%, and CO reached the maximum of 0.2%. In the material torrefied up to 350 °C, no oxygen was detected, while CO2 reached a maximum at 20.8%, and CO reached a peak of 7.5%. The analyses of material torrefied up to 400 °C showed that the CO2 remained the dominant gas at 14.8%, oxygen was not detected, methane reached 1.2%, and CO peaked at 6.0%.
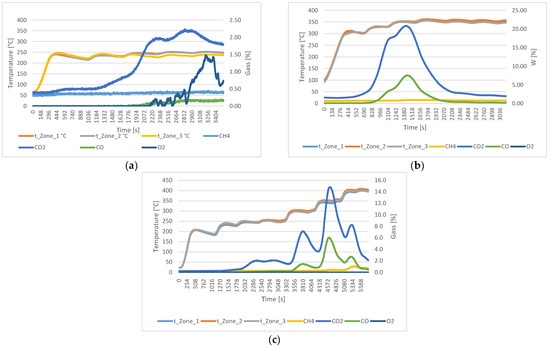
Figure 3.
Gas analyses of wood material in N2 atmosphere with 3 L/min flow at the following temperatures: (a) 250 °C; (b) 350 °C; (c) 400 °C.
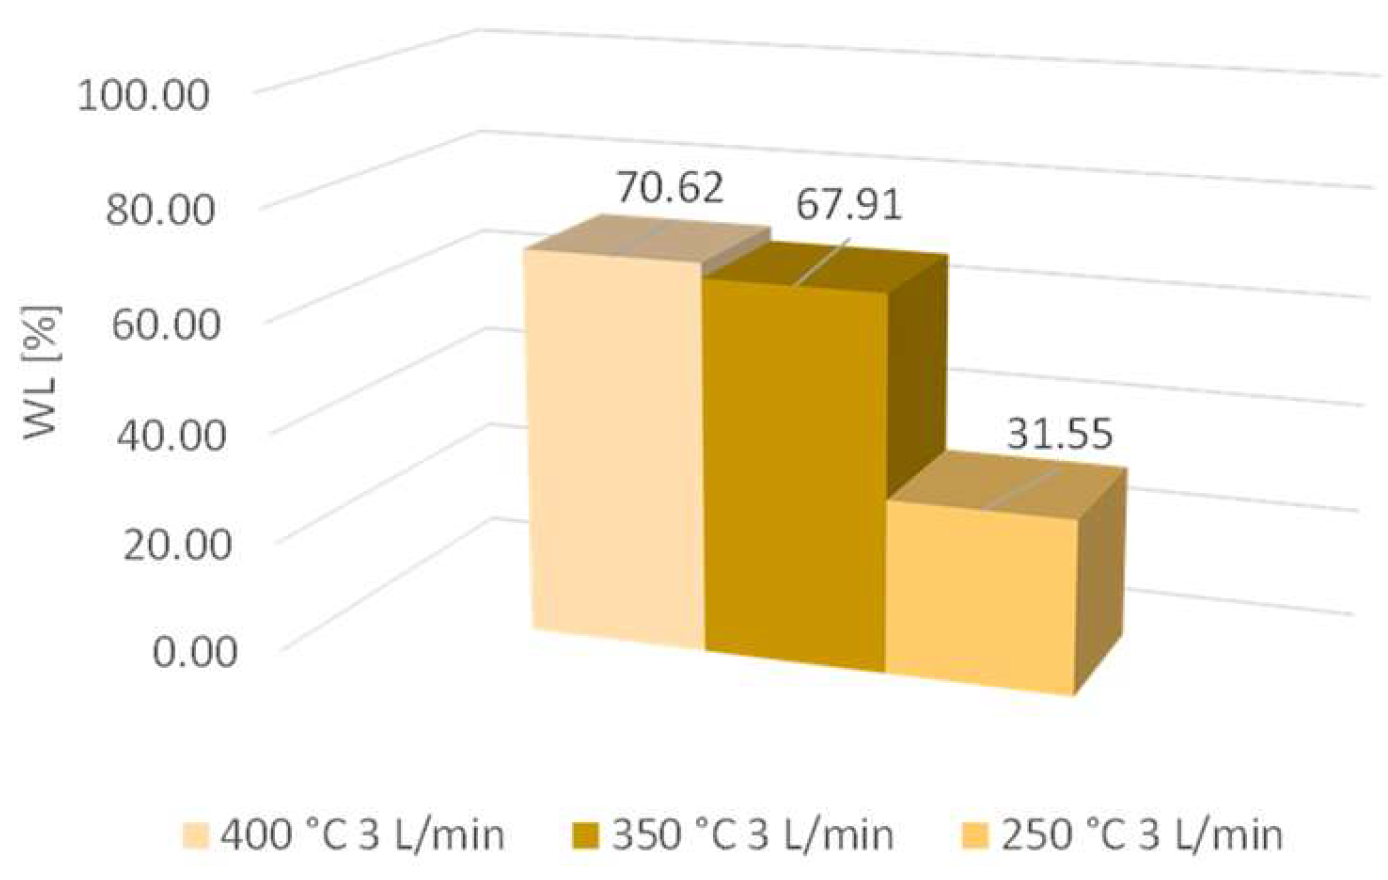
The results of mass loss (WL) at 250 °C, 350 °C, and 400 °C are shown in Figure 4.
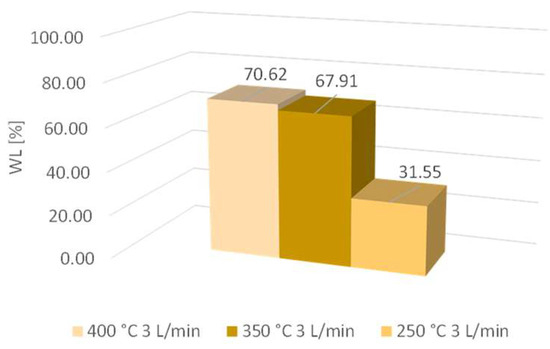
Figure 4.
Mass losses at 250 °C, 350 °C, and 400 °C.
As the sample mass increased, the mass loss also increased. The difference between mass losses at temperatures of 350 °C and 400 °C was very low; it was determined to be 2.7%. The difference between mass losses at 250 °C and 350 °C was much higher; it was determined to be 36.4%. Therefore, the temperature increased up to 350 °C and contributed to higher activity, while the decarbonization progress was higher compared to the lower temperature of 250 °C. The cellulose, as well as the hemicellulose, started to degrade at a temperature above 270 °C, and consequently, mass loss was higher at 350 °C [11].
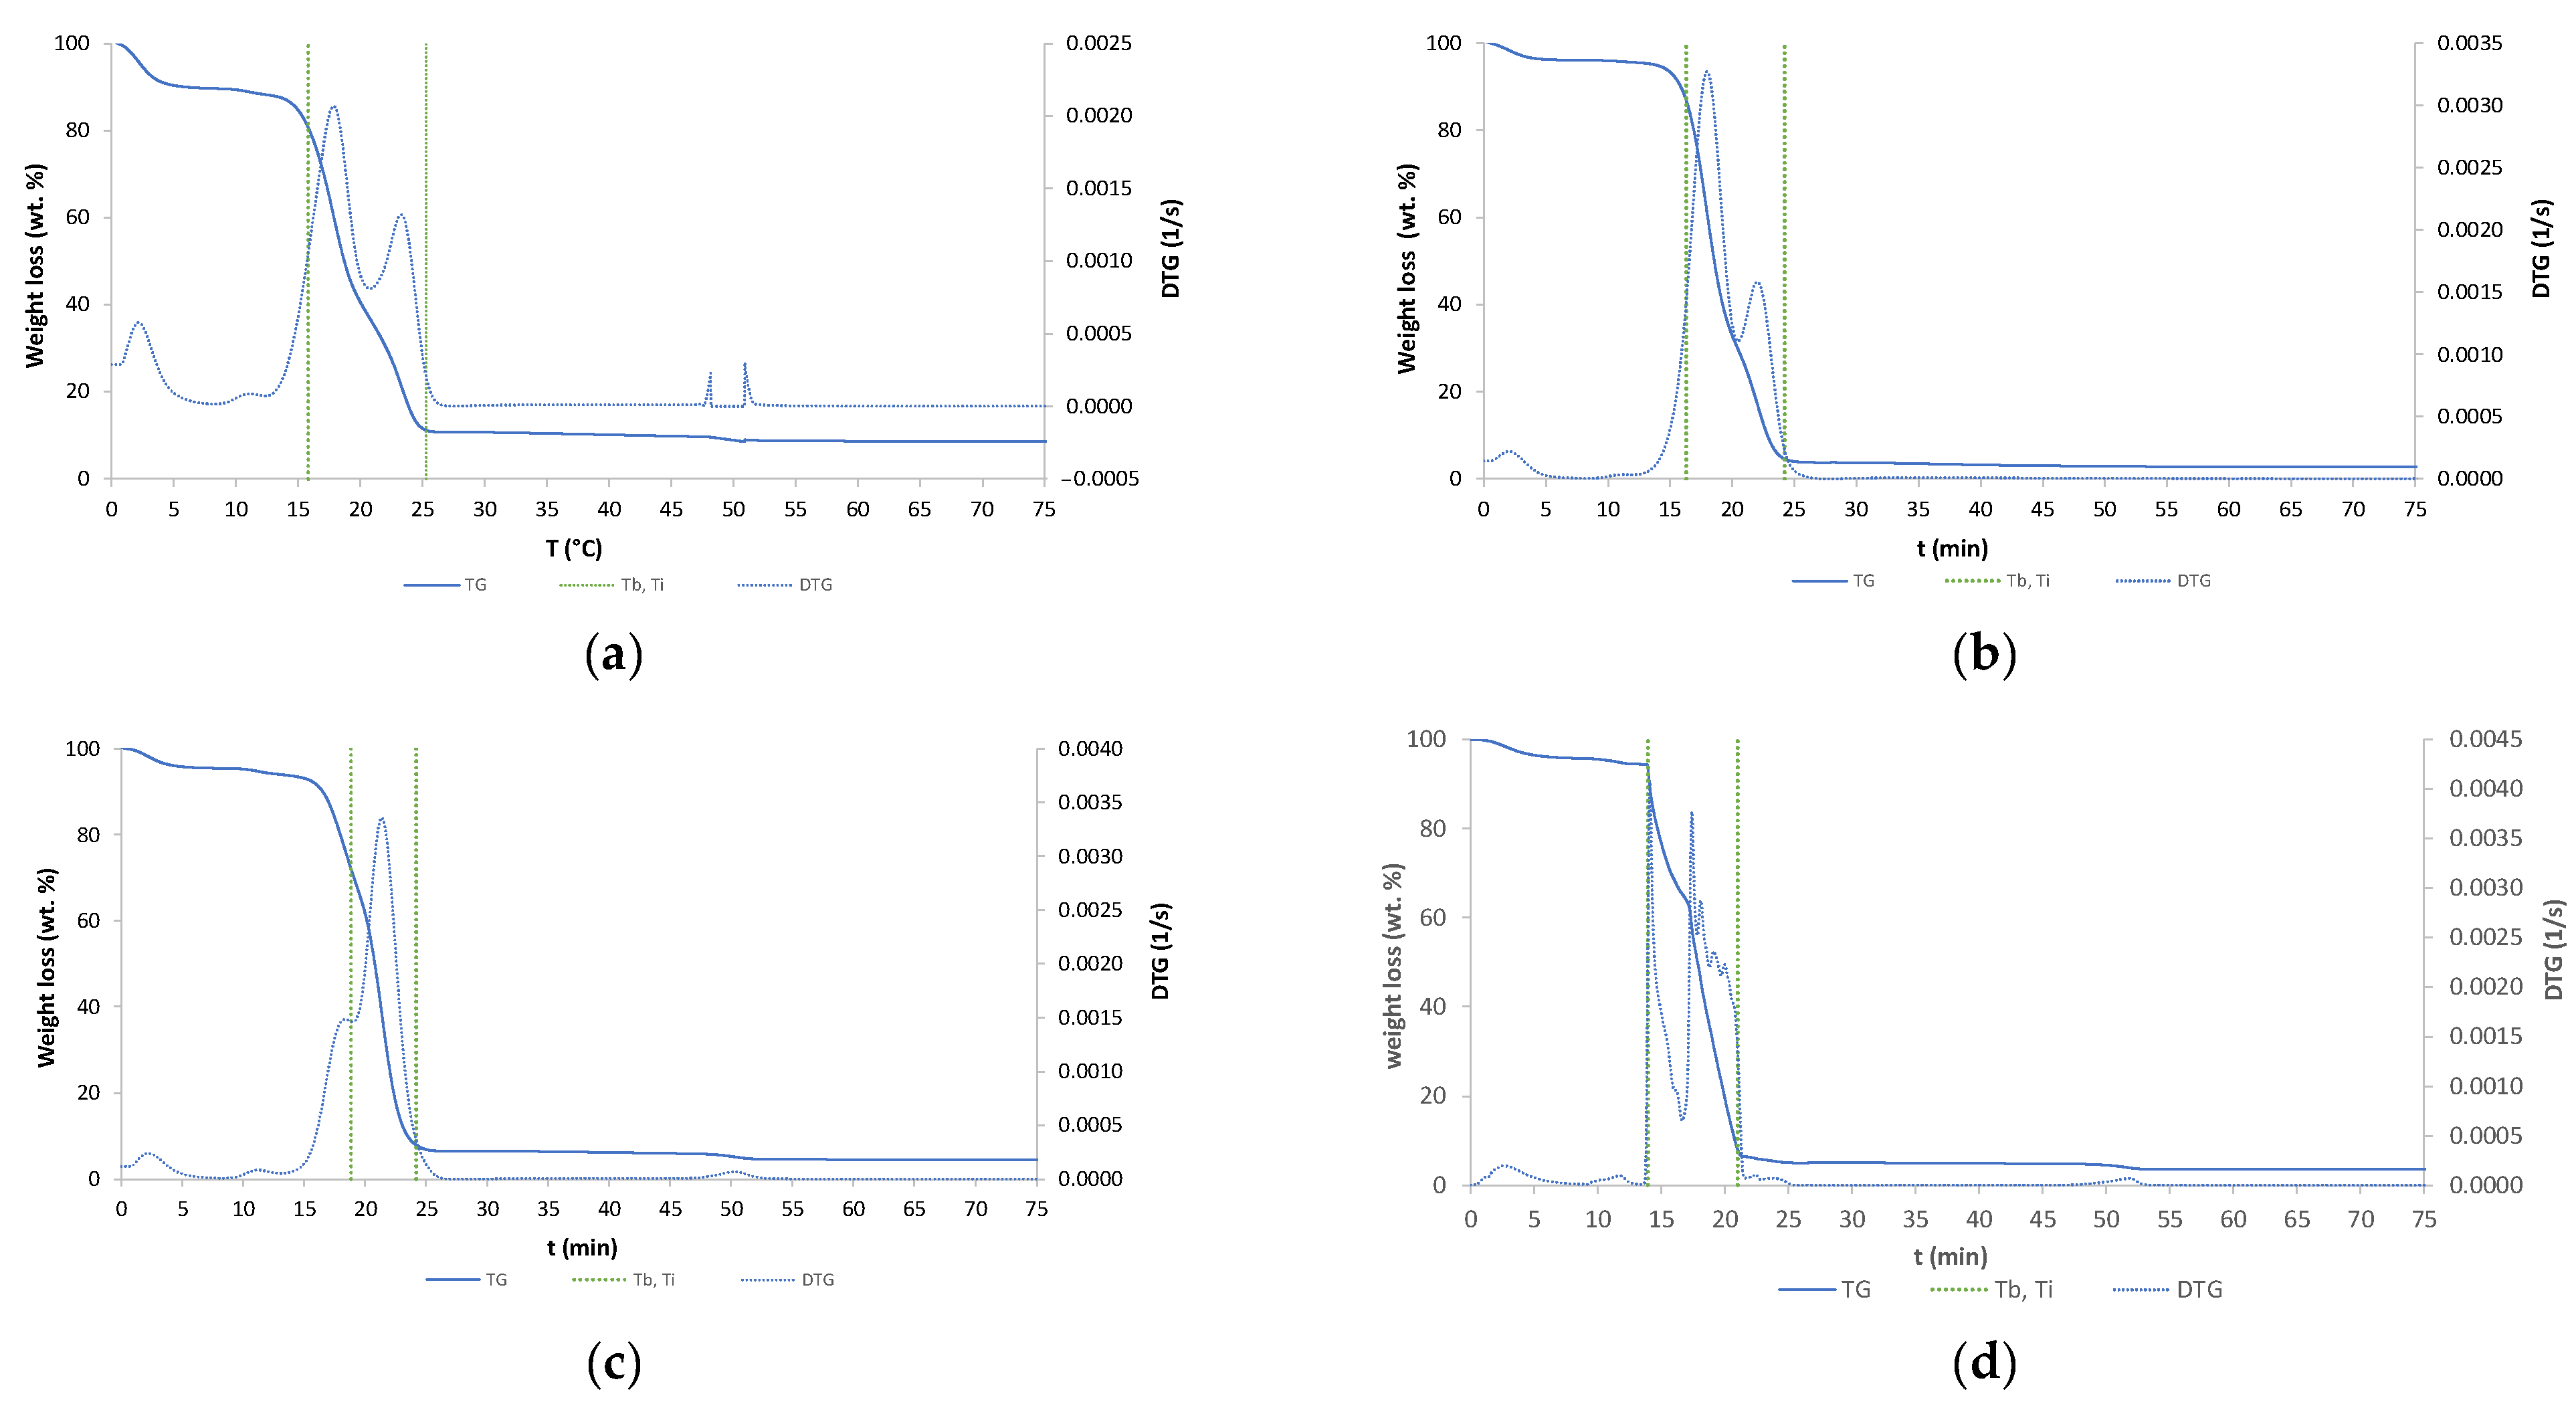
The TGA analysis results of six samples are shown in Figure 5. TG and DTG curves are seen in Figure 5. Ti represents the temperature of initial sample degradation, and Tb the temperature at the highest degradation rate.
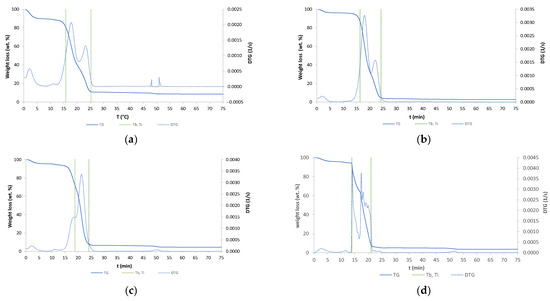

Figure 5.
TG and DTG curves: (a) raw wood; (b) wood torrefied at 250 °C; (c) wood torrefied at 350 °C; (d) wood torrefied at 400 °C; (e) wood torrefied at 400 °C with Cu(II); (f) wood torrefied at 400 °C with Ni(II).
DTG shows different numbers of peaks, different temperatures of combustion, and various shapes of peaks, which were found to be a difference between biochar and raw biomass. It can be concluded that structural changes appeared [14]. The highest difference between the torrefied material and raw biomass was detected at wood torrefied at 400 °C. First peaks are due to moisture loss of samples during dehydration process. The raw biomass showed huge moisture content, while the biochar content of moisture decreased with increased temperature. The mass loss of torrefied samples was higher compared to the raw wood biomass. The constant mass was reached in time intervals between 20 and 25 min. The temperature of onset of decomposition of the sample (Ti) demonstrates an increase with rising temperatures of reaction. The biochar with adsorbed nickel exhibits the highest Ti value of 399.63 °C, while the raw wood displays the lowest value of 282.52 °C. The temperature at the maximum rate of decomposition (Tb) is observed to decrease with increasing torrefaction temperature. Raw wood exhibits a Tb value of 524.34 °C, while wood torrefied at 400 °C displays a value of 440.69 °C. The presented TG and DTG curves were similar to those from the literature [15]. They found that cellulose degradation occurred first, followed by cellulose and lignin degradation.
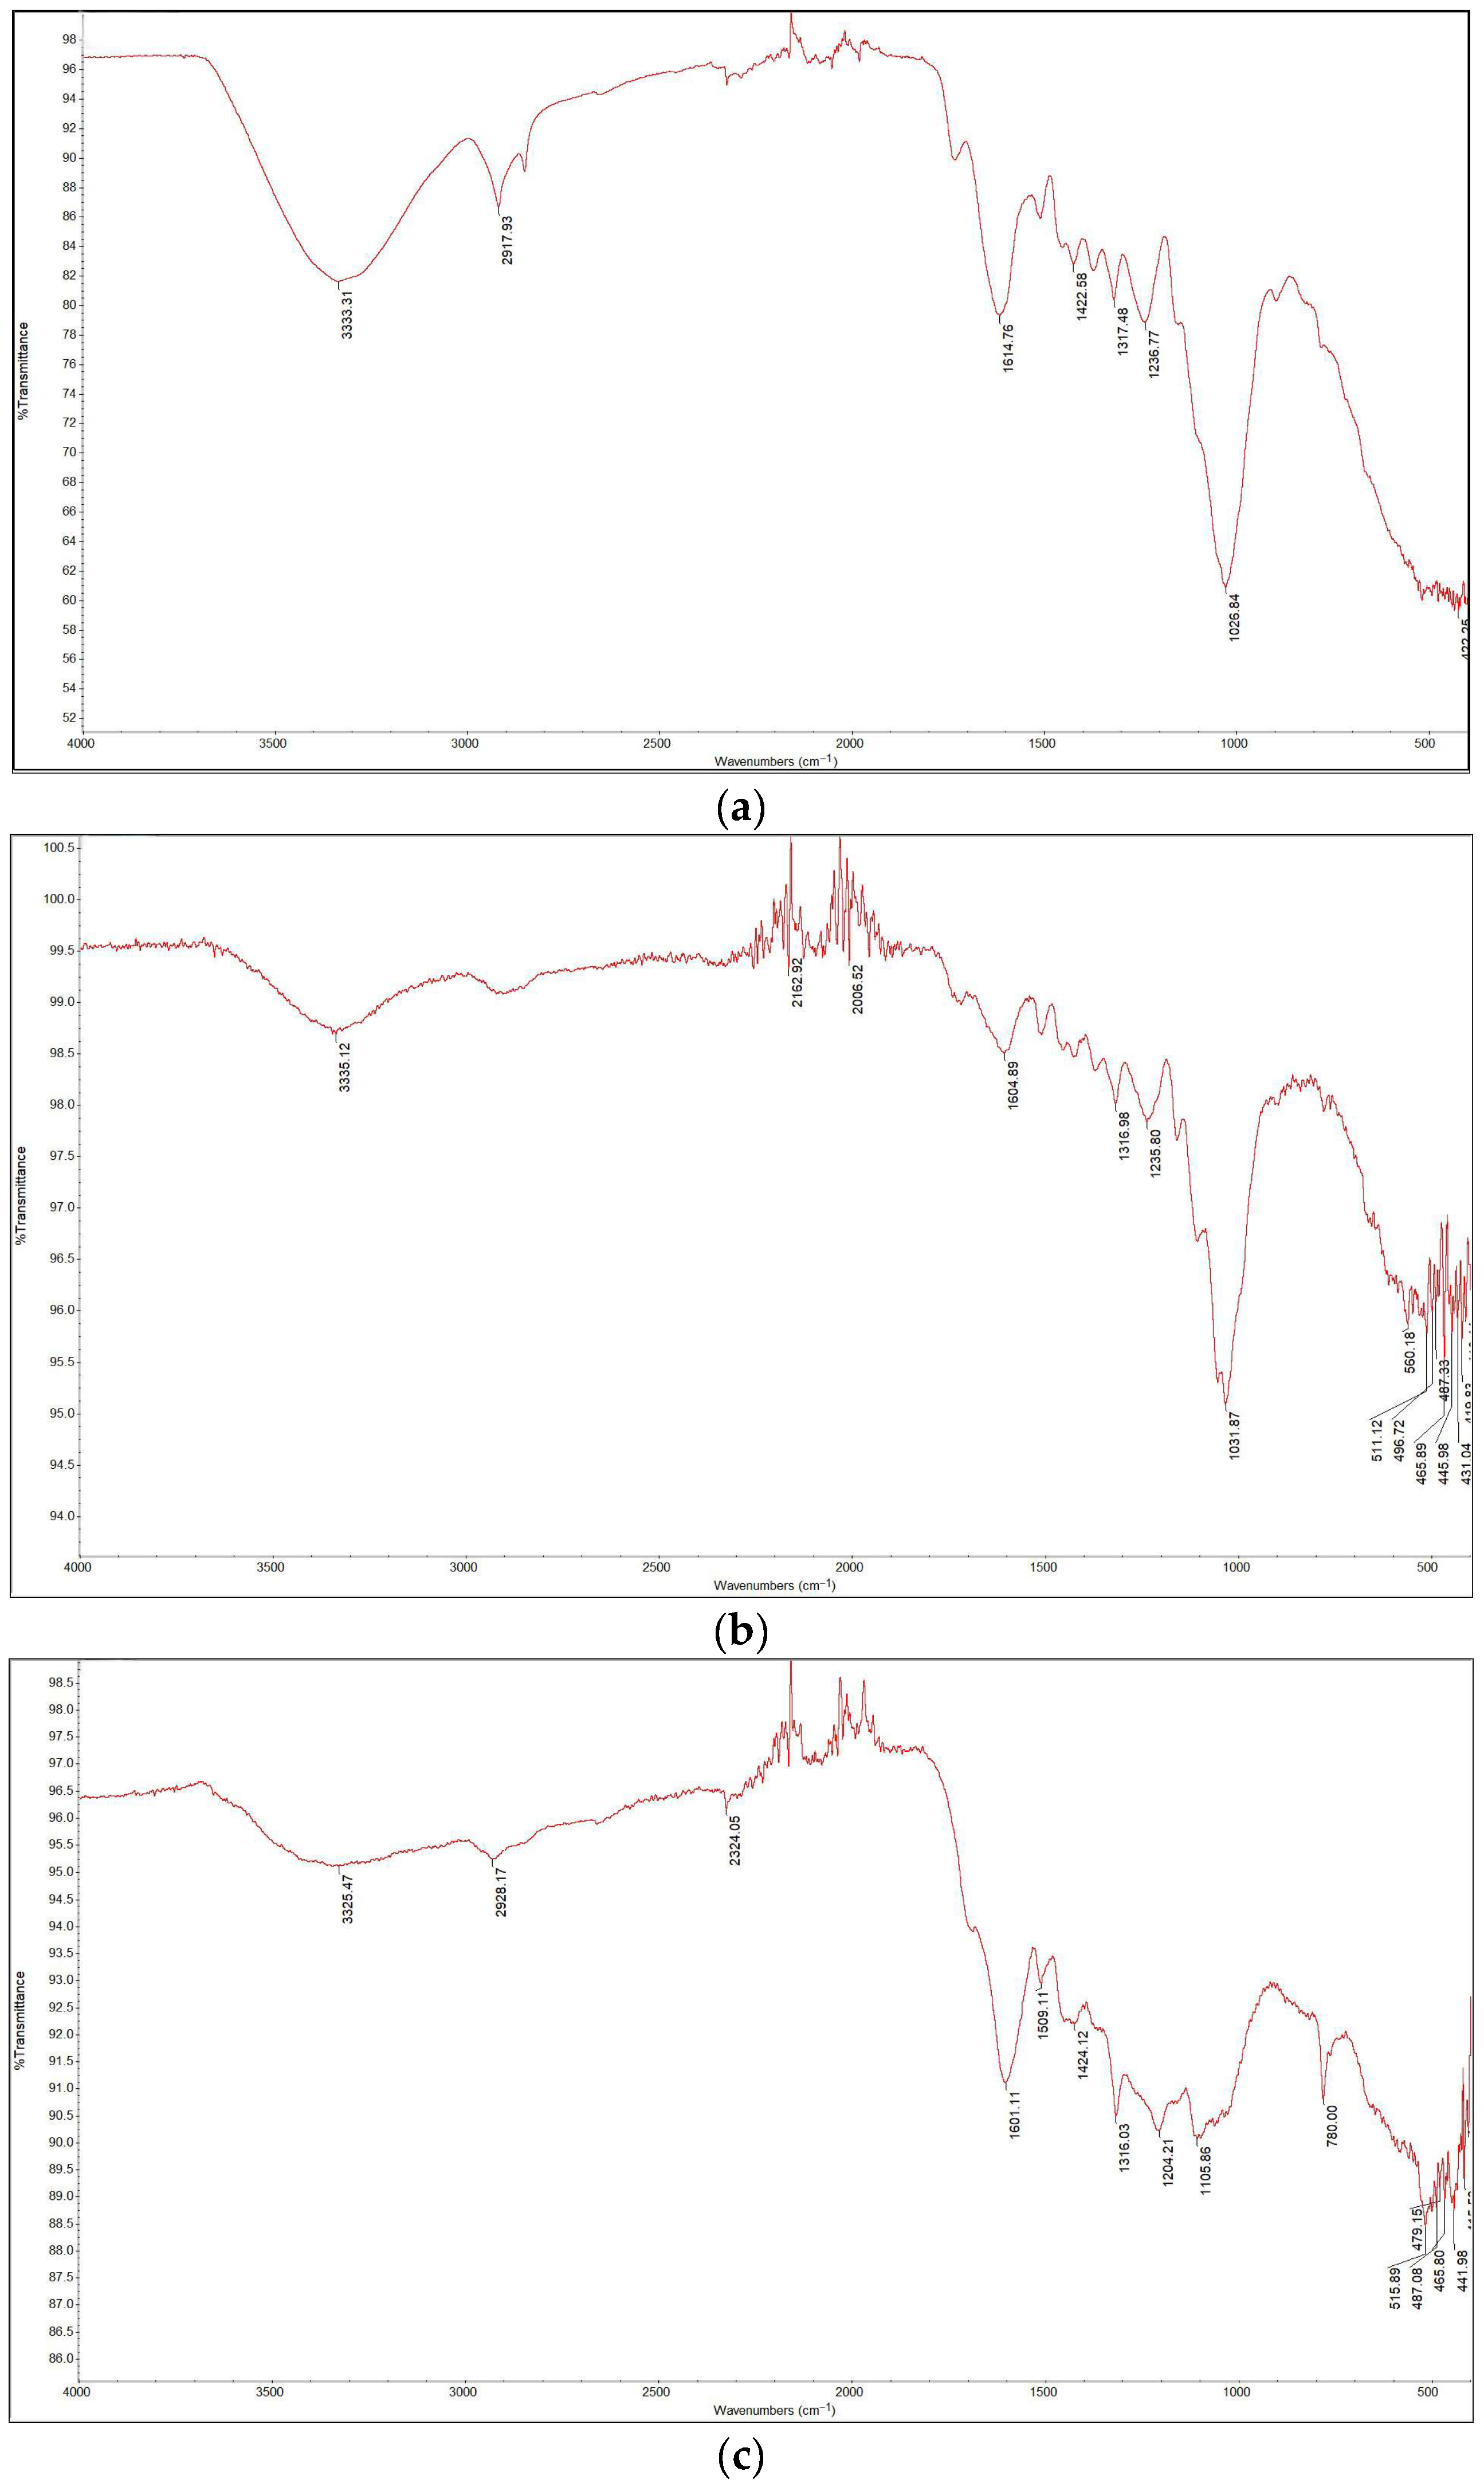
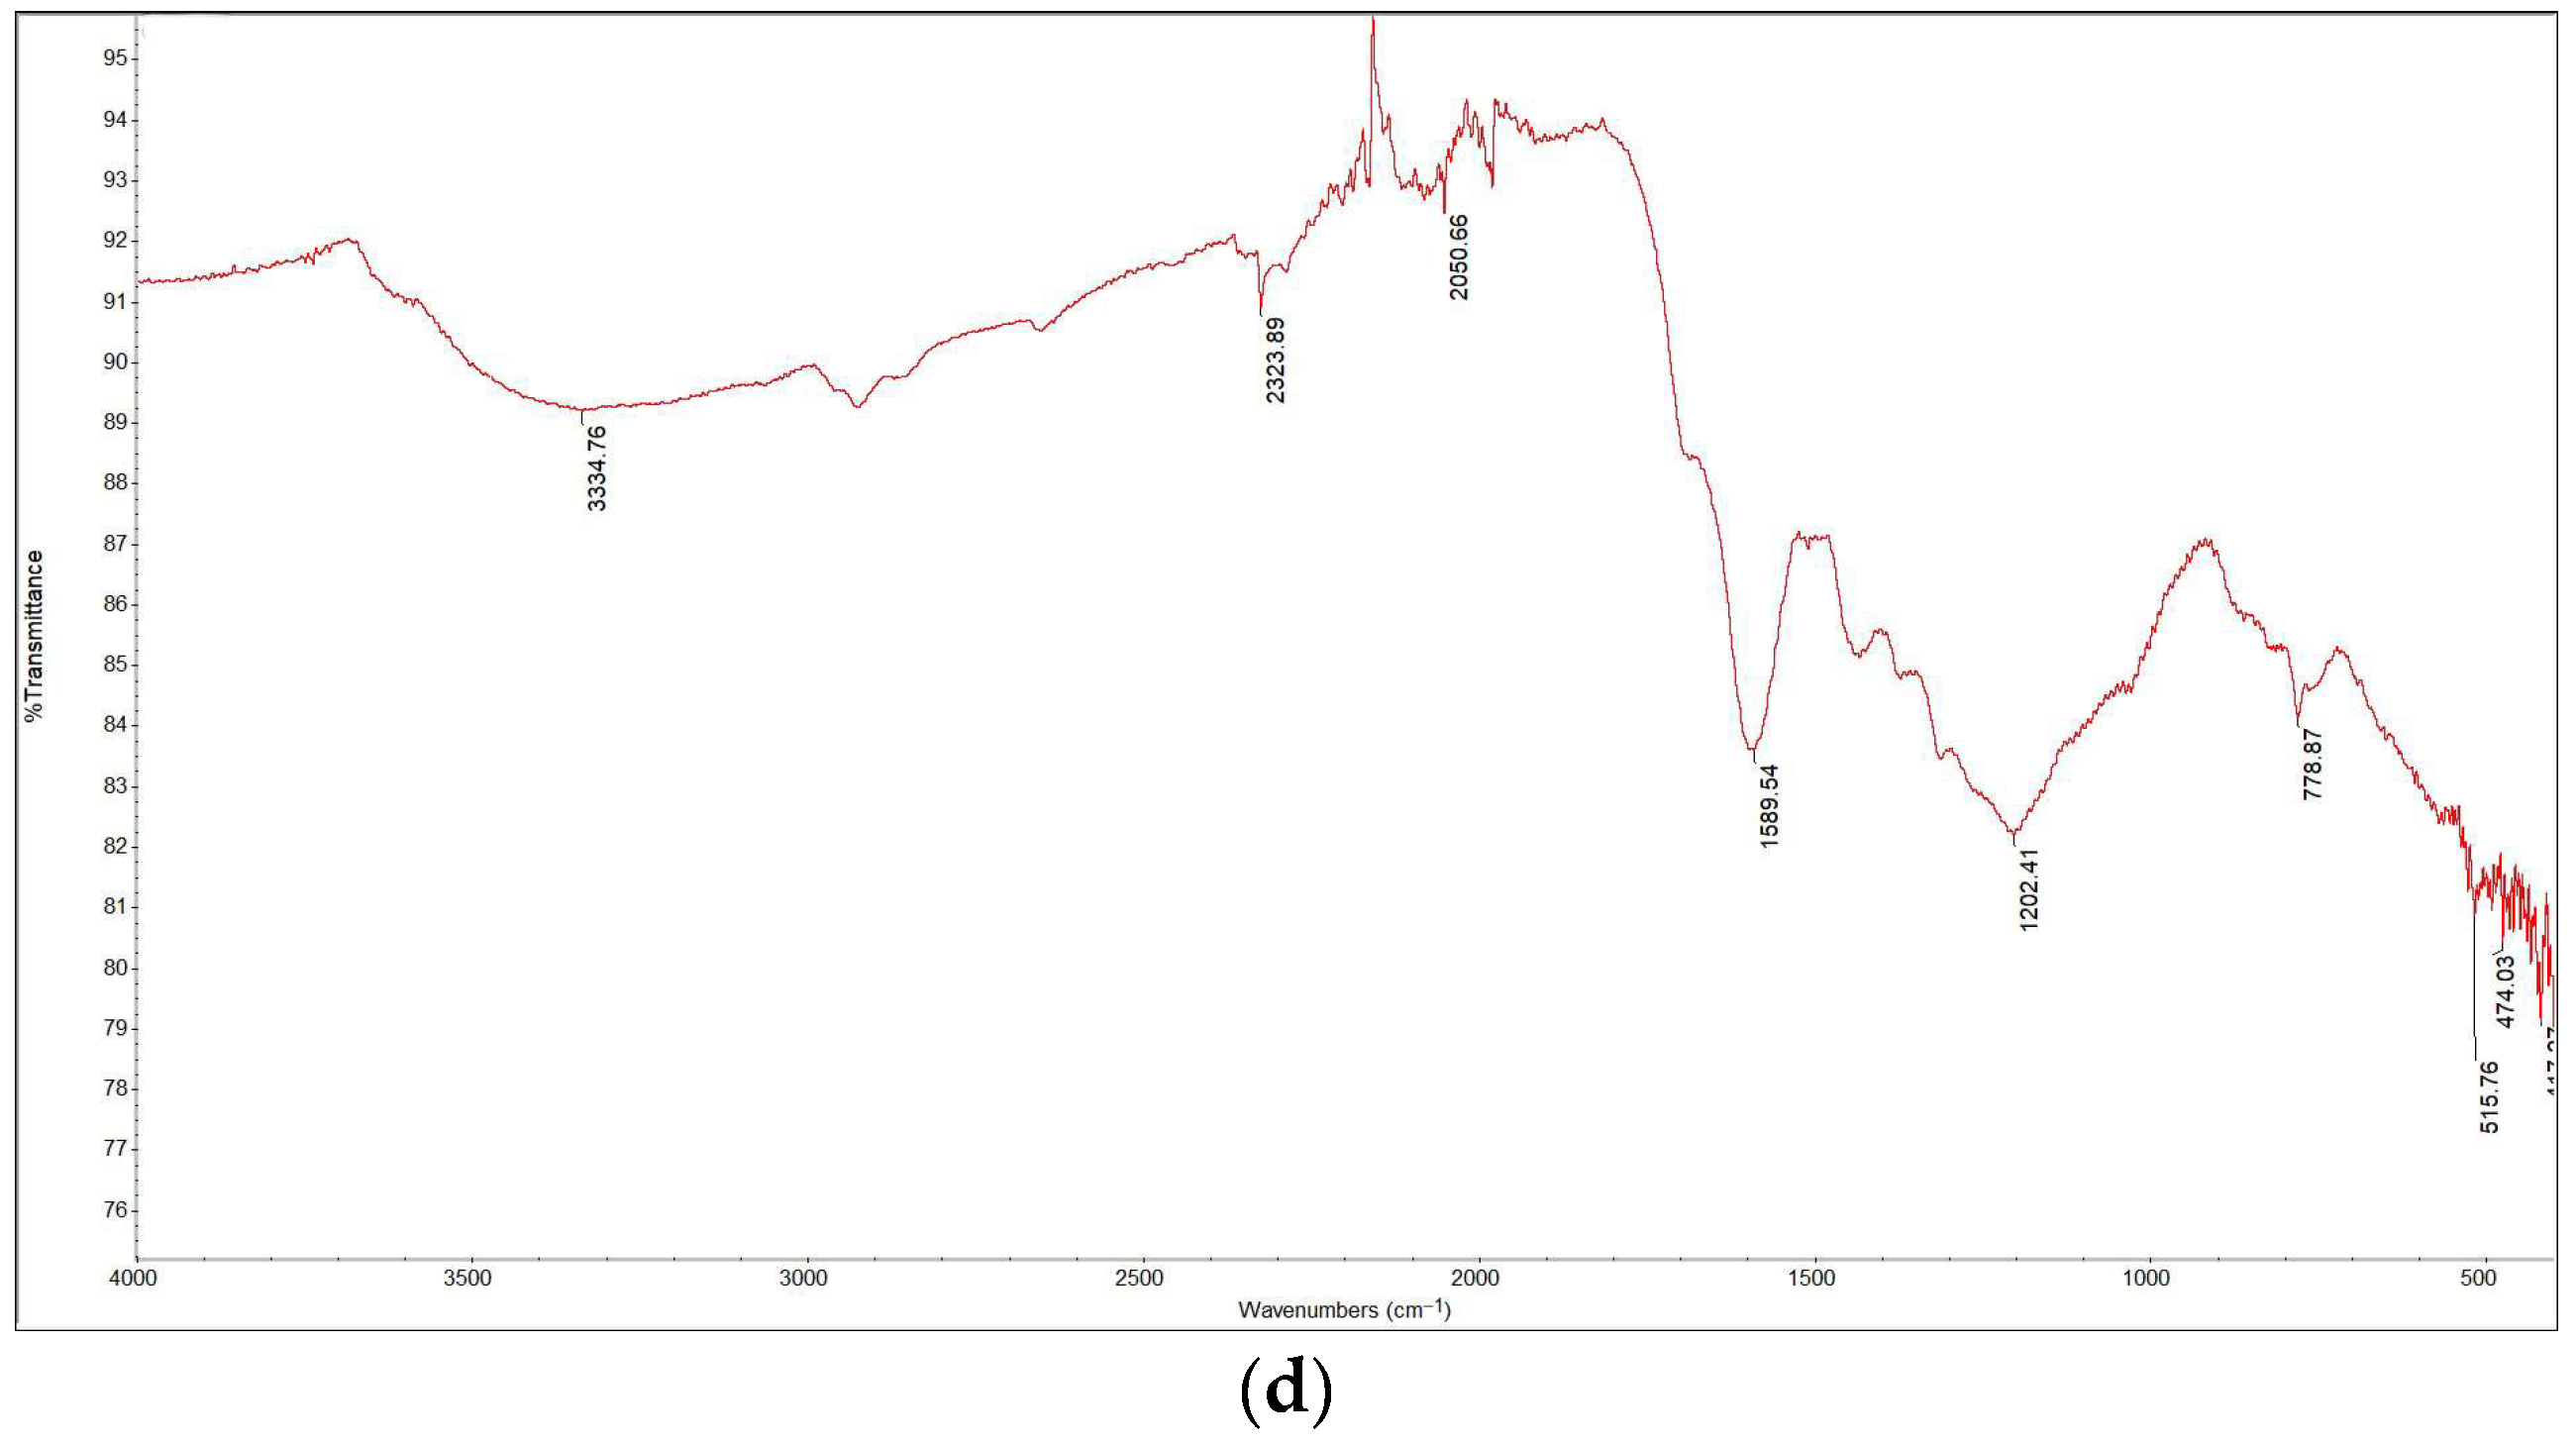
The FTIR spectra are presented in Figure 6. The spectrum of the sample torrefied at 250 °C closely resembled that of the raw biomass, as expected given that this was the lowest torrefaction temperature. The spectra for the samples containing Cu(II) and Ni(II) were also similar; by comparing the data with literature sources [2], various functional groups in the torrefied samples were identified. Functional groups such as O–H, C–H, and N–H were detected in all samples within the wavelength range of 2920 cm−1 to 3350 cm−1. Around 2300 cm−1, C≡O, C≡N, and X=C=Y bonds (where X and Y represent C, O, N, or S) appeared in all samples except for raw wood and wood torrefied at 250 °C. This suggests that torrefaction temperature significantly influences the presence of certain functional groups. Additionally, C=C, C–O (alcohols, esters, ethers, carboxylic acids), and C–N (amines) groups were detected in all samples within the 1175 cm−1 to 1615 cm−1 range. A prominent C–O band at 1022 cm−1, which is associated with cellulose and hemicellulose, showed decreasing intensity with increasing torrefaction temperature. These findings align with those of other studies [16,17].
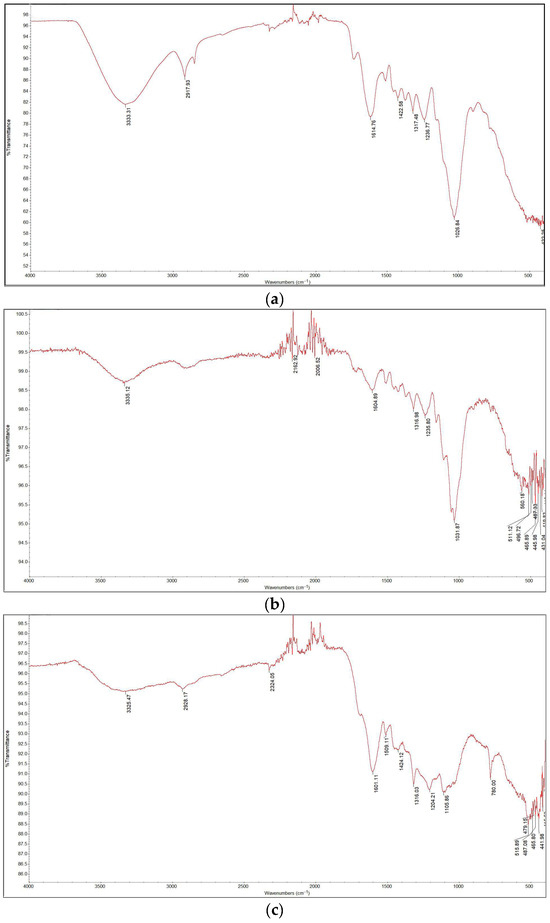
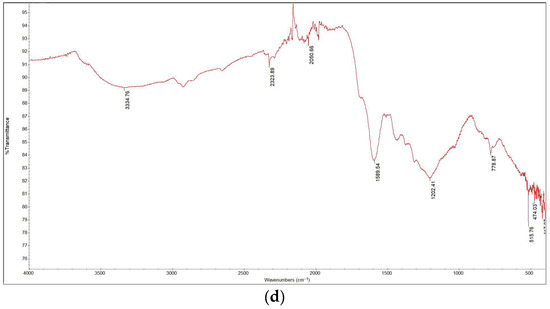
Figure 6.
FTIR analysis results: (a) raw wood; (b) wood torrefied at 250 °C; (c) wood torrefied at 350 °C; (d) wood torrefied at 400 °C.
The HHV results of calorimetric measurements and values of EDR, which were calculated according to Equation (2), and EY, which was calculated according to Equation (3), are presented in Table 1.

Table 1.
Values of HHV, EY, and EDR.
Raw wood had the lowest value among the higher heating values, which increased with increasing torrefaction temperature. Thus, temperature has a significant effect on HHV, and the obtained data were in accordance with the theoretical foundations of biomass torrefaction. During the torrefaction process, the content of oxygen and the proportion of volatile substances (mainly as bound water, CO2, and CO) decreased, which contributed to an increase in the amount of carbon and consequently to an increase in the HHV value, hydrophobicity, grindability, and combustion properties [18]. Torrefaction improved the properties of solid fuels, leading to increased HHVs [19].
Lower torrefaction temperatures generally lead to higher efficiencies in terms of mass and energy yield compared with higher torrefaction temperatures. As the temperature increased from 250 to 400 °C, the mass yield decreased continuously. The highest mass and energy yields were obtained at 250 °C in CO2, reaching 78.7% and 84.4%, respectively, which was due to the release of volatile compounds by the heat treatment. Higher temperatures tend to increase the energy density but reduce the mass and energy yield [20]. Torrefaction significantly improved the hydrophobic and grindability properties of the waste biomass; in comparison, samples treated at higher temperatures were more grindable [20]. Mass yield (MY) and energy yield (EY) represent the remaining mass in the solid phase and the energy content of torrefied biomass compared to raw biomass [21]. For all samples of torrefied biomass, the energy yield (EY) was greater than the mass yield (MY), which became even more pronounced at higher torrefaction temperatures. This phenomenon affects the increase in the heating value of torrefied biomass [5]. Increasing the energy density ratio (EDR) of torrefied biomass was one of the main advantages of the biomass torrefaction process [22]. The EDR improved with increasing process temperature, with the highest value of the energy density ratio being approximately 1.5 at 400 °C and even higher (1.6) for the same sample with adsorbed Cu(II).
3.2. The Adsorption of Moisture Results
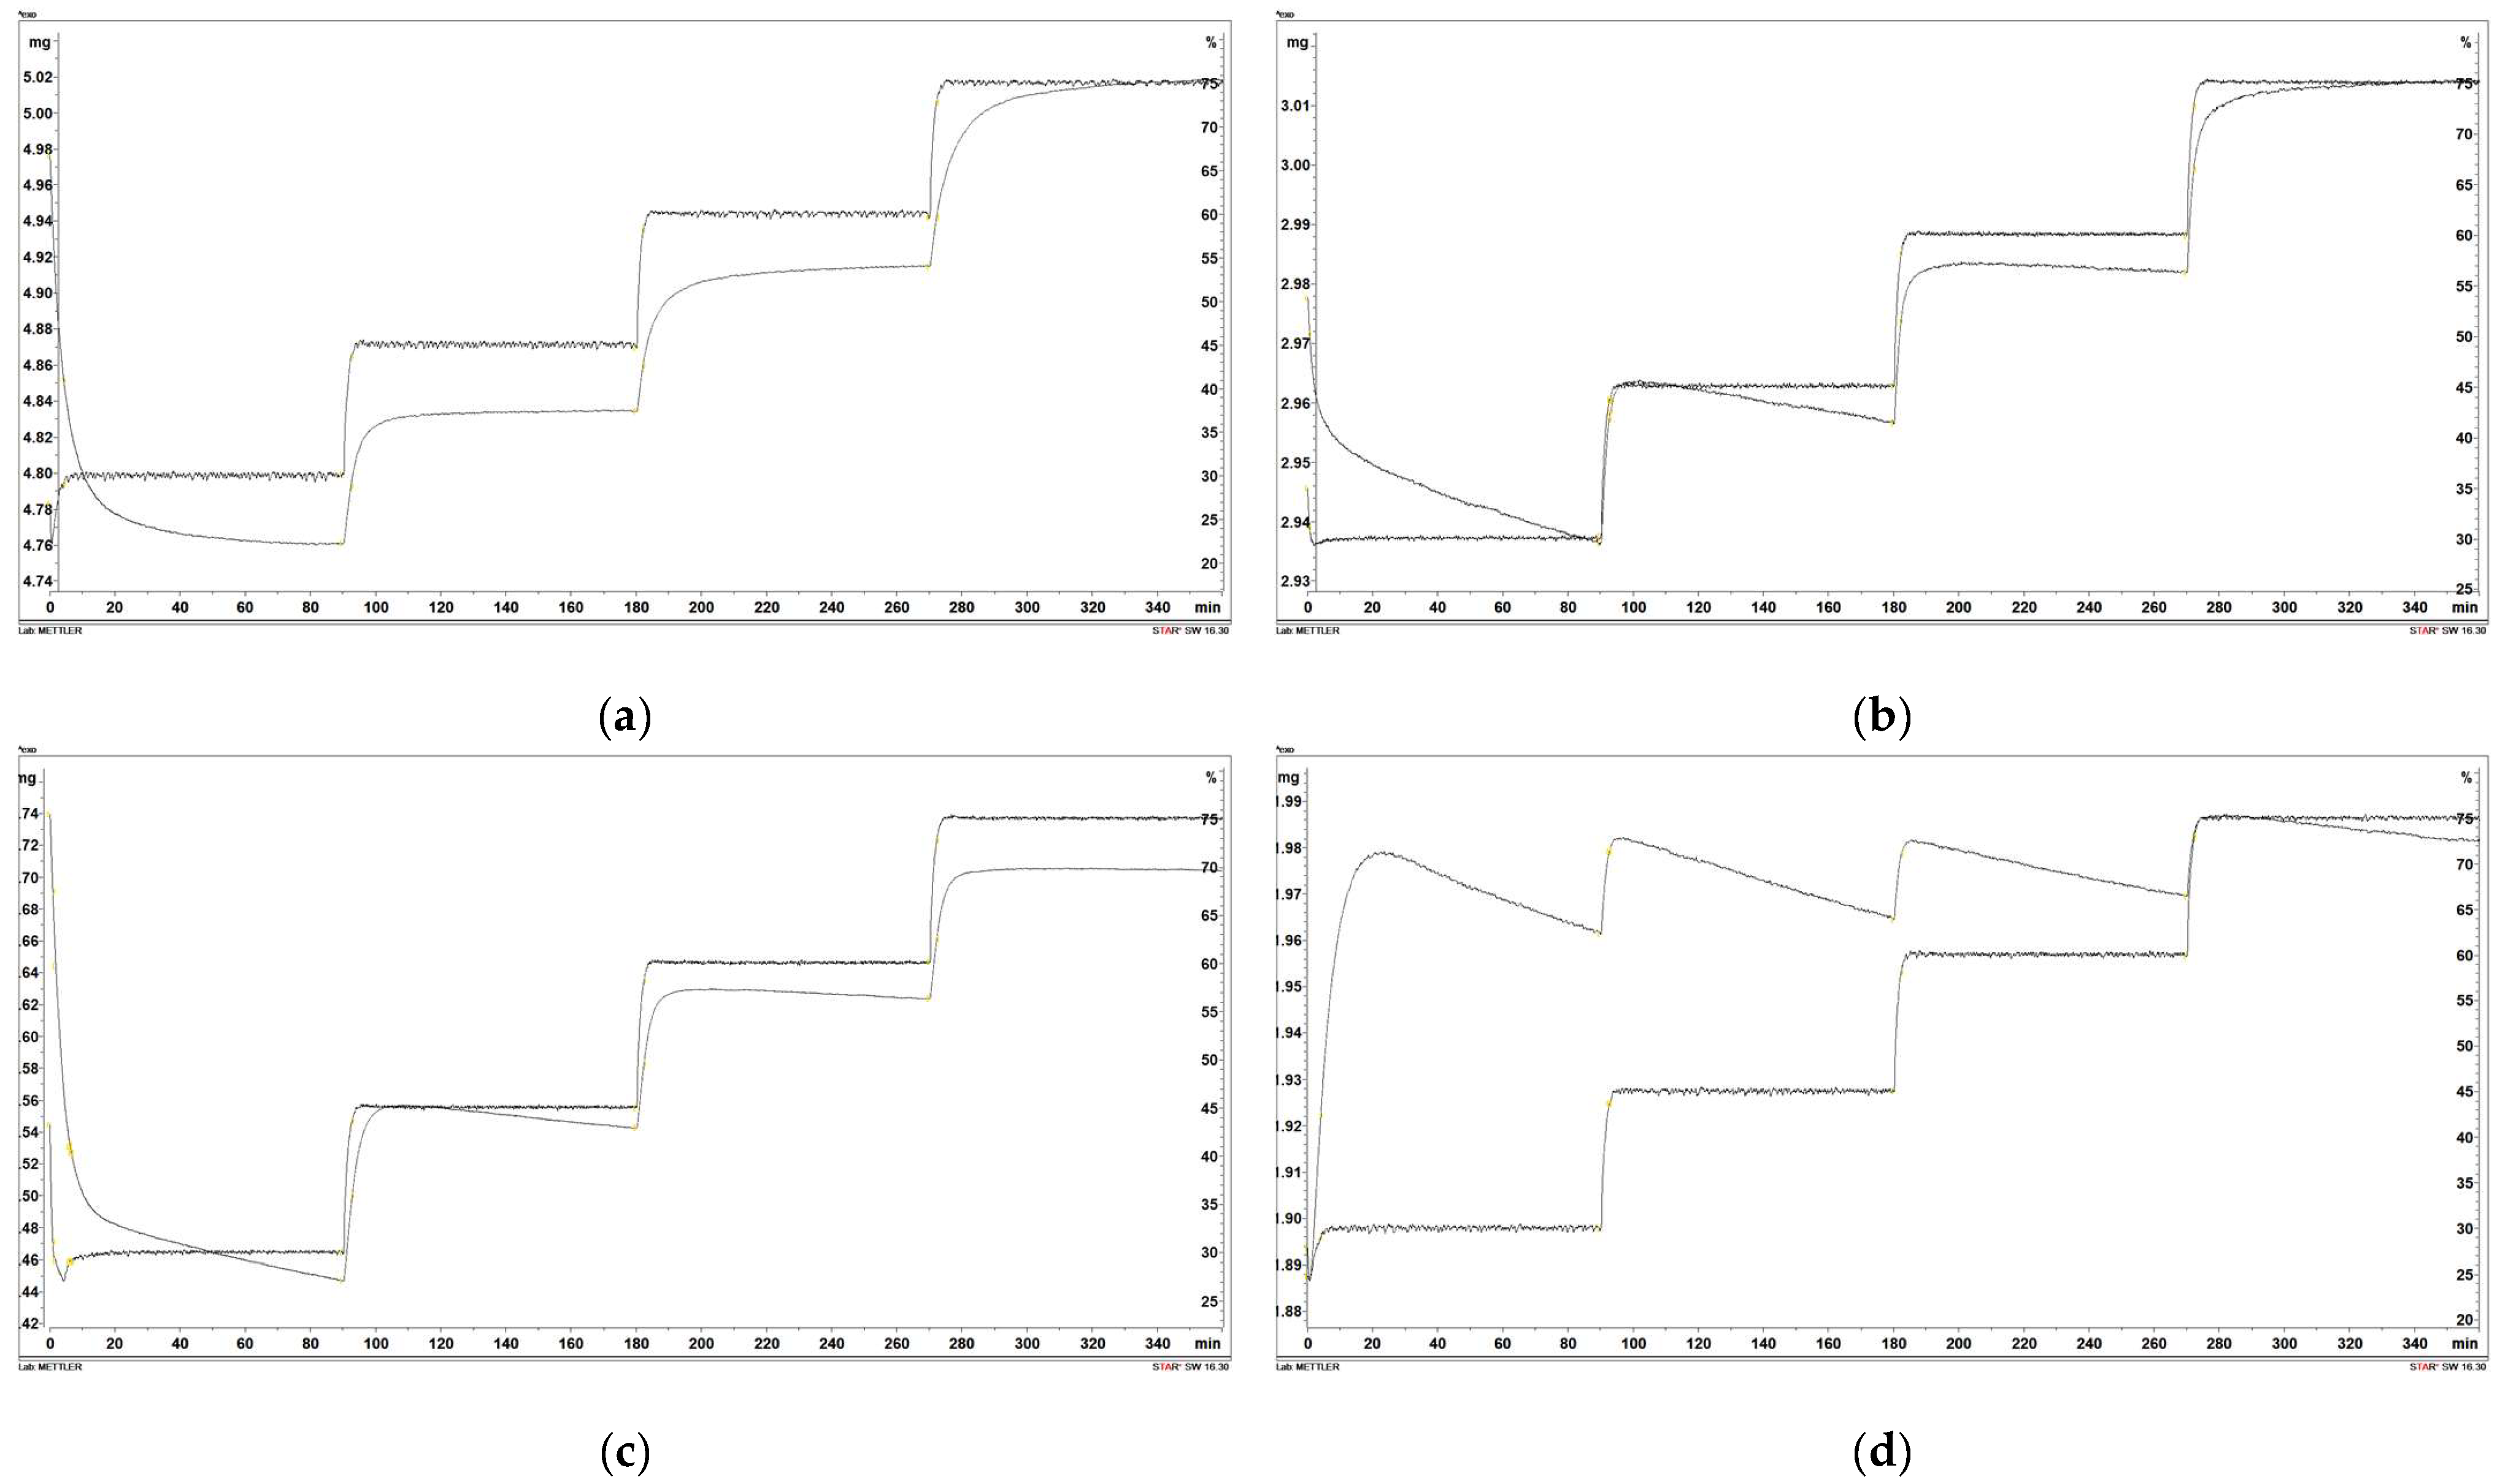
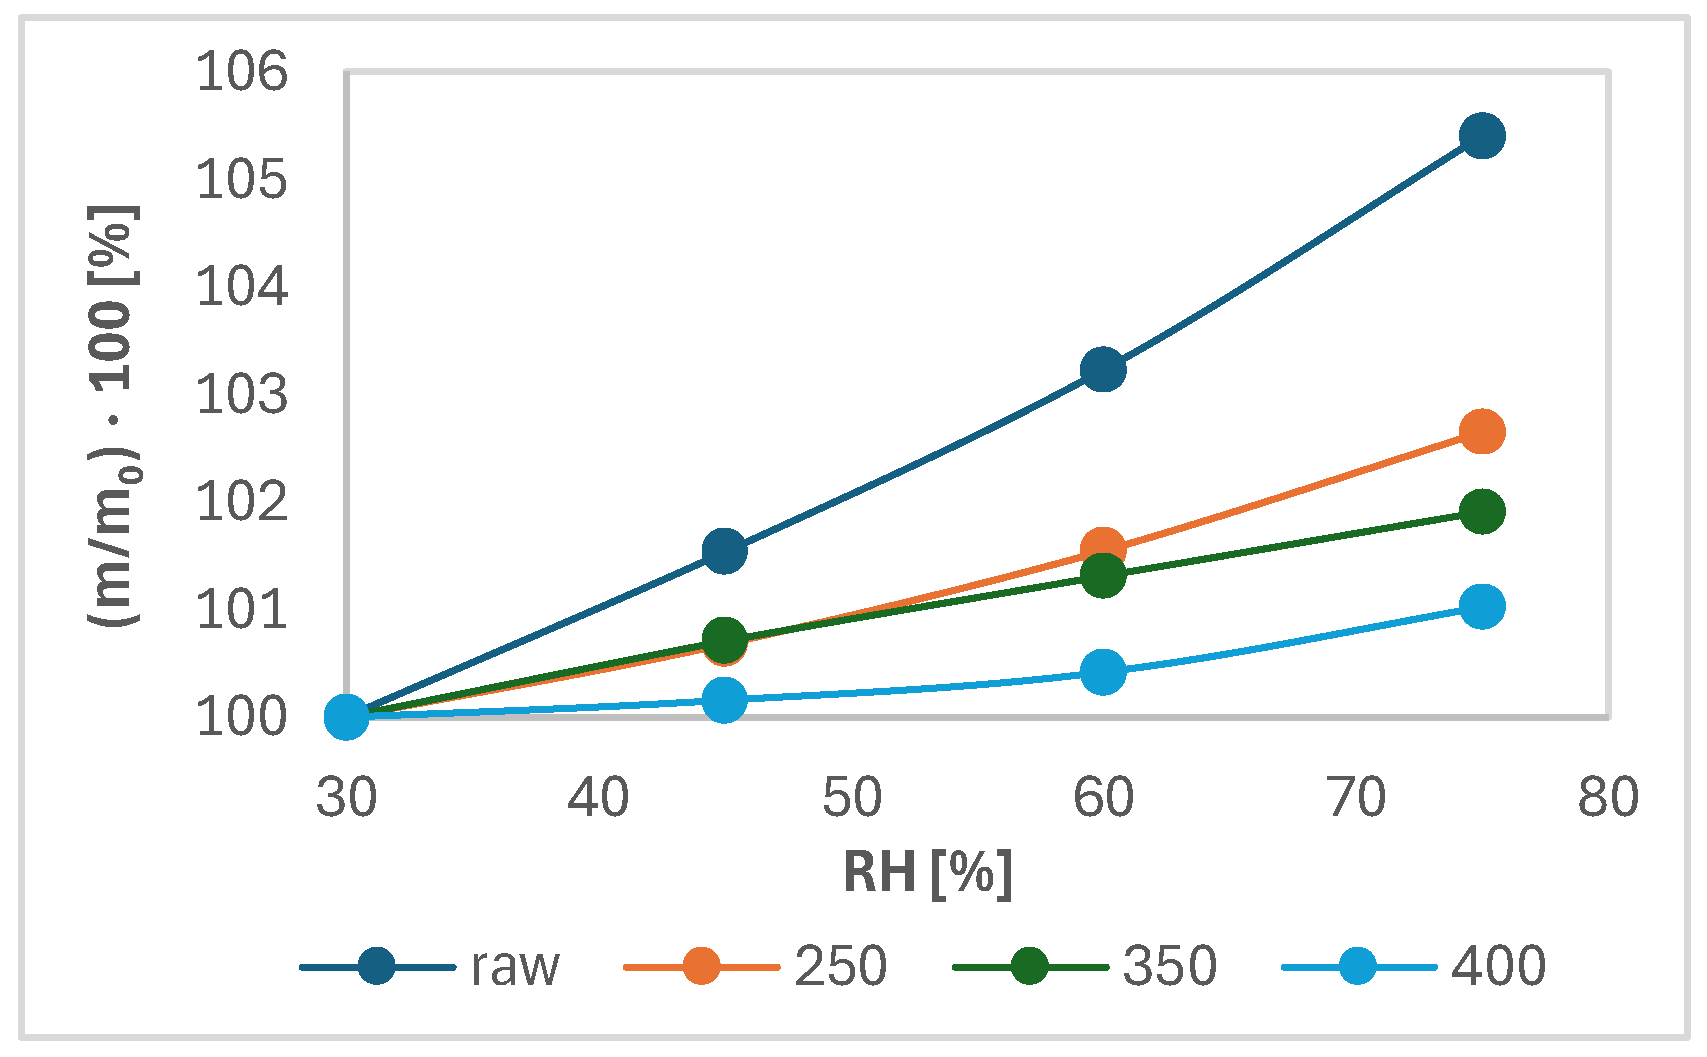
Figure 7 shows the changes in sample mass as a function of time and relative moisture of the atmosphere. Figure 8 shows the increase in the shared mass ratio because of moisture adsorption as a function of relative humidity (RH). As seen from Figure 7, the percentage of mass increase was the highest in all points of relative humidity and the lowest with wood torrefied at 400 °C. The highest difference in percentage of mass was detected between the initial and final weight for raw wood. The value was determined at 5.4%. The difference between the initial and final mass for samples decreased with increased temperature. The lowest difference in the percentage of mass increase between the initial and final mass was found in wood torrefied at 400 °C, determined at 1.0%. The results are in agreement with the theoretical foundations of torrefaction, which claimed the hydrophobicity of biomass increased with the torrefaction temperature and, therefore, became more resistant to moisture adsorption [8].
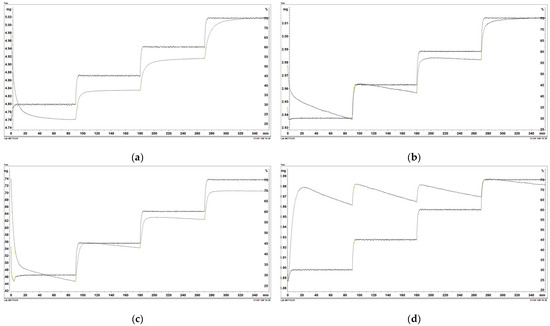
Figure 7.
Moisture adsorption of the following: (a) raw wood; (b) wood torrefied at 250 °C; (c) wood torrefied at 350 °C; (d) wood torrefied at 400 °C.
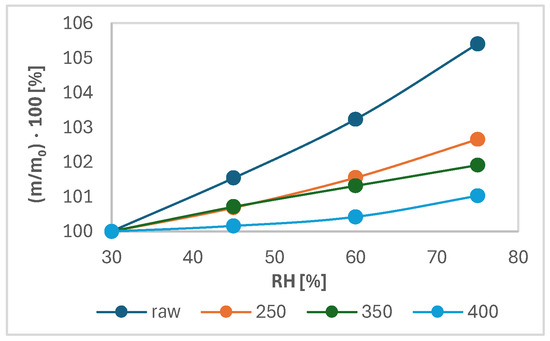
Figure 8.
Percentage of increase in the mass ratio as a function of relative humidity.
3.3. The Adsorption of Cu(II) and Ni(II) Results
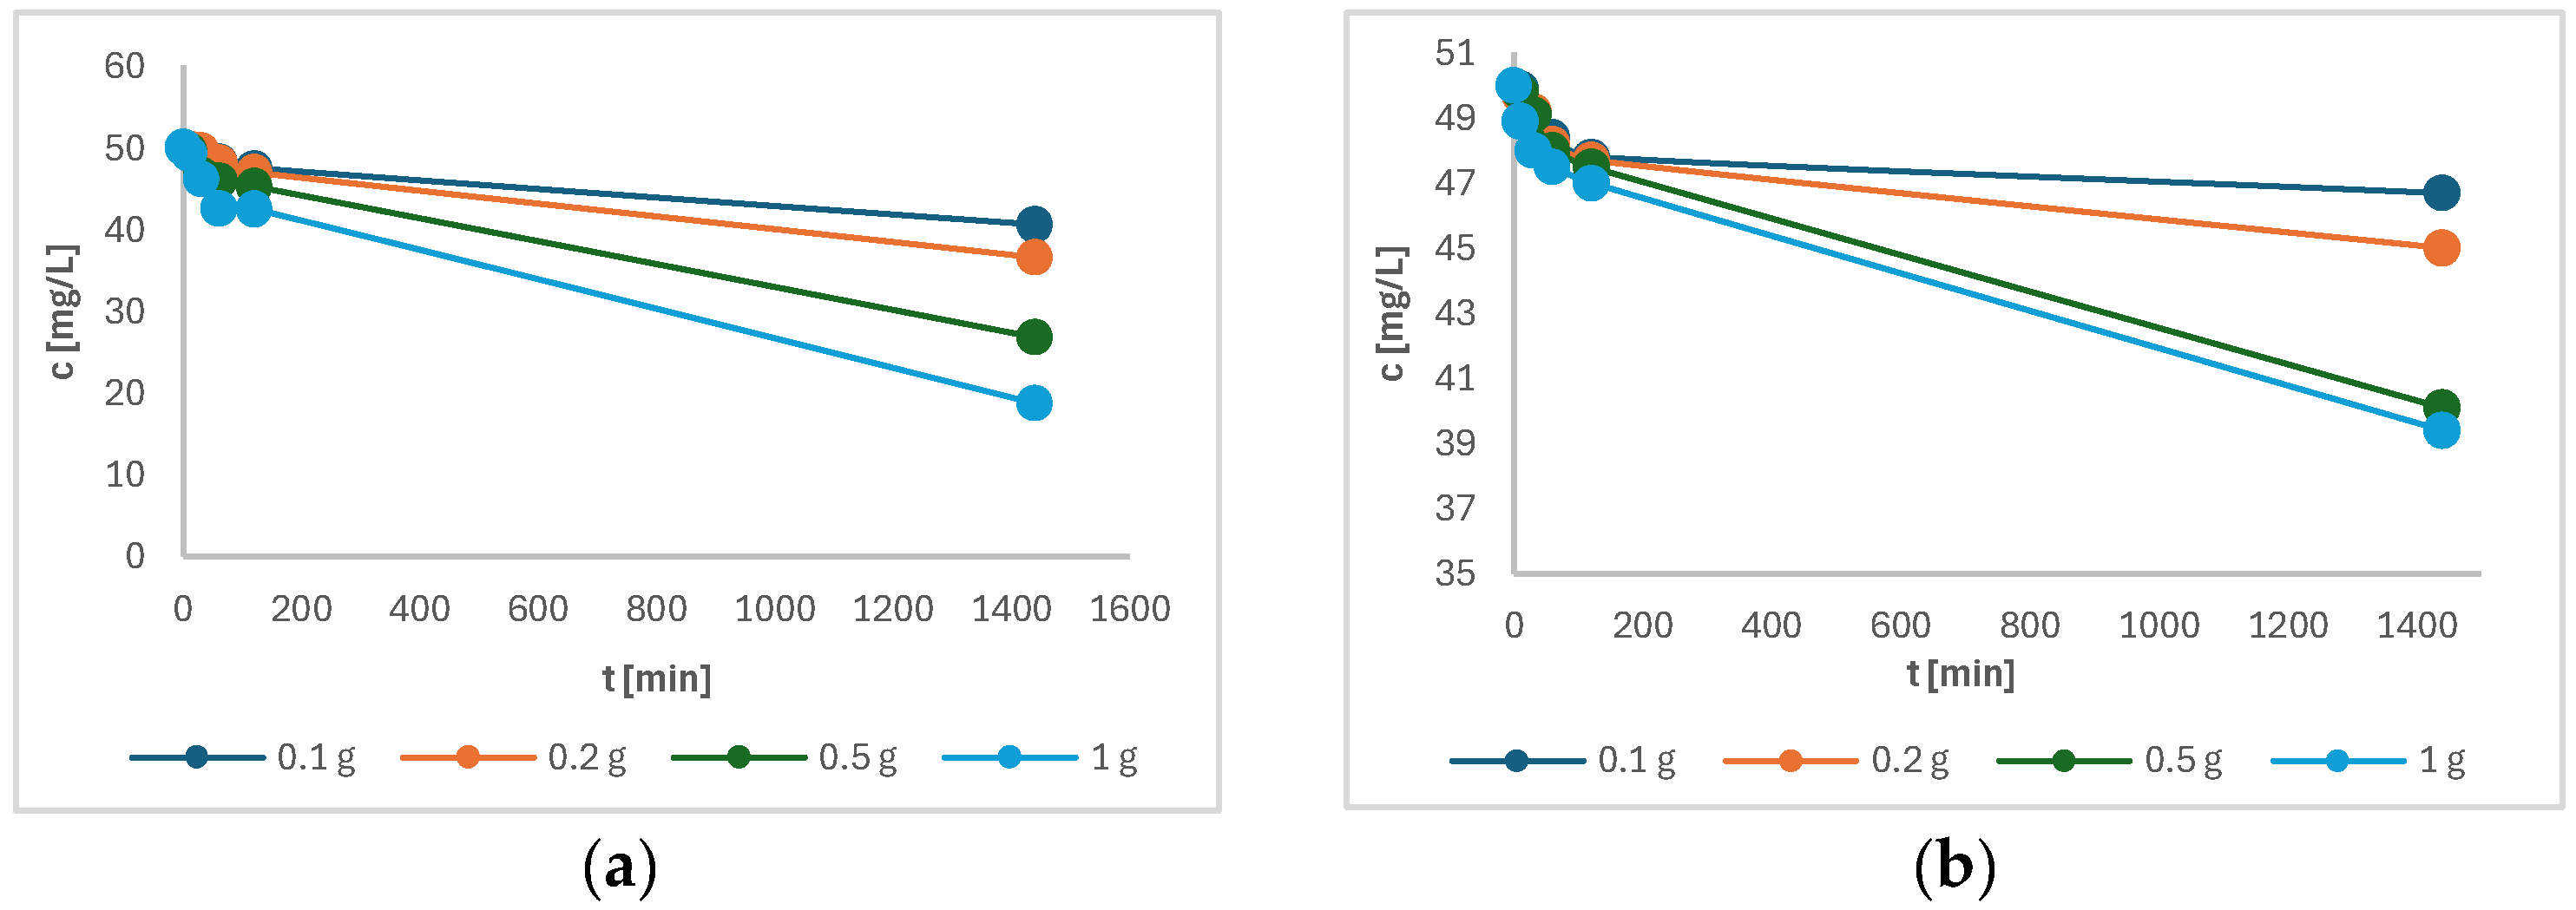
Figure 9 shows the variation of the concentration of the samples a) of Cu(II) and b) of Ni(II) as a function of time. The initial concentration of all solutions was 50 mg/L Cu(II) (or Ni(II)), and a decrease in concentration can be clearly seen in Figure 9a,b, indicating the successful adsorption of Cu(II) and Ni(II) onto the torrefied biomass. It was observed that Cu(II) showed a better adsorption affinity on torrefied wood than Ni(II). The adsorption for Cu(II) was higher, possibly because of strong coordination bonds formed with carboxyl groups [23]. In addition, it was observed that the sample with the highest initial mass of torrefied wood reached the highest metal adsorption onto torrefied material after 24 h of adsorption. The increment in uptake of both metals can be attributed to the constant mass transfer to the available active sites [24]. From Figure 9, it seems that the adsorption equilibrium was not reached. Therefore, the time was prolonged to 48 h. The measurement of the final concentration of both metal ions showed that the concentration did not change much compared to measurement after 24 h and sustained a plateau. Thus, it can be concluded that equilibrium was reached after 24 h.
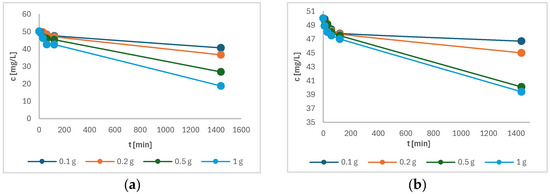
Figure 9.
The remaining concentration of the following in solution as a function of time: (a) Cu(II); (b) Ni(II).
Figure 10 shows the change in adsorption capacity as a function of time. The adsorption capacity of each sample increases with time, whereby the sample with the lowest mass of charcoal has the highest adsorption capacity. Figure 10 shows that samples had not yet reached equilibrium after 24 h of adsorption, suggesting that our samples require significantly more time to reach a steady state [25]. The adsorption rate is influenced by the interaction of adsorption sites on the adsorbent surface. However, subsequent measurements showed only a negligible increase in capacity after 48 h.

Figure 10.
The adsorption capacity of the following as a function of time: (a) Cu(II); (b) Ni(II).
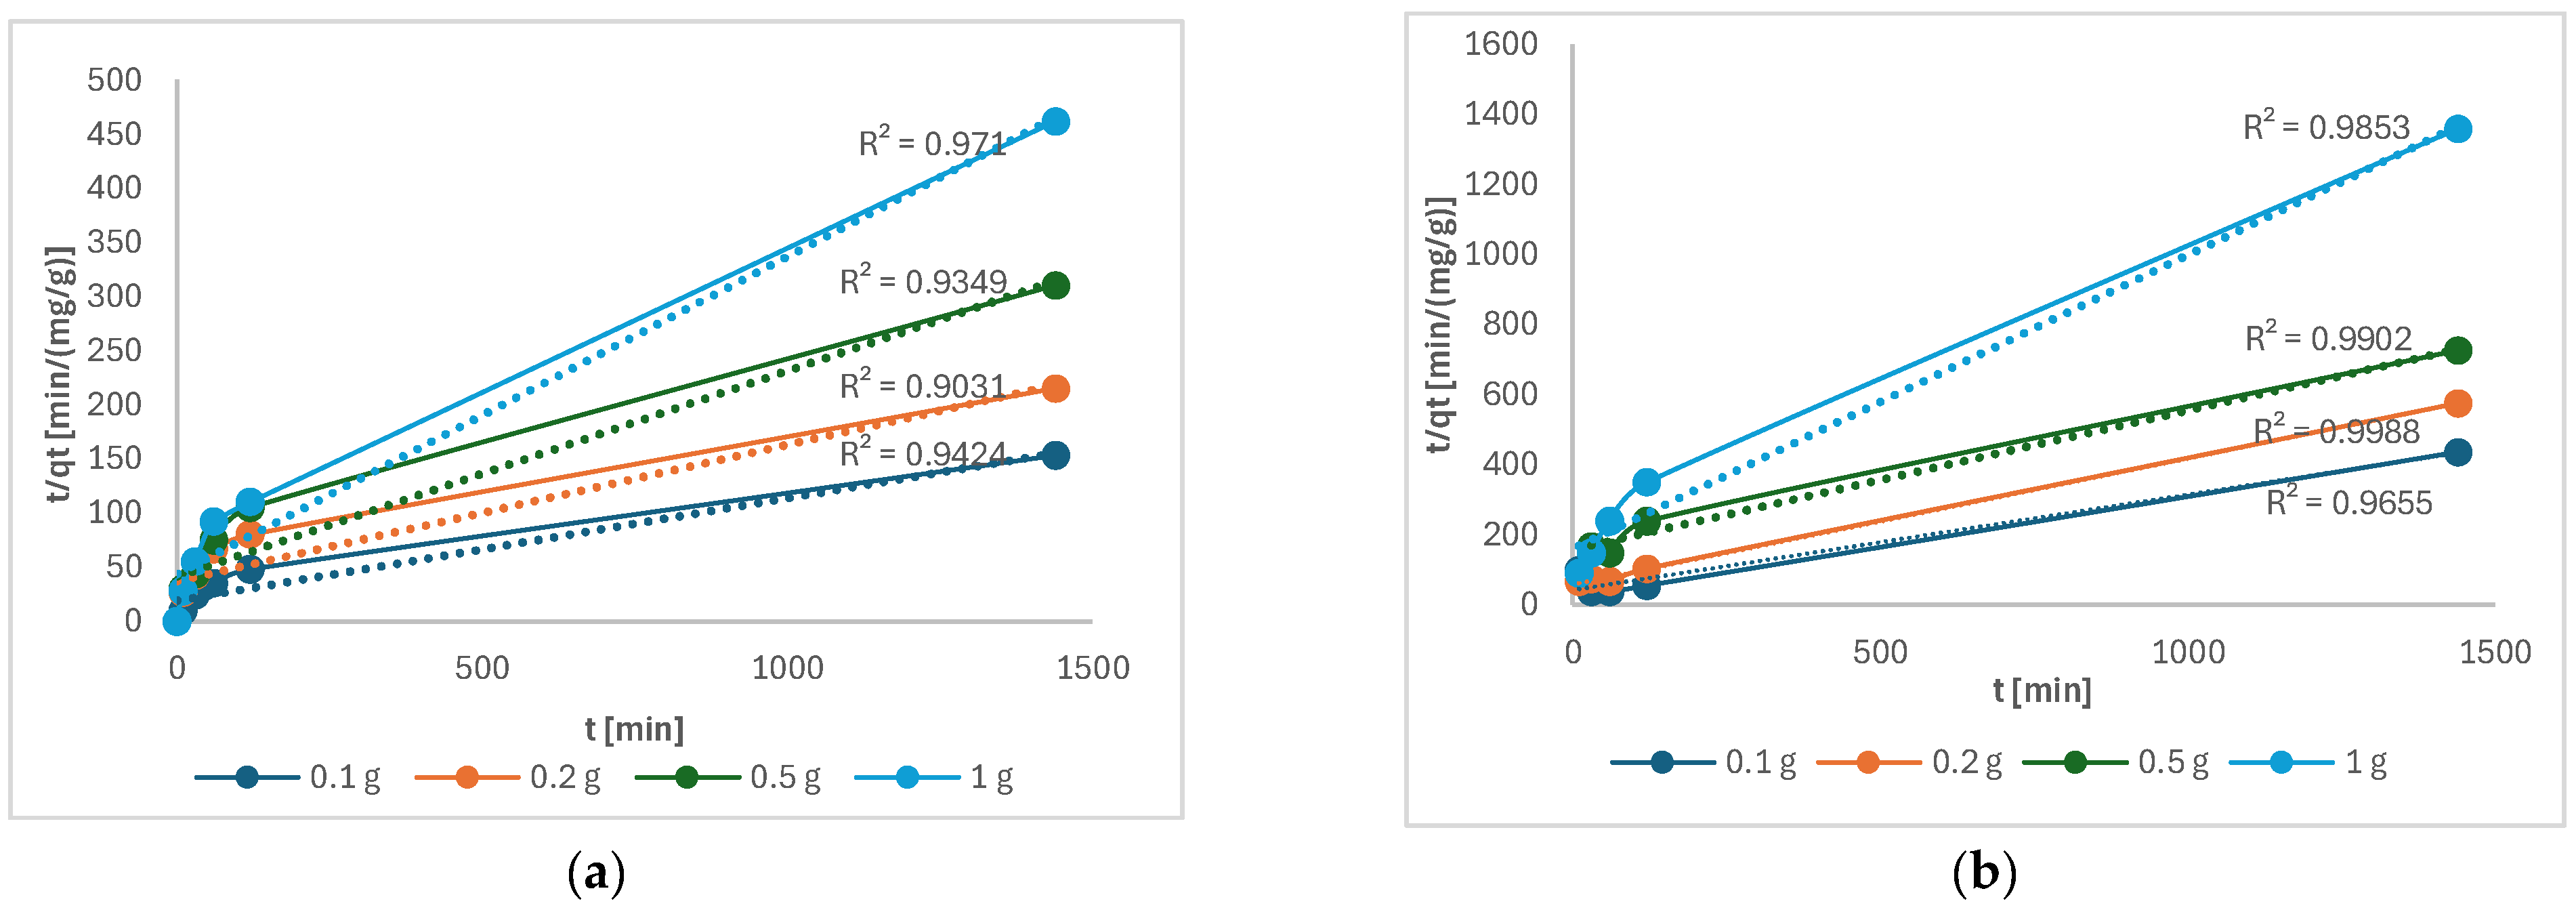
Figure 11 shows that the pseudo-second order describes the kinetics of Cu(II) and Ni(II) adsorption well.
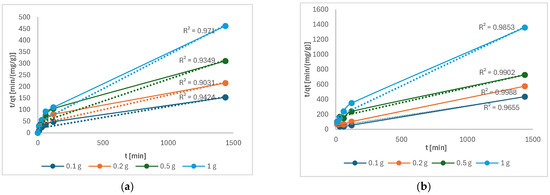
Figure 11.
t/qt as a function of time of the following: (a) Cu(II); (b) Ni(II).
Similar results were also obtained in other studies for Cu(II) [4] and Ni(II) [5]. A pseudo-second-order model describes chemisorption in which electron exchange takes place between the metal and the functional groups, such as the C–O band on the torrefied mixed wood [26].
Figure 12 showed the highest efficiency of Cu(II) and Ni(II) was achieved in solution where the highest mass of 1 g of torrefied material was studied. In the case of Cu(II), the efficiency was 62.4%, and for Ni(II), it was 21.2%. It was expected and is in accordance with other studies [4,5]. The efficiency was higher in Cu(II) compared to Ni(II), probably due to the smaller size of Cu(II), which may promote affinity reactions [27].

Figure 12.
The adsorption efficiency of the following as a function of time: (a) Cu(II); (b) Ni(II).
4. Conclusions
This study highlights the potential of torrefied biomass as an improved solid fuel with enhanced hydrophobic and energy properties. It also demonstrates its effectiveness as an adsorbent for the removal of heavy metals. The study examined the moisture adsorption behavior of torrefied biomass in comparison to raw wood, as well as the adsorption efficiency of heavy metals on torrefied material. The wood biomass was subjected to torrefaction at temperatures between 250 °C and 400 °C in an atmosphere of nitrogen. The application of lower torrefaction temperatures resulted in a notable reduction in mass, whereas the utilization of higher temperatures led to an increase in energy density. The HHV of the biomass exhibited an increase with rising torrefaction temperatures, thereby demonstrating enhanced energy properties.
With regard to metal adsorption, the torrefied biomass exhibited better results for Cu(II) ions, attaining an adsorption efficiency of 62.4% after 1440 min in comparison to a maximum adsorption of 21.2% for Ni(II). The kinetic analysis indicated that the adsorption process was best described by a pseudo-second-order model, which suggests that the adsorption rate is linearly related to the concentration of metal ions. The HHV value of torrefied material with adsorbed ions measured at 27 MJ/kg and 28 MJ/kg with Cu(II) and Ni(II), respectively, was higher compared to 26 MJ/kg of torrefied material without adsorbed heavy metal ions. This study demonstrates the potential of torrefied biomass as an improved solid fuel with enhanced hydrophobic and energetic properties, as well as its effectiveness as an adsorbent for heavy metal removal.
Author Contributions
Conceptualization, D.U. and M.S.; methodology, D.U. and M.S.; validation, A.P., M.S. and D.U.; formal analysis, I.S.; investigation, A.P.; writing—original draft preparation, I.S., D.U. and M.S.; writing—review and editing, M.S., A.P. and D.G.; supervision, A.P. and D.G. All authors have read and agreed to the published version of the manuscript.
Funding
This research was funded by the Slovenian Research Agency in the framework of Program Process Systems Engineering and Sustainable Development P2-0414 and Separation Processes and Production Design P2-0046.
Data Availability Statement
Data are contained within the article.
Conflicts of Interest
The authors declare no conflicts of interest.
References
- Adegoke, I.A.; Ige, A.R.; Adejoba, O.R.; Aruwajoye, D.A.; James, J. Roles of Biomass in the Absorption of Heavy Metals. Eur. J. Energy Res. 2022, 2, 9–13. [Google Scholar] [CrossRef]
- Mohamed, M.A.; Jaafar, J.; Ismail, A.F.; Othman, M.H.D.; Rahman, M.A. Chapter 1-Fourier Transform Infrared (FTIR) Spectroscopy. In Membrane Characterization; Hilal, N., Oatley-Radcliffe, D.L., Williams, P.M., Eds.; Elsevier: Amsterdam, The Netherlands, 2017; pp. 3–29. [Google Scholar]
- Duan, C.; Ma, T.; Wang, J.; Zhou, Y. Removal of heavy metals from aqueous solution using carbon-based adsorbents: A review. J. Water Process Eng. 2020, 37, 101339. [Google Scholar] [CrossRef]
- Sulaiman, S.; Azis, R.S.; Ismail, I.; Man, H.C.; Yusof, K.F.M.; Abba, M.U.; Katibi, K.K. Adsorptive Removal of Copper (II) Ions from Aqueous Solution Using a Magnetite Nano-Adsorbent from Mill Scale Waste: Synthesis, Characterization, Adsorption and Kinetic Modelling Studies. Nanoscale Res. Lett. 2021, 16, 168. [Google Scholar] [CrossRef]
- Gao, W.; He, W.; Zhang, J.; Chen, Y.; Zhang, Z.; Yang, Y.; He, Z. Effects of biochar-based materials on nickel adsorption and bioavailability in soil. Sci. Rep. 2023, 13, 5880. [Google Scholar] [CrossRef] [PubMed]
- Hyk, W.; Święcicka, D.; Garboś, S. Application of mixed (bimodal) distribution to human health risk assessment of Cu and Ni in drinking water collected by RDT sampling method from a large water supply zone. Microchem. J. 2013, 110, 465–472. [Google Scholar] [CrossRef]
- Zhou, Q.; Shen, Y.; Gu, X. Progress in torrefaction pretreatment for biomass gasification. Green Chem. 2024, 26, 9652–9670. [Google Scholar] [CrossRef]
- Grycova, B.; Pryszcz, A.; Krzack, S.; Klinger, M.; Lestinsky, P. Torrefaction of biomass pellets using the thermogravimetric analyser. Biomass Convers. Biorefinery 2021, 11, 2837–2842. [Google Scholar] [CrossRef]
- Ivanovski, M.; Goricanec, D.; Krope, J.; Urbancl, D. Torrefaction pretreatment of lignocellulosic biomass for sustainable solid biofuel production. Energy 2022, 240, 122483. [Google Scholar] [CrossRef]
- van der Stelt, M.J.C.; Gerhauser, H.; Kiel, J.H.A.; Ptasinski, K.J. Biomass upgrading by torrefaction for the production of biofuels: A review. Biomass Bioenergy 2011, 35, 3748–3762. [Google Scholar] [CrossRef]
- Odusote, J.K.; Adeleke, A.A.; Lasode, O.A.; Malathi, M.; Paswan, D. Thermal and compositional properties of treated Tectona grandis. Biomass Convers. Biorefinery 2019, 9, 511–519. [Google Scholar] [CrossRef]
- Petrovič, A.; Simonič, M. Removal of heavy metal ions from drinking water by alginate-immobilised Chlorella sorokiniana. Int. J. Environ. Sci. Technol. 2016, 13, 1761–1780. [Google Scholar] [CrossRef]
- Wei, M.; Chen, J.; Wang, X. Removal of arsenic and cadmium with sequential soil washing techniques using Na2EDTA, oxalic and phosphoric acid: Optimization conditions, removal effectiveness and ecological risks. Chemosphere 2016, 156, 252–261. [Google Scholar] [CrossRef] [PubMed]
- Li, S.; Chen, G. Thermogravimetric, thermochemical, and infrared spectral characterization of feedstocks and biochar derived at different pyrolysis temperatures. Waste Manag. 2018, 78, 198–207. [Google Scholar] [CrossRef]
- Chen, D.; Gao, A.; Cen, K.; Zhang, J.; Cao, X.; Ma, Z. Investigation of biomass torrefaction based on three major components: Hemicellulose, cellulose, and lignin. Energy Convers. Manag. 2018, 169, 228–237. [Google Scholar] [CrossRef]
- Oyebode, W.A.; Ogunsuyi, H.O. Impact of torrefaction process temperature on the energy content and chemical composition of stool tree (Alstonia congenisis Engl) woody biomass. Curr. Res. Green Sustain. Chem. 2021, 4, 100115. [Google Scholar] [CrossRef]
- So, C.-L.; Eberhardt, T.L. FTIR-based models for assessment of mass yield and biofuel properties of torrefied wood. Wood Sci. Technol. 2018, 52, 209–227. [Google Scholar] [CrossRef]
- Dyjakon, A.; Noszczyk, T.; Sobol, Ł.; Misiakiewicz, D. Influence of Torrefaction Temperature and Climatic Chamber Operation Time on Hydrophobic Properties of Agri-Food Biomass Investigated Using the EMC Method. Energies 2021, 14, 5299. [Google Scholar] [CrossRef]
- Matali, S.; Rahman, N.; Idris, S.; Yaacob, N.; Alias, A. Lignocellulosic Biomass Solid Fuel Properties Enhancement via Torrefaction. Procedia Eng. 2016, 148, 671–678. [Google Scholar] [CrossRef]
- Ivanovski, M.; Urbancl, D.; Petrovič, A.; Stergar, J.; Goričanec, D.; Simonič, M. Improving Lignocellulosic and Non-Lignocellulosic Biomass Characteristics through Torrefaction Process. Appl. Sci. 2022, 12, 12210. [Google Scholar] [CrossRef]
- Šantl, N.; Stergar, J.; Bozicko, M.; Goričanec, D.; Urbancl, D.; Petrovič, A. The utilisation of thermally treated poultry farm waste for energy recovery and soil application. Renew. Energy 2024, 221, 119809. [Google Scholar] [CrossRef]
- Świechowski, K.; Liszewski, M.; Bąbelewski, P.; Koziel, J.A.; Białowiec, A. Oxytree Pruned Biomass Torrefaction: Mathematical Models of the Influence of Temperature and Residence Time on Fuel Properties Improvement. Materials 2019, 12, 2228. [Google Scholar] [CrossRef] [PubMed]
- Premchand, P.; Mead, S.; Fino, D.; Demichelis, F.; Bensaid, S.; Chiaramonti, D.; Antunes, E. Sustainable valorisation of cigarette butts waste through pyrolysis: An insight into the pyrolytic products and subsequent aqueous heavy metals removal by pyrolytic char. Chem. Eng. Sci. 2025, 302, 120906. [Google Scholar] [CrossRef]
- Choudhary, M.; Kumar, R.; Neogi, S. Activated biochar derived from Opuntia ficus-indica for the efficient adsorption of malachite green dye, Cu+2 and Ni+2 from water. J. Hazard. Mater. 2020, 392, 122441. [Google Scholar] [CrossRef]
- Karagoz, S.; Tay, T.; Ucar, S.; Erdem, M. Activated carbons from waste biomass by sulfuric acid activation and their use on methylene blue adsorption. Bioresour. Technol. 2008, 99, 6214–6222. [Google Scholar] [CrossRef] [PubMed]
- Kończyk, J.; Kluziak, K.; Kołodyńska, D. Adsorption of vanadium (V) ions from the aqueous solutions on different biomass-derived biochars. J. Environ. Manag. 2022, 313, 114958. [Google Scholar] [CrossRef]
- Zhou, Z.; Xu, Z.; Feng, Q.; Yao, D.; Yu, J.; Wang, D.; Lv, S.; Liu, Y.; Zhou, N.; Zhong, M.-E. Effect of pyrolysis condition on the adsorption mechanism of lead, cadmium and copper on tobacco stem biochar. J. Clean. Prod. 2018, 187, 996–1005. [Google Scholar] [CrossRef]
Disclaimer/Publisher’s Note: The statements, opinions and data contained in all publications are solely those of the individual author(s) and contributor(s) and not of MDPI and/or the editor(s). MDPI and/or the editor(s) disclaim responsibility for any injury to people or property resulting from any ideas, methods, instructions or products referred to in the content. |
© 2025 by the authors. Licensee MDPI, Basel, Switzerland. This article is an open access article distributed under the terms and conditions of the Creative Commons Attribution (CC BY) license (https://creativecommons.org/licenses/by/4.0/).

