Experiments and Simulations on the Low-Temperature Reduction of Iron Ore Oxide Pellets with Hydrogen

 , ,
, ,  ,
,  , ,
, ,
Abstract
1. Introduction
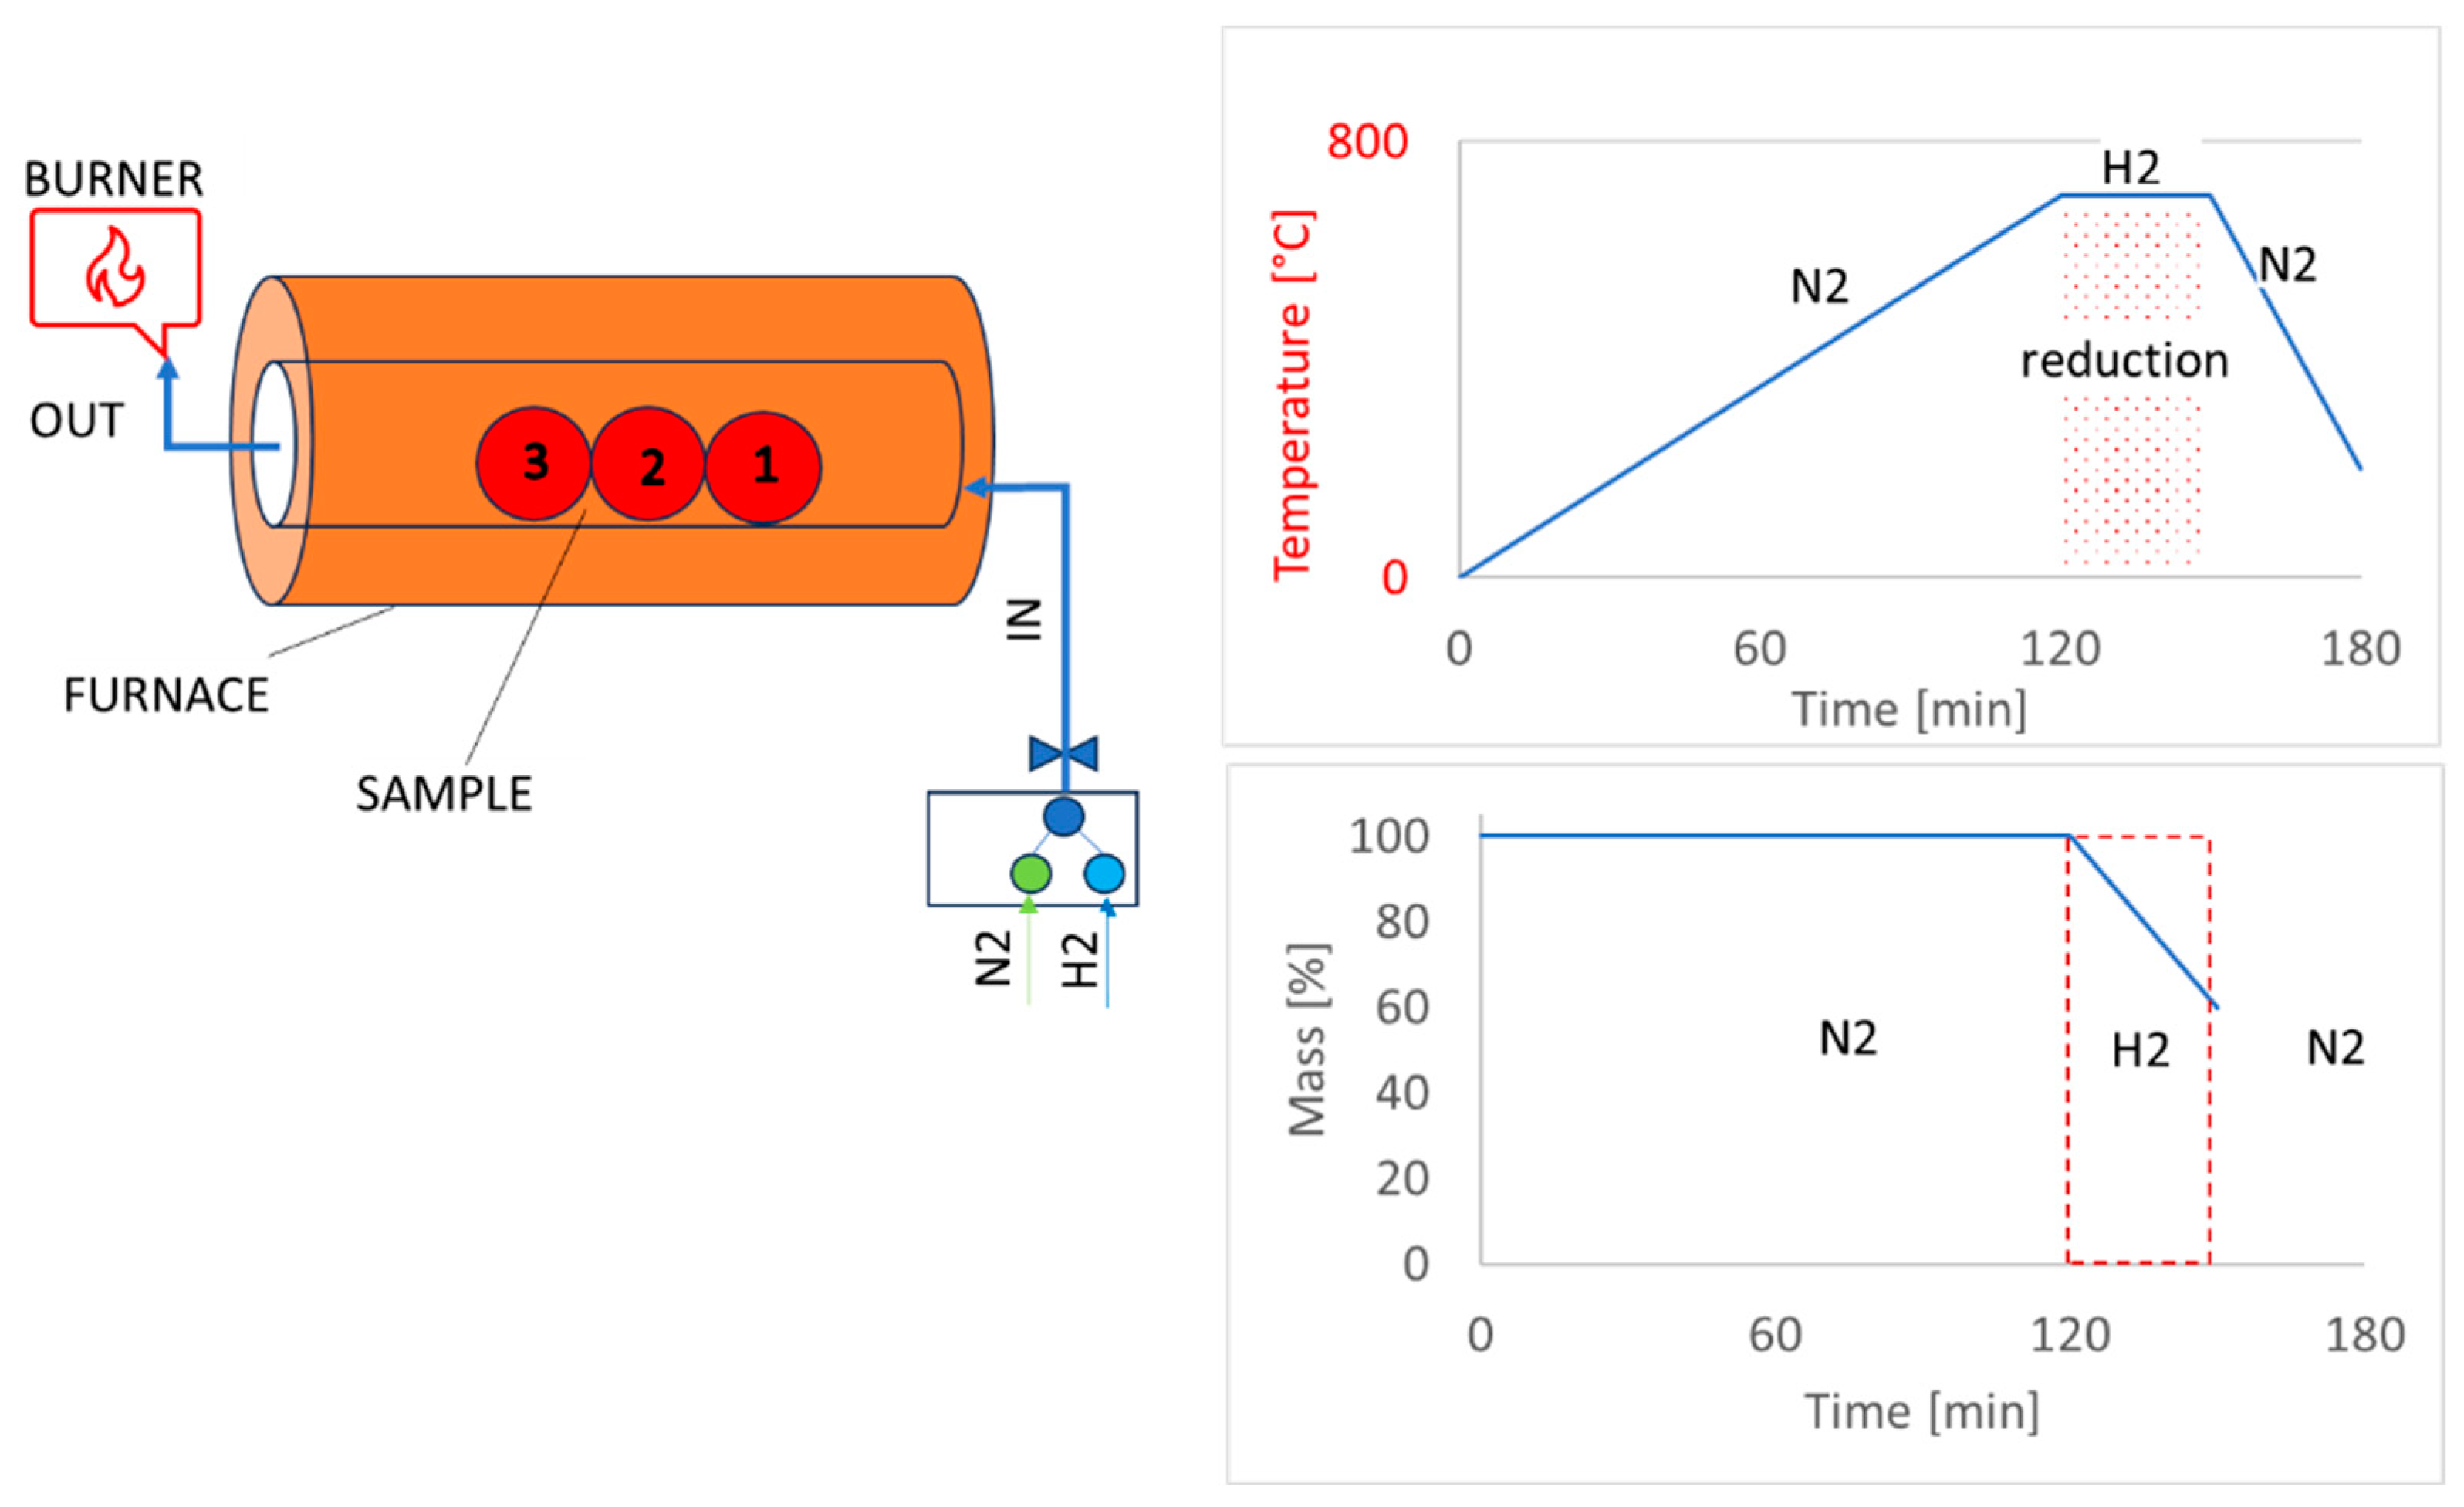
2. Materials and Methods
- mOi is the mass of oxygen initially present in the iron oxides before reduction;
- mOr is the mass of oxygen remaining in the iron oxides after reduction.
- Gk—generation of turbulence kinetic energy due to velocity gradients;
- Gb—generation of the kinetic energy of turbulence due to buoyancy;
- YM—contribution from fluctuating dilatations in compressible turbulent flow to total dissipation;
- C1εC2, C3—model constants;
- σk, σε—model constants—turbulent Prandtl numbers for k and ε (-);
- Sk, Sε—user-defined source members.
- Model constants:
- C2-Epsilon—1.9
- TKE Prandtl number—1
- TDR Prandtl number—1.2
- Energy Prandtl number—0.85
- Wall Prandtl number—0.85
- Turbulent Schmidt number—0.7
- |ρ| is the fluid density;
- |t| is time;
- is the velocity vector of the fluid.
- ∇.(ρ) represents the divergence of the mass flux (rate of mass flow per unit area).
- is the velocity component in the i-th direction;
- p is the pressure;
- is the viscous stress tensor, representing the viscous forces acting on the fluid;
- represents the gravitational acceleration in the i-th direction;
- —is an external body force (e.g., due to electromagnetic fields or other forces).
- E is the total energy per unit mass, which includes internal energy and kinetic energy;
- T is the temperature;
- k is the thermal conductivity of the fluid;
- ∇.(k∇T) represents the heat conduction (Fourier’s law);
- represents energy sources (e.g., due to chemical reactions, radiation, or other heat sources).
3. Results and Discussion
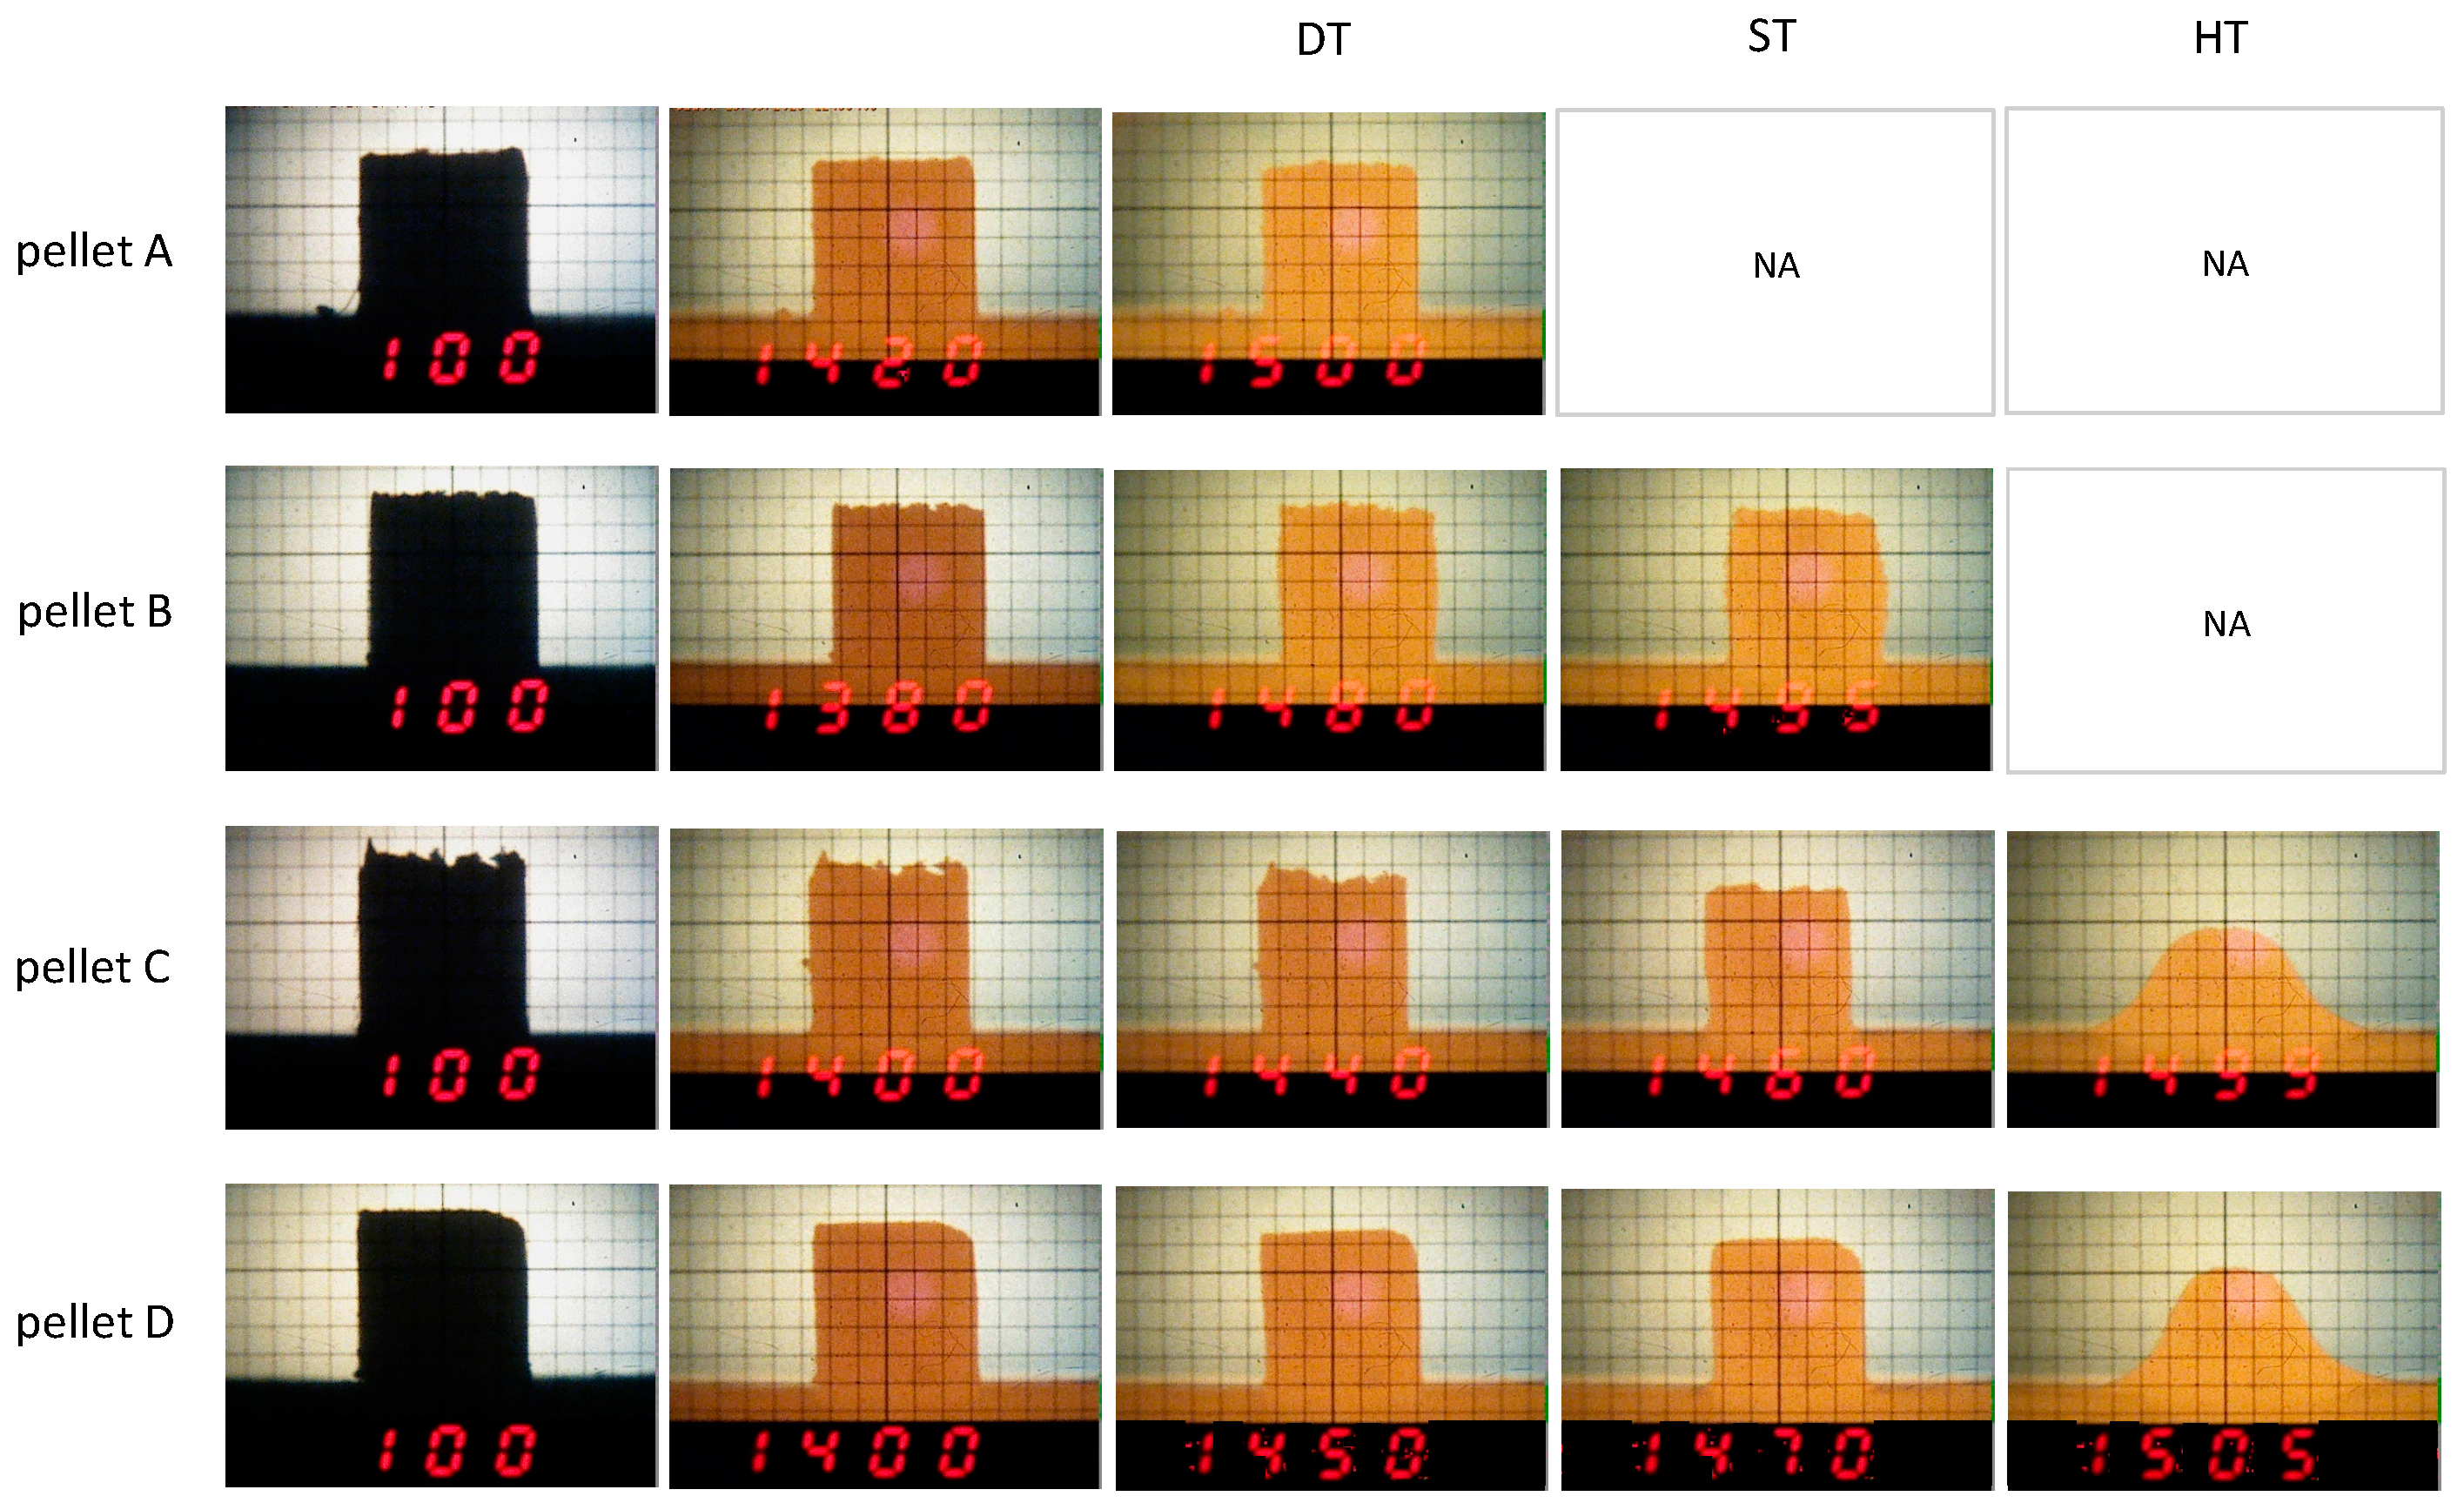
3.1. Physicochemical Properties of the Studied Pellets
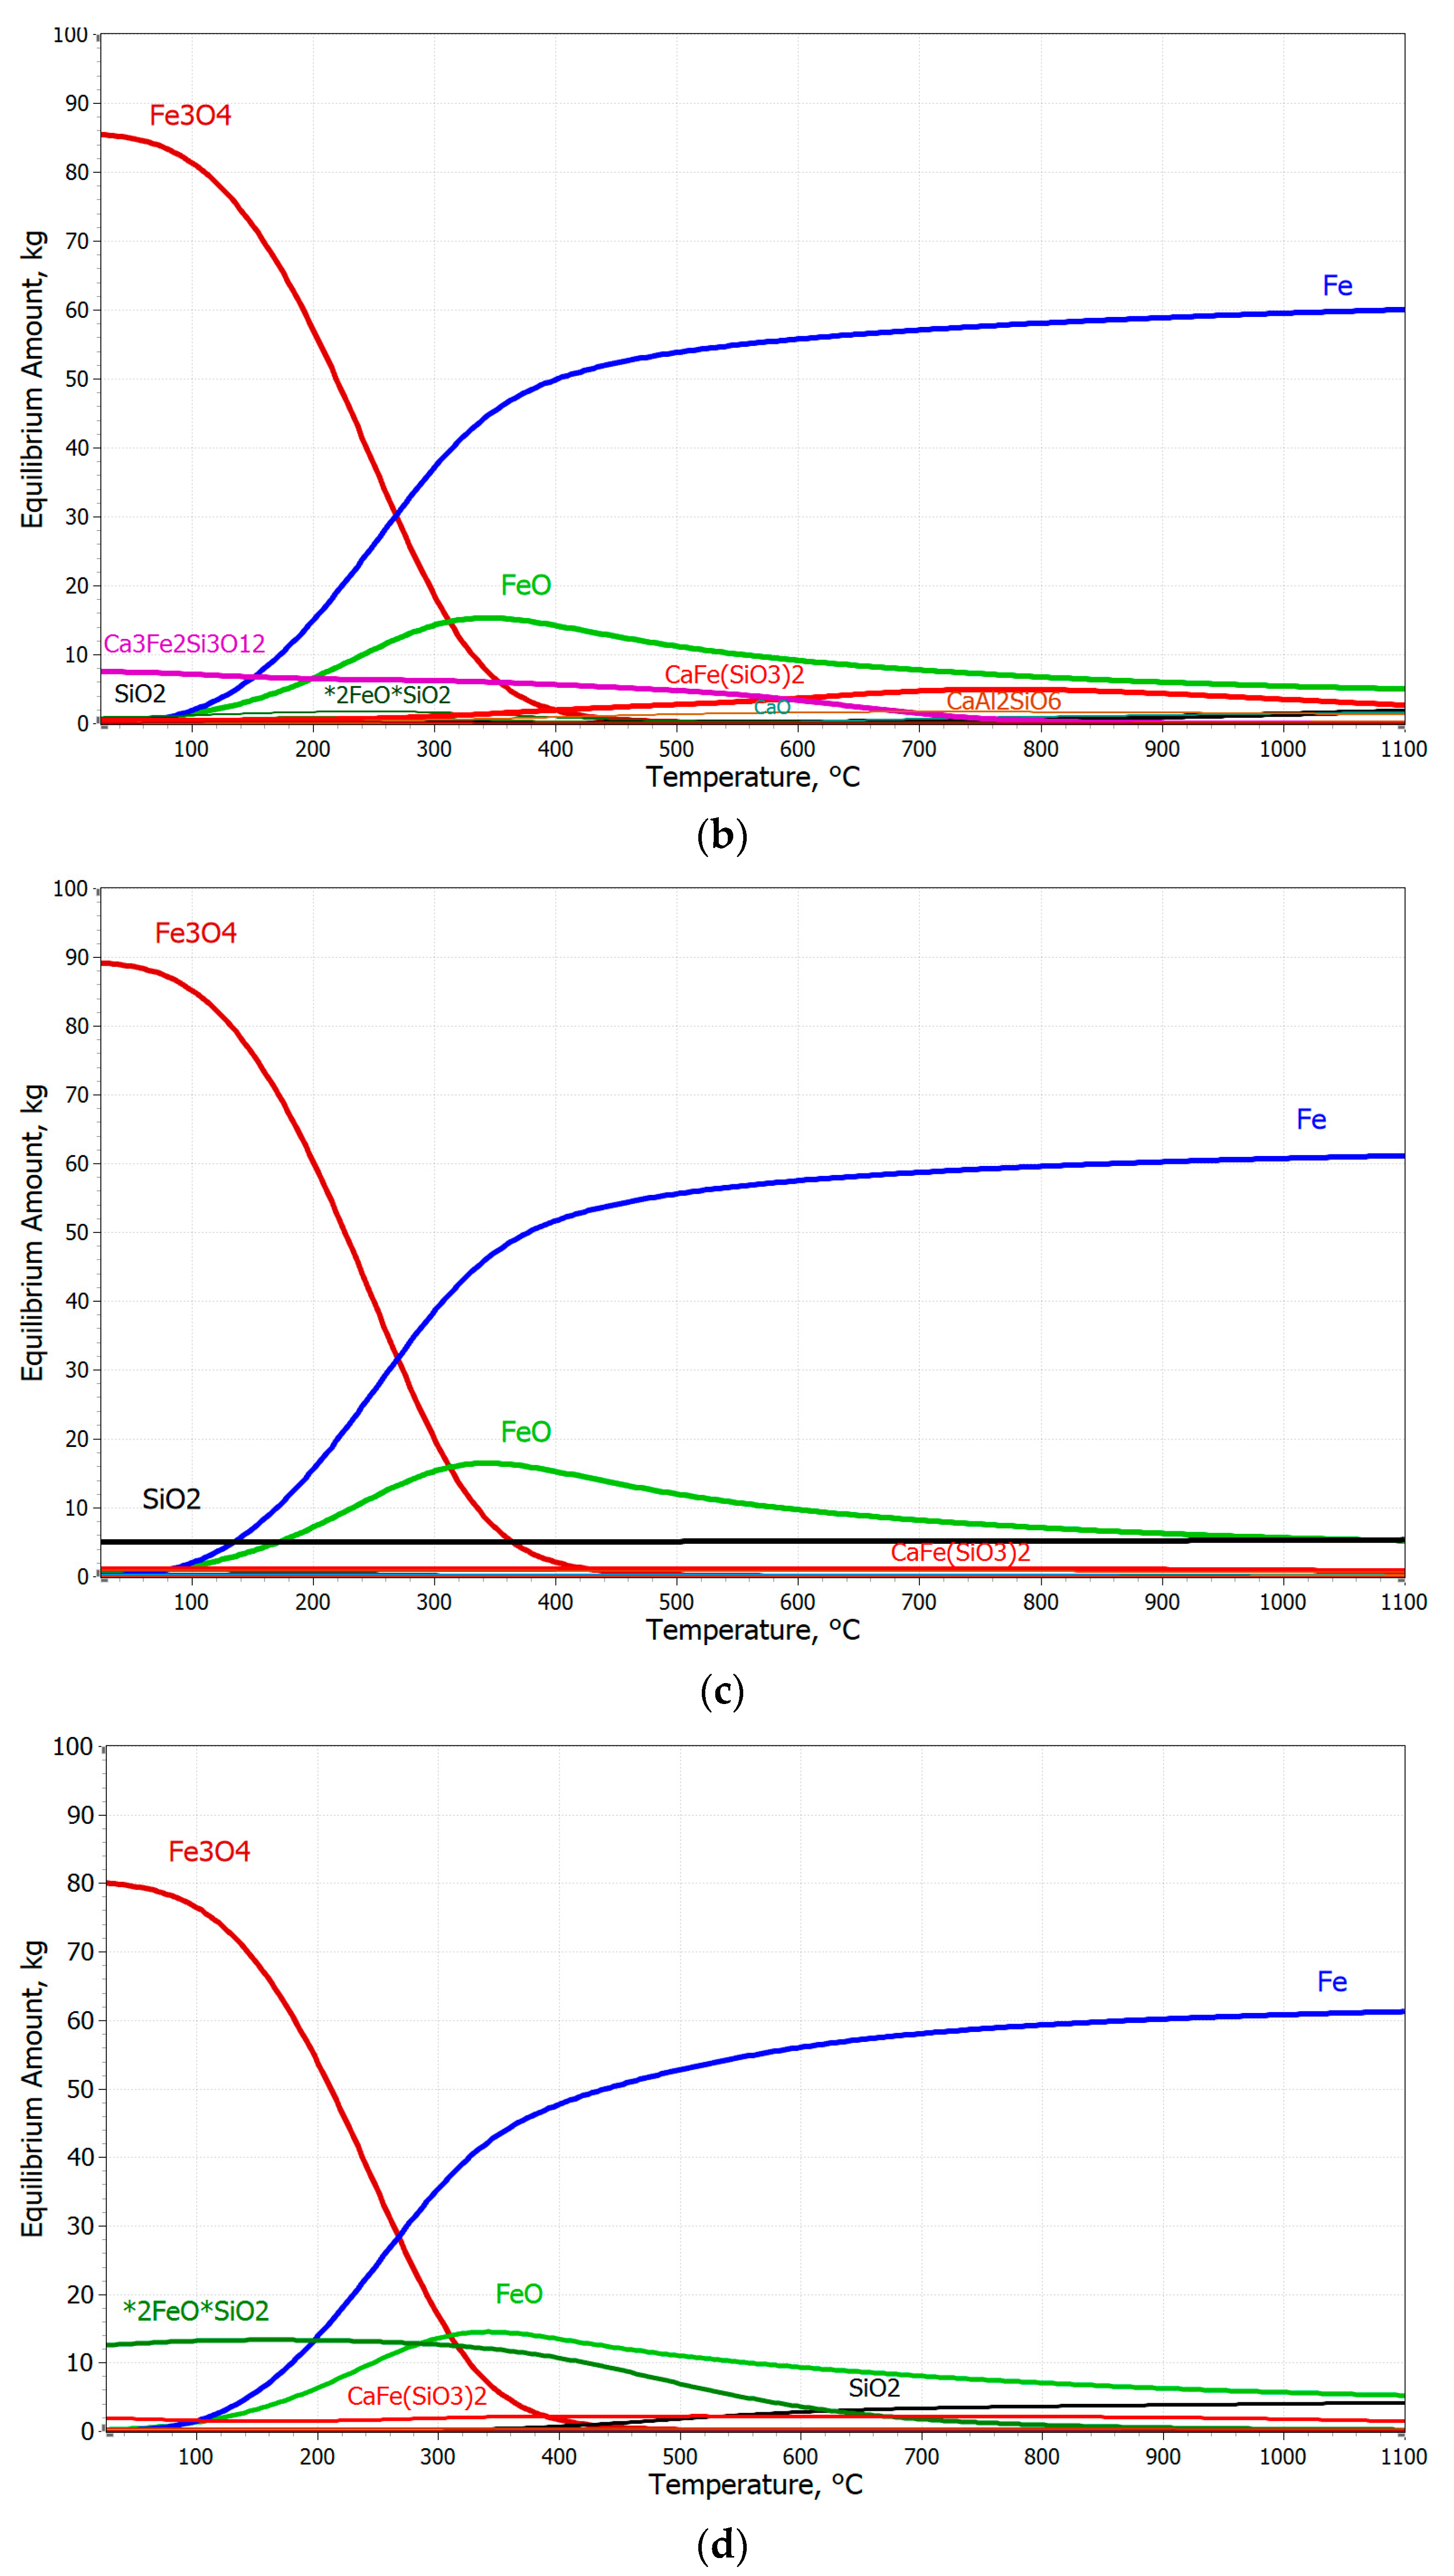
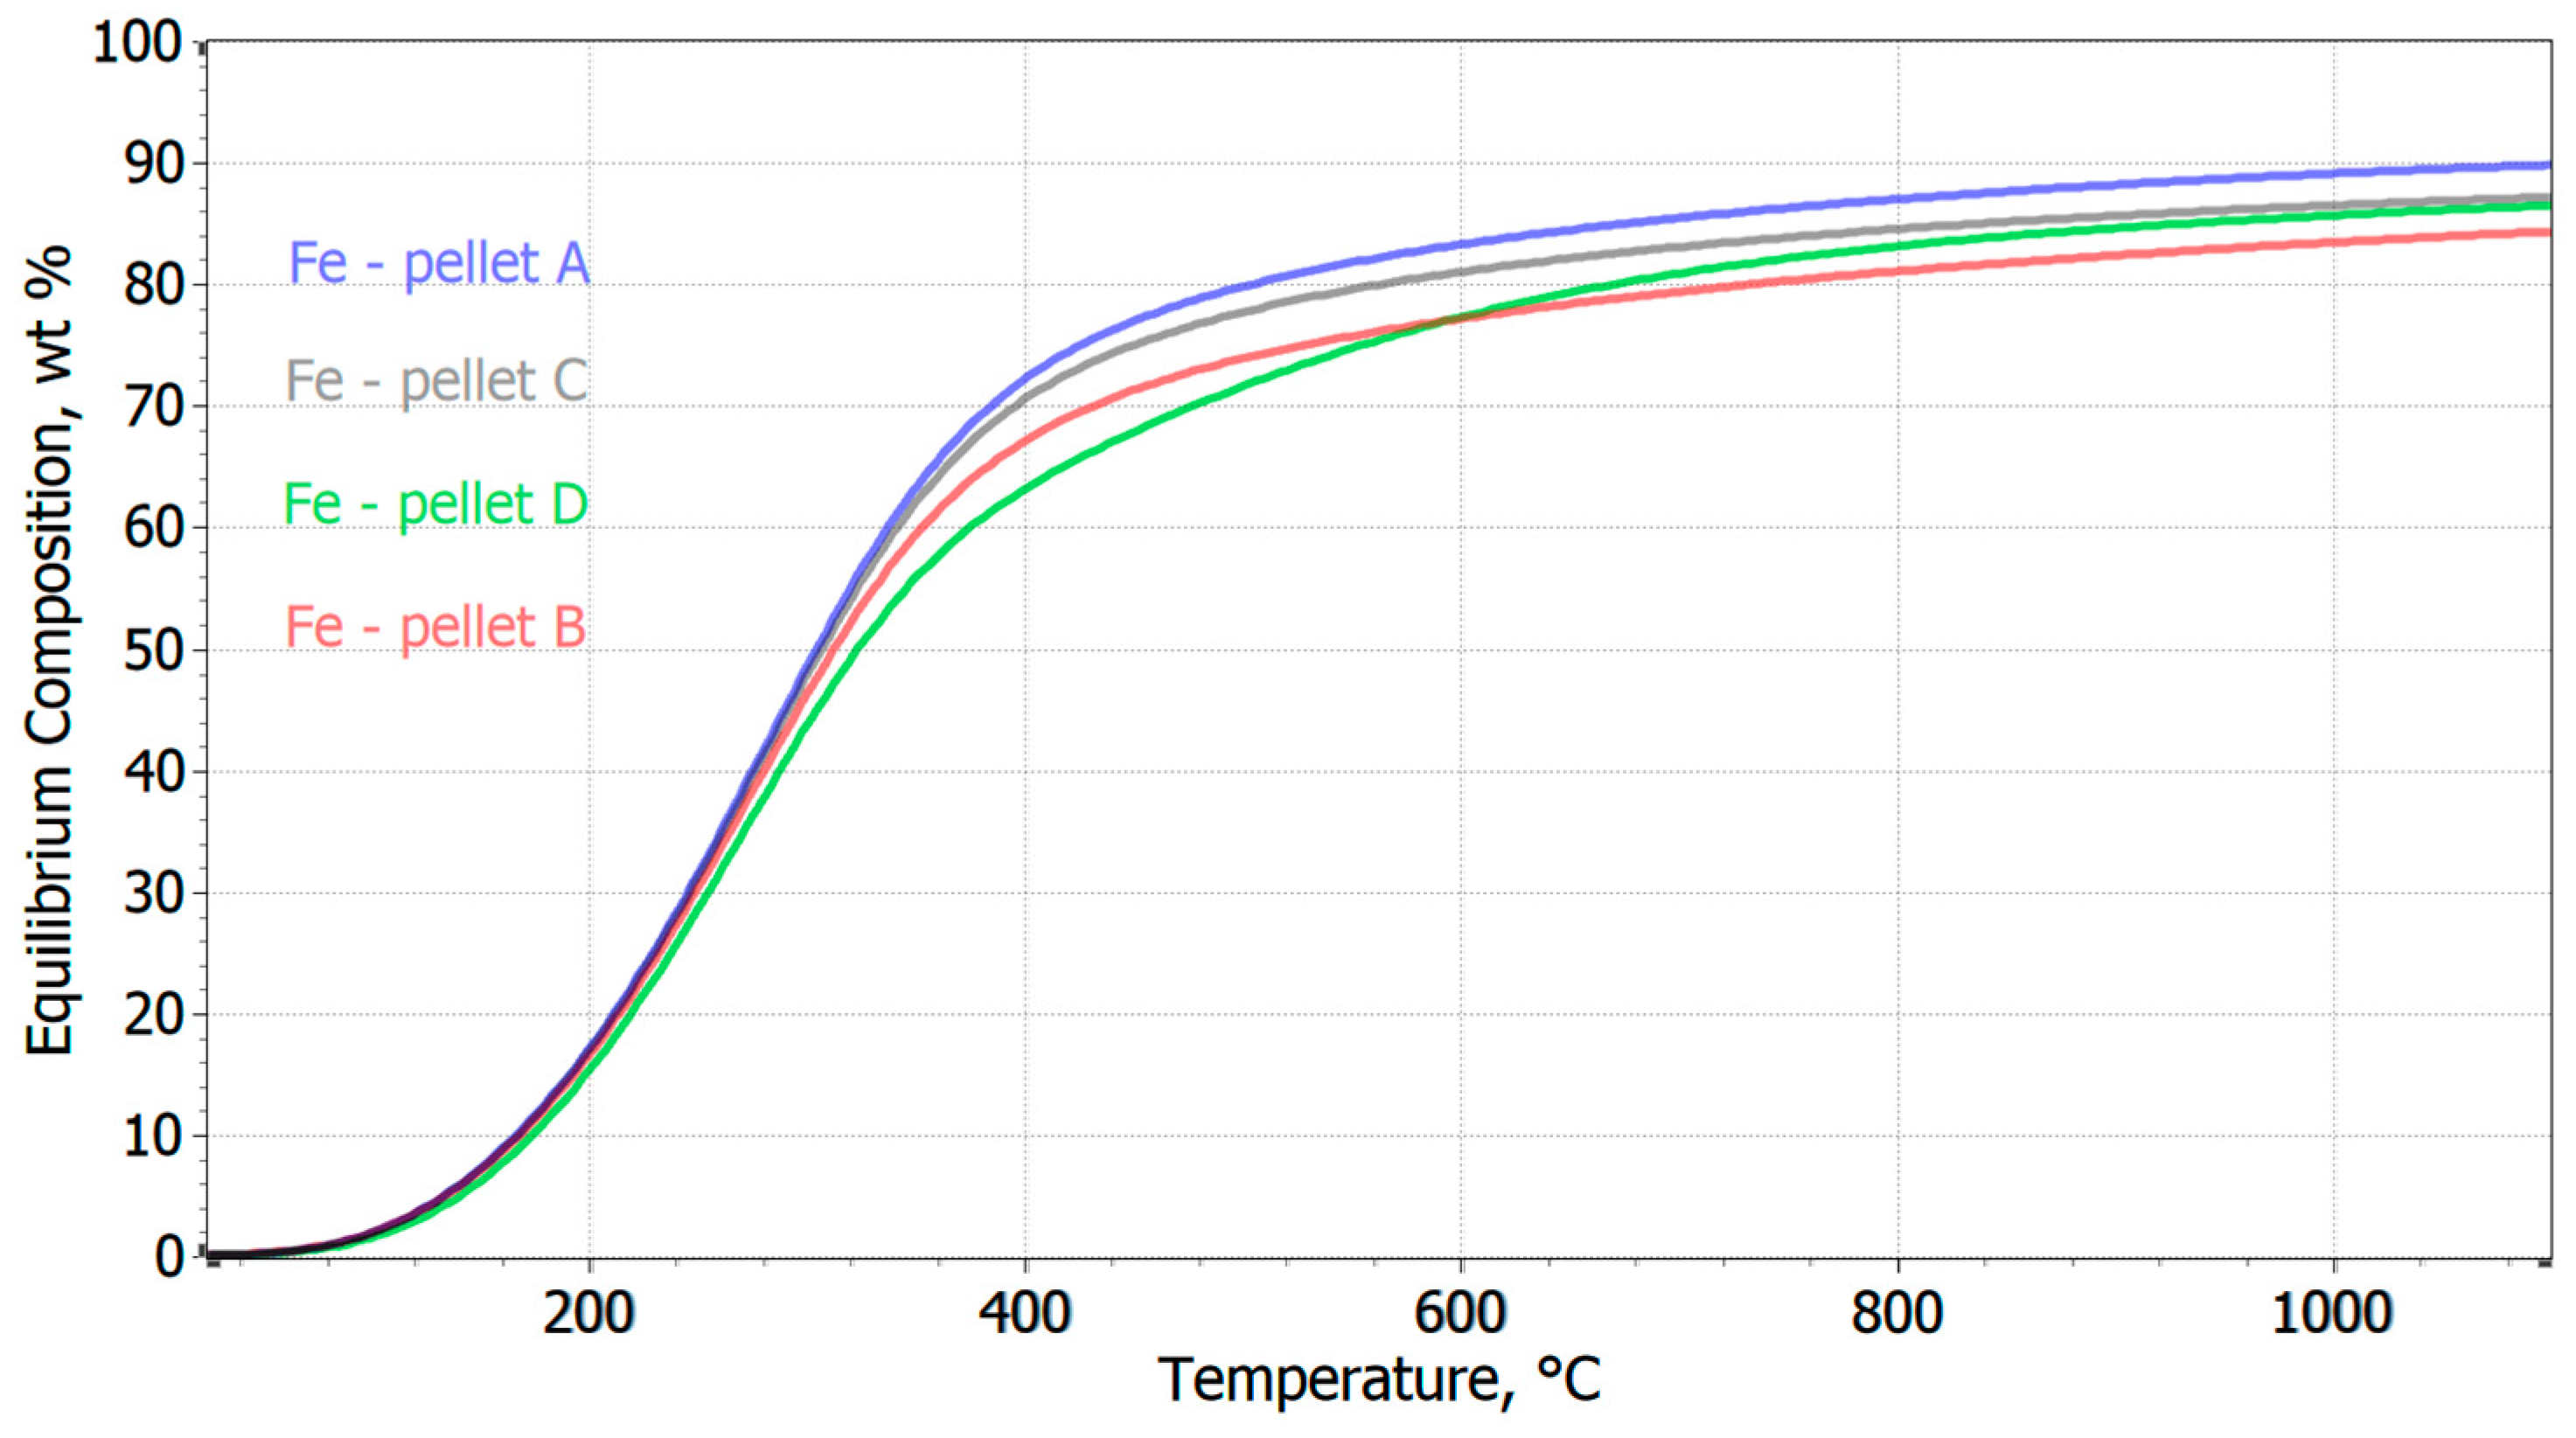
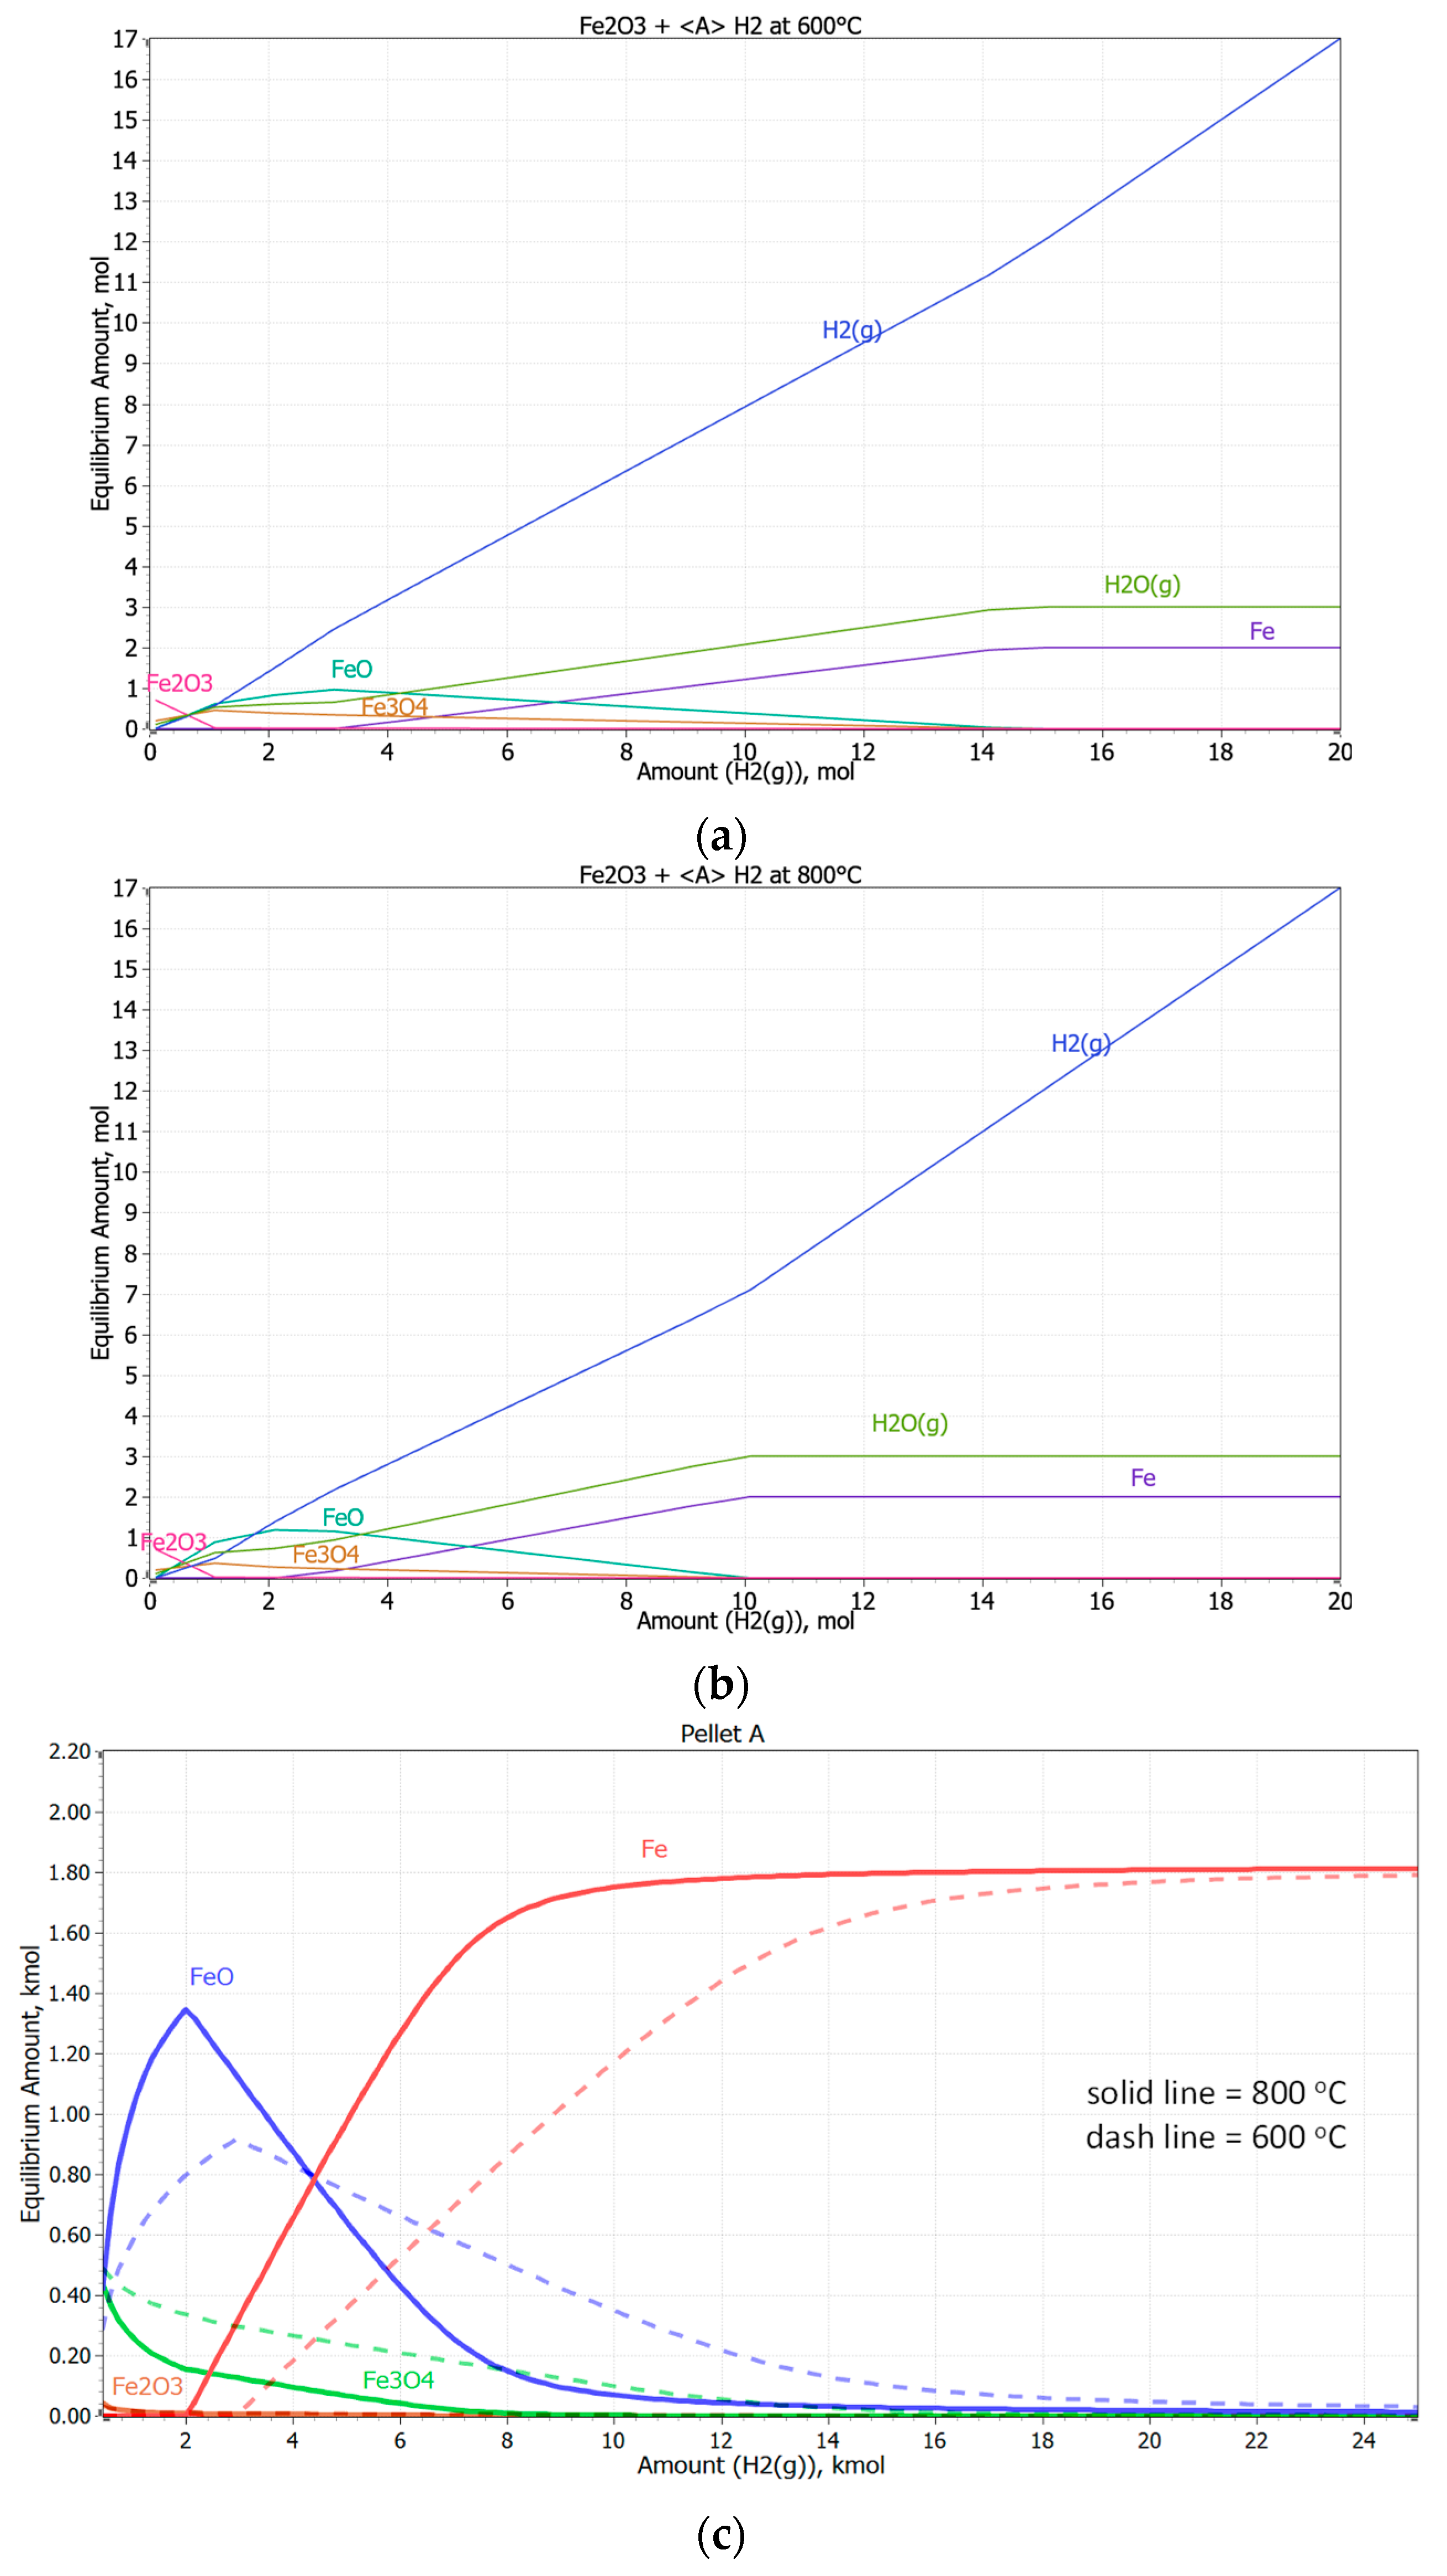
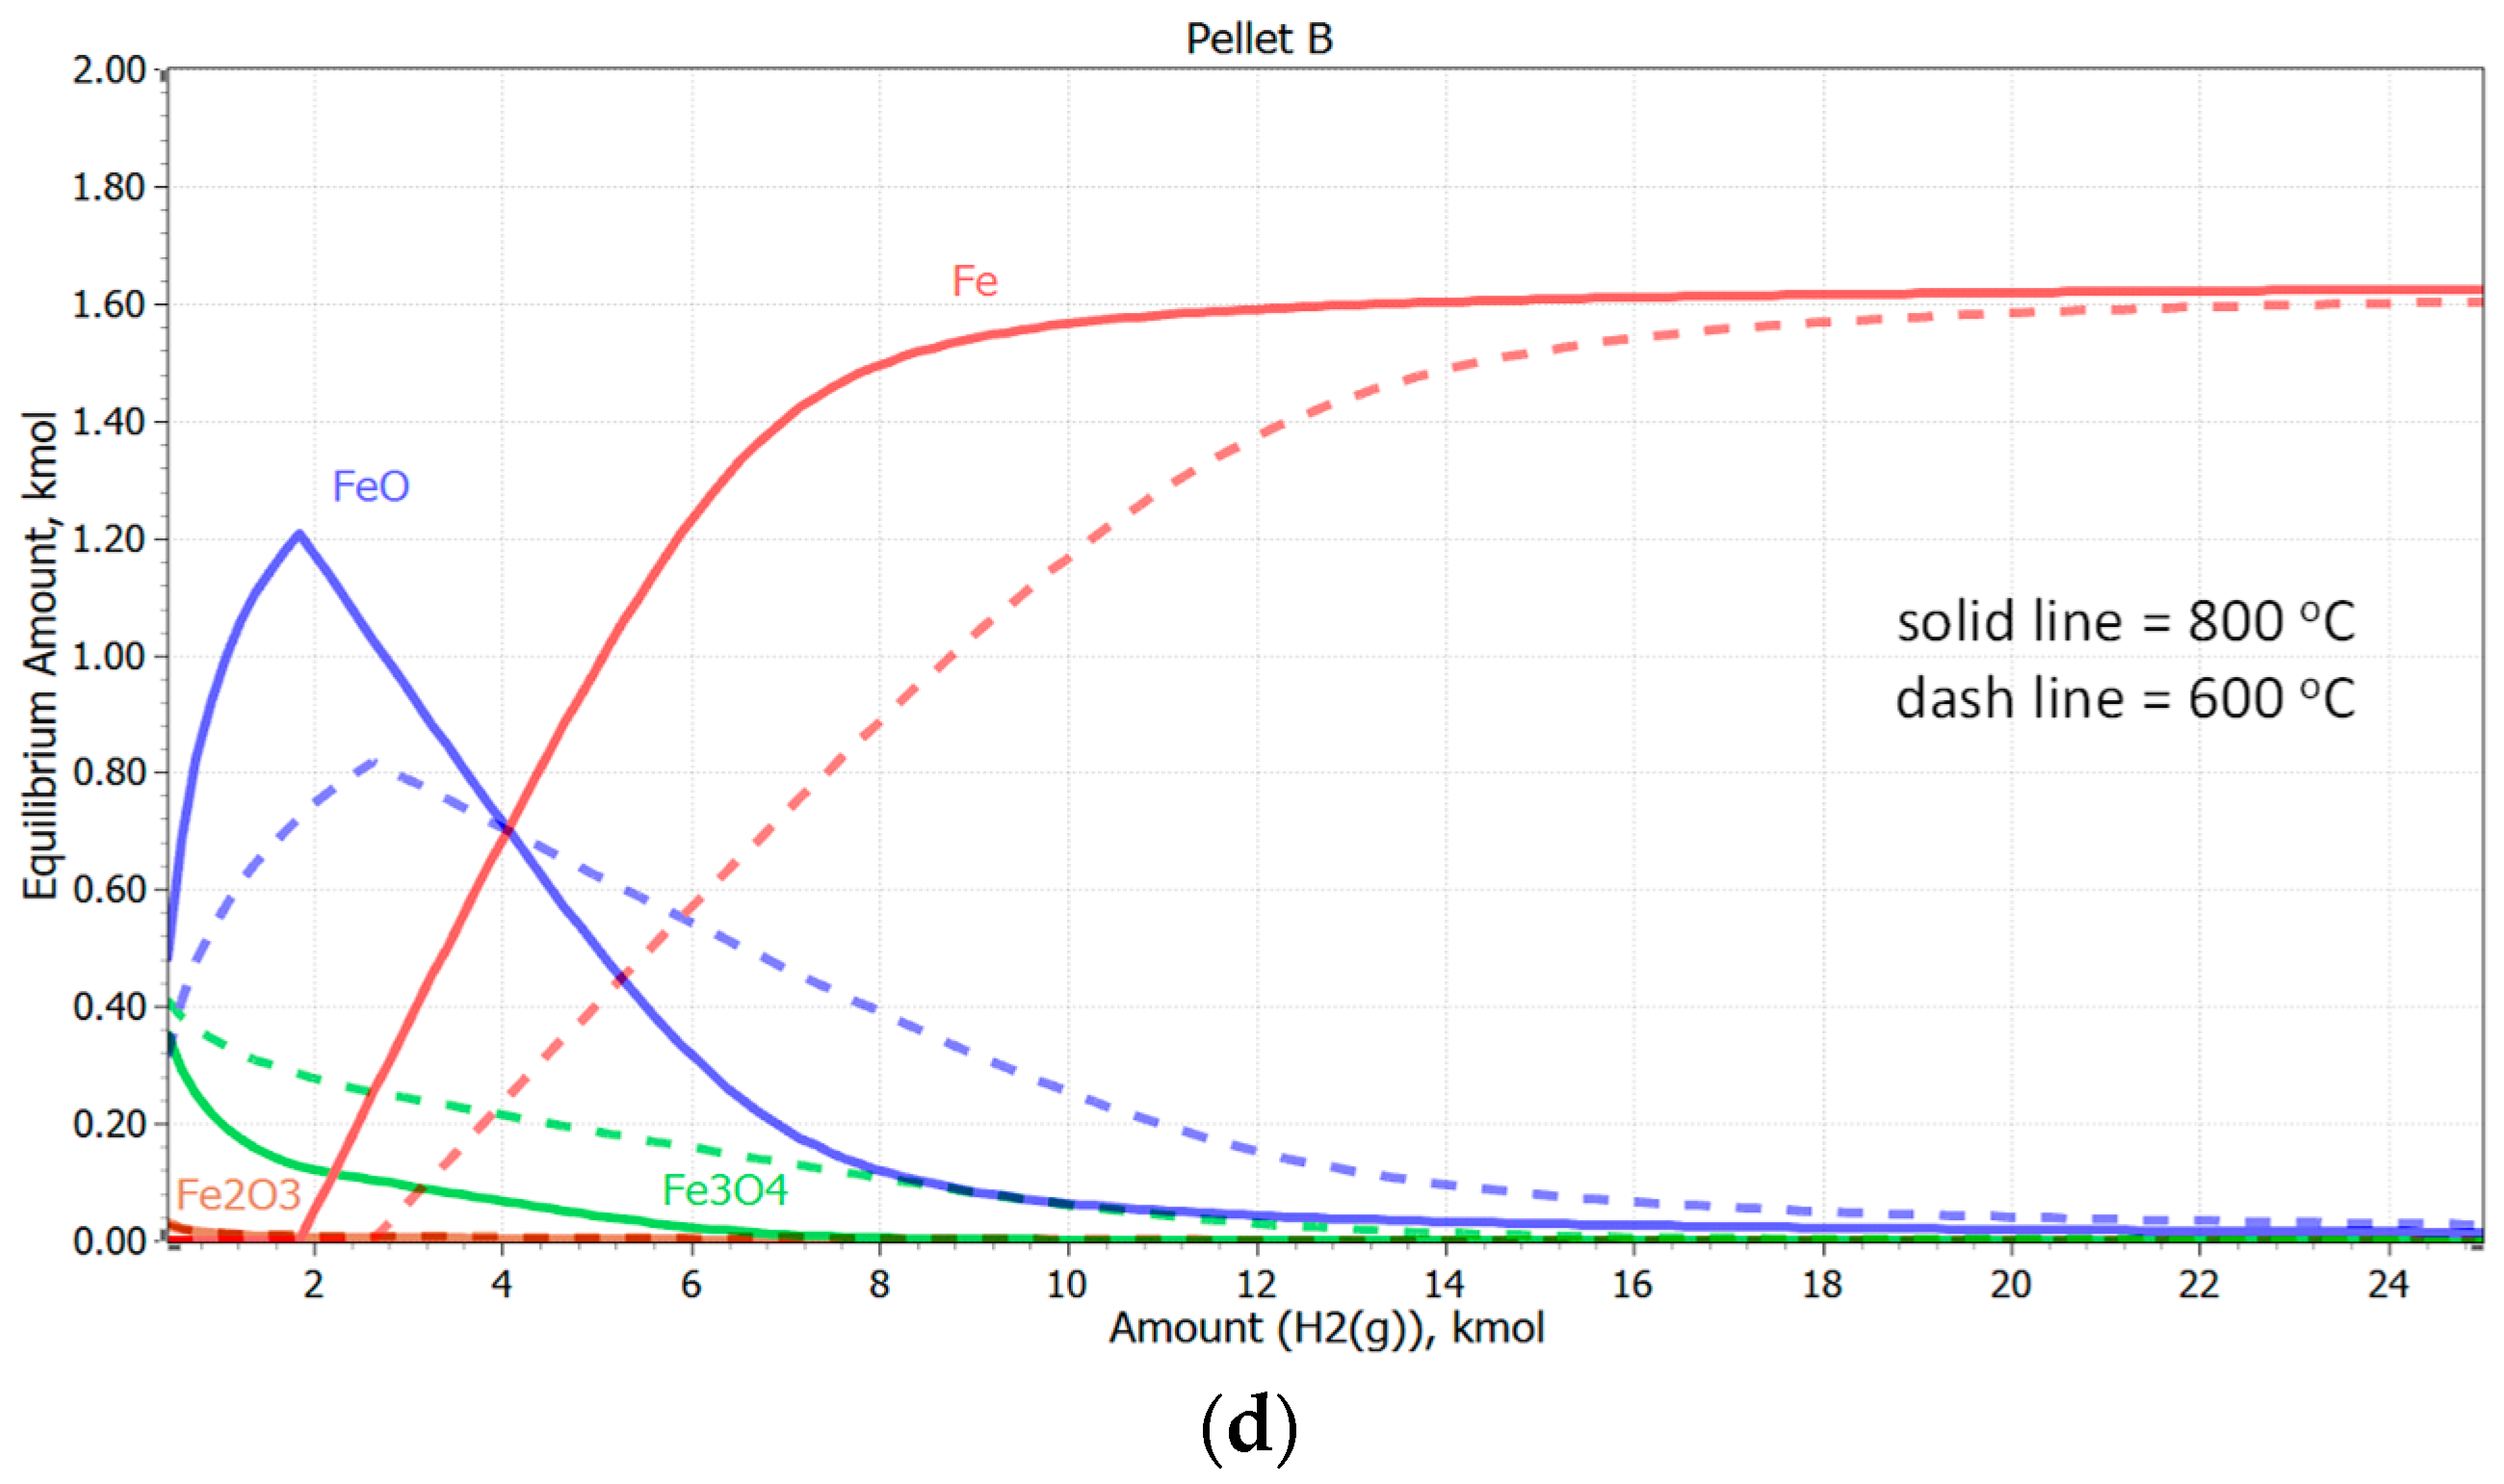
3.2. Thermodynamic Analysis of the Prediction of Pellet Reduction in an H2 Atmosphere
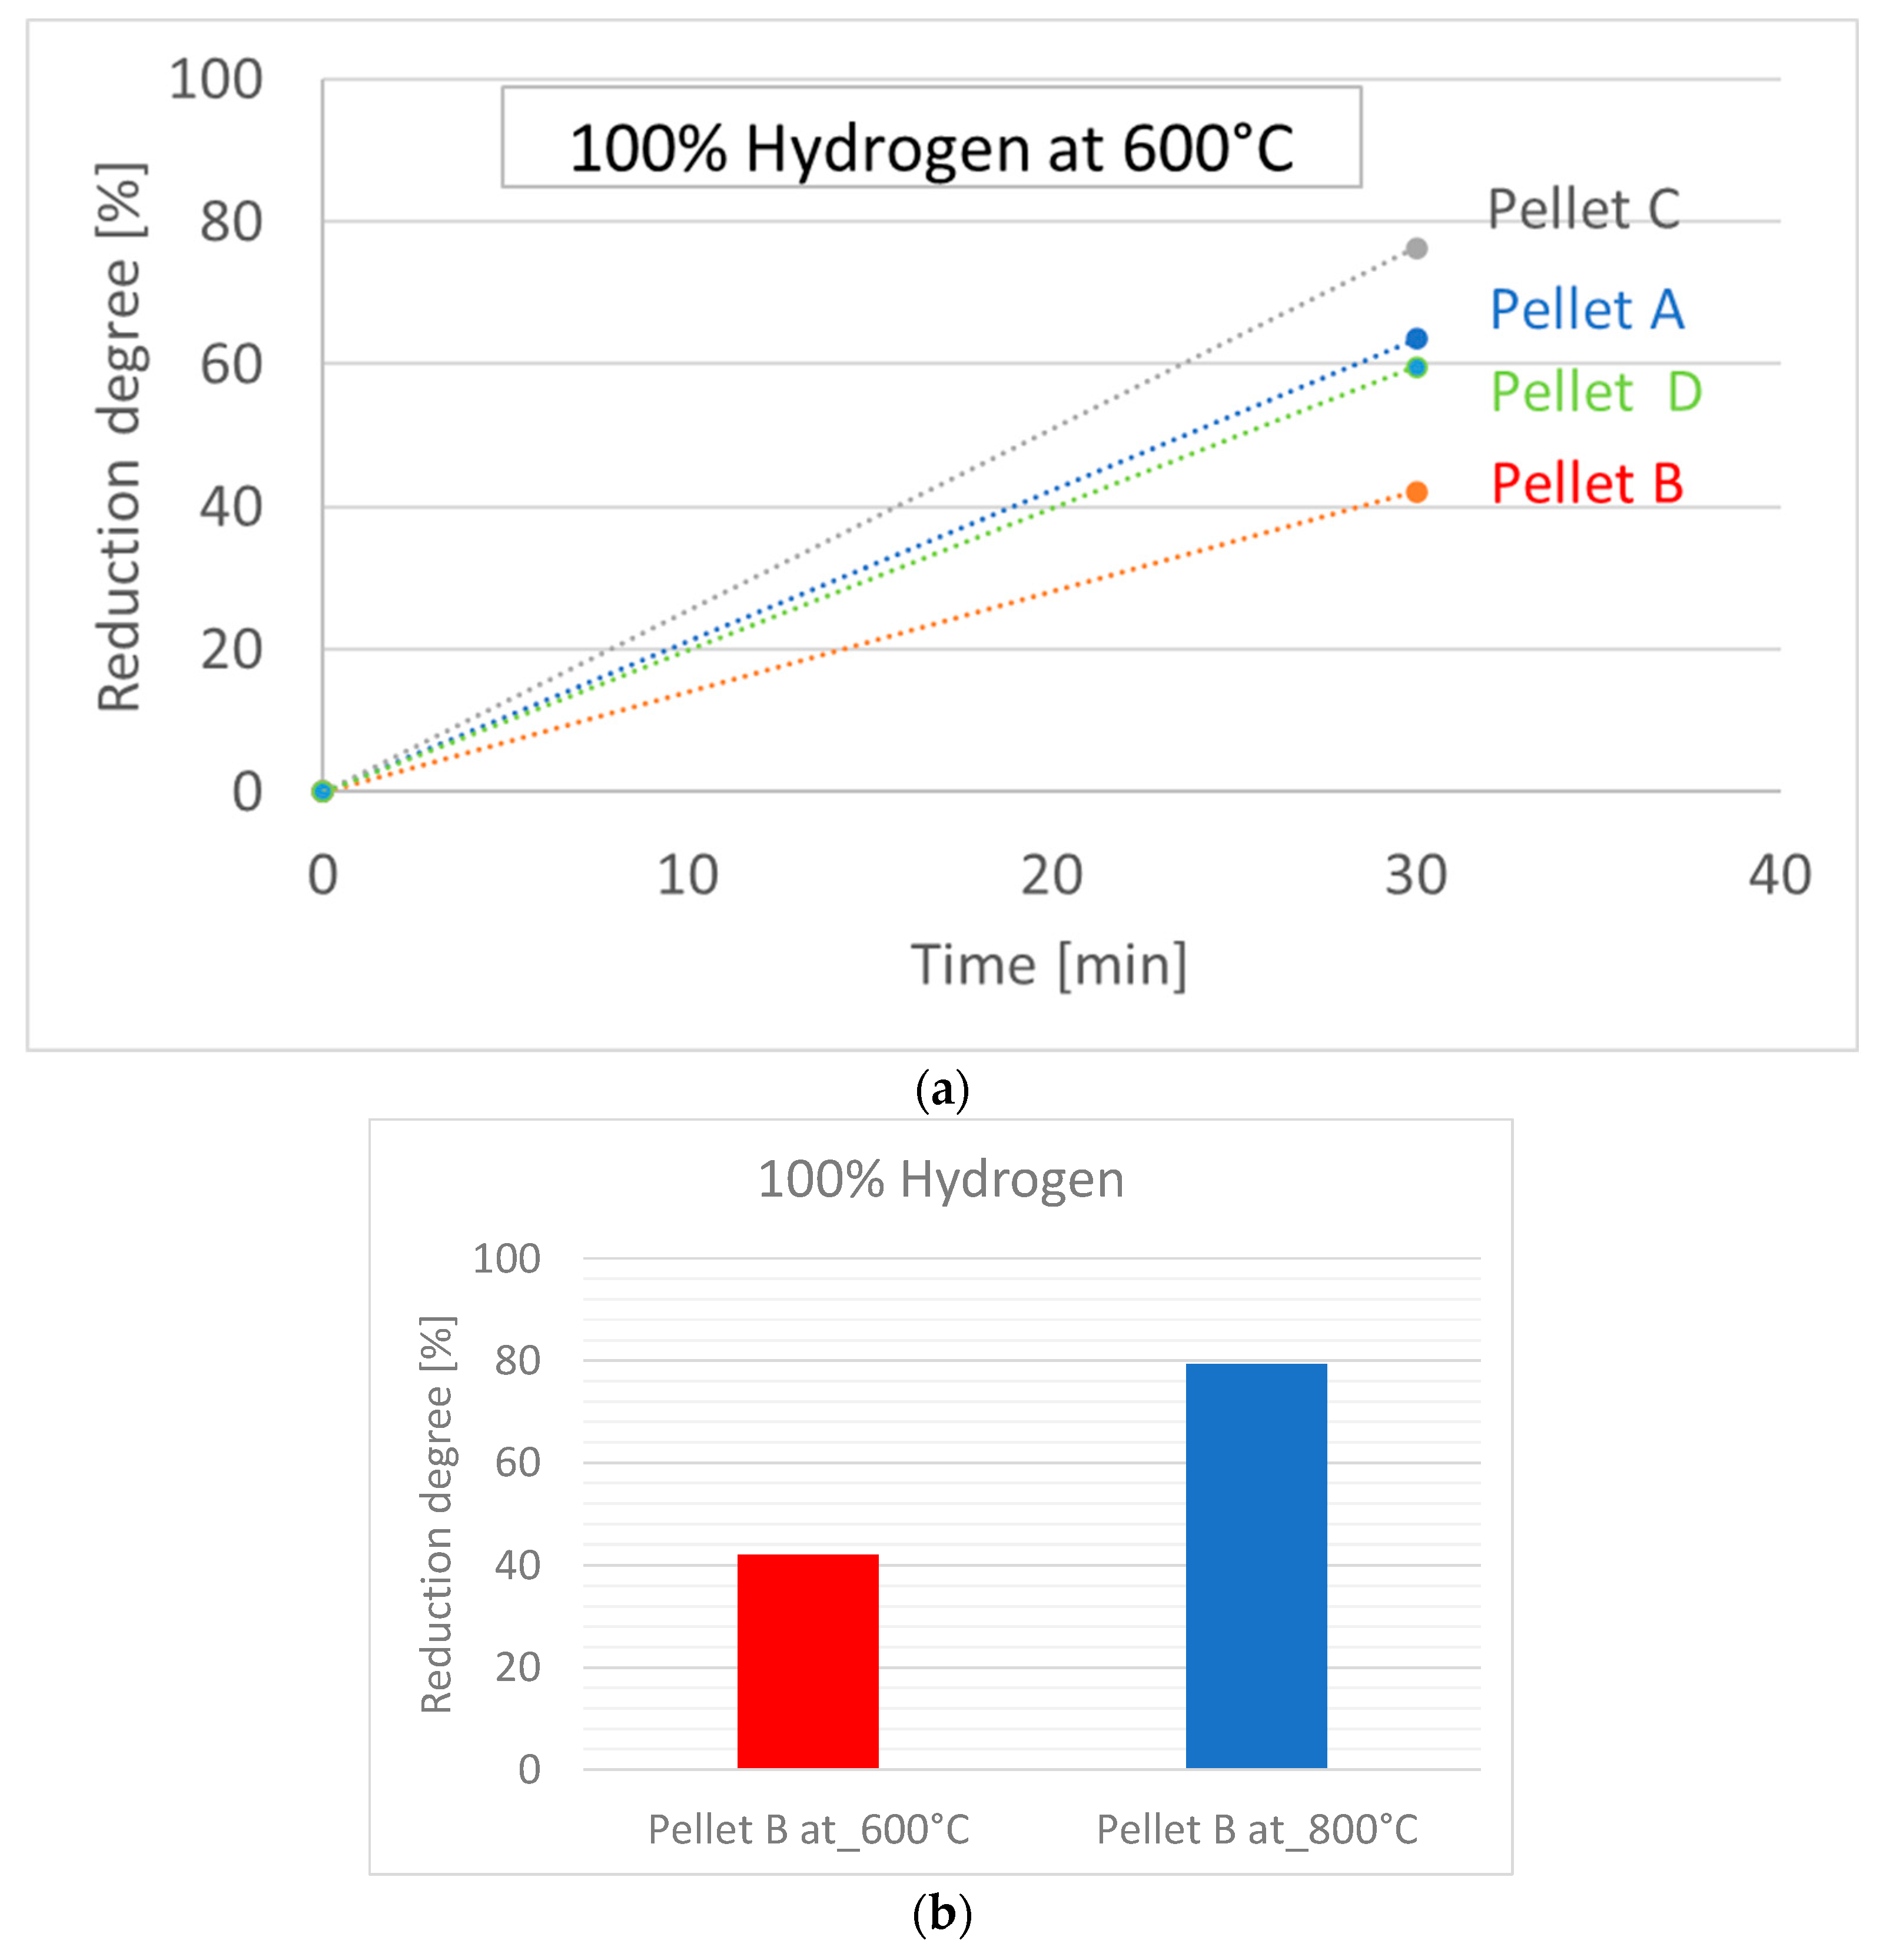
3.3. Reduction of Pellets in 100% H2 Atmosphere
4. Conclusions
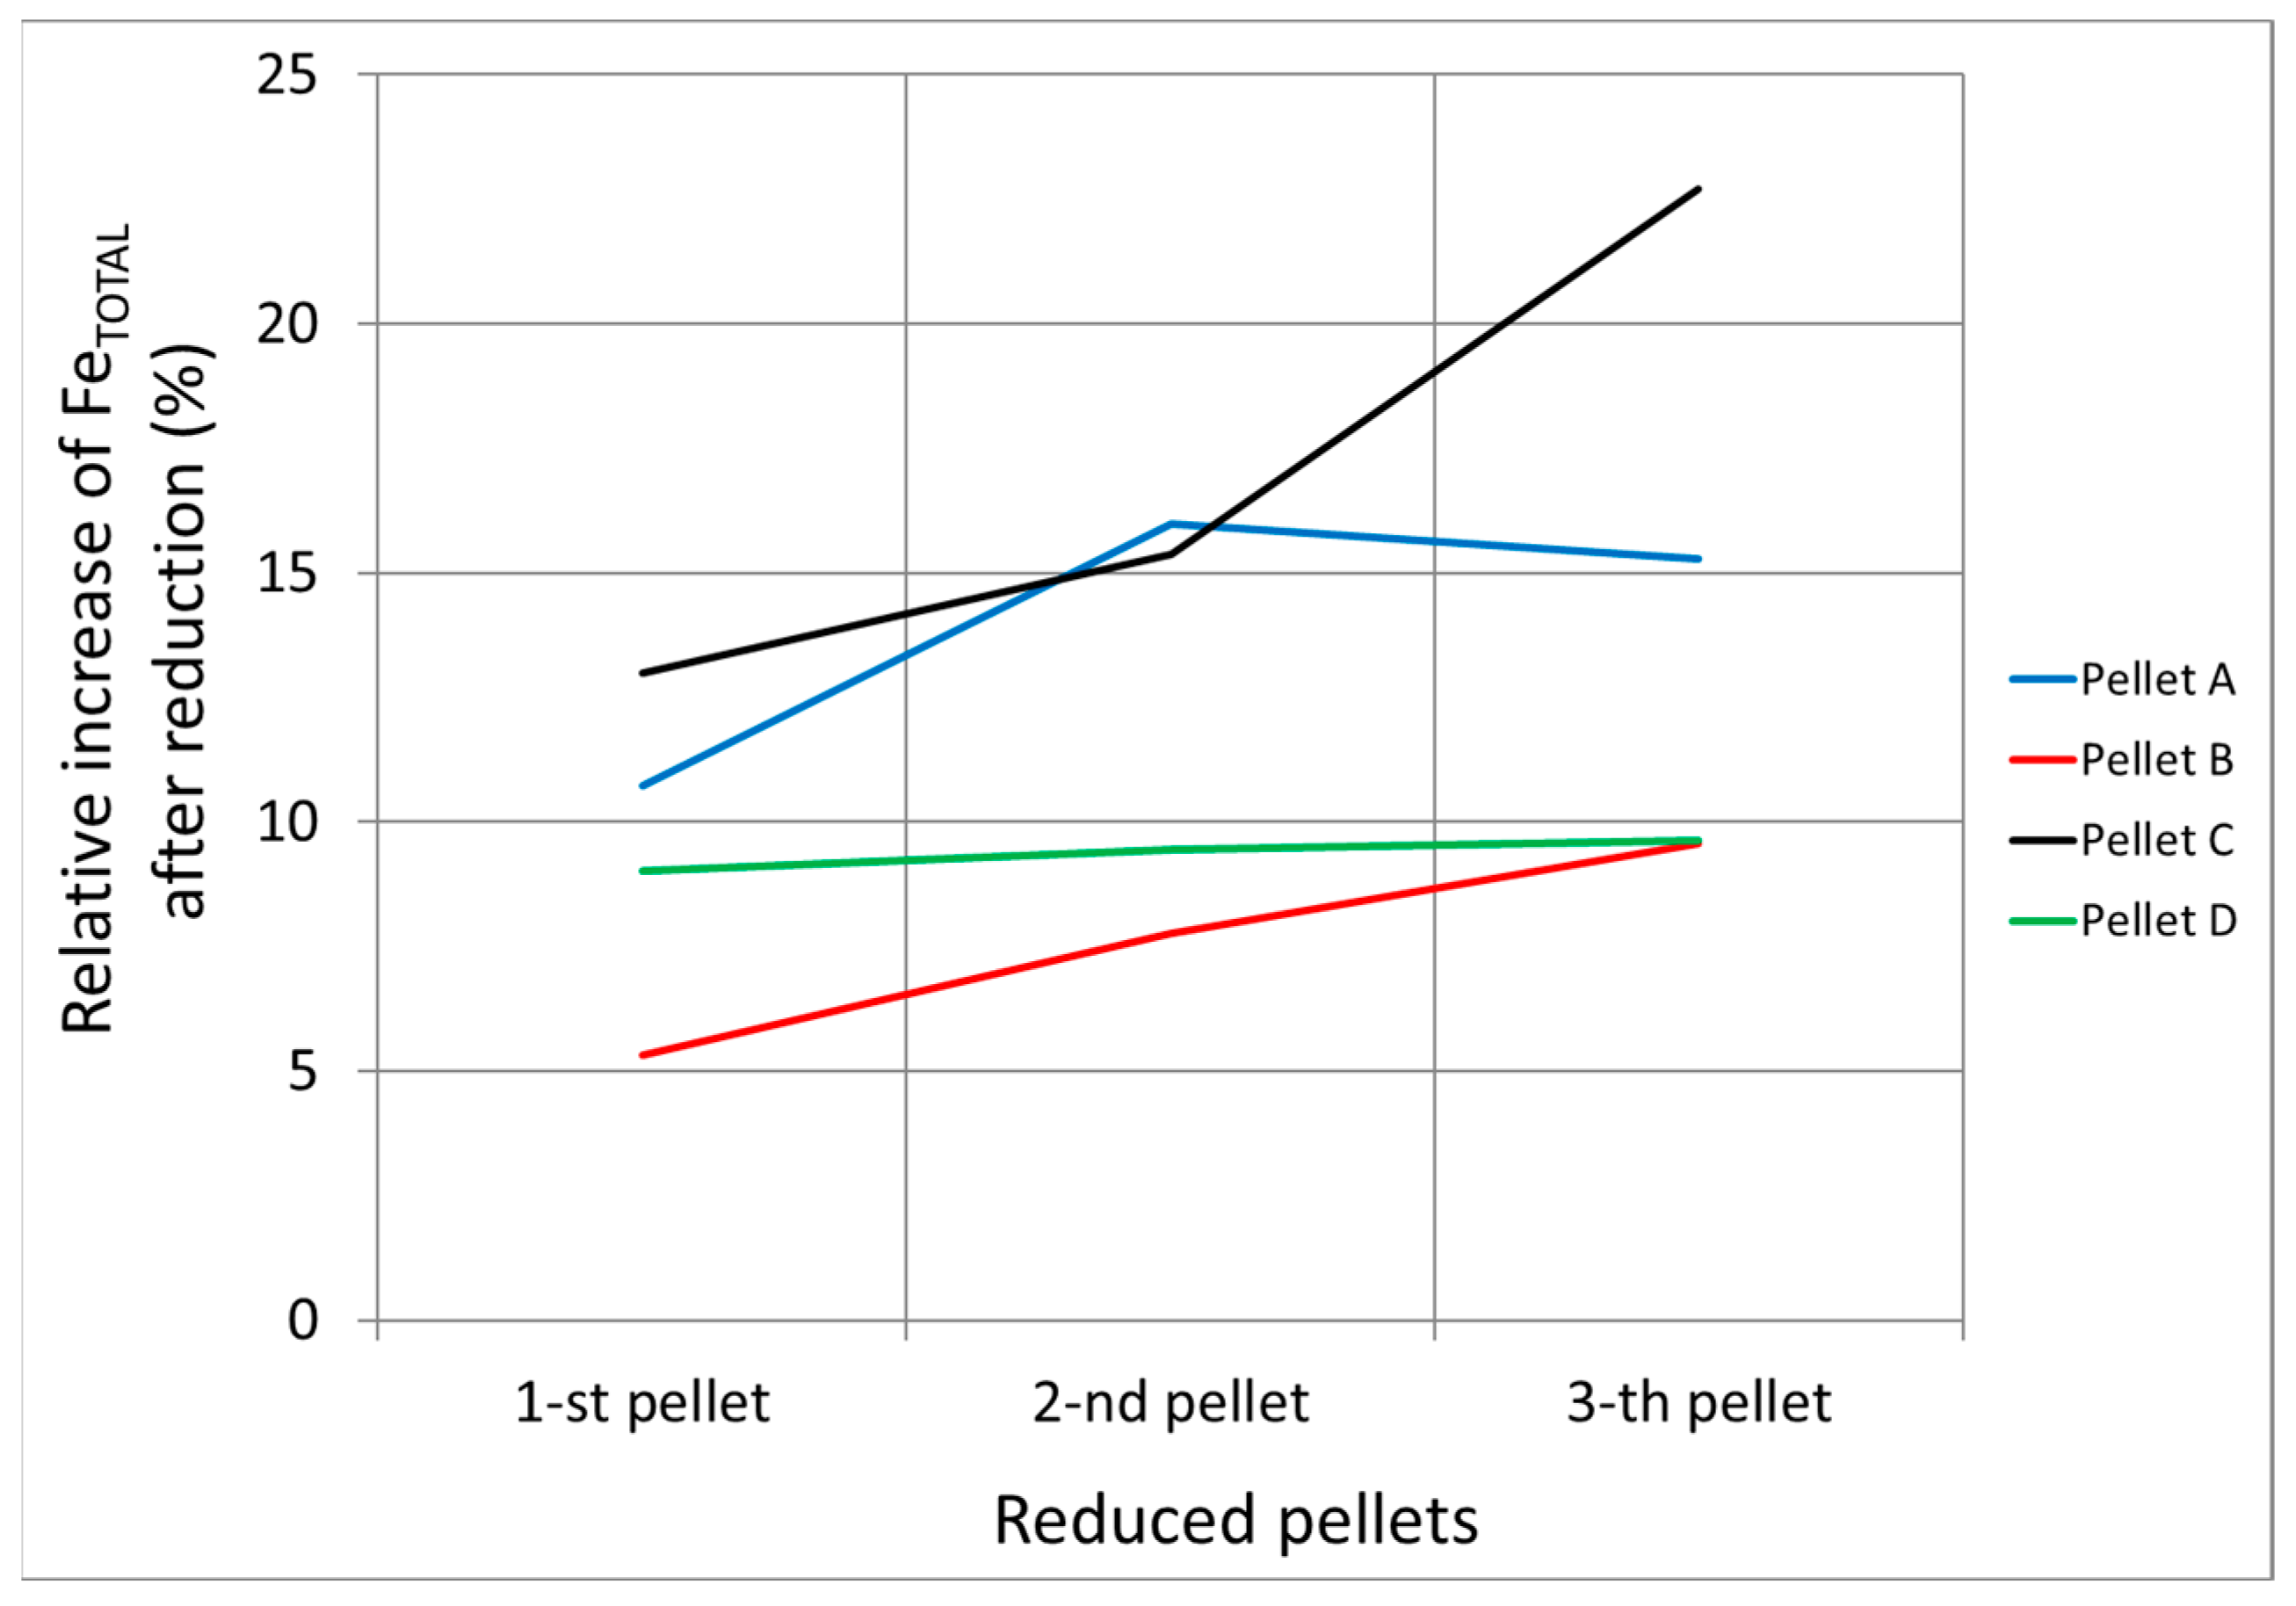
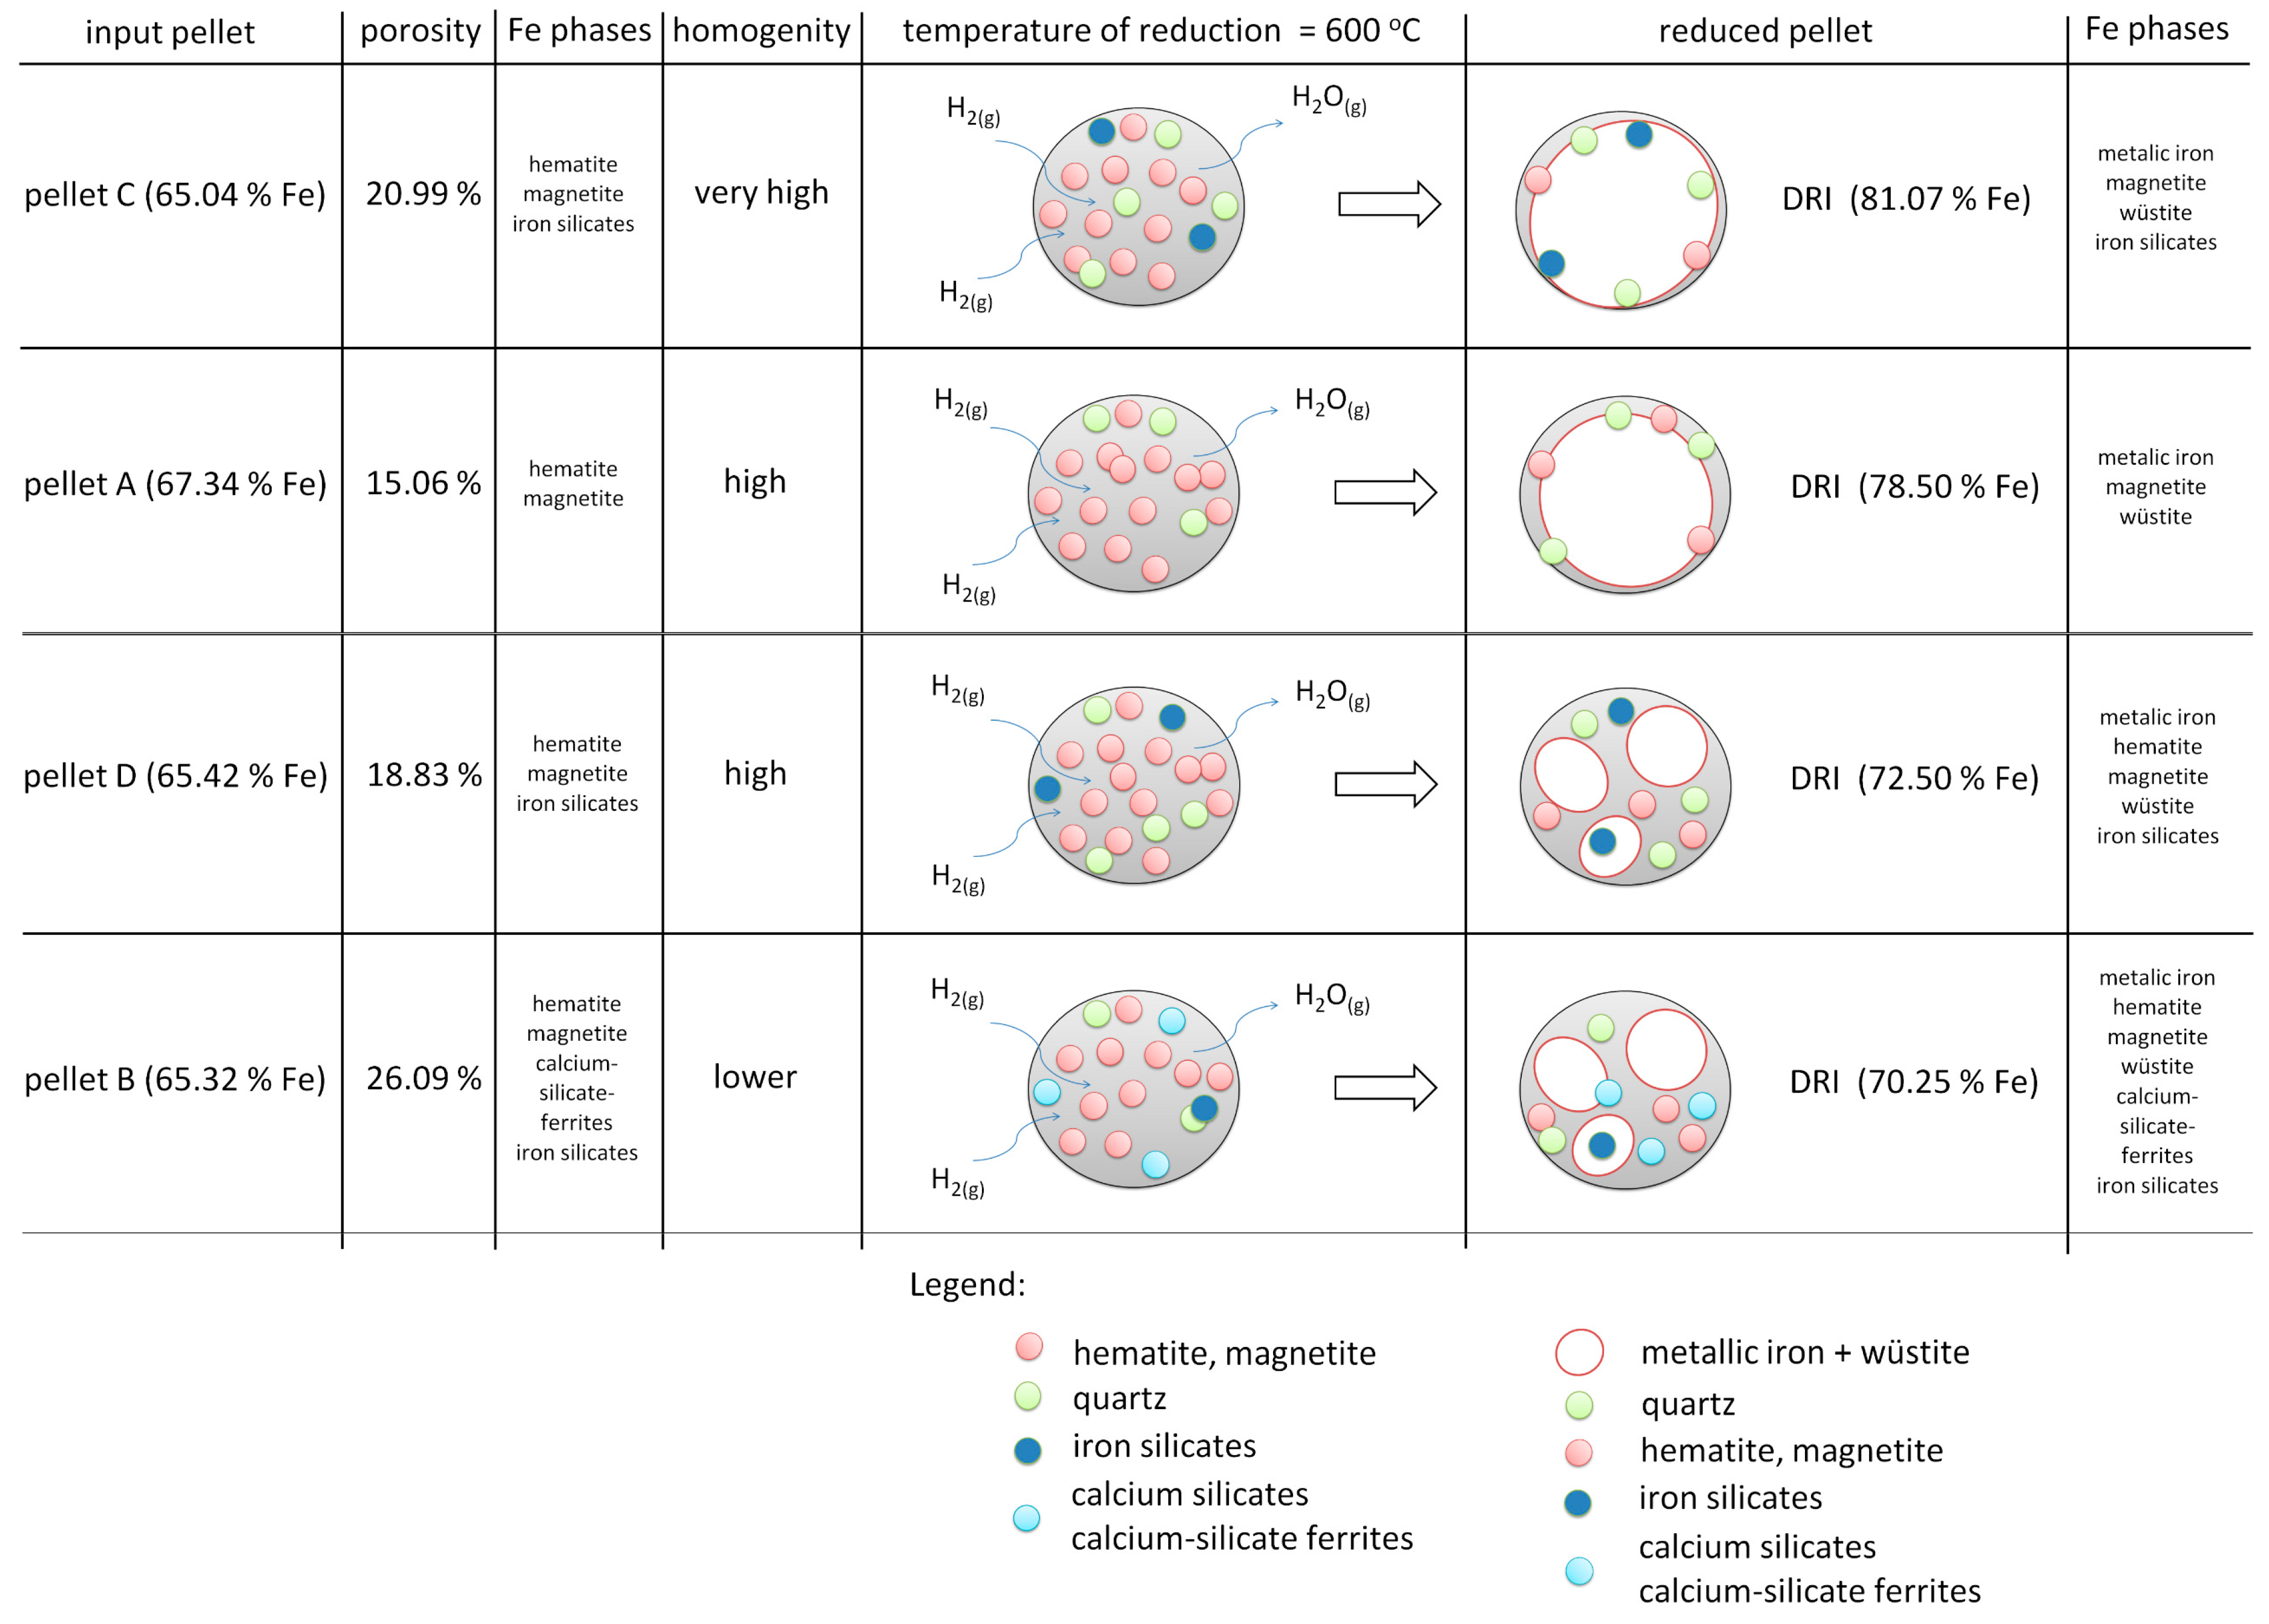
- The chemical composition of the pellets is a decisive factor for their reducibility. A higher FeTOT content in Pellets A and C led to better reduction results. The presence of CaO in Pellet B caused the formation of hard-to-reduce phases, such as calcium-silicate ferrites, which decreased their reducibility. A high SiO2 content in Pellets C and D also negatively affected reducibility due to the formation of iron silicates.
- Based on thermodynamic models, it was anticipated that Pellet A would achieve the highest reduction, while Pellet B was expected to be the least reducible, confirming the presence of difficult-to-reduce calcium silicate ferrites. Thermodynamic simulations showed that the best reduction results could be achieved at higher temperatures, which was subsequently confirmed in experimental tests at temperatures of 600 °C and 800 °C. The increase in temperature from 600 °C to 800 °C significantly improved the speed and efficiency of the reduction.
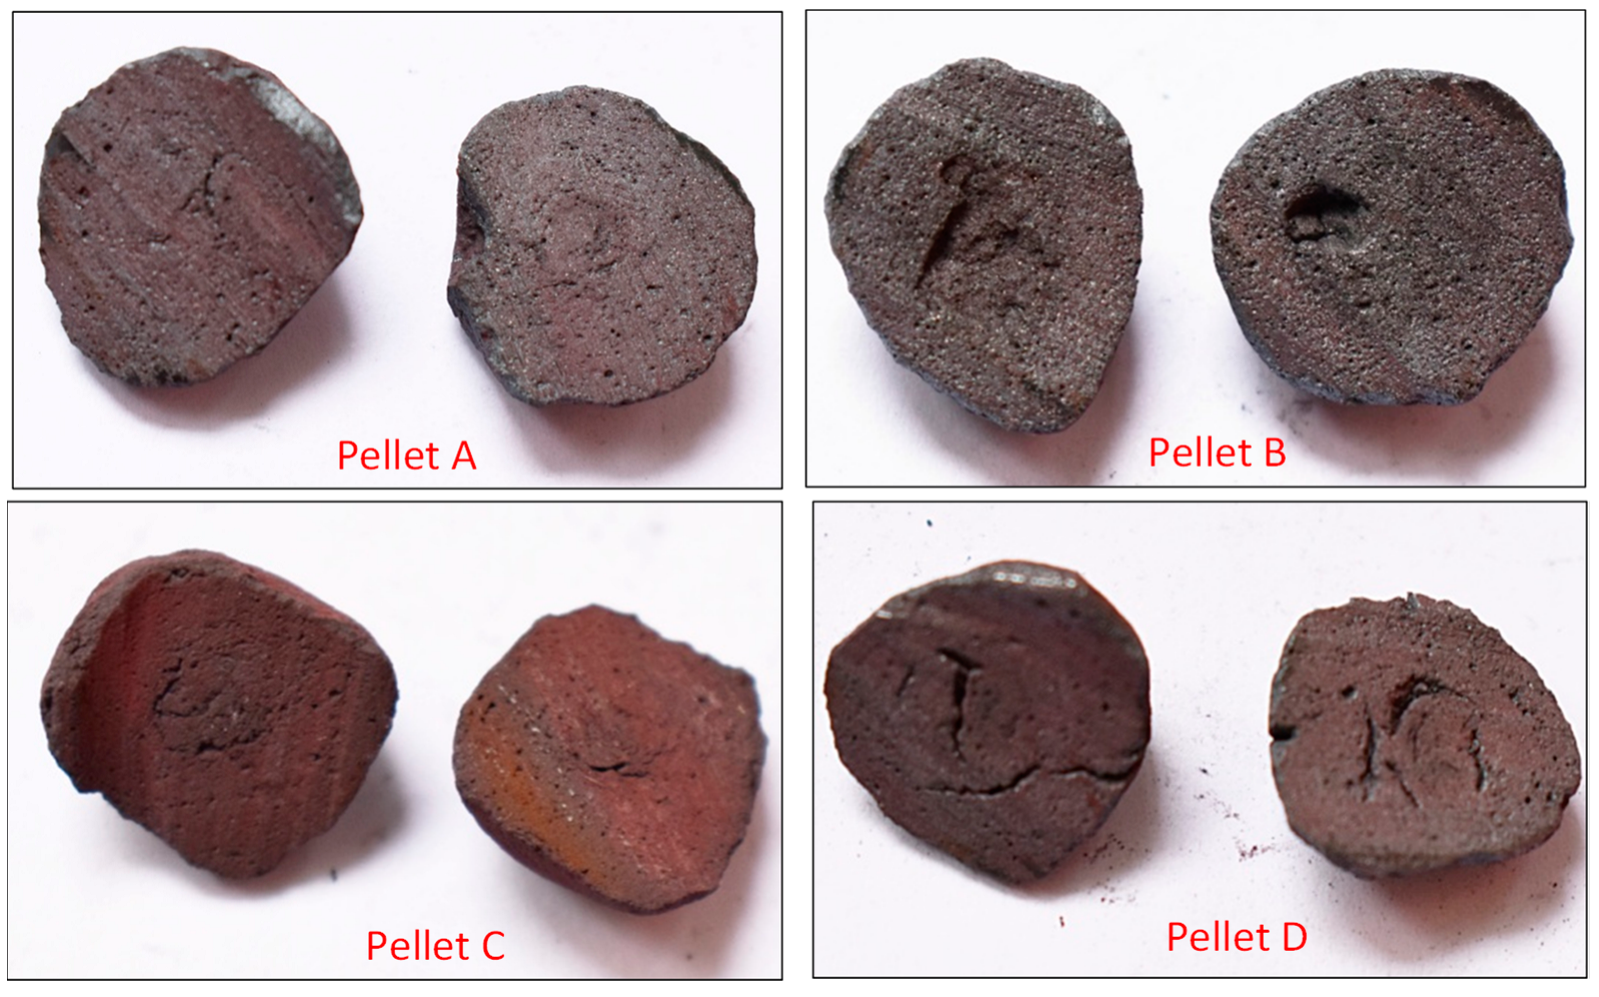
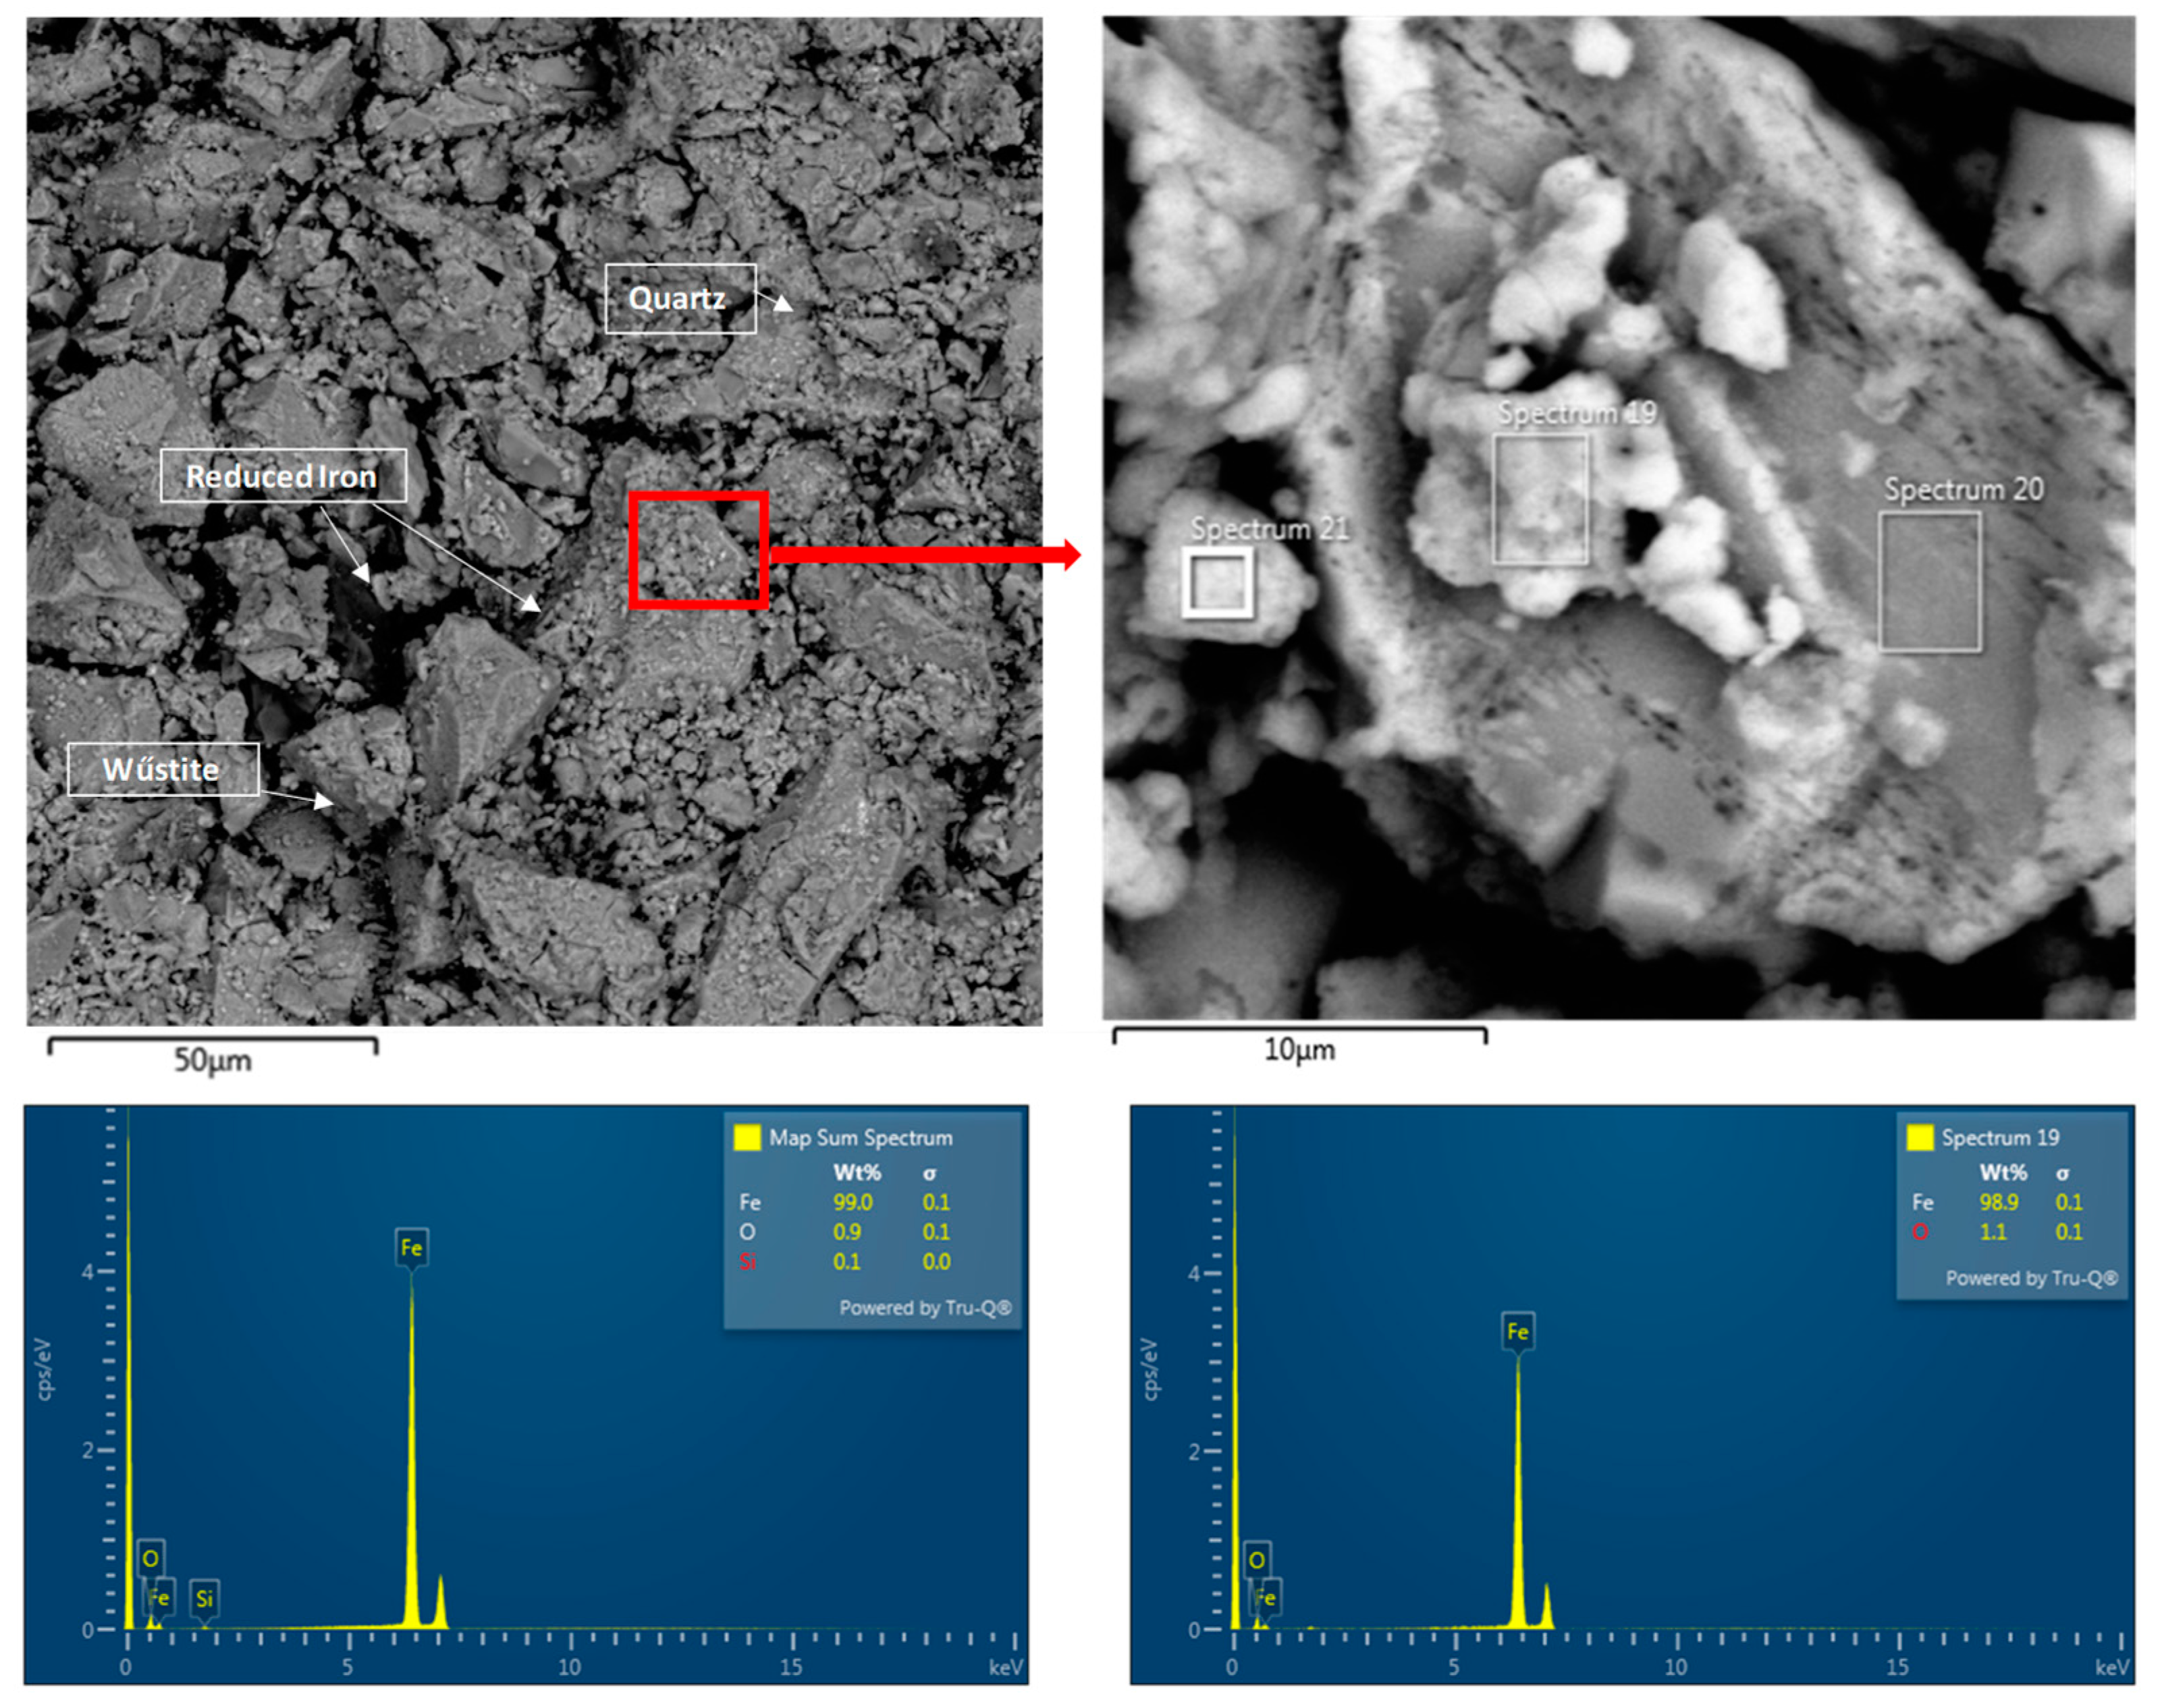
- The microstructural analysis showed that a uniform phase distribution and higher porosity improve the access of the reducing gas to the surface of the particles. Despite expectations, Pellet C achieved better results than Pellet A, which is attributed to its homogeneous microstructure and evenly distributed pores. These findings are crucial when evaluating the reduction potential of pellets at 600 °C and provide valuable insights for further optimization of iron production in industrial conditions.
- Pellets with higher porosity exhibited a higher degree of reduction due to better hydrogen diffusion. Pellet C, with higher porosity, achieved better results than Pellet A. A homogeneous distribution of pores, as observed in Pellet C, is advantageous for more efficient reduction.
- The best reducibility results were achieved by Pellets C and A, while Pellet B showed the worst results due to the presence of hard-to-reduce phases. Higher temperatures and homogeneous porosity are key to increasing the reducibility of pellets in pure hydrogen at the observed reduction temperatures.
Author Contributions
Funding
Data Availability Statement
Conflicts of Interest
References
- Rosner, F.; Papadias, D.; Brooks, K.; Yoro, K.; Ahluwalia, R.; Autrey, T.; Breunig, H. Green Steel: Design and Cost Analysis of Hydrogen-Based Direct Iron Reduction. Energy Environ. Sci. 2023, 16, 4121–4134. [Google Scholar] [CrossRef]
- Wesseling, J.H.; Lechtenböhmer, S.; Åhman, M.; Nilsson, L.J.; Worrell, E.; Coenen, L. The Transition of Energy Intensive Processing Industries towards Deep Decarbonization: Characteristics and Implications for Future Research. Renew. Sustain. Energy Rev. 2017, 79, 1303–1313. [Google Scholar] [CrossRef]
- Bararzadeh Ledari, M.; Khajehpour, H.; Akbarnavasi, H.; Edalati, S. Greening Steel Industry by Hydrogen: Lessons Learned for the Developing World. Int. J. Hydrogen Energy 2023, 48, 36623–36649. [Google Scholar] [CrossRef]
- Shahabuddin, M.; Brooks, G.; Rhamdhani, M.A. Decarbonisation and Hydrogen Integration of Steel Industries: Recent Development, Challenges and Technoeconomic Analysis. J. Clean. Prod. 2023, 395, 136391. [Google Scholar] [CrossRef]
- Miškovičová, Z.; Legemza, J.; Demeter, P.; Buľko, B.; Hubatka, S.; Hrubovčáková, M.; Futáš, P.; Findorák, R. An Overview Analysis of Current Research Status in Iron Oxides Reduction by Hydrogen. Metals 2024, 14, 589. [Google Scholar] [CrossRef]
- Kazemi, M.; Pour, M.S.; Sichen, D. Experimental and Modeling Study on Reduction of Hematite Pellets by Hydrogen Gas. Metall. Mater. Trans. B Process Metall. Mater. Process. Sci. 2017, 48, 1114–1122. [Google Scholar] [CrossRef]
- Hammam, A.; Nasr, M.I.; Elsadek, M.H.; Khan, I.U.; Omran, M.; Wei, H.; Qiu, D.; Yu, Y. Studies on the Reduction Behavior of Iron Oxide Pellet Fines with Hydrogen Gas: Mechanism and Kinetic Analysis. J. Sustain. Metall. 2023, 9, 1289–1302. [Google Scholar] [CrossRef]
- Korobeinikov, Y.; Meshram, A.; Harris, C.; Kovtun, O.; Govro, J.; O’Malley, R.J.; Volkova, O.; Sridhar, S. Reduction of Iron-Ore Pellets Using Different Gas Mixtures and Temperatures. Steel Res. Int. 2023, 94, 2300066. [Google Scholar] [CrossRef]
- Zakeri, A.; Coley, K.S.; Tafaghodi, L. Microstructural Evolution and Its Effect on Reaction Rate During Reduction of High-Grade Hematite Ore Pellets With Hydrogen. J. Sustain. Metall. 2025, 1–22. [Google Scholar] [CrossRef]
- Kovtun, O.; Levchenko, M.; Ilatovskaia, M.O.; Aneziris, C.G.; Volkova, O. Results of Hydrogen Reduction of Iron Ore Pellets at Different Temperatures. Steel Res. Int. 2024, 2300707. [Google Scholar] [CrossRef]
- Hessling, O.; Fogelström, J.B.; Kojola, N.; Martinsson, J. Influence of Water Content on the Kinetics and Mechanisms of Hydrogen Reduction Using Industrial Iron Ore Pellets at 873 K–1173 K. ISIJ Int. 2024, 64, 1493–1502. [Google Scholar] [CrossRef]
- Ma, Y.; Souza Filho, I.R.; Zhang, X.; Nandy, S.; Barriobero-Vila, P.; Requena, G.; Vogel, D.; Rohwerder, M.; Ponge, D.; Springer, H.; et al. Hydrogen-Based Direct Reduction of Iron Oxide at 700°C: Heterogeneity at Pellet and Microstructure Scales. Int. J. Miner. Metall. Mater. 2022, 29, 1901–1907. [Google Scholar] [CrossRef]
- Heidari, A.; Ghosalya, M.K.; Alaoui Mansouri, M.; Heikkilä, A.; Iljana, M.; Kokkonen, E.; Huttula, M.; Fabritius, T.; Urpelainen, S. Hydrogen Reduction of Iron Ore Pellets: A Surface Study Using Ambient Pressure X-Ray Photoelectron Spectroscopy. Int. J. Hydrogen Energy 2024, 83, 148–161. [Google Scholar] [CrossRef]
- Mishra, B.; Kumar Singh, A.; Shankar Mahobia, G. Hydrogen Reduction Studies of Low-Grade Multimetallic Magnetite Ore Pellets. Miner. Eng. 2024, 215, 108823. [Google Scholar] [CrossRef]
- Hosseinzadeh, M.; Kasiri, N.; Rezaei, M.; Mohammad Mirzaei, M.A. Investigation of Pellet Shape on the Hydrogen Reduction of Iron Oxide Using Mathematical Modeling and Image Processing. Steel Res. Int. 2023, 94, 2300085. [Google Scholar] [CrossRef]
- Metolina, P.; Ribeiro, T.R.; Guardani, R. Hydrogen-Based Direct Reduction of Industrial Iron Ore Pellets: Statistically Designed Experiments and Computational Simulation. Int. J. Miner. Metall. Mater. 2022, 29, 1908–1921. [Google Scholar] [CrossRef]
- Ali, M.L.; Fradet, Q.; Riedel, U. Kinetic Mechanism Development for the Direct Reduction of Single Hematite Pellets in H2/CO Atmospheres. Steel Res. Int. 2022, 93, 2200043. [Google Scholar] [CrossRef]
- Perrone, A.; Cavaliere, P.; Sadeghi, B.; Dijon, L.; Laska, A.; Koszelow, D. Carburization Behavior of High-Grade Pellets After Direct Reduction in Pure Hydrogen. J. Sustain. Metall. 2024, 10, 1991–2008. [Google Scholar] [CrossRef]
- Cavaliere, P.; Dijon, L.; Laska, A.; Koszelow, D. Hydrogen Direct Reduction and Reoxidation Behaviour of High-Grade Pellets. Int. J. Hydrogen Energy 2024, 49, 1235–1254. [Google Scholar] [CrossRef]
- Cavaliere, P.; Perrone, A.; Dijon, L.; Laska, A.; Koszelow, D. Direct Reduction of Pellets through Hydrogen: Experimental and Model Behaviour. Int. J. Hydrogen Energy 2024, 49, 1444–1460. [Google Scholar] [CrossRef]
- Özgün, Ö.; Dirba, I.; Gutfleisch, O.; Ma, Y.; Raabe, D. Green Ironmaking at Higher H2 Pressure: Reduction Kinetics and Microstructure Formation During Hydrogen-Based Direct Reduction of Hematite Pellets. J. Sustain. Metall. 2024, 10, 1127–1140. [Google Scholar] [CrossRef] [PubMed]
- Perrone, A.; Cavaliere, P.; Sadeghi, B.; Dijon, L.; Laska, A. Optimization of Hydrogen Utilization and Process Efficiency in the Direct Reduction of Iron Oxide Pellets: A Comprehensive Analysis of Processing Parameters and Pellet Composition. Steel Res. Int. 2024, 96, 2400565. [Google Scholar] [CrossRef]
- Kovtun, O.; Levchenko, M.; Oldinski, E.; Gräbner, M.; Volkova, O. Swelling Behavior of Iron Ore Pellets during Reduction in H2 and N2/H2 Atmospheres at Different Temperatures. Steel Res. Int. 2023, 94, 2300140. [Google Scholar] [CrossRef]
- Sharma, T.; Gupta, R.C.; Prakash, B. Effect of Gangue Content on the Swelling Behaviour of Iron Ore Pellets. Miner Eng. 1990, 3, 509–516. [Google Scholar] [CrossRef]
- Meshram, A.; Korobeinikov, Y.; Wei, X.; OMalley, R.J.; Sridhar, S. Quantification of Swelling in Hematite Pellets Reduced Using Hydrogen–Nitrogen Gas Mixture. Steel Res. Int. 2024, 2400442. [Google Scholar] [CrossRef]
- Nyankson, E.; Kolbeinsen, L. Kinetics of Direct Iron Ore Reduction with CO-H2 Gas Mixtures. Int. J. Eng. Res. Technol. 2015, 4, 934–940. [Google Scholar] [CrossRef]
- Devlin, A.; Kossen, J.; Goldie-Jones, H.; Yang, A. Global Green Hydrogen-Based Steel Opportunities Surrounding High Quality Renewable Energy and Iron Ore Deposits. Nat. Commun. 2023, 14, 2578. [Google Scholar] [CrossRef]
- Zhang, X.; Fan, Z.; Mi, A.; Cong, J.; Hu, Z.; Yang, J.; Wen, B. Characteristics of NH3–H2 Reducing Pellets. Metals 2024, 14, 1314. [Google Scholar] [CrossRef]
- ANSYS FLUENT Tutorial Guide|PDF. Available online: https://www.slideshare.net/slideshow/ansys-fluent-tutorial-guide/259648143 (accessed on 20 November 2024).
- Liu, W.; Zuo, H.; Wang, J.; Xue, Q.; Ren, B.; Yang, F. The Production and Application of Hydrogen in Steel Industry. Int. J. Hydrogen Energy 2021, 46, 10548–10569. [Google Scholar] [CrossRef]


| Atmosphere | Inert atmosphere—100% N2; Isothermic reduction atmosphere—100% H2 |
| Gas flow | N2—3 L/min H2—11 L/min |
| Used temperatures | 600 °C, 800 °C |
| Measurements of temperature | PtRh10%-Pt thermocouple |
| Holding time | 30 min. |
| Sample | 3 pieces of pellets from each sample |
| Iron Ore Pellets | A | B | C | D | |
|---|---|---|---|---|---|
| Chemical composition (wt %) | FeTOT | 67.34 | 65.32 | 65.04 | 65.42 |
| FeO | 0.43 | 2.16 | 0.43 | 0.86 | |
| SiO2 | 2.6 | 2.673 | 5.18 | 5.04 | |
| Al2O3 | 0.20.1 | 0.446 | 0.279 | 0.158 | |
| CaO | 0.30 | 1.43 | 0.191 | 0.313 | |
| MgO | - | 1.213 | 0.786 | - | |
| P | 0.041 | 0.039 | 0.042 | 0.04 | |
| S | 0.014 | 0.019 | 0.016 | 0.02 | |
| K2O | 0.133 | 0.155 | 0.16 | 0.25 | |
| Others * | 29.37 | 30.40 | 30.97 | 30.53 | |
| Granulometric composition (%) | ˂10 mm | 8.72 | 0 | 33.91 | 6.73 |
| ˃10 mm | 91.28 | 100 | 66.09 | 93.27 | |
| ˃16 mm | 2.06 | 5.13 | 2.01 | 2.00 | |
| Davg (mm) | 12.04 | 13.49 | 10.56 | 12.24 | |
| Apparent specific density (kg·m−3) | ρA | 2253 | 2158 | 2150 | 2080 |
| True specific density (kg·m−3) | ρt | 4788 | 4750 | 4606 | 4624 |
| Volumetric (bulk) specific density (kg·m−3) | ρb | 4067 | 3510 | 3639 | 3762 |
| Porosity— pycnometric analysis (%) | PPA | 15.06 | 26.09 | 20.99 | 18.83 |
| Porosity— microscopic analysis (%) | PMAO | 2.53 | 9.19 | 6.86 | 5.13 |
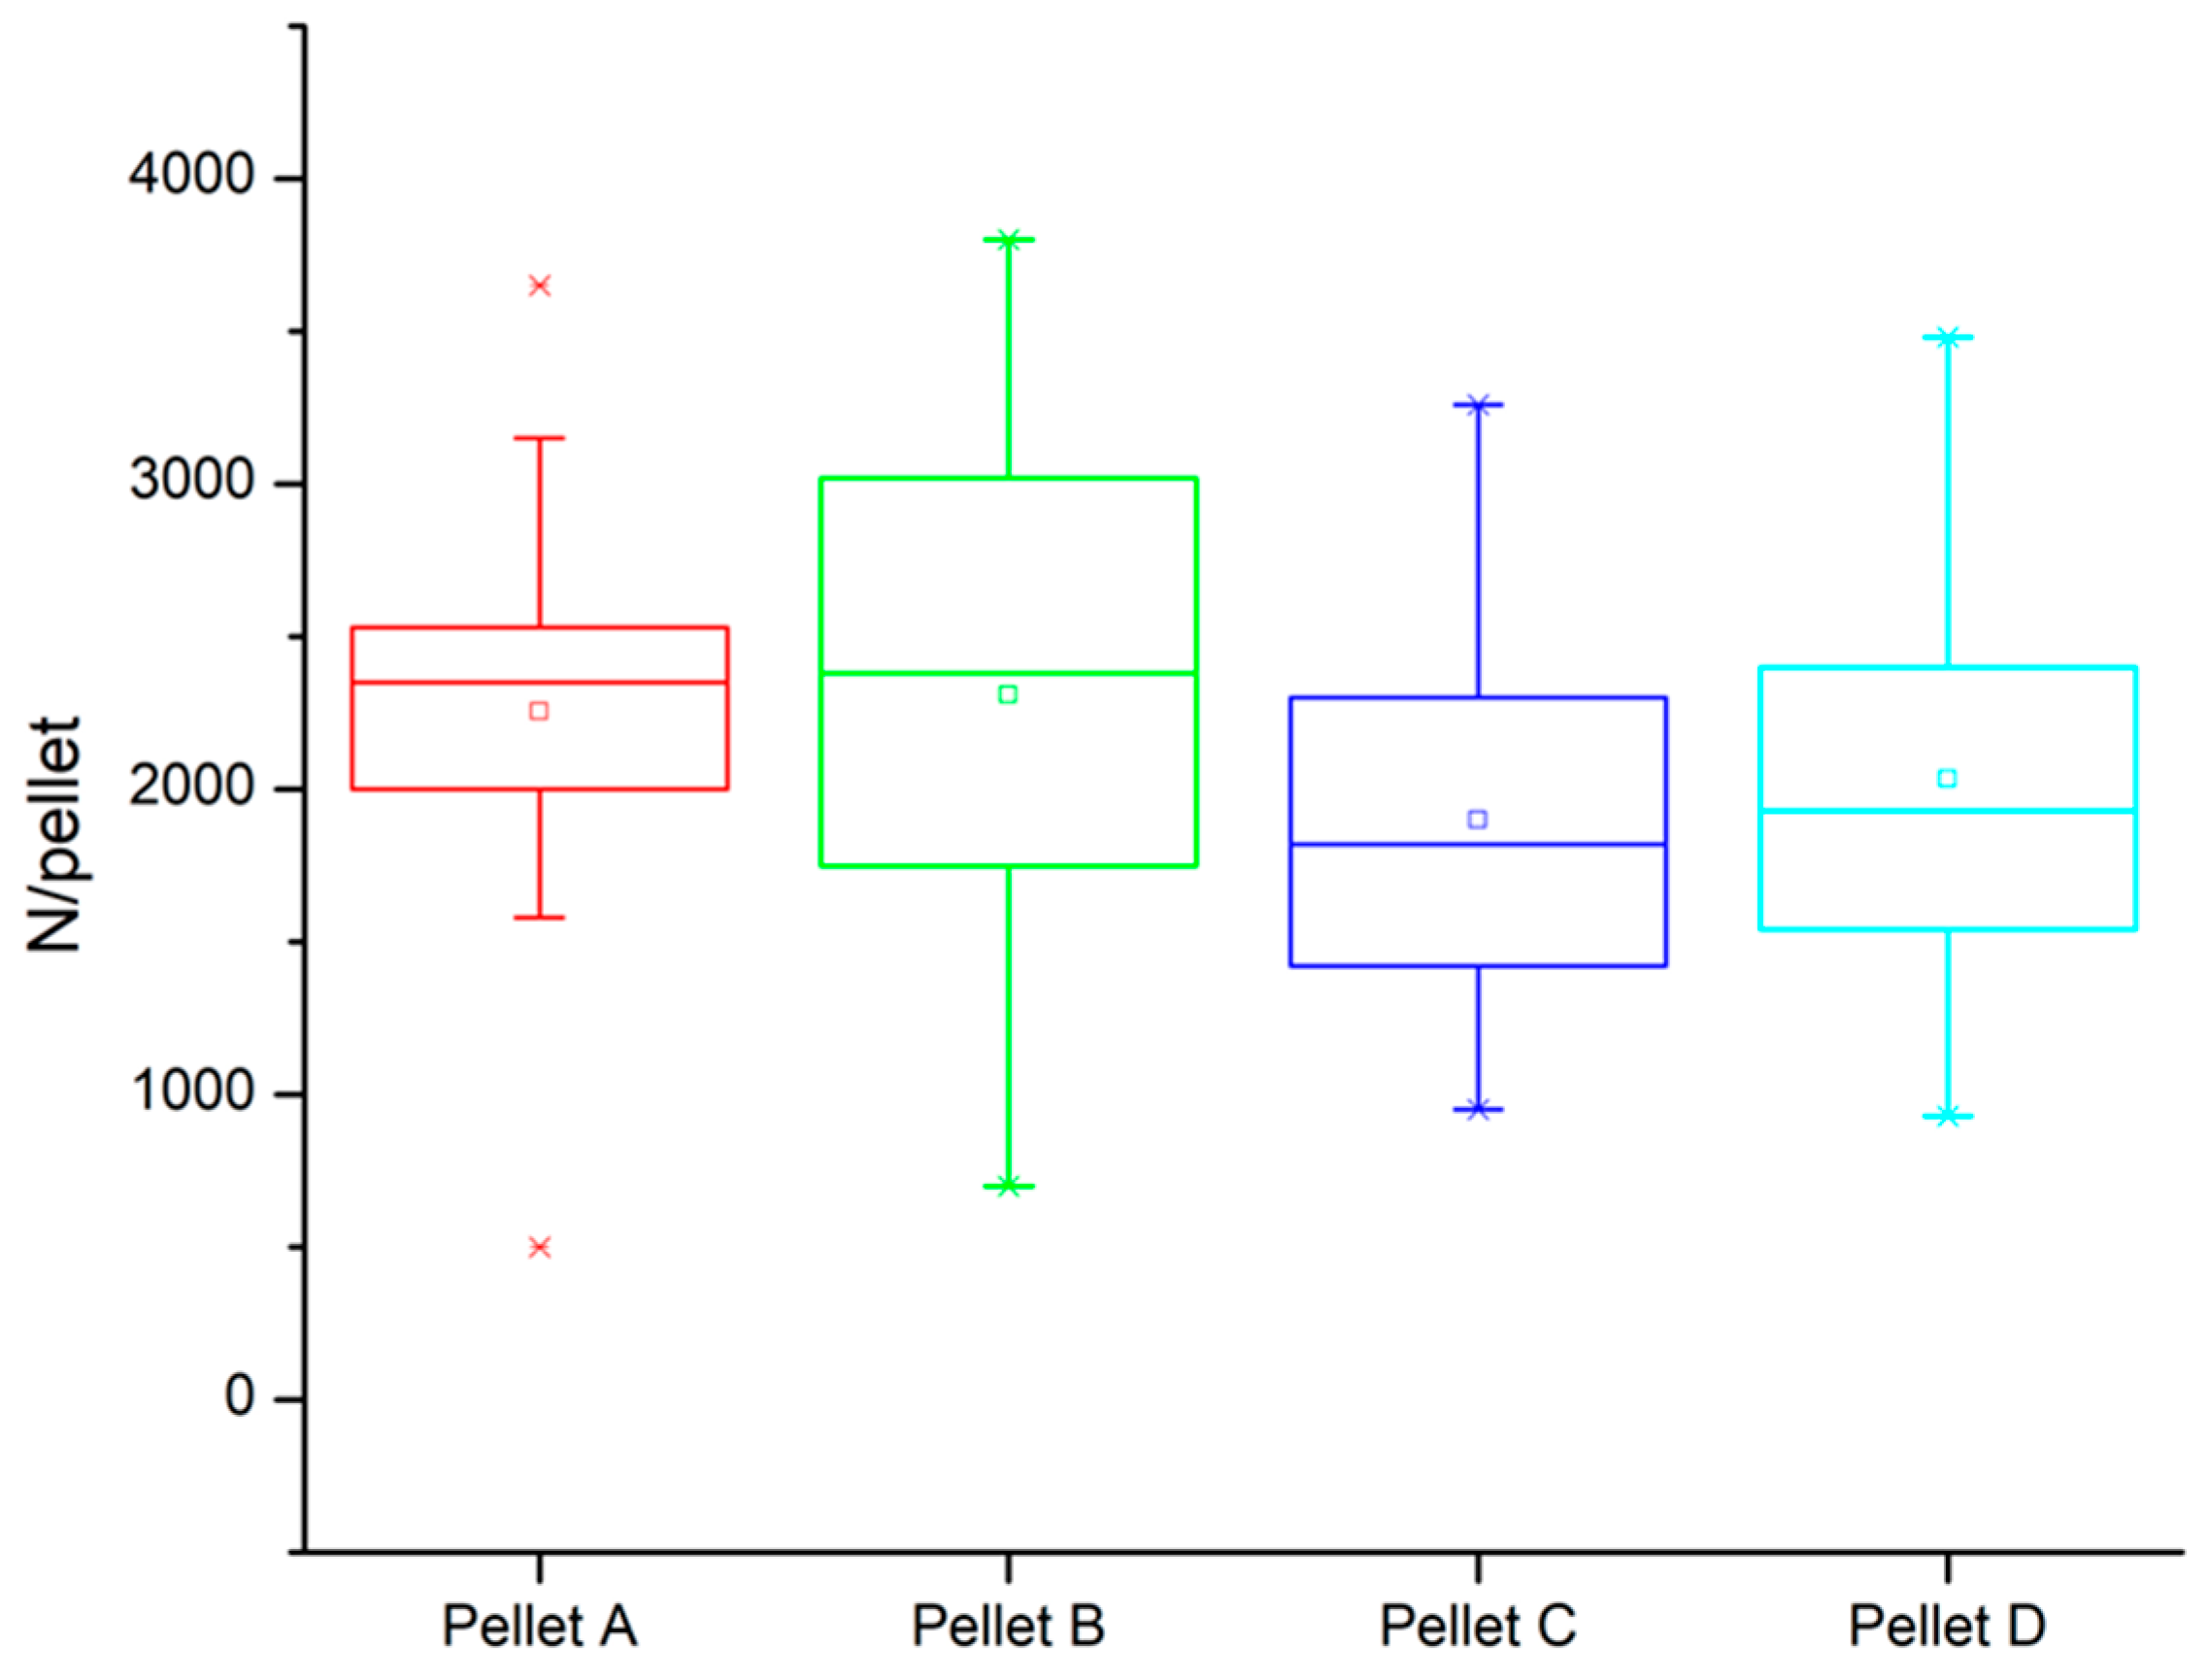
| Compressive strength (N/pellet) | Mean value | 2255 | 2308 | 1898 | 2033 |
| Melting point (°C) | - | - | 1505 | 1499 | |
| Mineralogical composition | XRD | Hematite Magnetite Quartz Cristobalite | Hematite Magnetite Quartz | Hematite Magnetite Quartz Cristobalite | Hematite Magnetite Quartz Cristobalite |
| Pellet Name | Pellet A | Pellet B | Pellet C | Pellet D |
|---|---|---|---|---|
| Identified phases | Hematite | Hematite | Hematite | Hematite |
| Magnetite | Calcium silicate ferrites + calcium silicates | Iron silicates | Iron silicates + complexes | |
| Quartz | Quartz | Quartz | Quartz | |
| Sample homogeneity | Homogeneous samples | Slight inhomogeneity of the samples | Homogeneous samples | Homogeneous samples |
| Pellet A | Pellet B | Pellet C | Pellet D | ||
|---|---|---|---|---|---|
| Input pellet | Photo |  |  |  |  |
| Macro |  |  |  |  | |
| Micro | 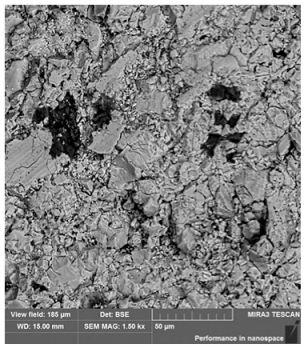 |  | 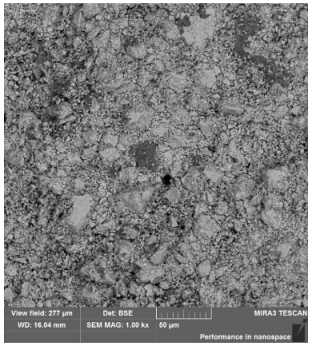 | 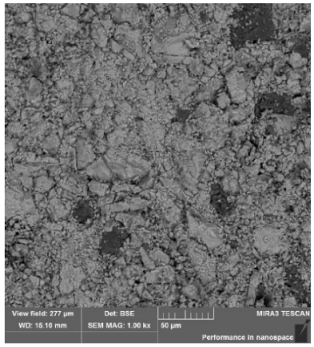 | |
| Pellet after H2 reduction at 600 °C | Photo |  |  |  |  |
| Macro |  |  |  |  | |
| Micro |  |  |  |  | |
Disclaimer/Publisher’s Note: The statements, opinions and data contained in all publications are solely those of the individual author(s) and contributor(s) and not of MDPI and/or the editor(s). MDPI and/or the editor(s) disclaim responsibility for any injury to people or property resulting from any ideas, methods, instructions or products referred to in the content. |
© 2025 by the authors. Licensee MDPI, Basel, Switzerland. This article is an open access article distributed under the terms and conditions of the Creative Commons Attribution (CC BY) license (https://creativecommons.org/licenses/by/4.0/).
Share and Cite
Findorák, R.; Miškovičová, Z.; Legemza, J.; Dzurňák, R.; Buľko, B.; Demeter, P.; Egryová, A.; Maliňák, R. Experiments and Simulations on the Low-Temperature Reduction of Iron Ore Oxide Pellets with Hydrogen. Metals 2025, 15, 289. https://doi.org/10.3390/met15030289
Findorák R, Miškovičová Z, Legemza J, Dzurňák R, Buľko B, Demeter P, Egryová A, Maliňák R. Experiments and Simulations on the Low-Temperature Reduction of Iron Ore Oxide Pellets with Hydrogen. Metals. 2025; 15(3):289. https://doi.org/10.3390/met15030289
Chicago/Turabian StyleFindorák, Róbert, Zuzana Miškovičová, Jaroslav Legemza, Róbert Dzurňák, Branislav Buľko, Peter Demeter, Andrea Egryová, and Róbert Maliňák. 2025. "Experiments and Simulations on the Low-Temperature Reduction of Iron Ore Oxide Pellets with Hydrogen" Metals 15, no. 3: 289. https://doi.org/10.3390/met15030289
APA StyleFindorák, R., Miškovičová, Z., Legemza, J., Dzurňák, R., Buľko, B., Demeter, P., Egryová, A., & Maliňák, R. (2025). Experiments and Simulations on the Low-Temperature Reduction of Iron Ore Oxide Pellets with Hydrogen. Metals, 15(3), 289. https://doi.org/10.3390/met15030289