Abstract
The interplay between melting viscosity, amorphous forming ability (AFA), nanocrystalline structure, and soft magnetic properties (SMPs) in Fe-based multicomponent alloys remains unclear. This study systematically explores the effects of Sn doping on the viscosity, precursor structure, and nanocrystallization behavior of Fe-Si-B-Nb-Cu-Al-P alloys. Sn doping reduces melting viscosity and induces an abnormal viscosity rise during cooling, lowering the fragility parameter ratio (F) between high- and low-temperature zones, thereby enhancing the AFA of the precursor ribbons. High-temperature heat preservation treatment (HTP) of the melt further reduces the F, improves precursor disorder, and refines nanocrystals, leading to reduced average magnetocrystalline anisotropy and optimized SMPs. The HTP-treated Sn-dopped alloy shows superior SMPs, including low coercivity of 0.4 A/m and high permeability of 32,400 at 5 kHz, making it highly promising for advanced electromagnetic device applications. This work reveals the relationship between viscosity, precursor structure, nanocrystalline structure, and SMPs of Fe-based alloys, which provides an approach for the optimization of SMPs.
1. Introduction
Nanocrystalline ferromagnetic alloys, renowned for their superior soft magnetic properties (SMPs) and energy-saving advantages, are essential in transformers, inductors, and other critical components, advancing energy conversion and signal transmission technologies [1,2,3]. The prevalence of third-generation semiconductor devices demands power electronic equipment with higher frequencies, increased power density, and improved efficiency, driving the need for wider, ultra-thin, and lower-loss nanocrystalline ribbons. These ultra-thin ribbons are crucial for high permeability (μ) and minimizing core loss at high frequencies [4]. Since Y. Yoshizawa et al. developed FINEMET (Fe-Si-B-Nb-Cu) nanocrystalline alloys in 1988 [5], researchers have created nearly a thousand alloys by adjusting compositions. Despite laboratory advancements incorporating Co, Mo, and other elements for superior SMPs [6,7], most alloys face industrial production challenges. The NANOPERM (Fe-Zr(V/Ta)-B-Cu) and HITPERM (Fe-Co-B-Zr(Ta/Hf)-Cu) alloys are easy to be oxidized and have poor AFA, while NANOMET (Fe-Si-B-P-Cu) and Cu-free alloys require high heating rate during annealing [8,9,10,11]. Only FINEMET and its modified alloys have achieved industrial-scale production. On the other hand, heat treatment techniques, including magnetic field, stress, and rapid annealing methods, have been explored to optimize SMPs [12,13,14,15]. These treatments regulate microstructure and magnetic domains, with magnetic field and stress annealing effectively inducing magnetic anisotropy, significantly enhancing SMPs at high frequencies. Innovative approaches, such as using quartz sand for flexible annealing, have been developed to improve both SMPs and plasticity in nanocrystalline alloys [16]. Despite these advancements, the preparation of ultra-thin precursor ribbons often encounters clogging issues due to the high viscosity of the alloy, which is closely related to the viscosity and structural characteristics of the melt [17,18].
Reduction in ribbon thickness is needed to shorten the distance between the bottom of the nozzle and the outer surface of a copper wheel, known as the nozzle wheel gap [19]. This method usually leads to clogging at the nozzle orifice, primarily due to the poor fluidity of the commercial alloy melts, which hampers their ability to spread out into the melt puddle between the nozzle and copper wheel, thereby limiting solidify rapidly into ribbons [20]. Moreover, better fluidity typically corresponds to lower viscosity (η) of the melt, which improves the migration ability of atoms and, in turn, accelerates the crystallization, thereby reducing the amorphous formation ability (AFA) of the precursor [21]. Consequently, achieving a balance between viscosity and fluidity remains a key challenge in fabricating ultra-thin ribbons with amorphous precursors.
Viscosity not only reflects the fluidity and AFA of the melt but also indicates structural changes in the alloy melt as a function of temperature [22]. When the viscosity of a metal melt decreases with the increase in temperature, a sudden transition zone in viscosity often appears, which has been observed in pure component elemental metals such as Sb and In, as well as binary and multicomponent alloys such as CuZr, CuSn, and CoFeSiB [23]. This abrupt change in viscosity reflects a liquid-liquid phase (LLP) transition, which indicates a reorganization of metal atoms in the melt [24]. The LLP transition exists widely in many alloys such as CuZr-based alloys and FeB-based alloys [25,26], which points to the inhomogeneity of the internal structure of the melt and can affect the precursor structure of solidified alloys [27,28,29]. L. Li et al. observed an abnormal decrease in viscosity within a specific range during the cooling process of ZrCuNiAl alloy melt. This abnormal decrease is related to the promotion of icosahedral cluster formation through LLP transition, which makes the melt form a more stable liquid phase during the cooling process, thereby optimizing the disorder of the ribbon obtained via rapid quenching [25]. W. Chu et al. found that in CuZrAl and CuZrTiNi alloy systems, increasing the doping contents of Al, Ti, or Ni weakens the structural characteristics and restrains the abnormal increase in viscosity; in addition, during the LLP transition, the formation of more icosahedral clusters enhances the AFA of the amorphous precursor ribbons [30]. On the other hand, this discontinuous viscosity transition, which takes place during the cooling of Zr-based alloy melts, also occurs during the heating of FeB-based alloy melts [31]. It has been found that the weakening of the viscosity mutation region in the melt, where LLP transition is weakened, is related to the enhancement in AFA of amorphous alloys. For instance, Y.W. Bai et al. discovered that the addition of rare earth elements greatly weakens the discontinuity of viscosity changes in FeB-based alloy melts, forms more stable polyhedral structures with rare earth elements as coordination atoms, and optimizes AFA in FeBY amorphous bulk alloys [32]. Similarly, Y.B. Zhao et al. revealed that the viscosity mutation region of FeB-based alloys containing Y weakens, and the primitive clusters tend to decompose into short-range ordered clusters at high temperatures, which leads to more amorphous regions in the bulk alloys [33]. However, most current studies on viscosity primarily focus on CuZr multicomponent alloys and Fe-based bulk alloys. The viscosity changes of Fe-based nanocrystalline alloy masters remain underexplored, and the relationship between these viscosity changes and the AFA of precursor soft magnetic ribbon is also vague. Therefore, investigating the links between viscosity, precursor structure, nanocrystalline structure, and SMPs is essential for advancing the development of nanocrystalline materials with superior properties.
Herein, to balance the viscosity and fluidity, the FeSiCuBNbAlP alloy was chosen for its enhanced SMPs and AFA due to the addition of Al and P elements [5,34,35,36]. Sn was added to reduce viscosity and enhance the fluidity of the alloy melt [37]. On this basis, the influence of the change of viscosity on the structure of the precursor and its reasons, as well as the changes in the process of nanocrystallization were studied. To study structural and property changes in ribbons prepared by LLP transition, high-temperature-preservation (HTP) treatment was applied to some master alloys. HTP involves maintaining the alloy melt at a temperature that exceeds the sudden change zone of viscosity for a prolonged time to complete the LLP transition. Therefore, we study the effect of melt LLP transition on the structure of precursors and nanocrystals. The study examined alloys with varying Sn content and the presence or absence of HTP treatment, exploring the relationship between viscosity, precursor structure, and nanocrystallized microstructure, as well as their impact on the SMPs of the nanocrystalline ribbons. The purpose of the study is to first obtain highly disordered precursors by adjusting melting viscosity, fragility parameter ratio (F), and HTP approach, and then to achieve fine uniform nanocrystalline structure and improved magnetic properties in Fe-based nanocrystalline alloys.
2. Experimental
The master alloys with nominal compositions of Fe74Si15B7Cu1Nb2−xAl0.3P0.7Snx (x = 0, 0.1, and 0.3; denoted as Sn0, Sn0.1, and Sn0.3, respectively) were prepared by melting pure Fe (99.97 wt.%), Si (99.999 wt.%), B (99.9 wt.%), Nb (99.95 wt.%), Cu (99.999 wt.%), Al (99.999 wt.%), Sn (99.99 wt.%), and pre-alloyed Fe3P (99.5 wt.%) in an argon atmosphere. The precursor ribbons with a width of approximately 1.2 mm and a thickness of around 24 μm were prepared in high vacuum by single-roller rapid quenching method with a spinning speed of ~40 m/s from molten master alloys. Nanocrystalline alloy ribbons were obtained by annealing the precursor ribbons at appropriate temperatures for 10 min.
The viscosity of the master alloy melts was measured by the high-temperature torsional oscillation method [38]. Master alloy samples, each weighing approximately 120 g, were placed in a heat-resistant corundum crucible contained in a graphite container suspended within a torsional suspension chamber. To prevent oxidation at high temperatures, the furnace chamber was filled with argon after achieving a vacuum of 10−3 Pa. When torsional oscillation was applied to the sample at high temperature, the state of the melt changed, and its dynamic response (such as torque and phase difference) was recorded. These responses were then converted into viscoelastic parameters, and finally, the viscosity of the melt was obtained. In the process of testing the melt viscosity during the heating and cooling stages, the heating and cooling rate was controlled at 0.167 K/s, and the viscosity was recorded at intervals of 20 K in a temperature range of 1473–1873 K. To ensure the accuracy, each melt sample was held for at least 30 min at each temperature point, and the average value of three measurements was taken.
For comparison, the Sn0 and Sn0.1 master alloys underwent HTP treatment during viscosity testing, followed by the preparation of precursor ribbons with a width of approximately 1.2 mm and a thickness of around 24 μm and nanocrystallization through annealing. Herein, the HTP treatment involves the master alloys being placed in the high-temperature torsional oscillator, heated to the highest temperature of 1873 K, and kept for half an hour, then cooled to room temperature to form ingots. It needs to be stated that the Sn0.3 master alloy is not analyzed here because it is difficult to produce continuous ribbons. The content of Sn may affect the high-temperature melt and the surface quality of the ribbon after solidification. If the Sn content is reduced properly, it may be helpful to the forming of the ribbons. The HTP-treated Sn0 and Sn0.1 mater alloys are referred to as Sn0-HTP and Sn0.1-HTP, respectively.
Thermal analysis of the precursor ribbons was carried out by differential scanning calorimetry (DSC, 404C) at the heating rate of 40 K/min. The microstructure of the ribbons was characterized by X-ray diffraction (XRD, D8 DISCOVER, provided by Bruker, Berlin, Germany) with Cu-Kα radiation in the range of 30–90° for 6 min. A transmission electron microscope (TEM, Talos F200x, provided by ThemoFisher, Waltham, MA, USA) was used to obtain TEM images, high-resolution TEM (HRTEM) images, selected-area electron diffraction (SAED) patterns, and element distribution maps. In the HRTEM images, the square regions of 3.5 × 3.5 nm2 were selected for the Sn0 precursor for auto-correlation analysis, and square regions of 2 × 2 nm2 were randomly selected for other samples. TEM specimens were obtained by ion-milling the ribbons (Gatan691, provided by Gatan, Inc., Pleasanton, CA, USA). To characterize the effect of HTP treatment on the microstructure of precursor ribbons more accurately, the synchrotron radiation XRD spectra of specific precursors were measured under the condition of energy of 100 keV and wavelength of 0.124 Å. The μ was measured by an impedance analyzer (4294 A) under the field of 1 A/m. The coercivity (Hc) was measured by the MATS magnetic material automatic testing system (SMTest, V6.0) under the field of 800 A/m.
3. Results and Discussion
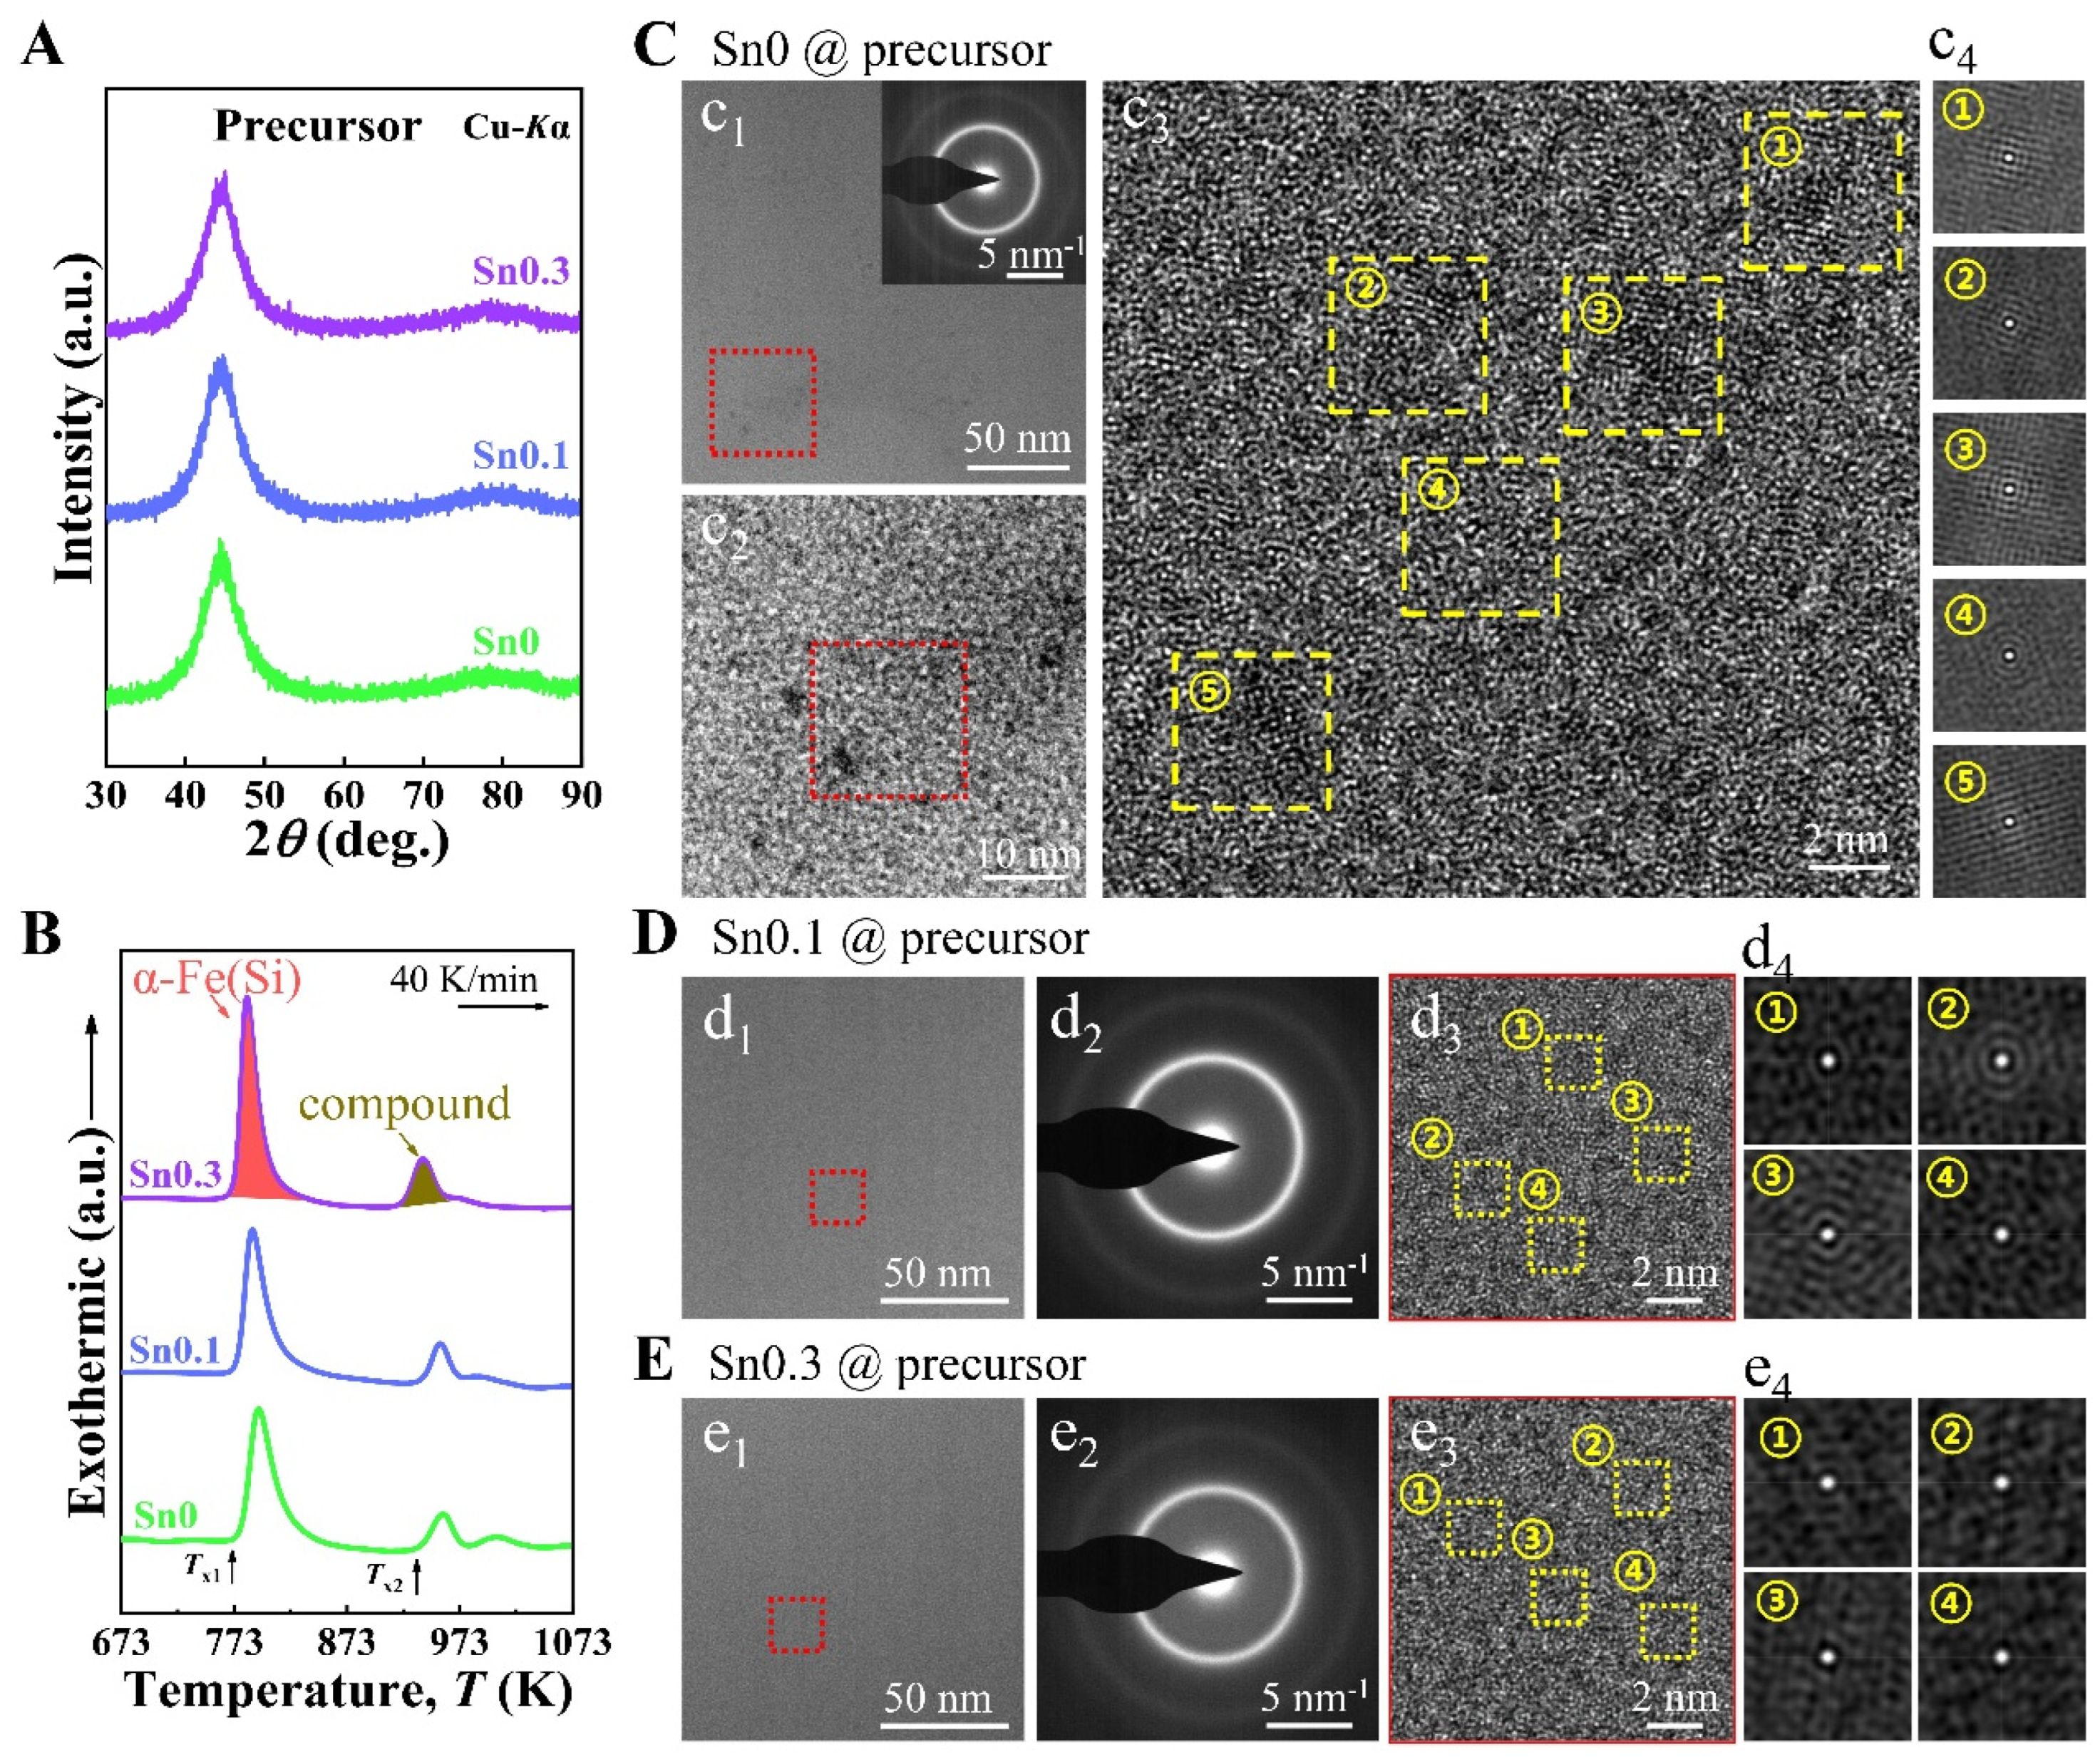
Figure 1A shows the viscosity of Sn0, Sn0.1, and Sn0.3 melts changes as a function of temperature during heating from 1473 K to 1873 K and then cooling back to 1473 K. For all three alloy melts, viscosity decreases with the increasing of temperature and increases again during cooling. The addition of Sn lowers the viscosity of the melt and 0.3 at.% Sn exhibits the most significant decrease, which indicates incorporating low-melting-point metal effectively reduces the viscosity of the melts. Meanwhile, there is at least a discontinuous viscosity change for all three melts during heating and cooling, which is consistent with that previously reported in Fe-based alloy melts [39]. The presence of several sections on the dependencies ln η = f(1/T) reflects the change of cluster structure at different temperature regions. Because of the wide fitting temperature range of the Arrhenius formula, the model is suitable for analyzing the activation energy of clusters. To provide a more intuitive analysis, we use an Arrhenius equation to fit the viscosity changes in the melts as follows [40,41]:
where η0 is the high-temperature limit of viscosity, Ea is the activation energy of fluid clusters, R is the gas constant, and T is the absolute temperature. The measured viscosity for the three alloys in various temperature ranges fitted with Equation (1) are shown in Figure 1B–D, where solid lines denote fitting curves.
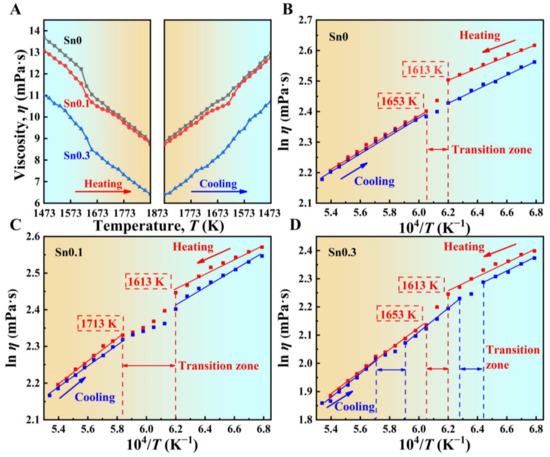
Figure 1.
(A) Temperature dependence of viscosity (η) of three alloy melts during heating and cooling. Relationship between viscosity and temperature of (B) Sn0, (C) Sn0.1, and (D) Sn0.3 alloy melts; squares: measured viscosity; solid lines: fitting the viscosity data by Arrhenius equation.
During heating, a sharp drop in viscosity is observed in all three alloys as the temperature increases to near 1613 K. The viscosity of melts transitions from continuous to discontinuous change with increasing temperature, indicating the occurrence of LLP transition characterized by a sudden drop in viscosity. This LLP transition is likely driven by the dissociation and rearrangement of clusters [42]. The Sn0.1 melt shows a longer range of sudden change in viscosity, spanning from 1613 K to 1713 K, compared to that of the Sn0 and Sn0.3 melts. The extended transition range observed for Sn0.1 may result from the dissociation of certain clusters in the melt at higher temperatures, thus prolonging the region of the sudden viscosity change. This phenomenon indicates that higher activation energy is required for cluster transformation in Sn0.1 melt and more types of clusters are involved in the decomposition into smaller clusters [21]. After heating to 1653 K for Sn0 and Sn0.3, as well as 1713 K for Sn0.1, viscosity returns to a linear trend, suggesting that the energy required for cluster activation increases and the melt structure stabilizes [17,33].
During the cooling process, in contrast to how the viscosity of Sn0 melt changes almost linearly with the decrease in temperature, the Sn0.1 melt exhibits an obvious sudden change in viscosity, and the Sn0.3 melt exhibits two sudden changes in viscosity during cooling. The observed discontinuous change in viscosity of the Sn0.1 and Sn0.3 melt during cooling may be attributed to the rearrangement of atoms [43]. The relevant parameters (Ea, η0) obtained by fitting are listed in Table 1. Sn0.1 exhibits a similar value of Ea within the same temperature range during both the heating and cooling stages, indicating that the melt requires approximately the same amount of energy to activate clusters. By comparing the Ea values of several stages in Sn0.3 melt, the structural evolution in the high-temperature region is relatively weak, and the structure of Sn0.3 melt tends to be stable when it decreases to 1553 K.

Table 1.
Ea, η0, M, and F for Sn0, Sn0.1, and Sn0.3 melts.
To clarify the relationship between the viscosity of melts and the microstructure of the precursor ribbons, the phases of Sn0, Sn0.1, and Sn0.3 precursor ribbons were identified by XRD, as shown in Figure 2A. Each alloy precursor shows an obvious broad peak at 2θ ≈ 45°, which indicates the characteristic of an amorphous nature. The full width at half maximum (FWHM) of the 2θ ≈ 45° peak is 5.82 ± 0.04°. The characteristic of an amorphous nature is further verified by a disordered maze, as shown in subsequent TEM images (Figure 2). The absence of crystalline structure is evidenced by the halo rings observed in the SAED patterns (inset of Figure 2c1; Figure 2(d2,e2)). Furthermore, no contrast change is observed in the TEM images of Sn0.1 (Figure 2d1) and Sn0.3 (Figure 2e1) precursors. Additionally, fringes are absent in their HRTEM images (Figure 2(d3,e3)), and disordered structure is observed in the 2D auto-correlation patterns (Figure 2(d4,e4)). These observations indicate that the Sn0.1 and Sn0.3 precursors exhibit a completely amorphous structure, with no evidence of local crystallization [29]. However, the Sn0 precursor exhibits a contrast change in TEM images (Figure 2(c1,c2)). The HRTEM image of Sn0 displays lattice fringe-like structures, approximately 2 nm in size (marked by yellow dotted squares), which are randomly dispersed within the amorphous matrix (Figure 2c3). Through the auto-correlation analysis of the regions marked by the yellow dotted squares in Figure 2c3, it is found that the relevant 2D auto-correlation patterns (Figure 2c4) show fringes indicative of atomic arrangements resembling crystal-like structures, suggesting local crystallization occurs in the amorphous matrix of the Sn0 precursor [44]. Consequently, the Sn0 alloy has relatively poorer AFA, compared to the Sn0.1 and Sn0.3 alloys. This result contradicts the principle that higher viscosity of melts correlates with better AFA. However, the addition of Sn alters the viscosity behavior of melts during cooling, transiting from a linear change in Sn0 melt to a discontinuous transition in Sn0.1 and Sn0.3 melts (Figure 1). This discontinuous viscosity is related to the rearrangement and stabilization of clusters, and the change in melt stability can be used to explain why the AFA of the alloys is promoted [45].
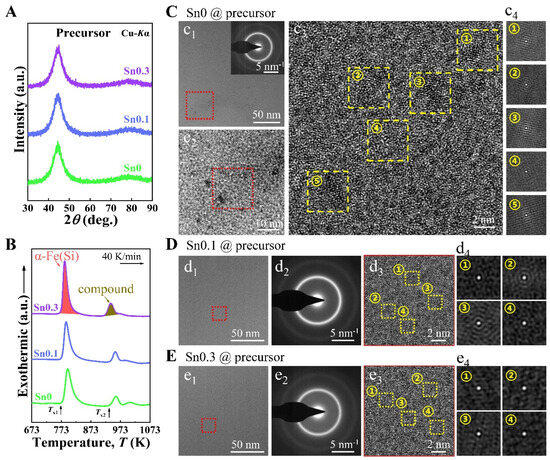
Figure 2.
(A) XRD patterns, (B) DSC curves, (C–E) TEM images, and SAED patterns of Sn0, Sn0.1, and Sn0.3 precursors. (d2,e2) The SAED patterns of Sn0.1, and Sn0.3 precursors. (c2) Enlarged images of the red square area in (c1); (c3,d3,e3) enlarged images of the red square areas in (c2), (d1), and (e1), respectively. (c4,d4,e4) 2D auto-correlation maps from the regions marked by the yellow squares in the HRTEM images (c3), (d3), and (e3), respectively, showing the degree of ordering in the local areas.
On the other hand, considering that the AFA of the alloy may be related to its LLP transition at high temperature, we use the superheated fragility parameter (M) to describe the dynamic behavior of the melt at high temperature, and the smaller M value indicates that the melt is more stable at this temperature, which is defined as [46]:
where TL is the liquidus temperature. The difference in melt stability in various temperature regions usually reflects the degree to which the melt is affected by temperature. In order to quantify the degree of dynamic transition of the melt from high temperature to low temperature, the parameter F can be defined to calculate the ratio of M in the high-temperature (HT) region to low-temperature (LT) region [33]:
The corresponding M and F values for each alloy are listed in Table 1. When the F value of the melt is greater than 1, the fragility of the melt decreases during the cooling from the HT region to the LT region, which means that the stability of the melt is improved, and the cluster structure in the HT region is maintained stably [46]. Specifically, the locally favored structures (LFSs) in the HT region are retained in the form of crystal-like structures (CLSs) of Fe3B cluster structure, which share vertices, edges, or faces in the process of further cooling to form crystal phase, which is not conducive to the formation of amorphous structure [33]. Therefore, the lower the F value, the weaker the tendency of CLSs to retain from the HT region, the more it can promote the formation of an amorphous phase in the precursor structure, and the better the AFA [21,32]. The F value of the Sn0 melt is higher than those of the Sn0.1 and Sn0.3 melts, indicating a greater tendency for the Sn0 melt to precipitate a crystalline phase during the transition from liquid phase to solid phase, resulting in lower AFA of precursors. Consequently, a small number of crystal-like regions can be observed in the TEM images of the Sn0 precursor (Figure 2C).
Figure 2B shows the DSC curves of three alloy precursors, which mainly show two obvious exothermic peaks corresponding to different crystallization processes. The first exothermic peak corresponds to the precipitation of the α-Fe(Si) crystal phase and the second exothermic peak corresponds to the precipitation of Fe-B compounds [47]. The heat treatment temperature range is determined according to the two onset crystallization temperatures of the precursors. The primary crystallization peak temperatures of Sn0, Sn0.1, and Sn0.3 are 794, 788, and 784 K, respectively. Compared to Sn0, the peak positions of Sn0.1 and Sn0.3 are shifted by −6 K and −10 K, respectively. This shift indicates that the addition of Sn slightly reduces the primary crystallization temperature. These Sn0, Sn0.1, and Sn0.3 precursor ribbons were subjected to heat treatment at intervals of 20 K in the range of 793–893 K for 10 min to produce nanocrystalline ribbons. The samples heat-treated at 873 K were found to exhibit the best SMPs (Figure S1, Supporting Information). Therefore, we have selected the Sn0, Sn0.1, and Sn0.3 nanocrystalline ribbons obtained under the optimal heat-treatment condition (873 K) for the observation and analysis of their phase and microstructures. The XRD patterns (Figure S2, Supporting Information) of three alloy nanocrystalline ribbons exhibit sharp crystallization peaks at 2θ ≈ 45°, 65°, and 85°, corresponding to (110), (200), and (211) diffractions, respectively. These peaks represent the formation of α-Fe(Si) grains. The TEM image (Figure 3a1) reveals that the optimally heat-treated Sn0 ribbon exhibits a nanocrystalline-amorphous dual-phase structure. The magnified image (Figure 3a2) shows precipitated nanocrystals of similar sizes are uniformly and randomly distributed within the amorphous matrix. However, the microstructure of the Sn0.1 and Sn0.3 ribbons is different from that of the Sn0 ribbon. The nanocrystals in the Sn0.1 and Sn0.3 ribbons are irregularly distributed in an amorphous matrix, exhibiting local aggregation of some nanocrystals (Figure 3(b1,c1)). This aggregation with the same orientation becomes more pronounced with increasing Sn content (Figure 3(b2,c2)). As the size of Cu clusters may affect the crystallization process, we calculate the size of Cu clusters in the samples. We perform Gaussian fitting to the size distribution, and the position of the fitting peak represents the mean cluster size. With increasing Sn content, the size of Cu clusters increases (Figure 3(a3,b3,c3)), and the average size increases from 3.2 to 5.1 nm (Figure 3D). As nucleation sites, Cu clusters tend to precipitate more grains around them with the increase in their size; at the same time, Sn clusters are easy to agglomerate with the increase in content, and the distribution is similar to that of Cu clusters (Figure S3, Supporting Information), which can promote the nucleation and growth of grains and interact with Cu clusters to cause local aggregation of grains [48].
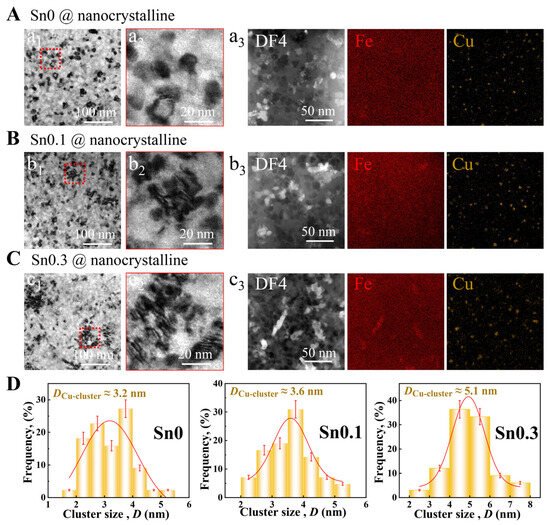
Figure 3.
Microstructures of (A) Sn0, (B) Sn0.1, and (C) Sn0.3 nanocrystalline ribbons. (a1,b1,c1) Bright-field TEM images of optimally heat-treated Sn0 (a1), Sn0.1 (b1), and Sn0.3 (c1). (a2,b2,c2) Enlarged images of the red square areas in (a1), (b1), and (c1), respectively. (a3,b3,c3) STEM-DF4 images and corresponding elemental maps of Fe and Cu elements. (D) Size distributions of Cu clusters of optimally heat-treated Sn0, Sn0.1, and Sn0.3 ribbons.
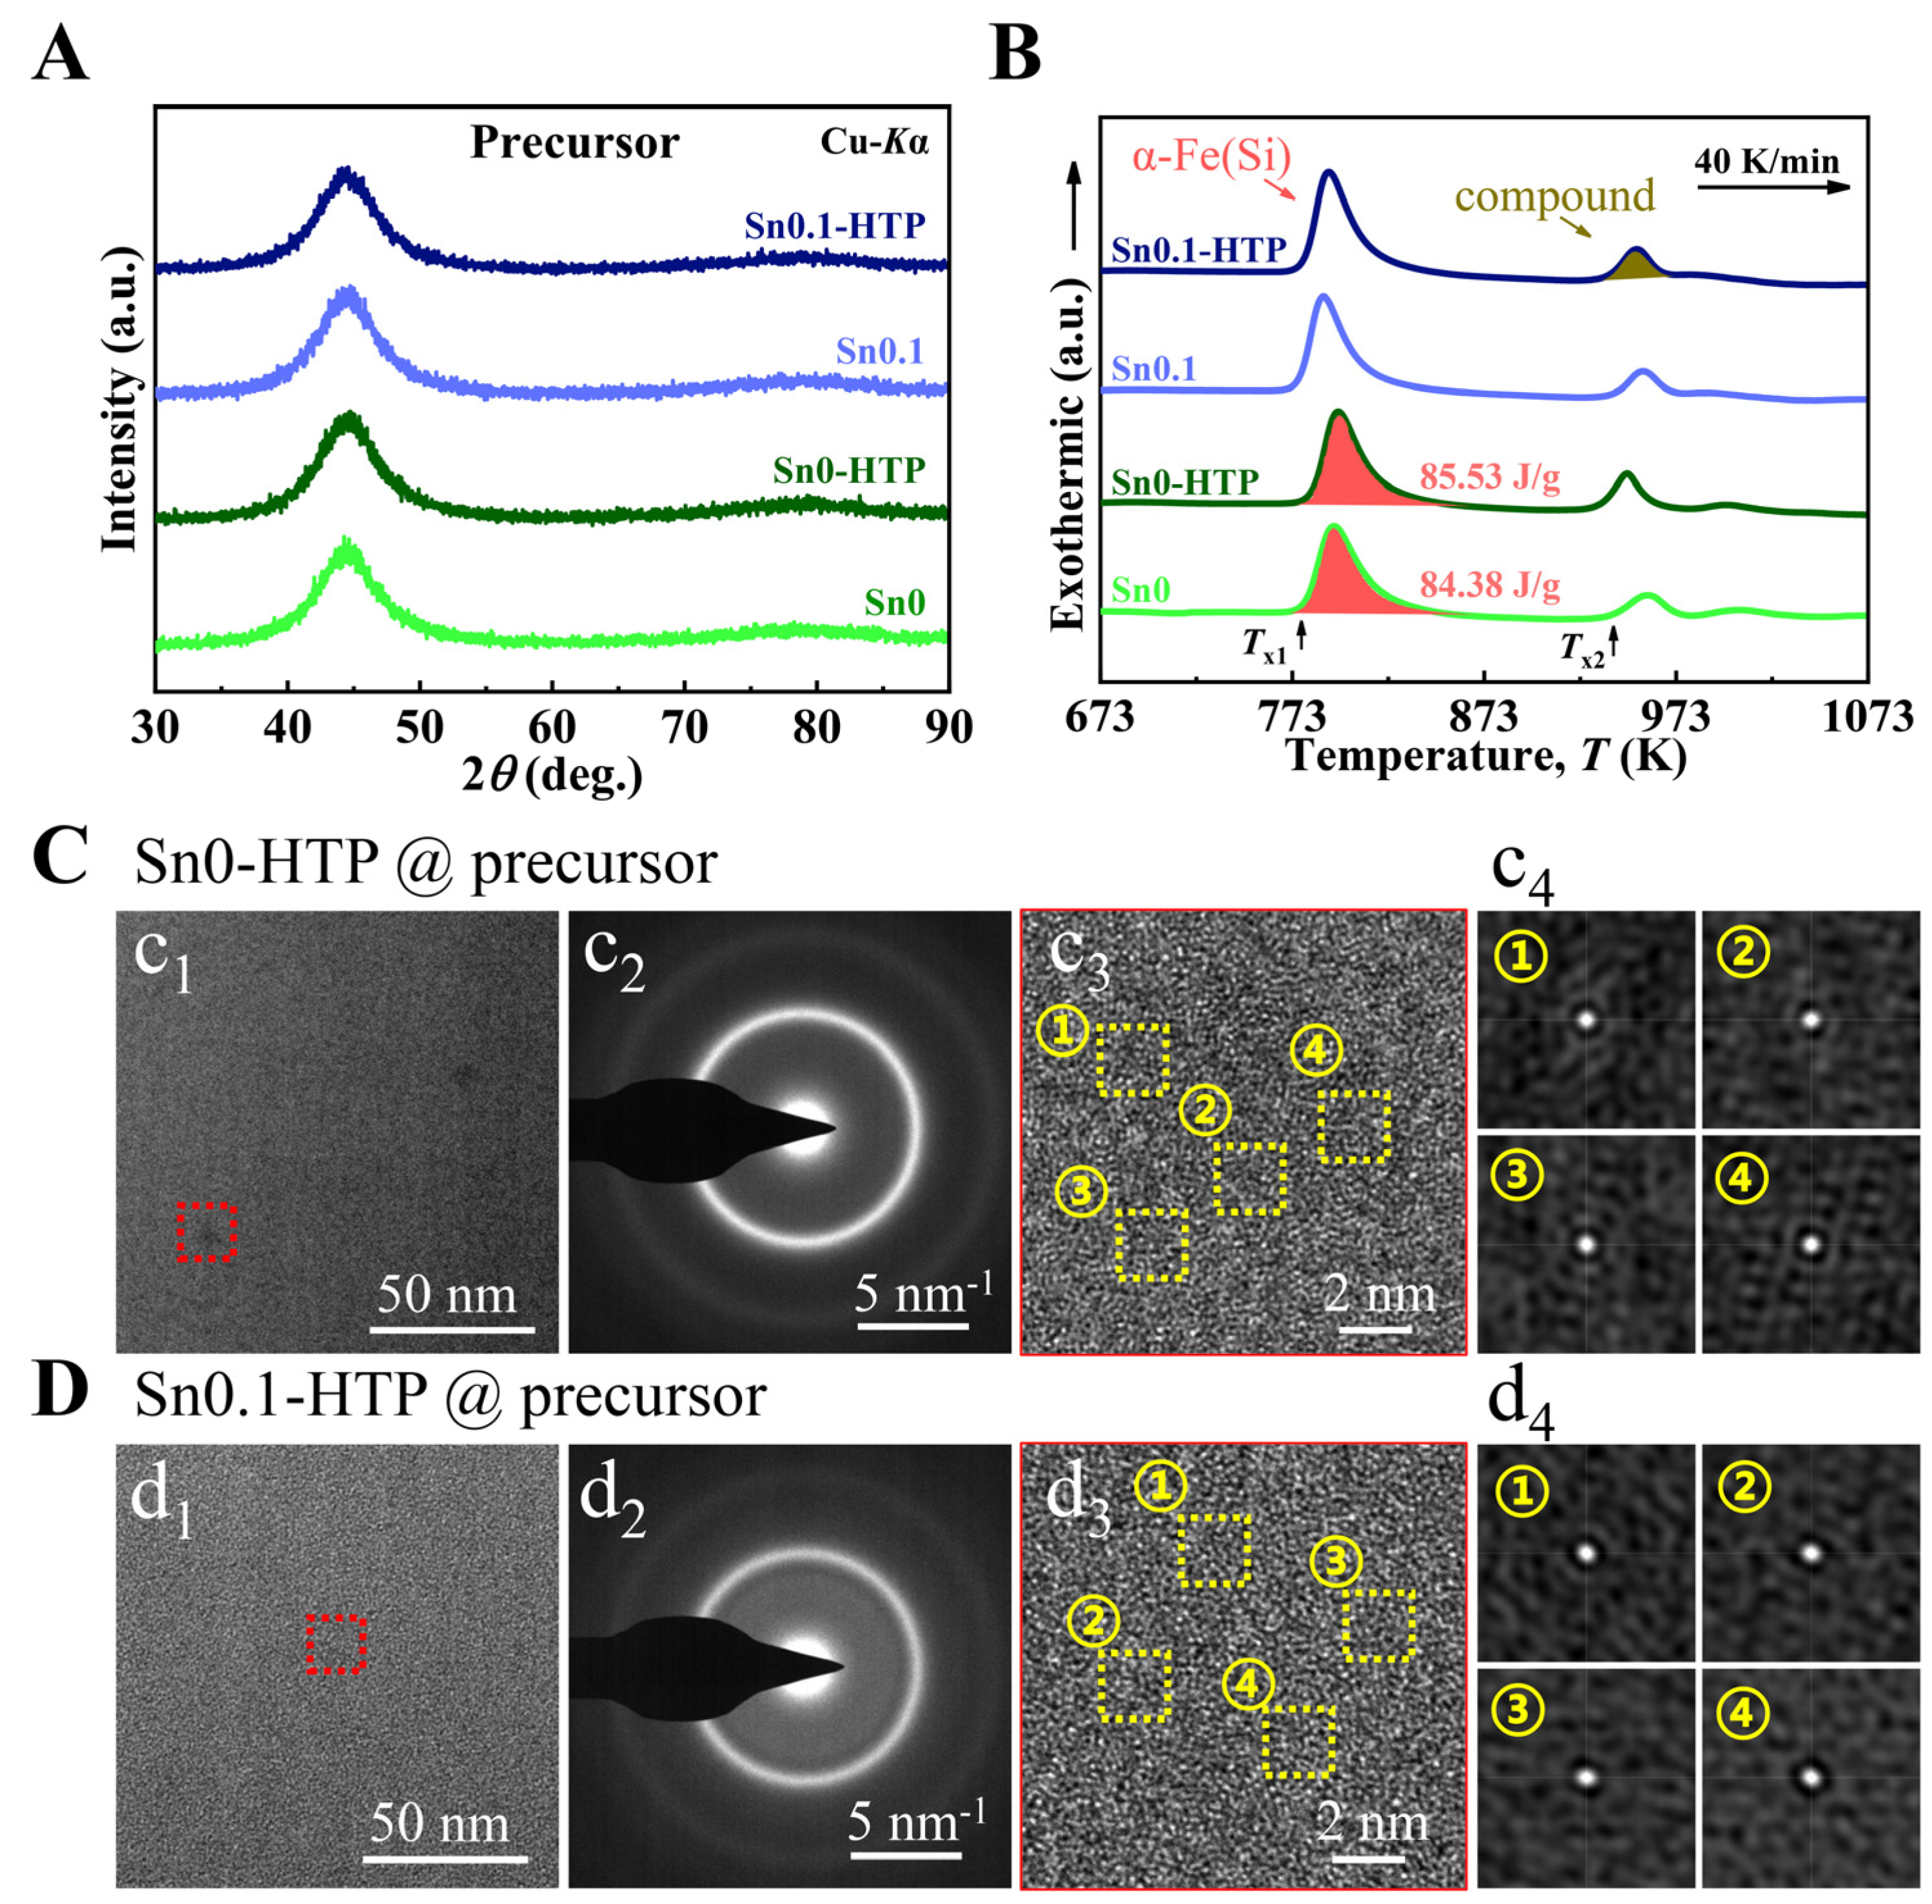
HTP treatment reportedly affects the chemical distribution of master alloys [49] and, consequently, could influence the fragility parameter of melts and AFA of the precursor ribbons. To achieve a superior nanocrystalline-amorphous dual-phase structure, the Sn0 and Sn0.1 melts were treated through HTP to produce Sn0-HTP and Sn0.1-HTP precursor ribbons. The XRD patterns (Figure 4A) reveal the HTP treatment has a negligible effect on the amorphous nature of precursors. However, as shown in DSC curves (Figure 4B), for Sn0, the HTP treatment resulted in an increase of 4 K in Tx1 and an increase of 1.15 J/g in the primary crystallization enthalpy (ΔH). The differences can be attributed to the presence of quenched nanograins in Sn0. It is worth noting that there is no crystallization region or crystal-like region in the TEM image (Figure 4(c1,c3)) of the Sn0-HTP precursor, and the 2D image of the local region after auto-correlation analysis also exhibits a disordered structure (Figure 4c4), which contrasts with that of Sn0 precursor, indicating the effectiveness of HTP treatment in enhancing AFA of precursor. The Sn0.1-HTP precursors also show a completely disordered structure (Figure 4D).
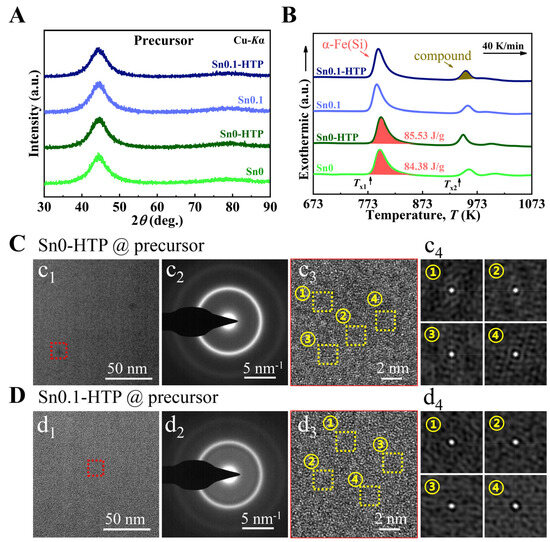
Figure 4.
(A) XRD patterns and (B) DSC curves of Sn0-HPT and Sn0.1-HPT precursors, compared to Sn0 and Sn0.1 precursors. (c1,d1) TEM images and (c2,d2) SAED patterns of (C) Sn0-HTP and (D) Sn0.1-HTP precursors. (c3,d3) Enlargement images of red square areas in (d1) and (c1), respectively. (c4,d4) 2D auto-correlation maps from the regions marked by the yellow squares in the HRTEM images (c3) and (d3), respectively, showing the degree of ordering in the local areas.
As shown in the synchrotron radiation XRD image in Figure 5, the diffraction intensity of the Sn0.1 precursor is higher than that of Sn0.1-HTP at 2θ ≈ 20° and 32°, which indicates that the Sn0.1-HTP precursor has a relatively high degree of disorder [17]. Therefore, the HTP treatment in melts effectively enhances the AFA of precursor ribbons. Furthermore, by comparing the F values of melts with and without HTP treatments (Table 1), it is found that after HTP treatment, the F values of Sn0 and Sn0.1 melts decrease from 1.53 to 1.14 and from 1.50 to 1.27, respectively. Consequently, the AFA of Sn0-HTP and Sn0.1-HTP is improved and the disorder of microstructure is enhanced. However, after HTP treatment, the F value of Sn0.3 increases from 1.48 to 1.76, which leads to worse AFA, so it is difficult to obtain precursor ribbons with good surface quality and amorphous structure.
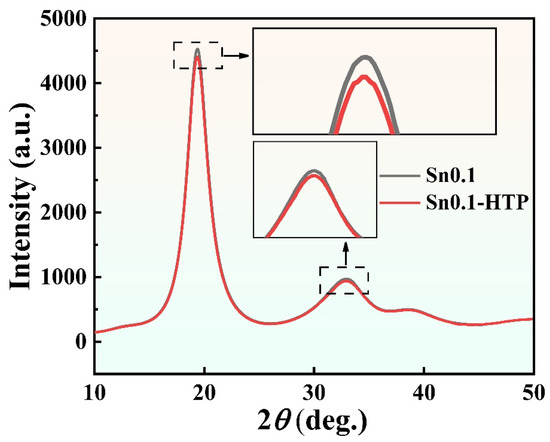
Figure 5.
Synchrotron radiation XRD patterns of Sn0.1 and Sn0.1-HTP precursor ribbons. The insets show the enlarged image of the dashed rectangular areas.
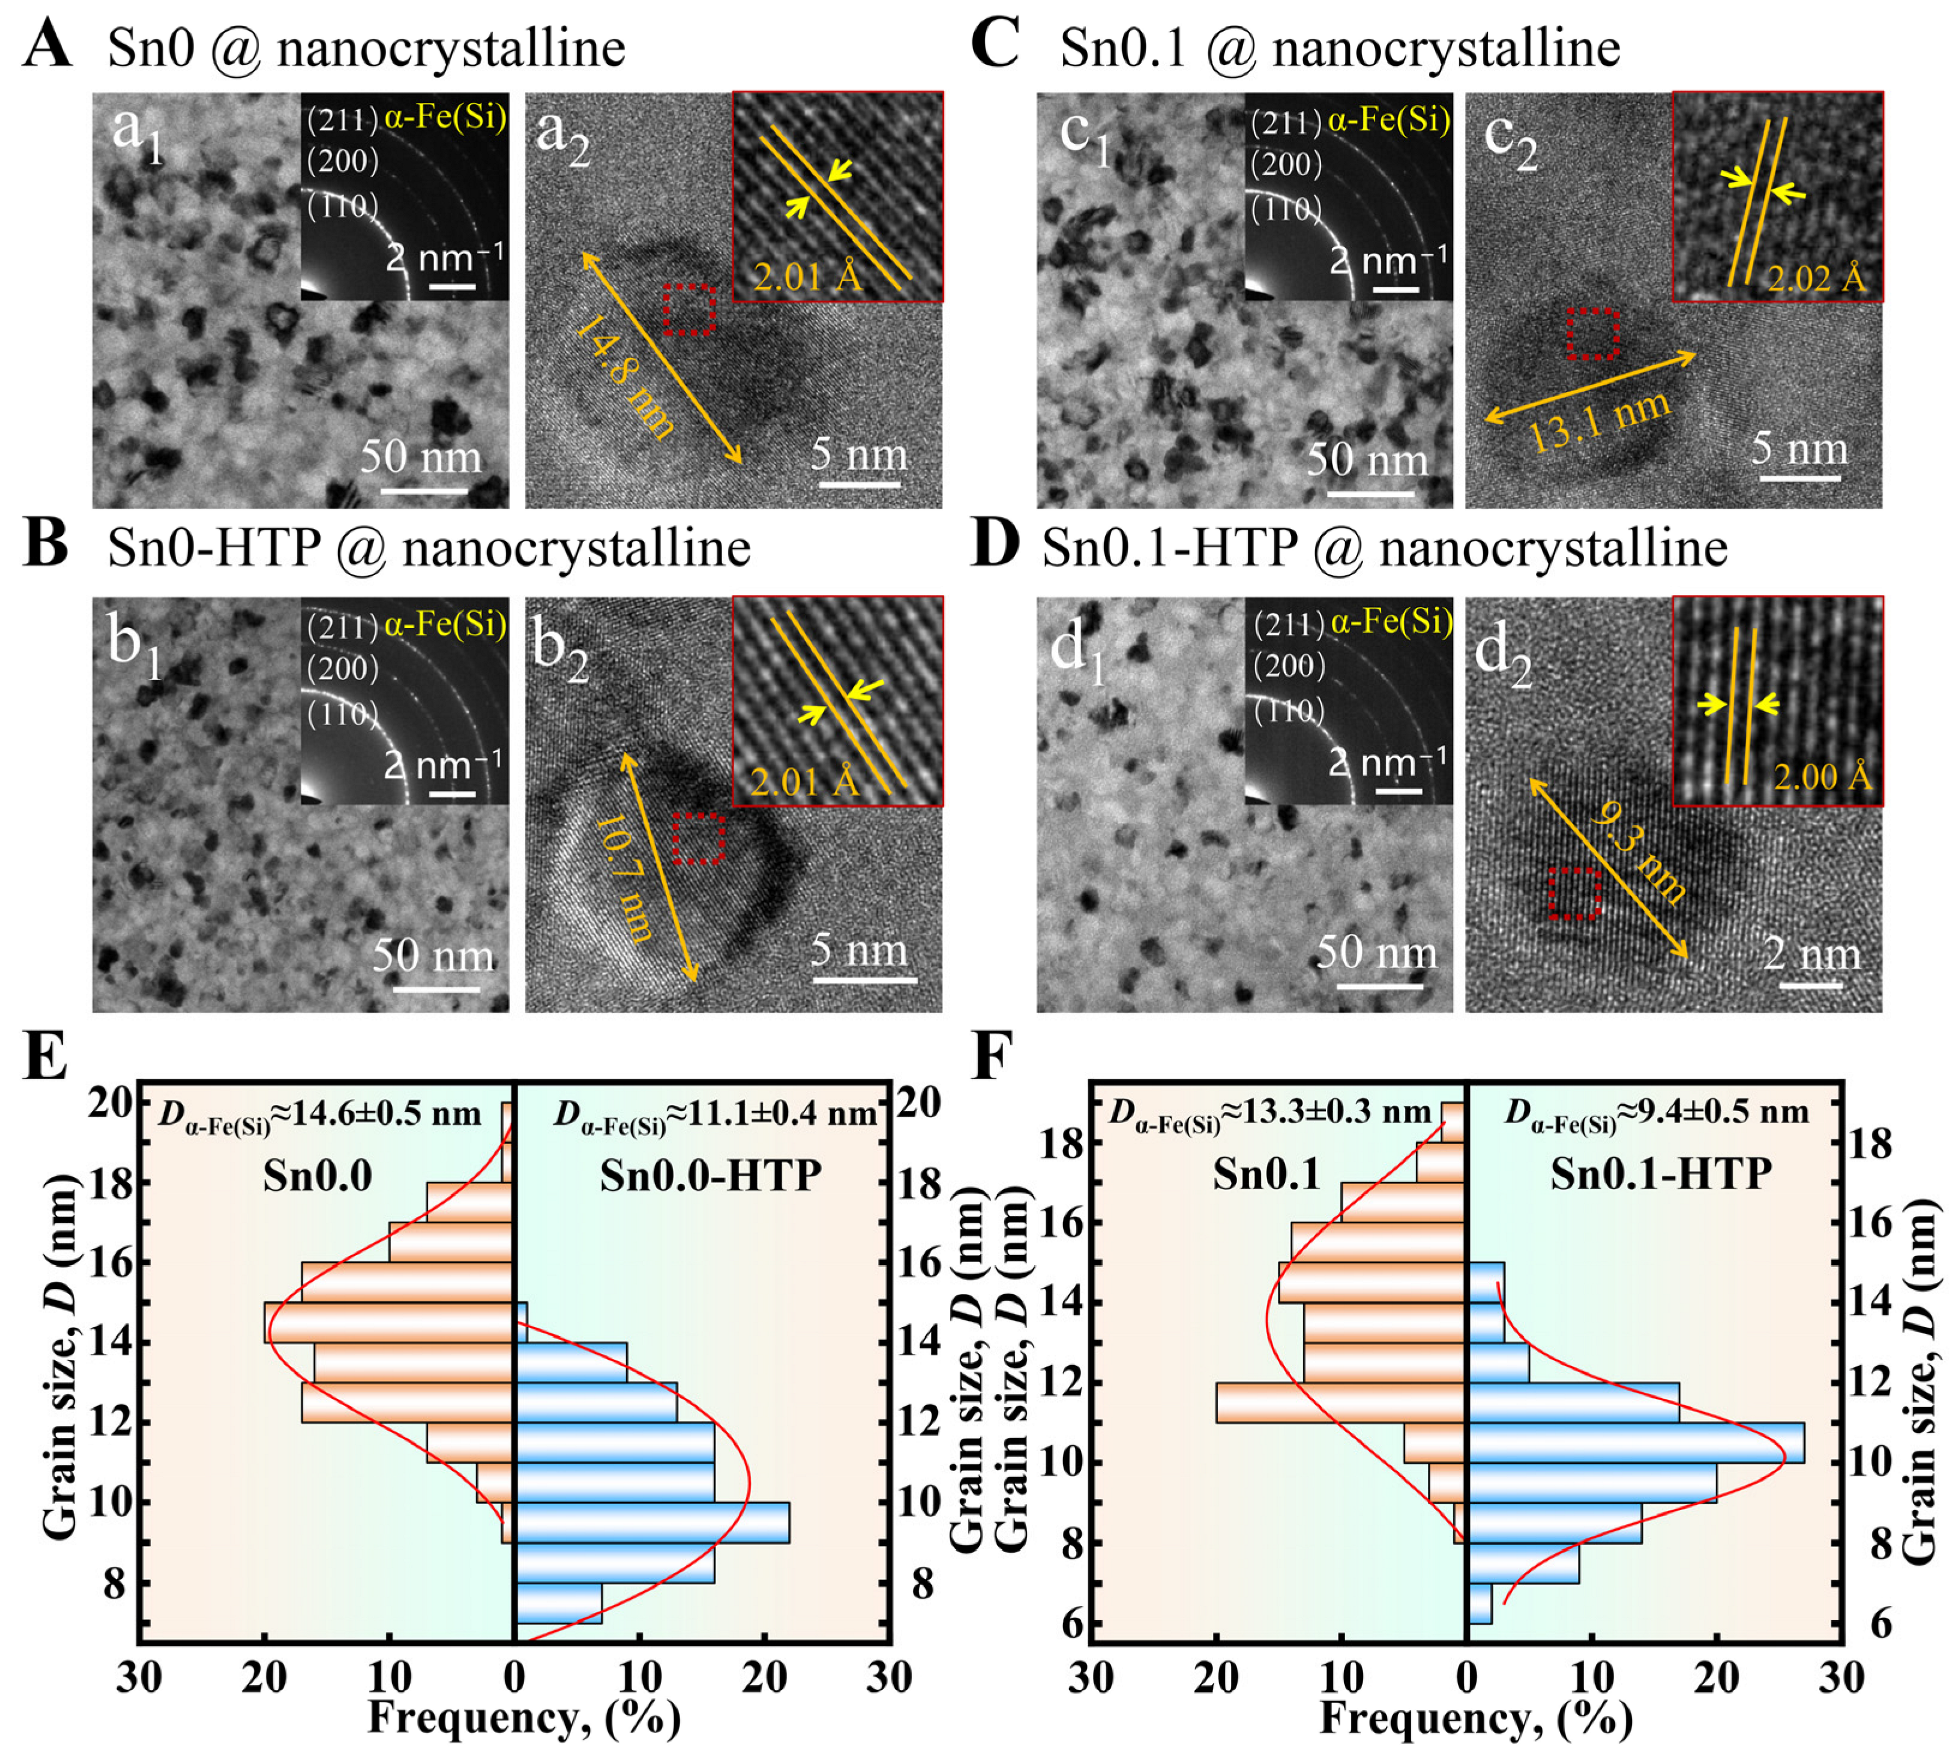
Figure 6 shows the TEM images and grain size distribution of the nanocrystalline ribbons obtained after the optimal heat treatment of the above samples. Except for a small amount of grain aggregation in Sn0.1, other nanocrystalline ribbons exhibit nanocrystals uniformly distributed in the amorphous matrix. The (110), (200), and (211) diffractions observed in the SAED patterns (inset of Figure 6(a1,b1,c1,d1)) and the interplanar distance of approximating 2 Å (inset of Figure 6(a2,b2,c2,d2)) confirm that the precipitated grains are α-Fe(Si), which is consistent with the results in Figure S4. After comparing the grain size of HRTEM images, we found that the grains in Sn0-HTP and Sn0.1-HTP samples were 3–4 nm smaller than those in Sn0 and Sn0.1, respectively. The statistical results of grain size, as shown in Figure 6E,F, display that the average grain sizes of Sn0 and Sn0.1 are approximately 14.6 nm and 13.3 nm, respectively. In contrast, the average sizes of Sn0-HTP and Sn0.1-HTP are around 11.1 nm and 9.4 nm, respectively. Debye–Scherrer formula as D = Kλ/(βcosθ) was used to calculate the grain size of each sample in the XRD patterns. The average grain sizes of Sn0 and Sn0.1 are 14.2 ± 0.3 nm and 13.1 ± 0.5 nm, respectively, and those of Sn0-HTP and Sn0.1-HTP are 11.6 ± 0.4 nm and 10.2 ± 0.4 nm, respectively. The average grain size calculated from XRD results is close to the grain size estimated by our statistics from TEM observations. These findings clearly demonstrate that the HTP treatment is effective in refining the grain size of the obtained nanocrystalline ribbons. The reason may be that the heterogeneous nucleation points in the master alloy decompose at high temperatures for a long time or decrease due to material exchange in the process of thermal convection, which is helpful in optimizing the microstructure of the alloy [50]. This HTP process ensures that the precursors possess a homogeneous microstructure, which is crucial for refining their nanocrystallized structure.
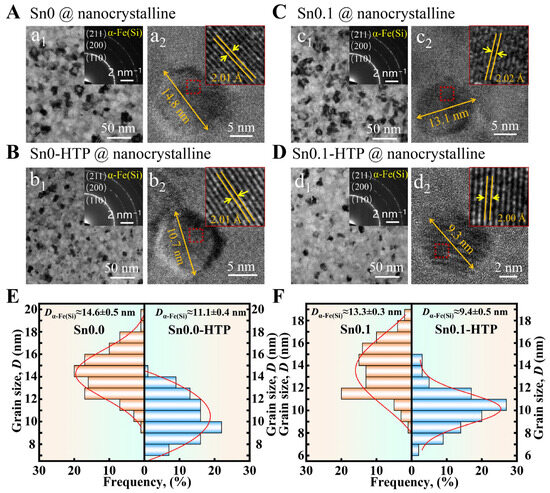
Figure 6.
(a1,b1,c1,d1) TEM, (a2,b2,c2,d2) HRTEM, and SAED images of (A) Sn0, (B) Sn0-HTP, (C) Sn0.1, and (D) Sn0.1-HTP nanocrystalline ribbons; Statistical diagram of grain size of (E) Sn0 with Sn0-HTP and (F) Sn0.1 with Sn0.1-HTP.
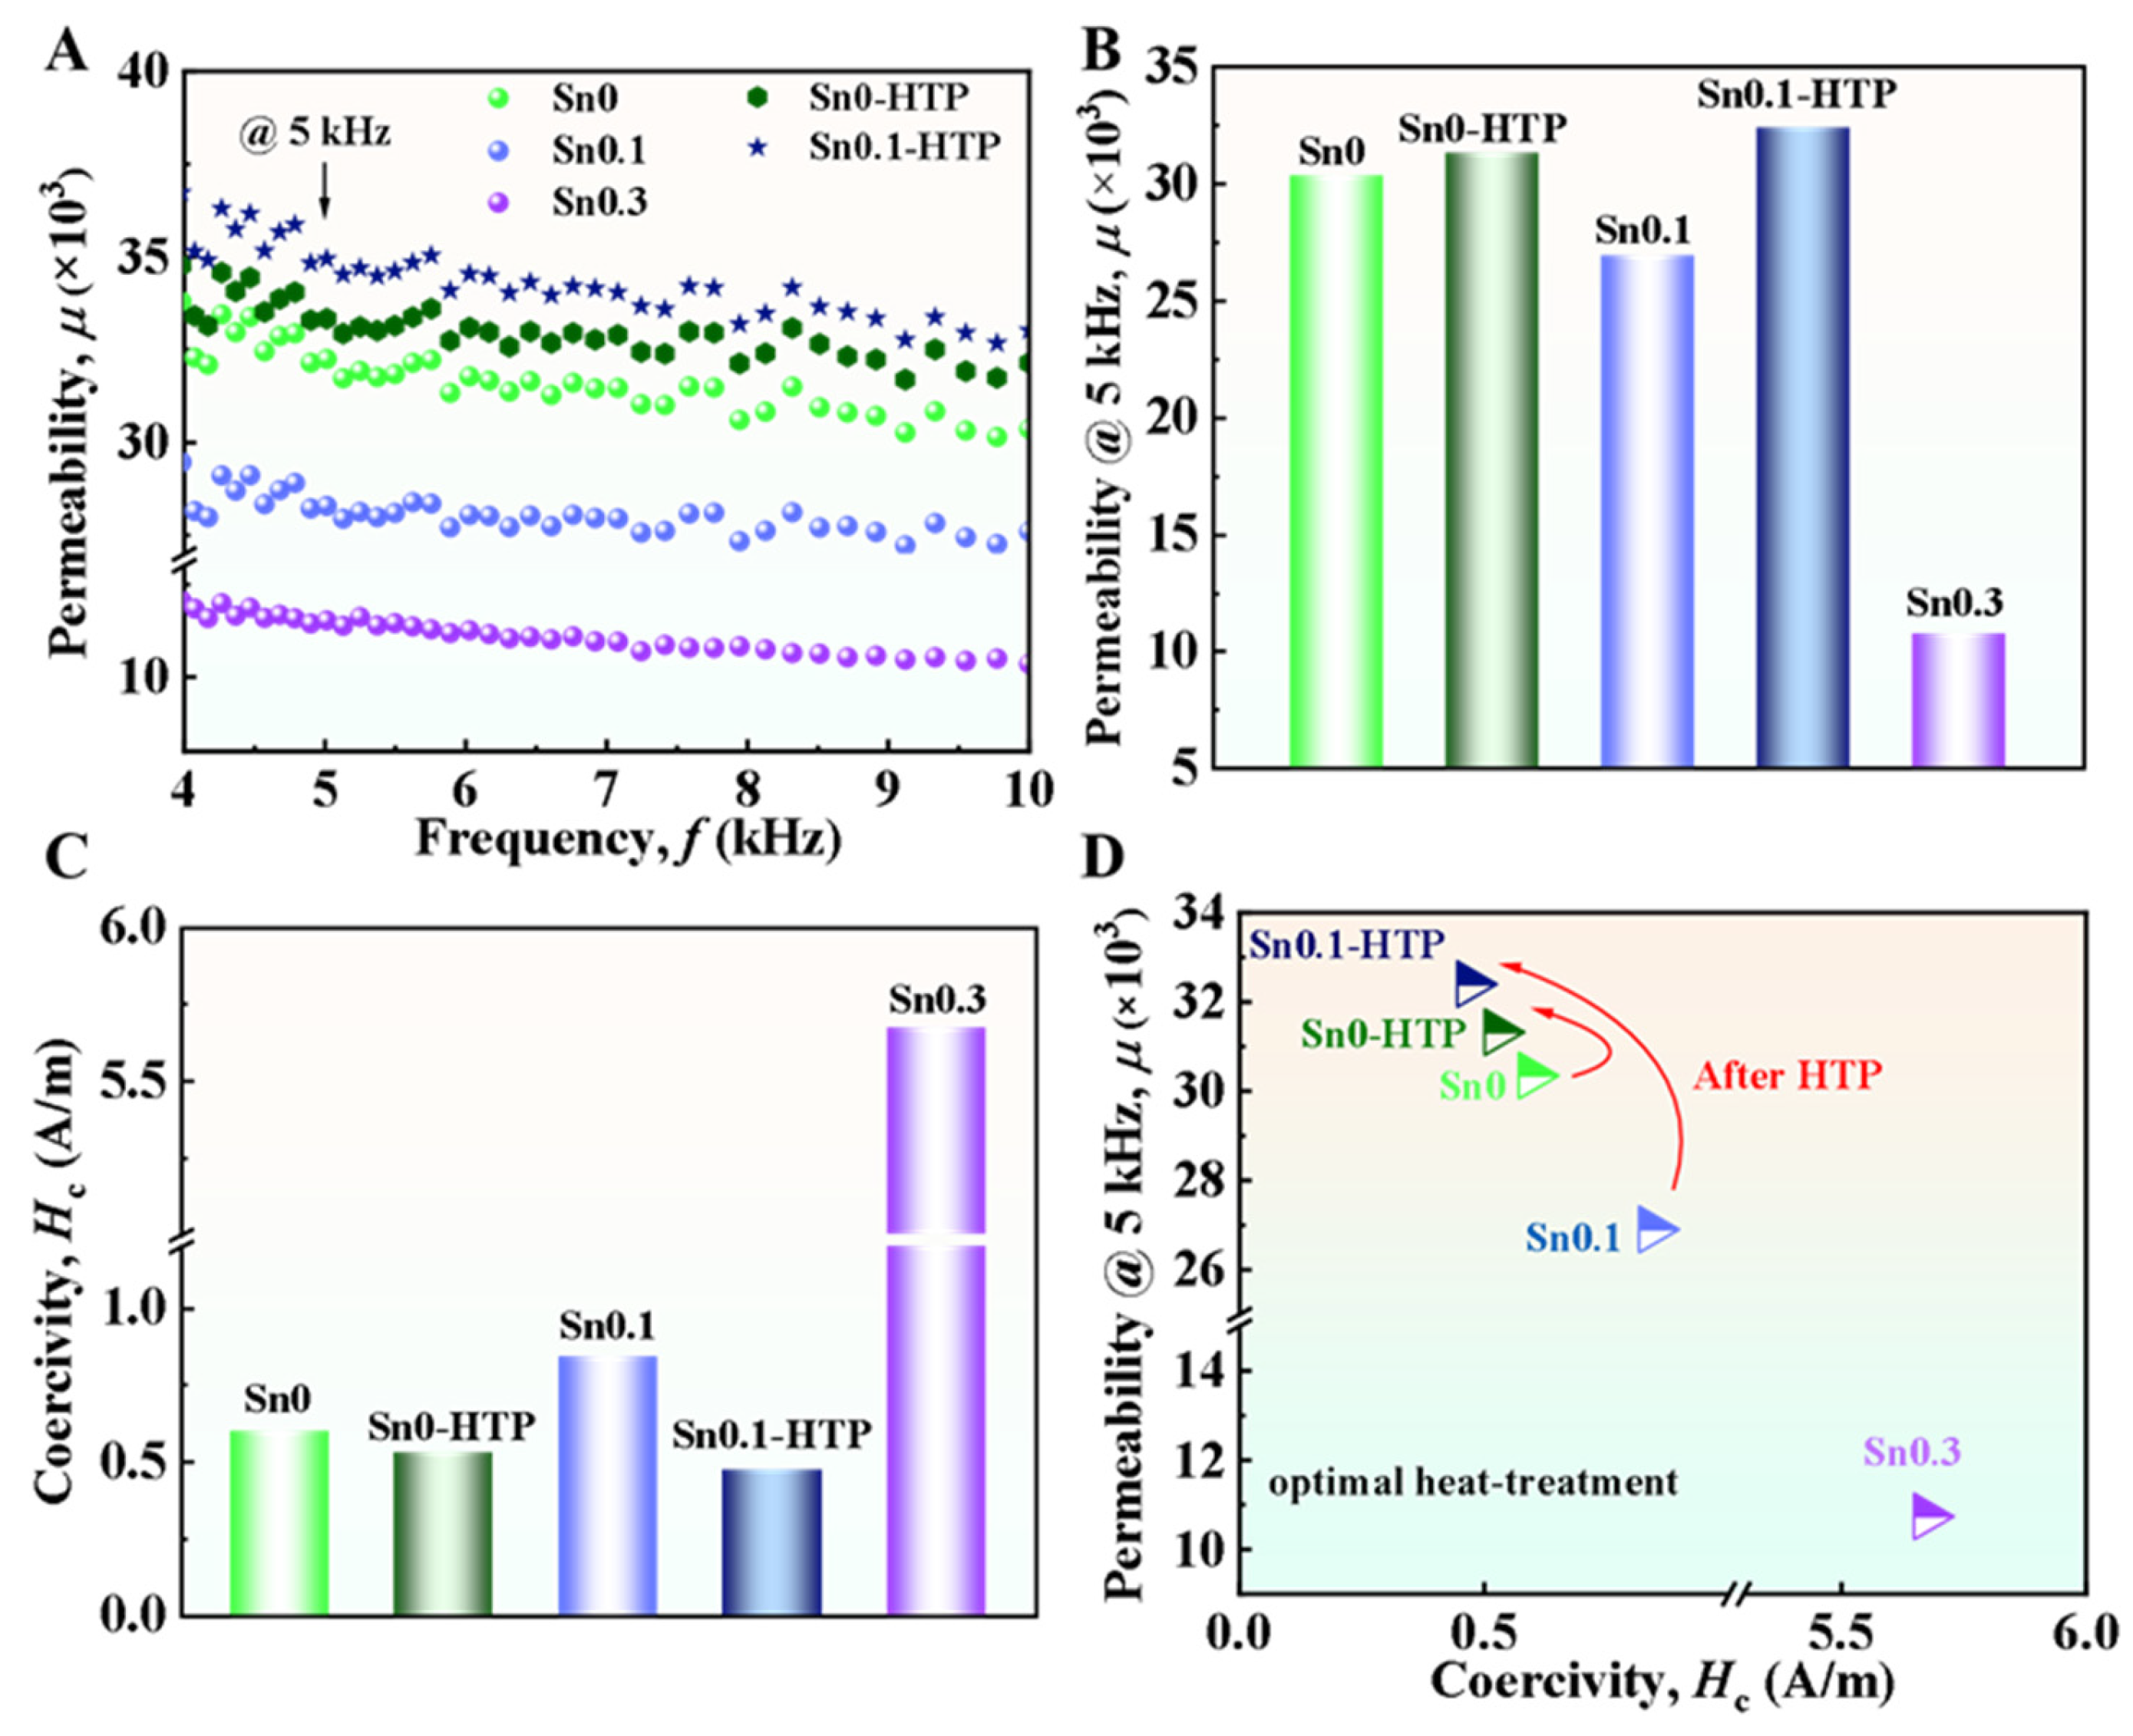
We further performed an investigation on the SMPs of Sn0, Sn0.1, Sn0.3, Sn0-HTP, and Sn0.1-HTP alloys. The precursor ribbons were heat-treated at 873 K for 10 min to yield nanocrystalline ribbons. As shown in Figure 7A,B, the μ of Sn0-HTP and Sn0.1-HTP nanocrystalline ribbons, measured at frequencies ranging from 4 to 10 kHz, is higher than that of Sn0 and Sn0.1, indicating that the effectiveness of HTP in enhancing permeability of nanocrystalline materials. The μ at 5 kHz of Sn0-HTP and Sn0.1-HTP reaches 31,000 and 32,400, respectively. Accordingly, the Hc of Sn0-HTP and Sn0.1-HTP nanocrystalline ribbons are as low as 0.5 and 0.4 A/m, respectively, which is smaller than those of Sn0 and Sn0.1 (Figure 7C,D). This is mainly attributed to the fact that HTP treatment can refine the nanocrystals obtained after nanocrystallization. Correspondingly, Hc and μ vary with the average size of nanocrystals (D) as Hc∝D6 and μ∝1/D6, respectively [51]. However, the Sn0.3 nanocrystalline ribbon exhibits the lowest μ of 10,700 and the highest Hc of 5.7 A/m, which is ascribed to the weakening of averaging effect of random magnetocrystalline anisotropy induced by its inhomogeneous nanocrystalline structure with aggregation of some nanocrystals having the same orientation [52]. As shown in Figure 3, when the content of Sn increases from 0.1 at% to 0.3 at%, the average size of Cu clusters increases by 1.5 nm, and the phenomenon of grain aggregation is more obvious. We calculated the average grain size by Scherrer’s equation and found that the average grain size of Sn0.1 and Sn0.3 is 13.1 nm and 12.9 nm, respectively, and the change is not obvious, so grain aggregation is an important reason for the significant difference in SMPs between them. In contrast to the Sn0.3 alloy with obvious grain aggregation in the same orientation, Sn0.1 exhibits relatively uniform fine nanograins with weak aggregation, which induces weak anisotropy and results in a low Hc of 0.8 A/m. The precursor of Sn0 alloy shows local crystallization regions characterized by approximately 2 nm lattice fringe-like structures, dispersed in the amorphous matrix, indicating relatively poor AFA. Adding 0.1 at% Sn leads to a discontinuous change in viscosity during cooling. This addition also reduces the value of F, thereby enhancing the AFA, resulting in the precursor of Sn0.1 alloy having a completely amorphous structure. Although the addition of 0.3 at.% Sn also leads to a completely amorphous structure in the precursor, it increases the size of Cu clusters and forms Sn clusters, which causes grain aggregation during the nanocrystallization process, As a result, the magnetic softness deteriorates, the Sn0.3 alloy has a high Hc of 5.7 A/m due to the increase in effective magnetic anisotropy caused by grain aggregation In contrast, the Sn0.1 alloy has a low Hc of 0.8 A/m due to its ultrafine nanograins with weak local aggregation. HTP treatment promotes the AFA and disorder in the precursor ribbons, refining the grain size of the nanocrystalline ribbons. This grain refinement leads to a decrease in the effective magnetic anisotropy and the optimization of SMPs.
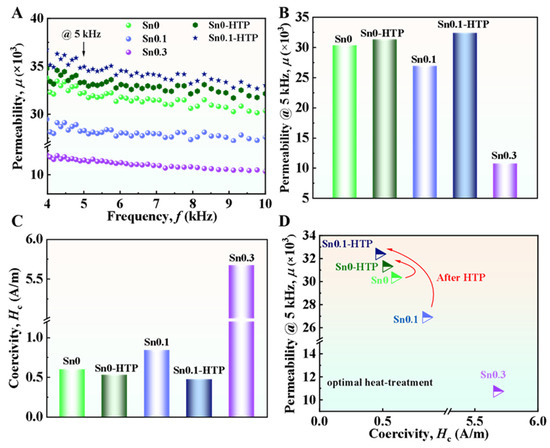
Figure 7.
(A) Frequency dependence of nanocrystalline ribbons. (B) μ at 5 kHz, and (C) Hc and (D) SMPs of nanocrystalline ribbons obtained from optimal heat treatment.
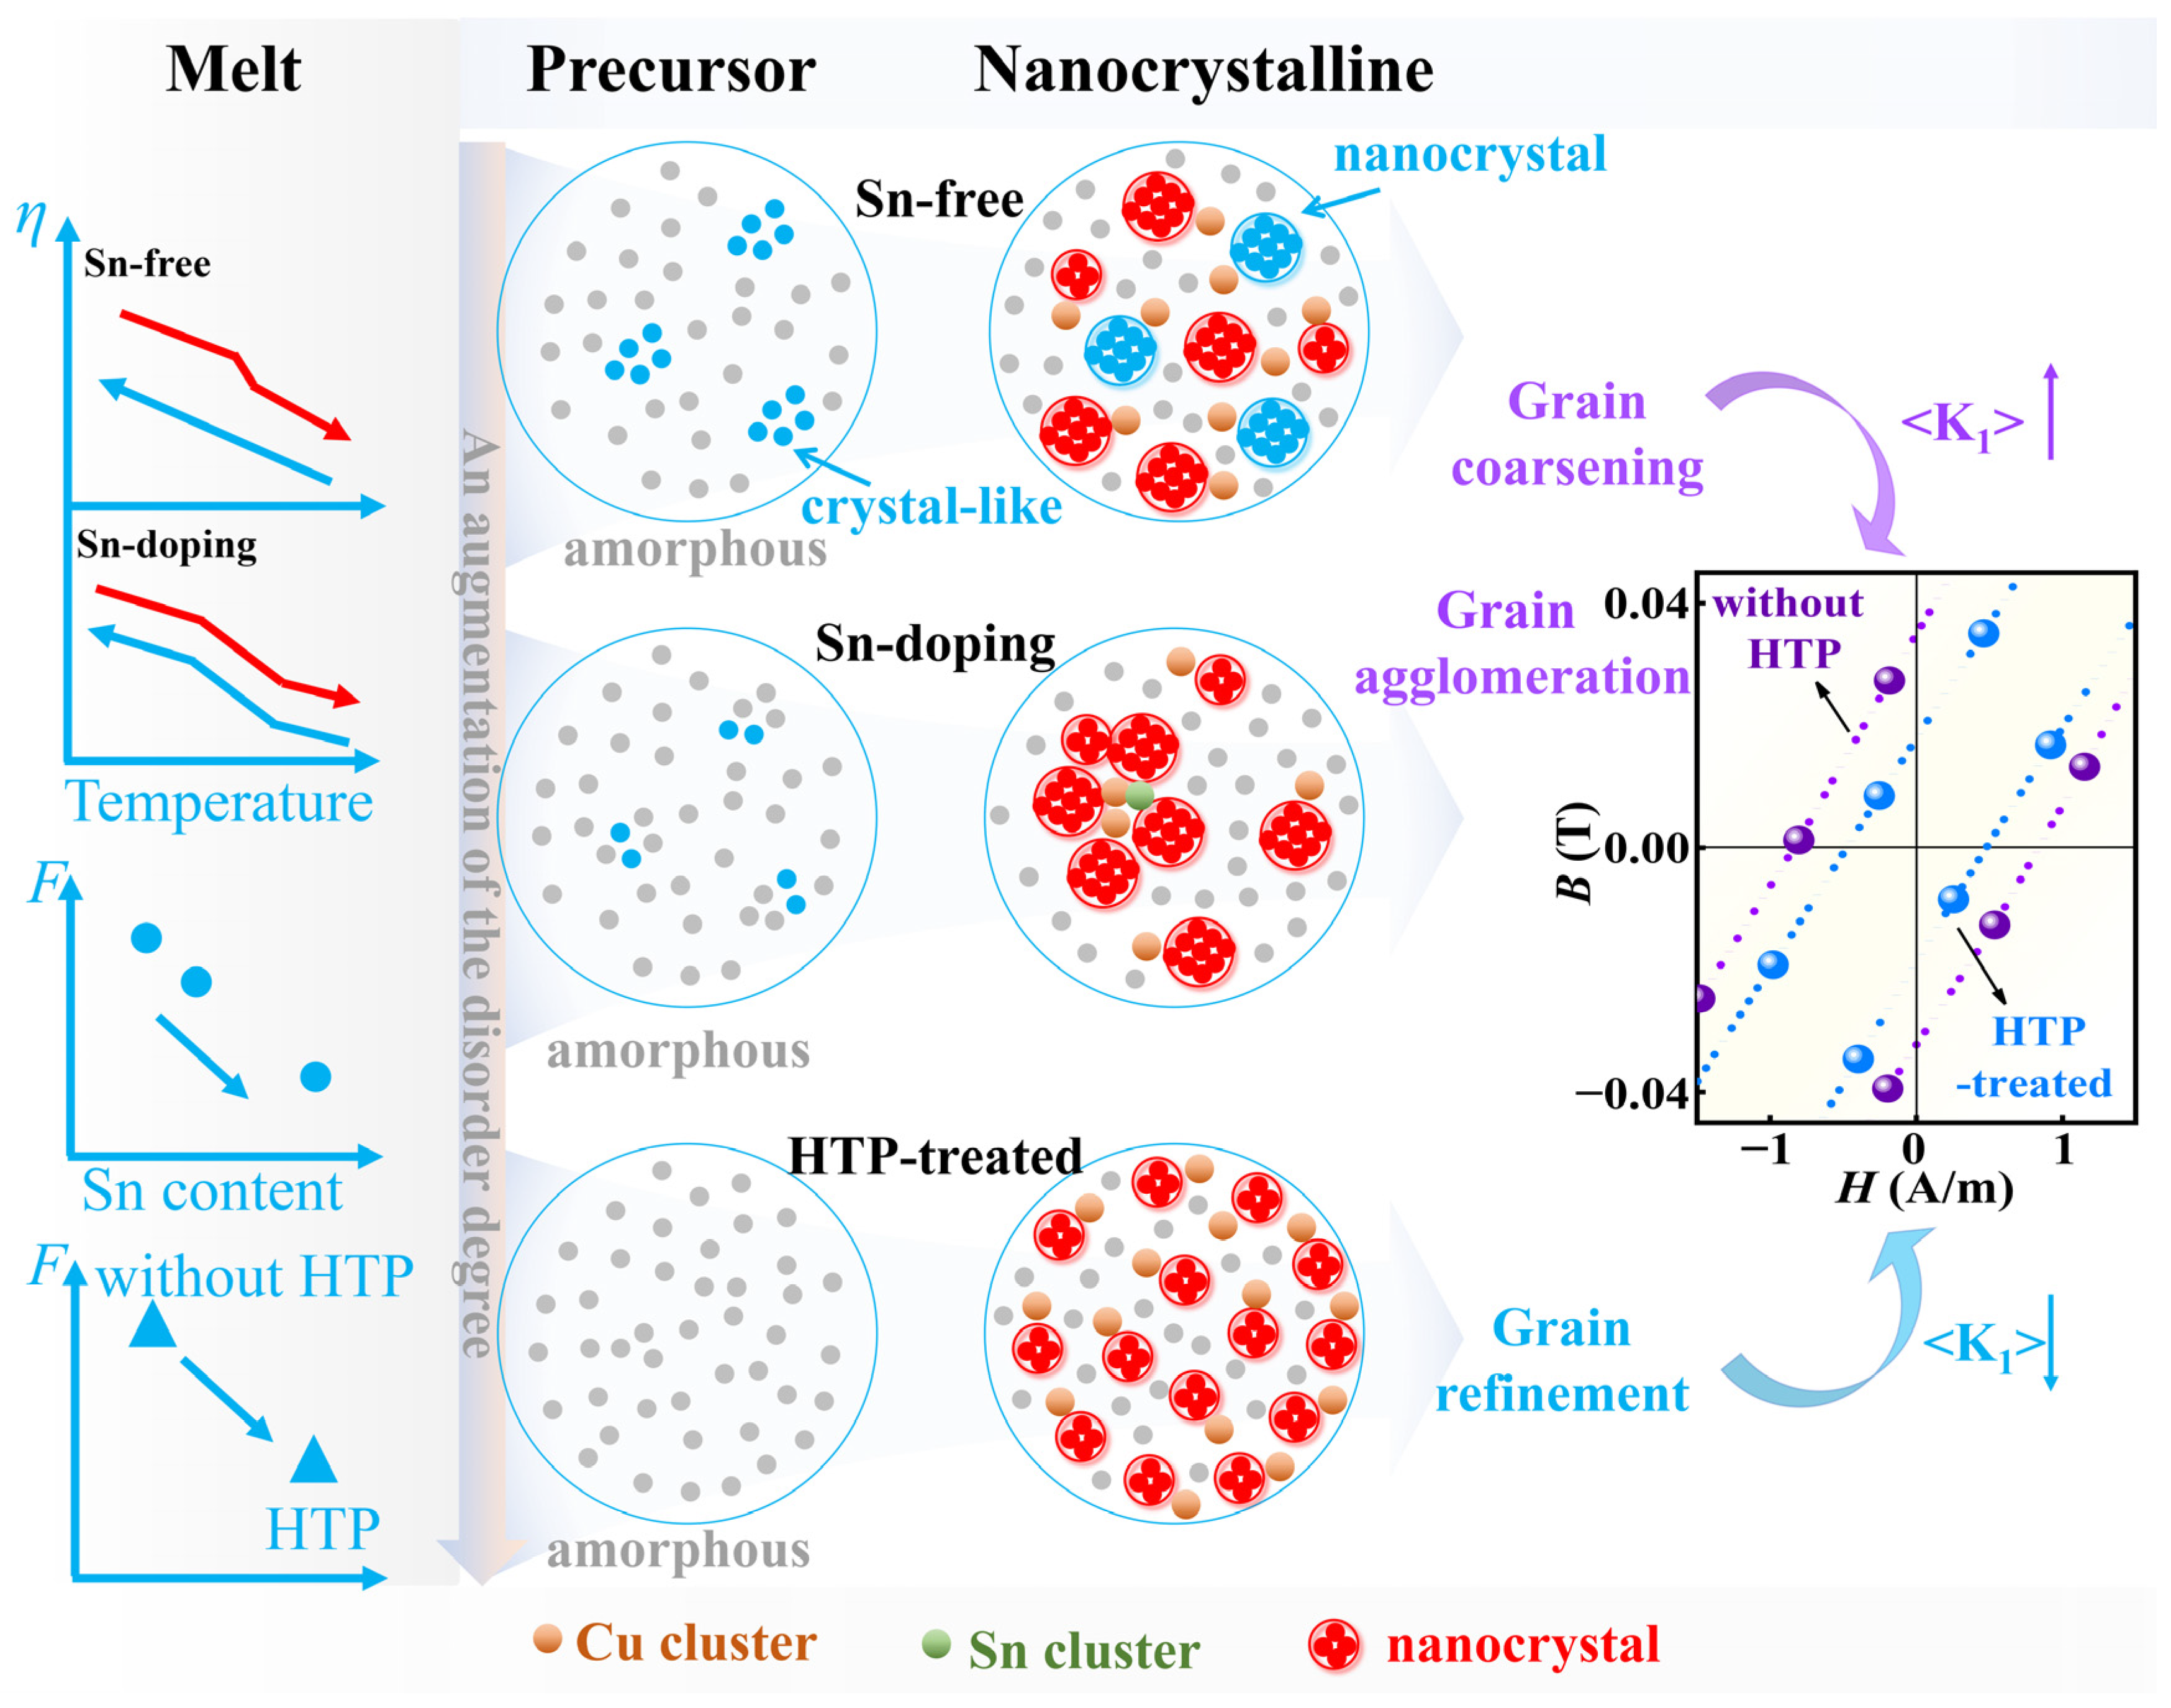
To clearly elucidate the effect of Sn content and HTP on the F of melts, AFA of precursor, and crystallization behavior, a schematic showing the correlation among viscosity, precursor structure, nanocrystalline structure, and SMPs is illustrated in Figure 8. With the addition of Sn, the viscosity of the master alloy melt decreases gradually at the same temperature, along with a reduction in the F value of the melt (Table 1). This indicates the Sn-doping melt shows a relatively weak relative change of M during cooling, compared to the Sn-free melt. The lower F in the Sn-doping melt makes it less prone to forming a crystal-like structure during cooling, resulting in improved AFA of precursors. In the Sn-free precursor, a portion of crystal-like structures tend to form easily. During the subsequent heat treatment, these crystal-like structures grow into distinct nanocrystals. In addition, the formation of Cu cluster nucleation sites facilitates the nucleation of new nanocrystals around them. The growth competition with crystal-like structures and new nanocrystals results in relatively uniformly distributed nanocrystals under optimal nanocrystallization. For the Sn-doping alloy, obvious grain aggregation has been observed in the nanocrystallized structure. This may be attributed, on the one hand, to the large reduction of crystal-like structures, which reduces the inhibitory effect on the uneven nucleation distribution of new nanocrystals [53]. On the other hand, the increase in the size of Cu clusters, along with the formation of Sn clusters around them, facilitates easier nucleation and growth of nanocrystals, resulting in an agglomerated grain structure. According to the Herzer model, the average magnetocrystalline anisotropy, <K1>, is proportional to the average size of nanocrystals (D) [52]. Therefore, the addition of Sn causes grain agglomeration, which increases the <K1>, leading to the increase in Hc of nanocrystalline ribbons. Due to the addition of 0.3 at% Sn, Sn0.3 has a lower viscosity than Sn0 and Sn0.1. The M of Sn0.3 melt (MHT = 2.62, MLT = 1.78) is higher than that of Sn0 (MHT = 2.00, MLT = 1.31) and Sn0.1 (MHT = 2.14, MLT = 1.43) in HT region and LT region, which indicates that the melt is relatively unstable in both temperature regions. However, the ratio of high and low-temperature M, that is F value, can measure the change degree of melt stability and the trend of crystalline phase formation during cooling. The smaller the F value is, the weaker the trend is, and the better the AFA of the alloy is. Sn0.3 (F = 1.48) has a lower F value than Sn0 (F = 1.53) and Sn0.1 (F = 1.50), so its precursor structure shows a higher degree of disorder. In the process of heat treatment, because the heat of mixing between Sn and Cu is positive (7 kJ/mol), the addition of 0.3 at% Sn promotes the clustering of Cu clusters and increases the size of Cu clusters before nanocrystallization, which increases the Cu cluster size of 1.5 nm compared with Sn0 and Sn0.1. Therefore, in the process of nanocrystallization of Sn0.3, with the clustering of Sn and the increase in the size of Cu clusters, the grains tend to precipitate near the nucleation position, resulting in the aggregation of grains with the same orientation. This phenomenon of grain aggregation makes the magnetocrystalline anisotropy (K1) of grains within the ferromagnetic exchange length difficult to average, which makes the <K1> relatively large. Generally speaking, the Hc is directly proportional to the <K1>, and the μ is inversely proportional to the <K1>, so the increase in <K1> in Sn0.3 deteriorates its SMPs.

Figure 8.
Schematic diagram of the relationship between viscosity, precursor structure, nanocrystalline structure, and Hc.
HTP treatment reduces the F of Sn-free and Sn-doping master alloys (Table 1), reducing the number of heterogeneous nucleation sites in the alloy, so that the precursor structure shows a high degree of disorder. The alloy melt may release some energy when it forms short-order clusters during cooling [33]. We use high-temperature DSC to compare the thermodynamic behavior of the master alloys before and after HTP treatment (Figure S5, Supporting Information). The DSC result shows that the amount of released energy (ΔH) values of the HTP-treated sample is increased from 2.8–4.0 J/g to 5.1–5.8 J/g, compared to the samples without HTP, indicating that HTP-treated samples are more inclined to form short-order clusters, resulting in the improvement of the degree of disorder of the precursors. Consequently, a nanocrystalline-amorphous dual-phase structure with uniform and fine nanocrystals distributed in the amorphous matrix is achieved after optimal heat treatment. This HTP treatment helps to refine the average size of nanocrystals, leading to the reduction in the <K1>, thereby reducing the Hc of nanocrystalline ribbons.
4. Conclusions
In summary, we have conducted a systematical study on the interplay among viscosity, precursor structure, nanocrystalline structure, and SMPs of FeSiBNbCuAlP(Sn) alloy. Unlike the Sn-free melt, which displays a discontinuous viscosity solely during the heating process, Sn-doped alloy melts exhibit abrupt changes in viscosity during both heating and cooling processes. The F value decreases with the addition of Sn, which improves the AFA of the precursor. However, during the nanocrystallization process, Sn doping leads to the formation of large-size Cu clusters and Sn clusters, resulting in grain aggregation and deterioration of SMPs. Furthermore, HTP treatment further decreases the F of the melt, improving the AFA and further enhancing the disorder of the precursor. The treatment refines the nanocrystals in the subsequent crystallization process, resulting in a reduction in <K1>, thereby optimizing the SMPs. These findings elucidate the relationship between HTP, F value, and SMPs, providing another feasible approach for the development of advanced nanocrystalline soft magnetic alloys.
Supplementary Materials
The following supporting information can be downloaded at: https://www.mdpi.com/article/10.3390/met15030262/s1. Figure S1. Annealing temperature dependence of (A) Hc and (B) μ at 5 kHz for several kinds of nanocrystalline alloy ribbons; Figure S2. XRD patterns of Sn0, Sn0.1, and Sn0.3 nanocrystalline alloy ribbons obtained under the optimal heat-treatment condition; Figure S3. Cu and Sn element distribution of the Sn0.3 nanocrystalline ribbon obtained under the optimal heat-treatment condition; Figure S4. XRD patterns of Sn0, Sn0-HTP, Sn0.1 and Sn0.1-HTP nanocrystalline ribbons obtained under the optimal heat-treatment conditions; Figure S5. High temperature DSC Curves of (A) Sn0 with Sn0-HTP and (B) Sn0.1 with Sn0.1-HTP master alloys during cooling.
Author Contributions
Methodology, M.S., J.L. and B.S.; Validation, Y.D.; Investigation, M.S.; Resources, B.Z.; Software, N.Z.; Conceptualization, Q.M.; Formal analysis, J.L.; Data curation, N.Z.; Writing—original draft, M.S.; Writing—review & editing, A.H. and Y.D.; Supervision, B.Z.; Project administration, A.H. and Q.M.; Funding acquisition, B.S. All authors have read and agreed to the published version of the manuscript.
Funding
This work is supported by the “Pioneer” R&D Program of Zhejiang Province (Grant No. 2023C01075), the Youth Innovation Promotion Association CAS (Grant No. 2021294), and Ningbo Key Scientific and Technological Project (Grant No. 2023Z099).
Data Availability Statement
The raw data supporting the conclusions of this article will be made available by the authors on request.
Conflicts of Interest
The authors declare that they have no known competing financial interests or personal relationships that could have appeared to influence the work reported in this paper.
References
- Silveyra, J.M.; Ferrara, E.; Huber, D.L.; Monson, T.C. Soft magnetic materials for a sustainable and electrified world. Science 2018, 362, eaao0195. [Google Scholar] [CrossRef] [PubMed]
- Qi, X.; You, J.; Zhou, J.; Qiu, K.; Cui, X.; Tian, J.; Li, B. A Review of Fe-Based Amorphous and Nanocrystalline Alloys: Preparations, Applications, and Effects of Alloying Elements. Phys. Status Solidi A 2023, 220, 2300079. [Google Scholar] [CrossRef]
- Theisen, E.A. Recent Advances and Remaining Challenges in Manufacturing of Amorphous and Nanocrystalline Alloys. IEEE Trans. Magn. 2022, 58, 2001207. [Google Scholar] [CrossRef]
- Suzuki, K. Recent advances in nanocrystalline soft magnetic materials: A critical review for way forward. J. Magn. Magn. Mater. 2024, 592, 171677. [Google Scholar] [CrossRef]
- Yoshizawa, Y.; Oguma, S.; Yamauchi, K. New Fe-based soft magnetic alloys composed of ultrafine grain structure. J. Appl. Phys. 1988, 64, 6044–6046. [Google Scholar] [CrossRef]
- Zhou, J.; Li, X.; Hou, X.; Ke, H.; Fan, X.; Luan, J.; Peng, H.; Zeng, Q.; Lou, H.; Wang, J.; et al. Ultrahigh Permeability at High Frequencies via A Magnetic-Heterogeneous Nanocrystallization Mechanism in an Iron-Based Amorphous Alloy. Adv. Mater. 2023, 35, 2304490. [Google Scholar] [CrossRef]
- Li, X.; Zhou, J.; Shen, L.; Sun, B.; Bai, H.; Wang, W. Exceptionally High Saturation Magnetic Flux Density and Ultralow Coercivity via an Amorphous–Nanocrystalline Transitional Microstructure in an FeCo-Based Alloy. Adv. Mater. 2023, 35, 2205863. [Google Scholar] [CrossRef]
- Makino, A.; Men, H.; Kubota, T.; Yubuta, K.; Inoue, A. New Fe-metalloids based nanocrystalline alloys with high Bs of 1.9T and excellent magnetic softness. J. Appl. Phys. 2009, 105, 07A308. [Google Scholar] [CrossRef]
- Willard, M.A.; Laughlin, D.E.; McHenry, M.E.; Thoma, D.; Sickafus, K.; Cross, J.O.; Harris, V.G. Structure and magnetic properties of (Fe0.5Co0.5)88Zr7B4Cu1 nanocrystalline alloys. J. Appl. Phys. 1998, 84, 6773–6777. [Google Scholar] [CrossRef]
- Fan, X.; Zhang, T.; Yang, W.; Luan, J.; Jiao, Z.; Li, H. Design of FeSiBPCu soft magnetic alloys with good amorphous forming ability and ultra-wide crystallization window. J. Mater. Sci. Technol. 2023, 147, 124–131. [Google Scholar] [CrossRef]
- Zang, B.; Parsons, R.; Onodera, K.; Kishimoto, H.; Kato, A.; Liu, A.; Suzuki, K. Effect of heating rate during primary crystallization on soft magnetic properties of melt-spun Fe-B alloys. Scr. Mater. 2017, 132, 68–72. [Google Scholar] [CrossRef]
- Cai, P.; He, A.; Zhang, N.; Zhang, B.; Ling, Y.; Dong, Y. Correlation between stress relaxation induced anisotropy, magnetic domain, and permeability of Co-doped FeCuSiBNbMn alloys. J. Magn. Magn. Mater. 2023, 588, 171407. [Google Scholar] [CrossRef]
- Novák, L.; Kováč, J. Influence of mechanical stress on magnetization processes in amorphous FINEMET alloy. J. Alloys Compd. 2022, 909, 164846. [Google Scholar] [CrossRef]
- Ding, Q.; Li, J.; Zhang, R.; He, A.; Dong, Y.; Sun, Y.; Zheng, J.; Li, X.; Liu, X. Effect of transverse magnetic field annealing on the magnetic properties and microstructure of FeSiBNbCuP nanocrystalline alloys. J. Magn. Magn. Mater. 2022, 560, 169628. [Google Scholar] [CrossRef]
- Zhang, R.; He, A.; Cai, P.; Zhang, J.; Dong, Y.; Li, J.; Ling, Y.; Shen, B. Nanostructural evolution and improved magnetic performance of high saturation-induction Fe-based alloy via two-step combination crystallization. Mater. Charact. 2023, 205, 113317. [Google Scholar] [CrossRef]
- Li, X.; Sun, R.; Li, D.; Song, C.; Zhou, J.; Xue, Z.; Chang, C.; Sun, B.; Zhang, B.; Ke, H.; et al. A plastic iron-based nanocrystalline alloy with high saturation magnetic flux density and low coercivity via flexible-annealing. J. Mater. Sci. Technol. 2024, 190, 229–235. [Google Scholar] [CrossRef]
- Cao, S.; Liu, G.; Huang, J.; Yu, X.; Fan, D.; Ni, Y.; Luo, Y. Atomic level simulation of amorphous/nanocrystalline transition behavior in the Fe based amorphous alloys. J. Non-Cryst. Solids 2024, 624, 122726. [Google Scholar] [CrossRef]
- Miao, J.; Ercius, P.; Billinge, S.J.L. Atomic electron tomography: 3D structures without crystals. Science 2016, 353, aaf2157. [Google Scholar] [CrossRef]
- Majumdar, B.; Sowjanya, M.; Srinivas, M.; Babu, D.A.; Reddy, T.K.K. Issues on Puddle Formation During Rapid Solidification of Fe–Si–B–Nb–Cu Alloy Using Planar Flow Melt Spinning Process. Trans. Indian Inst. Met. 2012, 65, 841–847. [Google Scholar] [CrossRef]
- Liu, H.; Chen, W.; Qiu, S.; Liu, G. Numerical Simulation of Initial Development of Fluid Flow and Heat Transfer in Planar Flow Casting Process. Metall. Mater. Trans. B 2009, 40, 411–429. [Google Scholar] [CrossRef]
- Zheng, H.; Hu, L.; Zhao, X.; Wang, C.; Sun, Q.; Wang, T.; Hui, X.; Yue, Y.; Bian, X. Poor glass-forming ability of Fe-based alloys: Its origin in high-temperature melt dynamics. J. Non-Cryst. Solids 2017, 471, 120–127. [Google Scholar] [CrossRef]
- Al-Mukadam, R.; Götz, I.K.; Stolpe, M.; Deubener, J. Viscosity of metallic glass-forming liquids based on Zr by fast-scanning calorimetry. Acta Mater. 2021, 221, 117370. [Google Scholar] [CrossRef]
- Shang, J.; Zhao, Y.; Hu, L. Abnormal viscosity changes in high-temperature metallic melts. Acta Phys. Sin. 2018, 67, 106402. [Google Scholar] [CrossRef]
- Ding, Y.; Shi, F.; Wang, X.; Bai, Y.; Wang, Z.; Hu, L. Evolution of coupling modes between α and β relaxations in metallic glass-forming liquids revealed by nano-calorimetry. Acta Mater. 2024, 266, 119698. [Google Scholar] [CrossRef]
- Li, L.; Hu, L.; Zhang, L.; Huang, Y.; Song, K.; Shen, H.; Jiang, S.; Wang, Z.; Zhao, X.; Sun, J. Liquid-liquid transition and inherited signatures in Zr-Cu-Ni-Al metallic glasses. J. Non-Cryst. Solids 2023, 600, 122029. [Google Scholar] [CrossRef]
- Yu, Q.; Wang, X.D.; Lou, H.B.; Cao, Q.P.; Jiang, J.Z. Atomic packing in Fe-based metallic glasses. Acta Mater. 2016, 102, 116–124. [Google Scholar] [CrossRef]
- Luo, S.; Khong, J.C.; Huang, S.; Yang, G.; Mi, J. Revealing in situ stress-induced short- and medium-range atomic structure evolution in a multicomponent metallic glassy alloy. Acta Mater. 2024, 272, 119917. [Google Scholar] [CrossRef]
- Cheng, Y.; Ma, E. Atomic-level structure and structure–property relationship in metallic glasses. Prog. Mater. Sci. 2011, 56, 379–473. [Google Scholar] [CrossRef]
- Xue, L.; Shao, L.; Luo, Q.; Hu, L.; Zhao, Y.; Yin, K.; Zhu, M.; Sun, L.; Shen, B.; Bian, X. Liquid dynamics and glass formation of Gd55Co20Al25 metallic glass with minor Si addition. J. Mater. Sci. Technol. 2021, 77, 28–37. [Google Scholar] [CrossRef]
- Chu, W.; Shang, J.; Yin, K.; Ren, N.; Hu, L.; Zhao, Y.; Dong, B. Generality of abnormal viscosity drop on cooling of CuZr alloy melts and its structural origin. Acta Mater. 2020, 196, 690–703. [Google Scholar] [CrossRef]
- Tsepelev, V.S.; Starodubtsev, Y.N. Nanocrystalline Soft Magnetic Iron-Based Materials from Liquid State to Ready Product. Nanomaterials 2021, 11, 108. [Google Scholar] [CrossRef] [PubMed]
- Bai, Y.; Hu, L.; Qin, J.; Wang, Z.; Song, K. General role of rare earth elements in dynamic characteristic of series of FeB-based bulk-glass-forming liquids. J. Non-Cryst. Solids 2021, 572, 121119. [Google Scholar] [CrossRef]
- Zhao, Y.; Bai, Y.; Ding, Y.; Hu, L. Predicting the glass-forming ability of rare earth-contained Fe-based alloys by features of dynamic transition in their melts. J. Non-Cryst. Solids 2020, 537, 120020. [Google Scholar] [CrossRef]
- López, G.P.; Fabietti, L.M.; Condó, A.M.; Urreta, S.E. Microstructure and soft magnetic properties of Finemet-type ribbons obtained by twin-roller melt-spinning. J. Magn. Magn. Mater. 2010, 322, 3088–3093. [Google Scholar] [CrossRef]
- Duan, H.; Wang, Z.; Jia, Y. Al addition effect on structure and magnetic properties in high Bs Fe-Cu-Si-B alloys. Mater. Res. Bull. 2019, 111, 289–293. [Google Scholar] [CrossRef]
- Wang, C.; Li, J.; Zhang, X.; Wu, J.; He, A.; Dong, Y. Effect of P microalloying on magnetic properties and structure of FeSiBNbCu nanocrystalline alloy. J. Mater. Sci. Mater. Electron. 2021, 32, 4177–4184. [Google Scholar] [CrossRef]
- Butvinová, B.; Švec, P.; Janotová, I.; Fos, A.; Maťko, I.; Janičkovič, D. Magnetic and structural properties of (Fe-Co)83(Sn-P)5B12 alloys with high saturation. J. Magn. Magn. Mater. 2021, 535, 168069. [Google Scholar] [CrossRef]
- Bakhtiyarov, S.I.; Overfelt, R.A. Measurement of liquid metal viscosity by rotational technique. Acta Mater. 1999, 47, 4311–4319. [Google Scholar] [CrossRef]
- Dong, B.S.; Zhou, S.X.; Wang, Y.G.; Li, Y.; Qin, J.Y.; Li, G.Z. Revealing a structural transition in typical Fe-based glass-forming alloy melts. J. Non-Cryst. Solids 2018, 498, 305–308. [Google Scholar] [CrossRef]
- Fu, Y.; Li, H.; Tang, K.; Yang, S.; Shi, Y.; Liu, B.; Luo, Q.; Zhang, L.; Li, Q.; Pan, F. Melt viscosity of light alloys: Progress and challenges. J. Mater. Sci. Technol. 2024, 183, 72–88. [Google Scholar] [CrossRef]
- Mauro, J.C.; Yue, Y.; Ellison, A.J.; Gupta, P.K.; Allan, D.C. Viscosity of glass-forming liquids. Proc. Natl. Acad. Sci. USA 2009, 106, 19780–19784. [Google Scholar] [CrossRef] [PubMed]
- Demmel, F.; Tani, A. Stokes-Einstein relation of the liquid metal rubidium and its relationship to changes in the microscopic dynamics with increasing temperature. Phys. Rev. E 2018, 97, 062124. [Google Scholar] [CrossRef] [PubMed]
- Bai, Y.; Li, J.; Zhang, J.; Dong, B.; Li, X.; Zhao, X.; Cui, Z.; Li, T.; Hu, L. The influence of the cluster connection modes on the soft magnetic properties in the Fe78Si9B13 amorphous ribbon. J. Non-Cryst. Solids 2024, 624, 122705. [Google Scholar] [CrossRef]
- Luo, Q.; Li, D.; Cai, M.; Di, S.; Zhang, Z.; Zeng, Q.; Wang, Q.; Shen, B. Excellent magnetic softness-magnetization synergy and suppressed defect activation in soft magnetic amorphous alloys by magnetic field annealing. J. Mater. Sci. Technol. 2022, 116, 72–82. [Google Scholar] [CrossRef]
- Bian, X.F.; Sun, B.A.; Hu, L.N.; Jia, Y.B. Fragility of superheated melts and glass-forming ability in Al-based alloys. Phys. Lett. A 2005, 335, 61–67. [Google Scholar] [CrossRef]
- Parthiban, R.; Stoica, M.; Kaban, I.; Ravi, K.; Eckert, J. Viscosity and fragility of the supercooled liquids and melts from the Fe–Co–B–Si–Nb and Fe–Mo–P–C–B–Si glass-forming alloy systems. Intermetallics 2015, 66, 48–55. [Google Scholar] [CrossRef]
- Stoica, M.; Ramasamy, P.; Kaban, I.; Scudino, S.; Nicoara, M.; Vaughan, G.B.; Wright, J.; Kumar, R.; Eckert, J. Structure evolution of soft magnetic (Fe36Co36B19.2Si4.8Nb4)100−xCux (x = 0 and 0.5) bulk glassy alloys. Acta Mater. 2015, 95, 335–342. [Google Scholar] [CrossRef]
- Han, M.; Sun, C.; Meng, Y.; Liu, C.; Zhang, W.; Li, H.; Xu, H.; Zhang, T. Effect of miscible and immiscible element microalloying on crystallization behavior and soft magnetic properties of Fe-P-C-B amorphous alloy. J. Non-Cryst. Solids 2023, 611, 122352. [Google Scholar] [CrossRef]
- Dong, B.; Zhou, S.; Qin, J.; Li, Y.; Chen, H.; Wang, Y. The hidden disintegration of cluster heterogeneity in Fe-based glass-forming alloy melt. Prog. Nat. Sci. Mater. Int. 2018, 28, 696–703. [Google Scholar] [CrossRef]
- Zhang, Z.Y.; Wang, Z.H.; Zhu, Y.M.; Yang, R.; Chen, G. Enhanced heterogeneous nucleation in Al alloys by melt ultrasonic treatment. Mater. Today Commun. 2024, 39, 109254. [Google Scholar] [CrossRef]
- Herzer, G. Grain size dependence of coercivity and permeability in nanocrystalline ferromagnets. IEEE Trans. Magn. 1990, 26, 1397–1402. [Google Scholar] [CrossRef]
- Herzer, G. Modern soft magnets: Amorphous and nanocrystalline materials. Acta Mater. 2013, 61, 718–734. [Google Scholar] [CrossRef]
- Meng, Y.; Pang, S.; Chang, C.; Wang, G.; Li, H.; Zhang, T. Magnetic softening of the Fe83Si3B11P2Cu1 amorphous/nanocrystalline alloys with large-size pre-existing α-Fe grains by high heating-rate annealing. J. Mater. Res. Technol. 2022, 20, 161–168. [Google Scholar] [CrossRef]


Disclaimer/Publisher’s Note: The statements, opinions and data contained in all publications are solely those of the individual author(s) and contributor(s) and not of MDPI and/or the editor(s). MDPI and/or the editor(s) disclaim responsibility for any injury to people or property resulting from any ideas, methods, instructions or products referred to in the content. |
© 2025 by the authors. Licensee MDPI, Basel, Switzerland. This article is an open access article distributed under the terms and conditions of the Creative Commons Attribution (CC BY) license (https://creativecommons.org/licenses/by/4.0/).