Article

Thermal Stability Calculation of Typical Phases in Tungsten Cathodes

Key Laboratory of Advanced Functional Materials, School of Material Science and Engineering, Ministry of Education of China, Beijing University of Technology, Beijing 100124, China
*
Author to whom correspondence should be addressed.
Metals 2025, 15(3), 254; https://doi.org/10.3390/met15030254
Submission received: 22 January 2025 / Revised: 15 February 2025 / Accepted: 17 February 2025 / Published: 27 February 2025
(This article belongs to the Section Computation and Simulation on Metals)

Abstract

Thermodynamic calculations were carried out on typical tungsten cathode materials using Factsage software within a temperature range of 1000–3400 °C. The relationship between the phase stability and electron emission performance of the cathode in a vacuum environment and under a protective atmosphere was investigated. The thermodynamic stability of tungsten cathodes doped with different proportions of carbides and oxides was calculated. It was found that when the doped phase (ThO2, La2O3, Y2O3, Lu2O3, Er2O3, Gd2O3, TiO2, ZrO2, HfO2, ThC2, LaC2, YC2, TiC, ZrC, and HfC) in the cathode starts to be consumed, the electron emission performance of the cathode will decline. Therefore, the high-temperature stability of the doped phase carbides and oxides also affects the operating temperature of the cathode. To verify these results, this study tested the electron emission performance of W–La2O3, W–ThO2, W–ZrO2, W–ZrC, and W–HfC, plotting their volt–ampere characteristic curves. The results indicated that the W-La2O3 cathode exhibits the best emission performance at low temperatures, while the W-ThO2, W–ZrO2, W–ZrC, and W–HfC cathodes showed better emission performance at high temperatures. The experimental results are in good agreement with the simulation results. The thermal stability of the doped phase is closely related to the high-temperature thermal stability of the cathode.

1. Introduction

As a kind of electron source, tungsten cathodes have important applications in welding, plasma cutting, vacuum tubes, and magnetrons [1,2,3,4,5,6,7,8,9,10,11]. Thorium tungsten cathodes, a traditional type of cathode, have been used for over one hundred years. However, thorium is a radioactive element, and its usage can pollute the environment and cause cumulative harm to human health [12,13]. Therefore, it is gradually being replaced by rare-earth tungsten cathode materials. Rare-earth tungsten cathode materials have a lower work function and can ignite the arc more easily than thoriated tungsten. They have shown better performance in many industrial applications [14,15,16,17,18,19,20,21]. However, in practical applications, especially in the case of high power and high current density, rare-earth tungsten cathode materials still have many problems. For example, rare-earth tungsten cathodes are prone to being “poisoned” in vacuum tube applications; they exhibit narrow operating temperature window in magnetron devices; and they lack resistance to ion bombardment. Additionally, they demonstrate poor burn resistance in welding and light-source applications [22]. These shortcomings may be attributed to the thermal instability of the rare-earth phase [23,24,25]. There is limited literature available on the thermal stability of the rare-earth phase. Zhou studied the diffusion and migration of rare earth elements to the surface and compared the thermal stability of various rare-earth tungstate salts [26]. Yang investigated the presence of rare-earth phases on cathode surfaces and their resistance to ion bombardment, concluding that the enhanced resistance to ion bombardment was due to the formation of free rare-earth elements [27]. In summary, the thermal stability of a rare-earth tungsten cathode determines its electron emission performance. It is very important to determine the relationship between the thermal stability of cathode materials and their appropriate working conditions. An emission cathode with good thermal stability is capable of operating normally over a broader temperature range. This allows the equipment to maintain favorable performance under diverse ambient temperatures or working conditions, thereby enhancing the equipment’s environmental adaptability and flexibility. For example, in electronic devices operating in extreme environments, such as aerospace and polar scientific research, the high thermal stability of the emission cathode ensures that the equipment can operate reliably under harsh conditions, including low or high temperatures.
In this paper, commercial cathode materials, such as thorium tungsten, lanthanum tungsten, and yttrium tungsten, are studied, as are lutetium tungsten, zirconium tungsten, and hafnium tungsten cathode materials, which have been mentioned in the literature. Additionally, we designed and included erbium tungsten, gadolinium tungsten, and titanium tungsten cathode samples. Utilizing Factsage 8.2 thermodynamic software, we simulated the thermodynamic behavior of different cathode materials under different working conditions and investigated the influence of phase changes on the emission stability of the materials [28,29,30,31]. Subsequently, the electron emission properties of several typical cathode materials were tested, and these results were mutually confirmed through theoretical calculations.

2. Materials and Methods

2.1. Calculation Method

Nine materials, namely W–ThO2, W–La2O3, W–Y2O3, W–Lu2O3, W–Er2O3, W–Gd2O3, W–TiO2, W–ZrO2, and W–HfO2, were subjected to calculations. Among them, La2O3, Y2O3, Lu2O3, Er2O3, and Gd2O3 are rare earth oxide doping phases, while ThO2, TiO2, ZrO2, and HfO2 are common non-rare earth oxide doping phases in cathodes [32,33,34]. The phase changes of these nine types of cathodes were determined through the simulation of the actual working conditions of cathode machining. All calculations were carried out using the Equilib and Reaction modules in FactSage 8.2. The calculation was based on the Gibbs–Duhem equation:
i = 1 I N i d μ i = S d T + V d p
The principle of this calculation is to determine the molar fraction and composition of each phase by solving the condition of equal chemical potential. Here, N i represents the number of moles of the i-th component, μ i denotes the increment in the chemical potential of the component, S stands for entropy, T is the absolute temperature, V represents the volume, and p indicates the pressure. This relationship reveals that in the realm of thermodynamics, intensive properties are not independent entities but rather are interconnected. As such, it serves as a mathematical expression of the state postulate.
When pressure and temperature are considered as variables, only I-1 out of the I components possesses independent chemical potential values. From this, the Gibbs phase rule can be deduced. The calculation results presented in this study are founded upon this very principle.
In conventional cathode materials, rare earth oxides such as Y2O3 and La2O3 are commonly incorporated to enhance the cathode’s emission capacity. Dong’s research fabricated a novel cathode by substituting La2O3–doped tungsten powder with LaC2 [25]. It was discovered that LaC2 also exerted a remarkable influence on the cathode’s emission performance. Consequently, in this paper, thermodynamic calculations of cathodes doped with rare-earth carbides and rare-earth oxides have been conducted. Additionally, the phase changes and stabilities of cathodes at various temperatures have been investigated.

2.2. Thermal Stability of Different Cathodes in Different Environments

Currently, the widely accepted emission mechanism is the atomic mode mechanism. Specifically, a film of rare–earth atoms is formed on the surface of the tungsten metal, which significantly reduces the cathode work function. The rare–earth atoms in this film must originate from rare–earth carbides and rare-earth oxides. Consequently, it can be inferred that both the carbides and oxides play a crucial and indispensable role in the emission performance of the cathode.
Subsequently, calculations and analyses were conducted for three scenarios, which are doping only carbides, doping only oxides, and doping both phases simultaneously, under both atmospheric and vacuum environments. The mass percentage of the doped phase was maintained at 2%, and the vacuum level was set at 10−5 Pa. In FactSage 8.2 (Developed by GTT-Technologies, Herzogenrath, Germany), the Equilib module was used for the calculations. The databases utilized were FTmisc and FactPS. The temperature range was set between 1000 °C and 3400 °C.

2.3. Experimental Verification

Several representative cathode materials were carefully selected to assess their electron emission properties. Subsequently, the volt–ampere characteristic curves were plotted, and the underlying emission mechanisms were analyzed. To validate the function of carbides in the cathode materials of magnetrons, HfC–W and ZrC–W cathodes were fabricated via spark plasma sintering (SPS). The choice of this method can enhance experimental efficiency and shorten the sintering time. Meanwhile, the pulsed current is capable of heating the material uniformly, thus avoiding the temperature gradient issues commonly encountered in traditional sintering methods and ensuring the uniform densification of the material [35,36]. The HfC and ZrC powders used in the experiment were provided by Beijing MRD Technology Co., Ltd., China, and the W powder was produced by Jinlu Hard Alloy Co., Ltd. in Jiujiang, Jiangxi, China. The discharge plasma sintering furnace used in this experiment is model SPS-211H, manufactured by Fuji Electric Co., Ltd. In Tokyo, Japan. The sintering parameters were set as follows: a temperature of 1600 °C, a pressure of 60 MPa, and a holding time of one minute. The content of carbides was maintained at 3%. After sintering, the samples were cut into Φ2 × 0.5 mm slices. Their surfaces were then polished to a clean state, and the emission performance was measured under a vacuum of 10−5 Pa. Figure 1 shows a schematic diagram of SPS sintering and a sample diagram.
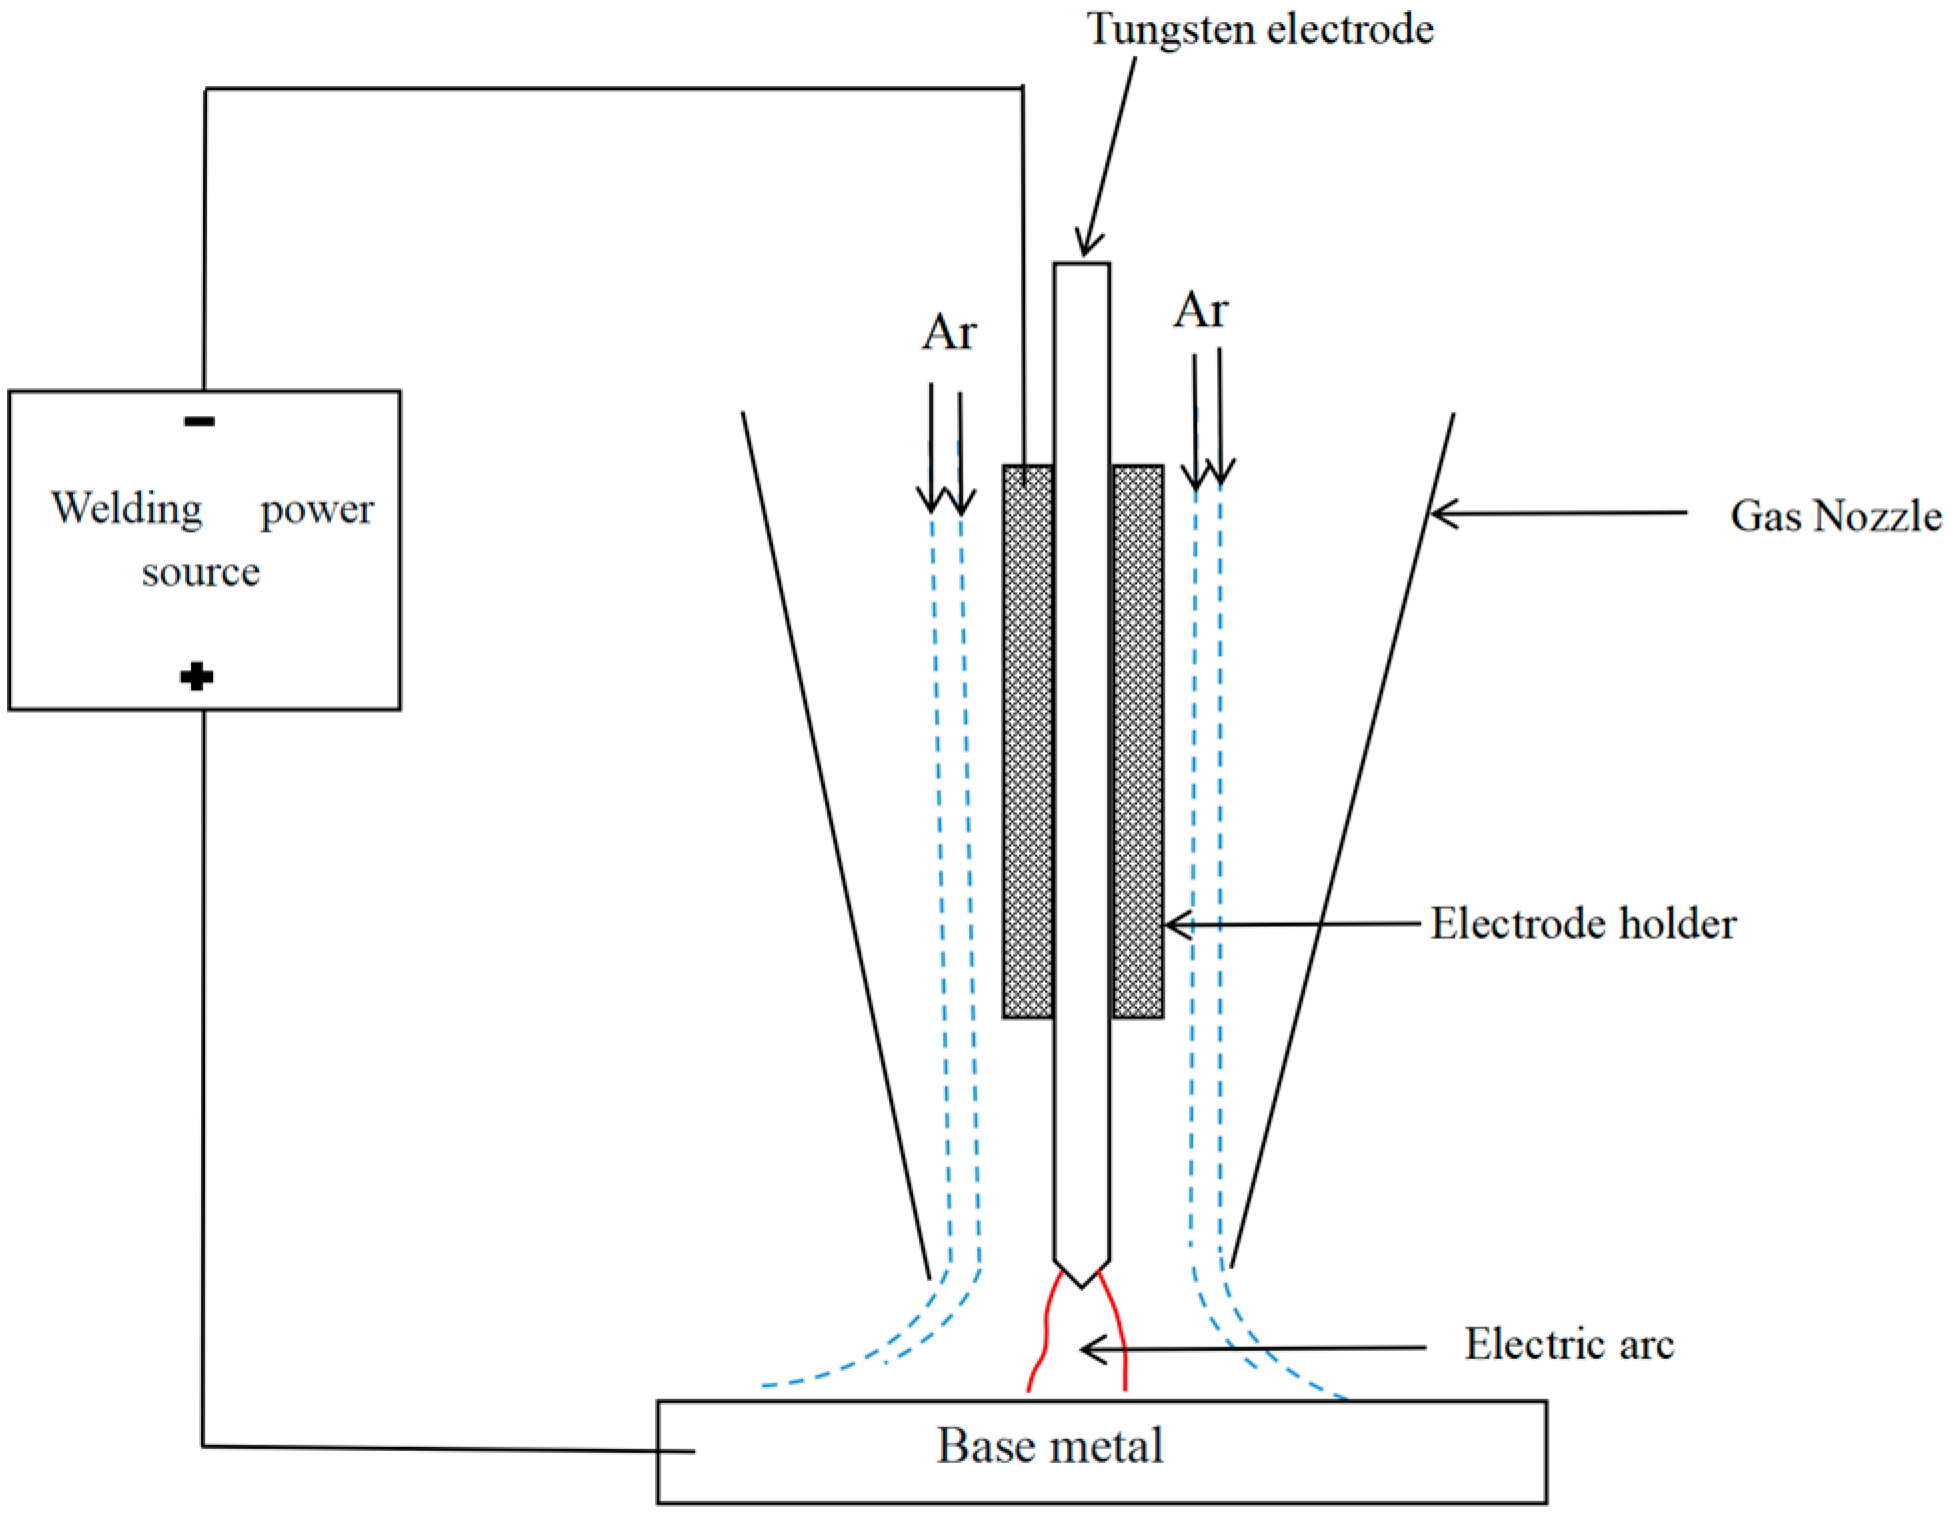
TIG welding experiments were conducted on three types of cathodes, namely W–La2O3, W–ThO2, and W–ZrO2. The aim was to analyze their thermal stability at different temperatures. Considering that it is difficult to directly and accurately measure the surface temperature of the cathodes during the welding process, in this experiment, the magnitude of the current was used to indirectly represent the temperature range. Specifically, the arc voltage was measured at currents of 20 A, 150 A, and 250 A. Among them, 20 A represents a low-temperature environment, 150 A represents a medium-temperature environment, and 250 A represents a high-temperature environment. By collecting and analyzing of arc voltage data under different currents, the thermal stability of the three cathode materials at the corresponding “equivalent temperatures” was inferred. The high-temperature emission stability of the TIG welding electrode was confirmed through the plotting of the arc’s volt–ampere characteristic curve. The electrodes used in the experiment were manufactured by Beijing North Tungsten Technology Co., Ltd., Beijing, China. The proportion of rare-earth oxides in the electrode was 2%. The size of the electrodes is Φ0.3 × 15 cm. Figure 2 shows a schematic diagram of the TIG welding principle.

3. Results and Discussion

3.1. Thermodynamic Analysis Under a Protective Atmosphere

In the TIG welding process, the negative terminal of the welding power supply is consistently connected to a non-consumable tungsten rod, which serves as the cathode. Under a welding current of 200 A, the temperature at the cathode tip reaches approximately 3000 °C [37]. When the doped phase of the cathode consisted solely of oxides, the phase changes under different temperatures and environments were calculated. The mass percentage of doped phase was set at 2%. Table 1 presents the phase changes of nine types of cathodes in an atmospheric environment.
According to Table 1, ThO2, ZrO2, and HfO2 exhibit relatively high melting points, but Y2O3, Lu2O3, Er2O3, Gd2O3, TiO2 and La2O3 have low melting points. They all underwent a transition from a solid state to a liquid state. When the doped phase changes from the solid state to the liquid state, it becomes more likely to diffuse outwards and undergo evaporation. This process reduces the rare-earth content within the cathode, thereby weakening the cathode’s resistance to burning loss. Consequently, when the operating temperature of the cathode exceeds the transition temperature, its electron emission capacity begins to decline. Thus, W–ZrO2 and W–HfO2 cathodes are likely to exhibit enhanced thermal stability under high-temperature conditions.
When the doped phase of the cathode was carbide, the phase changes of different cathode materials were calculated, as shown in Table 2.
Based on the analysis presented in Table 1, it can be observed that the lower the melting point of the oxide, the more readily it diffuses. This diffusion mechanism results in the relatively rapid consumption of doped phase at high temperatures, thereby reducing electron emission capacity. The distinction between Table 2 and Table 1 lies in the fact that ThC2, LaC2, and YC2 do not transform into the liquid state directly. Instead, at lower temperatures, they are reduced to liquid rare-earth elements by W.
ThC2 + 4W = Th + 2W2C
LaC2 + W = 4La + 2W2C
YC2 + 4W = Y + 2W2C
For cathodes of W–Th, W–La, and W–Y, carbides are more prone to consumption compared to oxides, which leads to their unstable presence at high temperatures. From this perspective, W–ThC2, W–LaC2, and W–YC2 cathodes start to consume Th, La and Y elements at lower temperatures. For example, the temperature at which La2O3 undergoes a phase transition from the solid state to the liquid state is 2400 °C, whereas the temperature required for the reduction of LaC2 to liquid La is merely 1600 °C. This results in the poor emission performance of the carbide cathode at high temperatures.
In contrast, TiC, ZrC, and HfC cannot be reduced at high temperatures. Thus, these carbides may exhibit favorable thermal stability under high-temperature conditions.
Subsequently, carbides and oxides were doped at a specific mass ratio to calculate their phase changes across different temperatures. The total mass fraction of the doped phases remained at 2%. Table 3 presents the phase changes that occur when carbides and oxides are doped in varying proportions.
As indicated by Table 3, when carbides and oxides co-exist, the carbides are initially reduced to elements by W, forming W2C. Subsequently, this W2C further reduces the oxides to elements. Notably, the proportion in which they are present does not affect the reduction temperature. Moreover, the temperature at which W2C reduces oxides is lower than that at which W reduces oxides. However, for W-Ti and W–Zr cathodes, since ZrC and TiC are not reduced by W, the following reaction occurs directly:
2TiC + TiO2 = 3Ti + 2CO
2ZrC + ZrO2 = 3Zr + 2CO
Therefore, for W–Th, W–La and W–Y cathodes, adding an appropriate amount of carbides to the oxides can cause the rare-earth elements to be consumed at a lower temperature, thereby reducing the operating temperature of the cathodes. For W–Hf cathode, HfC and HfO2 will not be reduced to rare-earth elements before 3400 °C.
In conclusion, when oxides and carbides exist independently, for W–Th, W–La, and W–Y systems, the oxides exhibit greater stability compared to the carbides. Specifically, ThC2, LaC2, and YC2 are more readily reduced by W. When both carbides and oxides are present simultaneously, the oxides are reduced to rare-earth elements by the carbides.

3.2. Thermodynamic Analysis Under Vacuum Conditions

In the magnetron, the cathode is the core. The electron emission characteristics of the cathode have a decisive influence on the performance of vacuum electronic devices. Thus, the selection of cathode materials is of great importance. At present, numerous studies have been conducted on novel cathodes such as La2O3–W, LaC2–W and Y2O3–W. It has been documented that W–Y2O3 electrodes have been proposed as alternatives to thoriated tungsten. This is because these non-radioactive electrodes have excellent durability and higher electron emissivity than traditional W–ThO2 [38,39,40]. The stability of the doped phases in the cathode may have a crucial impact on the cathode’s performance.
Considering that the vacuum level in the majority of vacuum electronic devices is in the order of 10−5 Pa, the phase alterations of diverse materials were calculated under this exact vacuum condition. Table 4 depicts the phase changes occurring in the oxide cathode at a vacuum degree of 10−5 Pa.
Based on the analysis of Table 4, within a temperature range up to 2000 °C, La2O3, Y2O3, TiO2, Gd2O3, Lu2O3, and Er2O3 will be reduced to their respective free elements by W.
La2O3 + 3W = 2La + 3WO
Y2O3 + 3W = 2Y + 3WO
TiO2 + 2W = Ti + 2WO
Gd2O3 + 3W = 2Gd + 3WO
Lu2O3 + 3W = 2Lu + 3WO
Er2O3 + 3W = 2Er + 3WO
In contrast, ThO2, ZrO2, and HfO2 exhibit higher reduction temperatures, and no elemental formation occurs below 2000 °C. The generation of rare–earth elements is more favorable for the formation of an atomic film on the cathode surface, which in turn reduces the work function of the tungsten matrix. Consequently, at the temperature at which rare-earth elements are produced, the cathode’s emission current reaches its maximum value. As the temperature rises, the rare-earth phase is continuously consumed, leading to a gradual decline in the emission current. This phenomenon may explain why the W–La2O3 cathode exhibits a large emission current at low temperatures, while the W–ThO2 cathode exhibits a large emission current at high temperatures.
However, the magnetron cathodes typically generate rare-earth carbides via the carbonization process. Therefore, the role of carbides should not be overlooked. Table 5 presents the phase change variations of the carbide cathodes at a vacuum level of 10−5 Pa.
As is evident from Table 5, carbides are more readily reduced than oxides. With the exception of HfC, the other five materials are reduced to their elemental forms by W at temperatures up to 2000 °C.
ThC2 +4W = Th + 2W2C
LaC2 + 2W = La + 2WC
YC2 + 2W = Y+2WC
TiC + 2W = Ti + W2C
ZrC + 2W = Zr + W2C
The formation temperature of W2C is 1324 °C, and the reduction temperature of LaC2 and YC2 is 1100 °C. Consequently, the product of Equations (14) and (15) is WC. It can be inferred from this that when the operating temperature of the cathode exceeds the temperature at which the carbide is reduced, the consumption of rare-earth elements begins, thereby reducing the emission performance of the cathode. Therefore, cathodes doped with ThC2, TiC, ZrC, and HfC exhibit a relatively high operating temperature, whereas those doped with LaC2 and YC2 display a relatively low operating temperature.
During the actual operation of the cathode, the doped phase may consist of a mixture of both carbides and oxides. Table 6 presents the phase changes that occur when carbide and oxide are doped in different proportions at a vacuum level of 10−5 Pa.
When carbides are incorporated into oxide cathodes, the carbides tend to reduce the oxides to elements. This reduction process promotes the formation of an atomic film on the cathode surface at lower temperatures.
ThC2 + ThO2 = 2Th + 2CO
3LaC2 + 2La2O3 = 5La + 6CO
3YC2 + 2Y2O3 = 5Y + 6CO
2TiC + TiO2 = 3Ti + 2CO
2ZrC + ZrO2 = 3Zr + 2CO
2HfC + HfO2 = 3Hf + 2CO
The proportion of co-existing carbides and oxides does not change the reduction temperature. Importantly, the temperature at which carbides reduce oxides is lower than that at which W reduces oxides. Consequently, for W–La and W–Y cathodes, the introduction of carbides enables the generation of elements at a lower temperature. This effectively decreases the operating temperature of the cathode. However, simultaneously, the high-temperature thermal stability of the cathode deteriorates.
As can be inferred from Table 6, when the carbide-to-oxide ratio is 1:2, the doped phase exhibits the broadest range in W–La and W–Y cathodes. In contrast, for other ratios, the range of the doped phase is narrow. W–Th and W–Zr, however, behave differently; the doping ratio of carbide and oxide does not affect the existence range of the doped phase. This discrepancy might explain the fact that the emission of W–La is less stable than that of W–Th. Consequently, W–Zr could potentially be a cathode material with relatively stable emission characteristics.
It can further be deduced that for W–La and W–Y cathodes, the incorporation of carbides facilitates the production of rare-earth elements and the formation of atomic films on the surface. As a result, these cathodes exhibit superior emission performance at lower temperatures. Nevertheless, the rapid depletion of the rare-earth elements at high temperatures leads to a decline in their emission performance. In contrast, for W–Th, W–Zr, and W–Hf cathodes, both carbides and oxides are not readily reduced. Consequently, they are less prone to consumption at high temperatures, enabling these cathodes to demonstrate better emission performance under such conditions.

3.3. Testing the Emission Stability of Several Materials

3.3.1. Testing in a Protective Atmosphere

To validate the thermal stability of the TIG welding cathode, the arc voltages of the W–ThO2, W–La2O3, and W-ZrO2 cathodes were measured at different currents of 20 A, 150 A, and 250 A. After arc initiation, the arc region can be partitioned into the cathode region, anode region, and arc column region, each with its corresponding voltage drop. These voltage drops are denoted as the cathode voltage drop, Uk; the anode voltage drop, UA; and the arc column voltage drop, Uc. The arc voltage is the sum of these three voltage drops, expressed as Ua = Uk + UA + Uc. Under identical operating current and arc length test conditions, the voltage drop in the arc column, Uc, remains a constant value and does not vary with changes in other parameters. Similarly, under the same experimental conditions, for an arc formed with the same electrode material, the value of the anode voltage drop, UA, is fixed. When the emission capacity of hot electrons is robust, the proportion of electrons within the current is relatively high, while the proportion of cations is low. Consequently, the cathode voltage drop, Uk, is also small [41]. Under the given experimental conditions, the voltage drops in the arc column and at the anode remain constant. As a result, the arc voltage UA is solely dependent on the cathode voltage drop. Consequently, the arc voltage UA serves as an indicator of the characteristics of the cathode material. In the experiment, the working voltage measured by a multimeter represents the cumulative effect of the anode voltage drop, cathode voltage drop, and arc column voltage drop. During testing in simulation conditions, a water-cooled copper block is employed as the anode, and the distance between the cathode tip and the anode is minimized and kept constant. Consequently, only the impact of the cathode voltage drop on the arc voltage needs to be taken into account. Therefore, the electron emission capability of the cathode can be characterized by measuring the arc voltage. During the experiment, the starting current was set at 90 A, the crater filling current was set at 90 A, and the argon gas flow rate was set at 8 L/min. The YC–300WX(Manufactured by Tangshan Matsushita Industrial Machinery Co., Ltd., Tangshan, China) welding machine was configured in the DC TIG welding mode. The arc voltage was measured every 5 minutes using a multimeter. The results are shown in Figure 3.
At low currents, the arc voltages of the three cathode materials are highly stable. Among them, the arc voltage of W–La2O3 is the lowest, suggesting the strongest electron emission capability. The arc voltage of W–ZrO2 shows an upward trend, indicating that its arc is the most stable. The long-term stable attachment of the arc at a certain position leads to ablation in this area, resulting in a decline in the cathode’s emission capacity. Ultimately, this explains the increase in the cathode’s operating voltage. As the current increases, the arc voltages of the three cathodes all start to decline. Among them, the arc voltage of W–La2O3 drops the fastest, which implies that La2O3 has undergone a transformation from the solid to the liquid phase. This transformation enables the diffusion of rare-earth elements towards the cathode tip, thus enhancing the electron emission ability. Under high current conditions, before 70 min, the arc voltage of W–La2O3 remains the lowest. However, after 60 min, the arc voltage of W–La2O3 begins to rise. After 70 min, the arc voltages of W–ThO2 and W–ZrO2 are both lower than that of W–La2O3 and maintain a downward trend. This indicates that La2O3 has started to be consumed, causing the electron emission performance of the W–La2O3 cathode to deteriorate. In contrast, ThO2 and ZrO2 possess good thermal stability at high temperatures and are not easily consumed. Therefore, the operating temperatures of the W–ThO2 and W–ZrO2 cathodes are significantly higher than the of the W–La2O3 cathode.
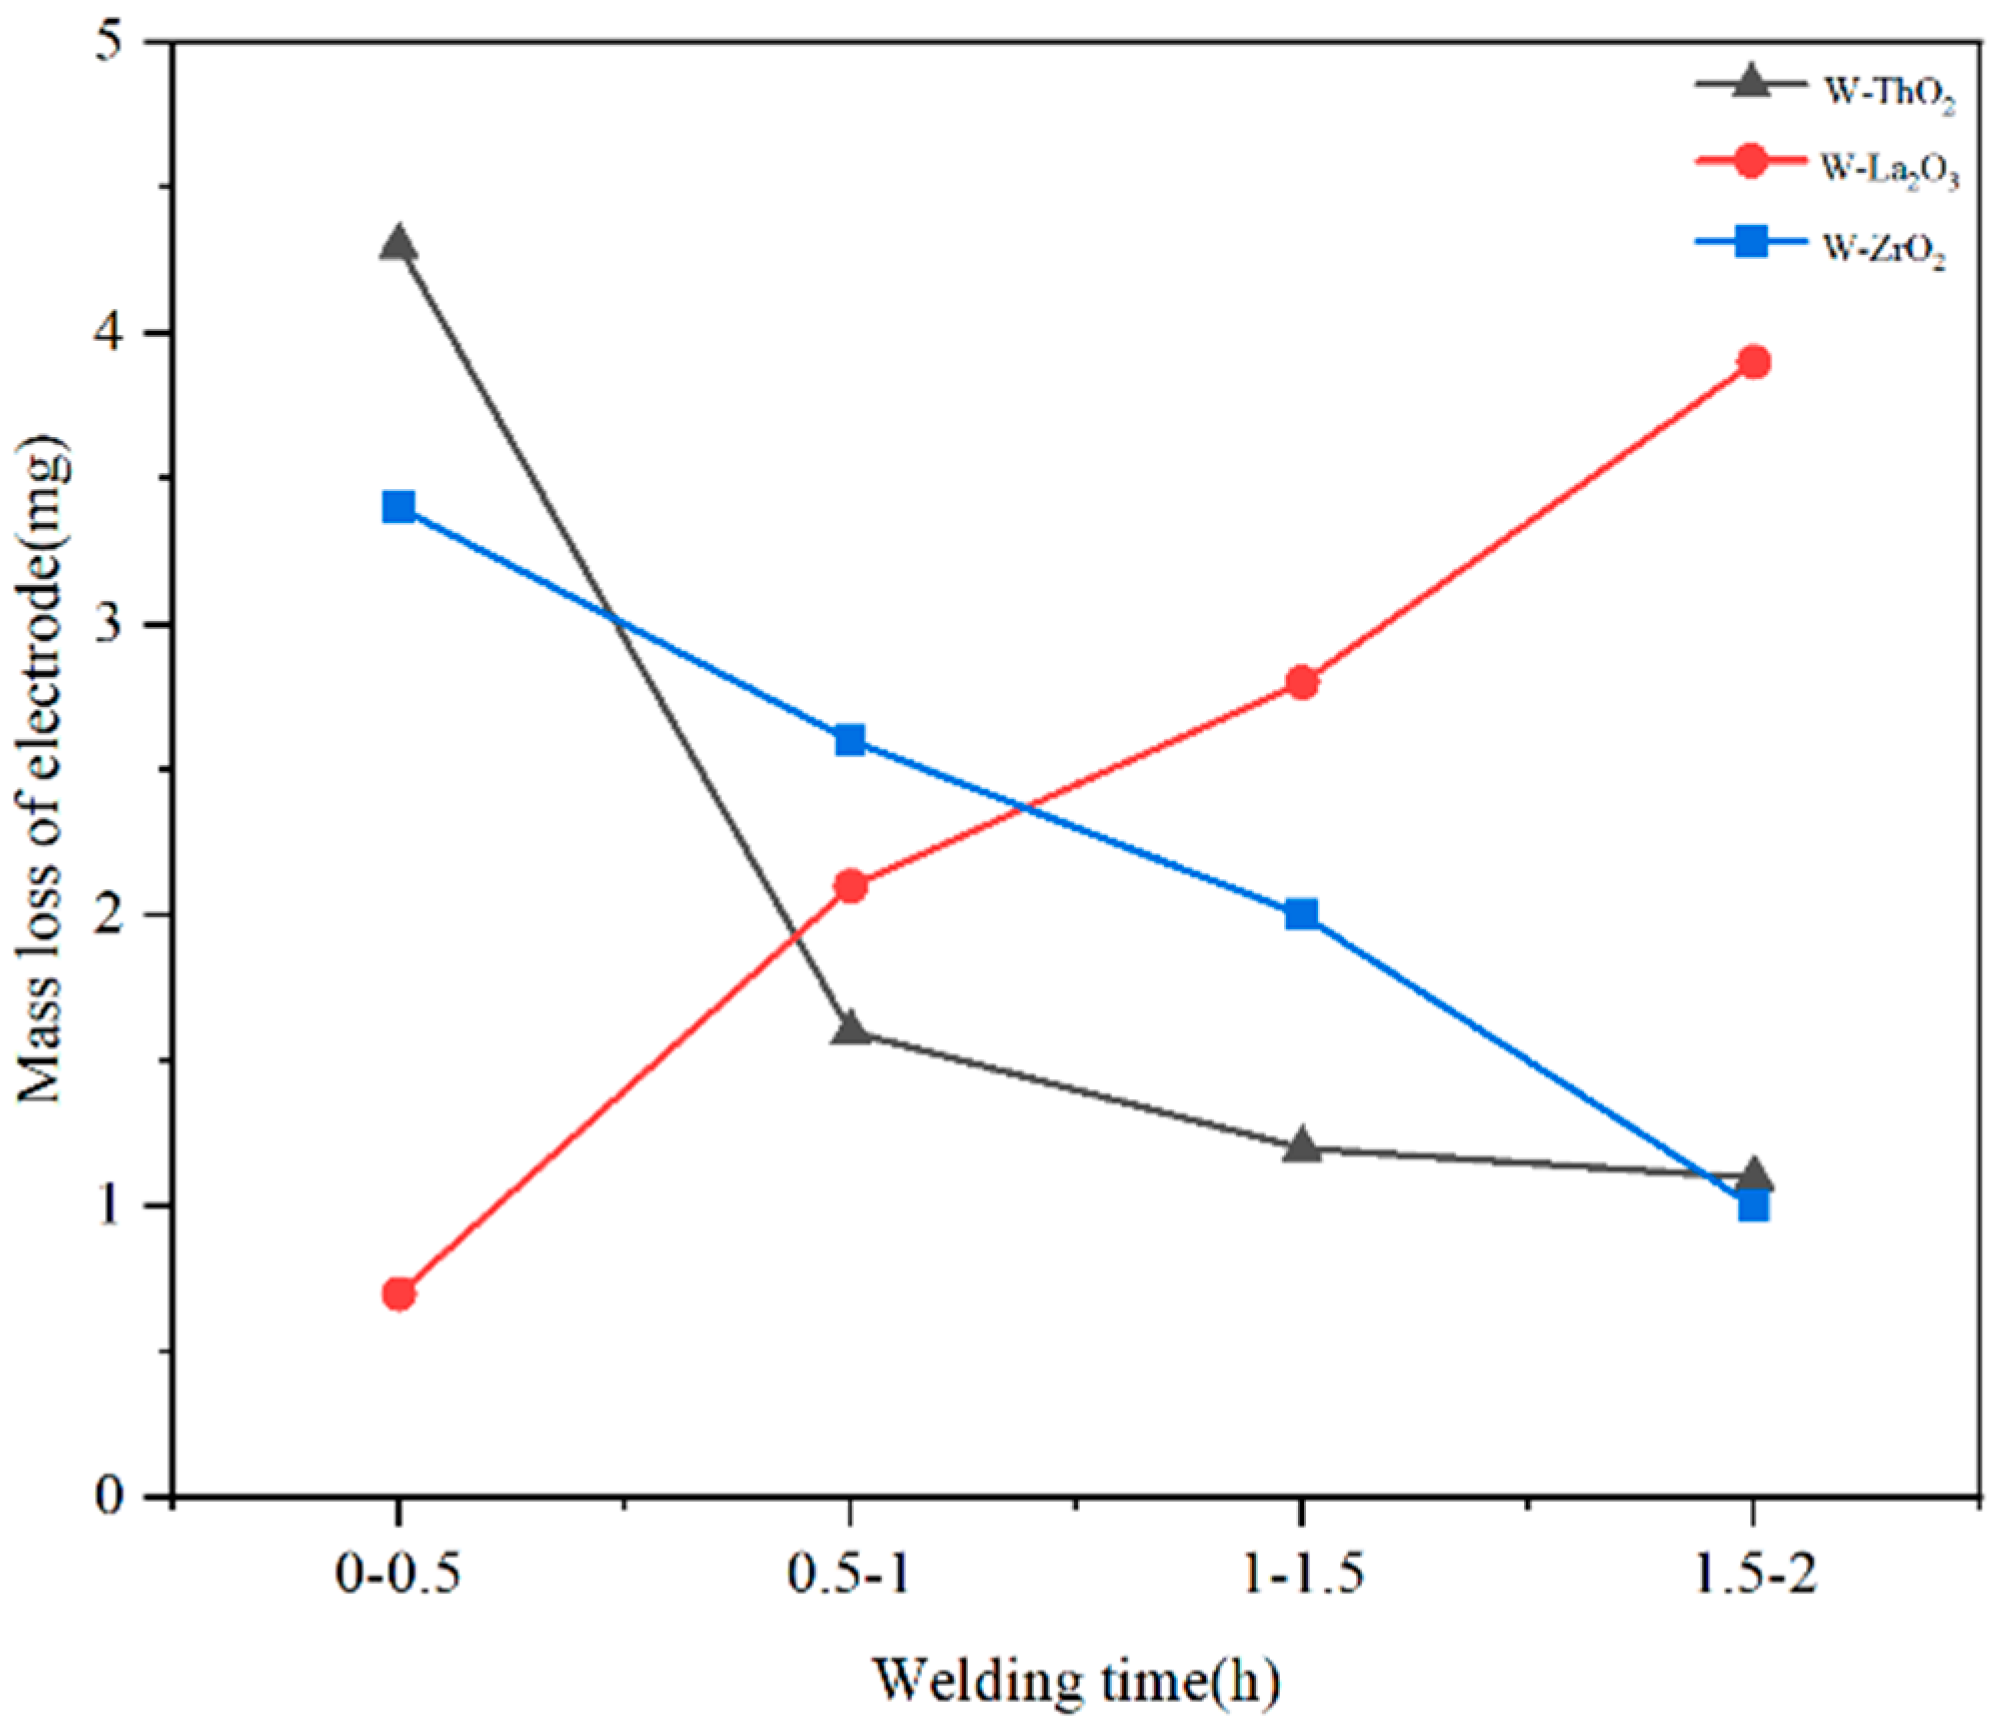
To further confirm the accuracy of the experimental results, the mass loss of the cathodes during the welding process was measured again, this time at a current of 250 A. Under this welding current, the temperature of the cathode surface can reach above 3000 °C [42]. The welding duration was set to 2 h. Every half hour, each cathode’s mass was measured using an electronic balance, and the mass difference compared to the previous measurement was calculated. Each sample was tested three times, and the final average value was taken. The specific results are presented in Figure 4.
According to current research, the principle of cathode ablation is that the evaporation of tip oxides cannot be replenished in a timely manner. After depletion, the tungsten matrix takes over the electron emission. Since the electron work function of tungsten is relatively higher compared to rare-earth substances, the operating temperature rises, leading to the melting and evaporation of the tip, thus causing electrode ablation.
During the first 0.5 h, the W–La2O3 cathode had the least amount of ablation, indicating that the oxides inside the cathode diffused towards the tip, resulting in an abundant supply of tip oxides and a low work function. In contrast, the relatively large ablation amounts of W–ThO2 and W–ZrO2 suggested that the diffusion of internal oxides in these two cathodes was slower. After 0.5 h, the ablation amount of the W–La2O3 cathode gradually increased, suggesting that the tip oxides began to be consumed and the work function gradually increased. After 1.5 h, the ablation amount of the W–La2O3 cathode had exceeded those of the W–ThO2 and W–ZrO2 cathodes, while the ablation amounts of the W–ThO2 and W–ZrO2 cathodes still showed a downward trend. This indicates that under high current operating conditions, namely at high temperatures, the stability of La2O3 is lower than that of ThO2 and ZrO2, making it more prone to consumption. Consequently, the W–La2O3 cathode cannot operate continuously at high temperatures for an extended period. Although the initial ablation amounts of the W–ThO2 and W–ZrO2 cathodes were large, as time elapsed, their ablation amounts gradually decreased. Since ThO2 and ZrO2 are not easily consumed, these two cathodes are more suitable for working at high temperatures. This is consistent with the theoretical calculation results presented in Table 1.

3.3.2. Testing in a Vacuum Environment

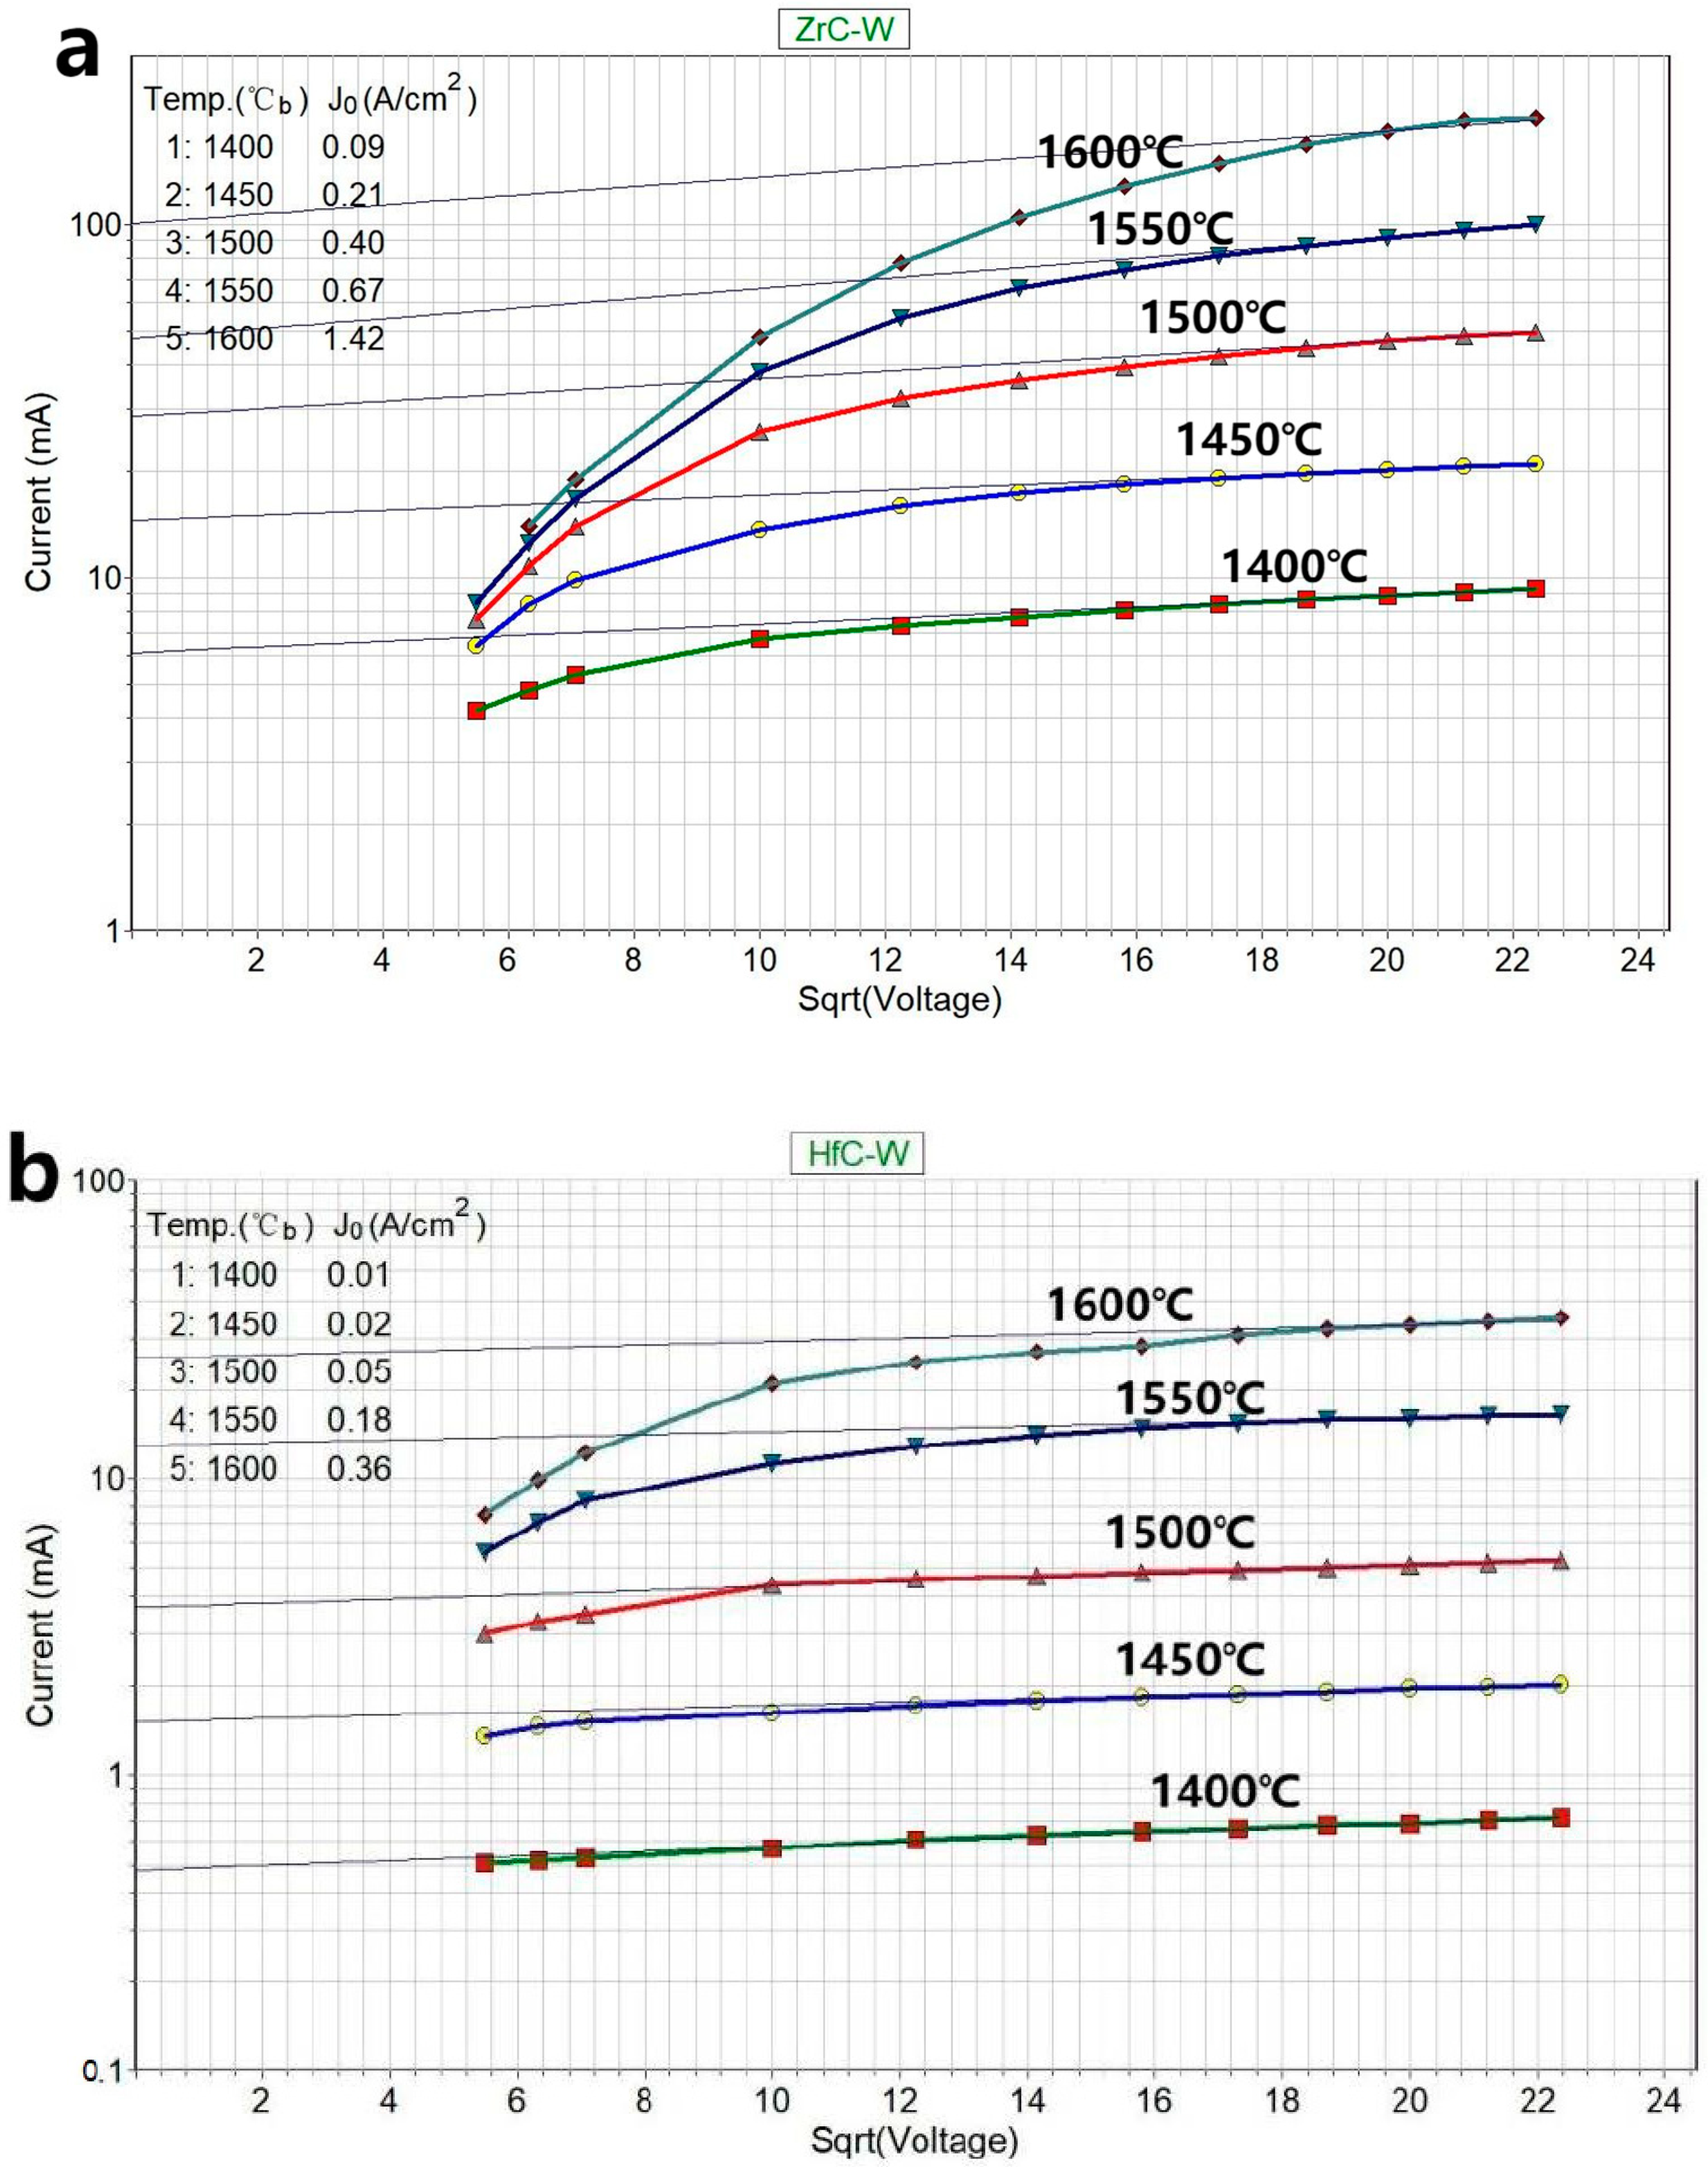
HfC and ZrC were separately doped into tungsten to prepare samples. Subsequently, the emission current of these samples was measured at a pressure of 10−5 Pa. Each sample was shaped into a circular sheet with a diameter of Φ2 mm and a thickness of 0.5 mm. The thermionic emission properties were examined under various temperatures and voltages, and the results are presented in Figure 5.
As is evident from Table 5, the reduction temperature of ZrC is 1900 °C, while that of HfC exceeds 2000 °C. Evidently, both substances exhibit relatively high stability. Consequently, these two cathodes are expected to demonstrate excellent emission performance at elevated temperatures. Figure 5 depicts that the emission currents of both cathodes rise in tandem with the increase in temperature, and the emission remains stable at high temperatures. This finding is in accordance with the calculated results.

4. Conclusions

This paper explores the thermodynamic stability of several cathode materials doped with rare-earth oxides and rare-earth carbides under a protective atmosphere and in a vacuum environment. In a vacuum environment, for cathode materials such as those of magnetrons, carbides may be formed after carbonization during the production process. Thus, carbides are also a crucial phase influencing the thermal stability of the materials. The calculation results from Table 4 to Table 6, together with the experimental results in Figure 5, consistently demonstrate that once the operating temperature of the cathode rises and exceeds the transition temperature threshold of the doped phase, the doped phase that was originally in a solid state will undergo a phase transition and rapidly transform into a gaseous state. These doped phases existing in a gaseous state will continuously volatilize and disperse into the surrounding air, thereby causing a gradual depletion of the doped elements within the cathode. At this point, the electron emission ability of the cathode begins to deteriorate. For cathode materials containing both carbides and oxides, such as W–La and W–Y, the carbides can reduce the oxides to gaseous rare-earth elements at low temperatures. Consequently, the amount of rare-earth elements in the cathode decreases, which impairs its emission performance at high temperatures. However, for cathode materials such as W–Th and W–Zr, both their carbides and oxides are difficult to reduce. Hence, the presence of carbides does not affect their emission performance at high temperatures. Consequently, the more stable the carbide doped phase of the material is, the better its high-temperature thermal stability will be.
In a protective atmosphere, for cathode materials such as those used in TIG welding, the stability of the arc voltage under a high current is also of great significance. When the doped phase changes from the solid state to the liquid state, rare-earth elements can diffuse more easily to the tip, reducing the work function of the cathode and enhancing the electron emission ability. However, when the melting point of the doped phase is too low, the rare-earth phase that turns into a liquid state will evaporate more easily into the air, thus leading to the consumption of rare-earth elements in the cathode. As the doped phase is reduced, or turns into a liquid or gas and evaporates into the air, the amount of the doped phase within the cathode gradually decreases; thus, the work function of the cathode increases. Therefore, W–TiC, W–ZrC, W–HfC, W–ZrO2, and W–HfO2 are likely cathode materials with good thermal stability at high temperatures. This conclusion requires more experiments to verify the accuracy of the simulation results. For instance, in a protective atmosphere, the welding duration could be extended to monitor the variations in electrode burnout. In a vacuum environment, the working temperature can be further elevated to examine the alterations in the emission performance of the cathode.

Author Contributions

Conceptualization, J.Y. and Z.N.; methodology, J.W.; software, J.W.; validation, J.W.; formal analysis, J.Y. and P.Z.; investigation, J.Y. and P.Z.; resources, J.Y. and Z.N.; data curation, J.W.; writing—original draft preparation, J.W.; writing—review and editing, J.Y.; visualization, J.W.; supervision, J.Y. and P.Z.; project administration, J.Y.; funding acquisition, J.Y. All authors have read and agreed to the published version of the manuscript.

Funding

This research was funded by the National Key Research and Development Program of China, grant number [No. 2023YFB3811800], and the APC was funded by the National Key Research and Development Program of China.

Data Availability Statement

The original contributions presented in the study are included in the article. Further inquiries can be directed to the corresponding author.

Conflicts of Interest

The authors declare no conflicts of interest.

References

  1. Kirkwood, D.M.; Gross, S.J.; Balk, T.J.; Beck, M.J.; Booske, J.; Busbaher, D.; Jacobs, R.; Kordesch, M.E.; Mitsdarffer, B.; Morgan, D.; et al. Frontiers in Thermionic Cathode Research. IEEE Trans. Electron Devices 2018, 65, 2061–2071. [Google Scholar] [CrossRef]
  2. Liu, X.; Vancil, B.K.; Durham, D.B.; Ogletree, D.F.; Barnard, E.S.; Balk, T.J. Observation of Ultrathin Sc-Containing Surface Layer on Life-Tested Scandate Cathodes. IEEE Trans. Electron Devices 2023, 70, 2876–2882. [Google Scholar] [CrossRef]
  3. Nemchinsky, V. Erosion of thermionic cathodes in welding and plasma arc cutting systems. IEEE Trans. Plasma Sci. 2013, 42, 199–215. [Google Scholar] [CrossRef]
  4. Ives, R.L.; Falce, L.R.; Miram, G.; Collins, G. Controlled-Porosity Cathodes for High-Current-Density Applications. IEEE Trans. Plasma Sci. 2010, 38, 1345–1353. [Google Scholar] [CrossRef]
  5. Swartzentruber, P.D. Microstructure and Work Function of Dispenser Cathode Coatings: Effects on Thermionic Emission. Ph.D. Thesis, University of Kentucky, Lexington, KY, USA, 2014. [Google Scholar]
  6. Liu, X.; Zhou, Q.; Maxwell, T.L.; Vancil, B.K.; Beck, M.J.; Balk, T.J. Scandate cathode surface characterization: Emission testing, elemental analysis and morphological evaluation. Mater. Charact. 2019, 148, 188–200. [Google Scholar] [CrossRef]
  7. Liu, X. Characterization of Nanostructure, Materials, and Electron Emission Performance of Next-Generation Thermionic Scandate Cathodes. Ph.D. Thesis, University of Kentucky, Lexington, KY, USA, 2019. [Google Scholar]
  8. Liu, X.; Vancil, B.K.; Beck, M.J.; Balk, T.J. Near-Surface Material Phases and Microstructure of Scandate Cathodes. Materials 2019, 12, 636. [Google Scholar] [CrossRef]
  9. Zhou, Q.; Liu, X.; Maxwell, T.; Vancil, B.; Balk, T.J.; Beck, M.J. BaxScyOz on W (0 0 1), (1 1 0), and (1 1 2) in scandate cathodes: Connecting to experiment via μO and equilibrium crystal shape. Appl. Surf. Sci. 2018, 458, 827–838. [Google Scholar] [CrossRef]
  10. Sun, J.; Yang, Y.; Dong, L.; Liu, Z.; Liu, P.; Cai, Y.; Liu, H.; Wang, J. Vacuum evaporation synthesizing Sc film layer and elucidation of near-surface Ba-O-Sc electronic configuration for dispenser cathode. Appl. Surf. Sci. 2024, 679, 161241. [Google Scholar] [CrossRef]
  11. Li, N.; Zhang, K.; Feng, J. Effect of Sr-Doping on the Emission-Active Materials of Scandate Cathodes. IEEE Trans. Electron Devices 2023, 70, 5883–5889. [Google Scholar] [CrossRef]
  12. Paschen, P. Alternatives to thorium additions to tungsten-based materials. JOM 1996, 48, 45–47. [Google Scholar] [CrossRef]
  13. Gäfvert, T.; Pagels, J.; Holm, E. Thorium exposure during tungsten inert gas welding with thoriated tungsten electrodes. Radiat. Prot. Dosim. 2003, 103, 349–357. [Google Scholar] [CrossRef] [PubMed]
  14. Gao, J.-Y.; Yang, Y.-F.; Zhang, X.-K.; Li, S.-L.; Hu, P.; Wang, J.-S. A review on recent progress of thermionic cathode. Tungsten 2020, 2, 289–300. [Google Scholar] [CrossRef]
  15. Cheng, Y.; Sun, Y.; Zhou, Y.; Wang, S.; Meng, J.; Cao, N.; Shi, W. Study on Morphology and Chemical States of Surface Active Layer of Th-W Cathode. Materials 2022, 15, 2726. [Google Scholar] [CrossRef] [PubMed]
  16. Liu, Z.; Yang, Y.; Sun, J.; Liu, H.; Li, Z.; Wang, J. Cathodes in magnetrons: A. review. MetalMat 2024, 1, e14. [Google Scholar] [CrossRef]
  17. Liu, Z.; Fang, Y.; Chen, S.; Zhang, T.; Lv, Z.; Luo, Z. Focusing cathode tip characteristics in cooling tungsten. Energy 2019, 167, 982–993. [Google Scholar] [CrossRef]
  18. Liu, Z.; Yang, J.C.; Cao, J.; Li, Y. Development and application of tungsten electrode materials. Mater. Sci. Forum 2015, 817, 348–354. [Google Scholar] [CrossRef]
  19. Wang, G.; Li, Y.; Zhou, C.; Wei, Y.; Kong, C.; Zheng, X.; Zhang, X.; Yang, Z.; Zheng, J.; Cong, Y.; et al. Endurance-test and theoretical prediction of a rare earth nanocathode for the applied field magnetoplasmadynamic thruster. Plasma Sci. Technol. 2023, 25, 104005. [Google Scholar] [CrossRef]
  20. Zhou, S.; Liang, S.; Guo, Y.; Yang, J.; Nie, Z. Study on microstructure and migration mechanism of LaW cathode. Mater. Charact. 2023, 195, 112547. [Google Scholar] [CrossRef]
  21. Cheng, Y.; Sun, Y.; Zhou, Y.; Wang, S.; Meng, J. Electron emission mechanism of scandium-tungsten cathodes. Int. J. Refract. Met. Hard Mater. 2022, 105, 105828. [Google Scholar] [CrossRef]
  22. Wang, X.; D’avella, S.; Liang, Z.; Zhang, B.; Wu, J.; Zscherpel, U.; Tripicchio, P.; Yu, X. On the effect of the attention mechanism for automatic welding defects detection based on deep learning. Expert Syst. Appl. 2025, 268, 126386. [Google Scholar] [CrossRef]
  23. Kottke, N.G.; Tajmar, M.; Hey, F.G. Hollow cathode testing of Y2O3, La2O3-doped tungsten and LaB6 emitters with krypton and iodine. Vacuum 2024, 220, 112812. [Google Scholar] [CrossRef]
  24. Gadzhiev, M.K.; Sargsyan, M.A.; Tereshonok, D.V.; Tyuftyaev, A.S. Investigation of the argon arc binding to the lanthanated tungsten cathode. Europhys. Lett. 2015, 111, 25001. [Google Scholar] [CrossRef]
  25. Dong, L.; Wang, J.; Liu, W.; Li, C.; Zhang, J.; Yang, Y.; Zhou, F. Fabrication and thermionic emission properties of lanthanum carbide doped tungsten cathodes. Mater. Lett. 2015, 146, 47–50. [Google Scholar] [CrossRef]
  26. Zhou, S.; Zhang, Y.; Liang, S.; Yang, J.; Nie, Z. Effect of ZrH2 Doping on Electron Emission Performance of Rare Earth Tungsten Electrode. Coatings 2023, 13, 666. [Google Scholar] [CrossRef]
  27. Yang, J.; Nie, Z.; Wang, Y. Microstructure and emission ability of rare earth oxides doped molybdenum cathodes. Appl. Surf. Sci. 2003, 215, 87–95. [Google Scholar] [CrossRef]
  28. Luo, L.; Shi, J.; Lin, J.; Zan, X.; Zhu, X.; Xu, Q.; Wu, Y. Microstructure and performance of rare earth element-strengthened plasma-facing tungsten material. Sci. Rep. 2016, 6, 32701. [Google Scholar] [CrossRef] [PubMed]
  29. Petriceanu, M.; Ioniță, F.G.; Piticescu, R.R.; Nicoară, A.I.; Matei, A.C.; Ioța, M.A.; Tudor, I.A.; Caramarin, Ș.; Ciobota, C.F. Effect of Doping ZrO2 on Structural and Thermal Properties. Inorganics 2024, 12, 290. [Google Scholar] [CrossRef]
  30. Wang, Y.; Xie, Z.; Wang, M.; Deng, H.; Yang, J.; Jiang, Y.; Zhang, T.; Wang, X.; Fang, Q.; Liu, C. The superior thermal stability and tensile properties of hot rolled W-HfC alloys. Int. J. Refract. Met. Hard Mater. 2019, 81, 42–48. [Google Scholar] [CrossRef]
  31. Gheribi, A.; Audet, C.; Le Digabel, S.; Bélisle, E.; Bale, C.; Pelton, A. Calculating optimal conditions for alloy and process design using thermodynamic and property databases, the FactSage software and the Mesh Adaptive Direct Search algorithm. Calphad 2012, 36, 135–143. [Google Scholar] [CrossRef]
  32. Yuan, J.; Dai, J.-Q.; Zhao, M.-W.; Zhong, Y.-Y.; Deng, D.-W. First-principles study on thermodynamic stability and electronic structures of the ferroelectric binary HfO2 and ZrO2 (001) polar surfaces. Surf. Interfaces 2025, 56, 105523. [Google Scholar] [CrossRef]
  33. Mokhena, T.C.; John, M.J.; Mochane, M.J.; Mtibe, A. Zirconia-based nanocomposites. In Handbook of Polymer and Ceramic Nanotechnology; Springer International Publishing: Cham, Switzerland, 2021; pp. 1505–1525. [Google Scholar]
  34. Li, M.; Zhao, N.; Wang, C.; Zou, Y.; Chen, X.; Mei, Y. Improving thermal stability and electrochemical performance of polymer solid electrolyte membranes with a novel TiO2@ PA-APP composite additive. Colloids Surf. A Physicochem. Eng. Asp. 2025, 705, 135640. [Google Scholar] [CrossRef]
  35. Cavaliere, P.; Sadeghi, B.; Shabani, A. Spark plasma sintering: Process fundamentals. In Spark Plasma Sintering of Materials: Advances in Processing and Applications; Springer: Cham, Switzerland, 2019; pp. 3–20. [Google Scholar]
  36. Saheb, N.; Iqbal, Z.; Khalil, A.; Hakeem, A.S.; Al Aqeeli, N.; Laoui, T.; Al-Qutub, A.; Kirchner, R. Spark plasma sintering of metals and metal matrix nanocomposites: A review. J. Nanomater. 2012, 2012, 983470. [Google Scholar] [CrossRef]
  37. Veleva, L.; Schaeublin, R.; Battabyal, M.; Plociski, T.; Baluc, N. Investigation of microstructure and mechanical properties of W–Y and W–Y2O3 materials fabricated by powder metallurgy method. Int. J. Refract. Met. Hard Mater. 2015, 50, 210–216. [Google Scholar] [CrossRef]
  38. Ushio, M. Arc discharge and electrode phenomena. Pure Appl. Chem. 1988, 60, 809–814. [Google Scholar] [CrossRef]
  39. Sadek, A.A.; Ushio, M.; Matsuda, F. Effect of rare earth metal oxide additions to tungsten electrodes. Metall. Trans. A 1990, 21, 3221–3236. [Google Scholar] [CrossRef]
  40. Ushio, M.; Sadek, A.A.; Matsuda, F. Comparison of temperature and work functionmeasurements obtained with different GTAelectrodes. Plasma Chem. Plasmaprocess. 1991, 11, 81–101. [Google Scholar] [CrossRef]
  41. Xie, Z.M.; Liu, R.; Zhang, T.; Fang, Q.F.; Liu, C.S.; Liu, X.; Luo, G.N. Achieving high strength/ductility in bulk W-Zr-Y2O3 alloy plate with hybrid microstructure. Mater. Des. 2016, 107, 144–152. [Google Scholar] [CrossRef]
  42. Haidar, J. A theoretical model for gas metal arc welding and gas tungsten arc welding. I. J. Appl. Phys. 1998, 84, 3518–3529. [Google Scholar] [CrossRef]
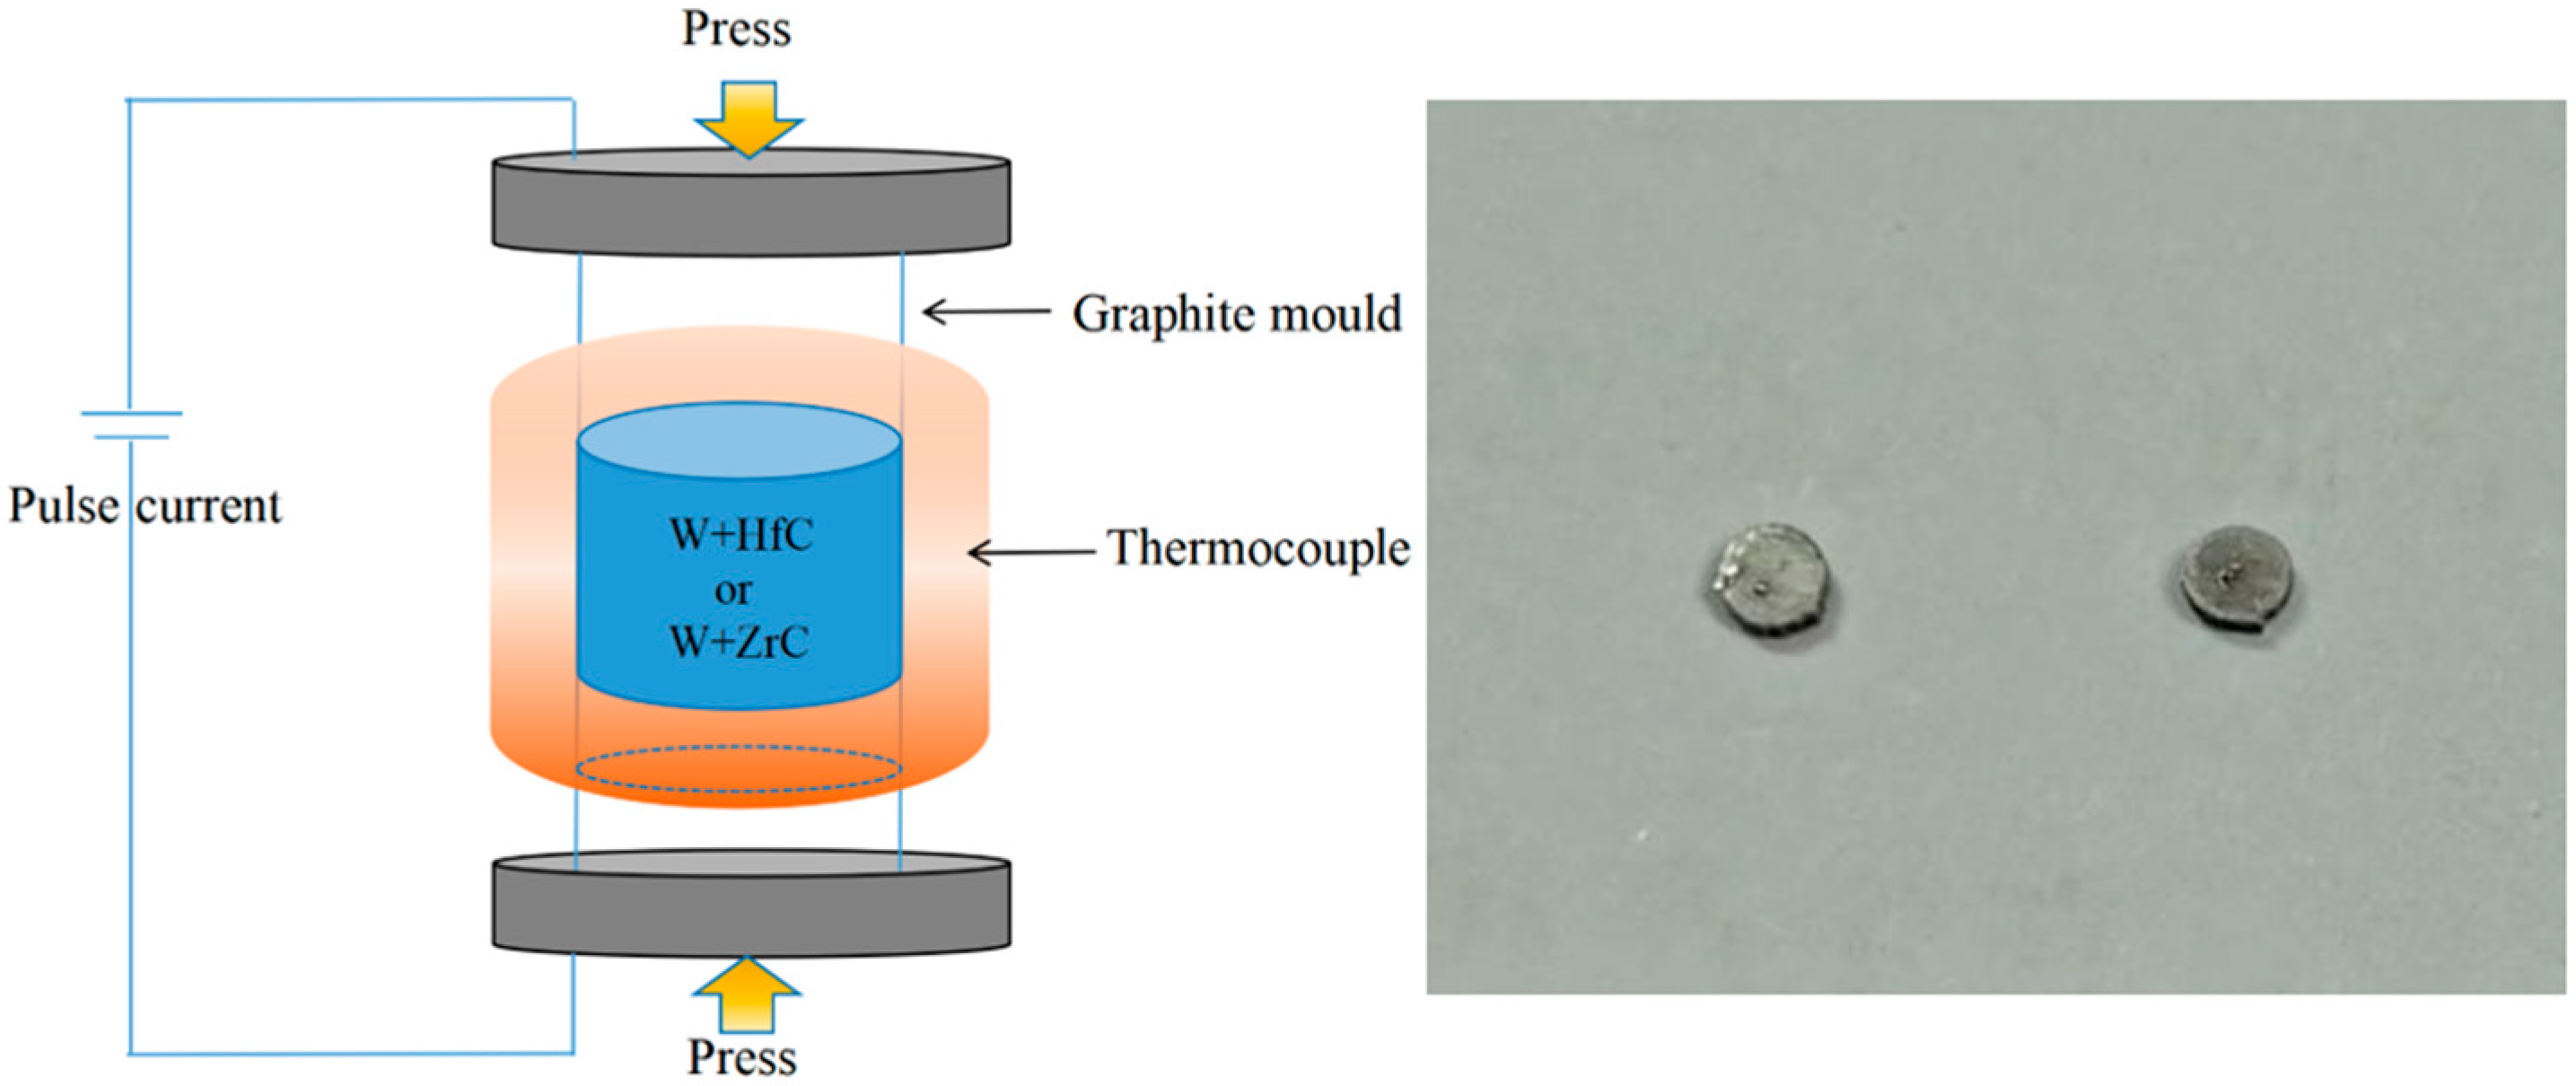
Figure 1. Schematic diagram of SPS sintering principle and sample diagram.
Metals 15 00254 g001
Figure 2. Schematic diagram of TIG welding principle.
Metals 15 00254 g002
Figure 3. The volt–ampere characteristic arc when the (a) current is 20 A; (b) current is 150 A; and (c) current is 250 A.
Metals 15 00254 g003
Figure 4. Comparison of mass loss of TIG welded samples.
Metals 15 00254 g004
Figure 5. Thermionic emission performance of the cathodes at different temperatures under 10−5 Pa: (a) ZrC–W and (b) HfC–W.
Metals 15 00254 g005
Table 1. Phase changes of oxide cathodes in a protective atmosphere.
T/°C1200
~
1400
1400~
1600
1600~
1800
1800~
2000
2000~
2200
2200~
2400
2400~
2600
2600~
2800
2800~
3000
3000~
3200
3200~
3400
3400
+
Materials
Th-WThO2(s)ThO2(l)
La-WLa2O3(s)La2O3(l)
Y-WY2O3(s)Y2O3(l)
Ti-WTiO2(s)TiO2(l)
Zr-WZrO2(s)ZrO2(l)
Hf-WHfO2(s)HfO2(l)
Gd-WGd2O3(s)Gd2O3(l)
Lu-WLu2O3(s)Lu2O3(l)
Er-WEr2O3(s)Er2O3(l)
ColorDescription
solid oxide
liquid oxide
Table 2. Phase changes of carbide cathodes in a protective atmosphere.
T/°C1200
~
1400
1400
~
1600
1600~
1800
1800~
2000
2000~
2200
2200~
2400
2400~
2600
2600~
2800
2800~
3000
3000~
3200
3200~
3400
3400
+
Materials
Th-WThC2(s)Th(l)
La-WLaC2(s)La(l)
Y-WYC2(s)Y(l)
Ti-WTiC(s)
Zr-WZrC(s)
Hf-WHfC(s)
ColorDescription
solid carbide
liquid element
Table 3. Phase changes when carbides and oxides with different mass ratios are added to the cathodes in a protective atmosphere.
T/°C1200
~
1400
1400
~
1600
1600
~
1800
1800
~
2000
2000
~
2200
2200
~
2400
2400
~
2600
2600
~
2800
2800
~
3000
3000
~
3200
3200
~
3400
3400
+
Carbide
:
Oxide
Materials
Th-WThC2(s) ThO2(s)ThO2(s) Th(l)Th(l)(a) 1:1
La-WLaC2(s) La2O3(s)La2O3(s) La(l)La(l) La2O3(l)La(l)La(g)
Y-WY2O3(s) YC2(s)Y2O3(s) Y(l)Y2O3(l) Y(l)Y(g)
Ti-WTiC(s) TiO2(s)TiC(s) TiO2(l)Ti(l) TiO2(l)Ti(l)Ti(g)
Zr-WZrO2(s) ZrC(s)ZrC(s) ZrO2(l)Zr(l) ZrO2(l)
Hf-WHfC(s) HfO2(s)HfC(s) HfO2(l)
Th-WThC2(s) ThO2(s)ThO2(s) Th(l)Th(l)(b) 1:2
La-WLaC2(s) La2O3(s)La2O3(s) La(l)La(l) La2O3(l)La(l) La(g)
Y-WY2O3(s) YC2(s)Y2O3(s) Y(l)Y2O3(l) Y(l)Y(l) Y(g)
Ti-WTiC(s) TiO2(s)TiC(s) TiO2(l)Ti(l) TiO2(l)TiO2(l) Ti(g)Ti(g)
Zr-WZrO2(s) ZrC(s)ZrC(s) ZrO2(l)Zr(l) ZrO2(l)
Hf-WHfC(s) HfO2(s)HfC(s) HfO2(l)
Th-WThC2(s) ThO2(s)ThO2(s) Th(l)Th(l)(c) 2:1
La-WLaC2(s) La2O3(s)La2O3(s) La(l)La(l) La2O3(l)La(l)La(g)
Y-WY2O3(s) YC2(s)Y2O3(s) Y(l)Y2O3(l) Y(l)Y(g)
Ti-WTiC(s) TiO2(s)TiC(s) TiO2(l)Ti(l) TiC(s)Ti(g) TiC(s)
Zr-WZrO2(s) ZrC(s)ZrC(s) ZrO2(l)Zr(l) ZrC(s)
Hf-WHfC(s) HfO2(s)HfC(s) HfO2(l)
ColorDescription
solid +solid
liquid + solid
liquid + liquid
gaseous + liquid
geseous
liquid
gaseous + solid
Table 4. Phase changes of oxide cathodes at 10−5 Pa.
T/°C1000
~
1100
1100
~
1200
1200
~
1300
1300
~
1400
1400
~
1500
1500
~
1600
1600
~
1700
1700
~
1800
1800
~
1900
1900
~
2000
2000
+
Materials
Th-WThO2(s)ThO2(g)
La-WLa2O3(s)La(g)
Y-WY2O3(s)Y(g)
Ti-WTiO2(s)TiO2(g)Ti(g)
Zr-WZrO2(s)ZrO2(g)
Hf-WHfO2(s)
Gd-WGd2O3(s)Gd(g)
Lu-WLu2O3(s)Lu(g)
Er-WEr2O3(s)Er(g)
ColorDescription
solid oxide
gaseous element
gaseous oxide
Table 5. Phase changes of carbide cathodes at 10−5 Pa.
T/°C1000
~
1100
1100
~
1200
1200
~
1300
1300
~
1400
1400
~
1500
1500
~
1600
1600
~
1700
1700
~
1800
1800
~
1900
1900
~
2000
2000
+
Materials
Th-WThC2(s)Th(g)
La-WLaC2(s)La(g)
Y-WYC2(s)Y(g)
Ti-WTiC(s)Ti(g)
Zr-WZrC(s)Zr(g)
Hf-WHfC(s)
ColorDescription
solid carbide
gaseous element
Table 6. Phase changes when carbides and oxides with different mass ratios are added to the cathodes at 10−5 Pa.
T/°C1000
~
1100
1100
~
1200
1200
~
1300
1300
~
1400
1400
~
1500
1500
~
1600
1600
~
1700
1700
~
1800
1800
~
1900
1900
~
2000
2000
+
Carbide
:
Oxide
Materials
Th-WThC2(s) ThO2(s)ThC2(s)Th(s)ThC2(s)Th(g)Th(g)(a) 1:1
La-WLaC2(s)La2O3(s)La(g)
Y-WY2O3(s) YC2(s)Y(g)
Ti-WTiC(s)TiO2(s)TiO2(s) Ti(g)Ti(g)
Zr-WZrC(s) ZrO2(s)ZrO2(s)Zr(s)ZrO2(s)Zr(g)Zr(g)
Hf-WHfC(s) HfO2(s)Hf(g) HfO2(s)
Th-WThC2(s) ThO2(s)ThO2(s)Th(s)ThO2(s)Th(g)Th(g)(b) 1:2
La-WLaC2(s)La2O3(s)La(g) La2O3(s)La(g)
Y-WY2O3(s) YC2(s)Y(g) Y2O3(s)Y(g)
Ti-WTiC(s)TiO2(s)TiO2(s) Ti(g)Ti(g)
Zr-WZrC(s) ZrO2(s)ZrO2(s)Zr(s)ZrO2(s)Zr(g)Zr(g)
Hf-WHfC(s) HfO2(s)Hf(g) HfO2(s)
Th-WThC2(s) ThO2(s)ThC2(s)Th(s)ThC2(s) Th(g)Th(g)(c) 1:3
La-WLaC2(s)La2O3(s)La(g)
Y-WY2O3(s) YC2(s)Y(g)
Ti-WTiC(s)TiO2(s)TiC(s) Ti(g)Ti(g)
Zr-WZrC(s) ZrO2(s)ZrC(s)Zr(s)ZrC(s)Zr(g)Zr(g)
Hf-WHfC(s) HfO2(s)HfC(s) Hf(g)Hf(g)
ColorDescription
solid +solid
solid+solid element
solid+gaseous element
gaseous element
Disclaimer/Publisher’s Note: The statements, opinions and data contained in all publications are solely those of the individual author(s) and contributor(s) and not of MDPI and/or the editor(s). MDPI and/or the editor(s) disclaim responsibility for any injury to people or property resulting from any ideas, methods, instructions or products referred to in the content.