Article

A Study of the Creep-Fatigue Damage Mechanism of a P92 Welded Joint Using Nanoindentation Characterization

1
Wenzhou Special Equipment Inspection & Science Research Institute, Wenzhou 325800, China
2
Hangzhou Steam Turbine Power Group Co., Ltd., Hangzhou 310012, China
3
Institute of Process Equipment and Control Engineering, College of Mechanical Engineering, Zhejiang University of Technology, Hangzhou 310014, China
4
Institute of Innovation Research of Shengzhou and Zhejiang University of Technology, Shengzhou 312400, China
*
Author to whom correspondence should be addressed.
Metals 2025, 15(1), 53; https://doi.org/10.3390/met15010053
Submission received: 8 November 2024 / Revised: 20 December 2024 / Accepted: 26 December 2024 / Published: 9 January 2025

Abstract

:
In fossil fuel and nuclear power plants, welded joints continuously experience creep-fatigue loading, which can result in premature cracking during the in-service term. To study the creep-fatigue interactive (CFI) behavior, the CFI test of P92 steel was performed with different strain rates at 823 K. Results indicate that the short cycle life is measured with the increasing strain rate. Relying on the scanning electron microscope, the fracture mechanism of P92 steel gradually changes from fatigue-dominating to creep-fatigue interactive damage with the increasing strain rate. The hardness (H), elastic modulus (E) and creep deformation were then measured by nanoindentation, and the strain rate sensitivity (m) was estimated. The relation between the degenerated mechanical properties and microstructural evaluations, i.e., enhanced grain size and nucleation of creep voids, was established, and the damage mechanism was discussed.

1. Introduction

Welding technology is widely used in the manufacture of key components in modern fossil fuel and nuclear power plants [1,2]. The non-uniformity of the microstructure and local mechanical properties of welded joints can lead to high-temperature instability of the welding structure. In addition, technical components used in power plants tend to operate at higher pressures and temperatures to improve energy conversion efficiency [3]. During long-term service, welded joints often endure creep and creep-fatigue interaction at high temperatures; premature failures are highly likely to occur at the welded joints [4,5,6,7].
In recent decades, many studies have focused on the deformation behavior and fracture mechanism of creep-fatigue damage in heat-resistant steels, including the effects of loading amplitude, dwell time, dwell position and oxide layer. P92 steel is widely used in the manufacture of elevated-temperature components of power plants. Veerababu et al. [8] found that the creep-fatigue cyclic life of P92 steel shows a clear decrease due to the introduction of the dwell period. Liu et al. [9] conducted stress-controlled creep-fatigue tests with a dwell time from 36 s to 1200 s on P92 steel, also showing a decrease in cyclic life as dwell time increased. Goswami et al. [10] investigated that the microstructure and discontinuities within the material or structures (welded joint) were responsible for the different behavior of tensile or compressive dwell period on creep-fatigue life. In addition, P92 steel showed strain rate sensitivity, i.e., premature failure, and the more detrimental effect occurred during the creep-fatigue test with high strain rates. The strain rates during the loading period are reported to strongly affect the creep strain accumulation, especially for the primary creep strain during the dwell period [11,12,13,14]. However, the effect of strain rate on the creep-fatigue behavior of inhomogeneous microstructures like welded joints has not been investigated well.
As for alloys, the evolution of local microstructures, i.e., creep voids, slip bands and crack initiation and propagation during creep-fatigue loading, was recently studied [15,16,17,18,19], and the relation between creep-fatigue mechanical behavior and microstructures was established [20,21] so that many life prediction methods were therefore proposed. However, the macroscopic mechanical behavior cannot represent the local mechanical properties of those non-uniform structures, such as welded joints. There is still a lack of a mechanical performance testing method to characterize the degree of high-temperature creep-fatigue damage. Nanoindentation is a high-precision method for studying the local mechanical properties and deformation mechanisms of alloys, thin films, and ceramics. In recent years, extensive research has been conducted on the relationship between the degradation of local mechanical properties (nanoindentation hardness and creep resistance) and microstructural evolution (grain size and dislocation density) during creep-fatigue testing [22]. For example, Zhang et al. proposed a creep-fatigue damage characterization method using nanoindentation hardness to study the local mechanical behavior of welded joints under creep-fatigue loading [23]. Sun et al. developed an engineering application for assessing the level of creep-fatigue damage by obtaining load-displacement curves using nanoindentation at the critical positions of service components [24]. These characterization methods do not take into account the different local mechanical properties of each microregion of the welded joint, resulting in unsatisfactory characterization results. The potential application of nanoindentation needs to be further developed in the creep-fatigue damage characterization.
This study investigated the fracture mechanism of P92 steel welded joints under creep-fatigue interaction at high temperatures. The strain-controlled creep-fatigue tests were carried out on three samples at different strain rates at 923 K. To determine the local mechanical properties of different microregions of the welded joint; nanoindentation was used to measure the hardness and elastic modulus from the fracture edge to the centerline of the weld. The relation between the degenerated mechanical properties and microstructural evaluations, i.e., enhanced grain size and nucleation of creep voids, was established, and the damage mechanism was discussed.

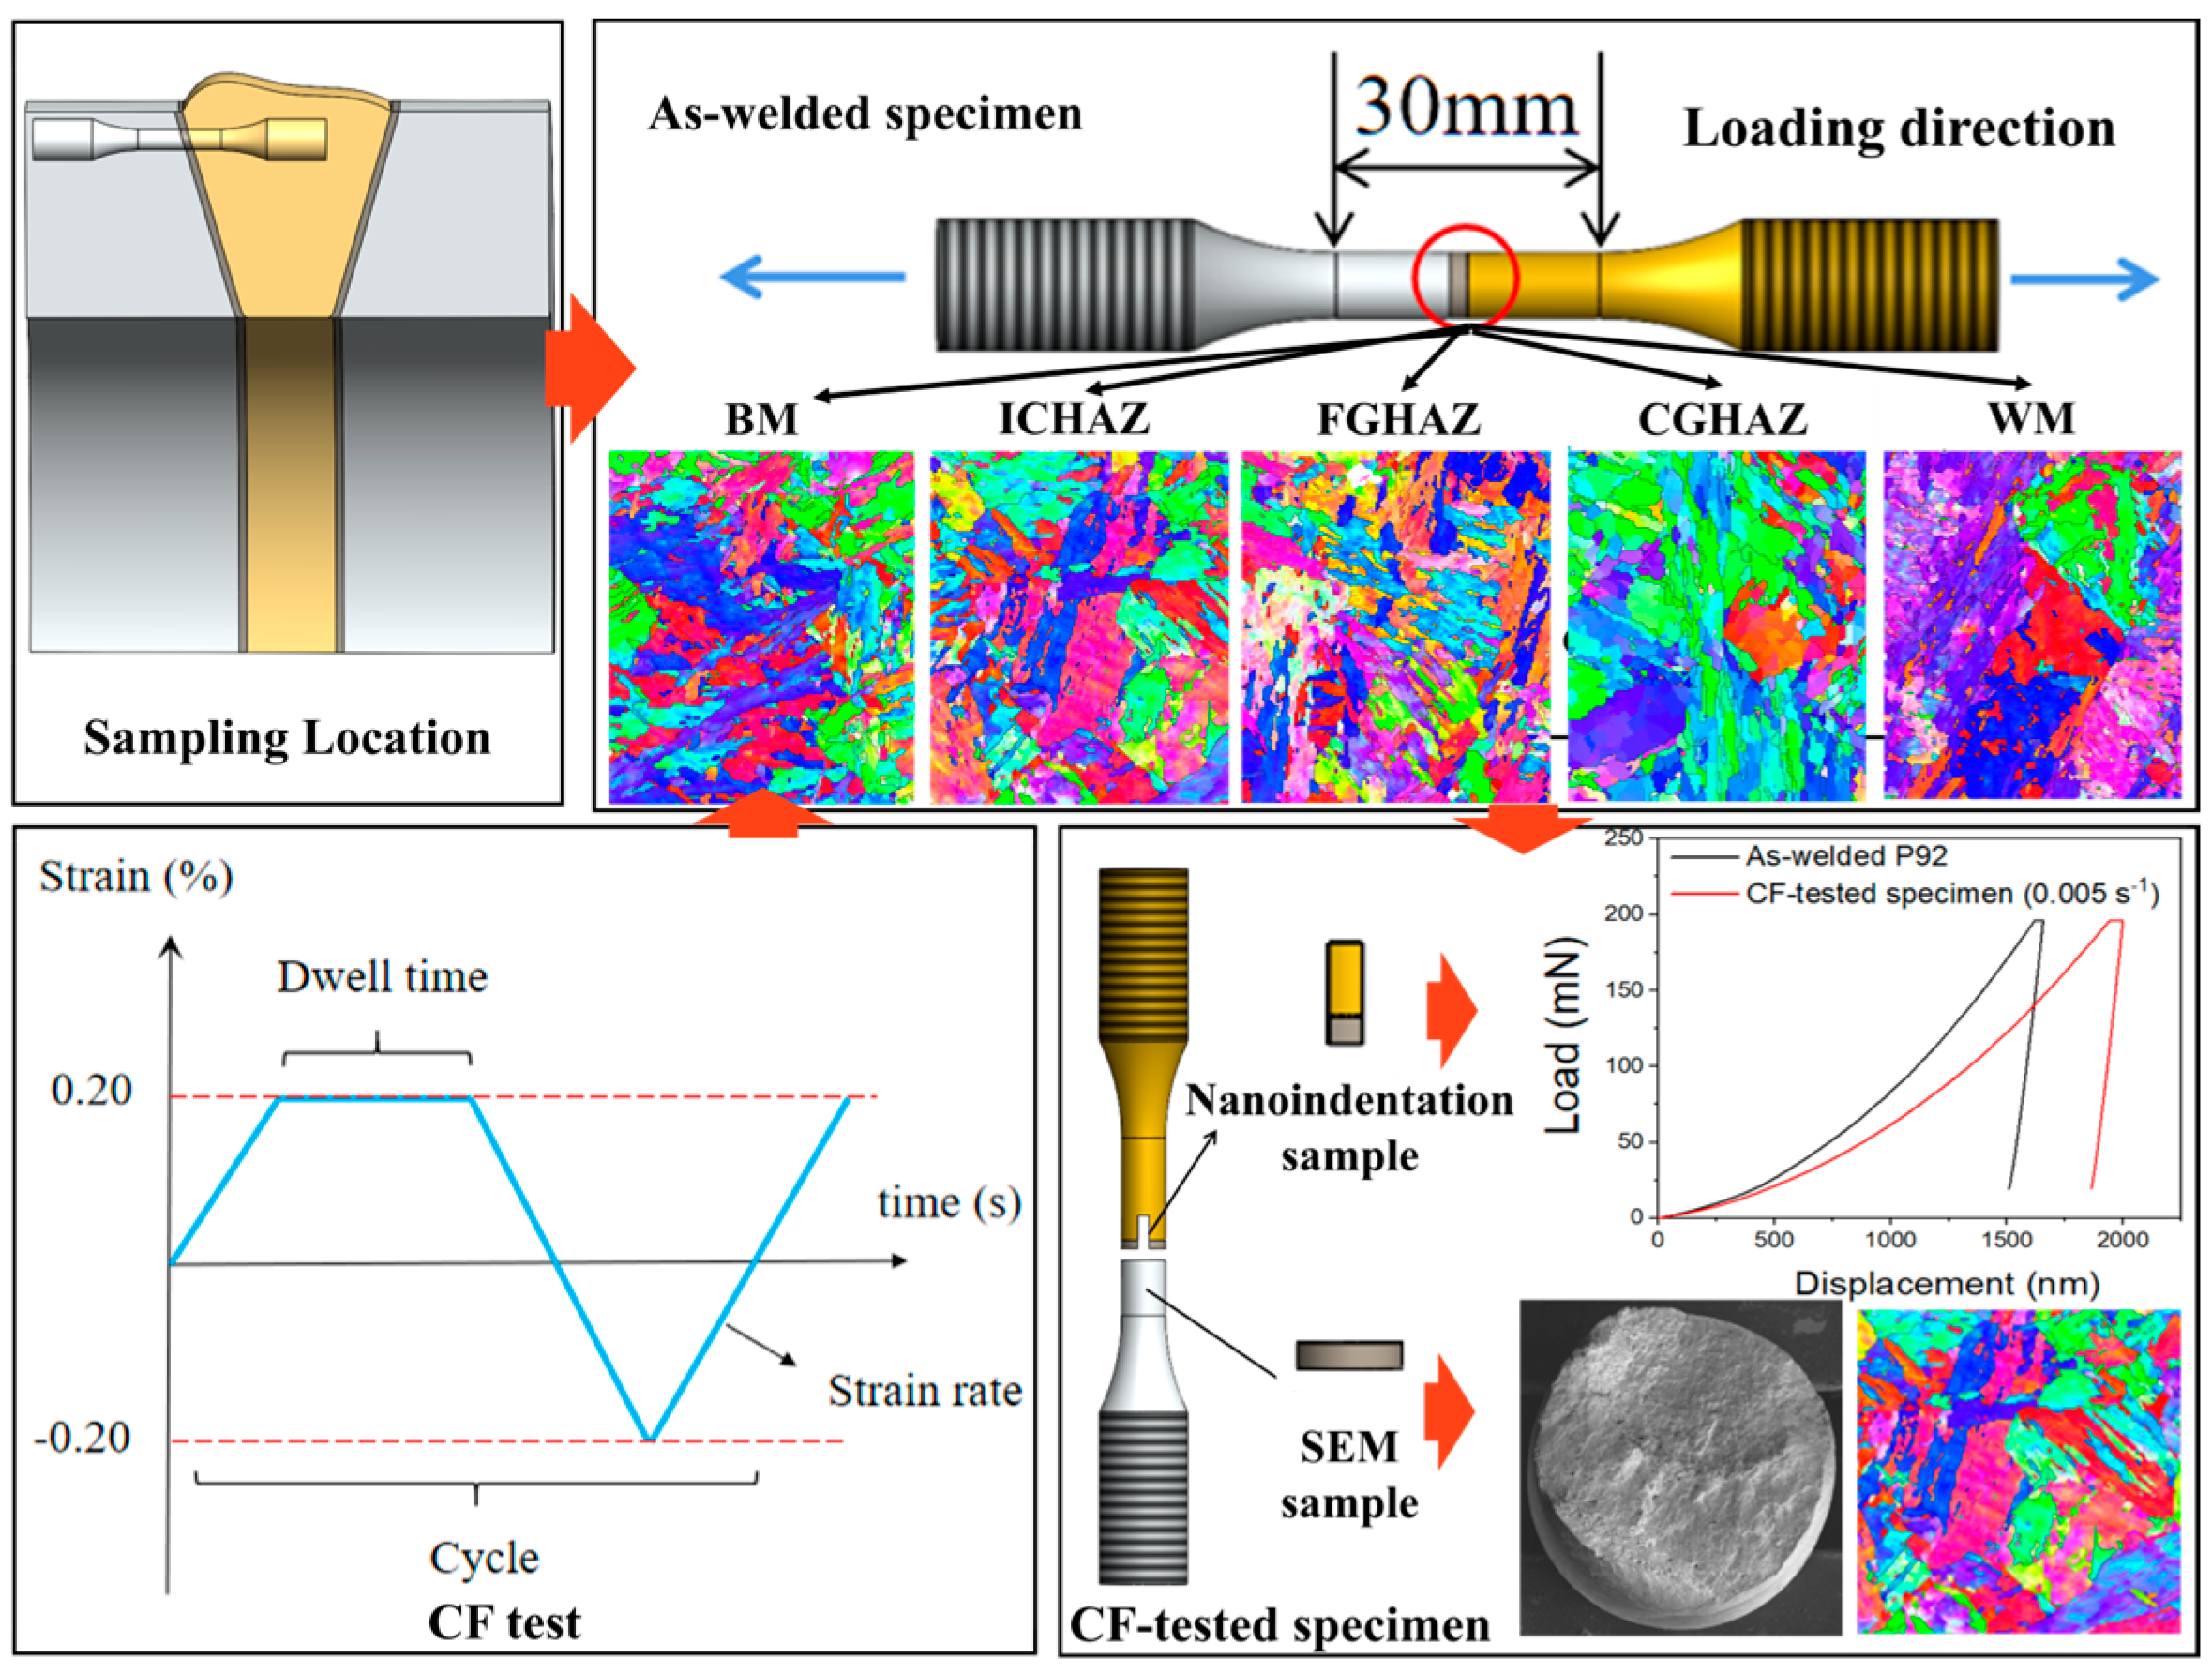
2. Materials and Experimental Procedures

2.1. Materials

In this work, two commercial Chinese Grade P92 steel pipes were used, whose diameter, thickness, and length were 840 × 80 × 300 mm, as illustrated in our previous paper [25]. Gas tungsten arc welding and submerged arc welding techniques were both employed. The welded joint was subsequently subjected to heat treatment at 1033 K for 2 h, followed by air cooling to eliminate residual stress. A nondestructive inspection was performed to ensure that the welded joint could meet industrial requirements. The chemical composition range of P92 steel and welded wire was measured using energy dispersive spectroscopy (EDS), and the specific compositions of the alloy and weld wire are both listed in Table 1.

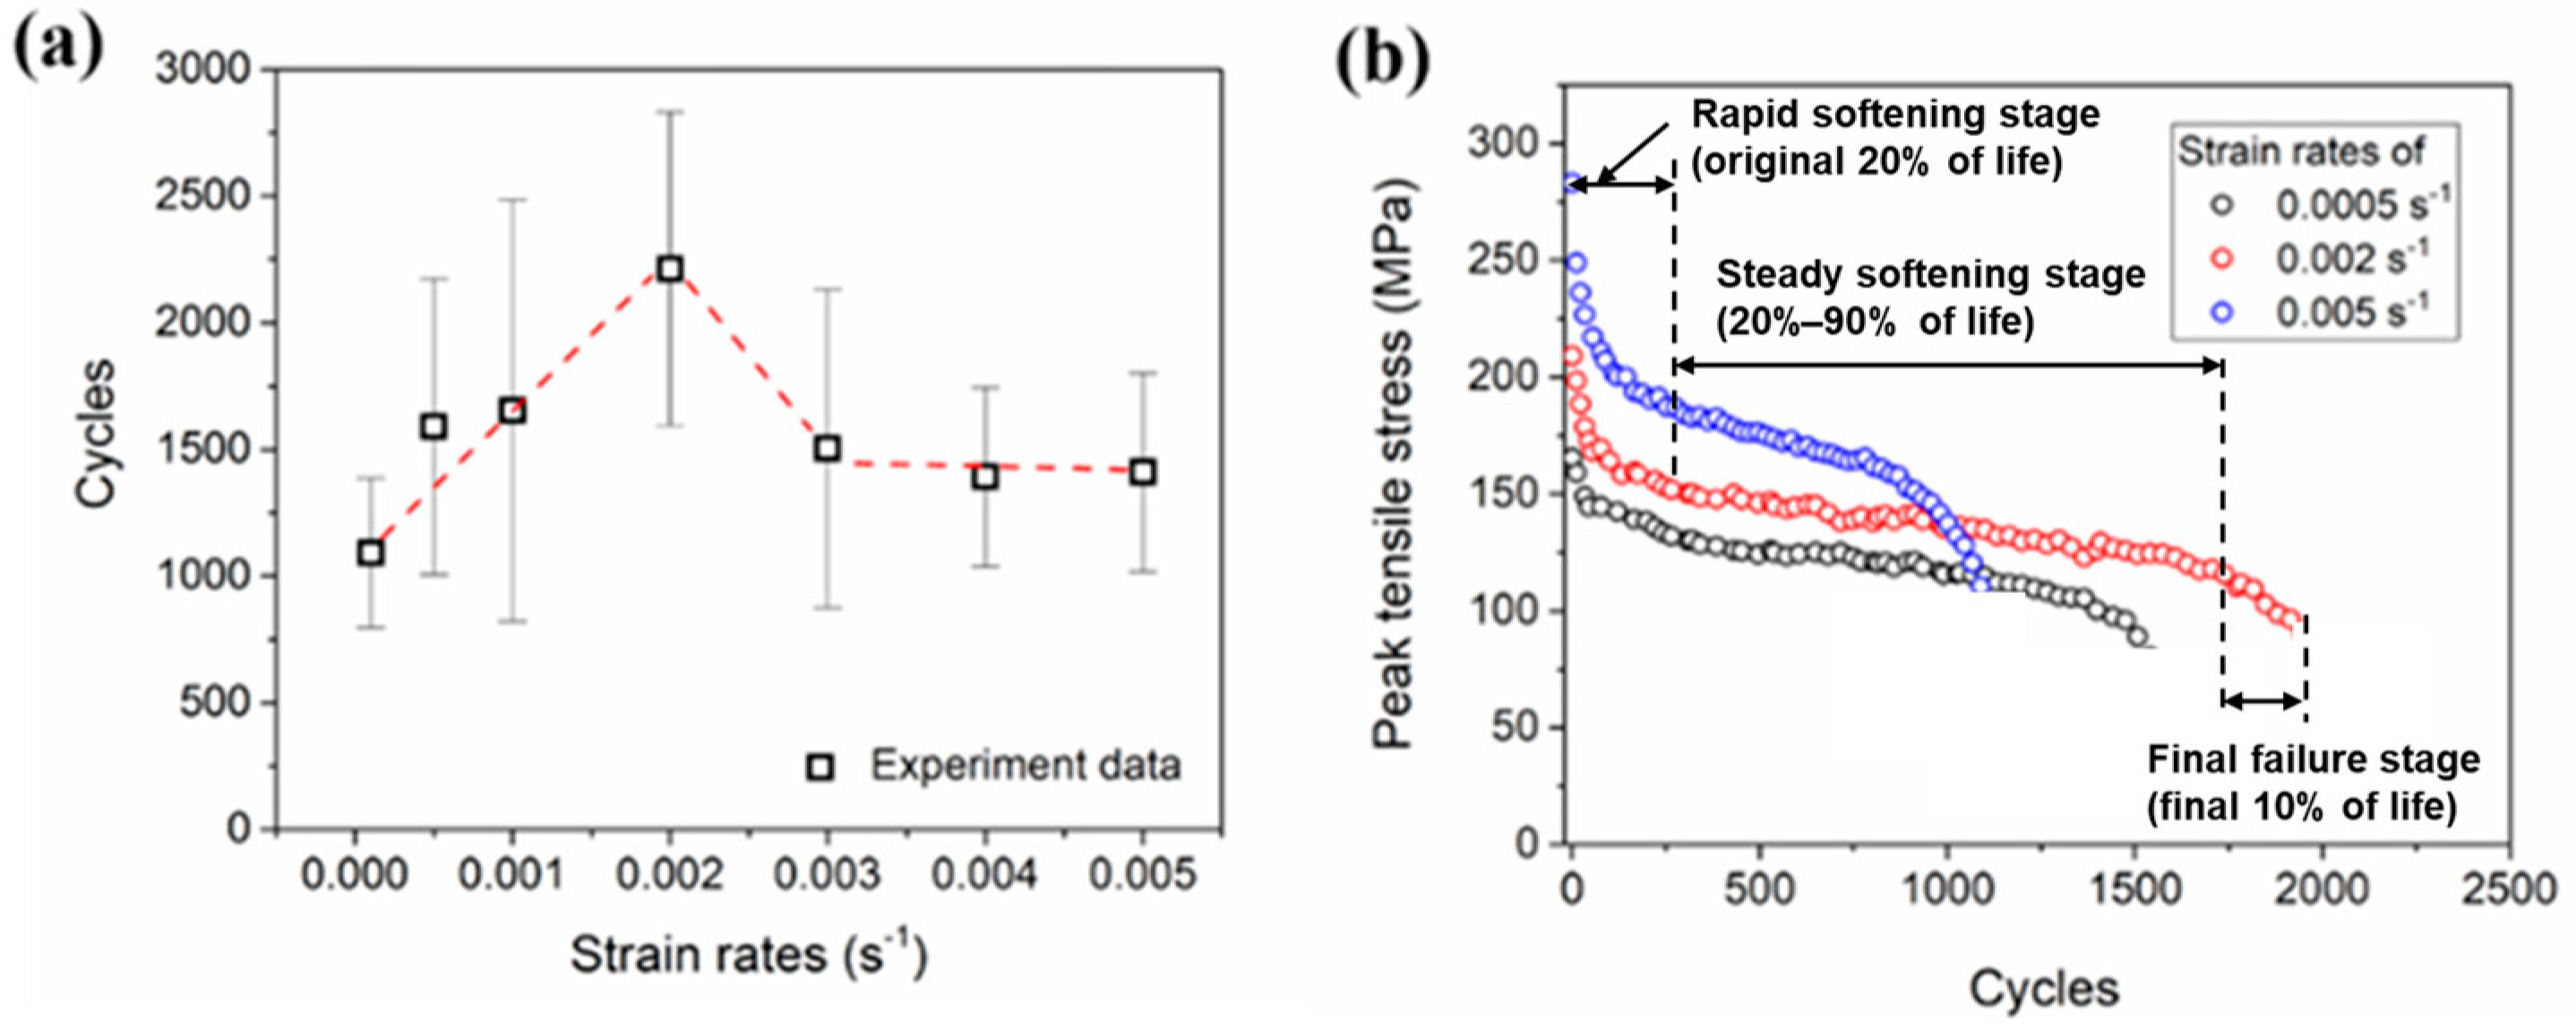
2.2. Creep-Fatigue Testing

The experimental procedure is shown schematically in Figure 1. To ensure similar mechanical properties of the creep-fatigue interaction (CFI), specimens with a 6 mm gauge diameter were prepared from the welded pipe thickness in the same position. The strain-control CFI tests were conducted at 923 K using a RPL series of electronic creep-fatigue testing machines (SINOTEST, Jilin, China) (loading capacity is 100 kN) equipped with a resistance furnace (maximum testing temperature is 1273 K). Symmetric trapezoidal waveforms were used in the CFI tests. The constant strain amplitude of ±0.20% and the peak tensile dwell time of 300 s were adopted. The strain rate was set as 0.0001, 0.0005, 0.001, 0.002 and 0.005 s−1, respectively, and a matrix of test parameters used in the CF experiments is given in Table 2. Three valid CFI results were obtained at each strain rate. During the CFI test, the instantaneous gauge length of the specimen was measured by an extensometer (Epsilon, the initial gauge length is 25 mm, and the measuring range is ±2.5 mm). Before the CFI test started, all the specimens were held for 30 min at 923 K to ensure a uniform temperature field in the gauge range. Furthermore, the temperature of the specimen was measured by three S-type thermocouples attached to the top, middle and bottom of each specimen, and the testing temperature fluctuation was controlled within ±1 K.

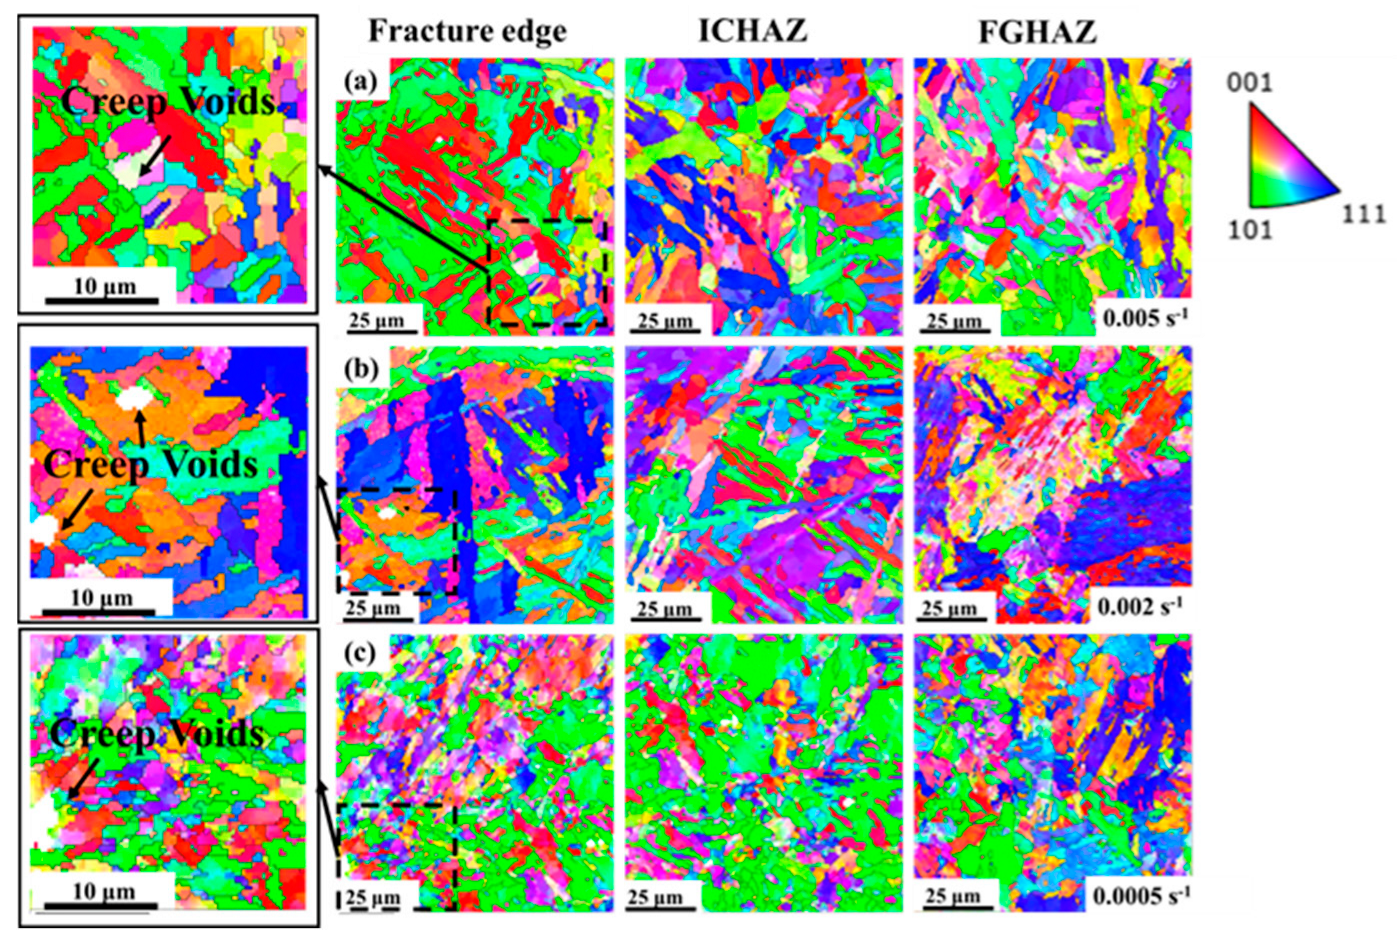
2.3. Microstructural Characterization

The fracture surface features of the welded joint under CF loading with different strain rates were observed using scanning electron microscopy (SEM). The microstructures were characterized using scanning electron microscopy (SEM, Thermo Fisher apreo 2c, Thermo Fisher Scientific, Waltham, MA, USA), equipped with electron backscatter diffraction (EBSD, Oxford nano+, Oxford Instruments, Abingdon, UK). AZtecCrystal software (https://www.oxinst.com, accessed on 12 September 2024) was used to draw inverse pole diagrams (IPF), which are of great significance for evaluating the crystal structure and texture of materials.

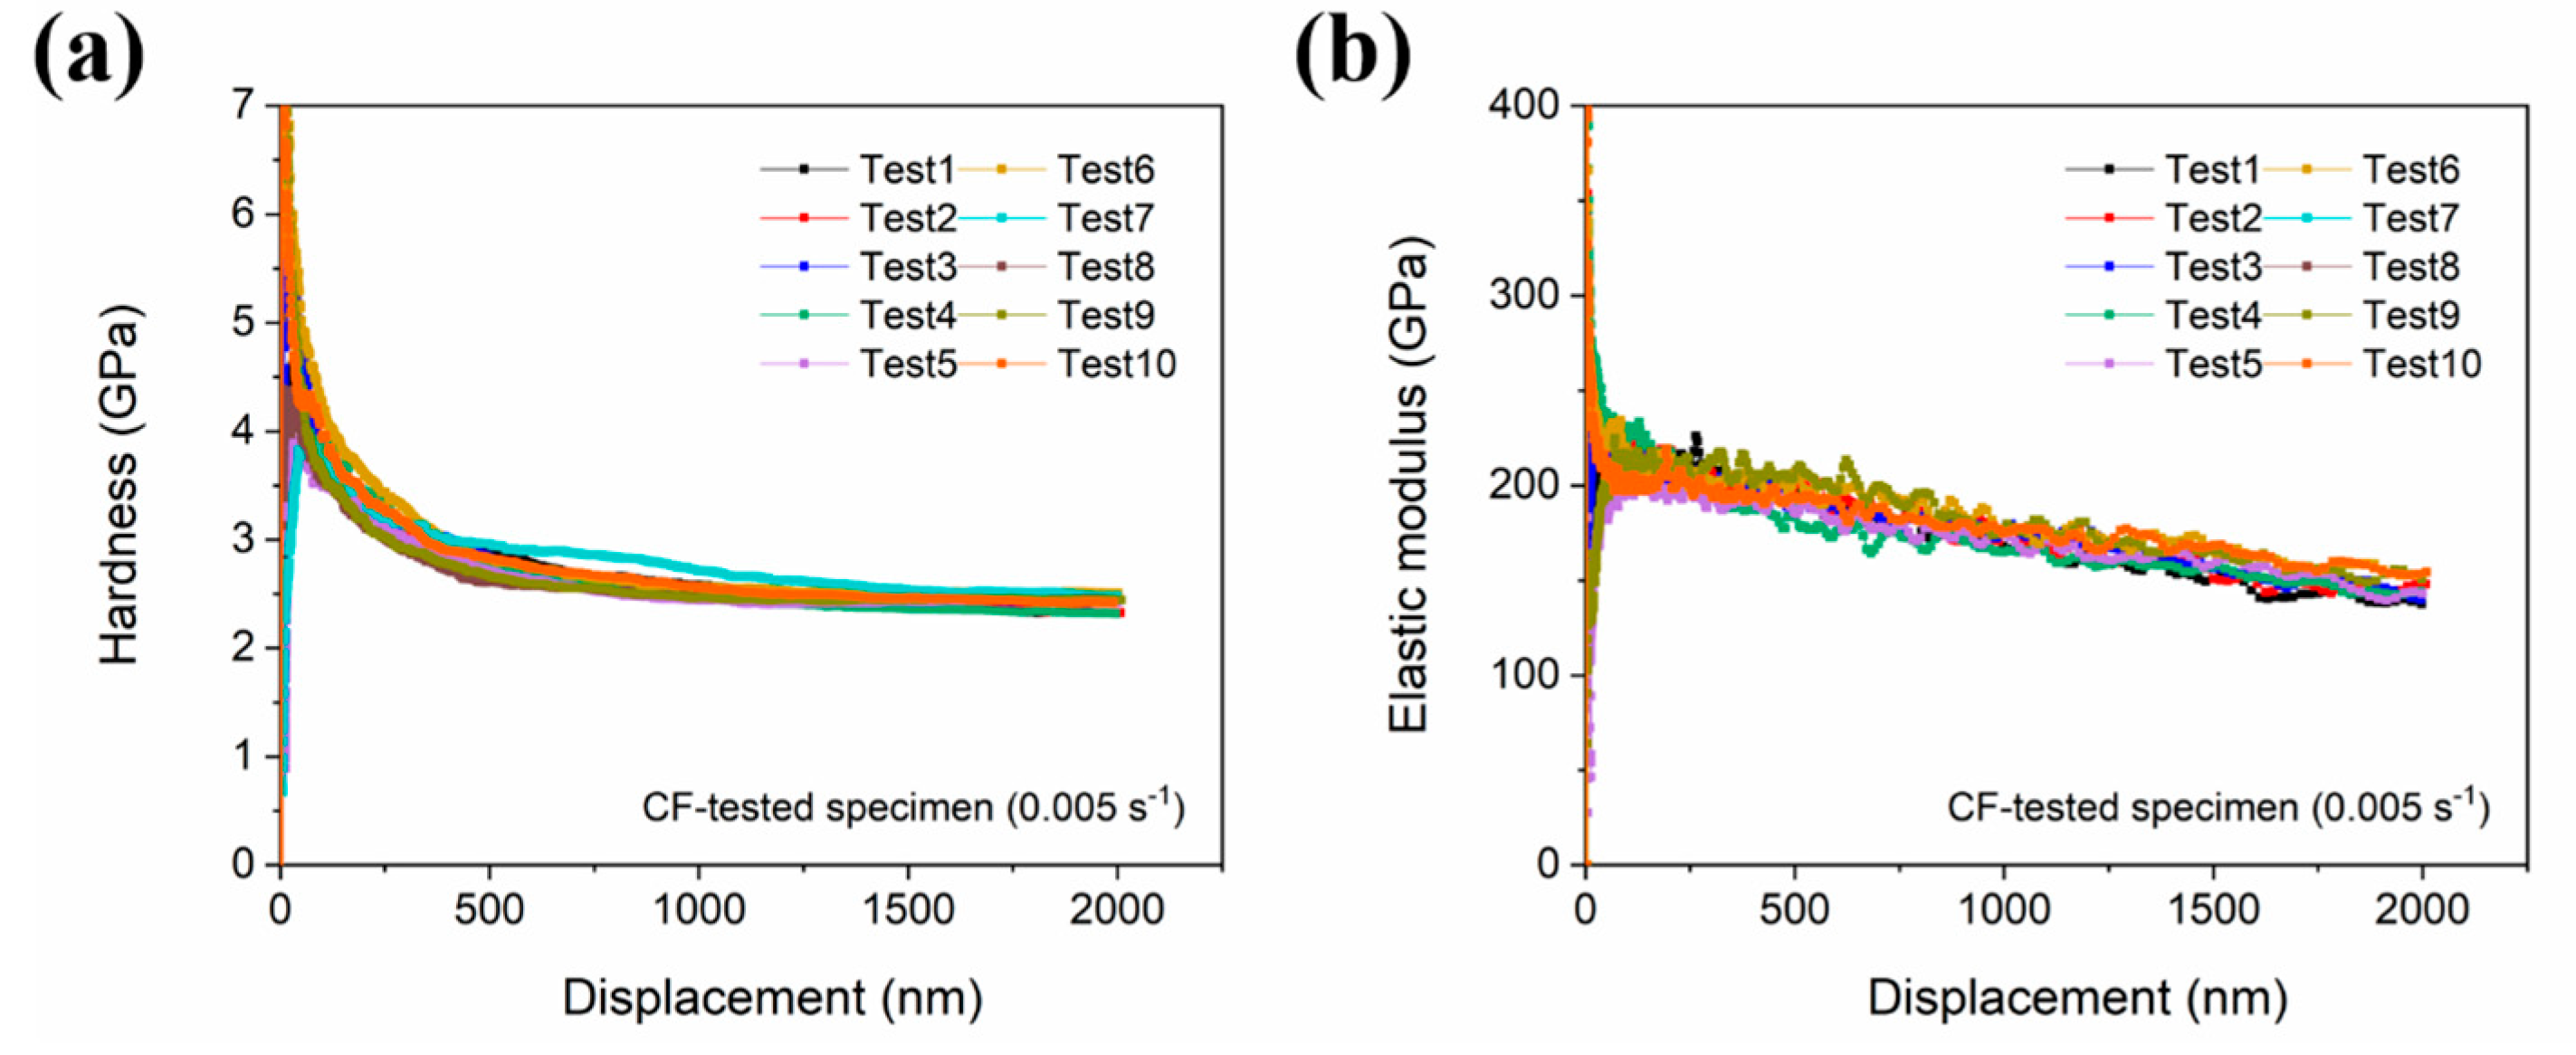
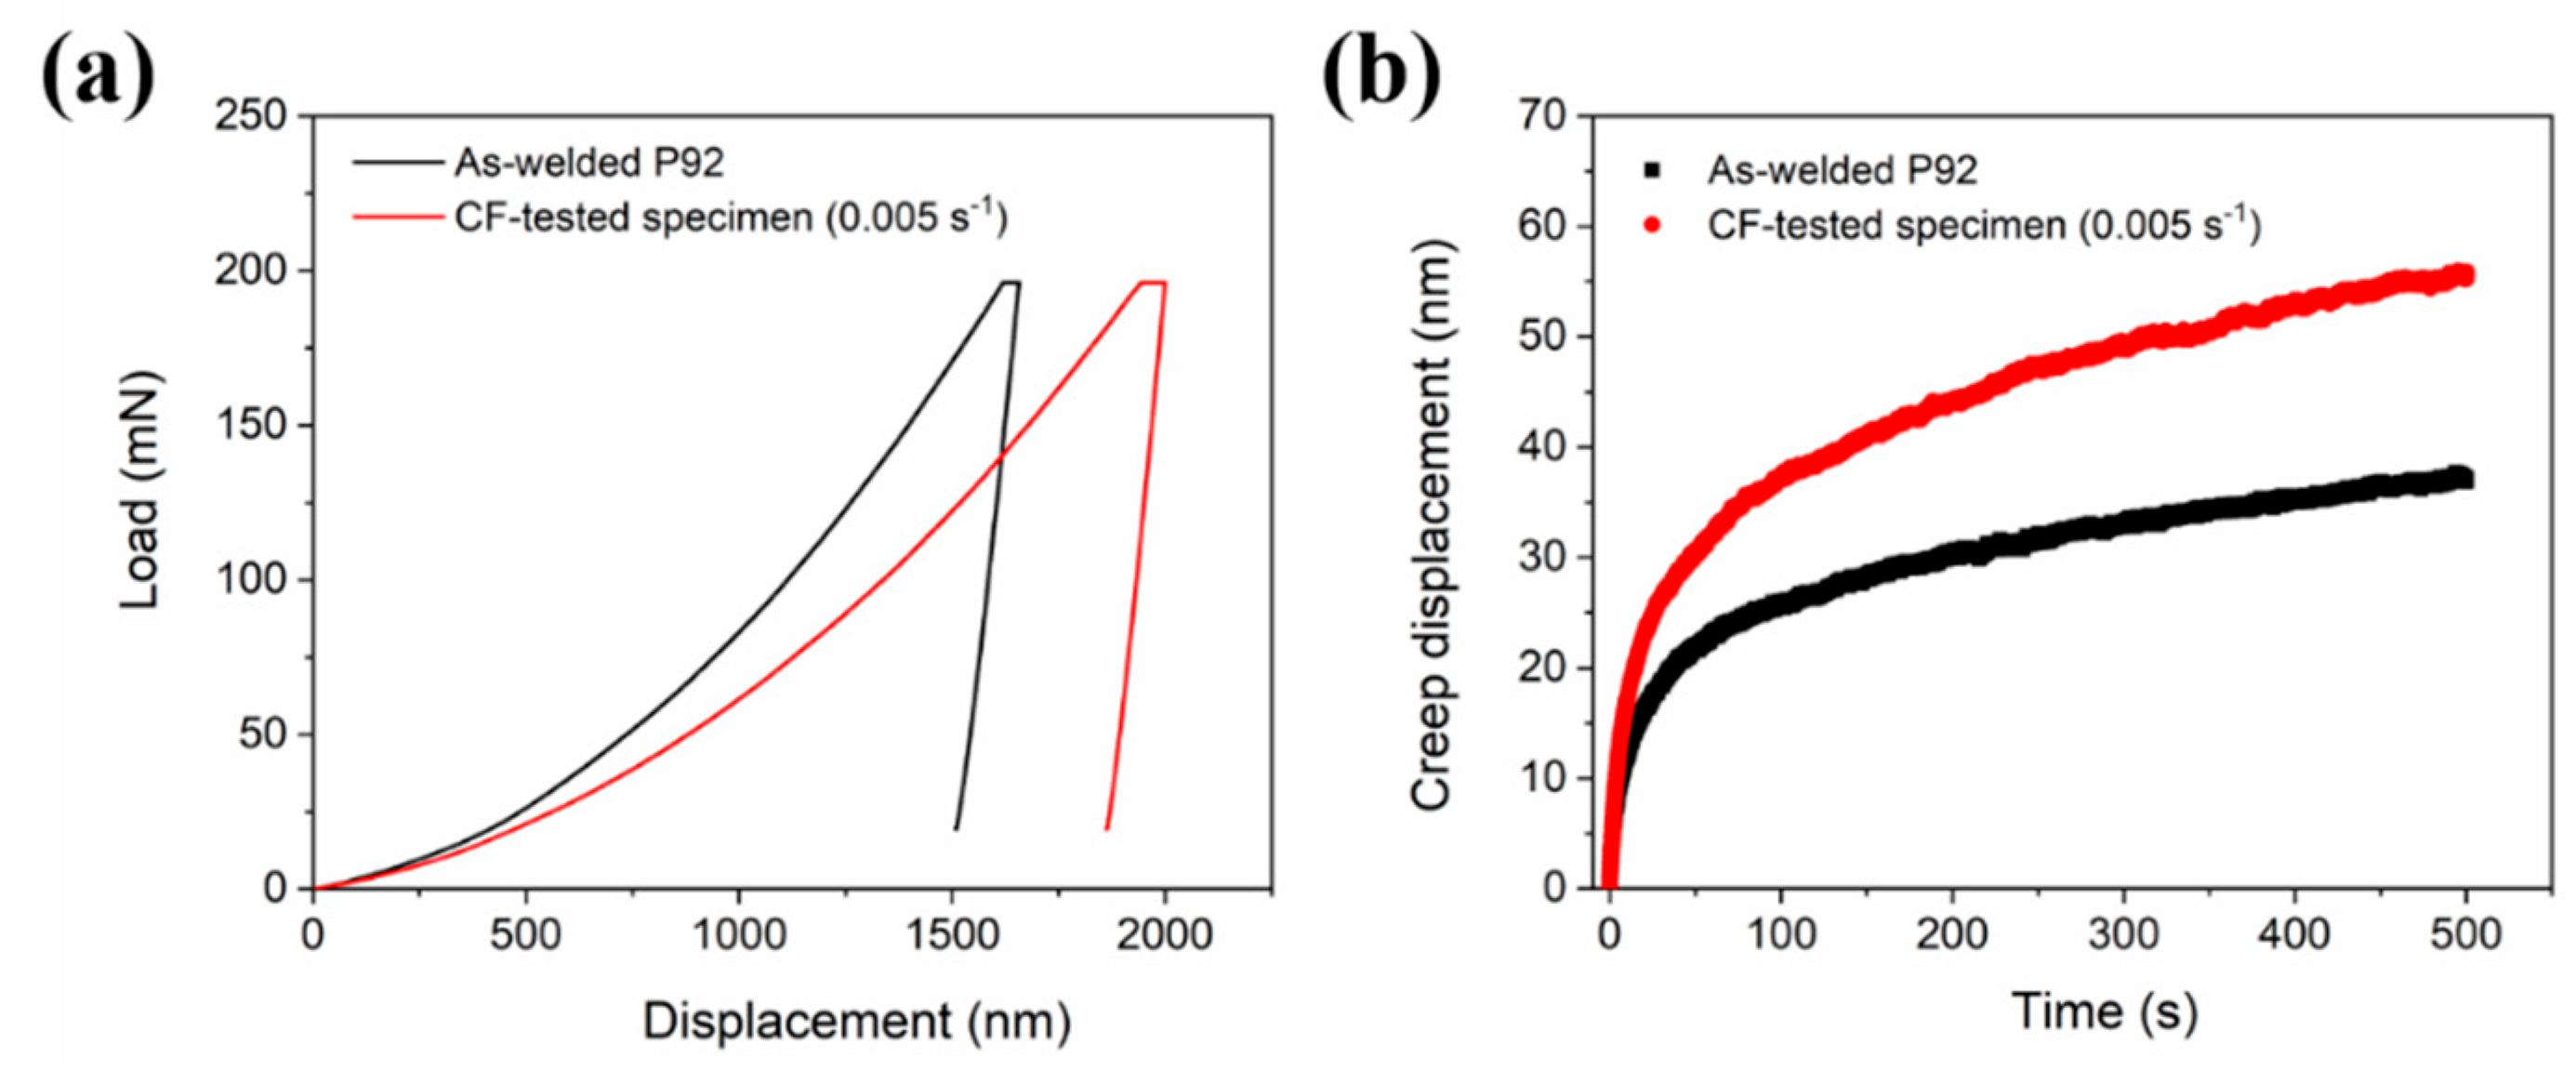
2.4. Nanoindentation Testing

Nanoindentation tests were performed at room temperature using an Agilent Nano Indenter G200 (Agilent Technologies Inc., Santa Clara, CA, USA). Nanoindentation samples were cut from the CFI-tested specimens through EDM. Then, their surfaces were polished with a mirror by a polishing machine (MP-1A). These polished samples were cleaned in an ultrasonic cleaning machine with an anhydrous-alcohol environment. Numerous testing regions were labeled in the CFI-tested samples based on their distance from the fracture edge, and a 50 μm space was strictly set between two adjacent regions. At least five indents were performed in each testing region to ensure reliability. Using a Berkovich indenter, the hardness and elastic modulus were first measured by a continuous stiffness module (CSM). The constant strain rate and the maximum depth were set as 0.05 s−1 and 2 μm, respectively. The constant load-holding method was then employed to investigate creep behavior for these samples. The indenter was held at a maximum load of 196 mN for 1000 s with a constant loading rate of 5 mN/s. The constant load test is more time-consuming than the CSM method (20 min per indention test vs. 5 min), so a larger spacing (100 micros) was set to measure the strain rate sensitivity of the as-received and CFI-tested specimens. Thermal drift was measured throughout the tests, and tests were only launched when thermal drift was reduced below 0.05 nm/s. The thermal drift correction was strictly calibrated at 10% of the maximum loading after the unloading stage.

3. Results

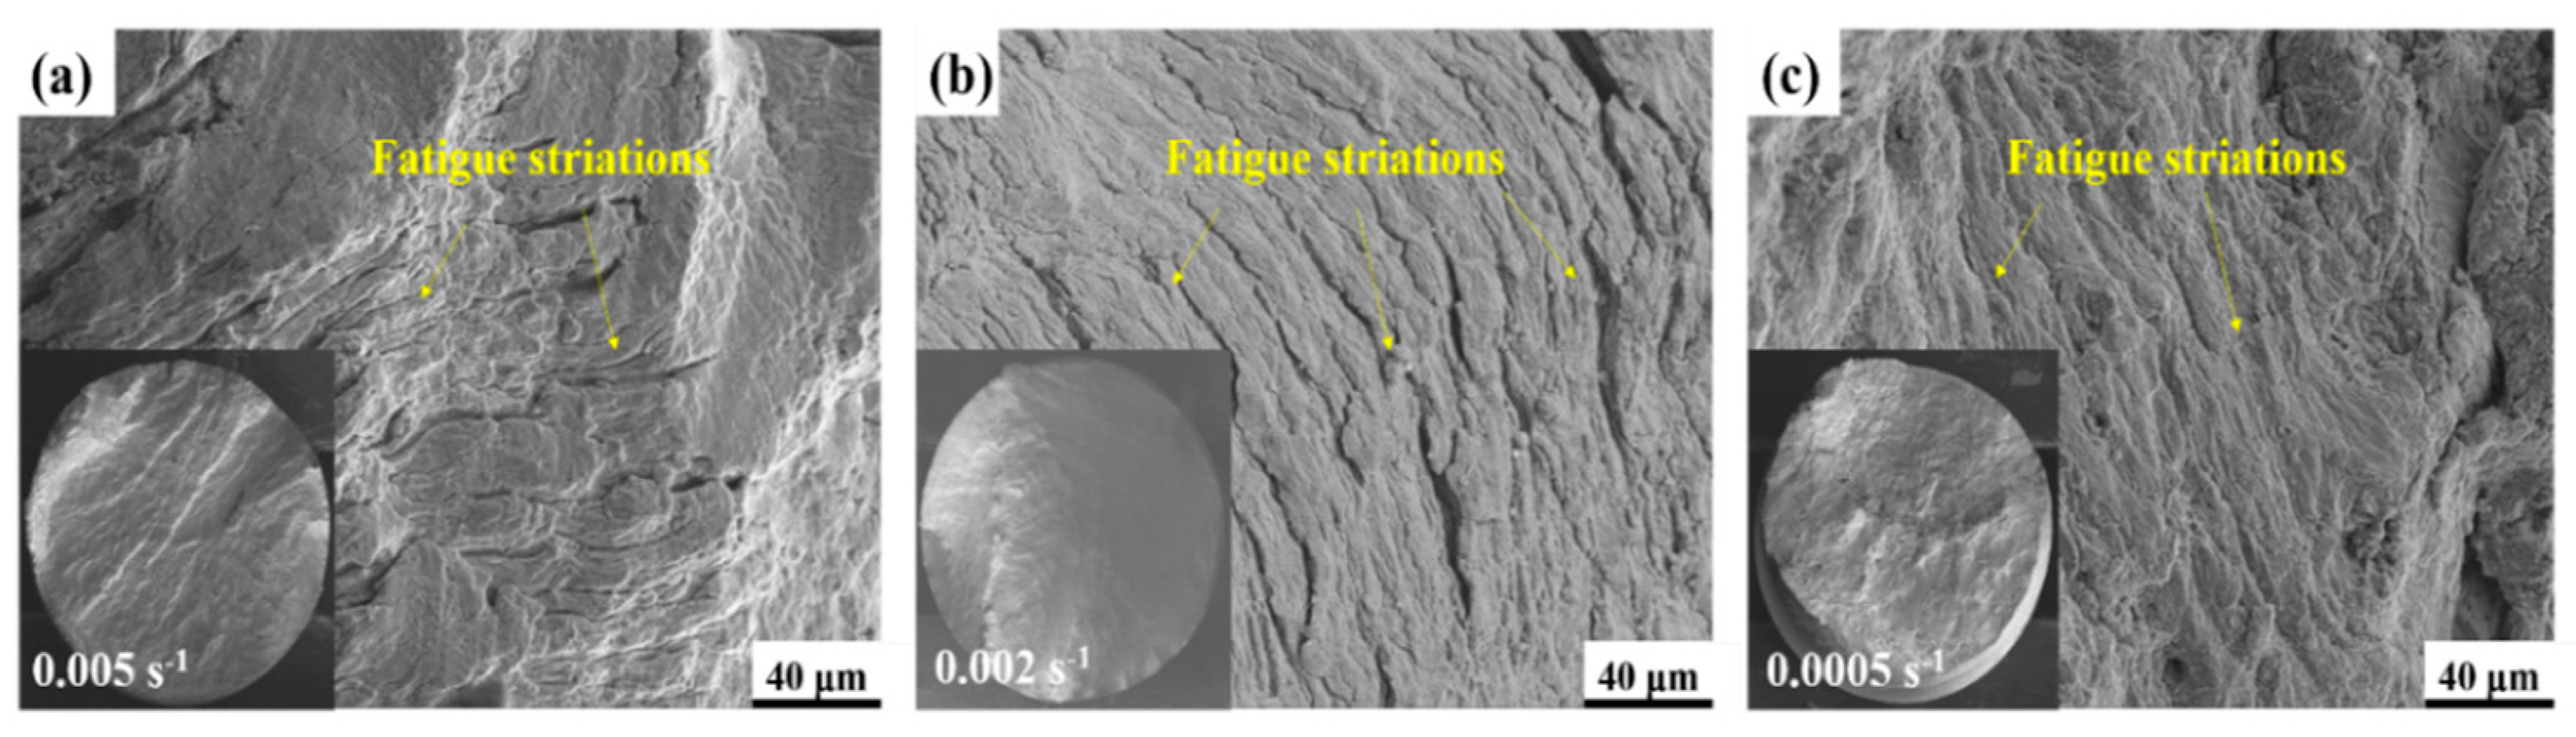
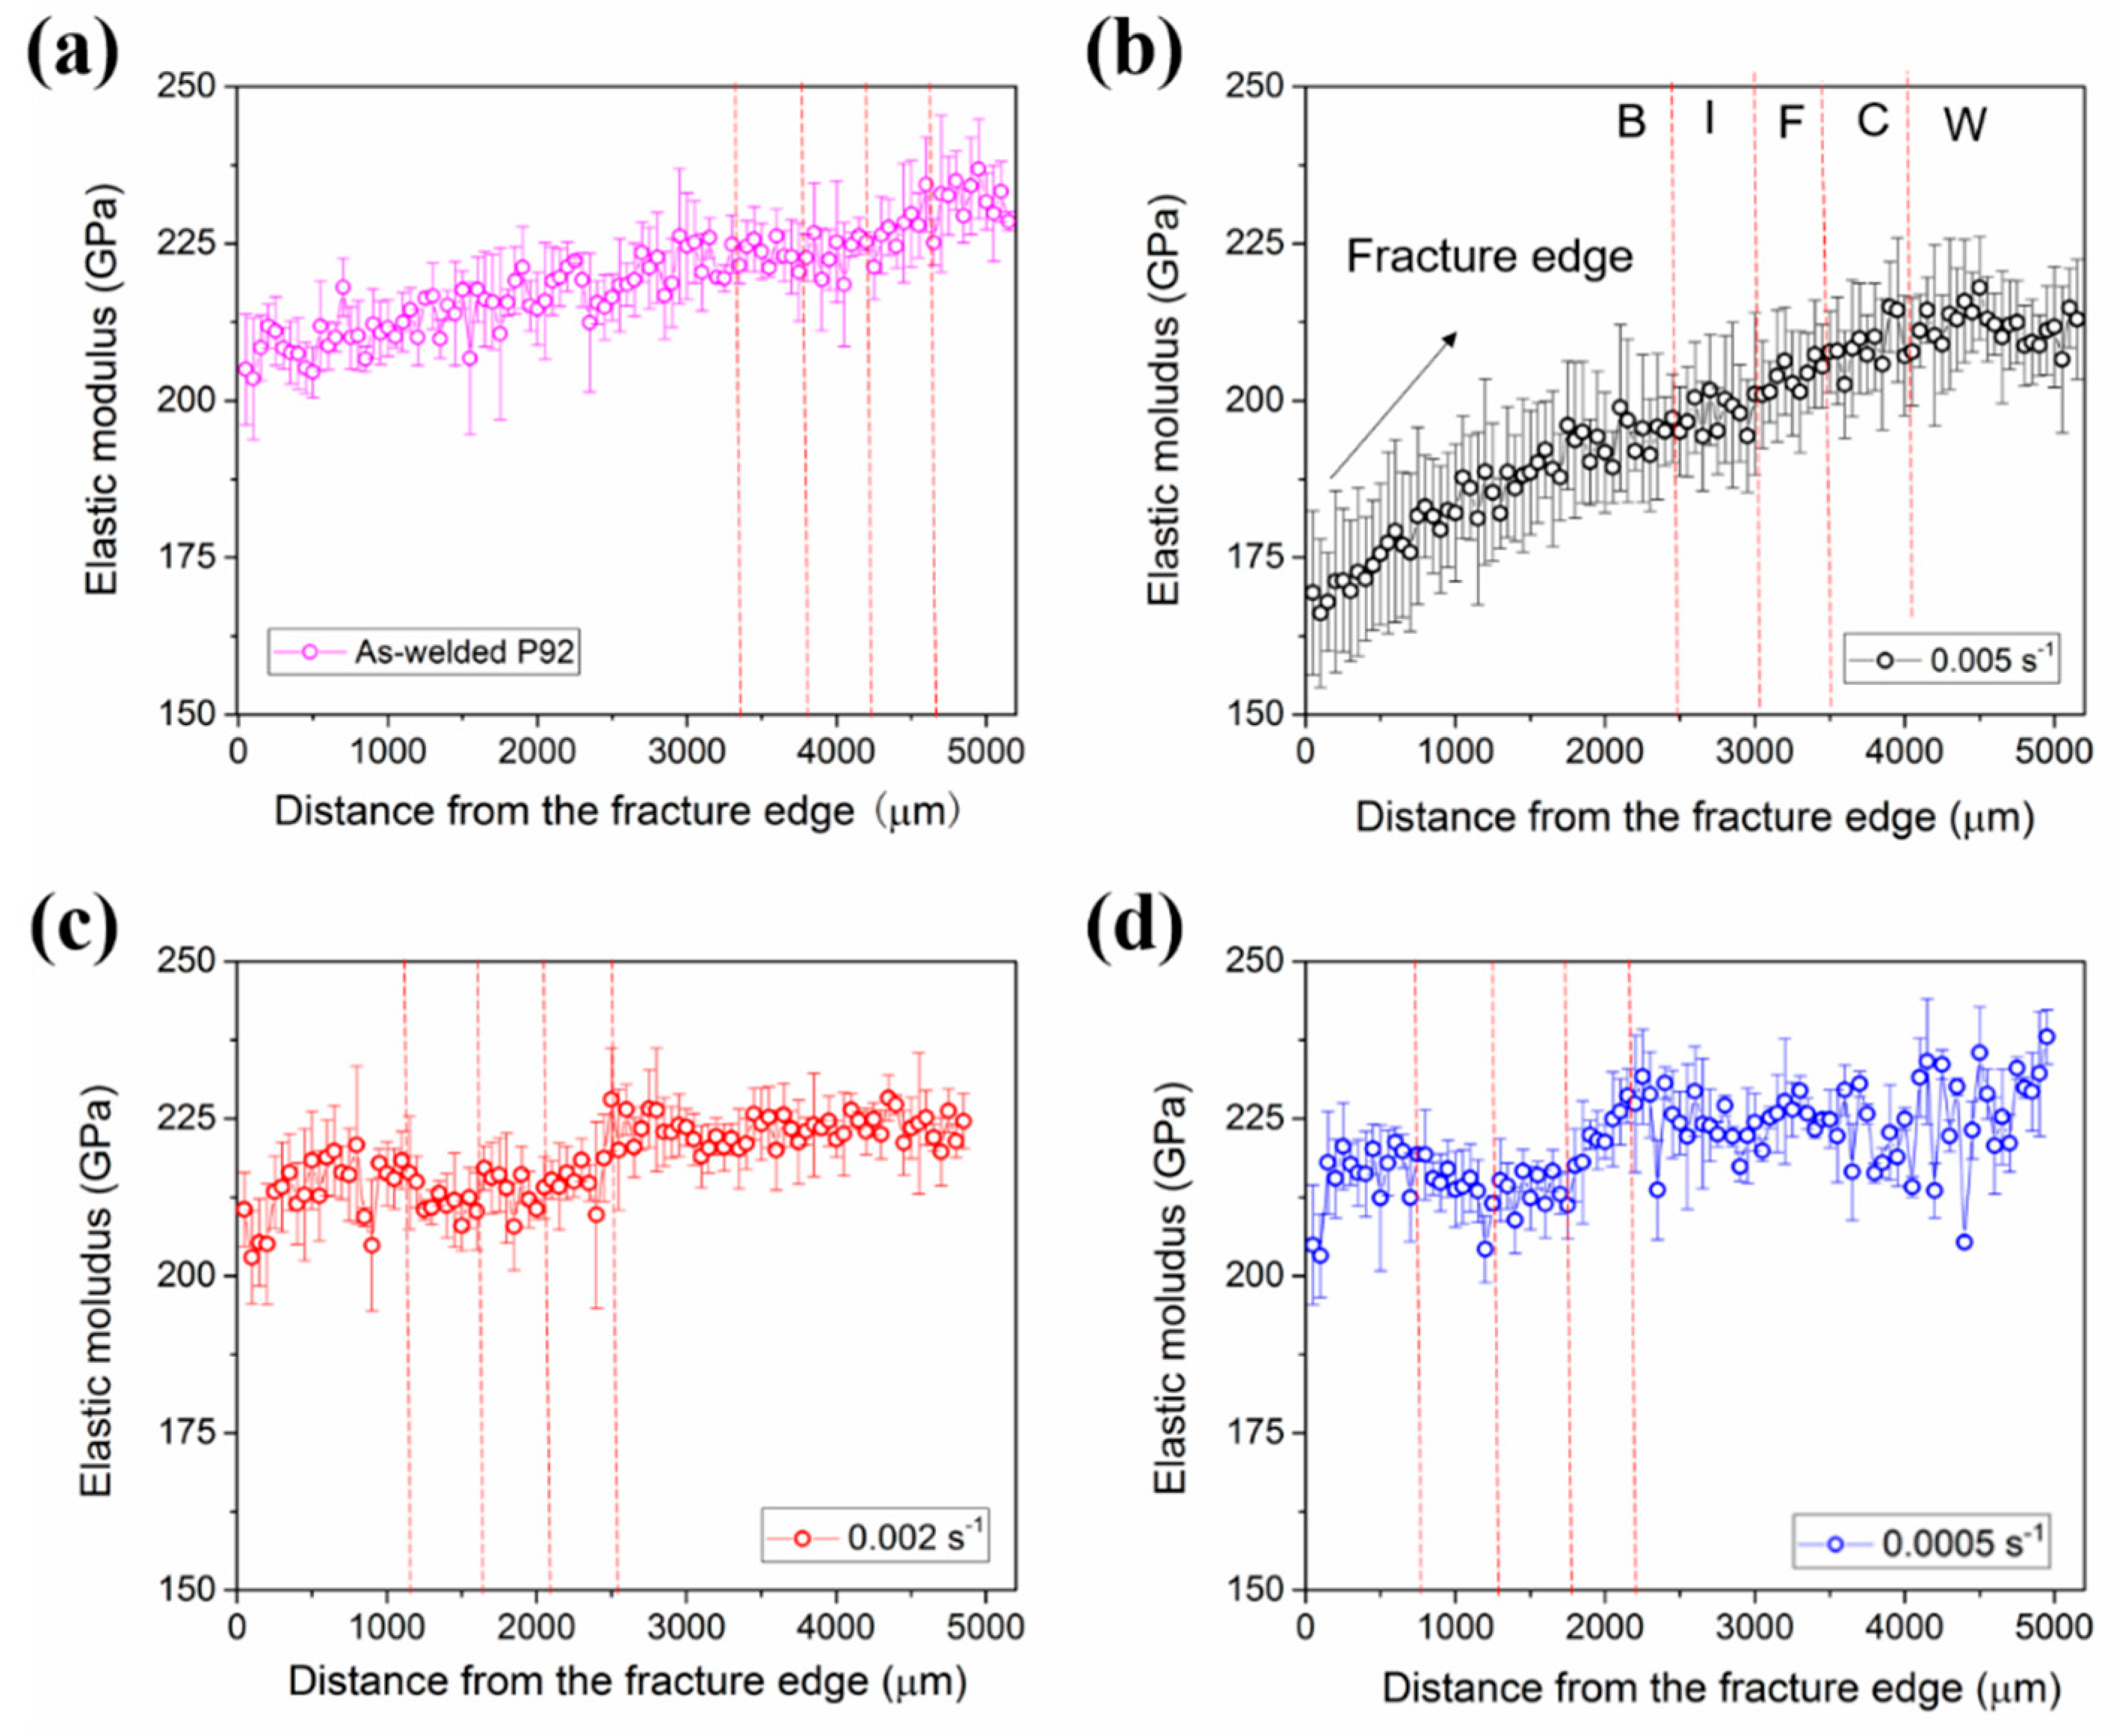
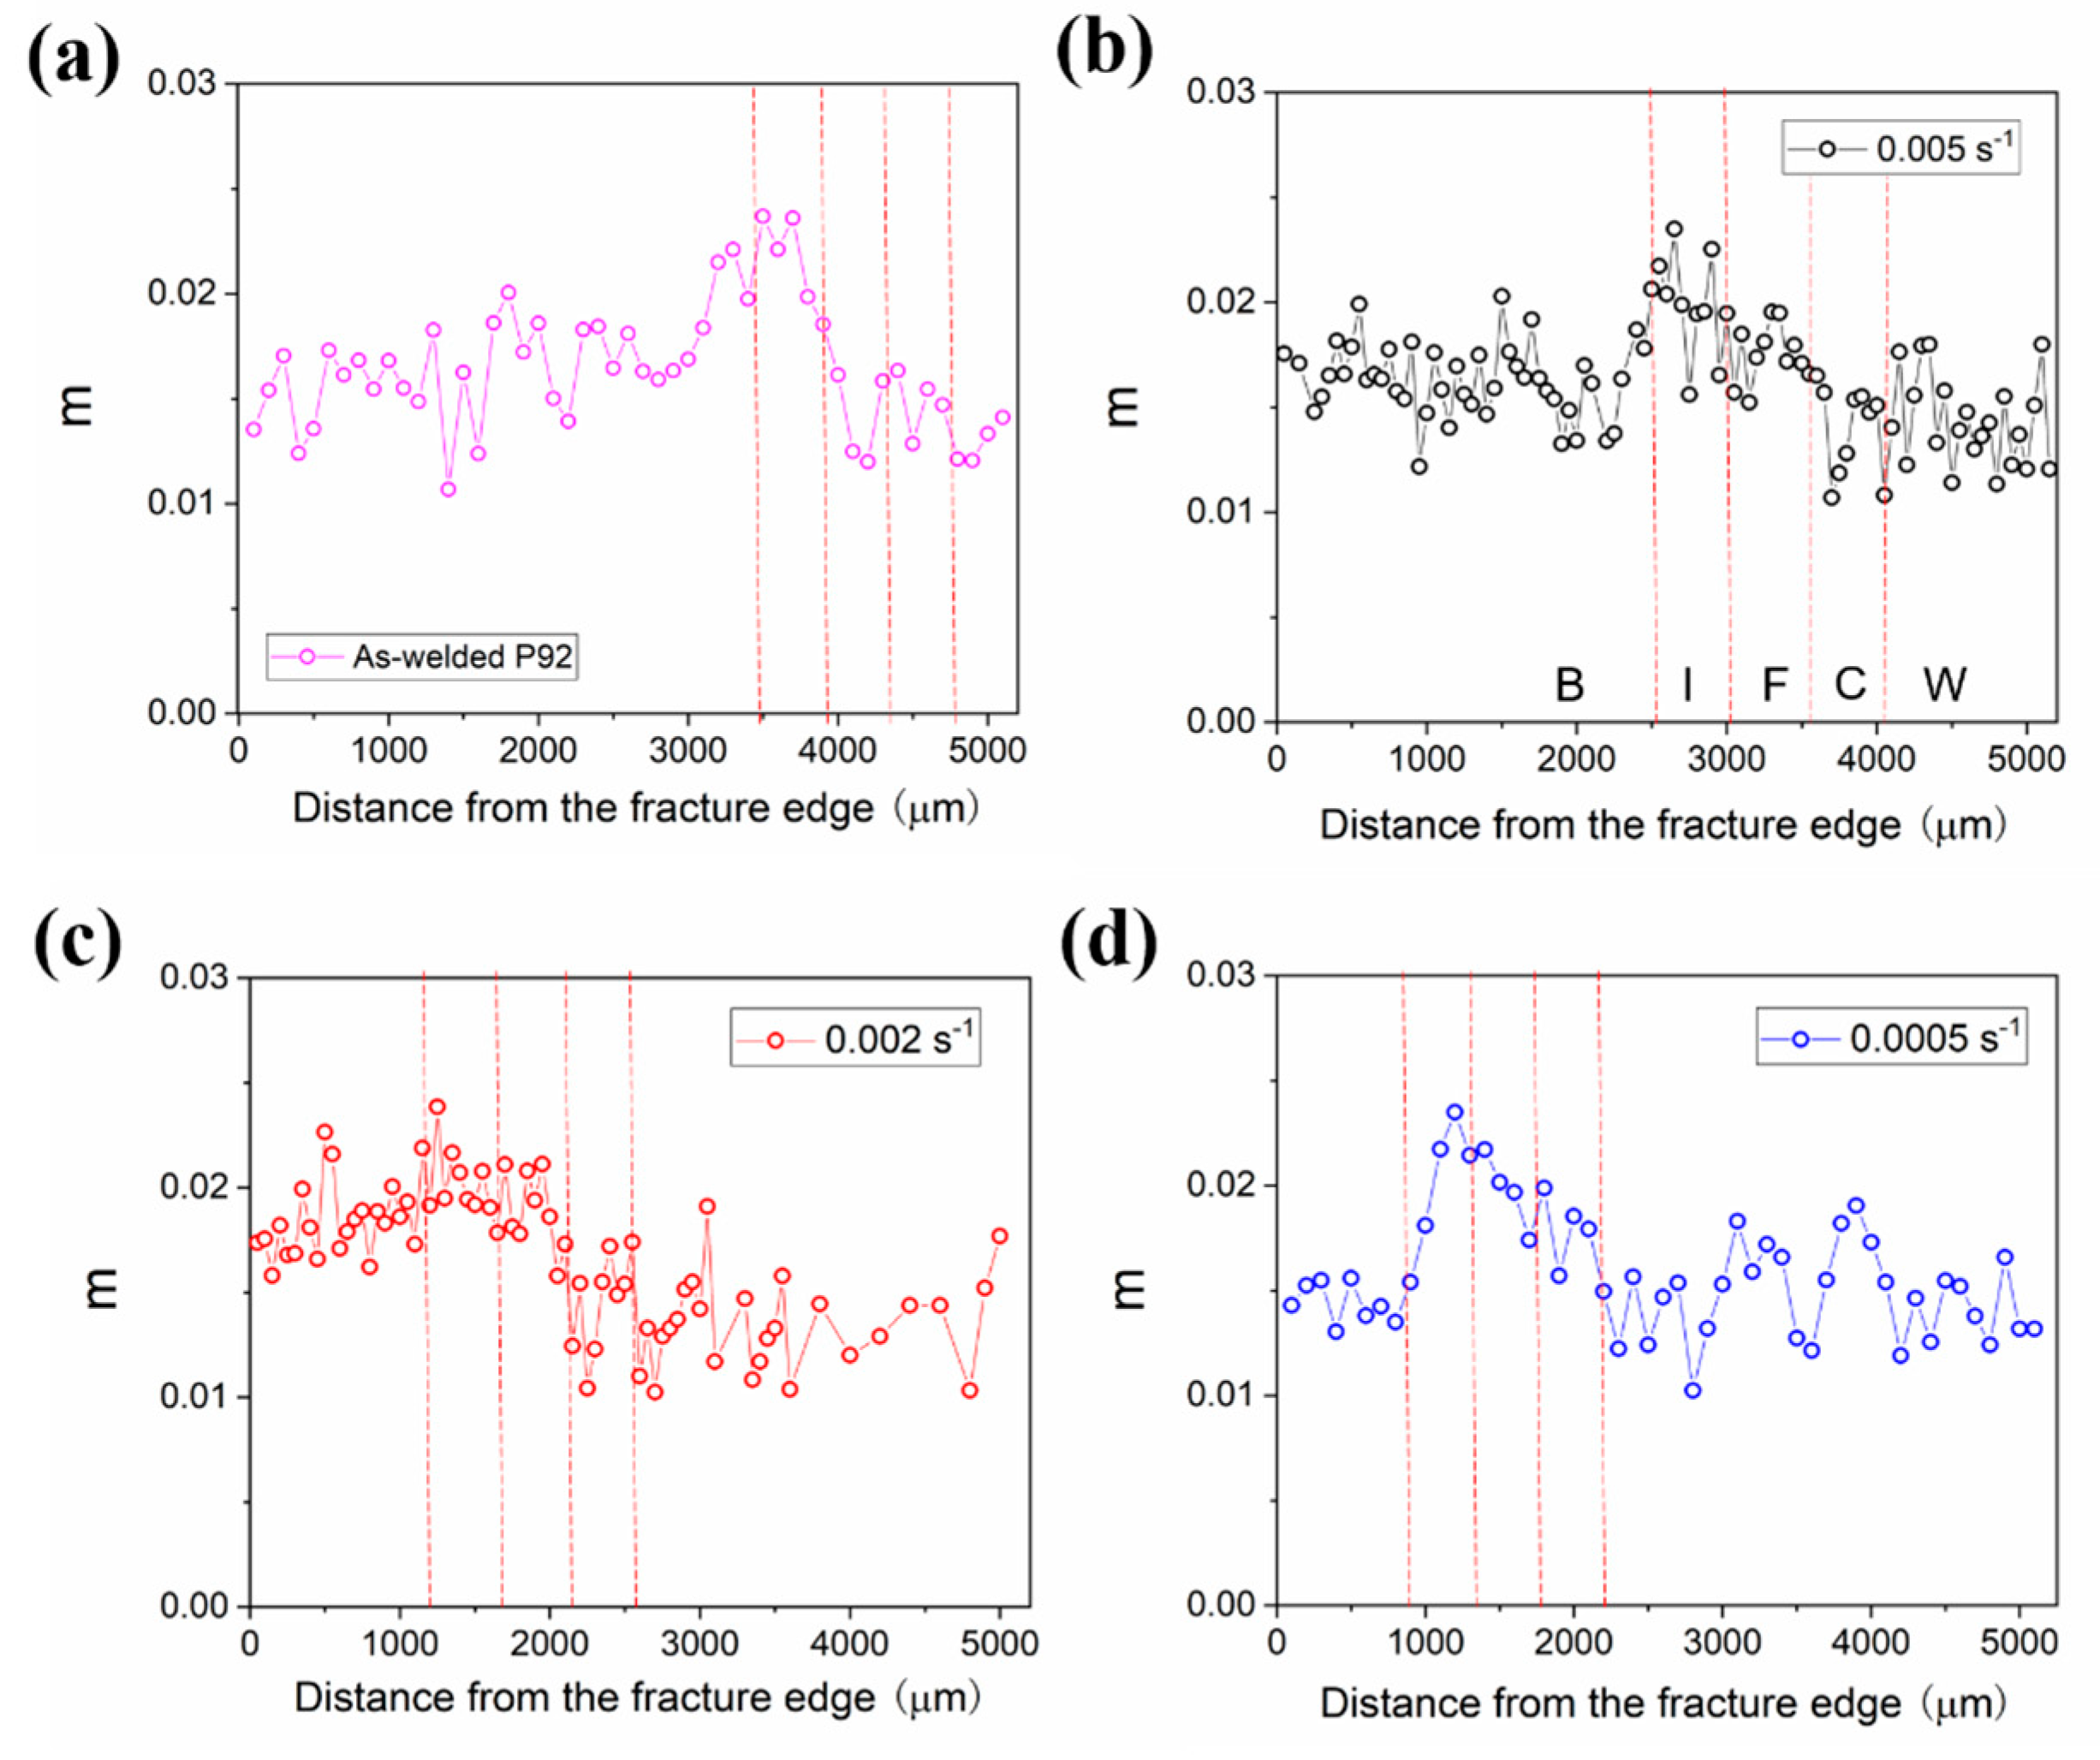
3.1. Microstructure Evolution Under CFI Loading

The results of the CF test were used in our previous studies [25]. These CFI-tested specimens all ruptured in the base metal (BM) region, and the fracture positions gradually near the inter-critical heated affected zone(ICHAZ) region, as shown in Figure S1. Figure 2a shows the cyclic life of the CFI specimens under a series of strain rates. It is evident that cyclic life increases with increasing strain rate in the range of 0.0001 to 0.002 s−1. However, the cyclic life decreases with an increasing strain rate that is beyond the strain rate of 0.002 s−1. Figure 2b presents the peak tensile stress versus fatigue cycles for the three typical specimens, which were tested under the strain rates of 0.0005, 0.002 and 0.005 s−1, since their cyclic lives seem close to the average value. In this work, when the peak tensile stress was reduced to 50% of its initial stress, the fatigue specimen was considered to have failed. Three cyclic softening stages were clearly observed, named the rapid softening stage, the steady softening stage, and the final failure stage. The first two softening stages were induced by the recovery of martensitic laths and the formation of subgrains, which occurred due to the competition between annihilation and multiplication of dislocations. As for the final failure stage, the main crack nucleated and propagated in the specimens, resulting in a significant reduction in nominal peak tensile stress. Furthermore, the typical specimen under a higher strain rate was subjected to a higher peak tensile stress. Nevertheless, the cyclic life did not decrease within the strain-rate range of 0.0001 to 0.002 s−1. This phenomenon could be the inhomogeneous microstructural evolution of the welded joint during the CFI test, leading to a variation in the strain rate sensitivity of these microregions.
Relying on the EBSD technique, typical IPF (x-axis, loading direction) maps in the fracture edge, ICHAZ and fine-grained heat-affected zone (FGHAZ) of the three specimens are shown in Figure 3a–c, respectively. The high-angle grain boundaries (HAGBs) (>15°) were labeled in each figure by a black line. It is worth noting that the tiny creep voids (~5 μm) were observed in the fracture edge of the CFI-tested specimens under the strain rate of 0.002 and 0.0005 s−1, as shown in Figure 3b,c. However, no creep void was found in the CFI-tested specimen under the strain rate of 0.005 s−1. Furthermore, more than 200 grains (blocks) were precisely recorded over an area of 200 × 200 μm2 in each region to obtain their variations in grain size by the EBSD technique. Figure 4a–c summarizes the statistical distributions of grain size in the fracture edge, ICHAZ and FGHAZ for these CFI specimens. For simplicity, the grain count was divided into specified size ranges, i.e., 0–5, 5–10, 10–20 and 20–40 μm. As the strain rate increases from 0.0005 to 0.005 s−1, the large grain size distribution (20–40 μm) of the fracture edge is approximately constant, while a progressive decrease in the 0–5 μm range is compensated by the increases in the frequency of 5–10 μm and 10–20 μm grains, as shown in Figure 4a. Similar trends in the grain size distribution were measured in Figure 4b,c for the ICHAZ and FGHAZ. This observation manifests that the average values of the grain size in these three regions are enlarged with the increasing CFI strain rates.
Using SEM, the fracture surfaces of three typical specimens were observed, and their fractographs are shown in Figure 5a–c. The overall fracture morphologies of the three specimens are displayed in the bottom left corners of the figures. Fatigue striations were clearly visible on the fracture surfaces for the three specimens, while no creep voids were observed. On the other hand, the necking phenomenon was absent in these CFI specimens. Figure 5a–c shows that the prominent fatigue striations occur in the CFI-tested specimen under a higher strain rate. It is indicated that the fracture mechanism of these CFI specimens is still fatigue-dominated, and the level of fatigue damage was enhanced under a higher strain rate.

3.2. Nanoindentation Characterization

Figure 6a,b shows the typical hardness-displacement (H-h) curves and corresponding elastic-modulus-displacement (E-h) curves for the CFI specimen, which was tested under the strain rate of 0.005 s−1. In both types of curves, the indentation size effects (ISE) are observed at depths below 200 nm. To avoid the influence of the ISE, the average values of hardness and elastic modulus measured at depths between 800 and 1000 nm were used in this work.
Figure 7a–d summarizes the distributions of hardness in the regions for the CFI-tested specimens subjected to the strain rates of 0.005, 0.002 and 0.0005 s−1, as well as the as-welded specimen. The boundaries of the BM, ICHAZ, FGHAZ, coarse-grained heat-affected zone (CGHAZ) and welded metal (WM) regions are labeled by red dotted lines in Figure 7a–d, and the fracture edges are also marked. It is worth noting that the fracture edges of all the specimens gradually move closer to the ICHAZ regions with decreasing strain rates. In the as-welded specimen, hardness is slightly reduced going from the BM to the FGHAZ, and it then increases sharply in the CGHAZ and WM regions, as shown in Figure 7a. For the CFI-tested specimens, which were subjected to the strain rate of 0.005 s−1, a fairly uniform reduction in the hardness from the fracture edge to the FGHAZ is observed, whereas the hardness values remain stable in the CGHAZ and WM regions, as plotted in Figure 7b. When the strain rate decreases to 0.002 s−1 or further reduces to 0.0005 s−1, the reductions in hardness of the ICHAZ, FGHAZ and WM regions become stabilized with the CFI-tested specimen under a higher strain rate. Interestingly, the hardness near the fracture edge is slightly higher than the BM, ICHAZ and FGHAZ of the CFI-tested specimen, which is subjected to a strain rate of 0.002 s−1. This phenomenon is more remarkable for the CFI-tested specimen under the strain rate of 0.0005 s−1. The elastic modulus data is presented in Figure 8a–d for the typical three CFI-tested specimens. In the as-welded specimen, the elastic modulus shows a slight decrease and then an increase from the BM to the WM. This behavior is due to the differences in chemical composition and thermal state (due to welding) between the heat-affected zone (HAZ) and the WM compared to the BM of P92 steel. During the long-term CFI test at elevated temperatures, the formation of precipitates [7] may have affected the local chemical composition (on the microscale), leading to changes in the elastic modulus.
Figure 9a provides the typical load-displacement curves from a representative region of the as-welded and CFI-tested specimens, which were subjected to the strain rate of 0.005 s−1. It is widely known that the mechanism of indentation deformation can be revealed by the value of strain rate sensitivity (SRS, m) [26,27,28]. A simplified method to estimate the value of m is used in this work as follows [29]:
m = ln H ˙ ln ε ˙ 2 Δ ln h Δ ln t creep = 2 ln h 2 / h 1 ln t 2 / t 1
where t1, t2 are the time at the beginning and end of the holding period during the holding stage, respectively. The parameters h1 and h2 are the corresponding displacements at the time of t1, t2, Δhcreep is the creep displacement in the creep time interval [t1, t2], and the Δtcreep is the certain creep time. From Equation (1), the average value of m with a certain time interval [t1, t2] could be estimated. Since the creep displacement at the primary creep stage can be slightly affected by the indenter overshoot, the m should be estimated at the secondary creep stage. In this work, the interval [t1, t2] was set at [400 s, 500 s] in the holding period.
Figure 10a–d shows the distribution of SRS (m) in all the regions of the as-welded specimen and three CFI-tested specimens. For the as-welded specimen, the values of m were in the range of 0.010 to 0.024, and the maximum value was found in the ICHAZ region. The relatively lower values of m were measured in the CGHAZ and WM regions. For the three CFI-tested specimens, the values of m were found to be slightly increased in all the regions, and the maximum value was also observed in the ICHAZ region. The value of m is strongly related to the thermal activation energy of dislocation, which can be defined as follows [30]:
m = k b T τ v
where kb is the Boltzmann constant, T is the absolute temperature, v is the thermal activation volume for dislocation nucleation and τ is the shear stress. In our previous study [31], the increase in m for the CFI-tested specimens could be related to the reduced dislocation density after the CFI test. As for the m value, if the difference is above an order of magnitude, it can be regarded as the transition in the deformation mechanism. In this work, the m value was consistently in the range of 0.1–0.3, which means that the deformation mechanism did not change after the CFI test.
Finally, it should be noted that the fracture mechanisms differ between high and low strain rates. As shown in Figure 7 and Figure 10, the hardness of the ICHAZ region (2.41–2.75 GPa) remains relatively stable compared to the BM region (2.35–3.24 GPa) under different strain rates. The higher hardness leads to greater fatigue load sensitivity. Therefore, the ICHAZ region exhibits more stable resistance to fatigue damage accumulation than the BM region. The higher initial hardness in the FGHAZ, CGHAZ, and WM regions is the primary factor that makes it more difficult for microcracks to initiate. Previous studies have shown that the ICHAZ region in 9% Cr steel welded joints contains equiaxed (sub)structures rather than martensitic lath structures [25]. It has been reported that these equiaxed (sub)structures remain unchanged under cyclic loading, leading to the insensitivity of the ICHAZ region to fatigue loads [32]. This suggests that the cyclic softening phenomenon in the ICHAZ region is less significant compared to that in other BM regions under fatigue loading. Due to the more unrecovered lath structures in the BM region, it inevitably undergoes more significant microstructural recovery, resulting in more severe fatigue damage accumulation [33]. The cyclic life decreases when the strain rate exceeds 0.002 s−1. Therefore, at the three specific strain rates (0.0005–0.005 s⁻1), all fractures occur in the BM region.
At lower strain rates (0.0005 s⁻1), the BM region exhibits relatively higher hardness (2.63–3.24 GPa) compared to higher strain rates (0.002 s⁻1–0.005 s⁻1), enhancing its sensitivity to fatigue load. It was found that reduced hardness depends on cyclic softening behaviors. At the low strain rate (0.0005 s⁻1), the creep damage is more severe, thus affecting the fracture behaviors, leading to a change in the dominant fracture mechanism from fatigue-dominated to creep-fatigue interaction. On the other hand, recrystallization (small grains were formed) is reported to be observed near the fracture edge of the creep-fatigue interactive failure [33]. Therefore, the hardness (Hall- Petch relation) was measured to be higher than that under other conditions at the lower strain rate (0.0005 s−1). As a result, the ICHAZ region is more prone to the formation of slip bands, leading to the generation of numerous surface microcracks. At a strain rate of 0.0005 s⁻1, the m-value in the ICHAZ region is 0.014–0.022, while in the BM region it is 0.013–0.016. Typically, a rapid decrease in dislocation density leads to a significant drop in deformation resistance [31,34], thereby initiating crack formation. It can be inferred that at lower strain rates (0.0005 s⁻1), the BM region exhibits stronger creep resistance compared to the ICHAZ region. Near the ICHAZ region, the nucleation of tiny creep cavities at PAGBs (prior austenite grain boundaries) further promotes the propagation of microcracks. Due to the microstructural evolution (lath structure recovery) in the BM region, leading to more severe fatigue damage accumulation, fracture eventually occurs near the ICHAZ region.
As for high strain rates (0.002 s⁻1–0.005 s⁻1), the sensitivity of the BM region to fatigue loads decreases compared to lower strain rates (0.0005 s⁻1). The m-value in the BM region (0.015–0.022) increases compared to that at lower strain rates (0.0005 s⁻1). At higher strain rates (0.002 s⁻1–0.005 s⁻1), the creep resistance of the BM region is weakened. During the hold phase of the CFI test, tiny creep cavities nucleate at PAGBs (prior austenite grain boundaries), leading to a decrease in local hardness and creep resistance, particularly in the BM region (Figure 7 and Figure 10) [35]. This phenomenon is more pronounced at higher strain rates. Ultimately, at high strain rates (0.002 s⁻1–0.005 s⁻1) under CFI loading, fracture occurs in the BM region.

4. Conclusions

This study aims to experimentally characterize the creep-fatigue (CFI) fracture mechanism of P92 steel welded joints. To achieve this goal, the hardness and elastic modulus of the CFI test specimen area and the welding area were measured. In addition, the strain rate sensitivity (m) of all regions was estimated from the creep test results of nanoindentation. The following conclusions can be drawn:
(1) Experimental results indicate that the cyclic life of the sample gradually increases with the increase of strain rate from 0.0005 to 0.005 s−1 and then slightly decreases with further increase of strain rate. It was found that the main cracks in all CFI test specimens started in the BM region, but as the strain rate decreased, their positions gradually approached the ICHAZ region.
(2) At higher strain rates (0.002 s⁻1–0.005 s⁻1), the BM region exhibits lower sensitivity to fatigue loads and reduced creep resistance, leading to the initiation of microcracks in the BM region, which eventually results in fracture. On the other hand, the accumulation of fatigue damage in the BM region further reduces its cyclic life under high strain rates (0.005 s⁻1).
(3) At lower strain rates (0.0005 s⁻1), recrystallization near the fracture edge results in higher measured hardness within the BM region. The increased sensitivity to fatigue loads and enhanced creep resistance in the BM region lead to the initiation of microcracks near the ICHAZ region, ultimately causing fracture to occur at a location close to the ICHAZ region.

Supplementary Materials

The following supporting information can be downloaded at: https://www.mdpi.com/article/10.3390/met15010053/s1, Figure S1. The fracture position of the CFI-tested specimens under strain rate of (a) 0.0005, (b) 0.0005 s−1.

Author Contributions

The manuscript was written with contributions from all authors. Investigation, Conceptualization, Methodology, Z.J.; Conceptualization, Funding acquisition, Project administration, Z.C.; Methodology, Investigation, X.G.; review and editing, Methodology, Investigation, Z.W.; review and editing, Investigation, Validation, Y.H.; review and editing, Methodology, Formal Analysis, T.Y.; Funding acquisition, Project administration, review and editing, Y.S.; review and editing, Funding acquisition, Z.G.; Investigation, Conceptualization, Methodology, review and editing, Funding acquisition, Z.Z. All authors have read and agreed to the published version of the manuscript.

Funding

This research was funded by the Natural Science Foundation of Zhejiang Province (LZ22E050004 and LQ24E050020), the National Natural Science Foundation of China (52305168) and the National Key R&D Program of China (2023YFC3010500), and the Wenzhou Basic Scientific Research Project (grant number G20240063).

Data Availability Statement

The original contributions presented in this study are included in the article. Further inquiries can be directed to the corresponding author.

Conflicts of Interest

Author Xuecheng Gu was employed by Hangzhou Steam Turbine Power Group Co., Ltd. The remaining authors declare that the research was conducted in the absence of any commercial or financial relationships that could be construed as a potential conflict of interest.

References

  1. Ni, J.Y.; Zhuang, X.C.; Wahab, M.A. Review on the Prediction of Residual Stress in Welded Steel Components. Comput. Mater. Contin. 2020, 62, 495–523. [Google Scholar] [CrossRef]
  2. Ni, J.; Vande Voorde, J.; Antonissen, J.; Wahab, M.A. Dependency of phase transformation on the prior austenite grain size and its influence on welding residual stress of S700 steel. Weld. World 2018, 62, 699–712. [Google Scholar] [CrossRef]
  3. Khan, M.S.; Lin, Z.H.; Lin, L.R.; Abid, M.; Ali, H.M.; Chen, C. Techno-economic analysis of solar-driven co-electrolysis for renewable methanol production using SOEC. Energ. Convers. Manag. 2024, 302, 118129. [Google Scholar] [CrossRef]
  4. Brinkman, C.; Alexander, D.; Maziasz, P. Modified 9Cr-1Mo Steel for Advanced Steam Generator Applications; Oak Ridge National Lab.(ORNL): Oak Ridge, TN, USA, 1990. [Google Scholar]
  5. Matsui, M.; Tabuchi, M.; Watanabe, T.; Kubo, K.; Kinugawa, J.; Abe, F. Degradation of creep strength in welded joint of 9% Cr steel. ISIJ Int. 2001, 41, S126–S130. [Google Scholar] [CrossRef]
  6. Albert, S.K.; Matsui, M.; Watanabe, T.; Hongo, H.; Kubo, K.; Tabuchi, M. Variation in the Type IV cracking behaviour of a high Cr steel weld with post weld heat treatment. Int. J. Pres. Ves. Pip. 2003, 80, 405–413. [Google Scholar] [CrossRef]
  7. Shang, C.; Wang, M.; Zhou, Z.; Yagi, K.; Lu, Y. The microstructure evolution and its effect on creep behaviors in P92 steel under different stresses. Mater. Charact. 2023, 198, 112744. [Google Scholar] [CrossRef]
  8. Veerababu, J.; Goyal, S.; Nagesha, A. Studies on creep-fatigue interaction behavior of Grade 92 steel and its weld joints. Int. J. Fatigue 2021, 149, 106307. [Google Scholar] [CrossRef]
  9. Liu, Z.; Gong, J.-G.; Zhao, P.; Zhang, X.-C.; Xuan, F.-Z. Creep-fatigue interaction and damage behavior in 9-12% Cr steel under stress-controlled cycling at elevated temperature: Effects of holding time and loading rate. Int. J. Fatigue 2022, 156, 106684. [Google Scholar] [CrossRef]
  10. Goswami, T. Low cycle fatigue—Dwell effects and damage mechanisms. Int. J. Fatigue 1999, 21, 55–76. [Google Scholar] [CrossRef]
  11. Zhang, X.C.; Tu, S.T.; Xuan, F.Z. Creep-fatigue endurance of 304 stainless steels. Theor. Appl. Fract. Mech. 2014, 71, 51–66. [Google Scholar] [CrossRef]
  12. Wang, X.; Zhang, W.; Zhang, T. A new empirical life prediction model for 9-12% Cr steels under low cycle fatigue and creep fatigue interaction loadings. Metals 2019, 9, 183. [Google Scholar] [CrossRef]
  13. Wang, X.W.; Zhang, W.; Gong, J.M.; Wahab, M.A. Low cycle fatigue and creep fatigue interaction behavior of 9Cr-0.5Mo-1.8W-V-Nb heat-resistant steel at high temperature. J. Nucl. Mater. 2018, 505, 73–84. [Google Scholar] [CrossRef]
  14. Mariappan, K.; Shankar, V.; Sandhya, R.; Bhaduri, A.K.; Laha, K. Comparative assessment of remnant tensile properties of modified 9Cr-1Mo steel under prior low cycle fatigue and creep-fatigue interaction loading. Int. J. Fatigue 2017, 103, 342–352. [Google Scholar] [CrossRef]
  15. Fischer, T.; Kuhn, B. Impact of frequency, hold time and atmosphere on creep-fatigue of a 9–12% Cr steel from 300° C–600° C. Int. J. Fatigue 2019, 124, 288–302. [Google Scholar] [CrossRef]
  16. Gao, Z.L.; Lu, C.Y.; He, Y.M.; Liu, R.; He, H.M.; Wang, W.Z.; Zheng, W.J.; Yang, J.G. Influence of phase transformation on the creep deformation mechanism of SA508 Gr.3 steel for nuclear reactor pressure vessels. J. Nucl. Mater. 2019, 519, 292–301. [Google Scholar] [CrossRef]
  17. Chen, X.; Yang, Z.Q.; Sokolov, M.A.; Erdman, D.L.; Mo, K.; Stubbins, J.F. Low cycle fatigue and creep-fatigue behavior of Ni-based alloy 230 at 850 °C. Mater. Sci. Eng. A 2013, 563, 152–162. [Google Scholar] [CrossRef]
  18. Wang, C.; Luo, T.J.; Yang, Y.S. Low cycle fatigue behavior of the extruded AZ80 magnesium alloy under different strain amplitudes and strain rates. J. Magnes. Alloy 2016, 4, 181–187. [Google Scholar] [CrossRef]
  19. Alsmadi, Z.Y.; Alomari, A.; Kumar, N.; Murty, K.L. Effect of hold time on high temperature creep-fatigue behavior of Fe-25Ni-20Cr (wt.%) austenitic stainless steel (Alloy 709). Mater. Sci. Eng. A 2020, 771, 138591. [Google Scholar] [CrossRef]
  20. Ma, Y.; Ye, J.H.; Peng, G.J.; Wen, D.H.; Zhang, T.H. Loading rate effect on the creep behavior of metallic glassy films and its correlation with the shear transformation zone. Mat. Sci. Eng. A 2015, 622, 76–81. [Google Scholar] [CrossRef]
  21. Zhang, T.H.; Ye, J.H.; Feng, Y.H.; Ma, Y. On the spherical nanoindentation creep of metallic glassy thin films at room temperature. Mater. Sci. Eng. A 2017, 685, 294–299. [Google Scholar] [CrossRef]
  22. Gopinath, K.; Gupta, R.K.; Sahu, J.K.; Ray, P.K.; Ghosh, R.N. Designing P92 grade martensitic steel header pipes against creep-fatigue interaction loading condition: Damage micromechanisms. Mater. Des. 2015, 86, 411–420. [Google Scholar] [CrossRef]
  23. Pandey, C.; Mahapatra, M.M.; Kumar, P.; Vidyrathy, R.S.; Srivastava, A. Microstructure-based assessment of creep rupture behaviour of cast-forged P91 steel. Mater. Sci. Eng. A 2017, 695, 291–301. [Google Scholar] [CrossRef]
  24. Wang, X.; Zhang, W.; Gong, J.; Jiang, Y. Experimental and numerical characterization of low cycle fatigue and creep fatigue behaviour of P92 steel welded joint. Fatigue Fract. Eng. Mater. Struct. 2018, 41, 611–624. [Google Scholar] [CrossRef]
  25. Song, Y.X.; Dai, Y.L.; Gao, Z.L.; Huang, H.D.; Chen, H.Y.; Ma, Y. Probing strain rate effect on the creep-fatigue fracture mechanism of 9%Cr steel-welded joint via nanoindentation characterization. Fatigue Fract. Eng. Mater. Struct. 2021, 44, 3320–3333. [Google Scholar] [CrossRef]
  26. Elmustafa, A.A.; Stone, D.S. Nanoindentation and the indentation size effect: Kinetics of deformation and strain gradient plasticity. J. Mech. Phys. Solids 2003, 51, 357–381. [Google Scholar] [CrossRef]
  27. Johnson, K.L. Contact Mechanics; Cambridge University Press: Cambridge, UK, 1987. [Google Scholar]
  28. Li, W.-B.; Henshall, J.; Hooper, R.; Easterling, K. The mechanisms of indentation creep. Acta Metall. Et Mater. 1991, 39, 3099–3110. [Google Scholar] [CrossRef]
  29. Alkorta, J.; Martínez-Esnaola, J.M.; Sevillano, J.G. Critical examination of strain-rate sensitivity measurement by nanoindentation methods: Application to severely deformed niobium. Acta Mater. 2008, 56, 884–893. [Google Scholar] [CrossRef]
  30. Wei, Q.; Cheng, S.; Ramesh, K.T.; Ma, E. Effect of nanocrystalline and ultrafine grain sizes on the strain rate sensitivity and activation volume: Fcc versus bcc metals. Mater. Sci. Eng. A 2004, 381, 71–79. [Google Scholar] [CrossRef]
  31. Song, Y.X.; Pan, Z.X.; Chen, J.N.; Qin, F.R.; Gao, Z.L.; Zhang, T.H.; Ma, Y. The effects of prior creep-fatigue on the strain rate sensitivity of a P92 welded joint. J. Mater. Sci. 2021, 56, 7111–7128. [Google Scholar] [CrossRef]
  32. Zhang, W.; Wang, X.; Kang, Z.; Zhang, T.; Jiang, Y.; Zhang, X.; Gong, J. Damage behaviour in different micro-regions of P92 steel weldment under sequential low cycle fatigue and creep loading. Eng. Fract. Mech. 2021, 254, 107935. [Google Scholar] [CrossRef]
  33. Wang, Q.; Cai, Y.; Liu, M.; Li, Q.; Pei, Y.; Zhang, H.; Wang, Q. The cyclic response behavior, failure mechanism, and life prediction model of 9% Cr-based steel under different strain ratios in the low cyclic fatigue regime at 430 °C. Fatigue Fract. Eng. Mater. Struct. 2023, 46, 4239–4253. [Google Scholar] [CrossRef]
  34. Zhang, W.; Wang, X.; Chen, H.; Zhang, T.; Gong, J. Evaluation of the effect of various prior creep-fatigue interaction damages on subsequent tensile and creep properties of 9% Cr steel. Int. J. Fatigue 2019, 125, 440–453. [Google Scholar] [CrossRef]
  35. Zhang, W.; Zhang, T.; Wang, X.; Chen, H.; Gong, J. Remaining creep properties and fracture behaviour of P92 steel welded joint under prior low cycle fatigue loading. J. Mater. Res. Technol. 2020, 9, 7887–7899. [Google Scholar] [CrossRef]
Figure 1. Schematic diagram of the experimental procedure.
Metals 15 00053 g001
Figure 2. (a) the average cyclic lives of the CFI-tested specimens with various strain rates, (b) the decay in peak tensile stress per cycle of the three typical CFI-tested specimens with the strain rates of 0.0005, 0.002 and 0.005 s−1 (their cyclic lives are similar with the average value). Reprinted from Ref. [25].
Metals 15 00053 g002
Figure 3. Using EBSD detection, the IPF maps of the typical CFI-tested specimens were subjected to the strain rates of (a) 0.005, (b) 0.002 and (c) 0.0005 s−1 by EBSD detection.
Metals 15 00053 g003
Figure 4. Using EBSD detection, the grain-size distributions of the typical CFI-tested specimens were subjected to the strain rates of (a) 0.005, (b) 0.002 and (c) 0.0005 s−1.
Metals 15 00053 g004
Figure 5. Fracture morphologies of the typical CFI specimens, which were subjected to the strain rates of (a) 0.005, (b) 0.002 and (c) 0.0005 s−1.
Metals 15 00053 g005
Figure 6. Using the CSM method, (a) hardness-displacement curves and (b) the corresponding elastic-modulus-displacement curves of typical regions in the welded joint under prior CFI loading with a strain rate of 0.005 s−1.
Metals 15 00053 g006
Figure 7. The hardness of the microregions in (a) as-welded and CFI-tested specimens subjected to the strain rates of (b) 0.005, (c) 0.002 and (d) 0.0005 s−1. (B-BM, I-ICHAZ, F-FGHAZ, C-CGHAZ and W-WM).
Metals 15 00053 g007
Figure 8. Elastic modulus of the microregions in (a) as-welded and CFI-tested specimens subjected to the strain rates of (b) 0.005, (c) 0.002 and (d) 0.0005 s−1. (B-BM, I-ICHAZ, F-FGHAZ, C-CGHAZ and W-WM).
Metals 15 00053 g008
Figure 9. (a) load-displacement curves and (b) representative creep curves in the typical regions of the as-welded P92 steel and the CFI-tested specimen under the strain rate of 0.005 s−1.
Metals 15 00053 g009
Figure 10. Strain rate sensitivity (SRS, m) of the corresponding regions in (a) as-welded and the CFI-tested specimens, which were subjected to the strain rates of (b) 0.005; (c) 0.002 and (d) 0.0005 s−1. (B-BM, I-ICHAZ, F-FGHAZ, C-CGHAZ and W-WM).
Metals 15 00053 g010
Table 1. Chemical composition of P92 steel and the welding consumable (wt. %).
ElementCSiMnNiCrMoPSNV
P920.1060.2350.3610.1089.2200.3740.0170.0080.0610.182
P92 wire0.0950.1500.6100.6808.3600.9400.0110.0070.0410.020
Table 2. Experimental CF test parameters and test results at 650 °C.
SpecimensStrain Rate (s− 1)Strain Amplitude
(%)
Holding Time (s)Life (Cycles)
HBI1180.00010.203001160
HBI121803
HBI1221431
HBI2180.00050.203001669
HBI209962
HBI2202068
HBI3180.0010.203001701
HBI319954
HBI3141415
HBI4180.0020.203002601
HBI4222904
HBI4281654
HBI5180.0050.203001463
HBI5091813
HBI5111002
Disclaimer/Publisher’s Note: The statements, opinions and data contained in all publications are solely those of the individual author(s) and contributor(s) and not of MDPI and/or the editor(s). MDPI and/or the editor(s) disclaim responsibility for any injury to people or property resulting from any ideas, methods, instructions or products referred to in the content.

