Article

Ni-Doped Activated Carbon from Invasive Plants as a Potential Catalyst

Faculty of Non-Ferrous Metals, AGH University of Krakow, Mickiewicz Avenue 30, 30-059 Krakow, Poland
*
Author to whom correspondence should be addressed.
Metals 2024, 14(7), 790; https://doi.org/10.3390/met14070790
Submission received: 31 May 2024 / Revised: 1 July 2024 / Accepted: 2 July 2024 / Published: 6 July 2024
(This article belongs to the Special Issue Advances in Nanostructured Metallic Materials)

Abstract

In this study we synthesized and characterized Ni/AC (Activated Carbon) systems. AC was obtained through pyrolysis of golden rod’s dried biomass. Ni nanoparticles were deposited on AC’s surface using a wet impregnation method from a nickel nitrate solution. SEM, MP-AES and DSC-TGA techniques were used for surficial and structural characterization, while ash content was made to check mineral ingredients input. The DSC-TGA study revealed that all carbons show good thermal stability up to 900 °C, which is far above operating temperatures in the methanation process. For all three carbons the BET isotherms were made as well. They show that in most cases the carbon’s surface is well developed and can adsorb decent amounts of metal. MP-AES helped to evaluate the efficiency of the impregnation process, which reached 76 mg of Ni per 1 g of carbon. The SEM-EDS study showed good distribution of Ni nanoparticles across AC’s surface. We also made a comparison of our systems to similar materials from other works.

1. Introduction

Nowadays, people are looking for recyclable, eco-friendly and multi-purpose materials, which would be applicable in many different fields of industry. A good example of such a material is activated carbon (AC), which is highly valued among scientists and industrial R&D workers [1,2,3]. This is mainly due to its high surface area, electric conductivity, thermal and chemical stability as well as porosity. AC also boasts an adjustable pore size distribution and the possibility of surface functionalization [4,5]. These features make it a versatile, multi-purpose material with a broad spectrum of possible applications.
Regarding the applications, AC can be used as an adsorbent, which is shown in a study made by Michałek et al. [6], describing an AC derived from cherry seeds through pyrolysis, applied for noble metal adsorption. Castro-Cardenas et al. [7] used a microwave hydrothermal carbonization technique to obtain activated carbon from invasive pleco fish biomass. Their material was further used for fluoride and cadmium ion adsorption from water. Another example of AC application for environmental protection is a biochar made by Sreńscek-Nazzal et al. [8] derived from banana peels activated with KOH and urea (nitrogen doping), which is capable of capturing CO2.
Biomass-based ACs can serve as a material for components of energy storage systems as well. Soursos et al. made an electrocatalyst for oxygen reduction reactions (ORR) and oxygen evolution reactions (OER) supported on corncob-based AC, which is an essential component of Zn-Air batteries. The carbon was obtained through pyrolysis in a partially oxidizing atmosphere (20% O2) and then activated with KOH at 850 °C [9]. Hydrothermal liquefaction is an AC synthetic method used by Asare et al. [10] to obtain activated carbon from algae. Their AC was further used as electrode material for supercapacitor construction. An interesting approach can be seen in a study published by Wang et al. [11], which considers enzyme treatment of walnut green husk to obtain activated carbon, further used for assembling a solid–solid phase-change material (SSCPM). Such a system is an example of a specific manner of solar–thermal energy utilization.
Carbons obtained from biomass can also serve as remarkable supports for catalysts, just like the material obtained by Yue et al. [12] from reed, which grows in sea or fresh waters. Through the pyrolysis of industrial organic residues, Mateus et al. [13] developed a series of M/AC-type catalysts for CO2 methanation by turning cork waste from the wine industry into activated carbon, which was further impregnated with Ni and Ce. For the same purpose the wheat straw-derived Ni/AC improved with CeO2 [14] or rice husk-derived Ni/AC doped with Mn can also be used [15]. We can see a similar approach in the case of other catalysts for CO2 methanation, such as Ce and Mg-promoted Ni catalysts supported on carbonized cellulose [16], as well as for Ni/Ce-AC catalyst supported on biochar made of pine sawdust [17]. Even low-grade coal [18] can be used as a starting material for AC production. Ni/AC nanomaterials are widely used for other catalytic processes, such as Chen et al.’s FENi electrocatalyst for oxygen evolution, supported on carbon nanotubes [19] or a similar system made by Wanga et al. [20] consisting of bimetallic phosphide on carbonaceous matrix, used for the same purpose as the previous one. Furthermore, Ren and Liu developed a catalyst for direct conversion of syngas into methane, which is based on nickel and supported on AC made from wheat straw [21]. Moreover, a NiFe/biochar catalyst synthesized by Gonzalez-Castano et al. [22] allows for synthetic production of natural gas ingredients. An interesting approach is shown in a study made by Lourenço et al. [23], which considers catalytic electrochemical reduction of CO2 to CO with the use of ZnO/biochar composites. In that case, the biochar was obtained through pyrolysis of chitosan and brewed coffee waste.
Quite unique nickel-based catalytic systems for methanation were developed by Quatorze et al. They used a carbon-ZrO2 nanocomposite as a support, while the “carbonic” part was assembled with functionalized activated carbon or carbon nanotubes. Such a combination is not only durable and resistant to sintering, but also provides an exceptionally high catalytic performance. Tests of the best variant, the Ni/CNT:ZrO2 (70:30), boast 85% conversion of CO2, its methane selectivity reaches 99.5% and the operating temperature is 370 °C. The system maintained stability during a 70 h test without any structural or chemical modifications [24]. To conclude, AC is a very valuable material that can be used not only in Ni-based catalysts but has a much broader spectrum of applications. It not only has many desirable features but can also be obtained in a cheap and eco-friendly way.
Although AC can be synthesized from various types of biomasses, plant material is the most commonly used type of biomass for its production. There are already commercially available activated carbons made of plant biomass, such as coconut shells [25], bamboo [26] or different types of wood [27,28]. Scientists would rather choose non-obvious starting materials for AC synthesis, but only a few studies consider golden rod as a plant of choice.
Golden rod is a 1.5–2 m tall weed-like plant with narrow leaves, a 6–8 mm thick, partially woodened stem and eye-catching yellow flowers. It is often spotted in meadows, near agricultural fields, in wastelands or at the sides of railroads. Due to its low ecological and economical value, vast regeneration capabilities, rapid growth [29] and expansive nature [30], golden rod is often considered as a pest plant [31,32]. These features make it a perfect starting material for obtaining activated carbon.

2. Materials and Methods

Activated carbon preparation: golden rod was collected from the suburban area of Jaworzno (Poland, Silesian Voivodeship), near Przemsza river at the beginning of November 2023. Leaves were separated from stems, which were cut into 2–3 cm long pieces. Both the leaf and stem pieces were dried for 1 month in a dry and warm environment. Then, leaves were crushed by hand (samples 2 and 2b; “b” is for “bis”) or ground in a mincer to a powder (sample 2p; “p” is for “powder”). Pyrolysis was performed in a tube furnace (Czylok, Jastrzębie-Zdrój, Poland) in a nitrogen (99.999% Air Liquide, Kraków, Poland) atmosphere (flow rate 10 mL/min.), with the temperature and time detailed in Table 1. Carbons 1, 2, 3, 4 and 5 were additionally ground in a mortar to fine powder (samples designated with letters “p” or “b” were not ground after pyrolysis).
Ni/AC catalysts preparation: 18.45 g of Ni(NO3)2·6H2O (WARCHEM, Zakręt, Poland) was dissolved in 1 L of distilled water to get 63 mM solution of Ni. Then, 1.5 g of carbon 1, 2, 2b, 2p and 5 were carried into glass bottles filled with 100 mL of previously made Ni solution, closed with screw tops and treated with ultrasounds for 10 min. In the next step, bottles with mixtures were put into the heated water bath with shaker (ELPIN, Lubawa, Poland) and the temperature was set to 80 °C. Samples were heated and shook for 2 h and then mixtures were filtered through small-pore filter on gravitational funnel. Subsequently, filtrate was collected and stored, while filters with impregnated biochar were put in beakers and dried at 105 °C for 2 days. After drying, impregnated charcoals were calcined in a tube furnace: starting temperature was 20–25 °C, heating rate of 10 °C/min., going up to 500 °C, hold for 3 h with nitrogen flow 10 mL/min. All samples were collected and stored in glass vials and then analyzed to find the connection between their preparation conditions and physicochemical properties.
DSC-TGA analysis: an assessment was performed for thermal stability. It was performed using a SDT Q.600 thermogravimeter (TA Instrument, New Castle, DE, USA). The measurement process occurred in Ar conditions and the gas flow was 100 mL/min.
MP-AES analysis: analysis was conducted to evaluate the effectiveness of Ni adsorption on the carbons’ surfaces. It was performed using an Agilent 4210 MP-AES (Santa Clara, CA, USA) analyzer. The first series was made to choose the carbon with the best adsorbing properties. Before measurement, the device was calibrated with the use of 1, 5, 10, 20 and 40 ppm Ni, as well as some other metals including V, Fe and Mo solutions in 1 M HNO3. Then, 1 mL of each filtrate (1, 2, 2b, 2p and 5) after impregnation (except the “W”, which was not used for impregnation and served as a benchmark) were transferred into vials and diluted according to sequence dilution method with ratios of 1:10 and 1:100 (which gave 15 research samples + benchmark—the “W”). In the second MP-AES study the Ni content was measured directly on impregnated carbon. It was done only for the 2p sample to provide more accurate data. Before solution preparation, 0.0405 g of Ni-impregnated 2p was leached in 50 mL of 1 M HCl in a microwave reactor Magnum II (Ertec, Wrocław, Poland). Heating time was set to 1 h, maximum pressure reached 45 bars and the minimum was 42 bars. Maximum temperature reached 240 °C, while its minimal value was 230 °C. After leaching, the solution was filtered gravitationally to remove the remains of carbon. Samples were prepared with the same method as for the first series of MP-AES studies, but the calibration was done with more standards: 5 ppm Sn in 1 M HCl; 5 ppm Ti, Si in H2O; 1 ppm As in HNO3; 5 ppm W in H2O; 1, 5 and 10 ppm SS IV in HNO3; 1, 5, 10 ppm V, Ni, Fe, Mo in 1 M HNO3.
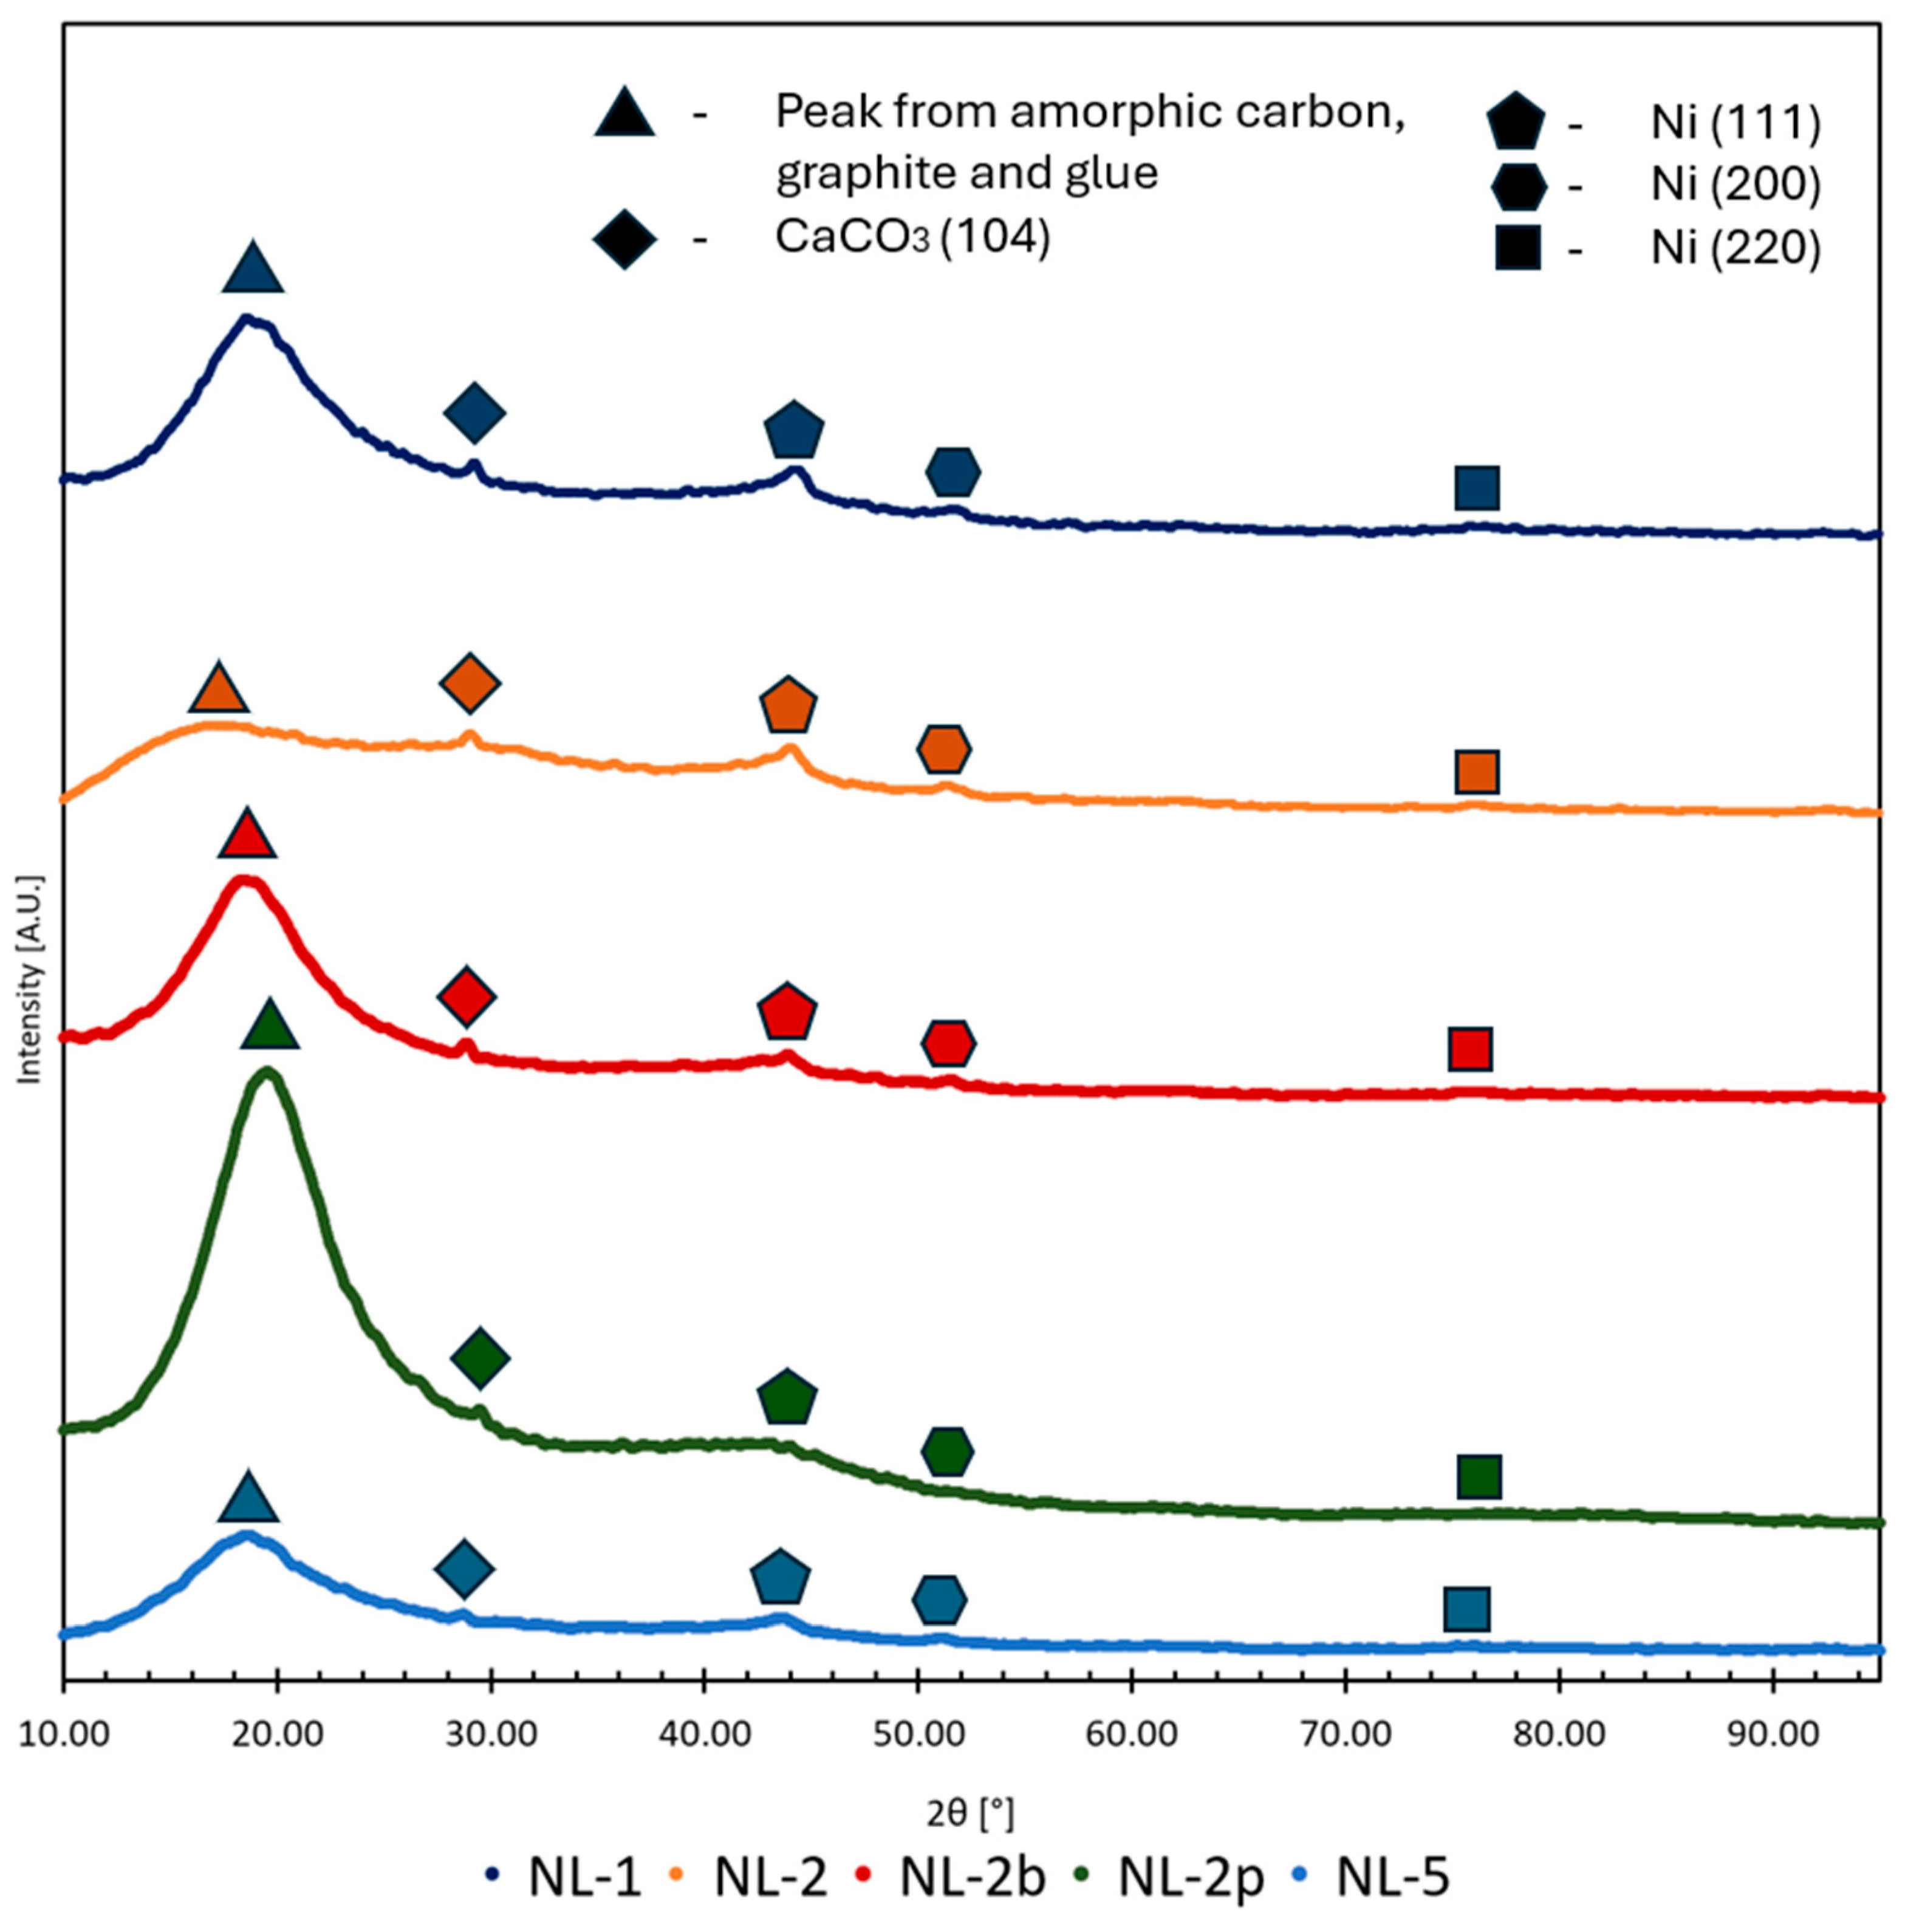
XRD analysis was conducted for verification of our material’s elemental composition. The experiment was performed with the Rigaku MiniFlex II Desktop Powder X-ray Diffractometer (Tokyo, Japan).
BET analysis was performed using a Micromeritics ASAP 2010 device (Norcross, GA, USA). Samples were degassed at 350 °C for 24 h. Measuring procedure started after reaching a 2.2 kPa. The temperature of a cell was maintained at 77.35 K. The break between measurements was 2 min.
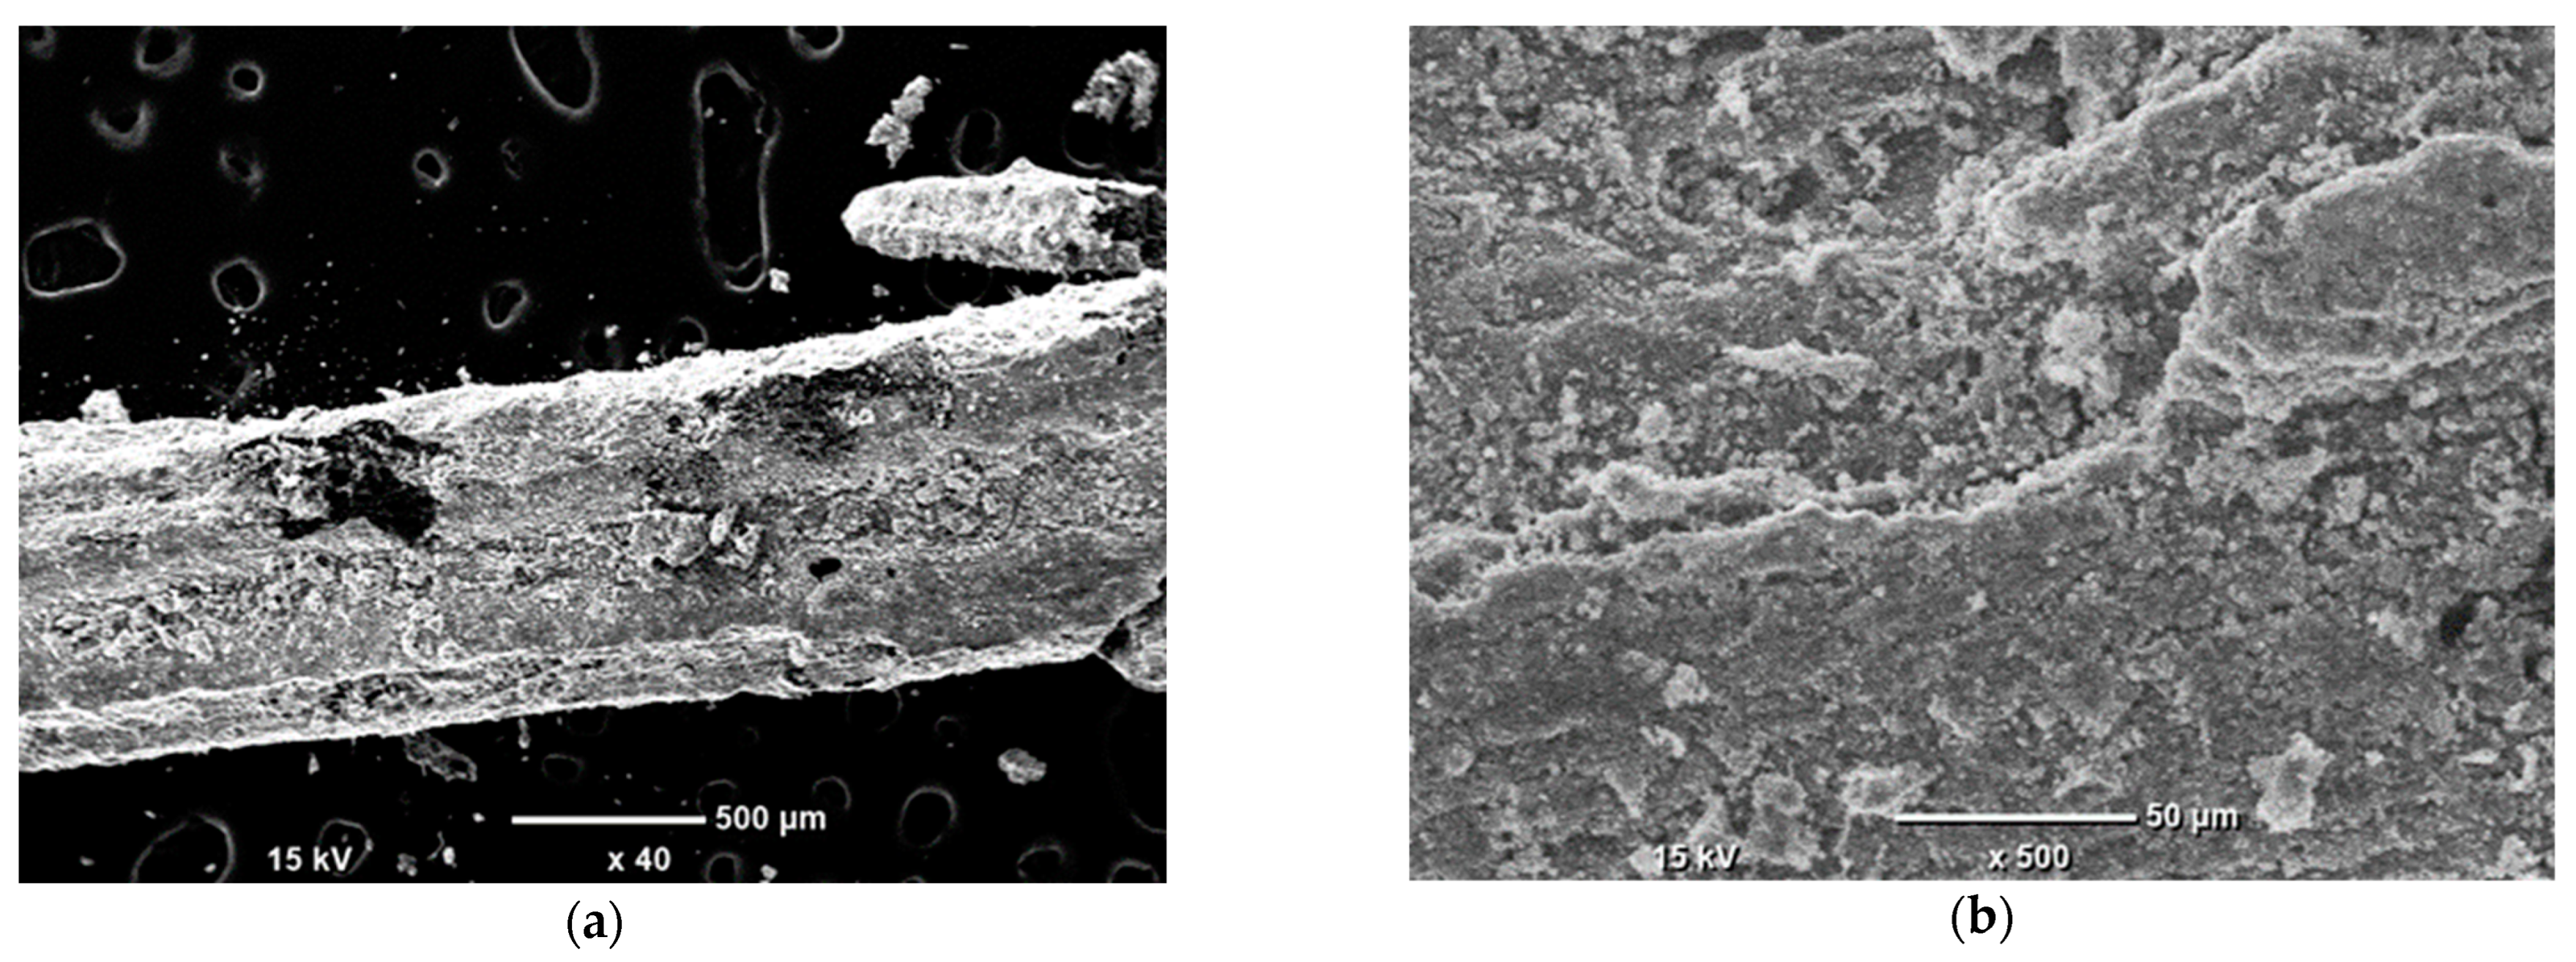
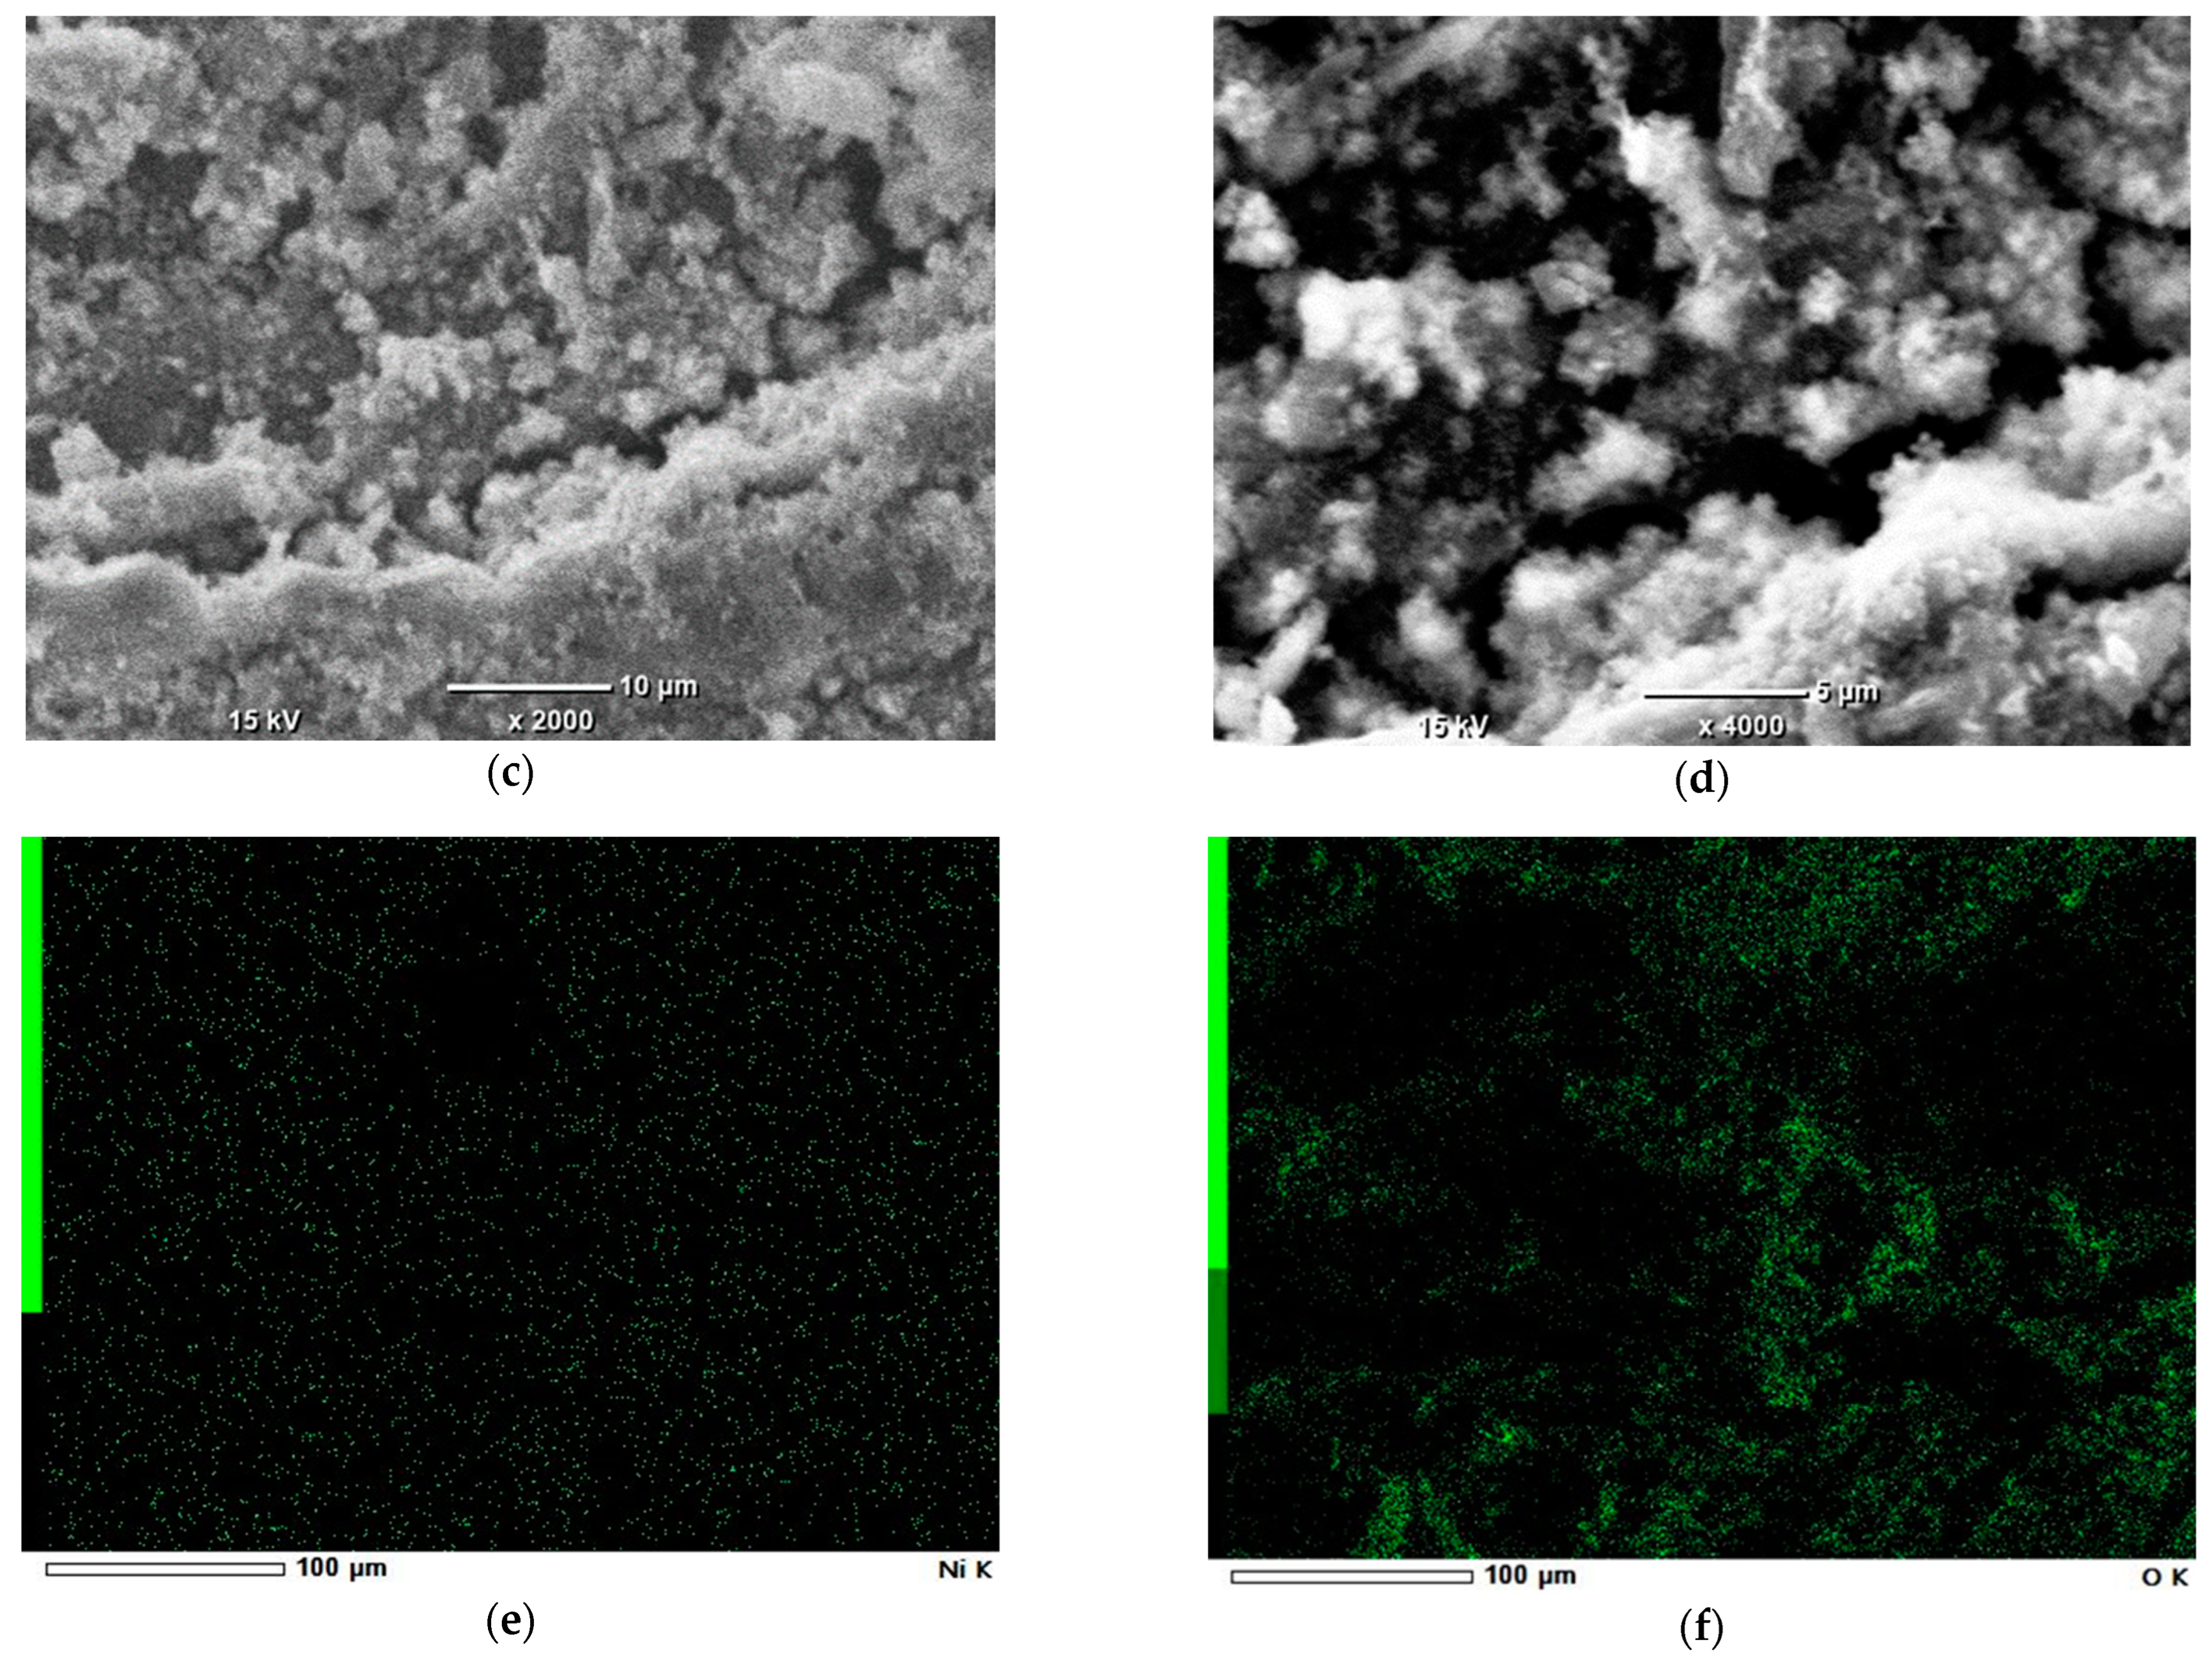
SEM-EDS study was done to observe the surficial structure of carbons and Ni nanoparticle distribution. The observation was conducted using a Scanning Electron Microscope JEOL-6000 Plus (Tokyo, Japan). Observations were made under a high vacuum, at a 10 kV accelerating voltage. The magnification range was from 40 to 4000 times. Observed grain of Ni impregnated on 2p carbon had the approx. size of 1 × 1 × 3 mm.
Ash content was measured to determine the level of mineralization during pyrolysis. Samples were burned in the same tube furnace as for pyrolysis, at the following parameters: 0 min. pre-hold, heating time 12 h, peak temperature 800 °C, hold time 0 min., inert cooling.

3. Results

3.1. BET Analysis

Making the adsorption–desorption plots (Figure 1a–d), we determined values of specific surface area (SSA) for our carbons.
We can see in Table 2 that the highest SSA value was obtained for sample 2b (700 °C, hold for 1 h), which was not ground before and after pyrolysis. Sample 5 (800 °C, hold for 2 h, ground after pyrolysis) had the second largest value of SSA, while the 2p (700 °C, hold for 1 h, ground before pyrolysis) sample had the third highest value. From this data we can conclude that the less damage was done to the structure of the carbon, the higher SSA value it has.

3.2. DSC-TGA Analysis

In DSC-TGA measurements we investigated energetic effects and sample mass reduction during heating. This allowed us to check a sample’s thermal stability and assess the pyrolysis effectiveness for each method.
In Figure 2a (carbon 1) we can observe the highest mass reduction (55%), which suggests that the mildest conditions of pyrolysis used in this study (600 °C, hold for 1 h) are not strong enough for decent decomposition of dried golden rod leaves. Better results (35%) occurred for sample 2 (Figure 2b), which was heated up to 700 °C and held for 1 h—these conditions are optimal among the tested parameters for pyrolysis of this material. The most intense mass reduction occurred for sample 3b (material not ground after pyrolysis) (Figure 2c). This suggests that the loose structure of this carbon has a positive influence on the speed of thermal decomposition. The least intensive mass changes were observed for sample 5 (Figure 2d), which was obtained in the most drastic conditions (800 °C, 2 h hold)—its mass reduction was 33%, but it was only 2% better than for sample 2. This means that using such high temperatures for 2 h is not necessary and causes only the waste of energy.

3.3. MP-AES Analysis

The MP-AES analysis was divided into two stages: in the first stage we measured the concentration of Ni which remained in solutions after AC impregnation. In the second stage we took a sample of Ni-impregnated carbon, leached it and directly measured the Ni content.
The first MP-AES study showed that the 2p can adsorb the highest amount of Ni among all five tested variants of carbon (Table 3)—the concentration of Ni in a filtrate after impregnation was the lowest for this sample. It may seem opposite to the results from BET study, which suggests that 2b should be the best adsorbent as it has the greatest specific surface area. However, such relations for Ni adsorbing capabilities may come from the larger number of specific functional groups on 2p’s surface. Their presence is probably connected to pre-treatment (grinding), which causes the reveal of certain structures that are covered in case of non-ground material. Looking at results of the second MP-AES analysis (Table 4), only Ca appears to occur in golden rod leaves in significant amount. The presence of this alkali metal is beneficial, because Ca atoms can act as basic centers that attract acidic CO2 particles to the catalyst’s surface during methanation and improve its performance.

3.4. Powder XRD Analysis

To confirm the results obtained during the MP-AES analysis, we performed the XRD scanning of our carbons, which lead to the following results.
In the study the following material data sheets were used: 00-001-1258 for Ni and 00-001-0837 for CaCO3. As we can see in Figure 3, there is a set of three peaks from Ni for each sample. Each peak corresponds to a different crystallographic direction of Ni crystals. A peak from CaCO3 is also visible and proves the presence of Ca in all samples, which corresponds to MP-AES results (Table 4), both for the experimental sample and the blind study. A peak near 29.28° corresponds to the calcite at a (104) crystallographic direction. CaCO3 was probably formed when the naturally occurring Ca in our material reacted with partially oxidized carbon on the sample’s surface. The peaks situated close to the angles 44.36°, 51.60° and 76.69° are from nickel ions orientated at (111), (200) and (220) crystallographic directions, respectively. Minor differences between peak location for each series probably come from slight differences in the amount of sample and from different glue layer thicknesses. The latter feature is also responsible for different sizes and location of peaks near the 20 angle °. Accurate quantitative analysis of minor phases is not possible due to the presence of the amorphous Ni phase and dominant carbon amorphous phase. However, we can make an assumption based on the peak from CaCO3, which is presuppositionally constant for each sample. In comparison to this signal, it is possible to estimate amorphous Ni content in each case. Considering that, we could get the highest Ni amount in the sample NL-2p, but we have to expect that in this sample we have a mix of crystalline and amorphous Ni as well. In the other samples, crystalline Ni content is higher than in NL-2p. We can conclude this from the shape of the peaks. Sharp and high peaks come from crystalline phases, while broad peaks come from amorphous phases.

3.5. SEM-EDS Study

SEM observations at different magnifications (Figure 4a–d) allowed us to look closer at carbon’s surface, while EDS attachment made it possible to check Ni particle distribution.
In the Figure 4e, we can observe that the surface of 2p’s grain is covered with small, well-scattered nanoparticles of nickel. Such a relation between size and displacement means that the catalyst has a large number of active sites, which should translate into high catalytic activity. Traces of oxygen (Figure 4f) can also be seen on 2p’s surface. The presence of this element comes from mineral ingredients such as metal oxides and salts, as well as remnants of organic compounds (carboxylic acids, alcohols and cellulose).

3.6. Ash Content

To determine the content of the mineral ingredients in the obtained carbons, we burned their samples and weighed the remaining ash.
According to Table 5, sample 5b has the highest ash content, which means that the starting material lost the largest portion of organic volatile compounds in the most drastic pyrolysis conditions (800 °C, 2 h hold). The second highest ash content was observed for sample 2b (700 °C, 1 h hold), not 3b (700 °C, 2 h hold). This result shows that longer hold time does not correspond to the level of mineralization. Temperature is the main factor determining the level of raw material decomposition and mineral compound content.

4. Discussion

In BET figures we can see the loops of hysteresis. Their presence means that the carbon’s surface has a certain amount of mesopores. This is beneficial from the catalytic point of view, as they provide a good spot for Ni adsorption, but are broad enough to allow free gases to flow during the methanation process. In DSC-TGA figures in each case there is a strong mass drop—this is due to evaporation of the water residues. From 200 to 600 °C there is another drop, which should be the result of cellulose and lignin decomposition. In the range of 600–900 °C the line changes its angle again—the residues of these compounds are evaporating. Sample 3b has the steepest line angle —because of its loose carbon structure its thermal decomposition goes at the fastest pace. As for MP-AES results, the lowest Ni content for carbon 1 comes from the mildest pyrolysis conditions, which means only partial decomposition and allows us to reveal only a part of the material’s functional groups. Moreover, grinding in mortar causes destruction of mesopores, which further reduces adsorption capacity. Relatively high values for the 2p, 2b and 5 samples are connected to more drastic pyrolysis conditions for “5” (800 °C, 2 h) and lack of carbon grinding after pyrolysis. Grinding the dried leaves before pyrolysis seems to provide the optimal fragmentation level. Combined with the pyrolysis method no 2 (700 °C, 1 h), such material preparation gives the best adsorption capacity among all tested variants. According to further MP-AES study and XRD analysis, the leaves of the collected golden rods contain no heavy metals, which is quite surprising considering their post-industrial origin area. SEM images show good Ni scattering and regular size of particles—this proves that the obtained carbon has a large number of functional groups, which are regularly placed along the grain’s surface. In terms of temperature, 700 °C seems to be an optimal temperature for carbon surface development. For better insight into our material’s properties, we compared it to a similar system from another study (see Table 6).
Golden rod leaves have almost five times less mineral ingredients than reed. Their volatile compound content is relatively similar, while golden rod has more fixed carbon, on the other hand. In total, 1g of reed-based carbon adsorbs 2 times more nickel and has 100 times larger SSA than carbon based on golden rod. However, when we correlate these two values, the results will show golden rod’s advantage: 1 m2 of 2p carbon adsorbs over 22 mg of Ni, while reed-based material does not adsorb even 1 mg of this metal. This may come from both species’ morphologies, which are strongly connected with the habitat in which they live. Reed, as a water plant, contains more moisture than dry ground-based golden rod. Thus, it contains fewer organic compounds—this means a larger SSA thanks to a looser structure but gives less functional groups (mostly obtained through lignin decomposition) per surface unit. The high amount of water in reed’s biomass is also the reason for its relatively low ash and fixed carbon content. In terms of surface development level, golden rod-based AC seems very underwhelming. Compared with commercial ACs obtained from plant materials, e.g., coconut shells and bamboo [33,34], for which SSA exceeds 1000 m2/g, the golden rod-based ACs do not seem to be noteworthy materials. However, we have to consider that the planned main purpose of these systems is as a gas phase reaction catalysis. Heterogenous catalysts do not need to contain a very high amount of catalytic metal. Far more important factors are the level of scattering and the size of its particles, as they determine the number of active sites per surface, which translates directly to a catalyst’s performance. Another important feature is ash content, as it determines the amount of inorganic compounds which can work as dopants (for example, alkali metals mentioned earlier). Humidity is also significant, as it has a certain influence on a catalyst’s thermal stability.
In Table 7 we can see that AC based on golden rod has humidity comparable to commercial catalysts. However, this material also contains a much higher amount of mineral ingredients, which suggests that it is a better candidate for catalyst support than commercially available carbons. To sum up, we assessed the parameters which are especially significant for catalytic applications and we obtained promising results (such as good nickel dispersion along the carbon’s surface, which translates to a large number of catalyst active sites). The starting material which we used for synthesis of activated carbon is special. Our golden rod biomass was collected from a post-industrial area. Because of that, the material contains a certain amount of alkali metals (Ca) and traces of light transition metals such as Fe, which are considered as dopants and can significantly improve catalytic performance, which will be tested in our next study.

5. Conclusions

Dried leaves from golden rods seem to be a good starting material to obtain activated carbon for catalytic applications. The best pyrolysis conditions tested in this study are a temperature of 700 °C maintained within 1 h. Additional fragmentation of dried leaves improves AC’s adsorption ability. Grinding of the obtained AC reduces its specific surface. Morevoer, 2p’s high adsorption capability probably comes from exposure of additional functional groups, which is the result of grinding (high structural fragmentation). This allows us to achieve a 76 mg Ni load per 1 g of carbon with good scattering and small particle sizes. Such results enable us to predict that materials synthesized within this study will serve as highly effective, cheap and eco-friendly catalysts for CO2 methanation. These predictions are going to be proven in our future work. Moreover, apart from reed, there are already confirmed and successful attempts of making catalysts for CO2 methanation from similar materials, for example wheat straw [36,37,38] or rice husks [15], which show high effectiveness in the spoken process. This allows us to expect just as good results for carbon based on golden rod.

Author Contributions

Conceptualization, P.Ż.; methodology, K.D.; validation, P.Ż.; formal analysis, P.Ż.; investigation, K.D.; resources, K.D.; data curation, K.W.; writing—original draft preparation, K.D.; writing—review and editing, P.Ż.; visualization, K.D.; supervision, K.D.; project administration, P.Ż.; funding acquisition, P.Ż. All authors have read and agreed to the published version of the manuscript.

Funding

This research received no external funding.

Data Availability Statement

The original contributions presented in the study are included in the article, further inquiries can be directed to the corresponding author.

Acknowledgments

BET study and porosity examination through adsorption methods were made by Kamil Kornaus in Departamental Laboratory of Microstructural study, KCiMO, WIMiC, AGH. Subsidy number: 16.16.160.557. DSC-TGA measurements were made by Stanisław Małecki in the Faculty of Non-ferrous Metals, AGH.

Conflicts of Interest

The authors declare no conflicts of interest.

References

  1. Chada, N.; Romanos, J.; Hilton, R.; Suppes, G.; Burress, J.; Pfeifer, P. Activated carbon monoliths for methane storage. Carbon 2012, 57, 2817–2825. [Google Scholar]
  2. Carroll, G.T.; Kirschman, D.L. A Peripherally Located Air Recirculation Device Containing an Activated Carbon Filter Reduces VOC Levels in a Simulated Operating Room. ACS Omega 2022, 7, 46640–46645. [Google Scholar] [CrossRef]
  3. Cataldi, P.; Lamanna, L.; Bertei, C.; Arena, F.; Rossi, P.; Liu, M.; Di Fonzo, F.; Papageorgiou, D.G.; Luzio, A.; Caironi, M. An Electrically Conductive Oleogel Paste for Edible Electronics. Adv. Funct. Mater. 2022, 32, 2113417. [Google Scholar] [CrossRef]
  4. Ternero-Hidalgo, J.J.; Rosas, J.M.; Palomo, J.; Valero-Romero, M.J.; Rodríguez-Mirasol, J.; Cordero, T. Functionalization of activated carbons by HNO3 treatment: Influence of phosphorus surface groups. Carbon 2016, 101, 409–419. [Google Scholar] [CrossRef]
  5. Azhagapillai, P.; Shoaibi, A.A.; Chandrasekar, S. Surface functionalization methodologies on activated carbons and their benzene adsorption. Carbon Lett. 2021, 31, 419–426. [Google Scholar] [CrossRef]
  6. Michałek, T.; Wojtaszek, K.; Małecki, S.; Kornaus, K.; Wandor, S.; Druciarek, J.; Fitzner, K.; Wojnicki, M. Recovery of Pd(II) Ions from Aqueous Solutions Using Activated Carbon Obtained in a Single-Stage Synthesis from Cherry Seeds. C 2023, 9, 46. [Google Scholar] [CrossRef]
  7. Castro-Cárdenas, M.; Medellín-Castillo, N.A.; González-Fernández, L.A.; Leyva-Ramos, R.; Gómez-Duran, C.F.A.; Gariepy, Y.; Pou, K.R.J.; Raghavan, V. Innovative Solution for Invasive Species and Water Pollution: Hydrochar Synthesis from Pleco Fish Biomass. Processes 2024, 12, 1158. [Google Scholar] [CrossRef]
  8. Sreńscek-Nazzal, J.; Kamińska, A.; Serafin, J.; Michalkiewicz, B. Chemical Activation of Banana Peel Waste-Derived Biochar Using KOH and Urea for CO2 Capture. Materials 2024, 17, 872. [Google Scholar] [CrossRef]
  9. Soursos, N.; Kottis, T.; Premeti, V.; Zafeiropoulos, J.; Govatsi, K.; Sygellou, L.; Vakros, J.; Manariotis, I.D.; Mantzavinos, D. Lianos, Study of the Suitability of Corncob Biochar as Electrocatalyst for Zn–Air Batteries. Batteries 2024, 10, 209. [Google Scholar] [CrossRef]
  10. Asare, K.; Mali, A.; Hasan, M.F.; Agbo, P.; Shahbazi, A.; Zhang, L. Algae Derived Carbon from Hydrothermal Liquefaction as Sustainable Carbon Electrode Material for Supercapacitor. C 2024, 10, 51. [Google Scholar] [CrossRef]
  11. Wang, Z.; Liu, L.; Cao, H. Multistage Porous Carbon Derived from Enzyme-Treated Waste Walnut Green Husk and Polyethylene Glycol for Phase Change Energy Storage. Materials 2024, 17, 1379. [Google Scholar] [CrossRef]
  12. Yue, X.; Chen, D.; Luo, J.; Huang, Z.; Hong, L.; Hu, Y. Direct synthesis of methane-rich gas from reed biomass pyrolysis volatiles over its biochar-supported Ni catalysts. Biomass Bioenergy 2021, 154, 106250. [Google Scholar] [CrossRef]
  13. Mateus, F.; Teixeira, P.; Lopes, J.M.; Henriques, C.; Bacariza, C. CO2 Methanation on Ni Catalysts Supported over Activated Carbons Derived from Cork Waste. Energ. Fuel 2023, 37, 8552–8562. [Google Scholar] [CrossRef]
  14. Tang, M.; Gamal, A.; Bhakta, A.K.; Jlassi, K.; Abdullah, A.M.; Chehimi, M.M. Carbon Dioxide Methanation Enabled by Biochar Nanocatalyst Composite Materials: A Mini-Review. Catalysts 2024, 14, 155. [Google Scholar] [CrossRef]
  15. Chernyak, S.; Rodin, V.; Novotortsev, R.; Kaplin, I.; Maslakov, K.; Savilov, S. Family of biomass-derived Ni and Ni–Mn catalysts of CO2 methanation. Catal. Today 2023, 424, 113846. [Google Scholar] [CrossRef]
  16. Tarifa, P.; Megias-Sayago, C.; Cazana, F.; Gonzalez-Martin, M.; Latorre, N.; Romeo, E.; Delgado, J.J.; Monzon, A. Highly Active Ce- and Mg-Promoted Ni Catalysts Supported on Cellulose-Derived Carbon for Low-Temperature CO2 Methanation. Energ. Fuel 2021, 35, 17212–17224. [Google Scholar] [CrossRef]
  17. Wang, X.; Yang, M.; Zhu, X.; Zhu, L.; Wang, S. Experimental study and life cycle assessment of CO2 methanation over biochar supported catalysts. Appl. Energ. 2020, 280, 115919. [Google Scholar] [CrossRef]
  18. Kim, S.; Yang, Y.; Lippi, R.; Choi, H.; Kim, S.; Chun, D.; Im, H.; Lee, S.; Yoo, J. Low-Rank Coal Supported Ni Catalysts for CO2 Methanation. Energies 2021, 14, 2040. [Google Scholar] [CrossRef]
  19. Chen, D.; Sun, Q.; Han, C.; Guo, Y.; Huang, Q.; Goddard, W.A.; Qian, J. Enhanced oxygen evolution catalyzed by in situ formed Fe-doped Ni oxyhydroxides in carbon nanotubes. J. Mater. Chem. A 2022, 10, 16007–16015. [Google Scholar] [CrossRef]
  20. Wanga, X.; Chai, L.; Ding, J.; Zhong, L.; Du, Y.; Li, T.-T.; Hu, Y.; Qian, J.; Huang, S. Chemical and morphological transformation of MOF-derived bimetallic phosphide for efficient oxygen evolution. Nano Energy 2019, 62, 745–753. [Google Scholar] [CrossRef]
  21. Ren, J.; Liu, Y.-L. Direct Conversion of Syngas Produced from Steam Reforming of Toluene into Methane over a Ni/Biochar Catalyst. Sustain. Chem. Eng. 2021, 9, 11212–11222. [Google Scholar] [CrossRef]
  22. Gonzalez-Castano, M.; Morales, C.; Navarro de Miguel, J.C.; Boelte, J.H.; Klepel, O.; Flege, J.I.; Arellano-García, H. Are Ni/ and Ni5Fe1/biochar catalysts suitable for synthetic natural gas production? A comparison with g-Al2O3 supported catalysts. Green Energy Environ. 2023, 8, 744–756. [Google Scholar] [CrossRef]
  23. Lourenco, M.A.O.; Zeng, J.; Jagdale, P.; Castellino, M.; Sacco, A.; Farkhondehfal, M.A.; Pirri, C.F. Biochar/Zinc Oxide Composites as Effective Catalysts for Electrochemical CO2 Reduction. ACS Sustain. Chem. Eng. 2021, 9, 5445–5453. [Google Scholar] [CrossRef]
  24. Patel, M.R.; Rathore, N.; Panwar, N.L. Infuences of biochar in biomethanation and CO2 mitigation potential. Biomass Convers. Bior. 2021. [Google Scholar] [CrossRef]
  25. Quatorze, I.F.; Gonçalves, L.P.L.; Kolenko, Y.V.; Soares, O.S.G.P.; Pereira, M.F.R. CO2 methanation over Ni supported on Carbon–ZrO2: An optimization of the composite composition. Catal. Today 2023, 422, 114215. [Google Scholar] [CrossRef]
  26. Available online: https://www.zhongjucarbon.com/?ActivatedcarbonBymaterials/69.html (accessed on 20 June 2024).
  27. Available online: https://www.walmart.com/ip/Activated-bamboo-charcoal-powder-organic-all-natural-raw-material-16-oz/506012265 (accessed on 20 June 2024).
  28. Available online: https://globaladsorbents.com/wood_based_activated_carbon.php (accessed on 20 June 2024).
  29. Available online: https://micbacindia.com/wood-powdered-activated-carbon (accessed on 20 June 2024).
  30. Jakobs, G.; Weber, E.; Edwards, P.J. Introduced plants of the invasive Solidago gigantea (Asteraceae) are larger and grow denser than conspecifics in the native range. Divers. Distrib. 2004, 10, 11–19. [Google Scholar] [CrossRef]
  31. Pal, R.W.; Chen, S.; Nagy, D.U.; Callaway, R.M. Impacts of Solidago gigantea on other species at home and away. Biol. Invasions 2015, 17, 3317–3325. [Google Scholar] [CrossRef]
  32. Weber, E.; Jakobs, G. Biological flora of central Europe: Solidago gigantea Aiton. Flora-Morphol. Distrib. Funct. Ecol. Plants 2004, 200, 109–118. [Google Scholar] [CrossRef]
  33. Available online: https://www.kelincarbon.com/Coconut-Shell-Activated-Carbon.html?gad_source=1&gclid=EAIaIQobChMIz4aPkaGzhgMVVReiAx0aSwB5EAAYASAAEgJeh_D_BwE#?campaignid=16352309682&adgroupid=128874577810&feeditemid=&targetid=kwd-717188027981&device=c&creative=583634453642&keyword=activatedcarbon (accessed on 29 May 2024).
  34. Available online: https://www.allcarbon.com.cn/bamboo-based-activated-carbon (accessed on 29 May 2024).
  35. Available online: https://www.kelincarbon.com/Coal-based-granular-activated-carbon.html (accessed on 24 June 2024).
  36. Di Stasi, C.; Cortese, M.; Greco, G.; Renda, S.; Gonzalez, B.; Palma, V.; Manya, J.J. Optimization of the operating conditions for steam reforming of slow pyrolysis oil over an activated biochar-supported NiCo catalyst. Int. J. Hydrogen Energy 2021, 46, 26915–26929. [Google Scholar] [CrossRef]
  37. Renda, S.; Di Stasi, C.; Manya, J.J.; Palma, V. Biochar as support in catalytic CO2 methanation: Enhancing effect of CeO2 addition. J. CO2 Util. 2021, 53, 101740. [Google Scholar] [CrossRef]
  38. Di Stasi, C.; Renda, S.; Greco, G.; González, B.; Palma, V.; Manyà, J.J. Wheat-Straw-Derived Activated Biochar as a Renewable Support of Ni-CeO2 Catalysts for CO2 Methanation. Sustainability 2021, 13, 8939. [Google Scholar] [CrossRef]
Figure 1. BET surface area plots for carbons 2b (a), 2 (b), 2p (c) and 5 (d).
Metals 14 00790 g001aMetals 14 00790 g001b
Figure 2. DSC-TGA plots for carbon 1 (a), 2 (b), 3b (c) and 5 (d).
Metals 14 00790 g002
Figure 3. XRD plot for all five carbon samples with a designation and description of all observed peaks.
Metals 14 00790 g003
Figure 4. SEM photographs of a single Ni/2p grain at different magnifications (panels (ad)). Panels e and f show the displacement of Ni (e) and O (f) deposits.
Metals 14 00790 g004aMetals 14 00790 g004b
Table 1. Pyrolysis parameters.
Sample NumberTemperature [°C]Hold Time [hours]
16001
1b6001
27001
2b7001
2p7001
2s7001
3b7002
48001
58002
5b8002
Table 2. Values of specific surface area for samples 1, 2, 2b, 2p and 5.
Number of SampleSpecific Surface Area [m2/g]
10.8224
20.3067
2b4.3622
2p3.4016
52.9933
Table 3. Ni concentration in filtrates after impregnation of charcoals with a 63 mM (3035 ppm) solution of Ni(NO3)2·6H2O. The “W” sample is an internal standard (a part of starting Ni solution, which was not used for AC impregnation) and represents max possible value.
Filtrate NumberNi Concentration in Filtrate after Impregnation [ppm]Amount of Ni per 1 g of Carbon [mg/g]Amount of Ni per 1 m2 of Carbon’s Specific Surface [mg/m2]
W 303500
123644555
2228550163
2b19807016
2p19017622
519497224
Table 4. Concentration of Ni and other metals in a filtrate collected after dissolving 0.0405 g of Ni-impregnated 2p carbon in 50 mL of 1 M HCl compared with the blind study.
Ni/2p
Ni [ppm]Ni amount per 1 g of 2p carbon [mg]Fe [ppm]Ca [ppm]Cu [ppm]Mn [ppm]Al [ppm]
31770.2110.20.10.3
2p carbon (not impregnated)
Ni [ppm]Ni amount per 1 g of 2p carbon [mg]Fe [ppm]Ca [ppm]Cu [ppm]Mn [ppm]Al [ppm]
0.10.20.219000.2
Table 5. Masses of carbons (1b,2b,3b and 5b) and their ashes with respective ash content.
Sample Name1b2b3b5b
Carbon mass [g]0.29150.16670.79600.4696
Ash mass [g]0.08650.04950.22390.1461
Ash content29.67%29.69%28.13%31.11%
Table 6. Comparison of two Ni-impregnated activated carbons derived from different plants: the 2p from this study and the reed-based FWB700 catalyst, adapted from Ref. [12].
Parameter/CarbonNi/2p (Golden Rod)FWB700 (Reed)
Ash [%]29.696.24
Volatile compounds [%]7279
Fixed carbon [%]19.614.4
Ni mass per 1 g of carbon [mg]76155
Specific surface area [m2/g]3.40355.49
Ni mass per surface unit [mg/m2]22.40.4
Table 7. Comparison of humidity and ash content from ACs made of different materials by different manufacturers.
ManufacturerAll Carbon [34]Zhongju Carbon [26]Kelin Carbon [35]Zhongju Carbon [26]2p Carbon
Starting materialBambooCoconut shellAnthraciteWoodGolden rod
Humidity [%]<15<5<5≤10<5
Ash content [%]<15<3<10≤10–15~30
Disclaimer/Publisher’s Note: The statements, opinions and data contained in all publications are solely those of the individual author(s) and contributor(s) and not of MDPI and/or the editor(s). MDPI and/or the editor(s) disclaim responsibility for any injury to people or property resulting from any ideas, methods, instructions or products referred to in the content.

