Abstract
Submerged entry nozzle (SEN) clogging will affect the production efficiency and product quality in the continuous casting process. In this work, the transient SEN clogging model is developed by coupling the porous media model defined by the user-defined function (UDF) and the discrete phase model (DPM). The effects of the transient SEN clogging process on the flow field, the distribution of argon gas bubbles and the fluctuation of the interface between steel and slag in the concave bottom SEN in the continuous casting slab mold with a cross-section of 1500 mm × 230 mm are studied by coupling transient SEN clogging model, DPM and volume of fluid (VOF) model. The results show that the actual morphology and thicknesses of SEN clogging are in good agreement with the numerical simulation results. The measurement result of the surface velocity is consistent with the numerical simulation result. With increasing the simulation time, the degree of SEN clogging increases. The flow velocities of molten steel flowing from the outlet of the side hole increase, because the flow space is occupied with the clogging inclusions, which leads to the increased number of argon gas bubbles near the narrow wall. The steel–slag interface fluctuation near the narrow walls also increases, resulting in the increased risk of slag entrapment.
1. Introduction
The submerged entry nozzle (SEN) is an important consumable material in the process of continuous casting. During the continuous casting production process, the inner wall of the SEN is gradually clogged with non-metallic inclusions, which seriously affect the service life of the SEN. SEN clogging not only leads to the replacement of the SEN but also has a great impact on the flow field of the mold [1,2], slag entrapment [3,4,5], removal of inclusions, heat transfer and solidification of molten steel [2,6,7], thus resulting in the deterioration of the surface quality of slab. Therefore, it is of great industrial value to study the clogging mechanism to delay the clogging process and prolong the service time of the nozzle. The main mechanisms of the SEN clogging include the reaction of molten steel with refractory material, the deposition of non-metallic inclusions on the inner wall of SEN and the solidification of molten steel. The previous works showed that the deposition of the inclusions on the inner wall of the SEN is one of the main reasons for clogging [8,9,10,11]. The main works on SEN clogging mainly focus on the analysis of the compositions of clogging materials and the clogging mechanism [12,13]. There are few numerical models of SEN clogging that can be used to simulate the industrial clogging process of SEN. It is desirable to develop a mathematical model to simulate the SEN clogging process and to describe the transient changing behavior of SEN clogging processes, which is difficult to obtain from experimental observations.
There are two main methods to simulate the SEN clogging behavior: physical modeling and mathematical modeling. Some researchers used the water model to simulate the flow field of molten steel in the mold after the nozzle is clogged, showing that when the nozzle is seriously clogged, the proportion of meniscus fluctuation greater than 3 mm increases from 4.7% to 10.6% and the amount of slag entrapment increases by 1.6 times [5]. Srinivas [4] used the water model experiment to simulate the SEN clogging by changing the nozzle structure and studied the eddy current change near the SEN in the mold when the nozzle was clogged. He found that when the degree of SEN clogging and water flow rate are higher, the rotational speed of the eddy current is higher and the life of the eddy current is longer. Li [3] studied the effect of SEN clogging on the flow field and slag entrapment in the mold using water and oil to simulate molten steel and slag, and the clogging was simulated by gluing different sizes of plexiglass particles to the inner walls of SEN. He showed that the flow field in mold changes from symmetrical double circulation flow to asymmetric flow with increasing clogging degree in the nozzle. The occurrence ratio of slag entrapment increases with the increase in clogging rate. When the clogging rate is large, the oil layer is pushed near the SEN, and the water near the narrow face is exposed to the air. Hua [14] observed the clogging nozzle through anatomy and divided the clogging into tubular clogging with a relatively uniform thickness distribution and hemispheric clogging with a sudden local increase in thickness. A water model was used to simulate these two situations and the effects of these two types of clogging on the flow field were studied. When a hemispherical clogging sticks to the side holes of SEN, the molten steel jet will be deflected to the non-clogged side. An increase in the thickness of the clogging layer leads to an increase in the magnitude of the jet velocity of molten steel near the outlet of SEN. Li [15] used a mercury model combined with electromagnetic stirring methods to study the effect of electromagnetic stirring on the flow field of the mold with the SEN clogging. He concluded that electromagnetic stirring technology can improve asymmetric flow in the mold caused by the SEN clogging.
As for the numerical simulation of SEN clogging, most works studied the changes in the flow field and slag layer in the mold after SEN clogging to a certain extent by directly changing the nozzle structure. Srinivas [16] used numerical simulation to study the change in eddy current in the mold under different degrees of clogging by changing one side hole geometric structure of the SEN. It is indicated that the eddy current increases with the increase in the degree of SEN clogging. Zhang [7] used numerical simulation to study the effects of SEN clogging on the flow field, fluctuation of the interface between steel and slag, movement of inclusions and distribution of temperature in the mold by changing of geometric structure of the SEN. After the nozzle is clogged, the large-sized inclusions are easy to be entrained from the slag layer into the molten steel. The SEN clogging will produce an asymmetric temperature distribution in the mold. Li [17] directly used the changed geometric structure of the SEN to simulate SEN clogging and studied the effect of electromagnetic stirring on the flow field of the mold with the SEN clogging. The electromagnetic stirring technology can improve asymmetric flow caused by SEN clogging, but it cannot completely eliminate it.
Some researchers developed mathematical models of the transient SEN clogging process. Hua [2,18] developed a transient SEN clogging model in the mold under the Euler–Lagrange framework and studied the growth process of the transient SEN clogging in the convex-bottom nozzle and the effect of the transient SEN clogging process on the flow field of the mold with the straight-through SEN. He showed that in the SEN with a convex bottom, the clogging first forms at the bottom of the SEN. With the increase in the clogging time, the flow velocity of the molten steel in the SEN increases. In the straight-through SEN, the internal shape of the SEN changes due to the SEN clogging, which will cause the jet flow from the outlet of SEN to disperse. With the increase in the clogging time, the impact depth of the jet decreases and more inclusions are captured by the solidified shell. Vakhrushev [19] conducted a two-dimensional simulation of SEN clogging and studied the influence of SEN clogging on the flow of molten steel, temperature field distribution, and solidification and remelting of molten steel in the mold.
The transient clogging model of SEN in the continuous casting process is mainly applied to straight-through SEN [2,14,20,21] and convex-bottom SEN [18]. In our previous work, the transient SEN clogging models under Euler–Lagrange and Euler–Euler frameworks for the convex-bottom nozzle were developed [22]. However, the transient SEN clogging process in the SEN with a concave bottom and the effects of transient SEN clogging on the flow field, movement of argon gas bubble and the fluctuation of the interface between steel and slag in the mold have not been studied yet. In the present work, the four phases of molten steel, inclusions, argon gas bubbles and slag are taken into consideration. The transient SEN clogging model is developed by coupling the porous media model defined by the user-defined function (UDF) with the discrete phase model (DPM) (non-metallic inclusions). The processes of transport, deposition, adhesion and clogging growth of non-metallic inclusions onto the inner wall of SEN are considered in the transient SEN clogging model. The DPM with two-way coupling is also used for argon gas bubbles to realize the interaction between molten steel and argon gas bubbles. The volume of fluid (VOF) model is used to track the interface between steel and slag to reveal the effect of SEN clogging on the mold flow field and the fluctuation of the interface between steel and slag. The transient process of clogging of the concave bottom SEN in the continuous casting mold with a cross-section of 1500 mm × 230 mm is simulated to study the effects of the transient SEN clogging process on the flow field, the transport of argon gas bubbles and the fluctuation of the interface between steel and slag. The accuracy of the transient SEN clogging model is verified with the morphology and thicknesses of the actual SEN clogging, and the simulation result of the mold flow field is also verified with the high-temperature quantitative measurement velocity of molten steel near the mold surface in the late stage of clogging.
2. High-Temperature Velocity Measurement
It is very difficult to measure the high-temperature flow velocity of molten steel. The rod deflection method was developed in our previous work for quantitative measurement of the velocity of molten steel near the mold surface. The flow velocity measurement device is composed of a measuring rod, deflection bearing, deflection angle indicator plate, deflection pointer and balance block. After the velocity measurement rod is inserted into the molten steel, it will deflect under the impact of the molten steel movement. After the deflection angle is stable the deflection angle is measured. The surface velocity of molten steel can be calculated through the relationship with the deflection angle, and the detailed method can refer to our previous research [23].
3. Mathematical Model
The mathematical model was solved by using the commercial CFD software Ansys Fluent 2021 R1, and simulations were conducted on a Windows 10 server equipped with one AMD 7702 core. In order to simplify the mathematical model, the following assumptions are made in this work: (1) molten steel and mold slag are considered to be uniform and incompressible Newtonian fluids; (2) the effect of the temperature field and chemical reactions in the mold is not considered; (3) the argon gas bubbles are regarded as spherical particles and coalescence and breakup of argon gas bubbles are not considered; (4) the liquid mold flux is only considered and the influence of the solid mold flux powder is ignored; (5) the effect of solidified shell is ignored; (6) the effects of mold vibration and mold taper are ignored; (7) the non-metallic inclusions are regarded as spherical particles with the equal diameter, without clustering; (8) when the non-metallic inclusions are in contact with the inner wall of the nozzle and the flow velocity of the molten steel in the grid cell is less than 0.6 m/s, the non-metallic inclusions particles are adhered to the wall of the nozzle [18,24].
3.1. Model Parameters and Boundary Conditions
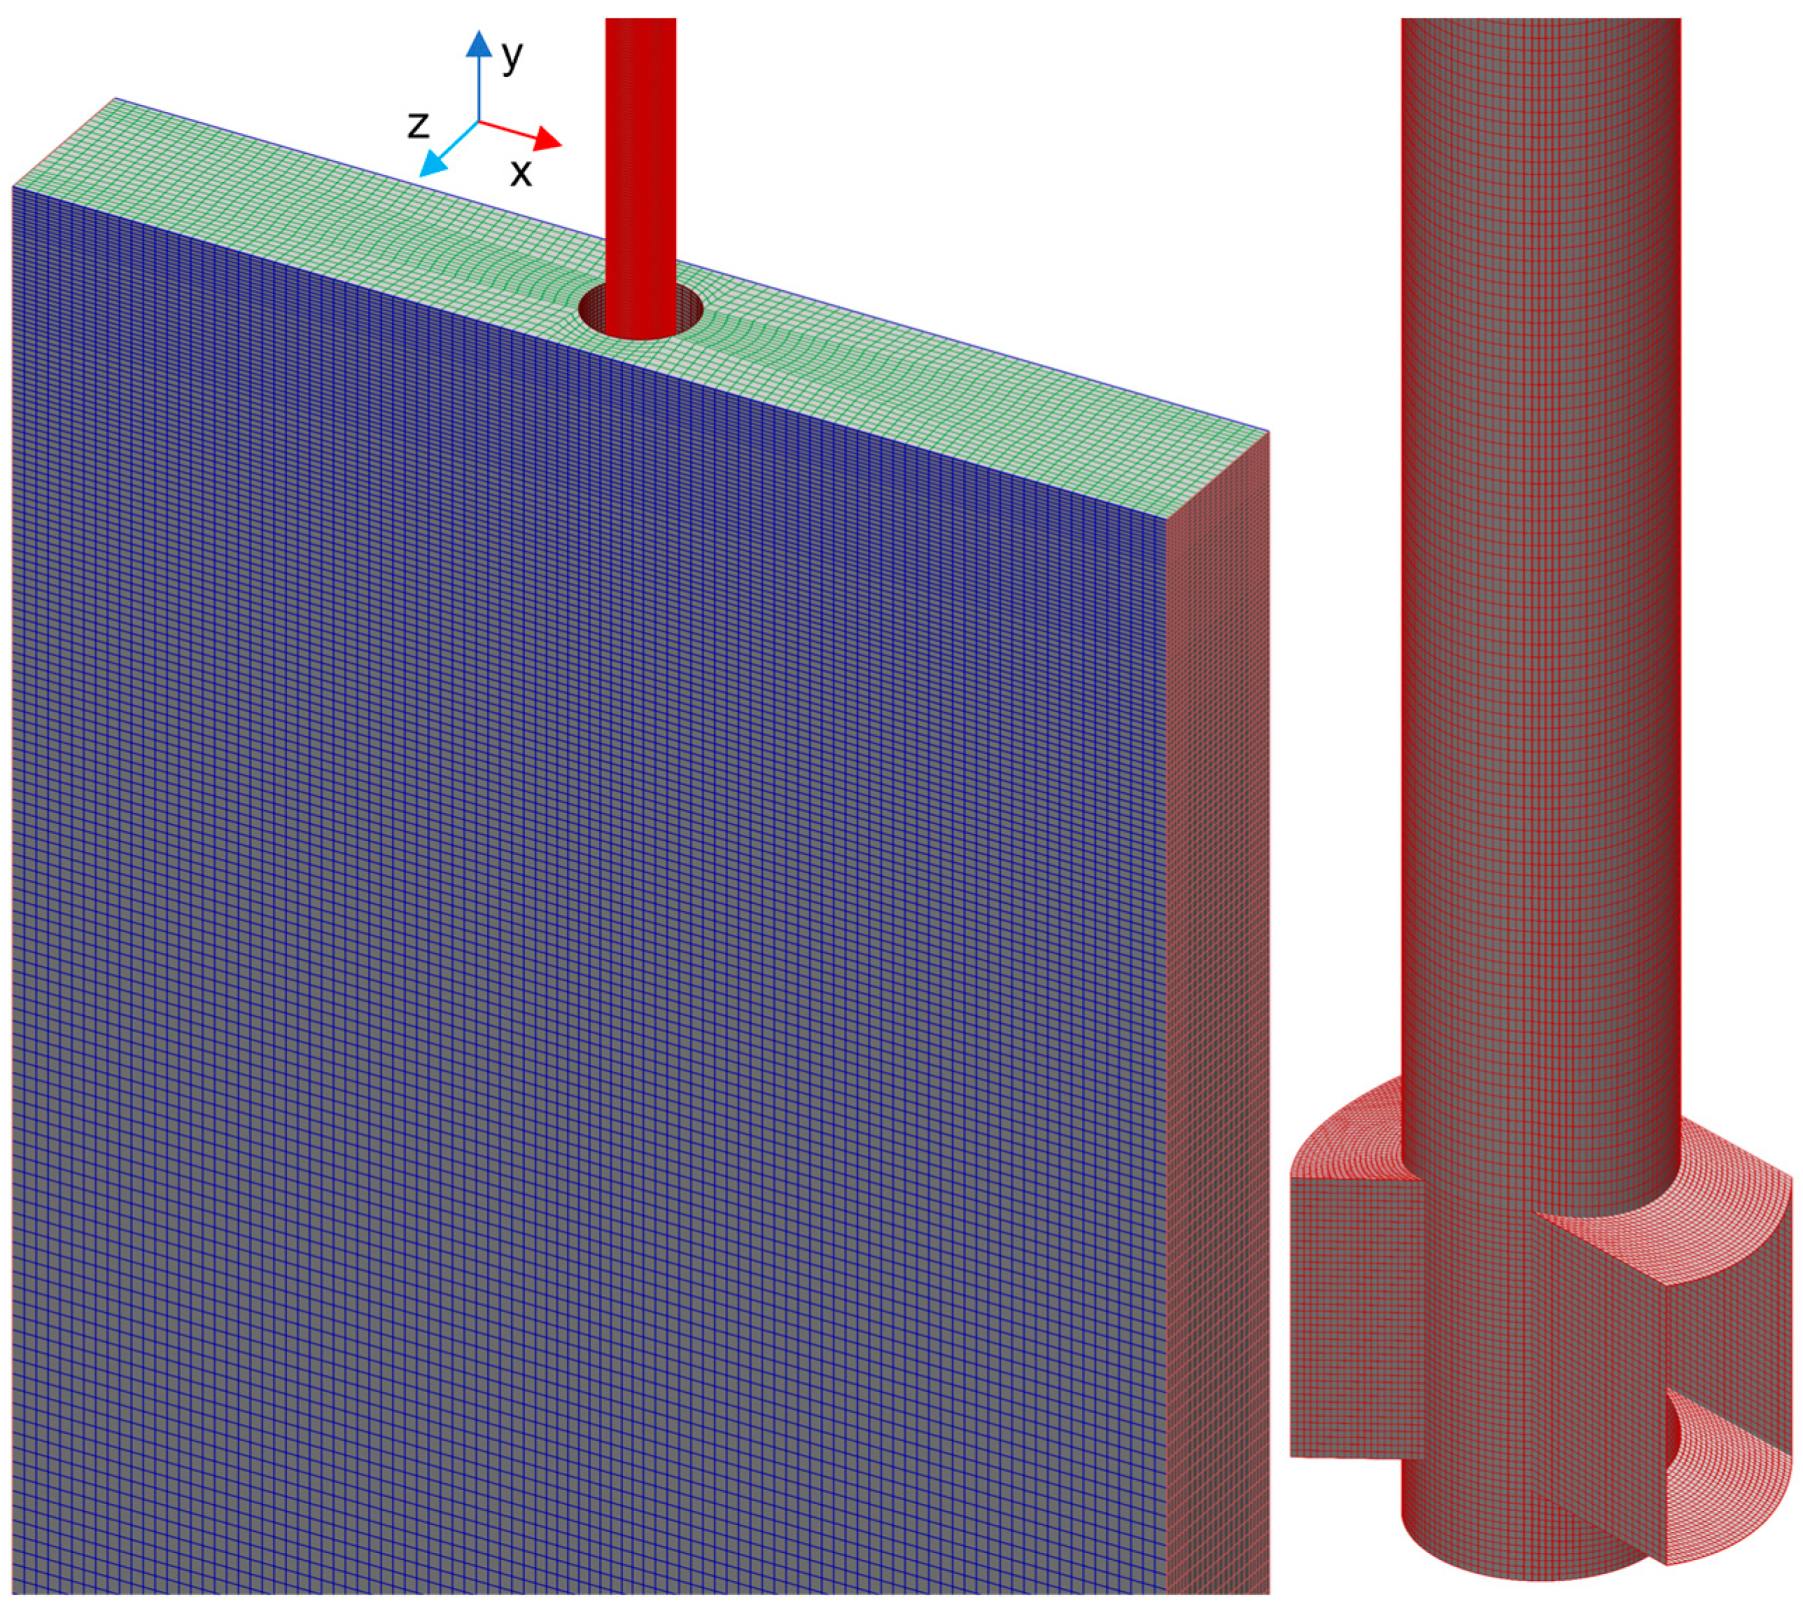
Figure 1 shows the computational meshes of the mold and SEN. The outlet shape of SEN is rectangle with a size of 70 mm × 90 mm and the bottom shape of SEN is concave bottom. In order to fully develop the molten steel turbulence in the mold, the computational domain of the mold is extended to 2.5 m. The number of meshes in the computational domain of the continuous casting mold is about 2.5 million, of which the number of meshes in the part of SEN is about 1.8 million. The maximum size of the mesh in the mold part is not more than 16 mm, and the maximum size of the mesh in the SEN is not more than 2.5 mm. The thickness of the layer of liquid mold powder is set to be 30 mm, and in order to better track the steel–slag interface in the mold, the meshes of 30 mm above and 30 mm below the steel–slag interface is refined to 5 mm. The geometric and physical parameters of the model are shown in Table 1.
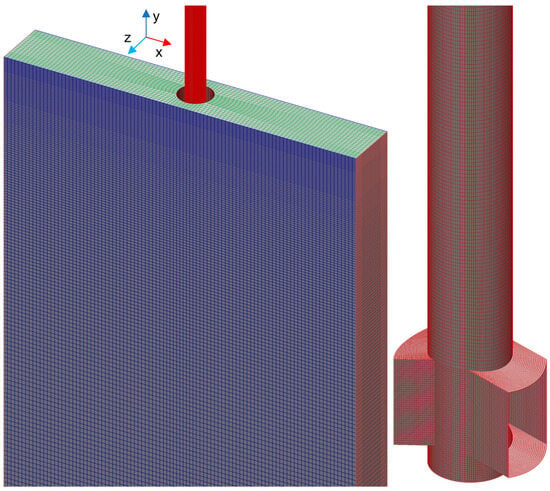
Figure 1.
Computational meshes of the mold and SEN.

Table 1.
Geometric parameters and physical property parameters.
For the continuous phase molten steel in the mold, the inlet and outlet are set as velocity inlet boundary and pressure outlet boundary, respectively. The walls of mold and SEN are set as non-slip wall boundaries, and the roughness height and roughness of the wall are 0 and 0.5, respectively. The top surface of the mold is set as a slip wall boundary. For discrete argon gas bubbles and non-metallic inclusions, the boundary conditions are defined through the DEFINE_DPM_BC macro in Fluent UDF. For the discrete phase, the argon gas bubbles, the inlet of the SEN, the outlet of the mold and the upper free surface are set as escape boundary conditions, the wide and narrow walls of the mold are set as capture boundary conditions, and the inner and outer walls of SEN are set as reflection boundary conditions with the reflection coefficient of 0.3. When the flow velocity of the cell where the non-metallic inclusions are located is less than 0.6 m/s, the non-metallic inclusions are considered to be deposited onto the walls of SEN. The size distribution of argon gas bubbles is based on the Rosin–Rammler size distribution. The minimum and maximum sizes of argon gas bubbles are 1 mm and 6 mm, respectively. The average size of argon gas bubbles is 2.5 mm and the fitting parameter for the size distribution of argon gas bubbles is 4.63 [25]. The mass flow of non-metallic inclusions is 5 × 10⁻⁵ kg/s. The non-metallic inclusions are regarded as spherical particles of an equal diameter of 5 μm. The algorithm of SIMPLE is used to couple pressure and velocity and the residuals of the continuity, velocity, and equations are set as 0.001. The amplification factor for inclusions is used to reduced simulation time. According to the work of Hua et al. [18], the amplification factor is set as 50 and the simulation time of SEN clogging is 400 s.
3.2. Fluid Phase Hydrodynamics
The flow of incompressible fluids is described by the following equations:
The effective viscosity is composed of the molecular viscosity and the turbulent viscosity .
is related to and :
The standard - two-equation turbulence model is used in this study. The transport equations of and are as follows:
where = 0.09, = 1.44 and = 1.92 are empirical constants. = 1.3 and = 1.0 are Prandtl numbers corresponding to turbulent kinetic energy and turbulent kinetic energy dissipation rate [26].
3.3. Volume of Fluid (VOF) Model
Considering the effect of mold slag, the volume of the fluid model (VOF) is used to track the steel–slag interface. Each phase in this model shares the velocity field and solves a single momentum equation in the entire calculation domain. The density and viscosity in the momentum equation are the weighted average of each phase:
The interface effect is described according to the continuous surface force model proposed by Brackbill et al. [27]. The effect of interfacial tension is added to the momentum equation source term. The pressure drops at the interface depends on the interfacial tension coefficient and the curvature radius of the two phases at the interface:
The interface curvature is shown in the parenthesis to the right of the above formula, which can be obtained from the divergence of the unit normal vector at the interface. The normal vector at the interface can be calculated by the gradient of the volume fraction of the slag :
After obtaining the surface curvature, the expression of interfacial tension and interfacial volume force is established by using the divergence theorem:
3.4. Discrete Phase Model (DPM)
The argon bubbles and inclusion particles are treated as discrete phases. The discrete particles receive multiple forces acting together in molten steel, and the momentum equation is as follows:
where is the drag force on particles; is the gravity of particles; is the buoyancy force of particles; is the pressure gradient force; is virtual mass force.
where is the drag coefficient and is virtual mass factor, referring to our previous work [25]. In Equation (2), denotes the momentum exchange with argon gas bubbles and inclusion particles, written as:
where is the volume of the cell and is the number of bubbles in the cell.
3.5. Porous Medium Model
In previous studies, the methods for clogging caused by particle deposition include arbitrary Euler–Lagrange method, smooth particle hydrodynamics method and porous media model [28]. The porosity of the porous media model can be expressed by the volume fraction in the grid cells that are not occupied by deposited inclusion particles. With the increasing number of non-metallic inclusion particles deposited in the grid cells of the computational domain, the porosity gradually decreases, and the clogged volume keeps growing. Therefore, a porous media model can be used to simulate the transient SEN clogging process caused by the deposition of non-metallic inclusion particles.
In this work, a user-defined function (UDF)-based porous media model coupled with a DPM model is used to simulate the dynamic process of SEN clogging in a continuous casting mold. The model simulates the porous media region by adding momentum source term to the standard fluid transfer equation in the computational domain. For simple homogeneous porous media, neglecting convective acceleration and diffusion, the momentum source term can be simplified to Darcy’s law. The Darcy source terms of velocity, turbulent kinetic energy and turbulent dissipation rate in the porous media region formed by SEN clogging are as follows:
According to references [2,20], the expression of permeability of porous media is:
The porosity in the cell grid of porous medium area is related to the number of non-metallic inclusion particles deposited in this cell .
where is the volume of non-metallic inclusion particles in the grid cell, m3; is the diameter of non-metallic inclusion particles, m.
For particles with uniform diameter, when the grid cells are completely clogged, the volume fraction of particle deposition is 0.74, while for particles with random movement, the volume fraction of particle deposition is between 0.591 and 0.634 [29]. According to the experiment of drying and weighing the clogging in the submerged nozzle carried out by Hua et al. [18], the volume fraction of the clogging formed by the deposition of non-metallic inclusion particles in the actual production process is 0.677. In this work, the maximum volume fraction of the clogging formed by the deposition of non-metallic inclusion particles in the porous medium area grid cell is 0.677.
Figure 2 shows the flow chart of the transient SEN clogging algorithm program. The mathematical model of transient SEN clogging in the production process of continuous casting mold is established by using the UDF in fluent. Firstly, the formation process of the clogging on the inner wall of the nozzle is realized by the user-defined discrete phase boundary condition using the macro of DEFINE_DPM_BC. After the iteration of each time step, the macro of DEFINE_ADJUST is used to update the porosity of the grid cells in the calculation domain of the nozzle to realize the growing process of the clogging of the nozzle interior. Finally, the momentum source term related to grid cell porosity is added to the standard fluid flow control equation using mesh the macro of DEFINE_SOURCE to realize the effect of transient SEN clogging on the liquid steel flow in the nozzle.
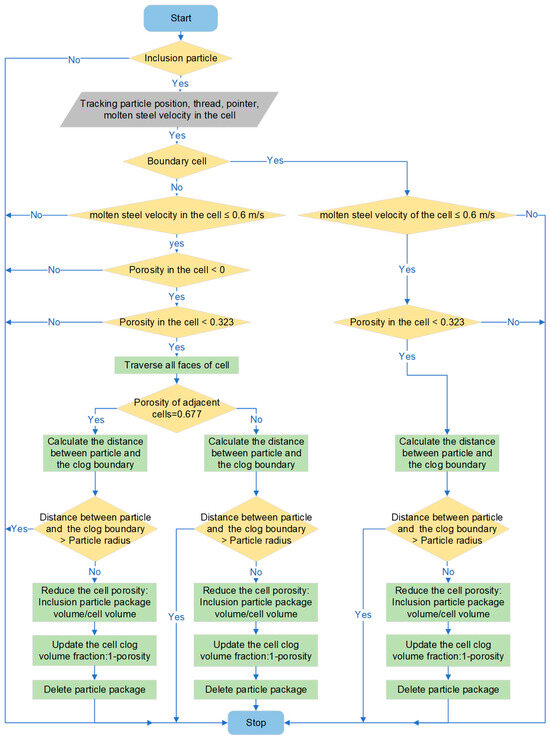
Figure 2.
Flow chart of transient SEN clogging algorithm.
4. Results and Discussion
4.1. Model Verification
In this work, the thicknesses of non-metallic inclusions clogging on different cross-sections of the SEN are actually measured and the morphologies of the actual SEN clogging are photographed. By comparing the actual situation of SEN clogging with the numerical simulation results, the accuracy of the transient SEN clogging mathematical model can be verified. Figure 3 is the comparison of the clogging morphologies between reality and numerical simulation on different cross-sections of SEN. It can be seen from the figure that the actual clogging morphologies of the SEN are in good agreement with the numerical simulation results.
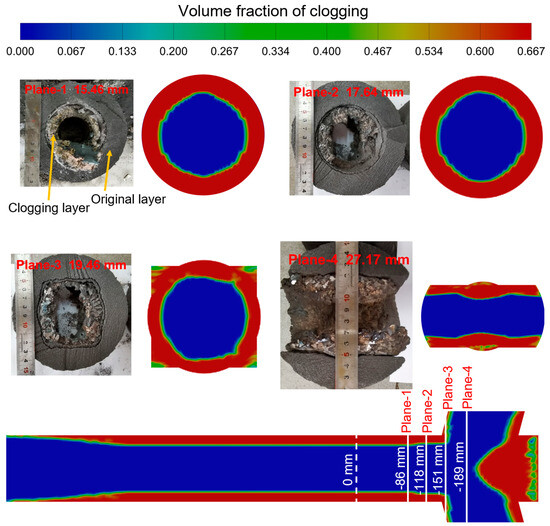
Figure 3.
Comparison of clogging morphologies between the reality and numerical simulation on different cross-sections of SEN.
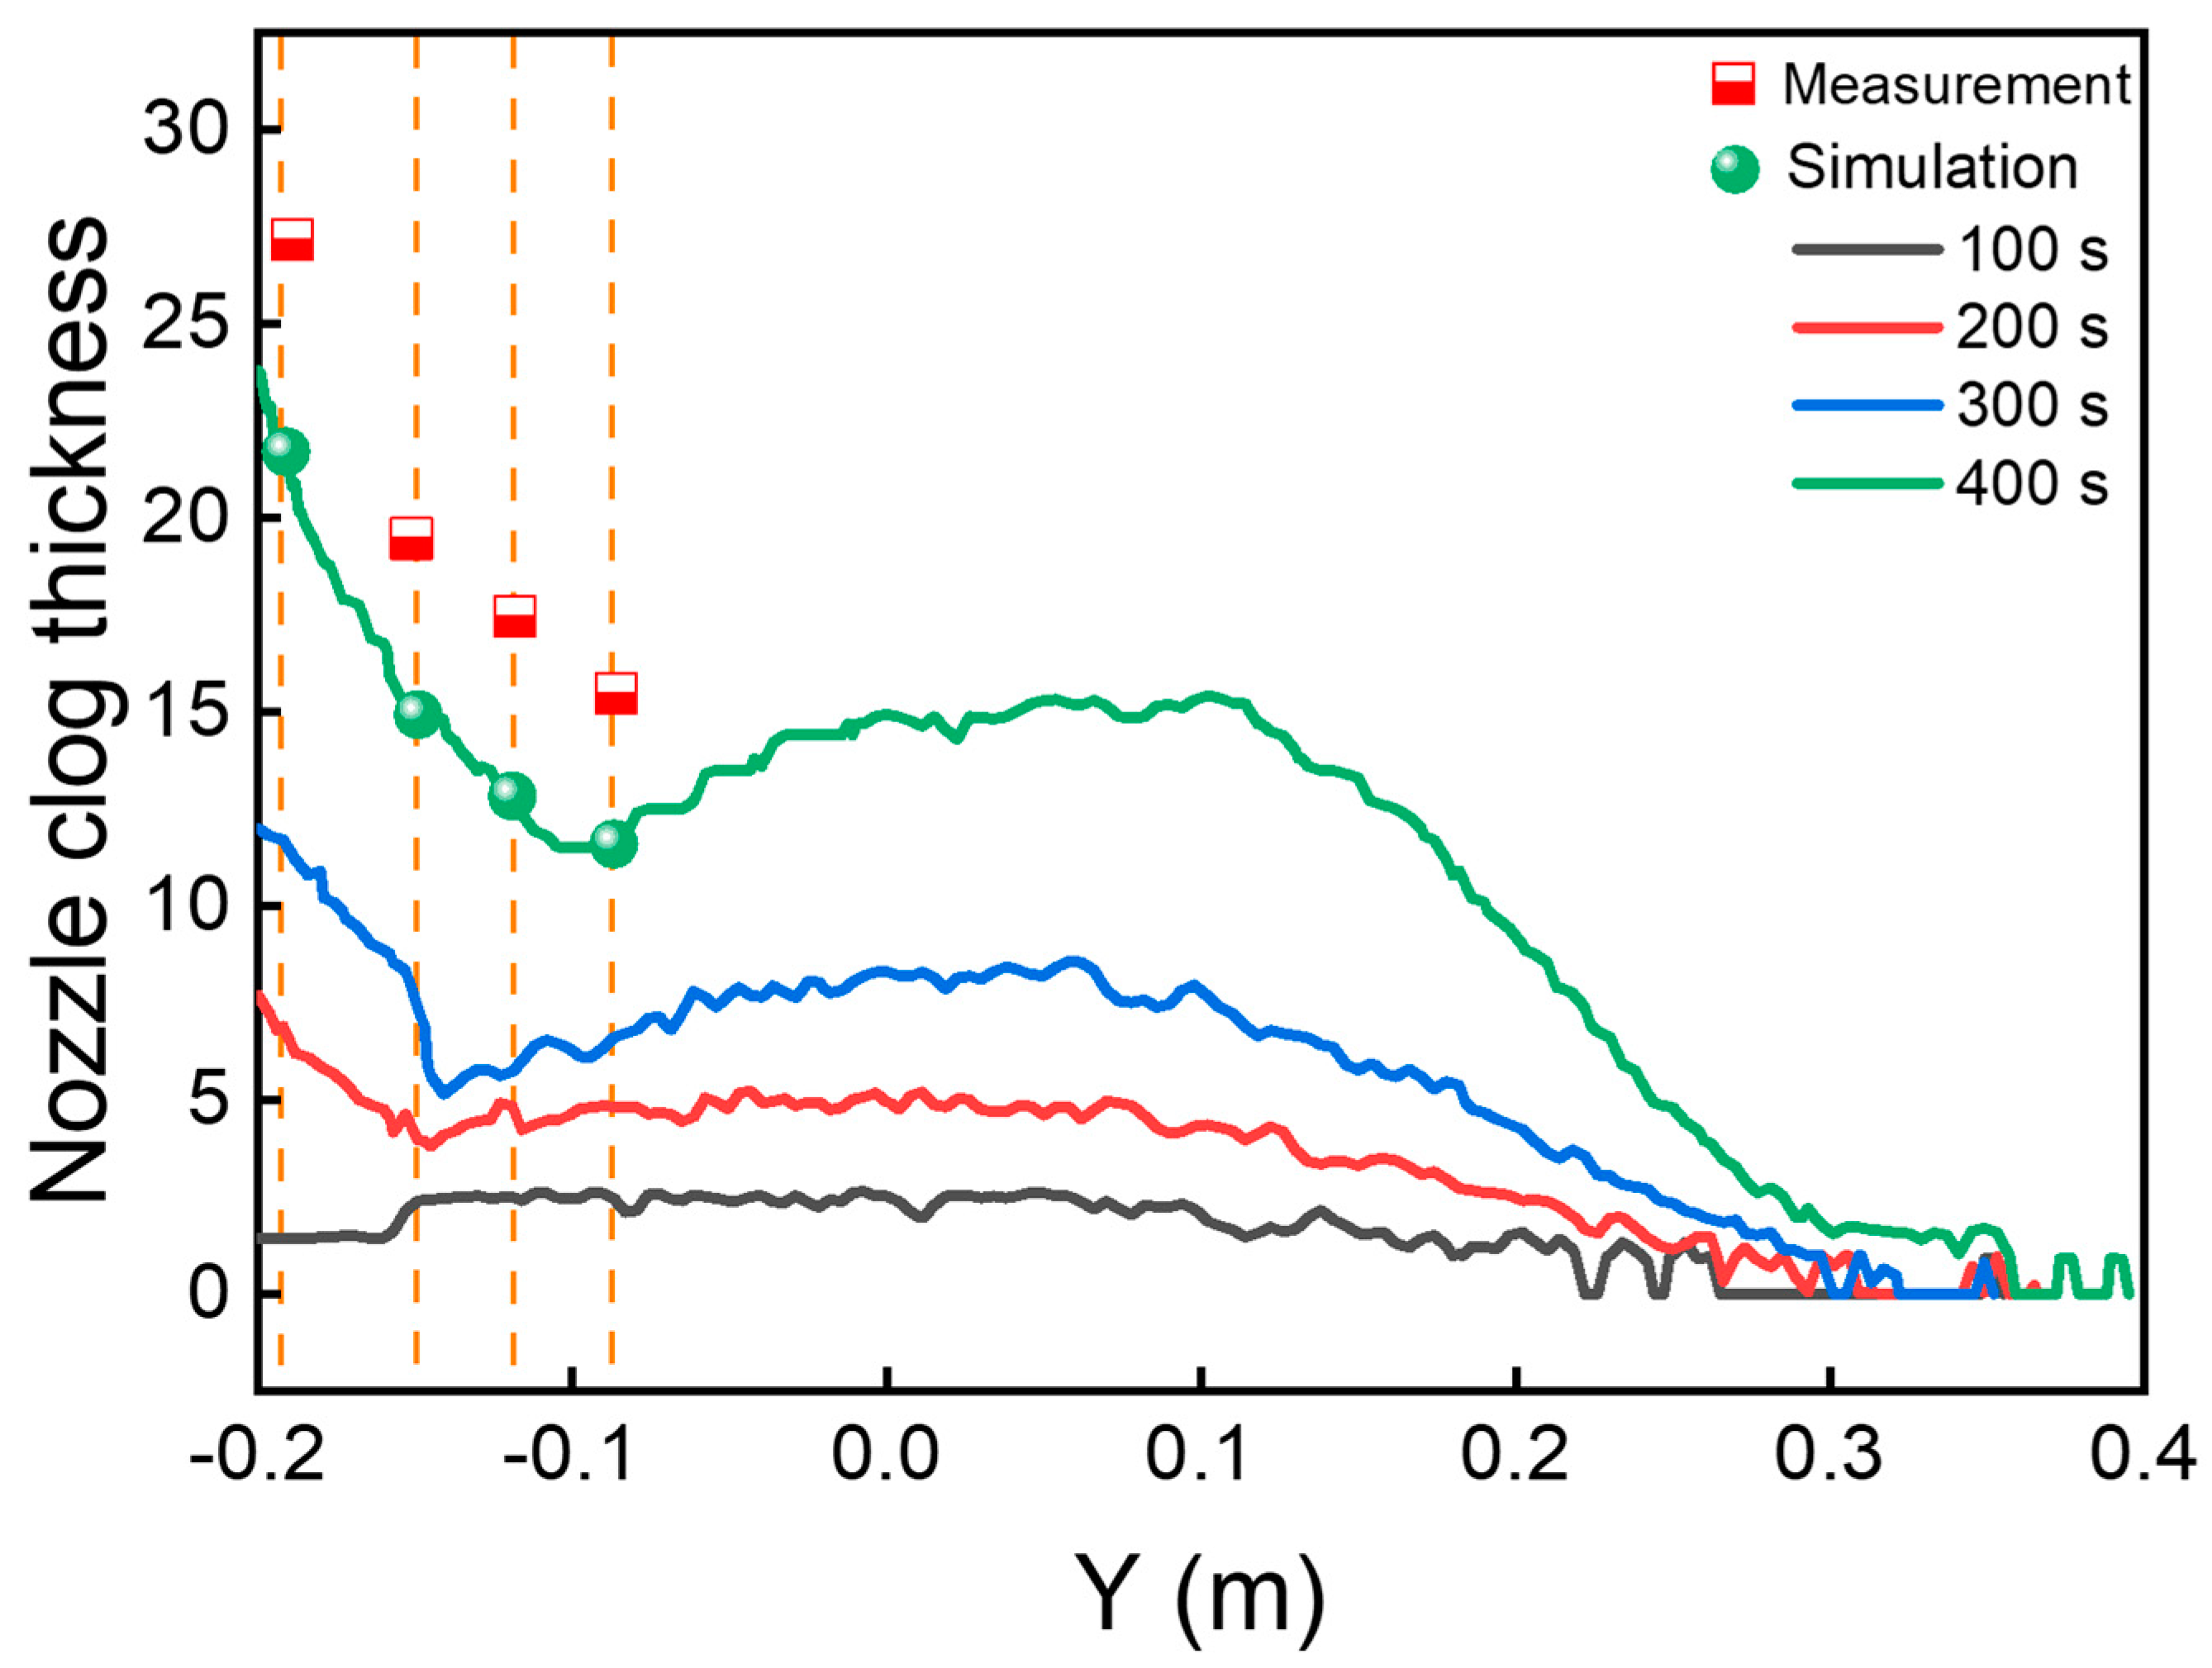
Figure 4 shows the comparison of the clogging thickness between the measurement and numerical simulation results on the X = 0 m plane of SEN. It can be found from the figure that the measured results are in good agreement with the numerical simulation results. With the increase in simulation time, the thickness of clogging in the vertical part of the SEN increases gradually. In the vertical part of the SEN, with the increase in the distance from the inlet of the SEN, the thicknesses of clogging first show an increasing trend and then a decreasing trend. In the later stage of clogging, the largest thickness of clogging in the vertical part of the SEN exceeds 15 mm. Figure 5 presents the contours of the volume fraction of clogging on the plane Z = 0 m of the SEN with different simulation times. From the figure, it can be found that the nonmetallic inclusions at the bottom of the SEN begin to deposit first and clog at the bottom of the SEN. The growth rate of the clogging at the bottom of the SEN is higher than that of the side hole wall of the SEN and the inner wall of the vertical part of the SEN.
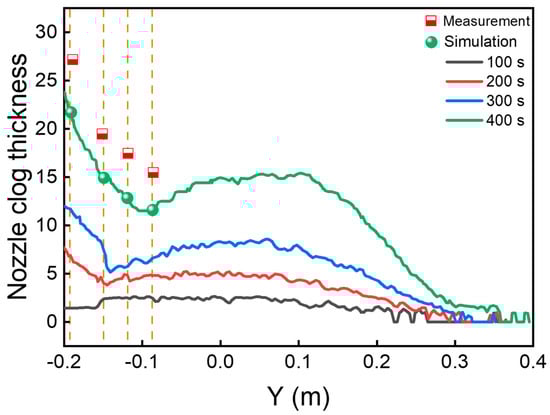
Figure 4.
Comparison of the clogging thickness between the measurement and numerical simulation results on the X = 0 m plane of SEN.
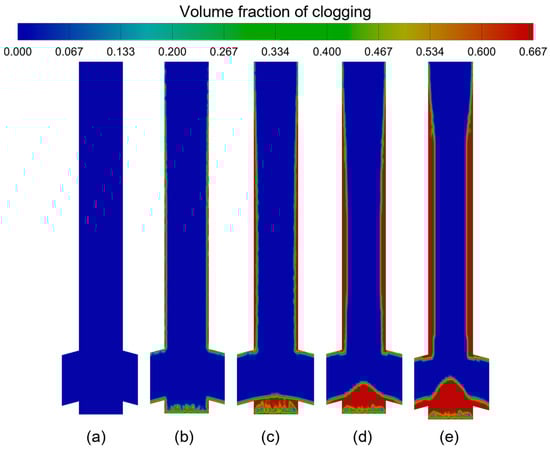
Figure 5.
Contours of volume fraction of clogging on the plane Z = 0 m of the nozzle with different simulation times: (a) 0 s, (b) 100 s, (c) 200 s, (d) 300 s, (e) 400 s.
4.2. Effect of SEN Clogging on the Flow Field of the Mold
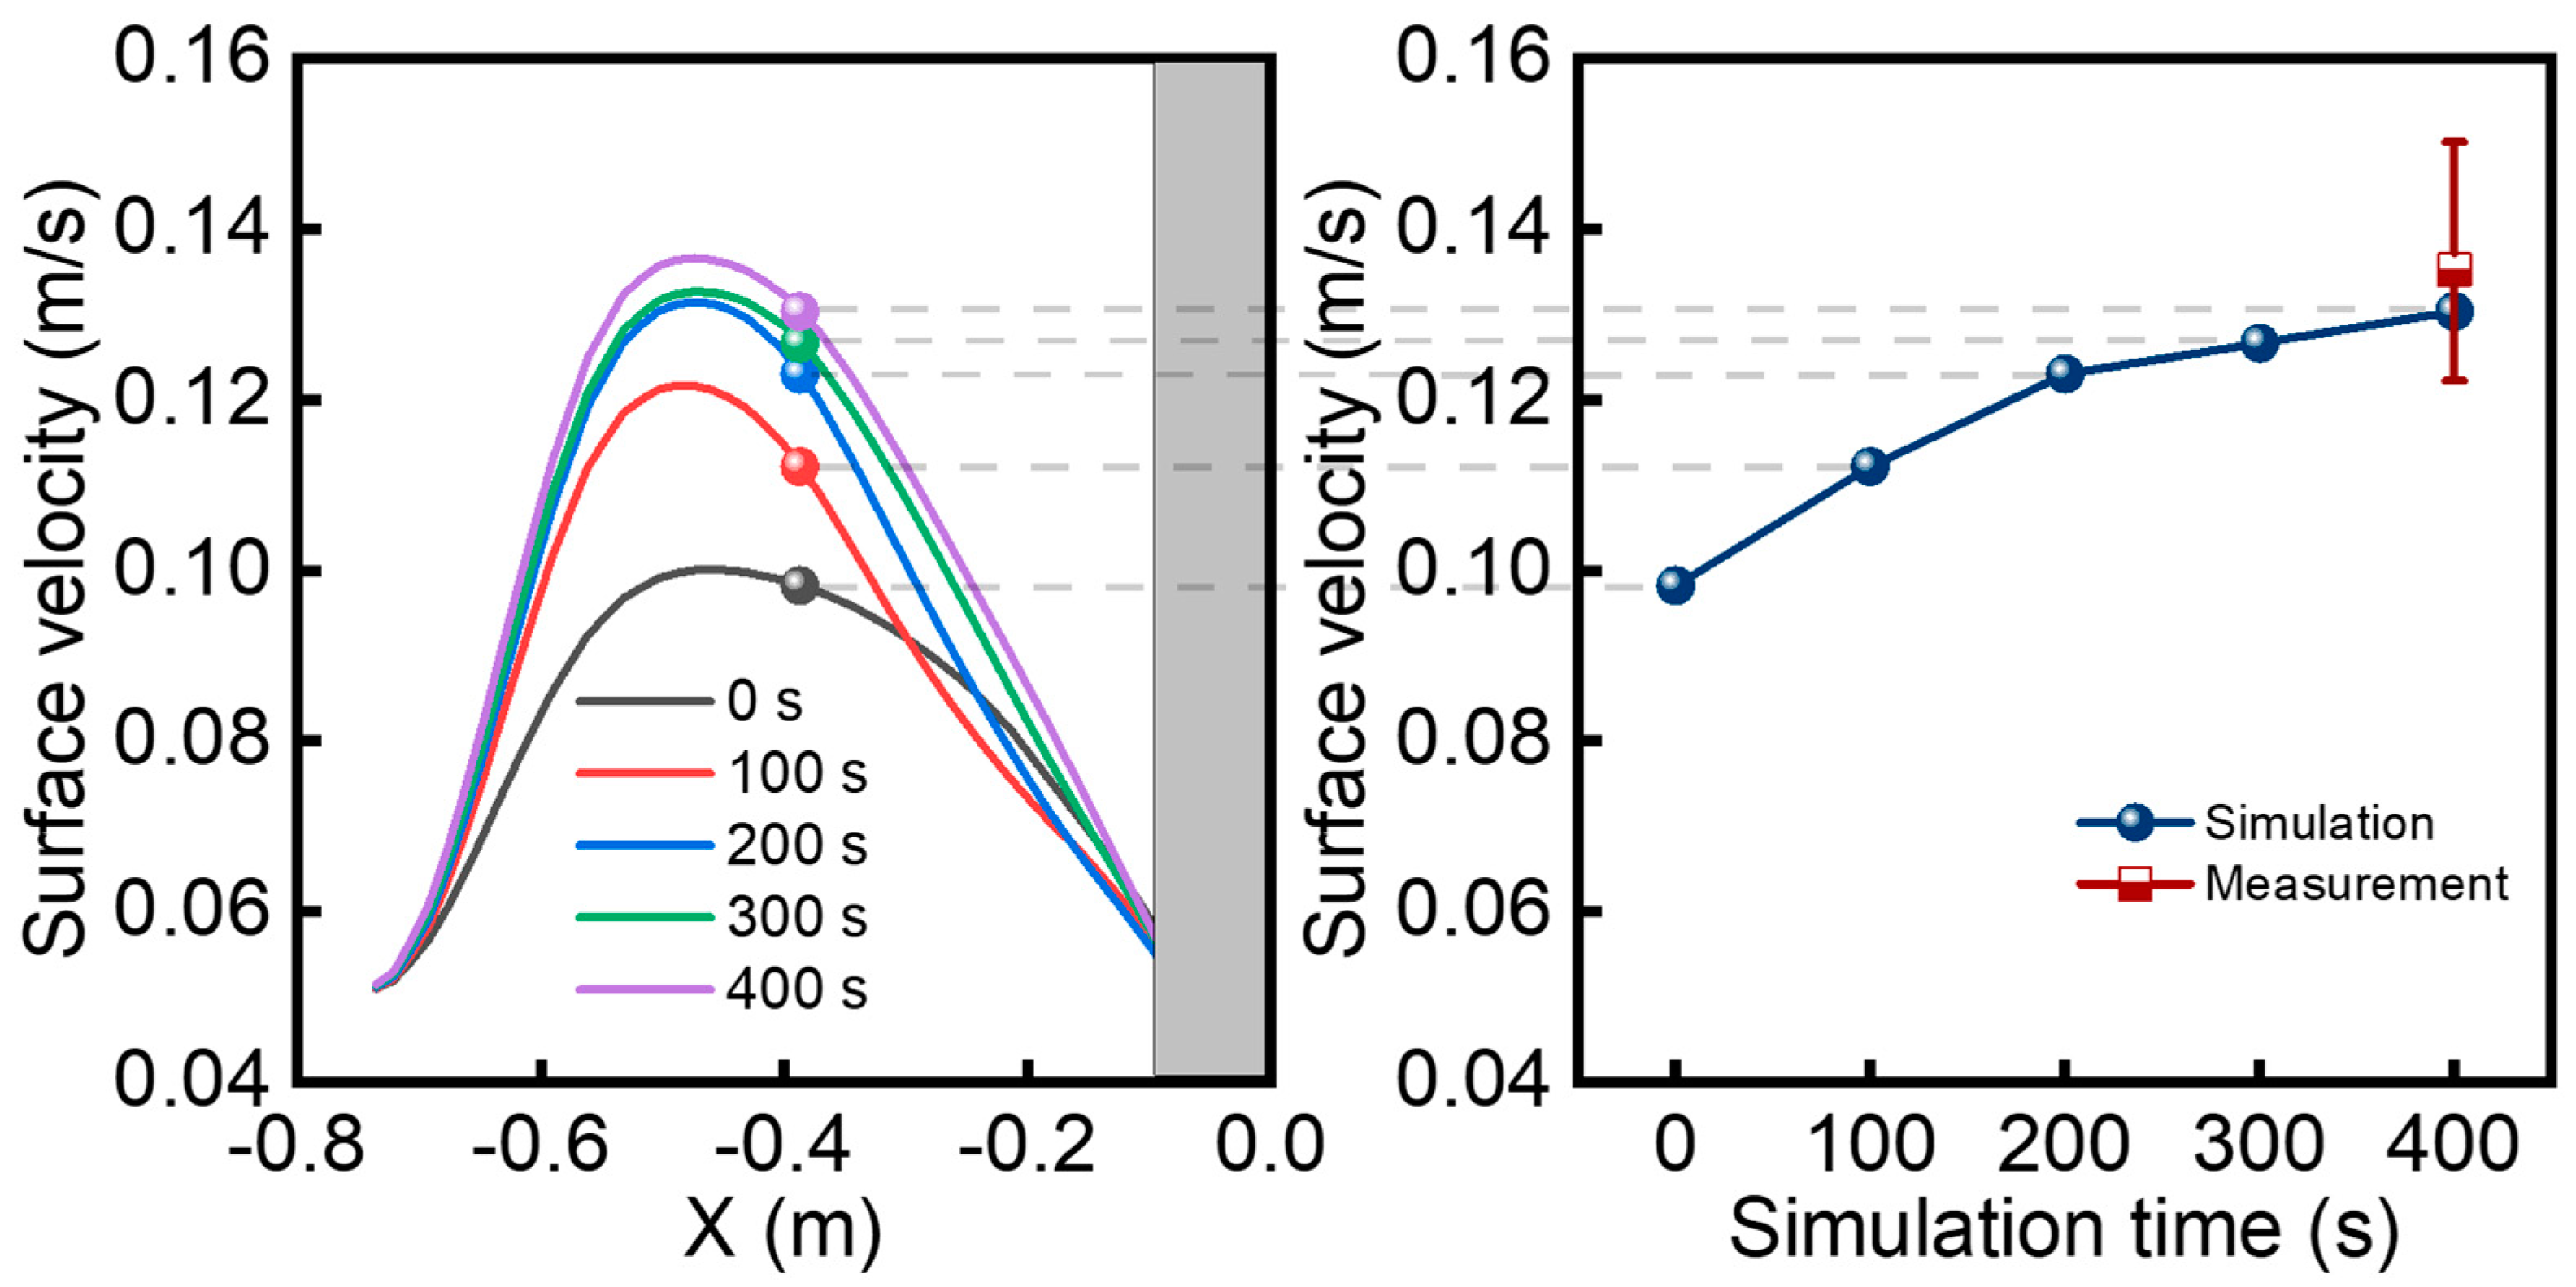
Figure 6 is the numerical simulation and high-temperature measurement results of the surface velocities of the continuous casting mold at different simulation times. It can be found that with increasing simulation time from 0 s to 100 s, 200 s, 300 s and 400 s, the surface velocities of molten steel near 1/4 width of mold will increase from 0.098 m/s to 0.112 m/s, 0.123 m/s, 0.127 m/s and 0.130 m/s. With increasing the degree in clogging, the flow velocity of molten steel on the surface of the mold shows an increasing trend. The high-temperature measurement results are measured near 1/4 width of the mold surface in the later stage of clogging and it can be found from the comparison figure that the high-temperature measurement results are in good agreement with the simulation results.
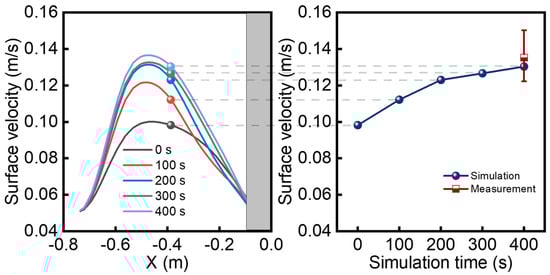
Figure 6.
Numerical simulation and high-temperature measurement results of the surface velocities of the continuous casting mold with different simulation times.
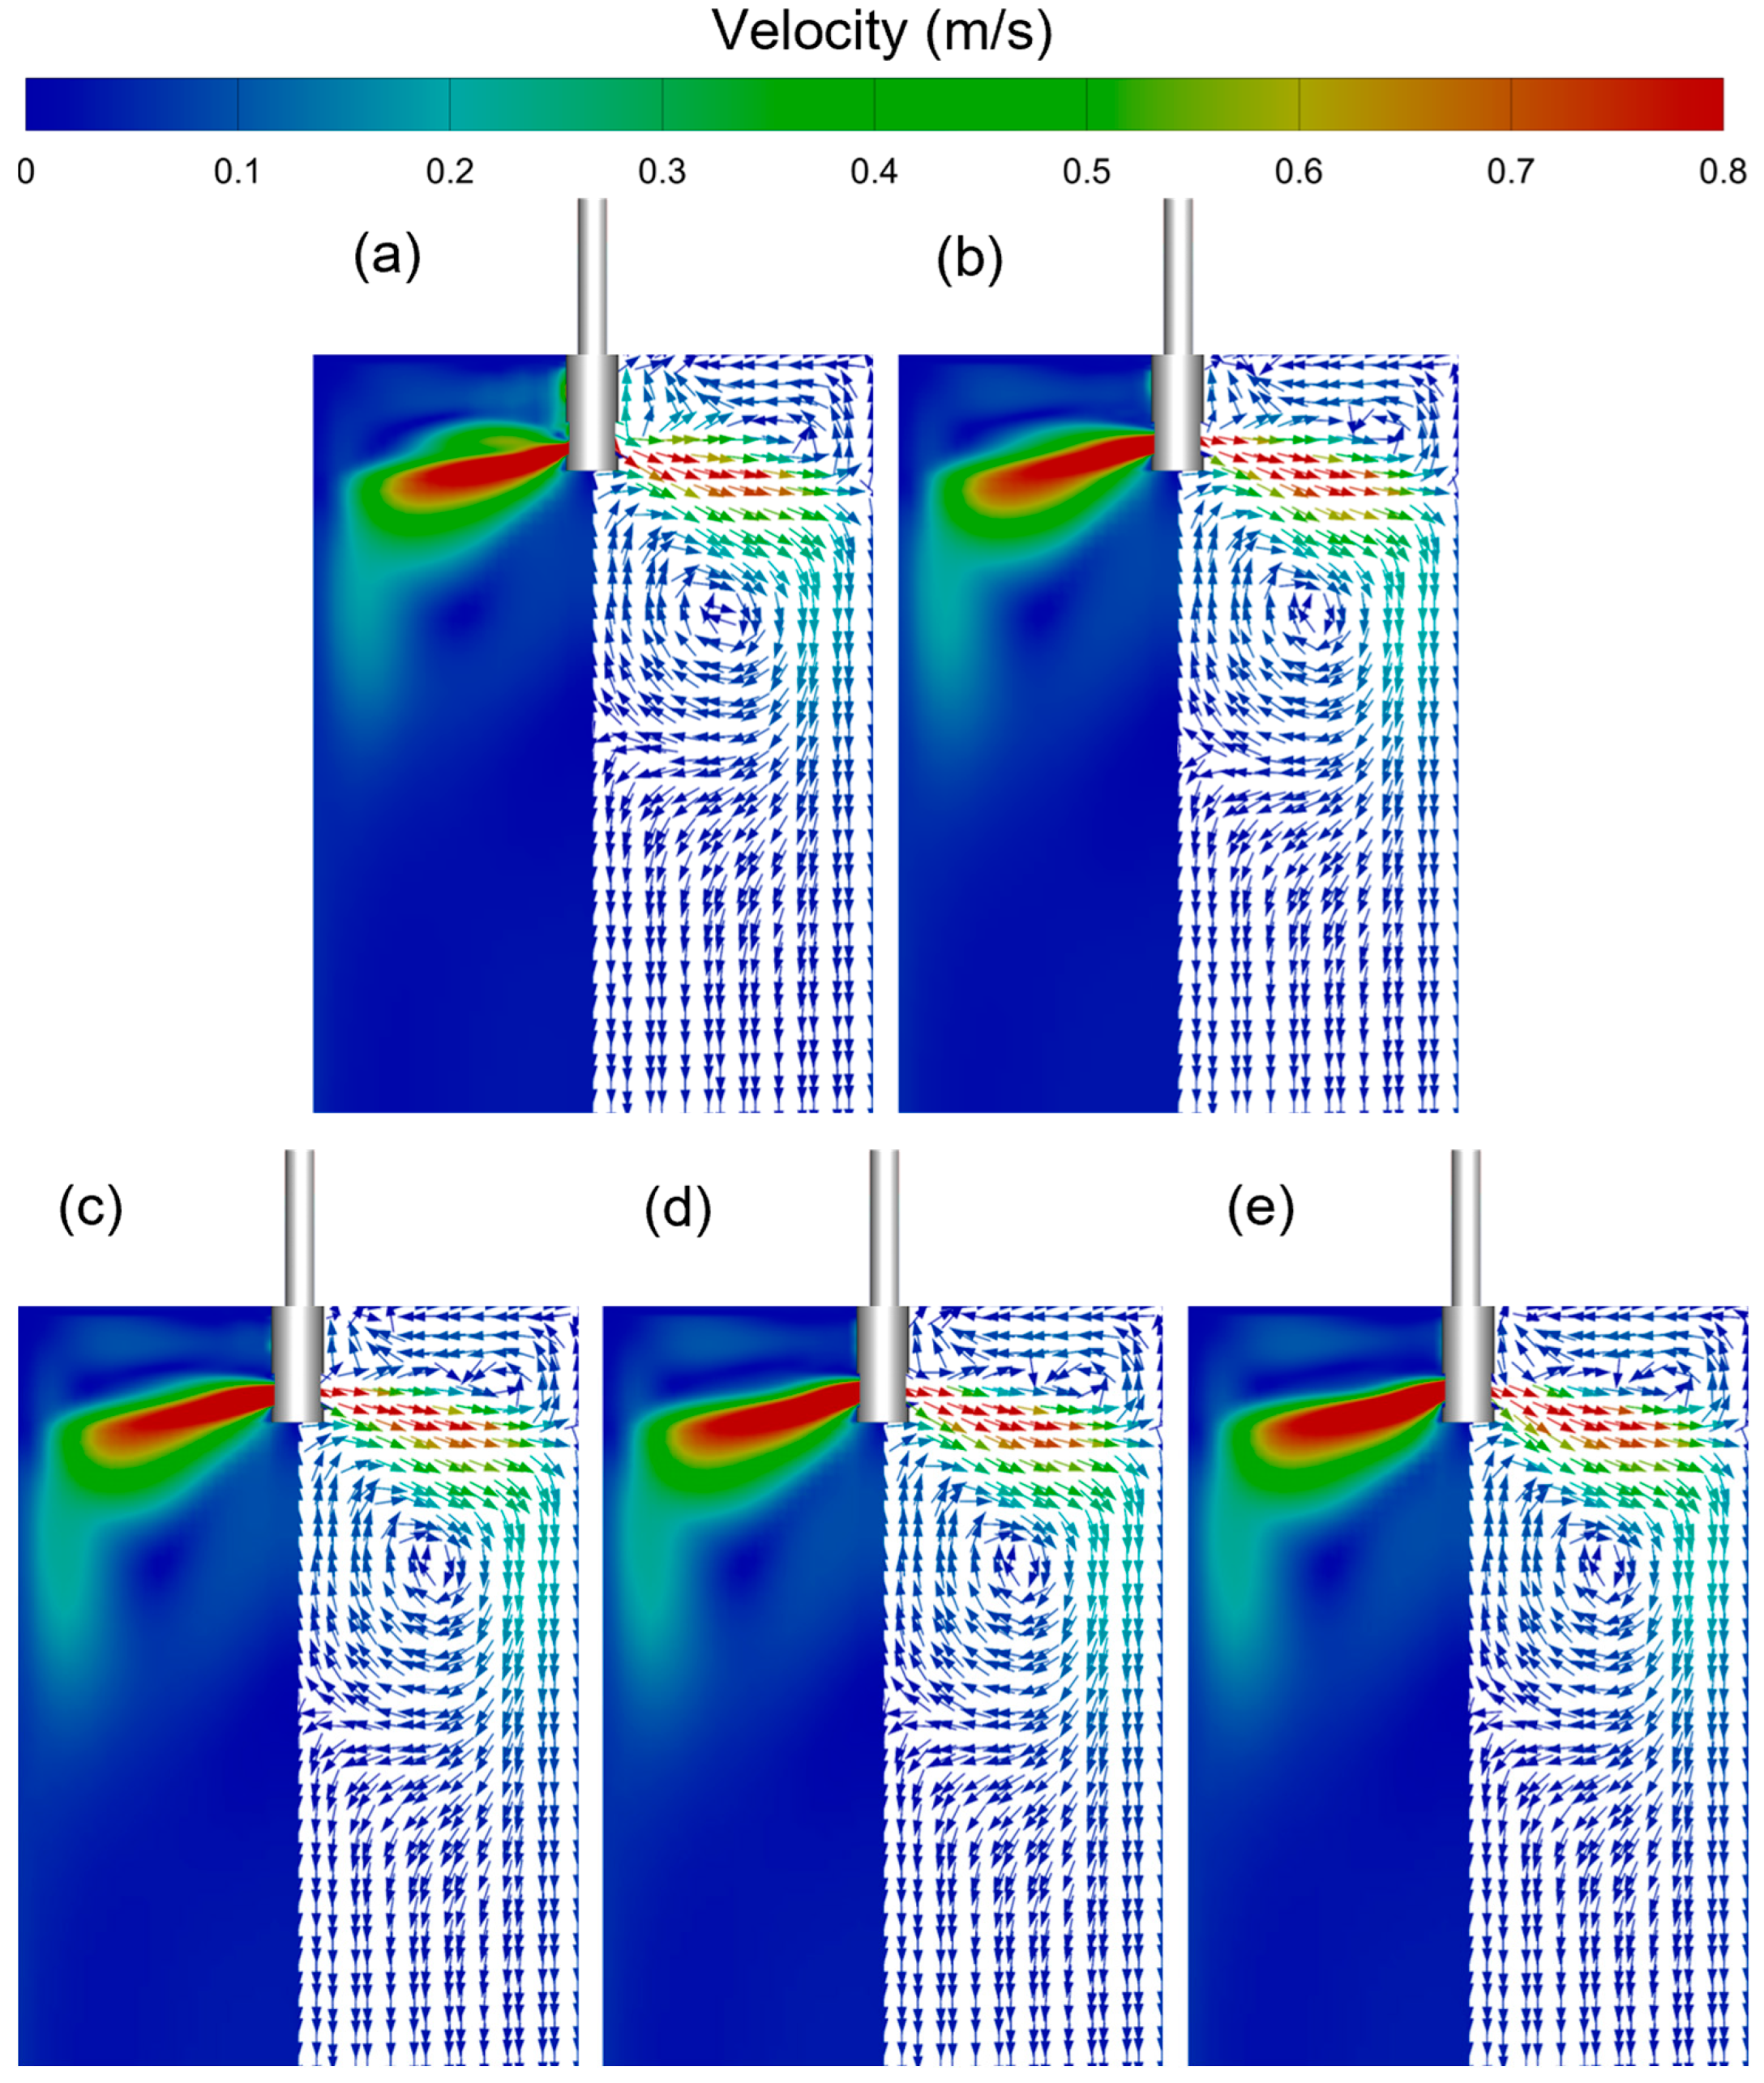
Figure 7 shows the velocity contours and velocity vectors on the Z = 0 m plane in the continuous casting mold at different simulation times. It can be seen from the figure that when there is no clogging inside the SEN, the intensity of the molten steel jet flowing out from the side holes of the SEN and the upper circulation flow of molten steel is weaker. A part of molten steel flowing out from the side holes of the SEN flows directly upward near the SEN, instead of the upper circulation flow where the molten steel first reaches the narrow wall and then flows upward, because the intensity of the molten steel jetting out from the side holes is weak and a lot of large-sized argon gas bubbles float up here. It can be seen in Figure 7b–e that by increasing the simulation time and the degree of clogging, the molten steel jet flow out from the side holes of the SEN becomes more concentrated and the jet strength gradually increases. The upper circulation flow is strengthened and the molten steel flowing directly upward near the SEN to the surface of the mold is reduced. At the same time, the strength of the lower circulation flow also increases and the vortex center of the lower circulation flow moves downwards.
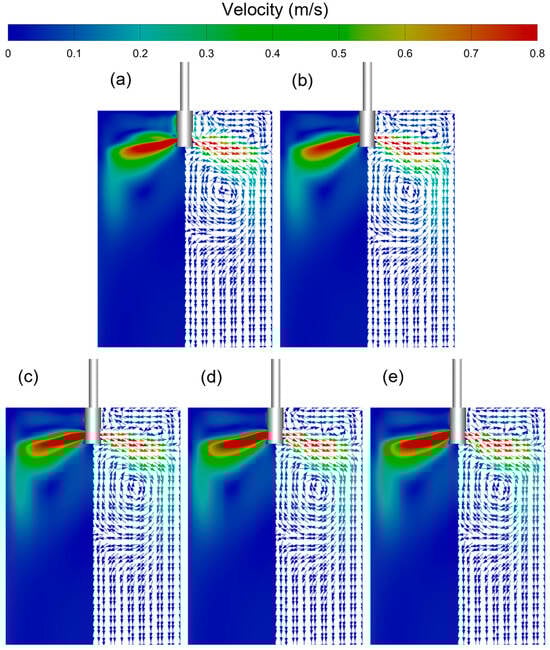
Figure 7.
Velocity contours and velocity vectors on the Z = 0 m plane in the continuous casting mold at different simulation times: (a) 0 s, (b) 100 s, (c) 200 s, (d) 300 s, (e) 400 s.
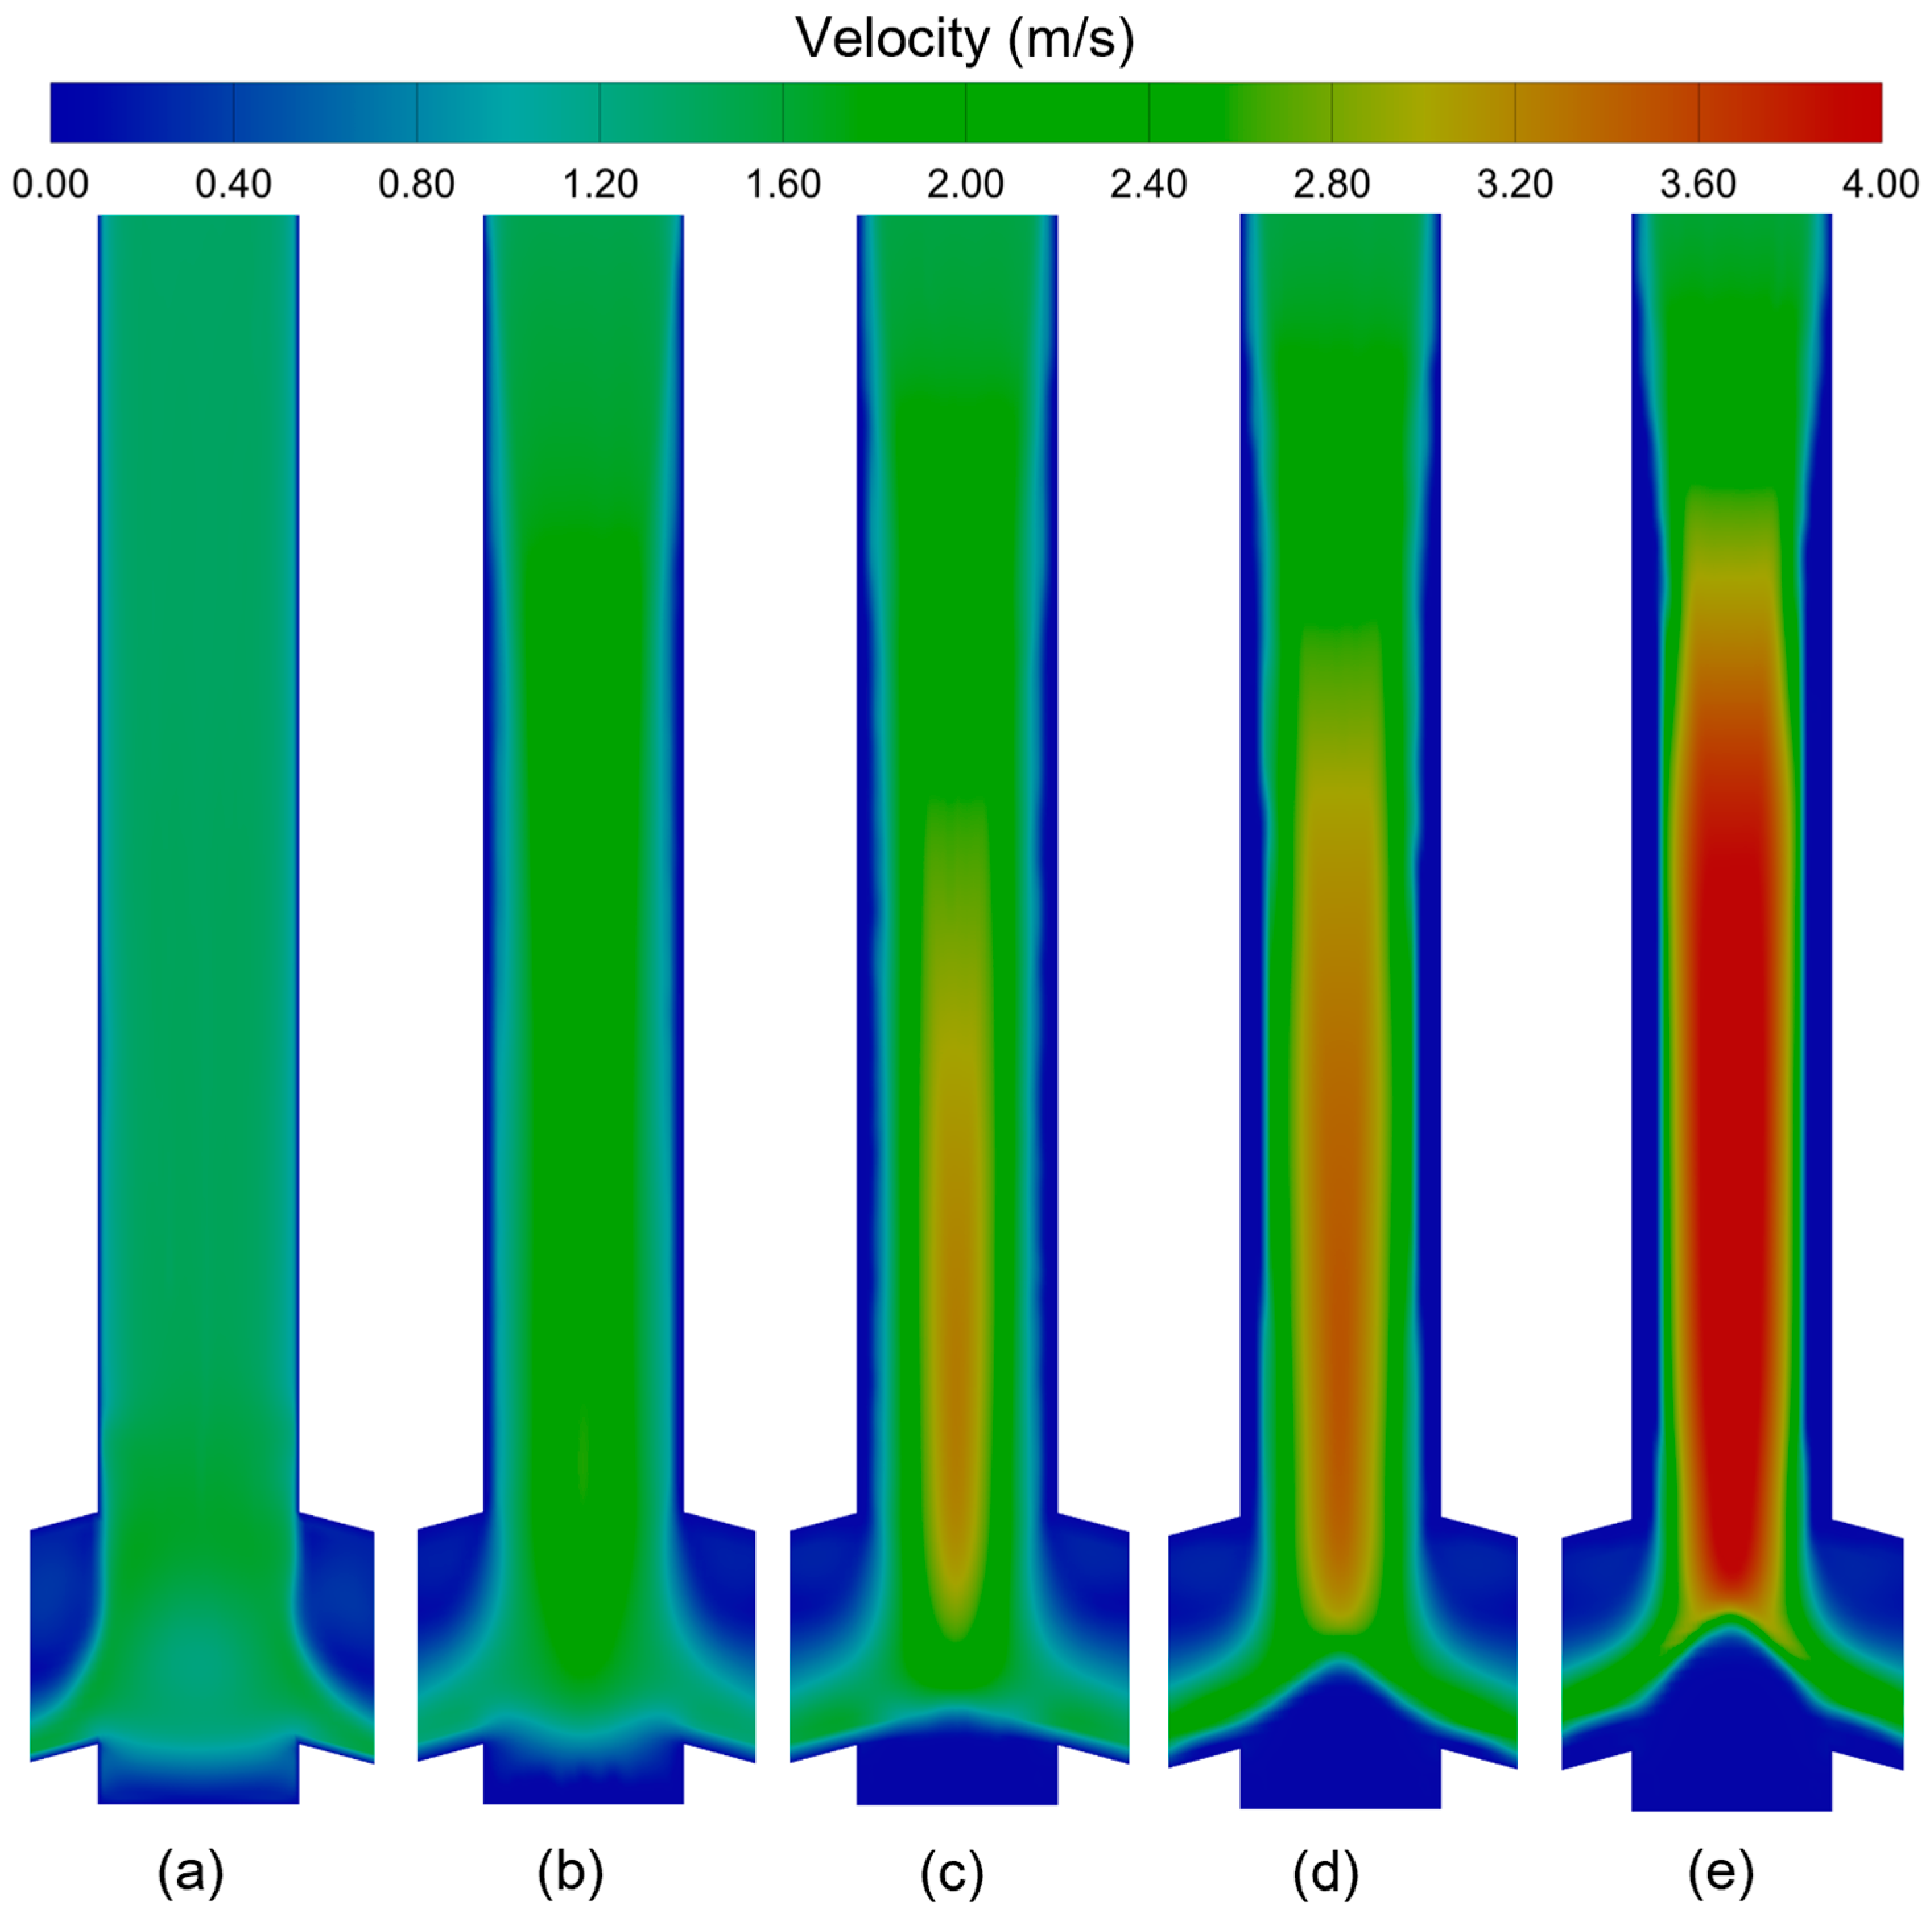
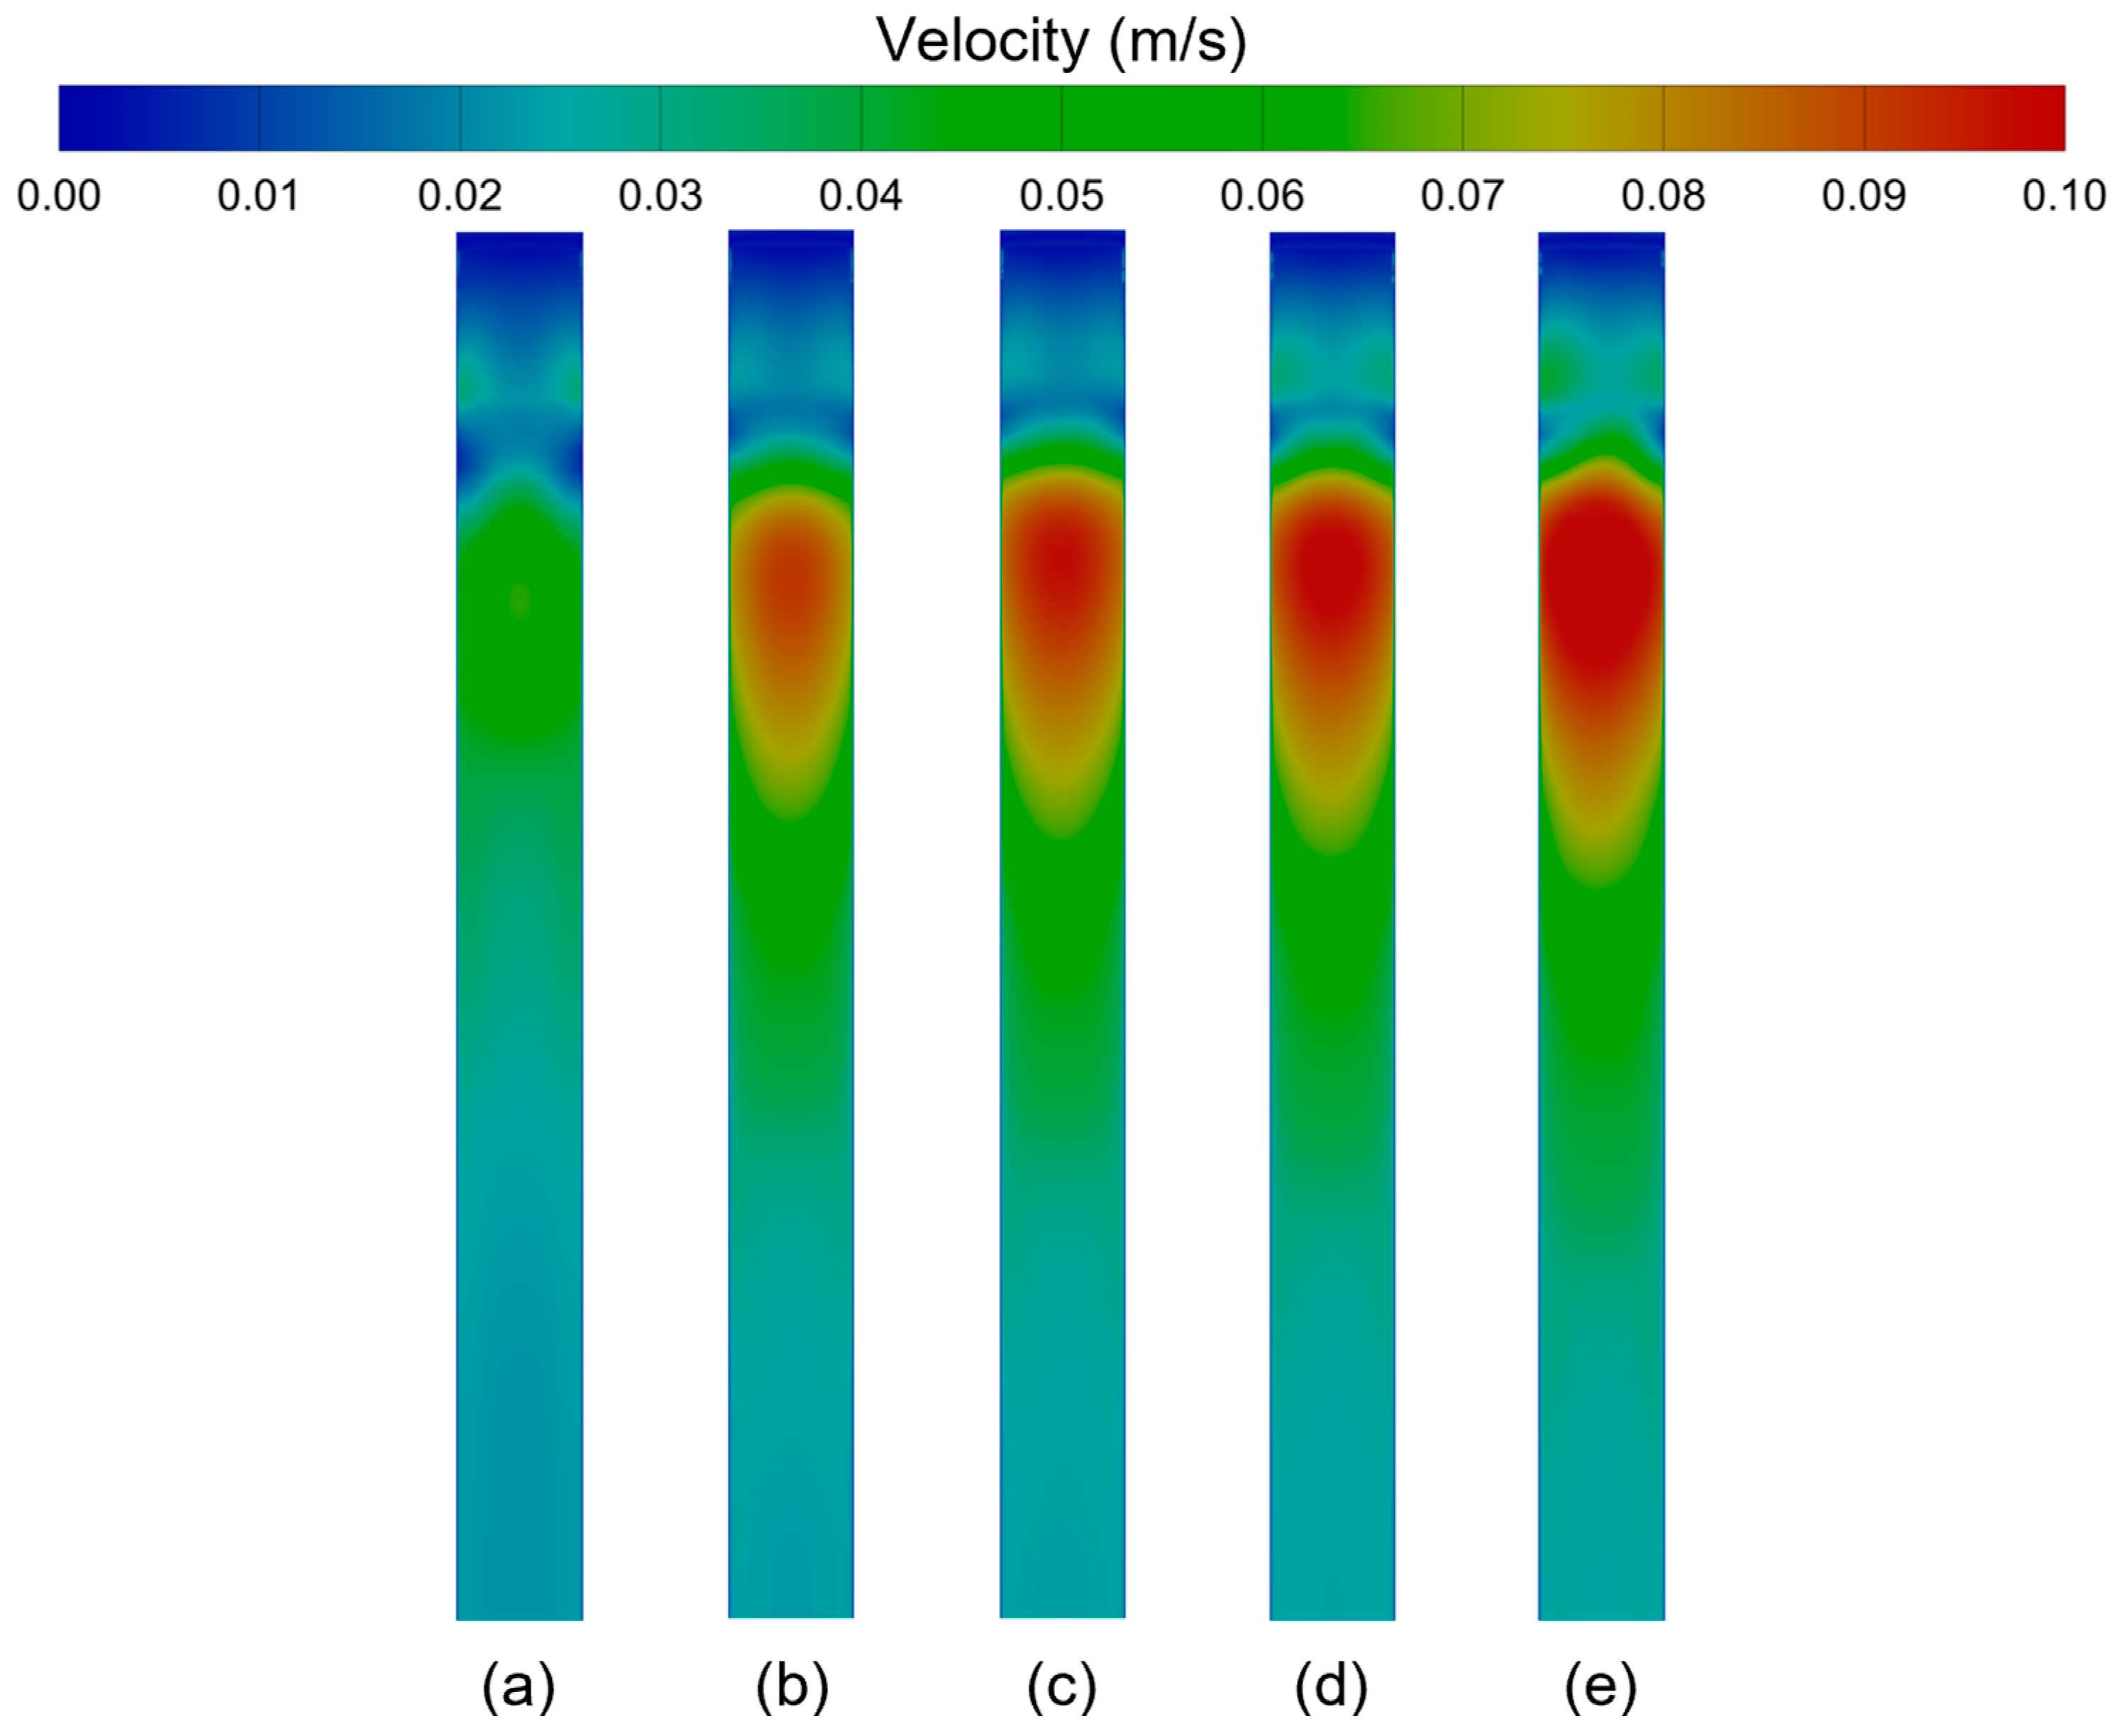
Figure 8 shows the velocity contours on the Z = 0 m plane inside the nozzle at different simulation times. It can be found from Figure 8a that there is a zone with low-velocity molten steel in the bottom of SEN because it is a concave bottom structure. In this zone, the probability of the inclusions being adhered to the inner walls of the SEN is greater because the velocity of the molten steel is lower and the force of the molten steel on the inclusions is lower than the adhesive force of the walls on inclusions. On the inner walls of the side holes and the vertical part of SEN, the probability of the inclusions being adhered to the inner walls of the SEN is less because the velocity of the molten steel is higher. Therefore, the inclusions clogging at the bottom of the SEN grows faster in the early stage of clogging. As shown in Figure 8a–e, with increasing the simulation time, the flow velocity of molten steel at the front of the clogging at the bottom of the SEN increases, and the growth rate of the clogging at the bottom of the SEN decreases. As the degree of clogging in the SEN increases, the volume occupied by the inclusions clogging increases, and the space for the molten steel to flow through decreases. Under the same throughput of molten steel, the velocity of molten steel inside the SEN increases. When the simulation time is 400 s, the velocity of molten steel at some areas inside the SEN exceeds 4 m/s.
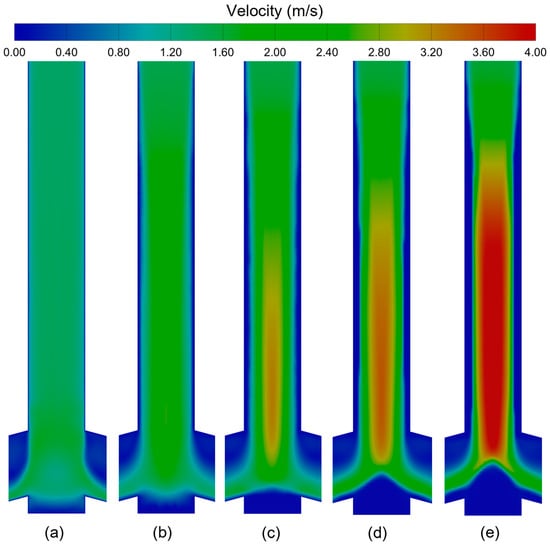
Figure 8.
Velocity contours on the Z = 0 m plane inside the nozzle at different simulation times: (a) 0 s, (b) 100 s, (c) 200 s, (d) 300 s, (e) 400 s.
Figure 9 shows the velocity contours at the outlet of the side holes of the SEN at different simulation times. It can be found that when there is no clogging, the molten steel with a high flow velocity is concentrated at the bottom and two sides. With increasing simulation time, the molten steel with a high flow velocity becomes more concentrated, the flow velocity of molten steel is increased and the center of molten steel jet is obviously shifted upward. This is because with increasing simulation time, the side holes of SEN are clogged around the four sides and the bottom is seriously clogged.

Figure 9.
Velocity contours at the outlet of the side holes of the SEN at different simulation times: (a) 0 s, (b) 100 s, (c) 200 s, (d) 300 s, (e) 400 s.
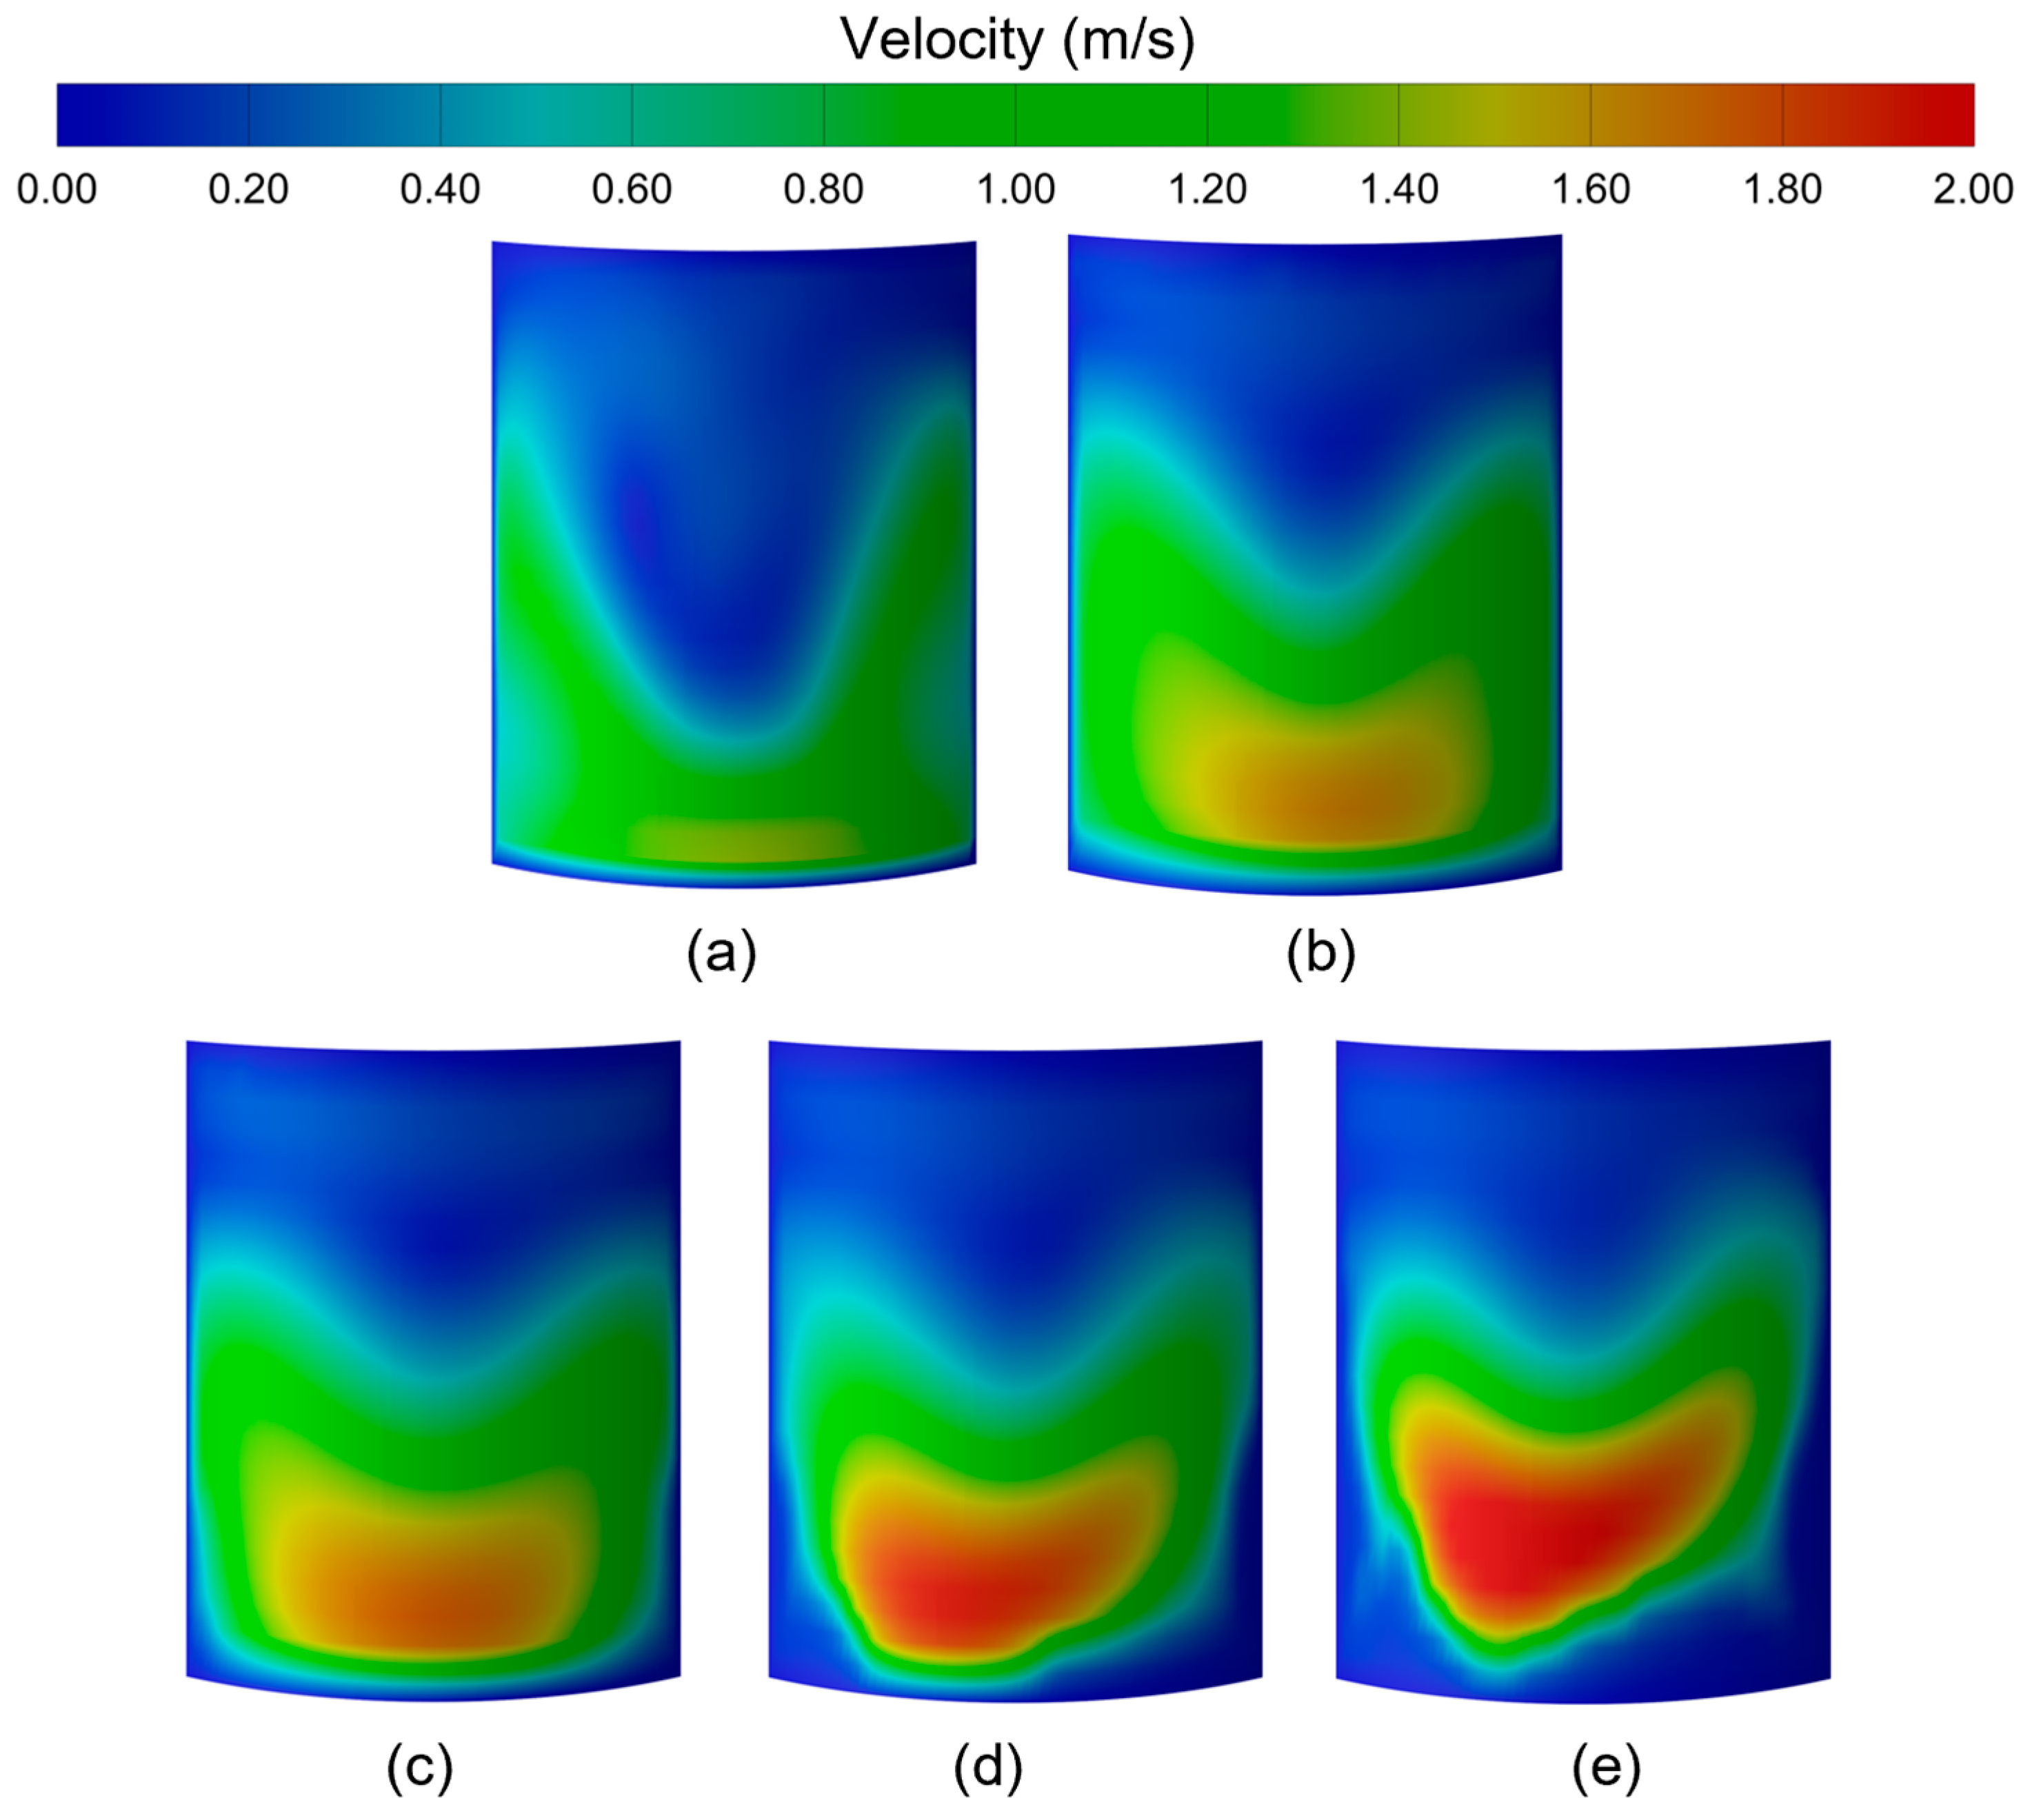
Figure 10 shows the velocity contours on the narrow wall of the mold at different simulation times. According to the figure, with increasing simulation time, the flow velocity of the molten steel near the narrow wall increases, the impact point shifts upward and the impact depth increases. In the actual process of continuous casting, the higher impinging velocity near the front of solidification will accelerate the heat transfer, which will result in a decrease in the thickness of the solidified shell at the narrow wall.

Figure 10.
Velocity contours on the narrow wall of the mold at different simulation times: (a) 0 s, (b) 100 s, (c) 200 s, (d) 300 s, (e) 400 s.
4.3. Effect of SEN Clogging on the Distribution of Argon Bubbles
Figure 11 gives the distribution and average volume fraction contours of argon gas bubbles in the mold at different simulation times. It can be found from the distribution of argon gas bubbles that with increasing simulation time, the number of argon gas bubbles floating up near the SEN decreases and the large-sized argon gas bubbles are carried further away from the SEN. This is because with increasing simulation time, the degree of clogging of SEN increases and the flow velocity of molten steel flowing out from the outlet of SEN increases. According to the average volume fraction contours, one can found with increasing simulation time, the average volume fraction of argon gas bubbles decreases near the SEN and the area with an average volume fraction over 0.0002 increases. In the late stage of clogging, the number of argon gas bubbles reaching near the narrow wall increases and the small-sized bubbles are difficult to float up, which will increase the incidence of bubble defects in the continuous casting slabs.
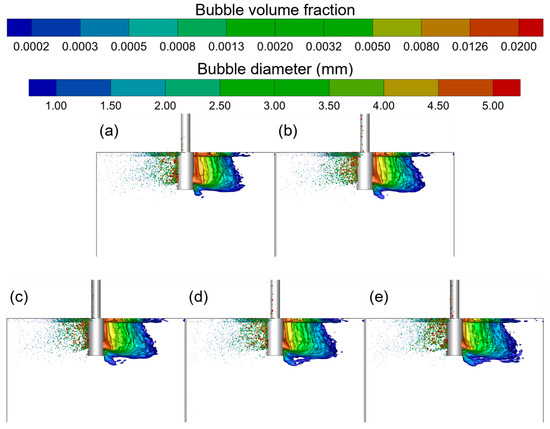
Figure 11.
Distribution and average volume fraction contours of argon gas bubbles in the mold at different simulation times: (a) 0 s, (b) 100 s, (c) 200 s, (d) 300 s, (e) 400 s.
4.4. Effect of SEN Clogging on the Fluctuation of the Steel/Slag Interface
Figure 12 demonstrates the fluctuation of the steel–slag interface in the mold at different simulation times. The initial interface between steel and slag is considered the equilibrium position, and the fluctuation value of the interface between steel and slag is the offset of the interface from the equilibrium position. It can be found that when there is no clogging, the fluctuation of the steel–slag interface is smaller near the narrow walls and larger near the SEN. With increasing simulation time, the fluctuation of the steel–slag interface increases near the narrow walls and decreases near the SEN. This is because with increasing simulation time, the flow velocity of the molten steel flowing out from the outlet of SEN increases, which will make the increased flow velocity of molten steel in the upper circulation flow and produce a greater impact on the steel–slag interface near the narrow walls. Near the SEN, the argon gas bubbles with large sizes will be carried away from SEN by molten steel, because the intensity of the molten steel jet out from the side holes will be enhanced; therefore, the amount of molten steel that flows from the side holes of the SEN and moves directly upward near the SEN reduces and the impact on the steel–slag interface near the SEN reduces. When the positive fluctuation of the steel–slag interface near narrow walls is large, the negative fluctuation near the 1/4 width of the mold will also increase. The shear-force-inducing slag entrapment will occur near the maximum negative fluctuation position. Compared with the slag entrapment droplets caused by argon gas bubbles near the SEN, the slag entrainment droplets caused by shear force are easier to enter into the molten steel in the mold, resulting in slag entrapment defects. Therefore, with increasing the clogging time, the risk of slag entrainment defects will increase.
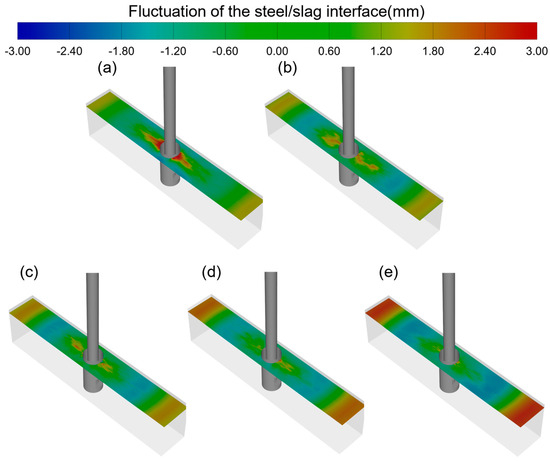
Figure 12.
Fluctuation of the steel–slag interface in the mold at different simulation times: (a) 0 s, (b) 100 s, (c) 200 s, (d) 300 s, (e) 400 s.
5. Conclusions
In the present paper, the clogging process of the concave bottom nozzle in the continuous casting slab mold and its effects on the flow field, the distribution of argon gas bubbles and the fluctuation of the steel–slag interface in the mold are studied with the numerical simulation assisted with high-temperature velocity measurement and the actual clogging morphology and measurement results of the submerged entry nozzle (SEN). The conclusions drawn from the comparative analysis of all results are as follows:
- The numerical simulation results of SEN clogging are in good agreement with the actual morphology and thicknesses of SEN clogging. In addition, the numerical simulation results of velocities near the 1/4 width of the mold at the late clogging stage are consistent with the measurement results of the surface flow velocity near the 1/4 width of the mold.
- The flow velocities of molten steel inside the SEN and at the outlet of the side hole increase with increasing simulation time and the degree of clogging, because the flow space is occupied with the clogging inclusions. This increases the strength of the upper circulation and lower circulation and increases the surface velocity of molten steel in the mold.
- The non-metallic inclusions are easy to adhere to the bottom of the SEN, because the flow velocities of molten steel and inclusions near the bottom are very low, which will make the growth rate of clogging at the bottom larger than those at the walls of the side holes and vertical part of SEN.
- With increasing the clogging simulation time and the clogging degree of the nozzle, the drag force of the molten steel jet to argon gas bubbles near the side holes of SEN will lead to an increase in the number of argon gas bubbles moving to the vicinity of the narrow walls.
- With increasing the clogging simulation time and the clogging degree of the nozzle, the fluctuation of the steel–slag interface near the narrow walls increases, resulting in the increased risk of slag entrapment caused by shear force.
Author Contributions
Conceptualization, Y.L., W.H. and J.L.; Methodology, Y.L., C.Z. and W.H.; Software, Y.L., Z.Y. and J.L.; Validation, W.H., C.Z. and J.L.; Formal Analysis, Z.Y. and Y.Z.; Investigation, W.H., C.Z. and Y.Z.; Resources, J.Y. and C.Z.; Data Curation, Y.L., Z.Y. and Y.Z.; Writing—Original Draft Preparation, Y.L., Y.Z. and J.L.; Writing—Review and Editing, Y.L. and J.Y.; Visualization, Y.L. and Z.Y.; Supervision, J.Y. and W.H.; Project Administration, J.Y; Funding Acquisition, J.Y. All authors have read and agreed to the published version of the manuscript.
Funding
This research was funded by the National Natural Science Foundation of China (U1960202).
Data Availability Statement
The original contributions presented in the study are included in the article, further inquiries can be directed to the corresponding author.
Acknowledgments
The authors also gratefully acknowledge the financial support from Shougang Jingtang United Steel Co., Ltd.
Conflicts of Interest
Authors Wenyuan He and Changliang Zhao were employed by the company Shougang Jingtang United Steel Co., Ltd. The authors declare that this study received funding from Shougang Jingtang United Steel Co., Ltd. The funder was not involved in the study design, collection, analysis, interpretation of data, the writing of this article or the decision to submit it for publication.
References
- Hashimoto, Y.; Matsui, A.; Hayase, T.; Kano, M. Real-Time Estimation of Molten Steel Flow in Continuous Casting Mold. Metall. Mater. Trans. B 2020, 51, 581–588. [Google Scholar] [CrossRef]
- Hua, C.; Bao, Y.; Wang, M.; Xiao, W. Effect of nozzle clogging on flow and inclusion transport in GCr15 steel casting process. J. Mater. Res. Technol. 2022, 19, 2330–2345. [Google Scholar] [CrossRef]
- Li, G.; Lu, C.; Gan, M.; Wang, Q.; He, S. Influence of Submerged Entry Nozzle Clogging on the Flow Field and Slag Entrainment in the Continuous Casting Mold by the Physical Model. Metall. Mater. Trans. B 2022, 53, 1436–1445. [Google Scholar] [CrossRef]
- Srinivas, P.S.; Singh, A.; Korath, J.M.; Jana, A.K. A water-model experimental study of vortex characteristics due to nozzle clogging in slab caster mould. Ironmak. Steelmak. 2017, 44, 473–485. [Google Scholar] [CrossRef]
- Zhou, H.; Zhang, L.; Zhou, Q.; Chen, W.; Jiang, R.; Yin, K.; Yang, W. Clogging-Induced Asymmetrical and Transient Flow Pattern in a Steel Continuous Casting Slab Strand Measured Using Nail Boards. Steel Res. Int. 2021, 92, 2000547. [Google Scholar] [CrossRef]
- Luo, Y.; Ji, C.; He, W.; Liu, Y.; Yang, X.; Li, H. Fluid flow and heat transfer with nail dipping method in mould during continuous casting process. Can. Metall. Q. 2020, 59, 201–210. [Google Scholar] [CrossRef]
- Zhang, L.F.; Wang, Y.F.; Zuo, X.J. Flow Transport and Inclusion Motion in Steel Continuous-Casting Mold under Submerged Entry Nozzle Clogging Condition. Metall. Mater. Trans. B 2008, 39, 534–550. [Google Scholar] [CrossRef]
- Zhao, B.; Wu, W.; Zhi, J.; Su, C.; Zhang, J. Study on the formation mechanism of clogging layer of rare earth microalloyed Q355 steel’s submerged entry nozzle and process optimization. Ironmak. Steelmak. 2023, 50, 782–793. [Google Scholar] [CrossRef]
- Ji, S.; Yang, W.; Ren, Y.; Zhang, L. Clogging Growth on the Submerged Entry Nozzle During Continuous Casting of a Ca-Treated and Al-Killed Resulfurized Steel. Metall. Mater. Trans. B 2023, 54, 1630–1638. [Google Scholar] [CrossRef]
- Deng, Z.; Zhu, M.; Zhou, Y.; Sichen, D. Attachment of Alumina on the Wall of Submerged Entry Nozzle During Continuous Casting of Al-Killed Steel. Metall. Mater. Trans. B 2016, 47, 2015–2025. [Google Scholar] [CrossRef]
- Cui, H.; Bao, Y.-p.; Wang, M.; Wu, W.-S. Clogging behavior of submerged entry nozzles for Ti-bearing IF steel. Int. J. Miner. Metall. Mater. 2010, 17, 154–158. [Google Scholar] [CrossRef]
- Barati, H.; Wu, M.; Michelic, S.; Ilie, S.; Kharicha, A.; Ludwig, A.; Kang, Y.B. Mathematical Modeling of the Early Stage of Clogging of the SEN During Continuous Casting of Ti-ULC Steel. Metall. Mater. Trans. B 2021, 52, 4167–4178. [Google Scholar] [CrossRef]
- Barati, H.; Wu, M.; Kharicha, A.; Ludwig, A. Role of Solidification in Submerged Entry Nozzle Clogging During Continuous Casting of Steel. Steel Res. Int. 2020, 91, 2000230. [Google Scholar] [CrossRef]
- Hua, C.; Wang, M.; Bao, Y. Effect of Nozzle Clogging on the Fluid Flow Pattern in a Billet Mold with Particle Image Velocimetry Technology. Metall. Mater. Trans. B 2020, 51, 2871–2881. [Google Scholar] [CrossRef]
- Li, B.; Lu, H.; Shen, Z.; Sun, X.; Zhong, Y.; Ren, Z.; Lei, Z. Physical Modeling of Asymmetrical Flow in Slab Continuous Casting Mold due to Submerged Entry Nozzle Clogging with the Effect of Electromagnetic Stirring. ISIJ Int. 2019, 59, 2264–2271. [Google Scholar] [CrossRef]
- Srinivas, P.S.; Mishra, D.K.; Gupta, R.; Korath, J.M.; Jana, A.K. Vortex characteristics due to nozzle clogging in water caster mould: Modelling and validation. Can. Metall. Q. 2019, 58, 308–324. [Google Scholar] [CrossRef]
- Li, B.; Lu, H.; Zhong, Y.; Ren, Z.; Lei, Z. Influence of EMS on Asymmetric Flow with Different SEN Clogging Rates in a Slab Continuous Casting Mold. Metals 2019, 9, 1288. [Google Scholar] [CrossRef]
- Hua, C.; Bao, Y.; Wang, M. Numerical simulation and industrial application of nozzle clogging in bilateral-port nozzle. Powder Technol. 2021, 393, 405–420. [Google Scholar] [CrossRef]
- Vakhrushev, A.; Kharicha, A.; Wu, M.; Ludwig, A.; Tang, Y.; Hackl, G.; Nitzl, G.; Watzinger, J.; Bohacek, J. On Modelling Parasitic Solidification Due to Heat Loss at Submerged Entry Nozzle Region of Continuous Casting Mold. Metals 2021, 11, 1375. [Google Scholar] [CrossRef]
- Barati, H.; Wu, M.; Kharicha, A.; Ludwig, A. A transient model for nozzle clogging. Powder Technol. 2018, 329, 181–198. [Google Scholar] [CrossRef]
- Barati, H.; Wu, M.; Kharicha, A.; Ludwig, A. Calculation Accuracy and Efficiency of a Transient Model for Submerged Entry Nozzle Clogging. Metall. Mater. Trans. B 2019, 50, 1428–1443. [Google Scholar] [CrossRef]
- Liu, J.-Q.; Liu, Y.-B.; Sun, Q.; Lin, Y.; Du, L.; Meng, J.-S.; Yang, J. Numerical Simulation of Transient Submerged Entry Nozzle Clogging With Euler–Euler and Euler–Lagrange Frameworks. Metall. Mater. Trans. B 2023, 54, 2629–2650. [Google Scholar] [CrossRef]
- Zhang, T.; Yang, J.; Jiang, P. Measurement of Molten Steel Velocity near the Surface and Modeling for Transient Fluid Flow in the Continuous Casting Mold. Metals 2019, 9, 36. [Google Scholar] [CrossRef]
- Dieguez Salgado, U.; Weiß, C.; Michelic, S.K.; Bernhard, C. Fluid Force-Induced Detachment Criteria for Nonmetallic Inclusions Adhered to a Refractory/Molten Steel Interface. Metall. Mater. Trans. B 2018, 49, 1632–1643. [Google Scholar] [CrossRef]
- Liu, Y.B.; Yang, J.; Lin, Z.Q. Mathematical Modeling of Mold Flow Field and Mold Flux Entrainment Assisted With High-Temperature Quantitative Velocity Measurement and Water Modeling. Metall. Mater. Trans. B 2022, 53, 2030–2050. [Google Scholar] [CrossRef]
- Thomas, B.G.; Huang, X.; Sussman, R.C. Simulation of Argon Gas Flow Effects in a Continuous Slab Caster. Metall. Mater. Trans. B 1994, 25, 527–547. [Google Scholar] [CrossRef]
- Brackbill, J.; Kothe, D.; Ca, Z. A Continuum Method for Modeling Surface Tension. J. Comput. Phys. 1992, 100, 335–354. [Google Scholar] [CrossRef]
- Jinbo, L.; Tao, Z.; Fubin, G.; Yankun, G.; Dan, Z. Analysis of nozzle clogging position in a continuous casting mold. Int. J. Chem. React. Eng. 2022, 20, 1027–1033. [Google Scholar] [CrossRef]
- Henry, C.; Minier, J.-P.; Lefèvre, G. Towards a description of particulate fouling: From single particle deposition to clogging. Adv. Colloid. Interface Sci. 2012, 185, 34–76. [Google Scholar] [CrossRef]


Disclaimer/Publisher’s Note: The statements, opinions and data contained in all publications are solely those of the individual author(s) and contributor(s) and not of MDPI and/or the editor(s). MDPI and/or the editor(s) disclaim responsibility for any injury to people or property resulting from any ideas, methods, instructions or products referred to in the content. |
© 2024 by the authors. Licensee MDPI, Basel, Switzerland. This article is an open access article distributed under the terms and conditions of the Creative Commons Attribution (CC BY) license (https://creativecommons.org/licenses/by/4.0/).