Abstract
Under high pressures, many crystalline metals undergo solid–solid phase transformations. In order to accurately model the behavior of materials under extreme loading conditions, it is essential to understand the kinetics of phase transition. Using molecular dynamics simulations, this work demonstrates the feasibility of characterizing the speeds of a moving phase boundary using atomistic simulations employing a suitable empirical potential for single-crystal magnesium. The model can provide temperature- and tensorial stress-dependent velocity of a moving phase boundary as a rate-limiting contribution to the kinetics of phase transformation in continuum codes. Results demonstrate that a nonlinear interaction exists between plasticity and phase transition, facilitating a jump in the velocity of a moving phase boundary, facilitated by activated plastic deformation mechanisms.
1. Introduction
Understanding the dynamic materials response at high pressure is important for planetary science, geology, and defense-related engineering applications. Dynamic compression experiments are often used to characterize the multi-phase equation of state. Shock loading conditions or high-pressure static conditions are useful for identifying phase transformation pressures. However, it is difficult to characterize phase transition kinetics as a function of microstructure and defects. This work provides new insights into the rate-limiting description for the rapid kinetics of a phase boundary using atomistic simulations.
The equation of state is usually employed to compute the evolution of material phases, which strongly influence the evolution of thermodynamic state variables. Thermodynamic state variables have recently been shown to be influenced by dislocations generated in the material before undergoing phase transition [1]. Moreover, the mechanical response of hexagonal-closed packed (HCP) structured materials is generally less understood than face-centered cubic (FCC) and other cubic materials.
Magnesium is an attractive material for structural applications in the defense and civilian sectors due to its high specific strength and formability. Magnesium has an HCP structure at ambient temperature and pressure conditions. At high pressure, magnesium (Mg) demonstrates phase transformation from a hexagonal-closed packed (HCP) structure to a body-centered cubic (BCC) structure [2,3,4]. In addition, Mg is a ductile material, and both FCC and BCC structures can demonstrate plastic deformation mechanisms. Interestingly, the incorporation of a BCC phase within the nanostructured Mg enhances ductility and strength while maintaining the lightweight nature and high strength-to-weight ratio compared to HCP Mg alone [5]. The continuum-level model incorporating the kinetics of phase transition is, thus, crucial for predictive simulations of shock and deformation response at high pressures.
Currently, the uncoupled nature of the commonly employed equation of state (for high-pressure response) and constitutive model (for plasticity) is less effective in predicting the nonlinear interaction between plasticity and phase transformation [6,7]. In order to model the behavior of Mg accurately under extreme loading conditions, it is essential to understand the kinetics of phase transition as a function of defects. The kinetics of phase transition refers to the pressure-dependent evolution of phase-transformed volume fraction. However, the shear stress and activated plastic deformation mechanisms have been known to influence the phase transition [8]. The effect of shear stress is typically incorporated as a correction factor for the equation of state (EOS) models [9]. However, a more quantitative understanding of the interaction between the shear stress-activated defects and phase transition kinetics is required. This work demonstrates that a model using atomistic simulations can characterize these interactions under controlled tensorial stress.
This work uses atomistic-level simulations to characterize the evolution of high-pressure phase transition in magnesium. Specifically, this work identifies speeds of the phase boundary in magnesium, which have not been reported to the best of the author’s knowledge. This research is an important step in enabling the development of continuum models of high-pressure phase transformation incorporating microstructural defects.
2. Background
Moriarty and McMahan (1982) were the first to identify the high-pressure HCP-BCC phase transition in magnesium (Mg) at 57 GPa, using first-principle techniques [4]. The studies of HCP-BCC phase transformation in Mg have gained attention since the observation by Olijnyk and Holzapfel (1985) [10]. They used energy-dispersive X-ray diffraction at room temperature and pressure of around 50 ± 6 GPa, obtained using a diamond anvil cell, with an estimated volume change of 1%. Milathianaki et al. (2012) [11] conducted dynamic shock-loading experiments on Mg using nanosecond resolution lattice measurements. They captured a compressed BCC phase at 26.2 ± 1.3 GPa at much higher temperatures along the principal shock Hugoniot.
Agarwal and Dongare conducted two studies on single crystal Mg. The first study [12] focused on the shock Hugoniot of single crystal Mg, while the second study [13] examined the shock-wave propagation and spall failure of single crystal Mg using the potential developed by Sun et al. (2006) [14]. Jian et al. (2022) [15] explained the crystallographic mechanism associated with the transition from HCP to BCC along the shock Hugoniot for shocking along different crystallographic directions. Simulations suggested an orientation relationship between HCP and BCC phases as .
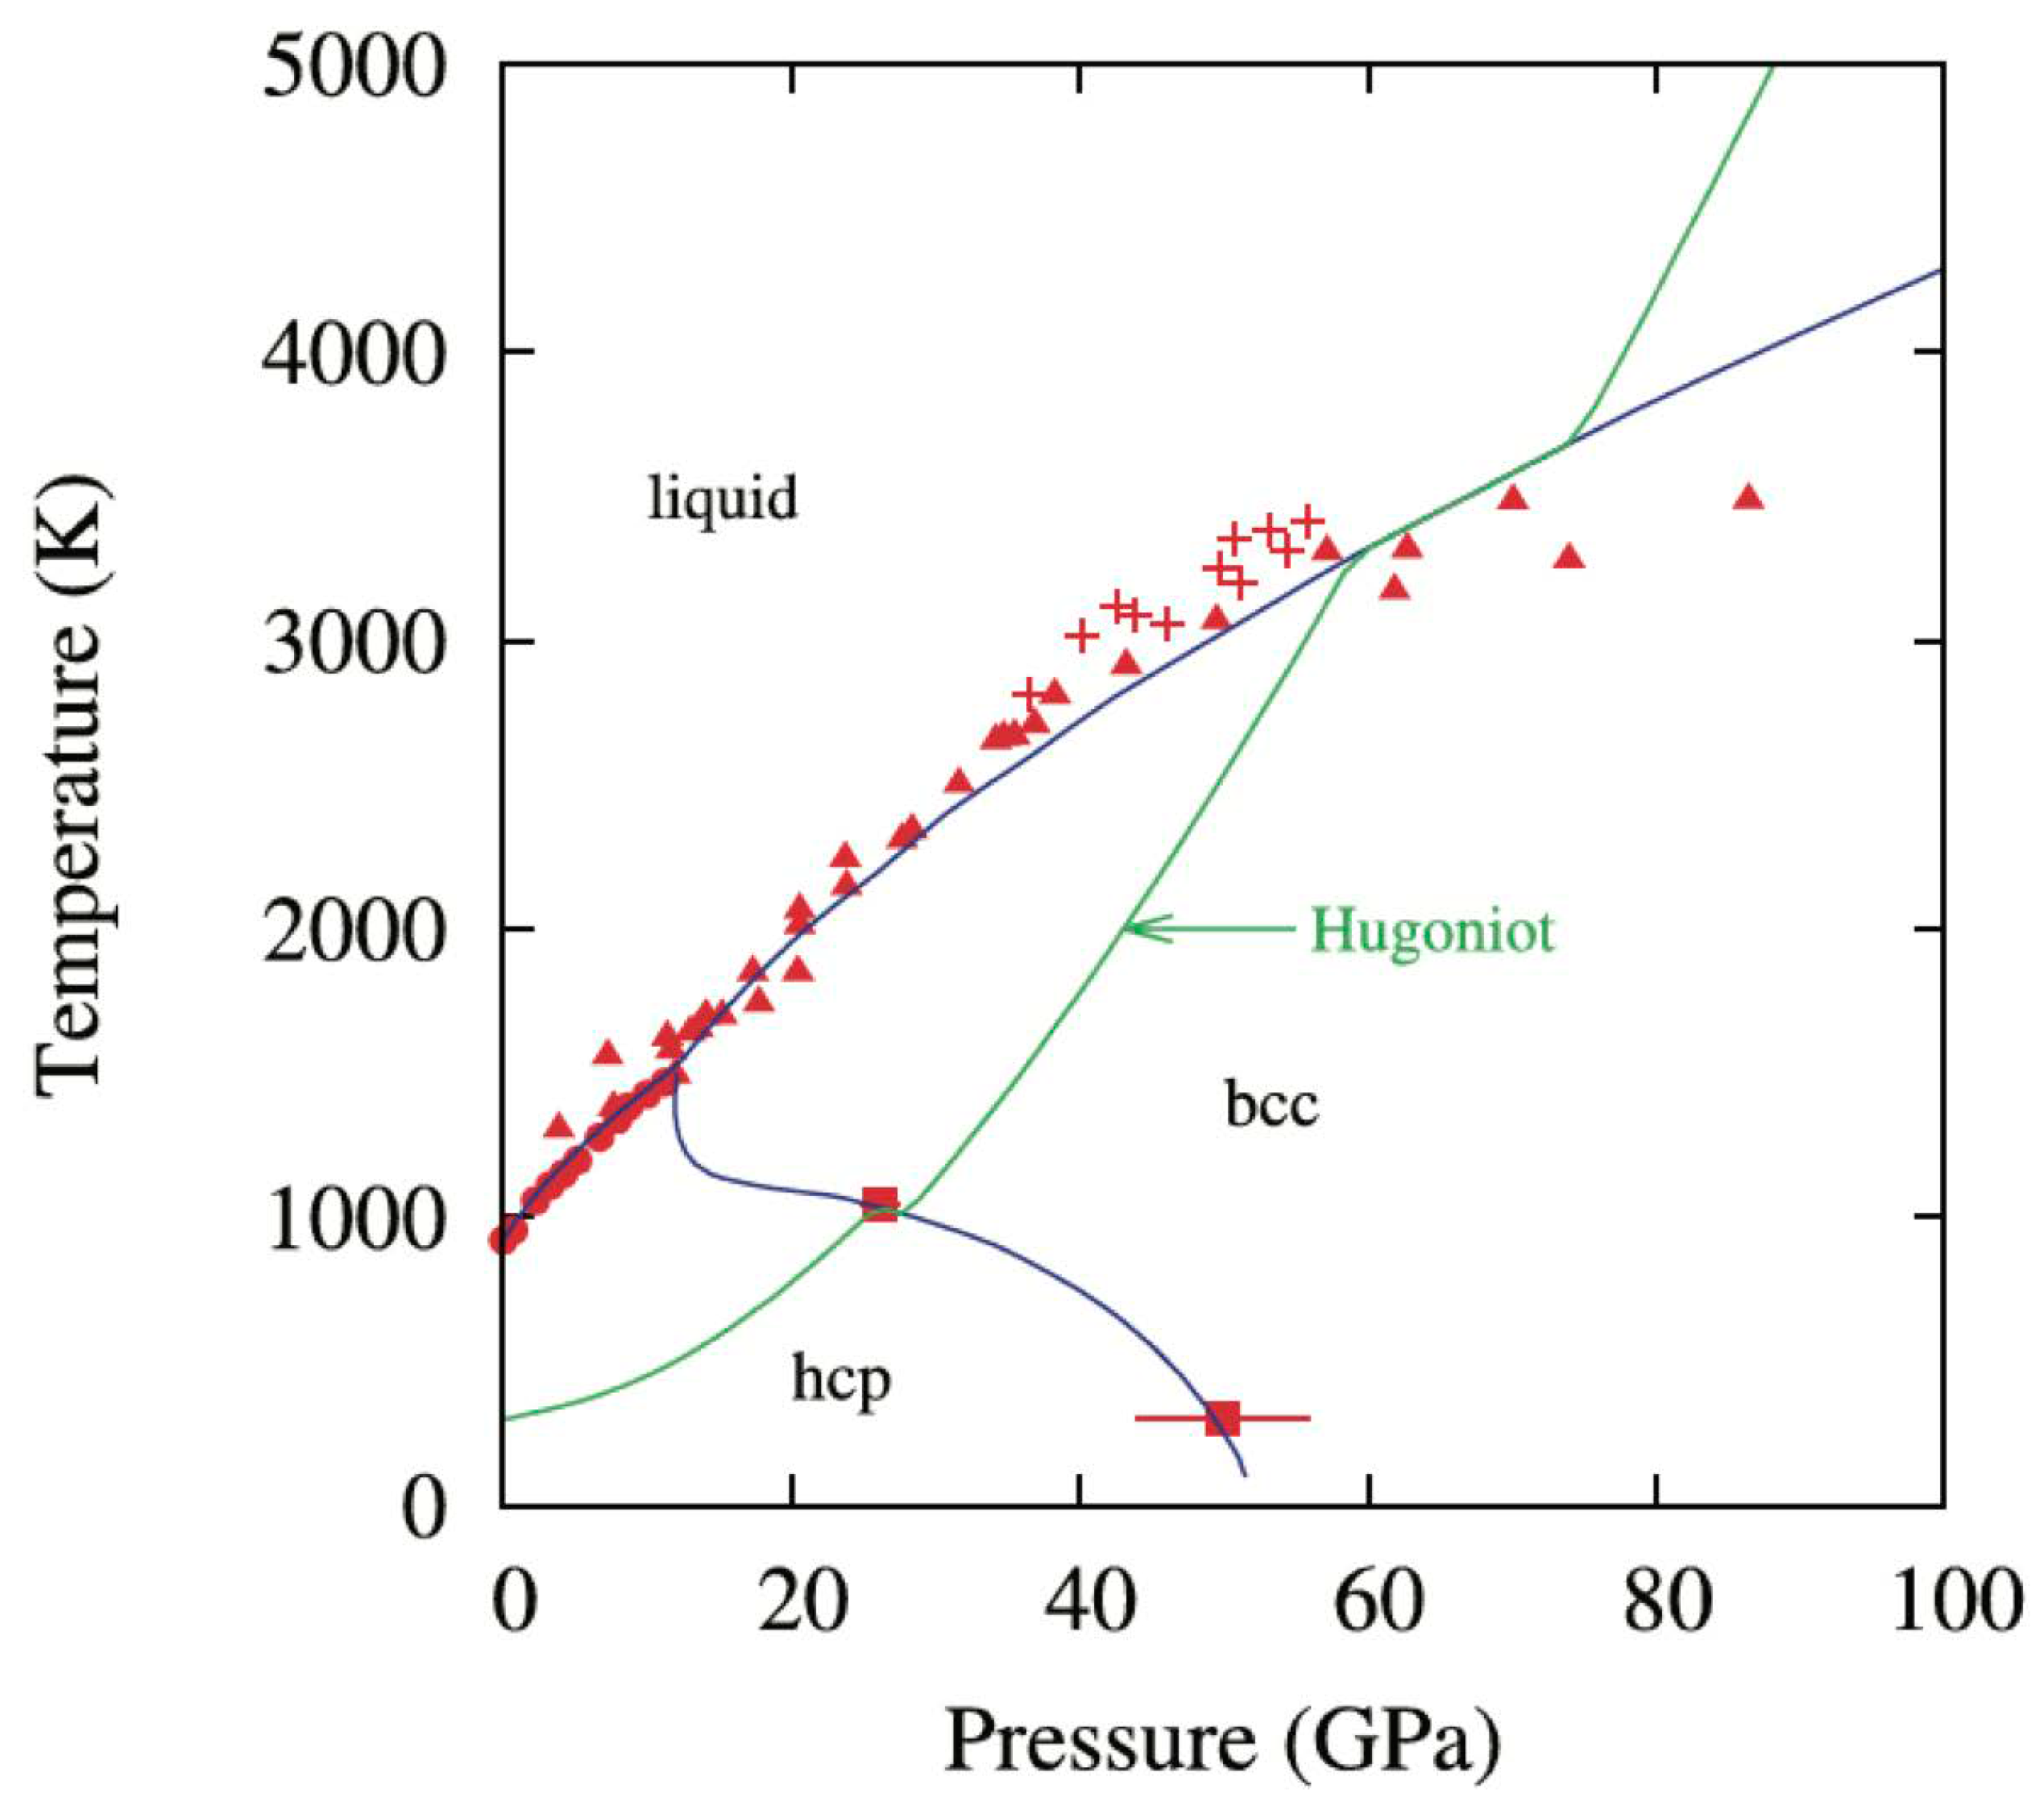
The pressure required for the HCP-BCC phase transformation in magnesium (Mg) varies with the temperature, as depicted in Figure 1. The figure shows the phase diagram and Hugoniot for Mg [16]. It shows the calculated phase boundary (blue) and Hugoniot (green), which are in good agreement with the experimental data (red). In shock experiments, the HCP-BCC phase transformation occurs around 26.2 GPa pressure along the shock Hugoniot [11]. At room temperature, the estimated pressure for this phase transformation is approximately 46 GPa [16].
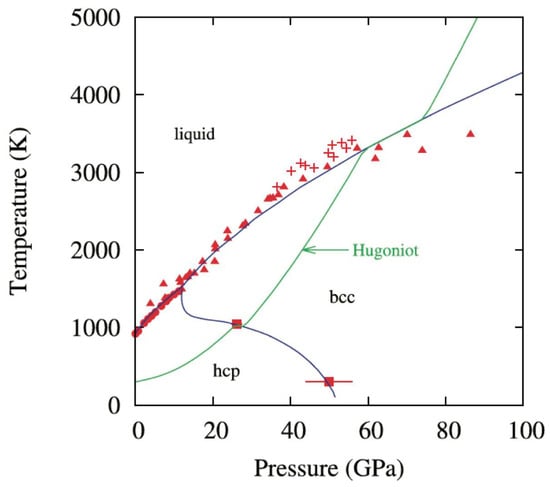
Figure 1.
Phase diagram and Hugoniot for Mg. The calculated phase boundary (blue), the Hugoniot (green), and the experimental data (Red). Experiments indicate phase transformation pressure as 50 ± 6 GPa at 300 K Reprinted from Ref. [16]. MD simulations were performed at 300 K to validate the capability of the potential described by Sun et al., Reprinted from Ref. [14] to simulate the HCP-BCC phase transition pressure.
This work focuses on the motion of the phase boundary near the thermodynamic point of phase coexistence at high pressure and ambient temperature conditions. Specifically, this work demonstrates the feasibility of simulating the thermodynamically well-characterized HCP to BCC phase transformation. The study utilized molecular dynamics (MD) to investigate the speeds of the HCP-BCC phase transformation boundary in Mg under controlled initial pressure and temperature conditions. A realistic and accurate inter-molecular potential was used for pure Mg.
3. Methods
This work carefully chose the example of Mg because there exists a reasonably good interaction potential [14] that can accurately simulate crystal–melt interface at the correct melting temperature, liquid densities at melting, the stability of the HCP structure relative to the BCC up to the melting temperature, and the correct crystal structure for the crystal undergoing melting. This work employed an open-source molecular dynamics simulation program from Sandia National Laboratories, LAMMPS [17]. Interatomic potentials were obtained from the National Institute of Standards and Technology (www.ctcms.nist.gov/potentials, accessed on 1 May 2018).
This work employed a computation in LAMMPS to determine the common neighbor analysis (CNA) pattern [18]. The CNA analysis was used to identify local crystal structure, such as HCP (CNA = 2), BCC (CNA = 3), or disordered (CNA = 5), suggesting atoms in the first phase, the second phase, or atoms belonging to a grain boundary, respectively. If an atom is part of a basal stacking fault within an HCP phase, it is identified as FCC (CNA = 1). Similarly, atoms belonging to a twin boundary and grain boundary within a BCC phase are identified as disordered (CNA = 5).
In order to study the kinetics of the HCP-BCC phase boundary under an initial hydrostatic pressure and 300 K temperature, molecular dynamics (MD) simulations were conducted. The simulations used a constant volume and temperature (NVT) ensemble, and results were also compared against a constant volume and energy (NVE) ensemble as well as a constant pressure and temperature (NPT) ensemble. The ambient temperature conditions were chosen to facilitate comparison with available experimental data from diamond anvil cell measured from x-ray diffraction by Olijnyk and Holzapfel [10].
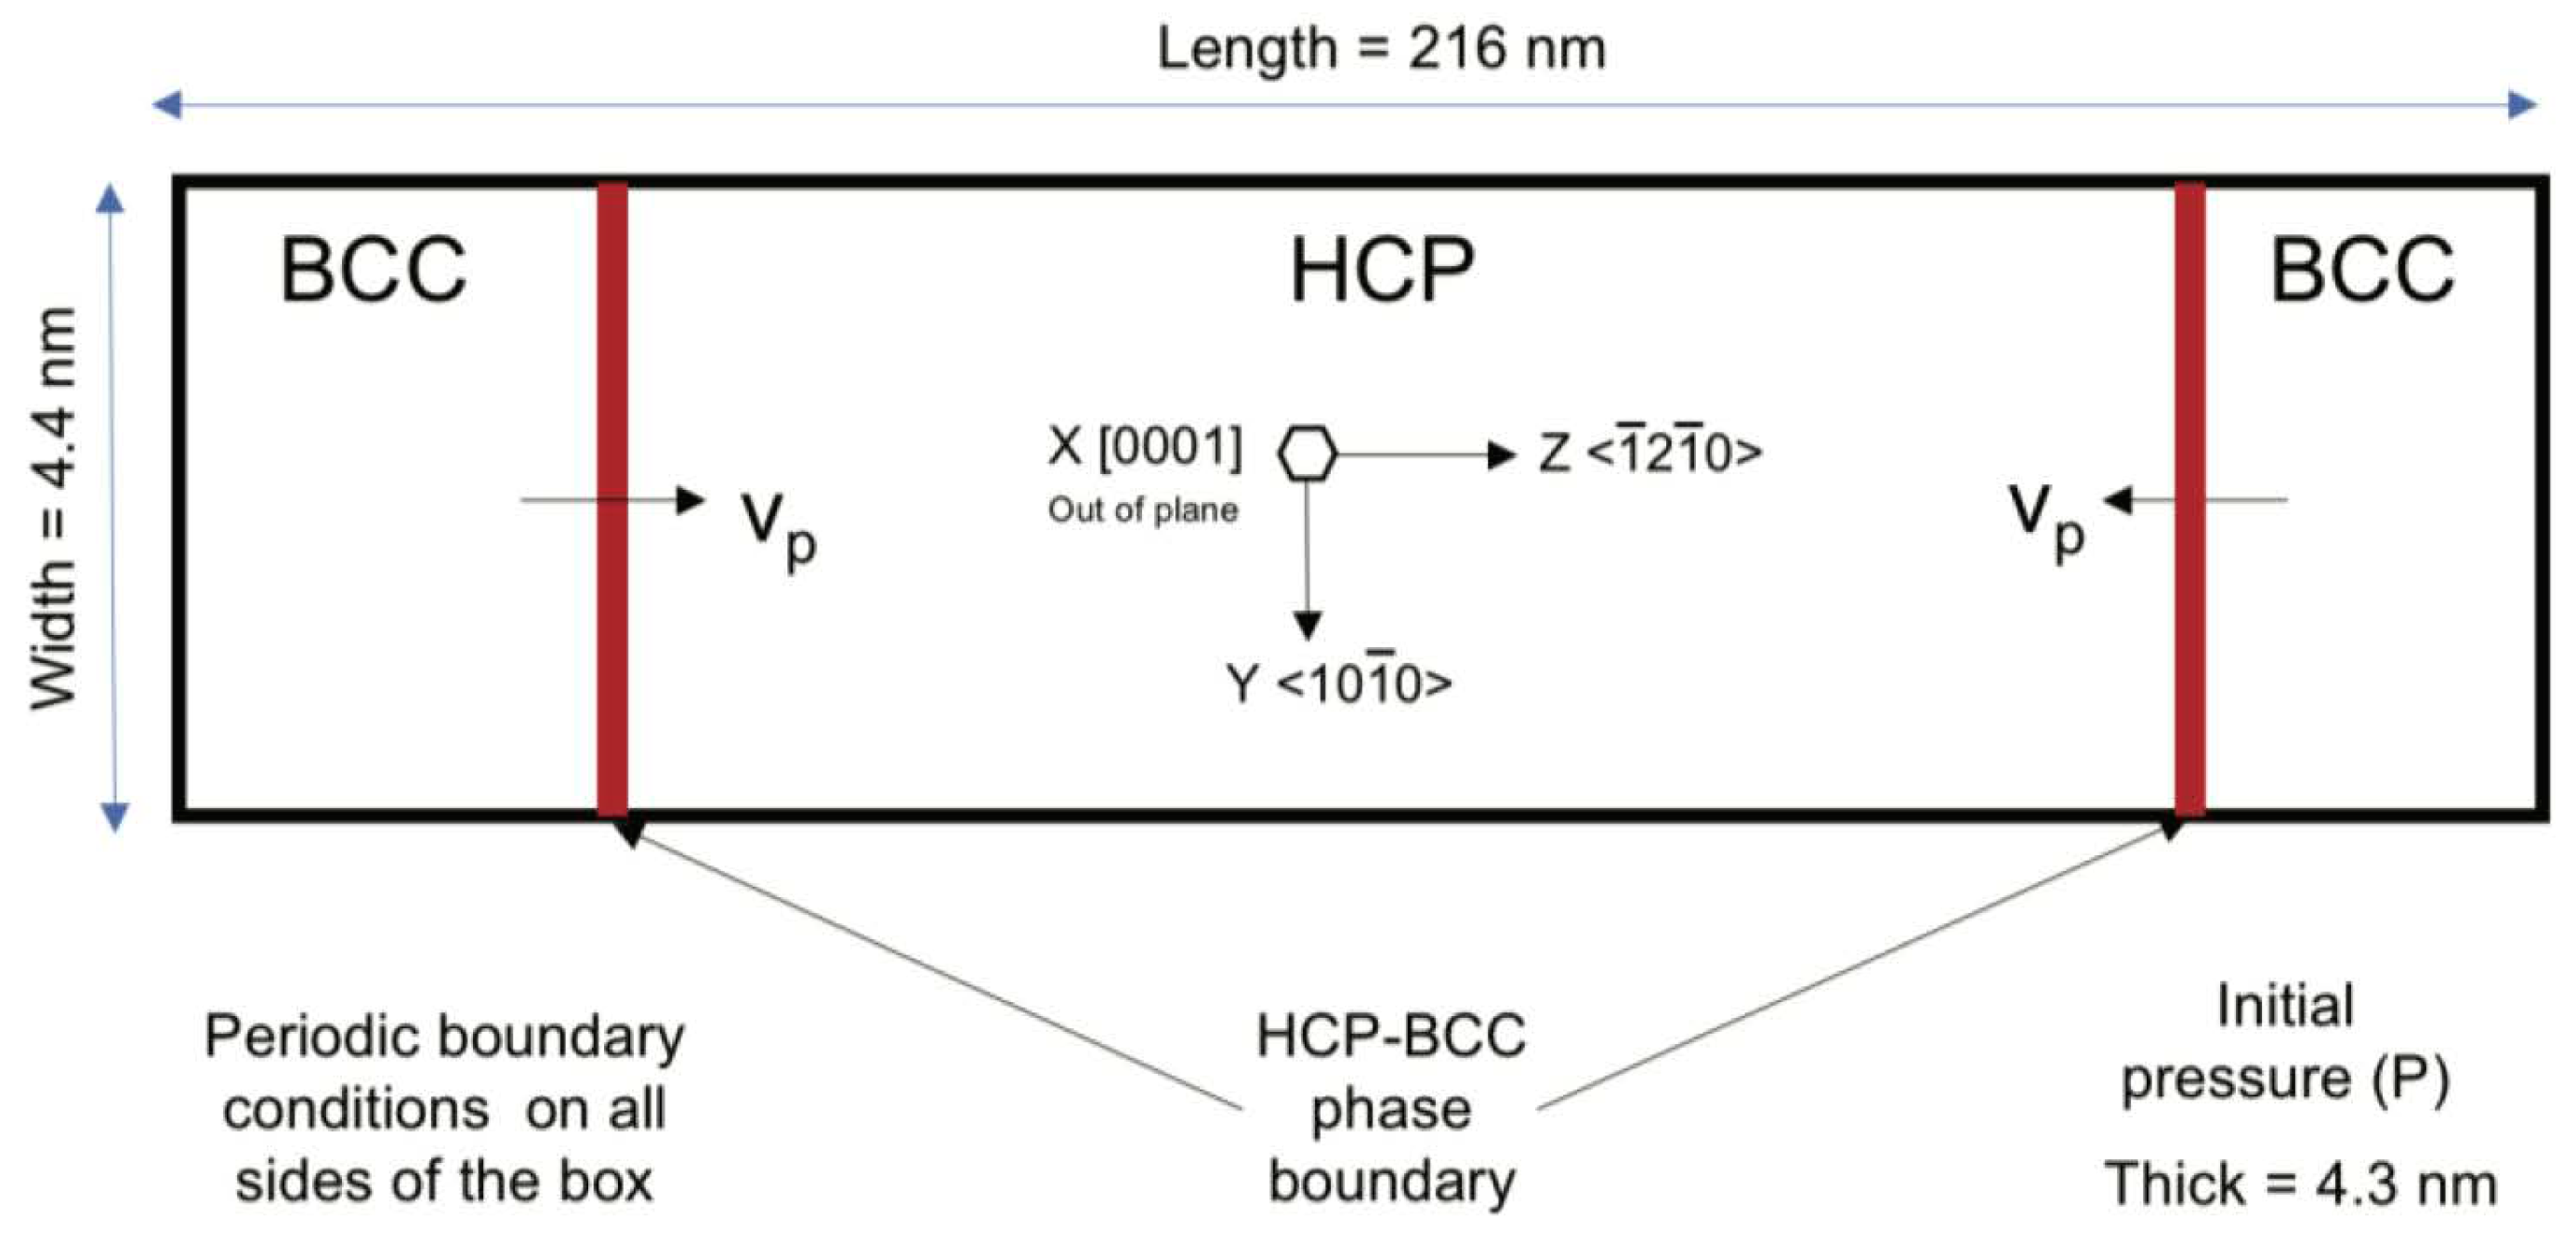
The schematic of the specimen geometry, boundary, and initial conditions for these simulations is shown in Figure 2. The MD specimen was oriented such that the c-axis of the HCP Mg was out-of-plane, which may promote activating prismatic slip systems and result in nucleation and motion of dislocations and twin boundaries, as previously observed in Mg. Periodic boundary conditions were applied on all sides, which allowed the nucleated HCP-BCC phase boundaries to traverse the entire specimen. The large aspect ratio of the specimen design prevented the stress release waves from interacting with each other.
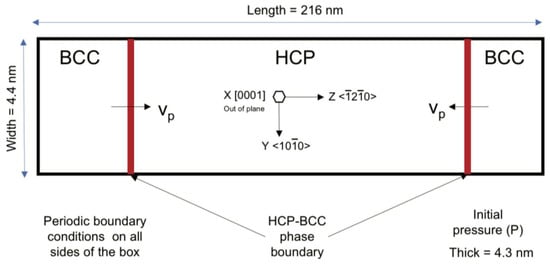
Figure 2.
Schematic of the specimen geometry, boundary, and initial conditions for molecular dynamics (MD) simulations to study the kinetics of the HCP-BCC phase boundary motion under an initial hydrostatic pressure.
4. Results and Discussion
Molecular dynamics simulations were conducted at a temperature of 300 K to validate atomistic potentials that can be used to model the phase transition pressure. For simulating the phase transformation of Mg, we considered two atomistic potentials, as follows: the potential by Sun et al. [14], which is the most widely used potential for Mg, and the potential developed by Wilson and Mendelev [19]. The latter corrects the tensile instability artifacts observed under spall conditions, caused by the potential by Sun et al., under high tensile stresses. Our work focused on high pressures (compressive stresses), so simulations using either potential are expected to align with the experimental results on phase transformation in magnesium at room temperature.
Simulated results obtained from three thermodynamic ensembles were assessed. The critical pressure for phase transformation was consistent between all the aforementioned ensembles. The kinetics of phase transition were expected to be different from one ensemble to another since differences in the ability of the ensembles to exchange thermal energy and mechanical work between the system and the surroundings are naturally expected to change the conditions for phase transition evolution.
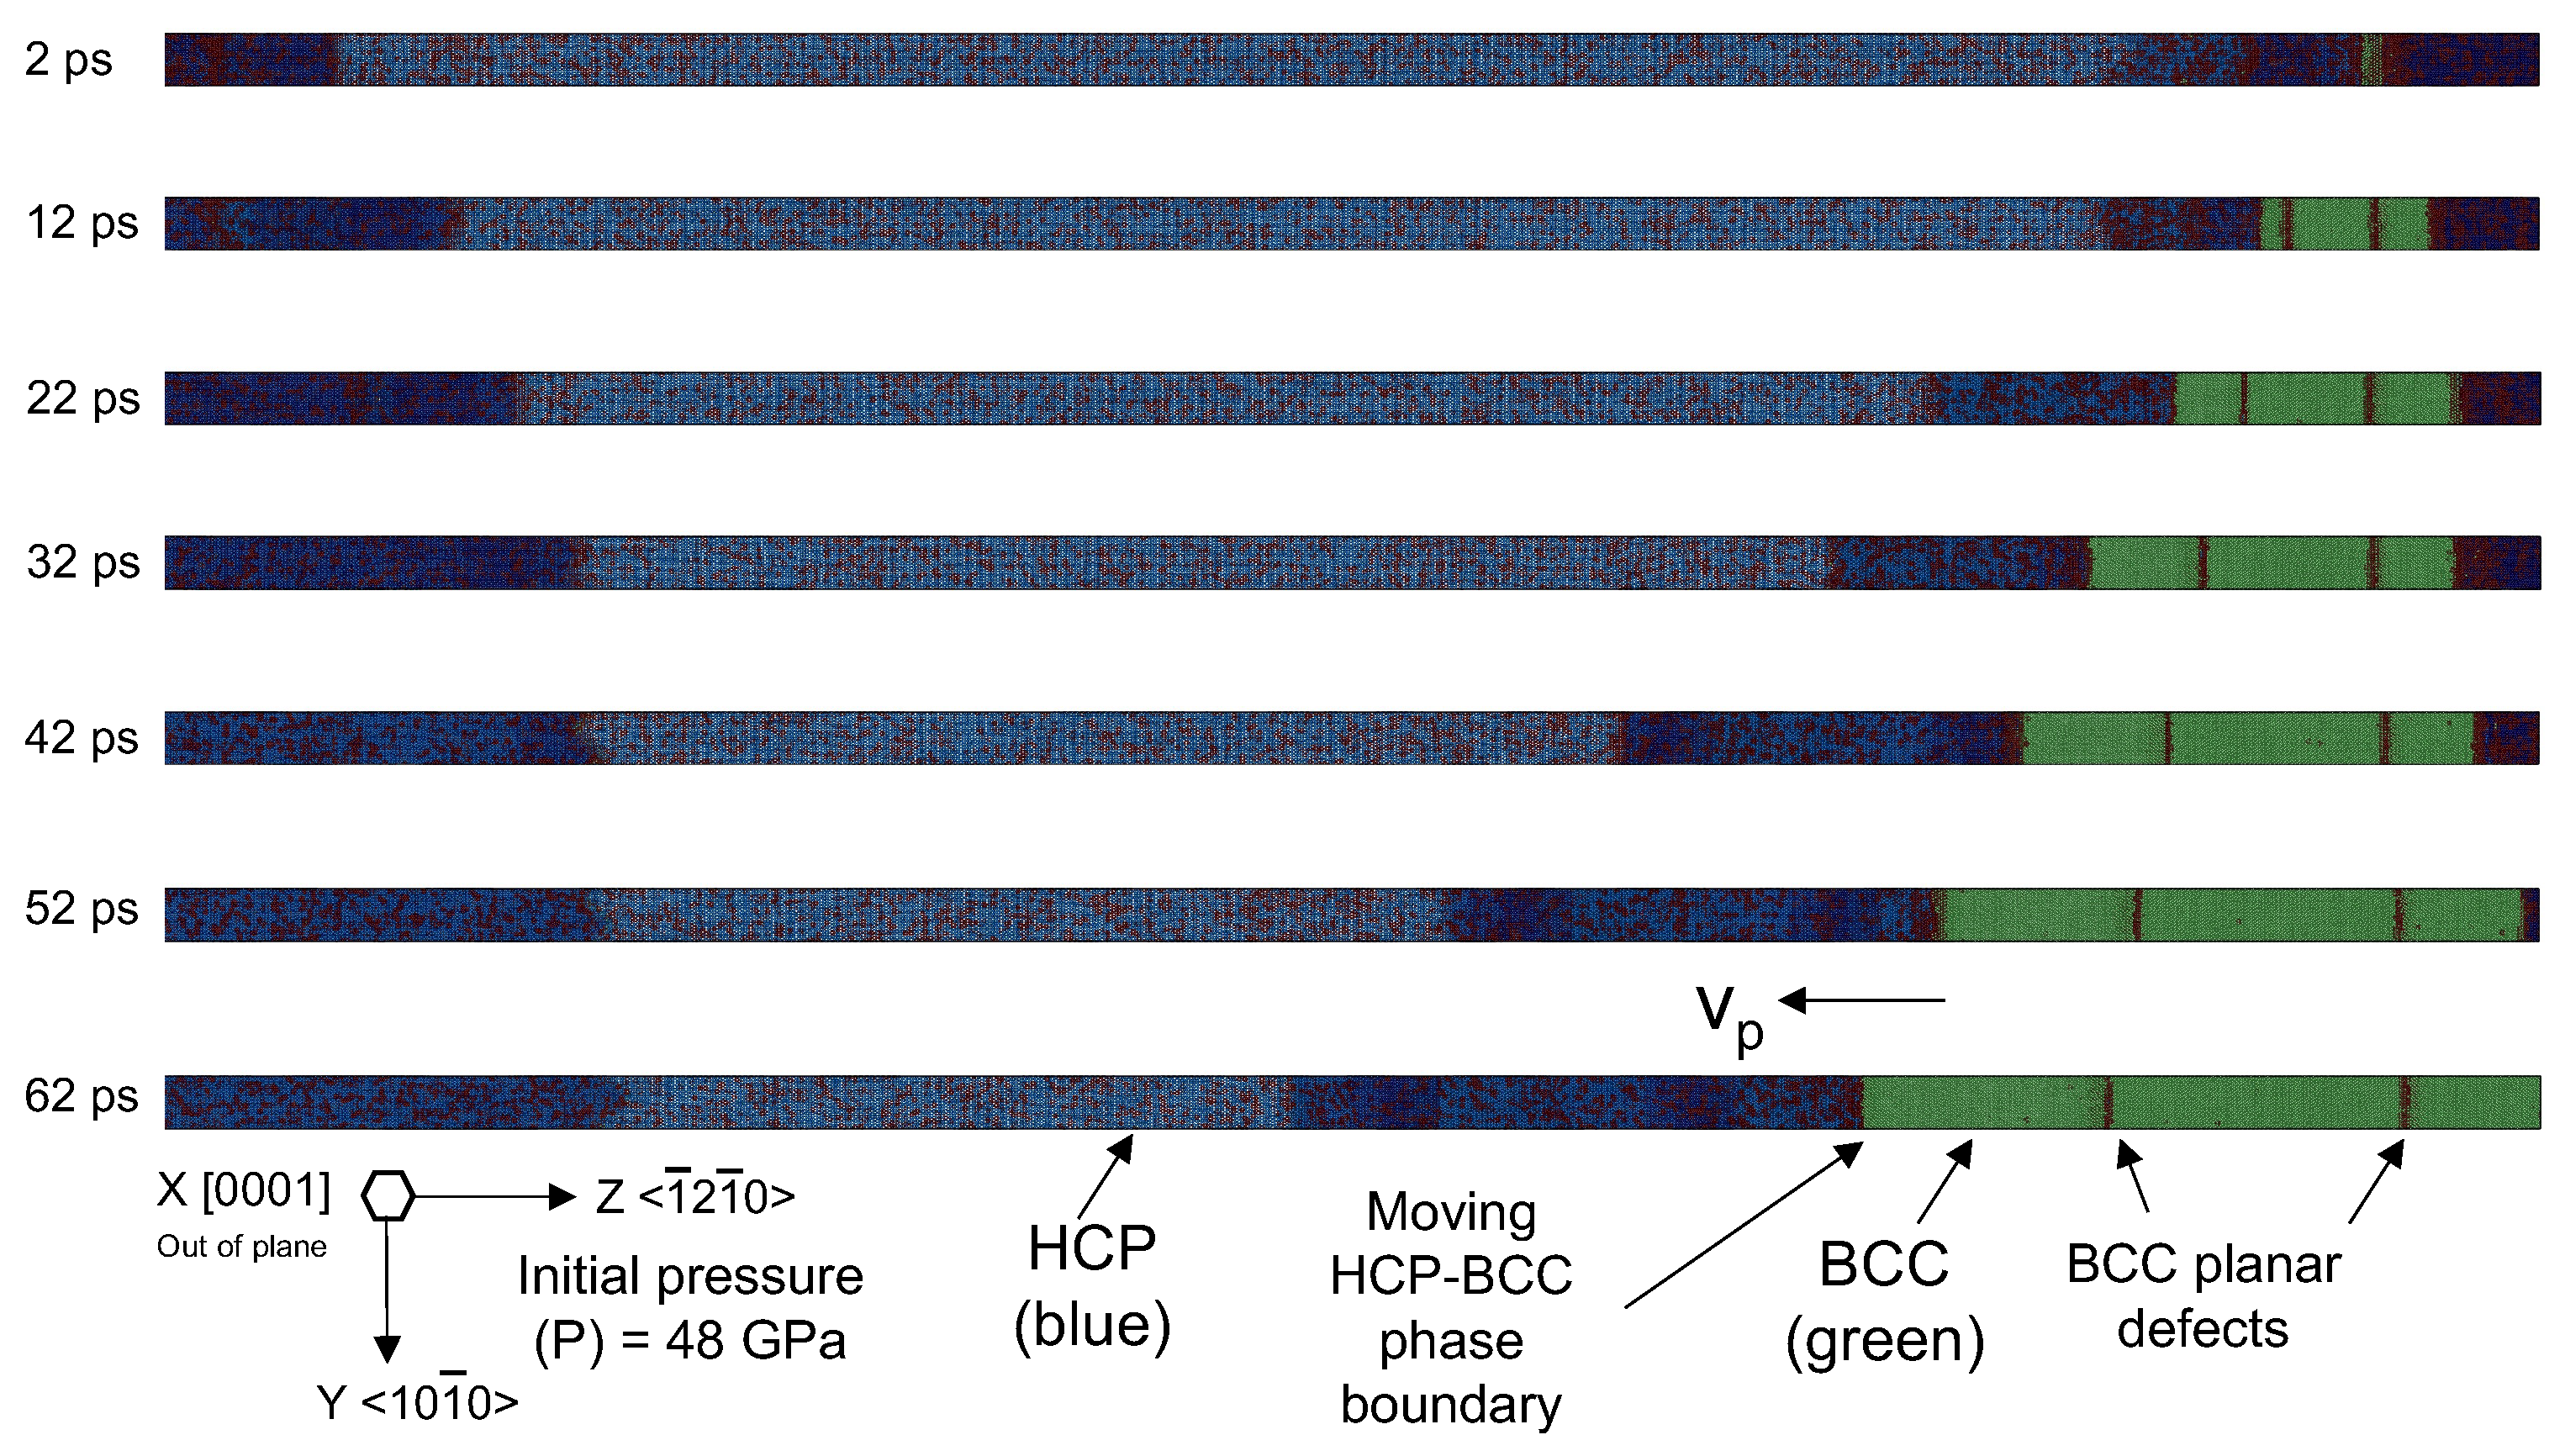
Figure 3 shows a series of snapshots taken at different times during a representative simulation of a phase transition. The simulation was conducted at an initial pressure of 48 GPa and a temperature of 300 K. In the figure, the blue atoms represent the HCP phase, while the green atoms belong to the BCC phase. The maroon-colored atoms within the HCP phase are disordered (CNA = 5). When viewed along the direction, the simulation results show the motion of a HCP-BCC phase boundary or a phase transition front. The boundary is composed of atoms a few layers thick, and the atoms within the boundary are disordered. Figure S1 shows the same result when viewed along direction. In this direction, stacking faults are seen in the basal plane of HCP Mg propagating ahead of the phase boundary. Stacking faults on the basal plane of HCP magnesium is an energetically favorable deformation mechanism [20]. Within the BCC phase in Figure 3, a planar boundary was observed to be left behind by the propagating phase boundary. This boundary, colored in red, is a grain boundary made up of several layers of thick atoms, and it is mobile.
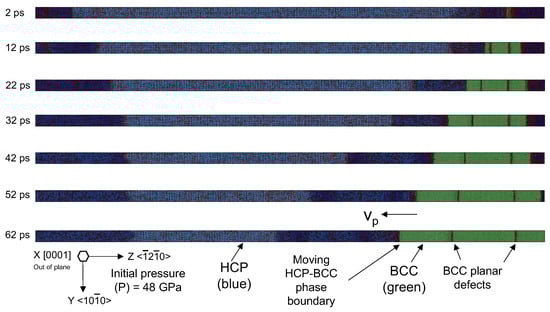
Figure 3.
Snapshots from a representative simulation result showing the motion of an HCP-BCC phase boundary. The snapshot is part of the specimen (right side of Figure 2) and not the entire specimen. BCC atoms are colored green, while HCP atoms are colored blue. The phase boundary comprises atoms a few layers thick, and the atoms are disordered (an incoherent boundary). Phase boundary motion is obtained under an initial pressure of 48 GPa and 300 K temperature under the constant volume and temperature thermodynamic ensemble.
The displacement and velocity histories from the HCP-BCC phase boundary (indicated by an arrow on the right side of Figure 3) are shown in Figure S2. The velocity history oscillates due to the nucleation of defects that dissipate energy behind (in BCC) and ahead (in HCP) of the propagating phase boundary. Additionally, the overall velocity decreases over time because the overall pressure in the system decreases as the HCP-to-BCC transformation progresses. Furthermore, the energy of the system reduces while maintaining a constant temperature via the NVT ensemble.
The phase boundary propagates under relatively pure hydrostatic pressure. This hydrostatic condition was further verified by plotting the evolution of the normal stress field in Figure S3, which shows that the pressure ahead of the phase boundary remains uniform. However, the stress state behind the phase boundary is no longer purely hydrostatic. Figure S4 shows a shear wave behind the moving phase boundary on the right. The stress tensor components were calculated using the virial stress formulation and time-averaged over 1 ps. The shear wave in Figure S4 (on the right) is traveling in the -ve Z-direction and coincides with the normal wave in Figure S3. Both the fronts of the shear and normal waves coincide with the position of the phase boundary. Due to the phase transformation from HCP to BCC, there is a jump in the shear stress and the normal stress components across the HCP-BCC phase boundary. The phase transformation leads to a reduction in the magnitude of pressure in the BCC phase. However, in the BCC domain, the magnitude of the normal stress components is unequal, resulting in finite shear stress, as seen in Figure S4. This shear stress component is likely responsible for defects, such as twin boundaries in the (BCC phase) wake of the moving HCP-BCC phase boundary.
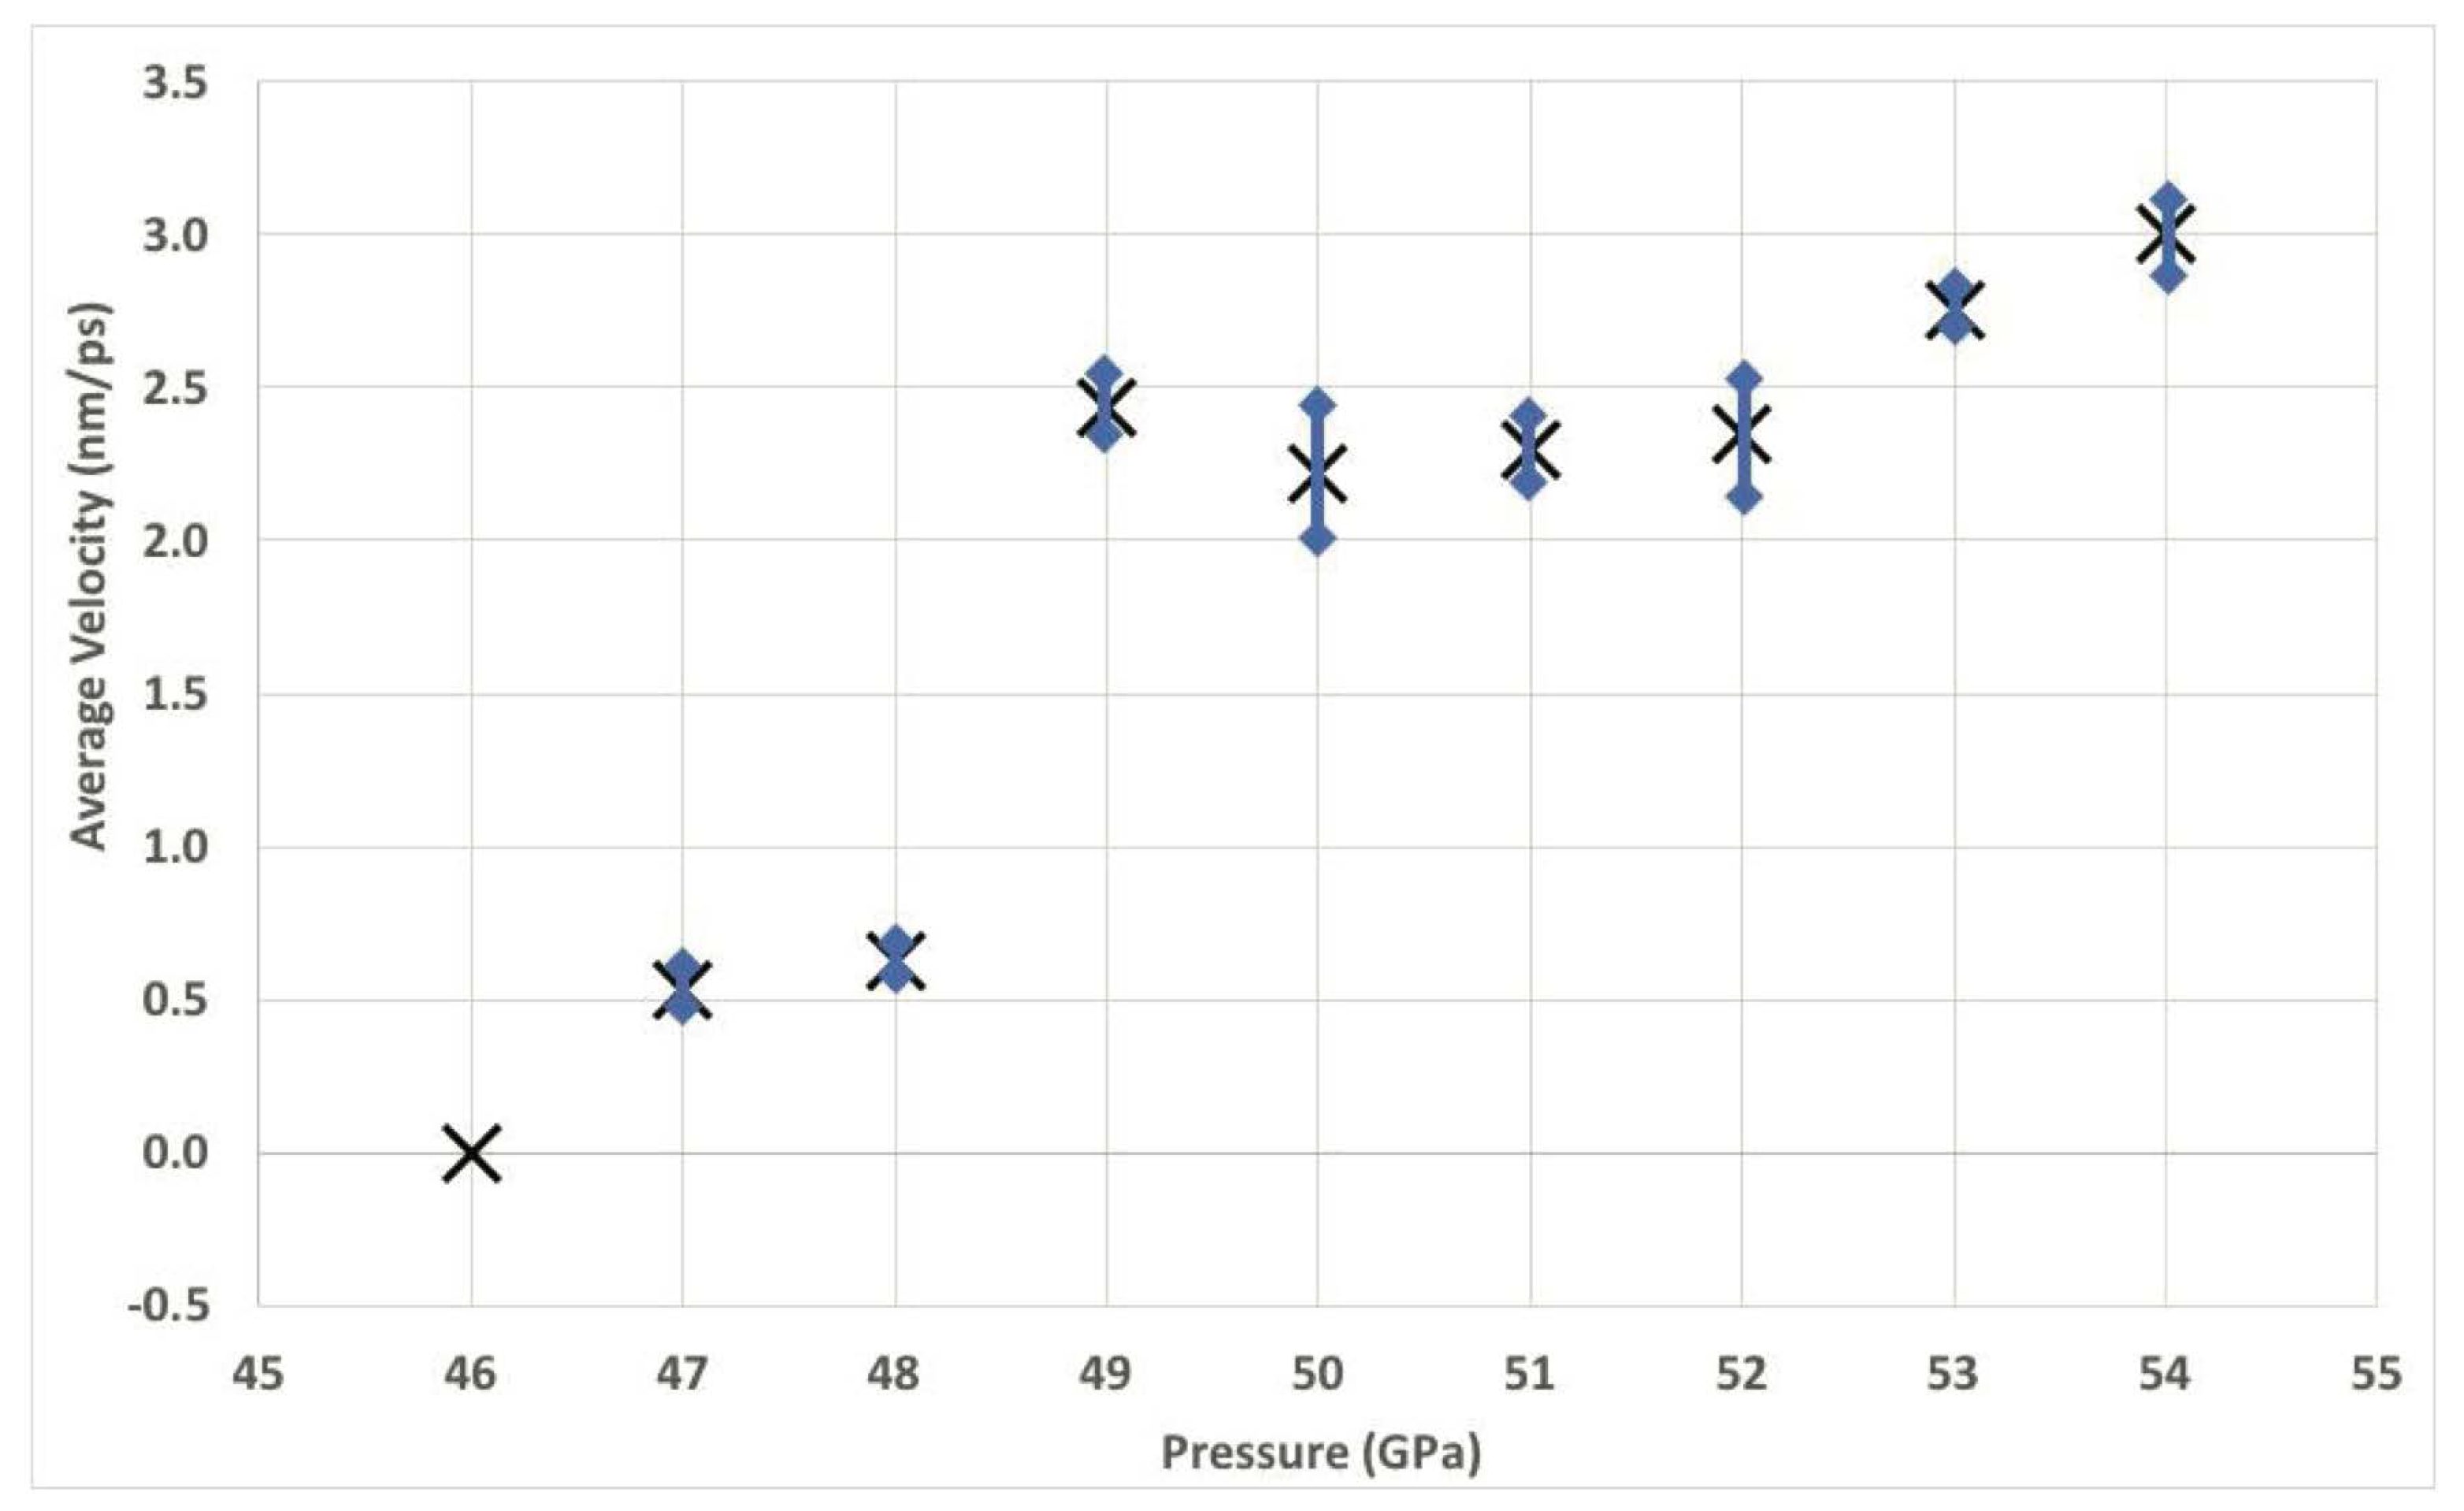
Figure 4 shows the velocity of a phase boundary with pressure. The propagation velocity starts at 46 GPa and increases to 650 m/s at 48 GPa. Between pressures of 48–49 GPa, a jump in the velocity is observed, reaching about 2500 m/s at 49 GPa. This jump is qualitatively similar to the non-monotonous kinetics of a twin boundary, which is caused by the nucleation of new mechanisms of plastic deformation (dislocations and twin boundaries) that influence the mode of propagation of the boundary (as reported in Daphalapurkar et al., 2014 [21]). This MD result indicates a non-monotonous dependence of phase boundary velocity on the pressure. Beyond pressures of 49 GPa to 54 GPa, the velocity of propagation increases, reaching about 3000 m/s. However, there is a slight decreasing trend in the velocity from 49 GPa to 50 GPa.
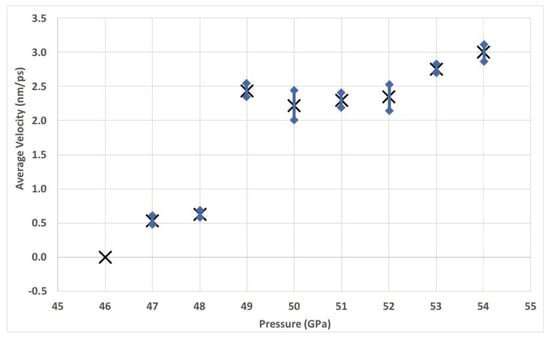
Figure 4.
The velocity of phase boundary propagation with pressure. This plot indicates a monotonic dependence of phase boundary velocity on pressure. A jump in the velocity is observed between pressures of 48 and 49 GPa. Bars indicate one standard deviation.
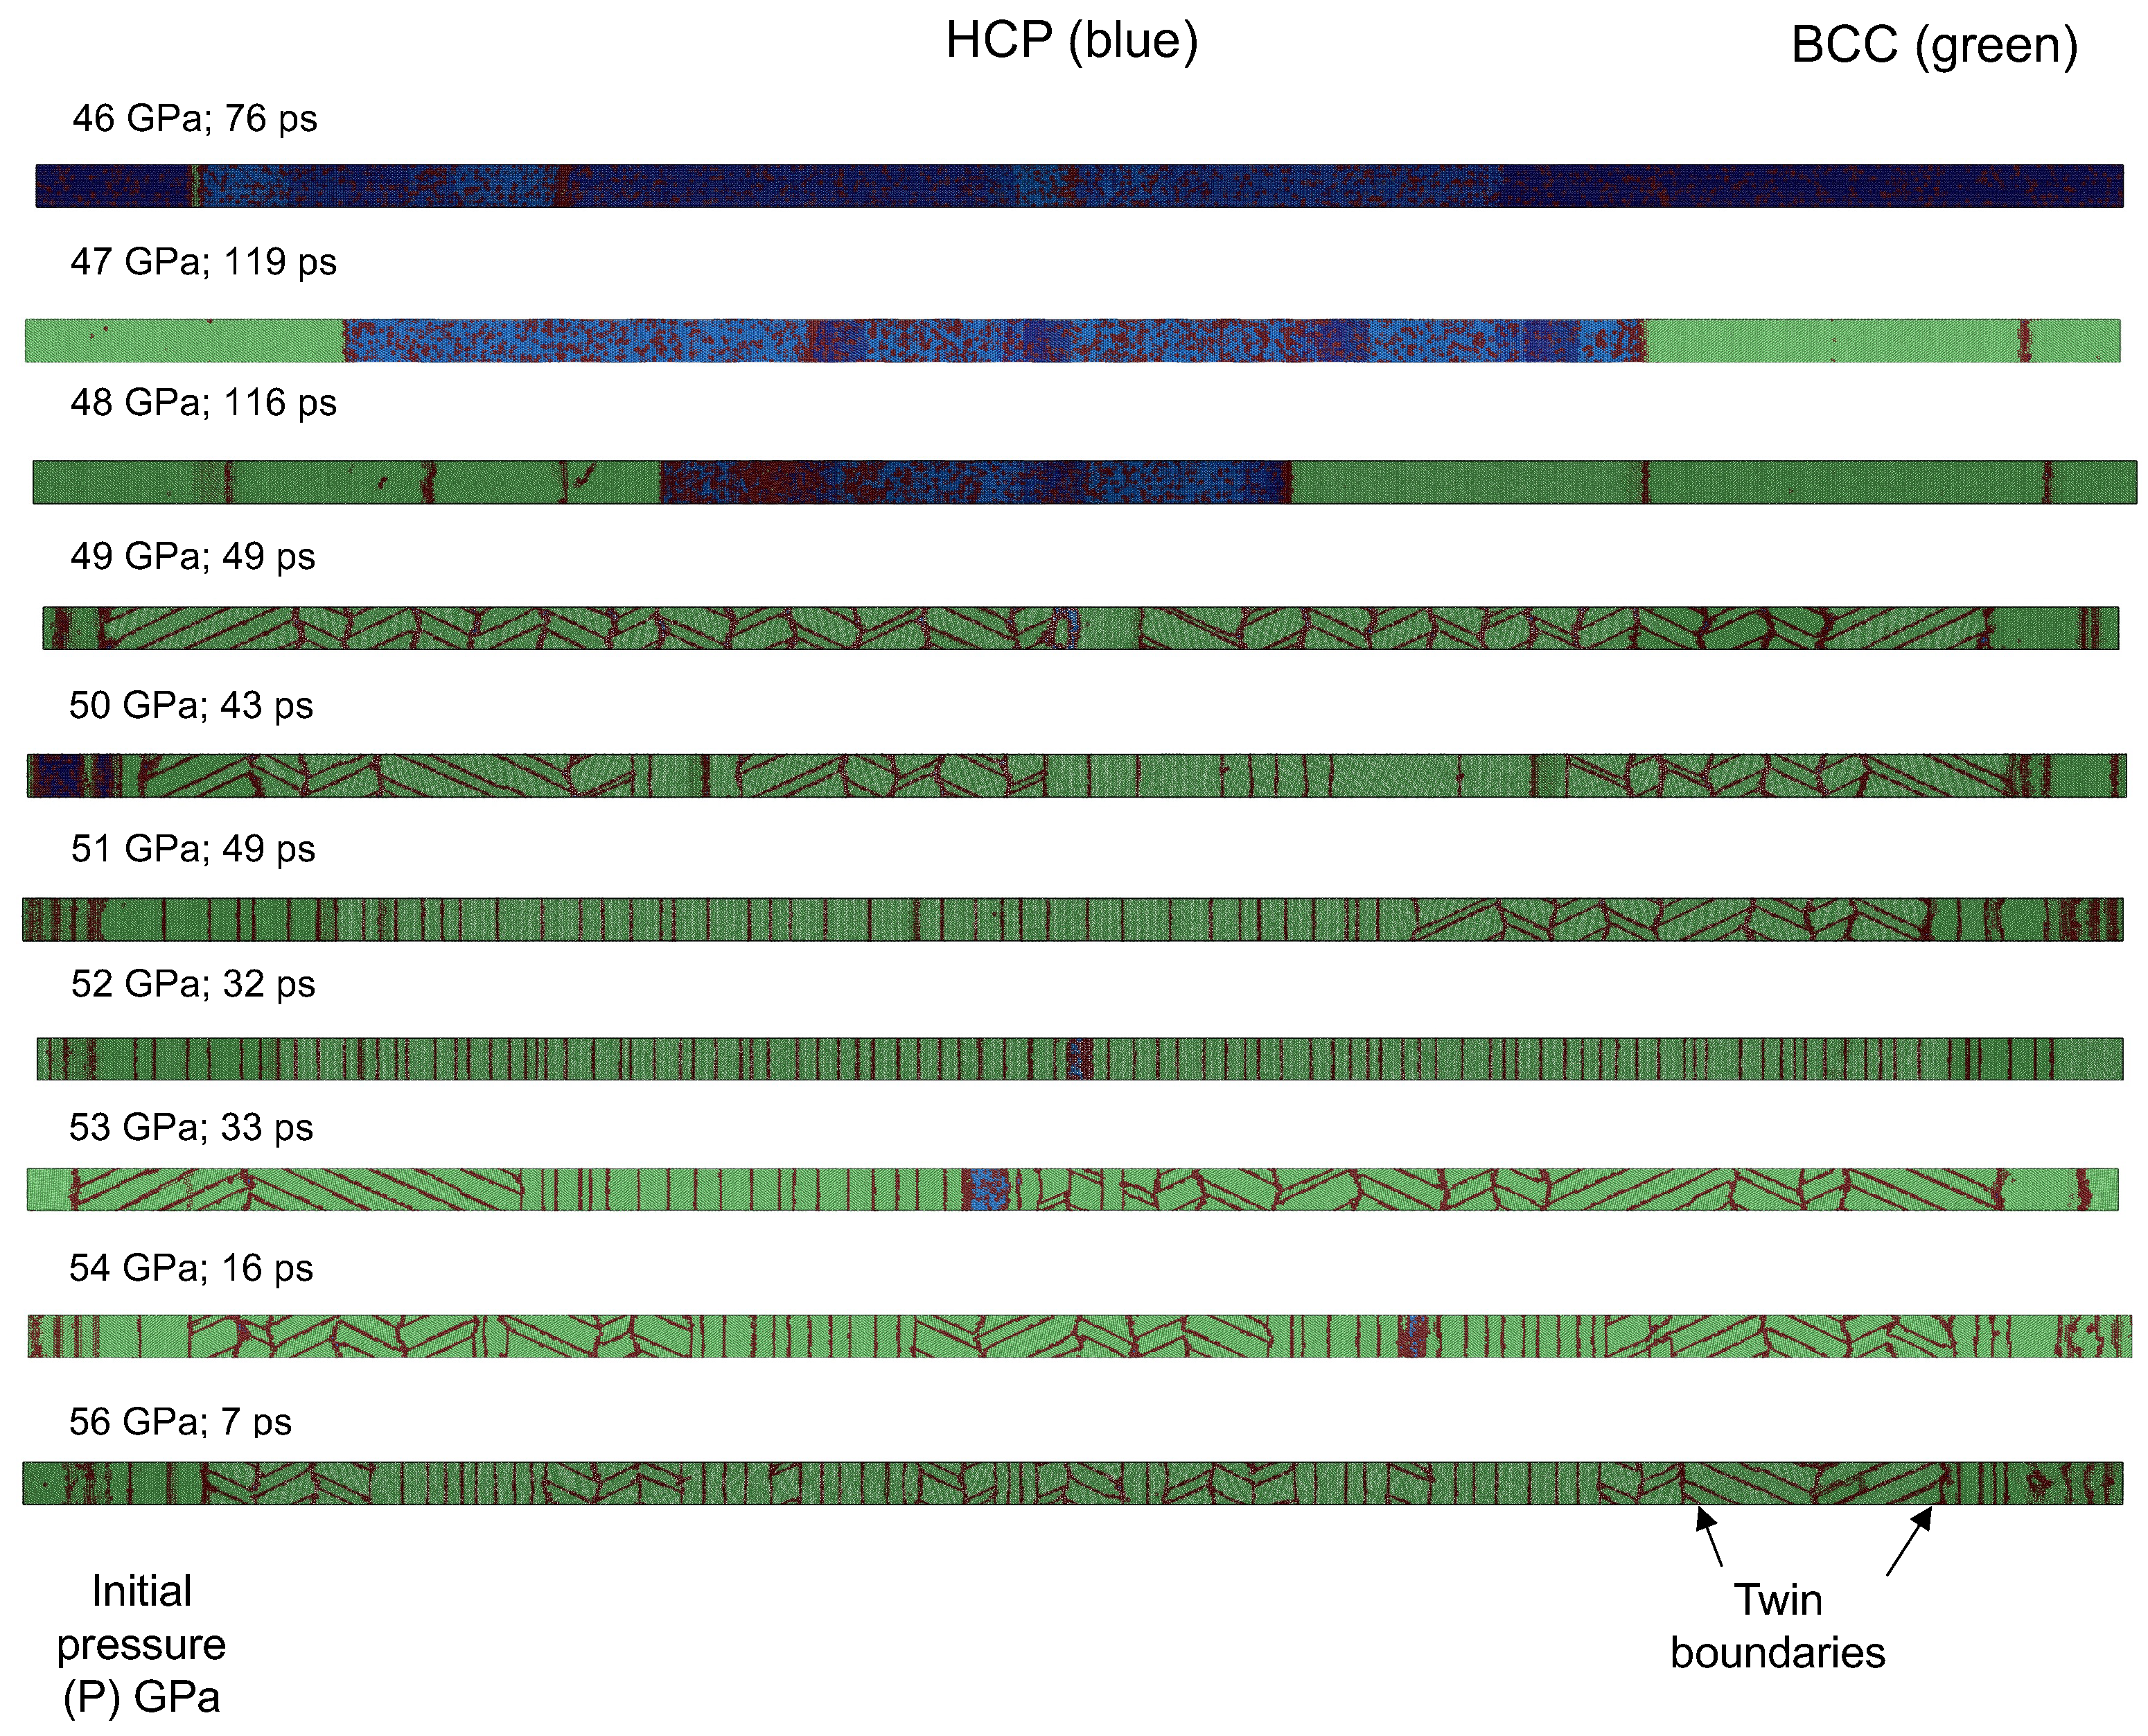
In Figure 5, snapshots from simulations conducted at different initial pressures (46 GPa to 56 GPa) show the planar boundary that was left behind in the BCC structure by propagating two phase boundaries. At a critical pressure of 46 GPa, a few layers of BCC atoms were nucleated. However, despite the nucleation of the phase boundary, no motion was observed in the boundary. The motion of the phase boundary was observed at and above 47 GPa pressure. The agreement between the predicted phase transformation pressure using the potential by Sun et al. [14] and the experimental prediction [16] is satisfactory. The results are shown for the constant volume and temperature ensemble, while the results using two other ensembles (constant volume and energy; constant pressure and temperature) resulted in similar values for the critical pressure at which phase boundary propagation commences.
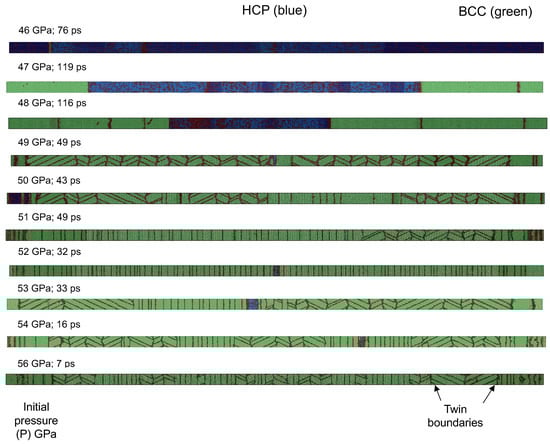
Figure 5.
Snapshots from simulations conducted at different initial pressures (46 GPa to 56 GPa) showing planar boundaries left behind in the BCC structure by propagating two phase boundaries. The critical pressure for nucleation of the phase boundary is at and above 47 GPa. Two types of planar boundaries are observed—vertical and inclined—postulated as belonging to two different slip systems.
We further provide observations on the activated planar faults from the MD results. It was found that the density of planar faults left behind by the phase boundary increases with the initial pressure, as seen in Figure 5. Two types of planar boundaries (vertical and inclined) were observed; they are topologically different from each other. The non-planar boundaries, which are made up of several layers of thick atoms and colored in red, are the grain boundaries in BCC Mg that were left behind by the propagating HCP-BCC phase boundary.
Figure S5 shows a comparison between the motion of the phase boundary at two initial pressures of 48 GPa and 51 GPa. The magnitudes of average velocity indicate propagation of the phase boundary under a reasonably constant value of statistically averaged pressure and temperature conditions. At 51 GPa, the phase boundary travels at an average velocity of 2.3 ± 0.23 nm/ps (or 2300 ± 230 m/s), which is higher than the velocity of 0.63 ± 0.11 nm/ps (or 630 ± 110 m/s) at 48 GPa.
Next, the propagation modes of the phase boundary were identified. Figure 5 shows snapshots from simulations conducted at different initial pressures ranging from 46 GPa to 56 GPa. These snapshots show planar boundaries left behind in the BCC structure by propagating phase boundaries. The jump in the propagation velocity above 49 GPa from Figure 4 confirms that a new plastic deformation (twin) system was activated, which helped in faster propagation of the phase boundary. Previous studies have shown that the presence of dislocations in the original phase impacts the formation of the phase boundary (for example, [22]).
To the author’s knowledge, these are the first results to demonstrate the role of plastic deformation in the newly transformed phase (in the wake of the phase boundary) in modulating the phase transformation kinetics. Two types of boundaries, namely a grain boundary and a twin boundary, were identified in BCC Mg. In BCC metals, twins are created by multi-layer stacking faults resulting from the movement of dislocations on successive planes [23]; where a represents the BCC lattice constant. This process can be explained in the crystallographic direction. The twin formation happens by shearing consecutive planes of a BCC crystal. The glide of the first dislocation on a plane causes the creation of a one-layer stacking fault. When the second and third dislocations glide on successive planes, two- and three-layer stacking faults are created, respectively. The twin growth occurs when the dislocations glide beyond the third layer on successive planes. It is important to note that the twin boundaries in these simulations are mobile, and the subsequent time snapshots in Figure S1 demonstrate that the grain boundaries are mobile, as well.
The critical pressure for nucleation of the phase boundary was 47 GPa, and although BCC atoms a few layers thick were nucleated (on the left side), there was no motion of the phase boundary. Phase boundary motion was observed at all pressures above 47 GPa. The agreement between the MD-predicted phase transformation pressure (47 GPa) using the potential by Sun et al. [14] and the experimental prediction (50 GPa) [16] is satisfactory.
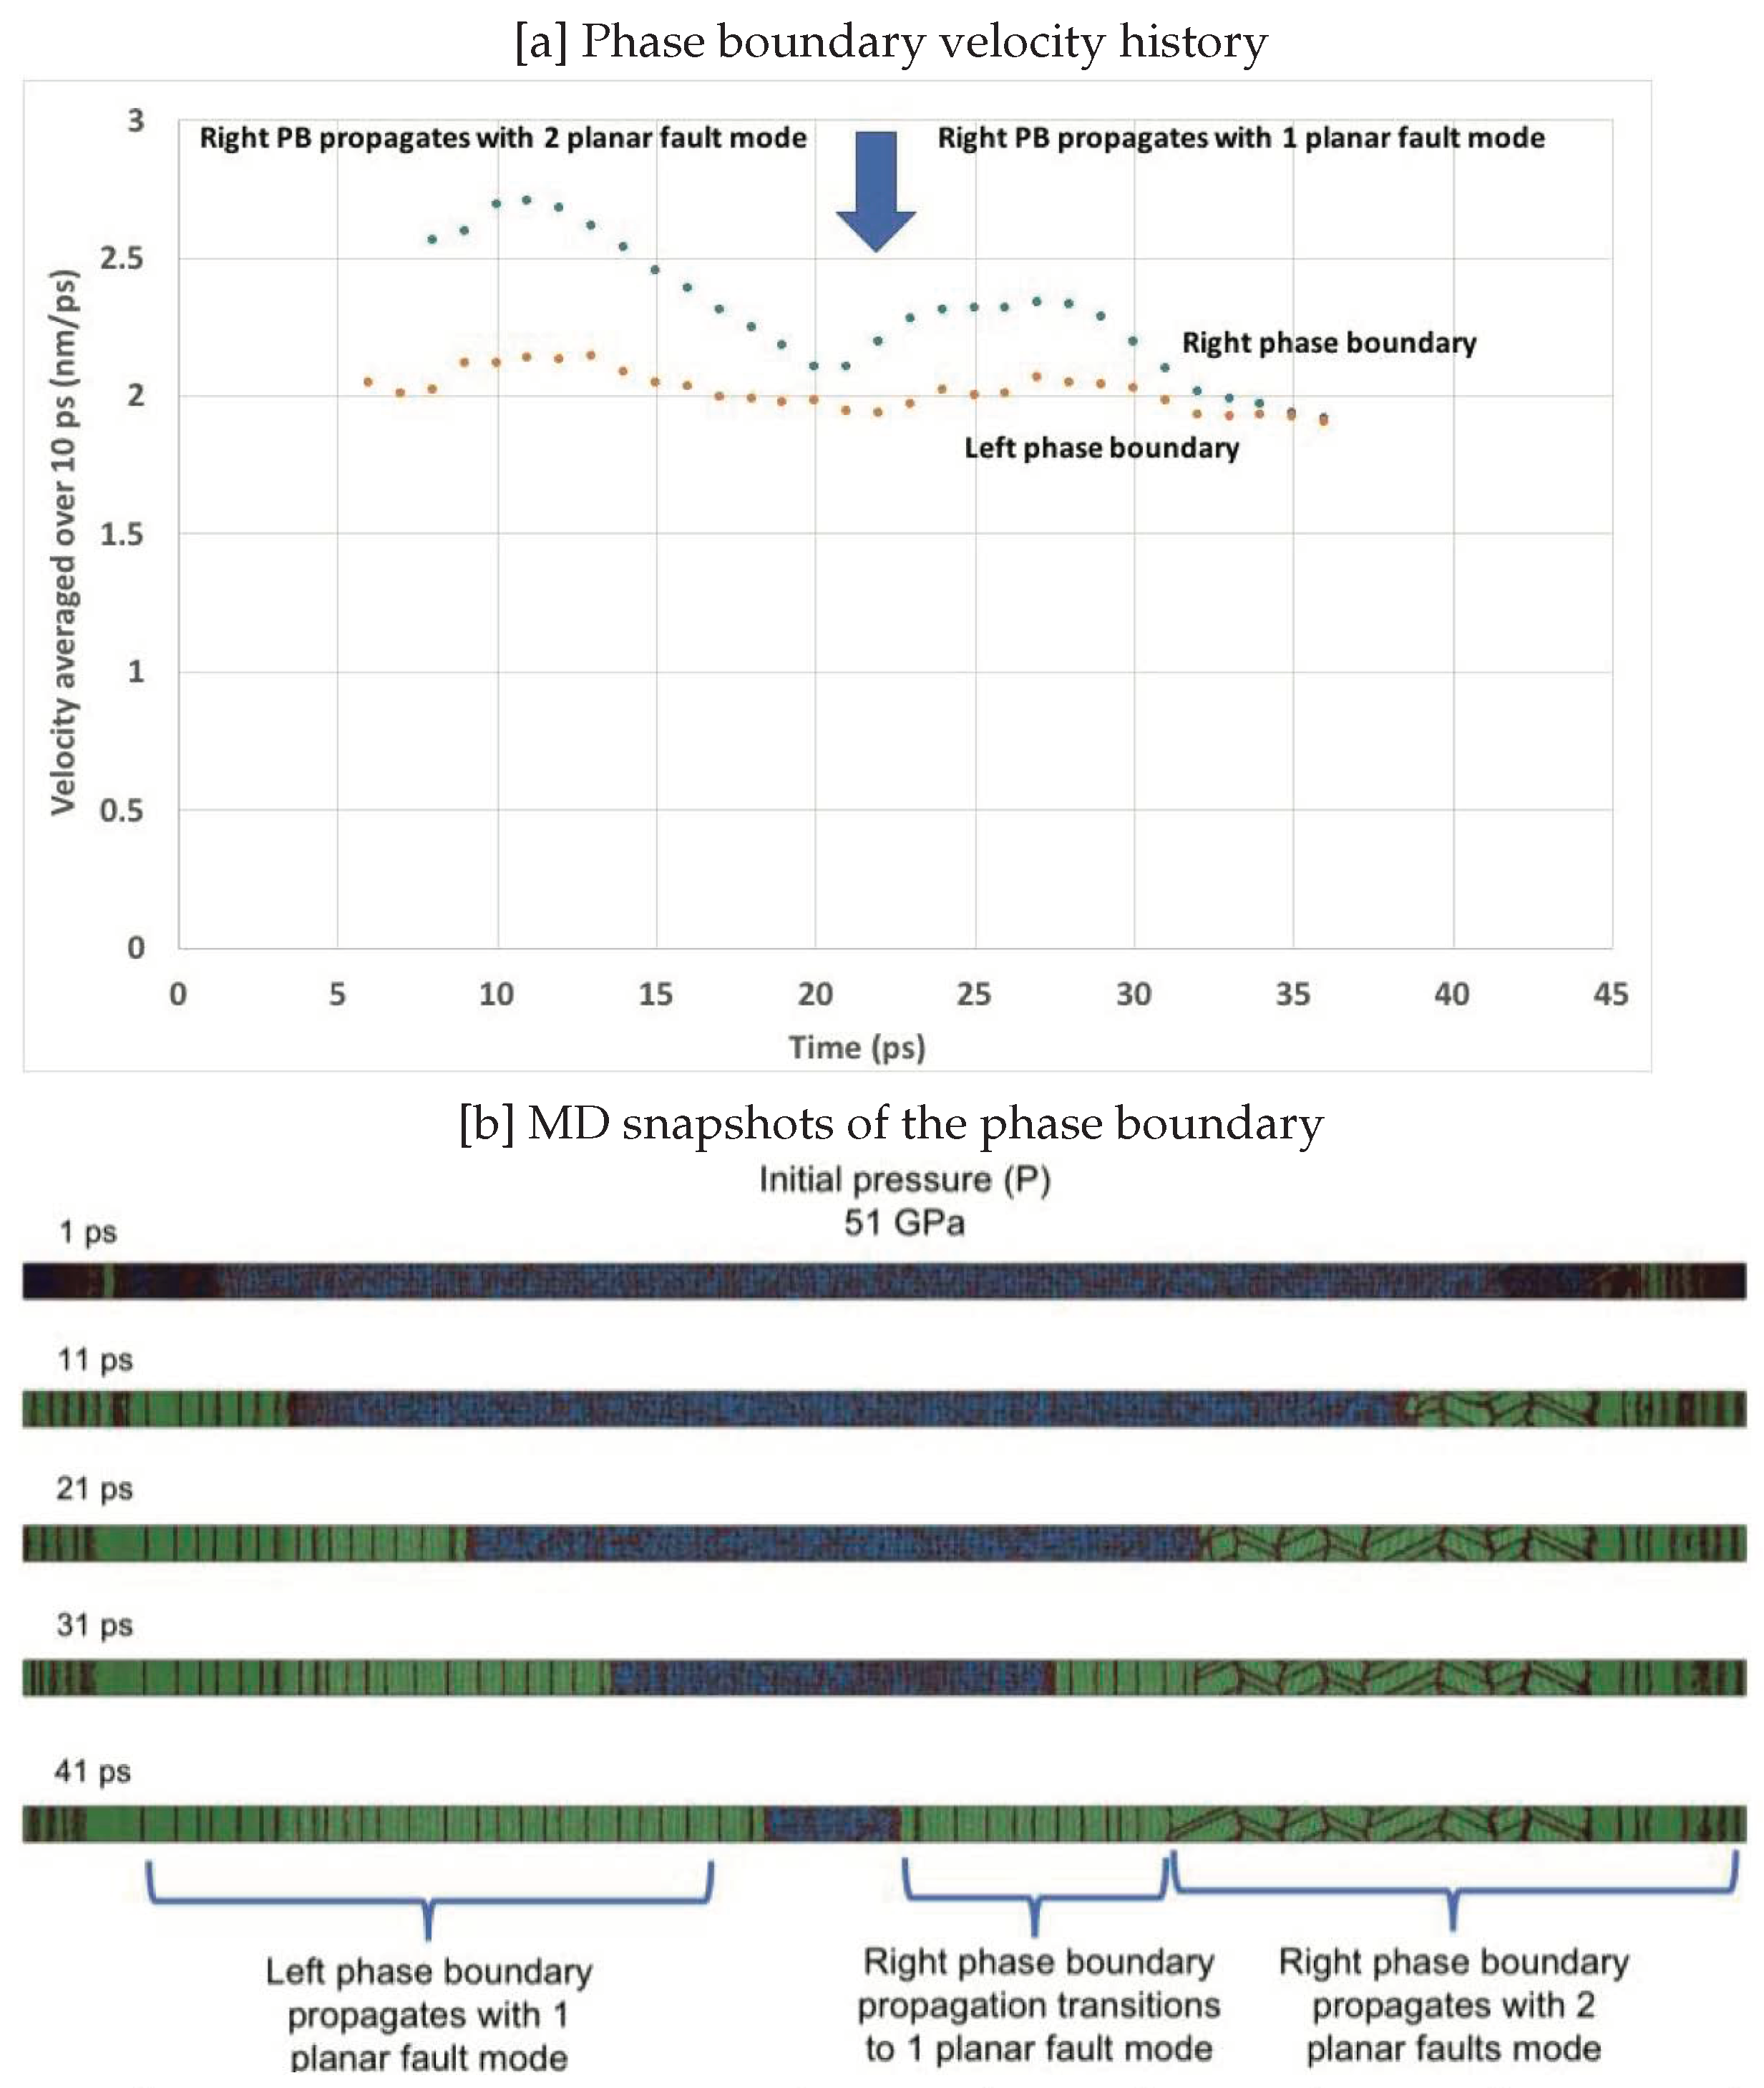
The density of planar faults left behind by the phase boundary increases with initial pressure. Two types of planar boundaries are observed—vertical and inclined; these are grain boundaries and twin boundaries, respectively, as viewed along the direction of BCC Mg. Figure 6 shows snapshots showing the propagation of phase boundaries, along with histories of displacement and velocity, for an initial pressure of 51 GPa. An algorithm was used to calculate the average X-position of atoms belonging to an HCP-BCC phase boundary, which were identified using CNA analysis. The left phase boundary leaves behind vertical planar faults (grain boundaries). On the other hand, the right phase boundary leaves both types of planar faults in its wake. After 21 ps, the propagating phase boundary appears to suppress the inclined planar faults (twin boundaries). Thus, the activation of inclined planar faults (twin boundaries) facilitated the relatively higher propagation velocity of the right phase boundary compared to the left phase boundary. This observation is also true when looking at snapshots of simulations in Figure 5, which show the presence of inclined planar faults (twin boundaries) for simulations with initial pressure higher than 49 GPa. These twin boundaries result from the activation of slip systems depending on the magnitude of the resolved shear stress on the slip system, which is favorable for twinning.

Figure 6.
Snapshots showing the propagation of two-phase boundaries for an initial pressure of 51 GPa. The left phase boundary activates one kind of planar fault in its wake. The right phase boundary initially activates two kinds of planar faults and then transitions to one planar fault in its wake. The two planar fault activation in the BCC phase thus allows a higher velocity of propagation for the phase boundary.
The study conducted nine simulations with superimposed shear stress from 20 megapascal to 1000 megapascal (MPa) with an initial pressure of 46 GPa. It is known that the shear stress modulates the phase transformation pressure [9]. In all cases of simulations, results indicated the critical pressure for the propagation of the phase boundary was reduced in the presence of shear stress. Such high levels of shear stress may be experienced under shock-loading conditions and in anisotropic crystals. At 46 GPa pressure, the phase boundary propagated in the presence of a superimposed 500 MPa shear stress, which otherwise failed to propagate under the pure hydrostatic case. In addition, under 1000 MPa shear stress, the BCC phase nucleated, and the phase boundary propagated a significant distance at pressures as low as 40 GPa, which is almost 14% lower than the critical pressure under purely hydrostatic conditions (47 GPa pressure). Thus, the shear stress provides additional thermodynamic force for the motion of the phase boundary.
This work successfully demonstrated the feasibility of simulating the transformation from hexagonal close-packed (HCP) to body-centered cubic (BCC) phase that occurs at and above 47 GPa and at room temperature (300 K), using an intermolecular potential developed for pure Magnesium by Sun et al. [14]. Using molecular dynamics, we developed a model to examine the kinetics of phase transformation under controlled initial pressure conditions. The simulated results for the critical phase transformation pressure are consistent with experimental results [16] at 300 K temperature. Finally, this work compared simulations of phase transformation under several different hydrostatic pressures and characterized the kinetics relation, i.e., the velocity of a moving phase boundary as a function of pressure. The molecular dynamics result suggests a non-monotonic dependence of the phase boundary velocity on pressure, indicating the need for further development of models of the kinetics of phase transformation to account for the activation of defects that enable high-speed boundary velocities.
5. Conclusions
This study focused on basic events near the thermodynamic point of phase coexistence under high pressure and room temperature. The proposed model demonstrated the feasibility of using MD simulations to characterize the hexagonal close-packed (HCP) to body-centered cubic (BCC) phase transition in magnesium under controlled temperature and pressure. This work characterized phase transformation near 47 GPa pressure, which agrees with the experimentally well-characterized HCP to BCC phase transformation. This study even identified the velocities of the HCP-BCC phase boundary at higher pressures to be non-linearly dependent on the pressure above 47 GPa. Simulation results further demonstrated the influence of plastic deformation mechanisms in the transformed phase on the phase transformation velocity.
Supplementary Materials
The following supporting information can be downloaded at https://www.mdpi.com/article/10.3390/met14060609/s1, Figure S1: Stacking faults on basal planes in the HCP phase ahead of the propagating HCP-BCC phase boundary; Figure S2: Histories of phase boundary displacement and velocity; Figure S3: Spatial distribution of normal stress components; Figure S4: Spatial distribution of shear stress components; Figure S5: Histories of phase boundary position (a) and velocity (b) under an initial pressure of 48 GPa and 51 GPa.
Funding
This research was funded by the Laboratory Directed Research and Development program of the Los Alamos National Laboratory under project number 20180738ER. This work was supported by the U.S. Department of Energy through the Los Alamos National Laboratory, which is operated by Triad National Security, LLC, for the National Nuclear Security Administration of the U.S. Department of Energy (Contract No. 89233218CNA000001).
Data Availability Statement
The raw data supporting the conclusions of this article will be made available by the authors on request.
Acknowledgments
The author is grateful for insightful discussions with P.K. Swaminathan of the Johns Hopkins University Applied Physics Laboratory.
Conflicts of Interest
The author declares no conflicts of interest.
References
- Levitas, V.I.; Javanbakht, M. Interaction between phase transformations and dislocations at the nanoscale. Part 1. General phase field approach. J. Mech. Phys. Solids 2015, 82, 287–319. [Google Scholar] [CrossRef]
- Zhou, J.N.; Guo, Y.F.; Ren, J.Y.; Tang, X.Z. The mechanism of HCP-BCC phase transformation in Mg single crystal under high pressure. Scr. Mater. 2023, 236, 115670. [Google Scholar] [CrossRef]
- Wentzcovitch, R.M. HCP-to-BCC pressure-induced transition in Mg simulated by ab initio molecular dynamics. Phys. Rev. B 1994, 50, 10358. [Google Scholar] [CrossRef] [PubMed]
- Moriarty, J.A.; Mcmahan, A.K.; Livermore National Laboratory’, L. High-Pressure Structural Phase Transitions in Na, Mg, and Al. Phys. Rev. Lett. 1982, 48, 809. [Google Scholar] [CrossRef]
- Pathak, S.; Velisavljevic, N.; Baldwin, J.K.; Jain, M.; Zheng, S.; Mara, N.A.; Beyerlein, I.J. Strong, Ductile, and Thermally Stable BCC-Mg Nanolaminates. Sci. Rep. 2017, 7, 8264. [Google Scholar] [CrossRef] [PubMed]
- Felipe, G.-C.; François, S.; Burkhard, M. Equation of state of hot, dense magnesium derived with first-principles computer simulations. Phys. Plasmas 2020, 27, 092706. [Google Scholar]
- Stinton, G.W.; MacLeod, S.G.; Cynn, H.; Errandonea, D.; Evans, W.J.; Proctor, J.E.; Meng, Y.; McMahon, M.I. Phase Diagram and Equation of State of Magnesium to High Pressures and High Temperatures. Phys. Rev. B 2014, 90, 134105. [Google Scholar] [CrossRef]
- Fisher, J.C.; Turnbull, D. Influence of stress on martensite nucleation. Acta Metall. 1953, 1, 310–314. [Google Scholar] [CrossRef]
- Duvall, G.E.; Graham, R.A. Phase transitions under shock-wave loading. Rev. Mod. Phys. 1977, 49, 523–579. [Google Scholar] [CrossRef]
- Olijnyk, H.; Holzapfel, W.B. High-pressure structural phase transition in Mg. Phys. Rev. B 1985, 31, 4682–4683. [Google Scholar] [CrossRef]
- Milathianaki, D.; Swift, D.C.; Hawreliak, J.; El-Dasher, B.S.; McNaney, J.M.; Lorenzana, H.E.; Ditmire, T. In situ lattice measurement of the BCC phase boundary in Mg on the principal shock Hugoniot. Phys. Rev. B 2012, 86, 014101. [Google Scholar] [CrossRef]
- Agarwal, G.; Dongare, A.M. Shock wave propagation and spall failure in single crystal Mg at atomic scales. J. Appl. Phys. 2016, 119, 145901. [Google Scholar] [CrossRef]
- Agarwal, G.; Dongare, A.M. Atomistic study of shock Hugoniot of single crystal Mg. AIP Conf. Proc. 2017, 1793, 070004. [Google Scholar]
- Sun, D.Y.; Mendelev, M.I.; Becker, C.A.; Kudin, K.; Haxhimali, T.; Asta, M.; Hoyt, J.J.; Karma, A.; Srolovitz, D.J. Crystal-melt interfacial energies in HCP metals: A molecular dynamics study in Mg. Phys. Rev. B 2006, 73, 024116. [Google Scholar] [CrossRef]
- Jian, Z.; Chen, Y.; Xiao, S.; Wang, L.; Li, X.; Wang, K.; Deng, H.; Hu, W. Shock-induced plasticity and phase transformation in single crystal magnesium: An interatomic potential and non-equilibrium molecular dynamics simulations. J. Phys. Condens. Matter 2022, 34, 115401. [Google Scholar] [CrossRef] [PubMed]
- Kerley, G.I. Equation of State for Magnesium. Kerley Technical Services Research Report, KTS14-1. 2014. Available online: http://kerleytechnical.com (accessed on 17 May 2024).
- Thompson, A.P.; Aktulga, H.M.; Berger, R.; Bolintineanu, D.S.; Brown, W.M.; Crozier, P.S.; In’t Veld, P.J.; Kohlmeyer, A.; Moore, S.G.; Nguyen, T.D.; et al. LAMMPS—A flexible simulation tool for particle-based materials modeling at the atomic, meso, and continuum scales. Comp. Phys. Comm. 2022, 271, 108171. [Google Scholar] [CrossRef]
- Faken, D.; Jónsson, H. Systematic analysis of local atomic structure combined with 3D computer graphics. Comput. Mater. Sci. 1994, 2, 279–286. [Google Scholar] [CrossRef]
- Wilson, S.R.; Mendelev, M.I. A unified relation for the solid-liquid interface energy of pure FCC, BCC, and HCP metals. J. Chem. Phys. 2016, 144, 144707. [Google Scholar] [CrossRef] [PubMed]
- Yin, B.; Wu, Z.; Curtin, W.A. Comprehensive first-principles study of stable stacking faults in HCP metals. Acta Mater. 2017, 123, 223–234. [Google Scholar] [CrossRef]
- Daphalapurkar, N.P.; Wilkerson, J.W.; Wright, T.W.; Ramesh, K.T. Kinetics of a fast moving twin boundary in nickel. Acta Mater. 2014, 68, 82–92. [Google Scholar] [CrossRef]
- Jian, Z.; Chen, Y.; Xiao, S.; Wang, L.; Li, X.; Wang, K.; Deng, H.; Hu, W. Molecular dynamic simulations of plasticity and phase transition in Mg polycrystalline under shock compression. Appl. Phys. Express 2022, 15, 015503. [Google Scholar] [CrossRef]
- Ojha, A.; Sehitoglu, H. Twinning stress prediction in BCC metals and alloys. Philos. Mag. Lett. 2014, 94, 647–657. [Google Scholar] [CrossRef]
Disclaimer/Publisher’s Note: The statements, opinions and data contained in all publications are solely those of the individual author(s) and contributor(s) and not of MDPI and/or the editor(s). MDPI and/or the editor(s) disclaim responsibility for any injury to people or property resulting from any ideas, methods, instructions or products referred to in the content. |
© 2024 by the author. Licensee MDPI, Basel, Switzerland. This article is an open access article distributed under the terms and conditions of the Creative Commons Attribution (CC BY) license (https://creativecommons.org/licenses/by/4.0/).