Article

Recovery of Rare Earth Elements from Coal Fly and Bottom Ashes by Ultrasonic Roasting Followed by Microwave Leaching

Faculty of Technology and Metallurgy, University of Belgrade, Karnegijeva 4, 11120 Belgrade, Serbia
*
Author to whom correspondence should be addressed.
Metals 2024, 14(4), 371; https://doi.org/10.3390/met14040371
Submission received: 21 February 2024 / Revised: 13 March 2024 / Accepted: 18 March 2024 / Published: 22 March 2024
(This article belongs to the Special Issue New Technologies in Leaching and Recovery of Valuable Metals)

Abstract

:
Considering the rising demand for rare earth elements (REEs), researchers are looking for new sources for their extraction, thereby fostering economic and environmentally justified processing solutions. Among potential industrial sources, coal fly ash emerges as one of the most promising. The recovery of REEs from coal fly and bottom ashes derived from different thermal power plants was the main focus of this study. A dual-step methodology was conducted on ash samples, which involved an ultrasonic roasting process to disintegrate the silica matrix, followed by a microwave-assisted acid leaching step to extract REEs. The roasting procedure was studied using the Plackett–Burman design, and the Box–Behnken design was subsequently implemented to optimize the leaching procedure. The optimized ultrasonic roasting procedure was set up at 95 °C for 10 min with an ash-to-roasting agent (3M NaOH) ratio of 0.5:1 (m/V). For acid leaching, the optimal conditions were obtained at 174 °C for 30 min with an HCl ÷ HNO3 mixture (1:1 V/V). The standard reference material (NIST 1633c) was used in the conclusive experiments to estimate the average recovery (80%) of REEs. The green aspects of this methodology were evaluated using several metrics (atom economy, E-factor, and energy consumption). The proposed process outperforms high-temperature roasting procedures in terms of greenness; however, the REE recovery rate is lower.

1. Introduction

Rare earth elements (REEs) refer to a group of 17 chemical elements containing 15 lanthanoids, scandium, and yttrium. These elements have similar properties and are found together in geological deposits [1,2]. Regarding their occurrence and industrial application, REEs are divided into three groups: critical (Nd, Eu, Tb, Dy, Y, and Er), non-critical (La, Pr, Sm, and Gd), and excessive (Ce, Ho, Tm, Yb, and Lu) [3]. Their significant classifications are based on their geochemical characteristics and atomic numbers: light (Sc, La, Ce, Pr, Nd, Pm, and Sm), medium (Y, Eu, Gd, Tb, and Dy), and heavy (Ho, Er, Tm, Yb, and Lu) elements [4]. REEs are globally recognized as strategic elements because of their multiple technological applications, including critical defense, catalysts and magnets, green energy technology, and hybrid and electric vehicles [5,6]. One of the critical elements, neodymium (Nd), is an essential element of the strongest magnets available and is used in hard drives and smartphones [7]. Recycling items that contain REEs allows them to be returned. One promising source of these elements appears to be batteries [8,9].
Each of these elements is found in natural ores at low concentrations and is distributed unevenly worldwide. The estimated content of REEs in the Earth’s crust varies from 130 to 240 μg/g [3,10,11]. Their natural ores mostly occur in Southeast Asia; therefore, China stands out as the main producer of REEs, with a total market share of 61% [12]. Owing to this unequal distribution on the market, and the economic and environmental issues regarding the availability of REEs, other countries are compelled to look for alternative sources.
Coal fly ash (CFA) is considered a promising source of REEs, including other strategic elements such as Ge, Ga, and Al [13,14]. CFA is a waste stream generated during combustion in thermal power plants (TPPs). Through its disposal, a harmful environmental impact is manifested by the potential release of contaminants (dominantly heavy metals) into the water, air, and soil [15,16,17]. The disposal of this waste stream does not adhere to the waste management hierarchy because it contains valuable materials [18]. It is possible to transform this waste for different purposes, primarily as a building material [19,20], a purification medium [21], a remediation agent [22], and for source recovery [3,23]. The reuse of ash is completely based on the principles of the circular economy and the waste-to-value concept.
CFA consists mostly of an aluminosilicate structure with constituents of oxides of Fe, Ca, Na, and Mg [10,22]. Since acid leaching is the main method for REE extraction from natural ores [24], it is also typically employed to recover REEs from other sources [25,26]. Due to the nature of the fly ash matrix, it is necessary to use more aggressive extraction methods [27]. Previous research has shown that the roasting pretreatment effectively destroys the crystalline phase, thereby releasing REEs by acid leaching [28,29].
A combination of methods is often used to achieve the highest possible efficiency for REE recovery. Commonly, these include physical separation (magnetic, flotation, and particle size distribution), acid and alkaline leaching, and pyro- and hydrometallurgical processes (the use of NaOH, Na2O2, NaCl, Na2CO3, and (NH4)2SO4 under a high temperature) [12]. Physical separation methods are commonly used as preparatory stages to separate the ash fraction containing the highest REE content. Furthermore, the roasting hydrometallurgical method is frequently employed to destroy the aluminosilicate matrix, from which the elements are then transferred into the solution by acid leaching. In previous studies, various chemical agents have been tested for the roasting process. Taggart et al. investigated the use of NaOH, Na2CO3, Ca(OH)2, CaCl2, and (NH4)2SO4, simultaneously optimizing the reaction temperature, after which aqueous and acid leaching (HNO3) were performed to obtain a recovery of 90% [30]. Wen et al. combined physical separation (sieving the ash, magnet, and density separation) and acid leaching (HCl) to increase the overall recovery to 95.5% [31].
In this study, a dual-step consecutive process was used to extract REEs from CFA: ultrasonic roasting followed by microwave leaching. Three sets of experiments were performed during the optimization of the process. First, the dominant parameters for the overall recovery process were determined by screening experiments. Second, the response surface methodology led to optimized parameters for acid leaching. Finally, an innovative methodology was applied to recover REEs from real coal ash samples. The greenness of the developed methodology was also evaluated by calculating the E-factor, atom economy, and energy consumption.

2. Materials and Methods

2.1. Chemicals and Instruments

Calcium oxide (p.a. > 95%) and sodium hydroxide (p.a. > 98%) were provided by Centrohem d.o.o. (Stara Pazova, Serbia) and were used for the roasting process. Trace metal analysis grade, hydrochloric acid (37%), and nitric acid (67–69%) were purchased from Fisher Chemical (Waltham, MA, USA) and used for microwave leaching and chemical analysis. All solutions were prepared using deionized water (18 MΩ-cm). Standard Reference Material (SRM)—Trace Elements in Coal Fly Ash 1633c was purchased from NIST (Gaithersburg, MD, USA).
For material characterization, a microscope model, OPTIKA B-193PL (Ponteranica, Italy), was used, whereas the chemical analysis of major elements was performed using a hand-held X-ray fluorescence (XRF) spectrometer model, Thermo Scientific Niton™ XL3t GOLDD (Waltham, MA, USA), and Thermo Scientific model, iCAP 6500 ICP-OES. The ultrasonic bath model, Skymen JP-031S (Shenzhen, China), was used for ultrasonic roasting. The bath water was externally heated to 95 °C. Microwave leaching was performed in a microwave digestion oven model, ETHOS LEAN, from Milestone Srl (Sorisole, Italy).
Samples were roasted, leached in microwave vessels, and dried in a drying oven model, Vims electric ssw53 (Tršić, Serbia). Concentrations of REEs (Sc, Y, La, Ce, Pr, Nd, Sm, Eu, Gd, Tb, Dy, Ho, Er, Tm, Yb, and Lu) were measured on an ICP-MS Thermo Scientific iCAP Q instrument [32]. The Pm concentration was not measured because it is radioactive and unstable.

2.2. Sample Preparation and Characterization

Coal fly (CFA) and bottom (CBA) ashes were collected from several thermal power plants (TPPs) in Serbia: TPP Kostolac (CFA1, CBA2), TPP Kolubara (CFA3, CFA4), TPP Morava (CFA5, CBA6), TPP “Nikola Tesla” TENT A (CFA7, CBA8), and TPP “Nikola Tesla” TENT B (CFA9, CBA10, CFA11). All of the aforementioned TPPs combust lignite coal. All of the examined ash samples were homogenized and sieved through 125 μm granulation sieves and further used in the experiments. Screening experiments and optimization were performed with a sample of fly ash from TPP Kostolac (CFA1), whereas the conclusive set of experiments was performed with all collected samples as well as with the standard reference material (SRM) (NIST 1633c).
Fly and bottom ashes were screened using XRF spectrometry, whereas major and REE elements were quantitatively determined using inductivity-coupled plasma and optical emission spectrometry (ICP-OES) and inductivity-coupled plasma and mass spectrometry (ICP-MS), as detailed elsewhere [16]. The morphology and particle size distribution were determined using an optical microscope.
Quality assurance for the ICP-OES and ICP-MS measurements, including sample preparation, was ensured by employing SRM (NIST 1633c certified standard reference material). The analytical recovery and relative standard deviation (RSD) for the major and REE elements measured using this SRM were in the ranges of 74–119% and 4–16%, respectively.

2.3. Design of Experiments for Process Optimization

To identify the significant variables of the process and find the optimal conditions, the design of the experiment (DoE), which combined mathematical and statistical methods, was used. The optimal roasting and leaching parameters for the recovery of REEs from coal ash were determined using the Plackett–Burman experimental design and Box–Behnken response surface methodology (RSM).
The Plackett–Burman design (PBD) enables the examination of the influence of several different parameters that are mutually dependent [33]. To identify the main extraction factors that affect the recovery of REEs from coal ash, a two-level PBD was used for 11 selected parameters. Roasting was selected as one of the most efficient methods to disintegrate the ash aluminosilicate structure [28,29]. Afterward, the recovery of REEs into an aqueous solution was carried out through an acid leaching procedure.
A screening set of 12 experiments (Table S1) was conducted to determine the statistically significant parameters for REE extraction, including the selection of digesting techniques, temperature(s), reaction times, and quantities and concentrations of chemical reagents for roasting and leaching [34,35,36,37]. The selected parameters and their levels are shown in Table 1.
The following values were calculated as output parameters: atom economy, E-factor, energy consumption, total REE concentration, and outlook coefficient (ratio of critical and excessive elements). With the adopted data for the roasting procedure, further optimization was performed for acid leaching. The second set of experiments was performed using a three-level, three-factor Box–Behnken design (BBD). The BBD was used to establish an appropriate correlation between a response parameter and the primary factors and their interactions [38].
This design was applied to investigate and validate the acid leaching process parameters, varying the share of HNO3 in the HCl ÷ HNO3 mixture (A: 0–1), temperature (T: 90–190 °C), and reaction time (t: 10–50 min). The total volume of added acids (10 mL) and treatment in a microwave oven at 900 W were set as constant input parameters. Factor levels are given as −1 (low), 0 (middle), and 1 (high) [39]. A total of 15 experiments (Table S2) were performed in this optimization step, and the results were analyzed using the RSM and the desirability function (D).
To find the optimal values of the process parameters based on the multiple responses that were obtained, a multi-object optimization technique was employed using a desirability function that leads to maximum REE extraction. The desirability function is used to optimize processes with several response variables, where a quality level is defined for each response [40], and the function translates several different answers into one objective function. This function implies translating an individual answer into an individual desirability function di by ranking the obtained answers y on a non-dimensional scale from 0 for an undesirable answer to 1 for the most desirable [33,41].
If we prefer a value closer to the maximum for a certain parameter, the individual desirability is calculated as shown in Equation (1).
d i = 0 ( ( y y m i n ) ( y m a x y m i n ) ) w 1   i f   y y m i n i f   y m i n y y m a x i f   y y m a x
If a response is a target value Ti, the individual desirability is defined as follows:
d i y i ` x = 0 i f   y < y m i n y y m i n T y m i n w i f   y m i n < y < T 1 y = T y y m a x T y m a x w i f   T < y < y m a x 0 i f   y > y m a x
If a minimum value is suitable for a certain parameter, individual desirability is calculated as follows:
d i = 0 ( ( y m a x y ) ( y m a x y m i n ) ) w 1   i f   y y m i n i f   y m i n y y m a x i f   y y m a x
where di is the individual desirability of the response yi (i = 1,2,3, … n), n is the number of responses, and w is the weight of each response. In this study, all responses were equally weighted (=1). The set minimum and maximum values for each parameter are labeled ymin and ymax, respectively. The overall desirability (D) is calculated by calculating the geometric mean of all individually determined individual desirability values, as shown in Equation (4) [42].
D = d 1 r 1 · d 2 r 2 · · d n r n 1 r i
where ri represents the importance of each measured parameter relative to the others. In this study, all parameters were treated equally, i.e., the r for all parameters was 1.

2.4. Recovery of REEs from Coal Ash Samples

REE recovery from 11 fly and bottom ash samples was performed under the optimal conditions defined in the process optimization step. For each sample, 0.5 g of the <125 µm sample was measured and transferred to microwave vials. A total volume of 1 mL of 3M NaOH solution was added to each sample, and the samples were placed in an ultrasonic bath for 10 min, where the water was preheated to 95 °C. Afterward, microwave leaching was performed at 174 °C for 30 min, where the volume ratio of conc. HCl and HNO3 was 1:1 for a total amount of 10 mL.
In this step, the influence of drying on the efficiency of the reaction was examined, and three sets of experiments were performed. First, the previously optimized method of roasting and leaching was performed. Next, the samples were dried at 110 °C overnight after roasting, and then microwave leaching was carried out.
After leaching, all samples were washed several times with deionized water, transferred to plastic vials, and diluted to 40 mL. They were allowed to settle for 2 h, after which a 20 mL aliquot was taken from each sample. The content of REE in the leaching solution was determined using ICP-MS.

2.5. Greenness Evaluation of REE Recovery

Green chemistry is an emerging field that has acquired significance due to the desire to develop chemicals and processes that are not only economically justified for use but also environmentally friendly [43]. Twelve principles of green chemistry are stated, the application of which intends to move toward sustainable manufacturing and further development. This study considers three principles of green chemistry: waste prevention, which is expressed through the E-factor (environmental factor); atom economy; and energy efficiency design.
The first principle indicates the importance of waste prevention. This parameter is quantified by determining the E-factor, which indicates the greenness of the method that determines the amount of generated waste (byproducts, leftover reactants, solvent losses, and catalysts) concerning the desired product. Its ideal value is zero and values close to zero [44].
The percentage of reactants that becomes the intended product is indicated by atom economy, also known as atom efficiency. In green chemistry, this number should be as close to 100% as possible [45]. This alludes to the idea of using raw materials to maximize the amount of reactants in the final product.
Energy use and efficiency are important parameters for the industrial application of processes. To potentially commercialize this process, the use of electrical energy was monitored as an output parameter for each of the presented experiments.

3. Results and Discussion

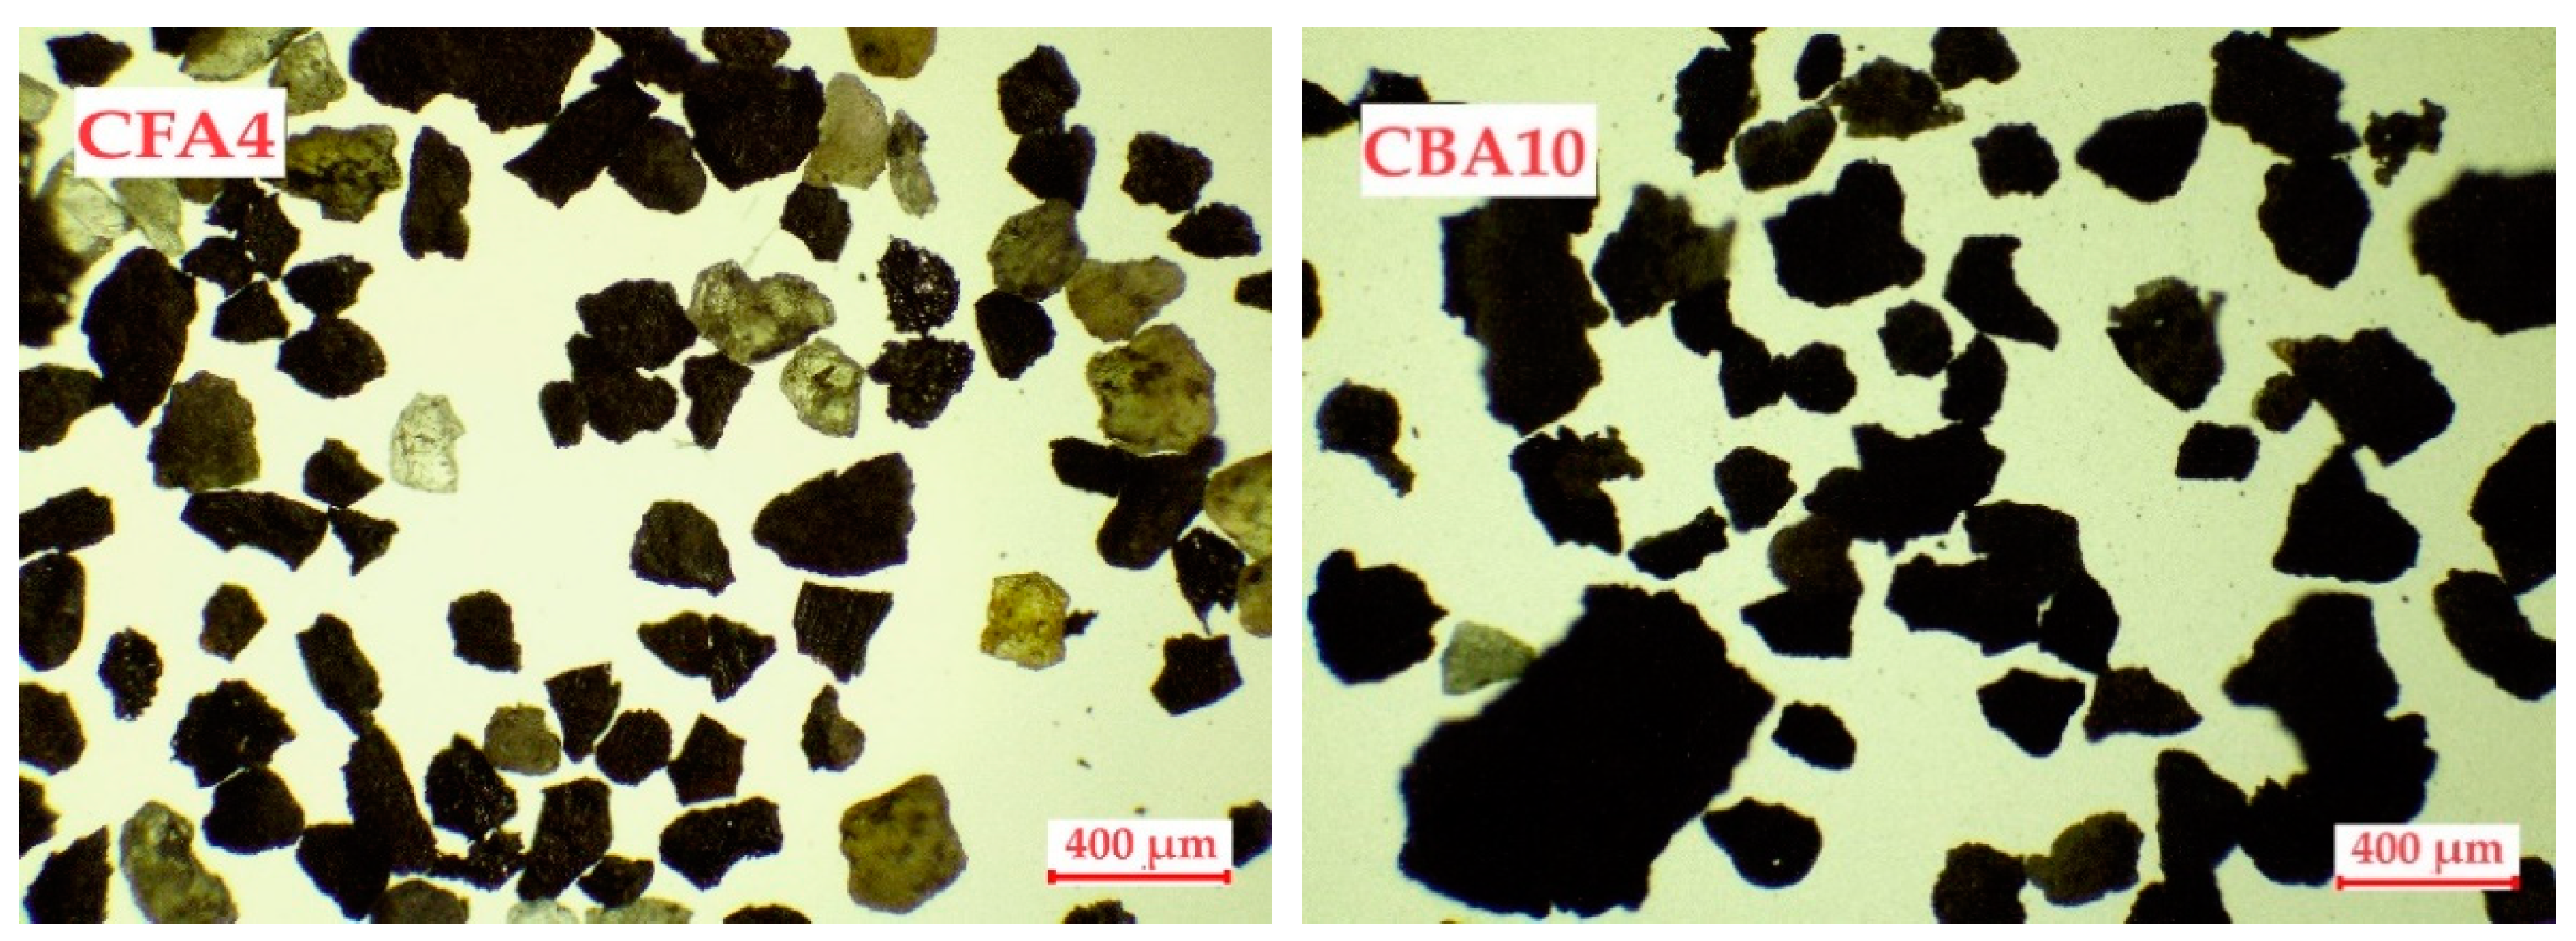
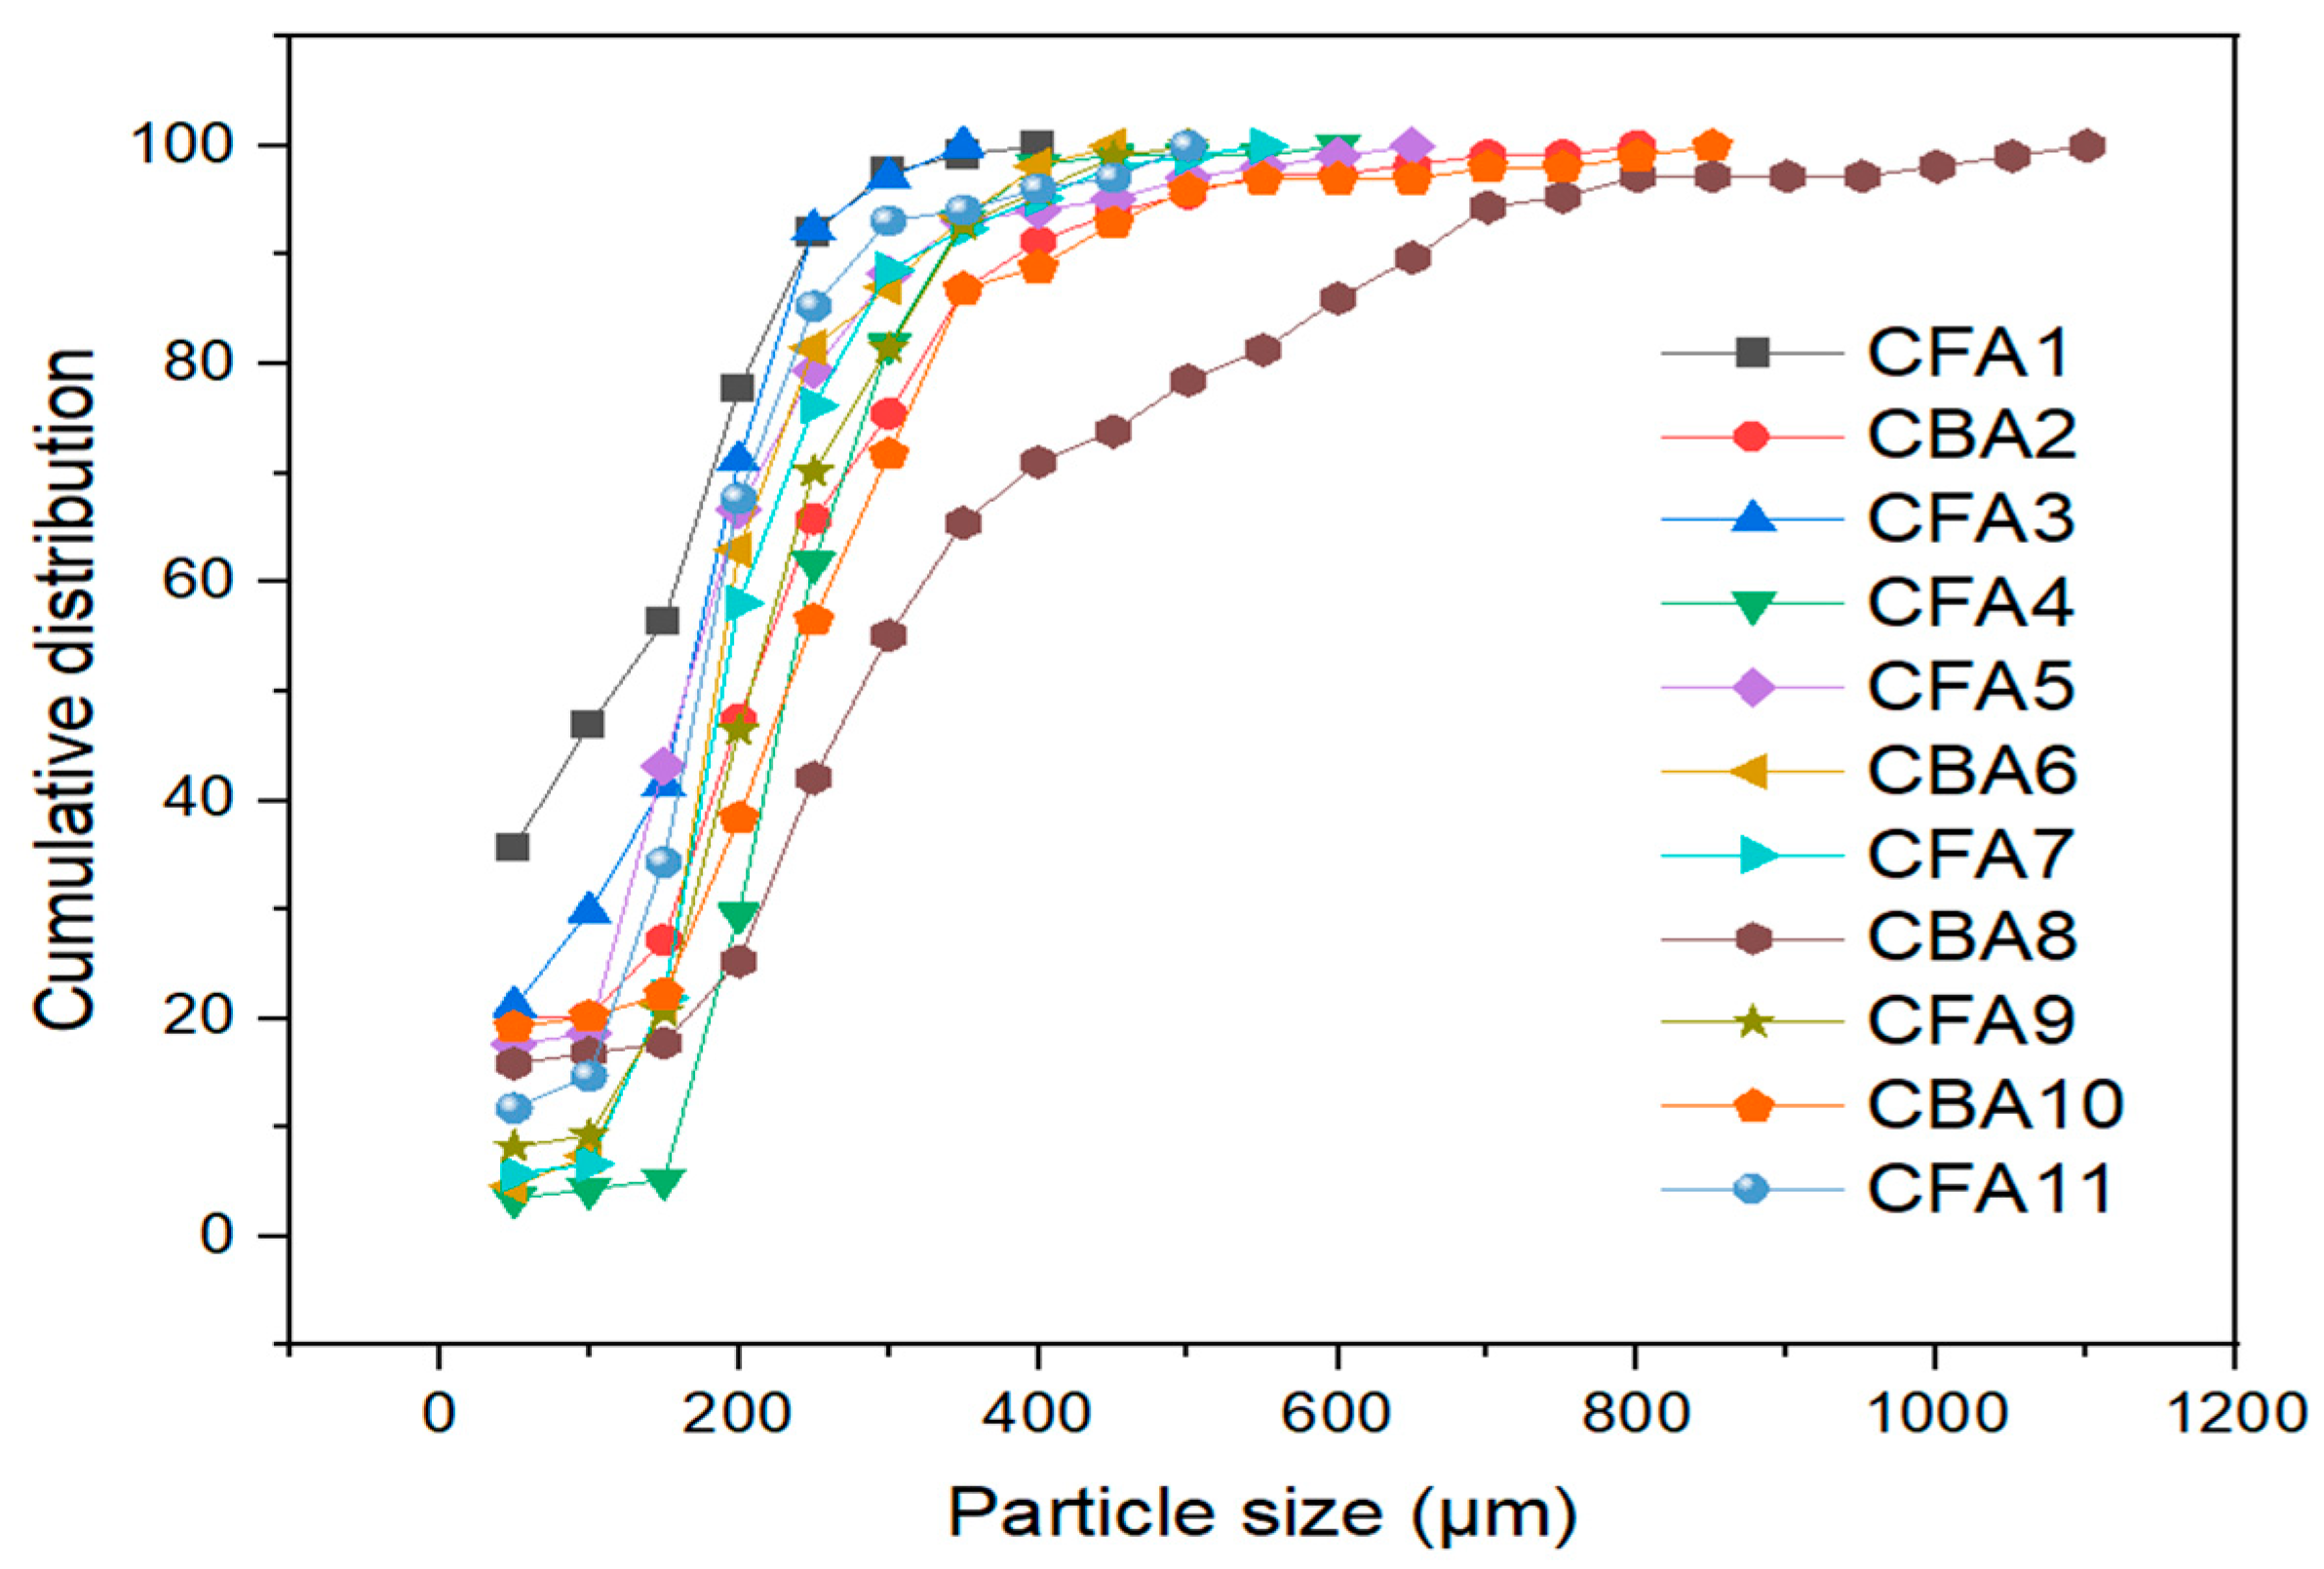
3.1. Characterization of Samples

All of the fly and bottom ash samples were analyzed using an optical microscope to determine the particle size distributions. Figure 1 shows the main structural differences in the selected fly and bottom ash particles under a microscope. All analyzed samples are shown in Figure S1.
A microscopic analysis of the coal fly and bottom ash samples showed that the samples differed greatly from each other. The fly ash samples were characterized by a granular structure, and the particles were more spherical in shape. The particles are also characterized by different colors, from yellow and orange to gray and black. Spherical particles with a glassy structure were also observed. The different colors of the particles indicate the heterogeneous structure of the ash as they are mutually constructed from different oxides [46]. Bottom ash particles are much less uniform and mostly have an irregular structure with a distinctly black color.
Understanding the proportion of the examined particle classes in the overall mass of ash is crucial for determining the economic viability of recovering essential components. Furthermore, the potential of using ashes for further applications is greatly influenced by their particle sizes [47]. The cumulative particle size distribution was determined using an optical microscope, and the results are shown in Figure 2.
The sizes of the particles vary in the range from a few micrometers to a few millimeters. The cumulative distribution indicates that the particles of different fly and bottom ash samples are mostly represented in the range from 100 to 350 μm, as for all samples in this segment, the greatest growth was recorded. Another noticeable trend is that bottom ash particles (samples CBA2, CBA6, CBA8, and CBA10) are slightly larger than fly ash particles (samples CFA1, CFA3, CFA4, CFA5, CFA7, CFA9, and CFA11). The bottom ash sample CBA8 contains the largest particles, whereas the fly ash sample CFA1 contains a larger proportion of small particles. The values of D50 and D90 for each sample are shown in Table S3. The D50 values vary in the 114–282 µm range, whereas the D90 values have a range of 246–664 µm.
The results of portable XRF screening (Figure 3) are shown for the blank, 11 ash samples, and SRM. The investigated ash samples are characterized by Ca, Fe, Ni, As, Rb, Sr, and Y peaks, whereas the blank shows distinguished peaks of Cl, Zn, Nb, and Mo. All samples have the highest Fe peak, followed by Sr, which is also represented to a significant extent. The CFA3, CFA4, CFA5, CFA7, CBA8, CFA9, CBA10, and SRM samples are also characterized by a significant As peak, whereas in sample CFA3, it is by far the most pronounced. Calcium and nickel were evenly detected in all test samples. This XRF screening analysis is not the method of choice for determining the chemical composition of coal ash samples. However, it is rather helpful for a fast field analysis of sample patterns.
The concentrations of the major elements in the ash samples measured using ICP-OES are presented in Table 2. The fly ash samples stand out due to their high dominance of SiO2 and Al2O3, distinguishing them from the bottom ash samples. Bottom ashes are characterized by their lower mineral contents. Across the studied samples, the average major element contents have the following descending sequence: Si > Al > Fe > Ca > K > Mg > Na~Ti. It is noteworthy that sulfur is usually present in coal ash as a major element, but it was not quantified in this study. The reason for this is that sulfur was not interesting for recovery, and sulfuric acid was also a candidate as an acid leaching agent. The REE concentrations in the studied fly and bottom coal ashes measured using ICP-MS after alkaline fusion sample preparation are given in Table S4.

3.2. Experimental Design Optimization of Coal Ash Roasting and REE Leaching

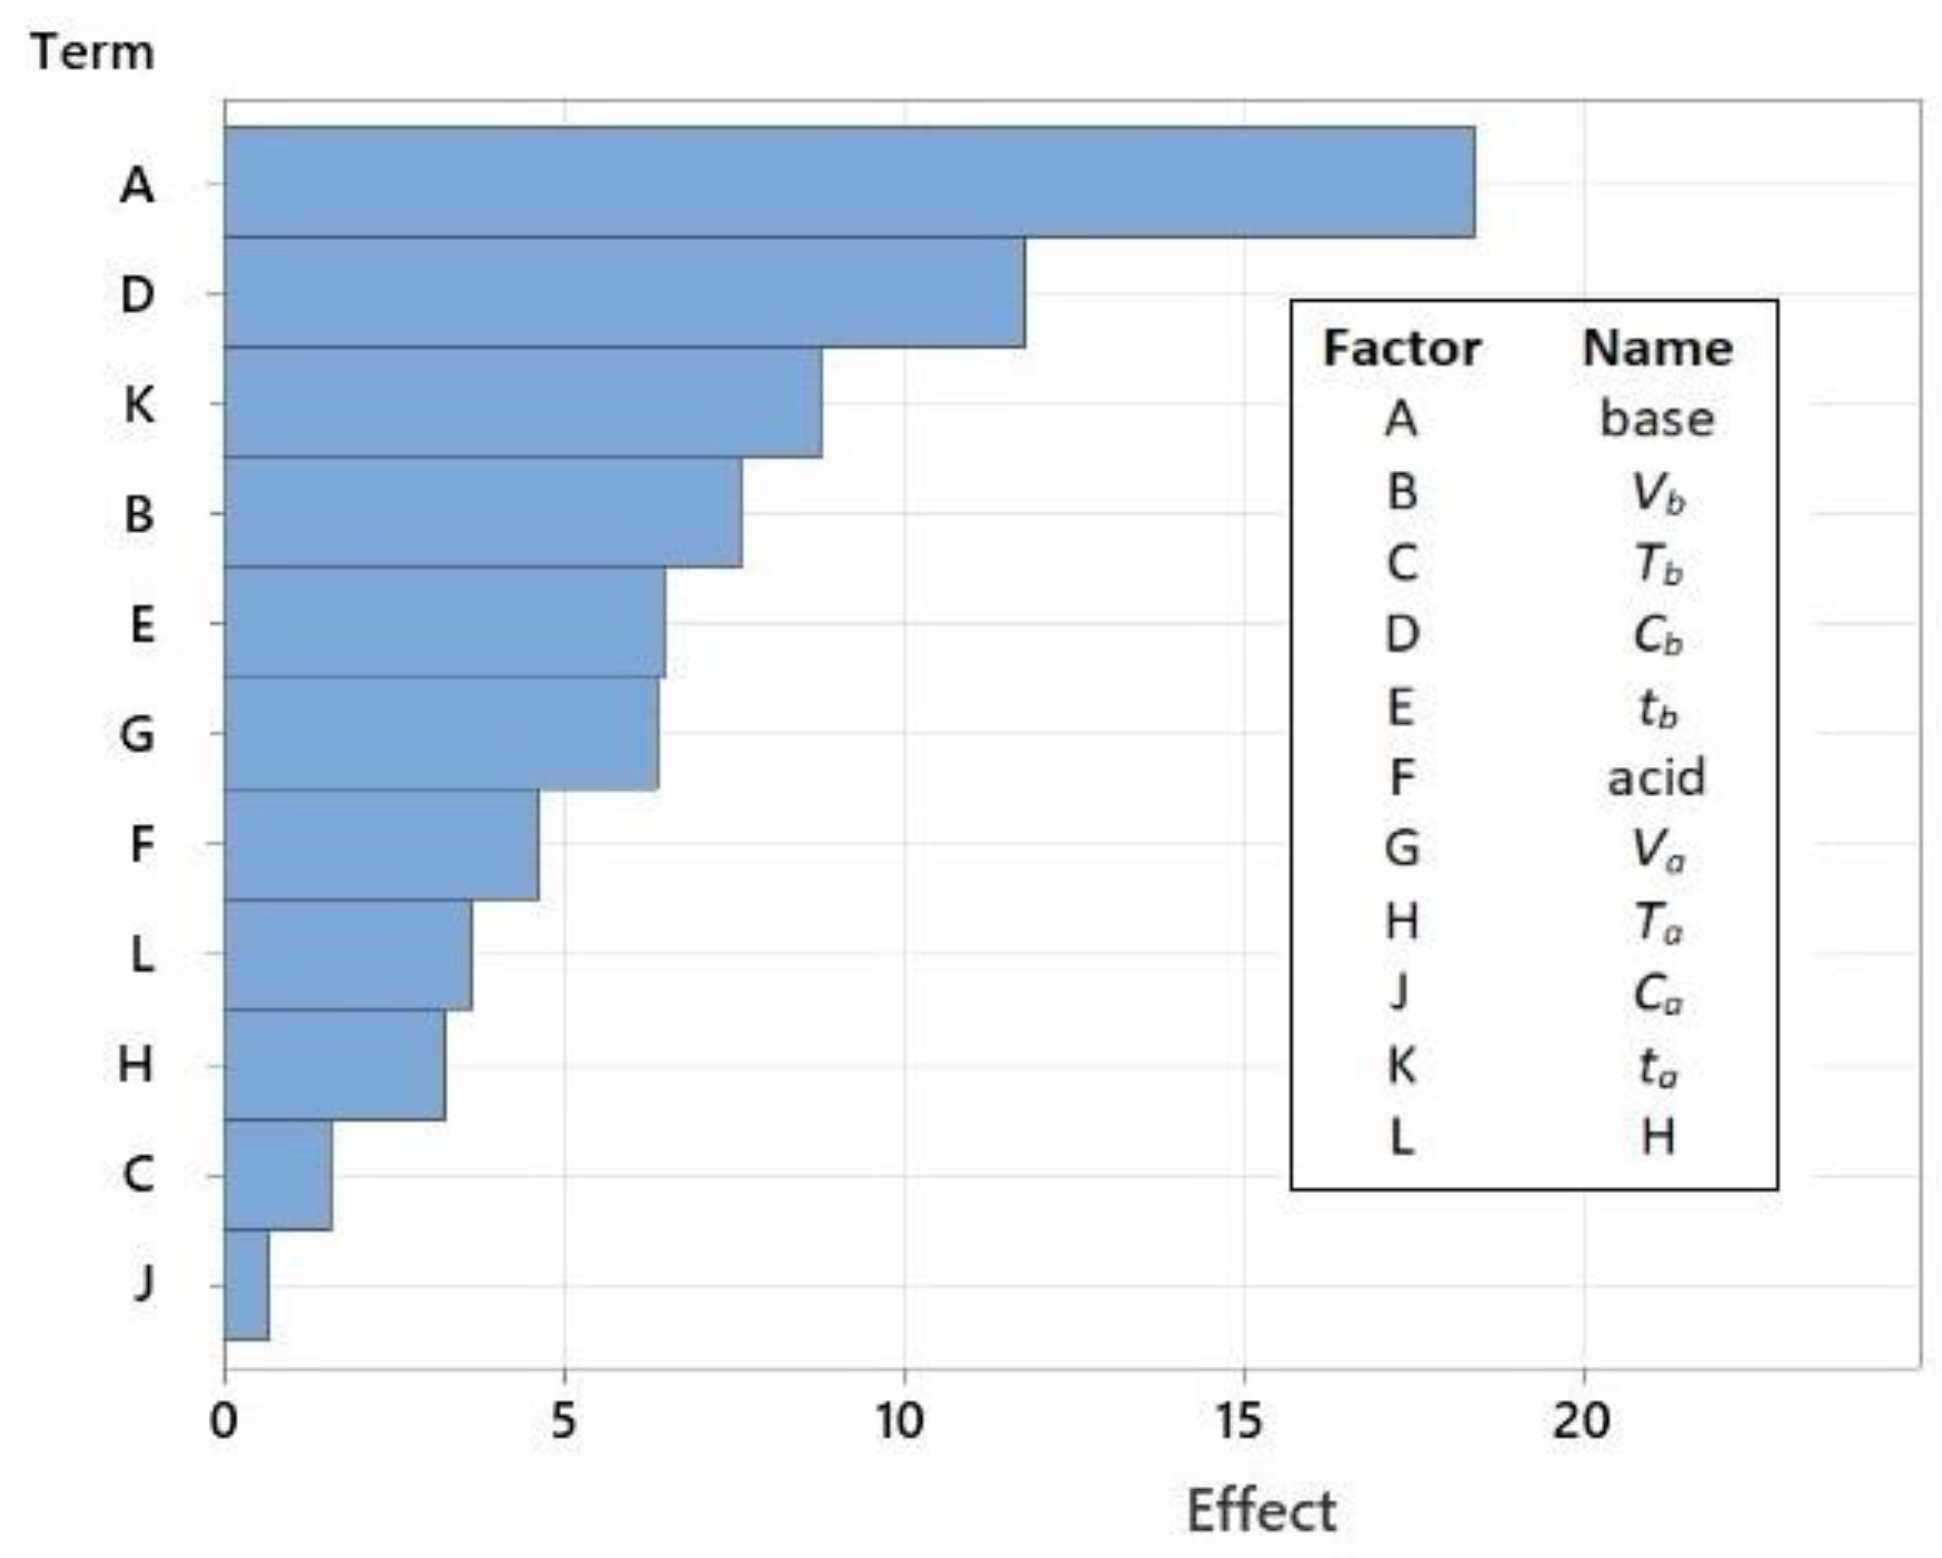
3.2.1. Screening Experiments—Plackett–Burman Design

In this set of experiments using the PBD, 11 parameters were evaluated and investigated in 12 experiments. The REE recovered, outlook coefficient, E-factor, atom economy, and energy consumption were considered as output parameters of the PBD. The values for each set of experiments are shown in Table 3. The total REE concentration for the examined sample was 152 mg kg−1.
The outlook coefficient represents the content ratio of recovered critical and excessive elements. It is important to consider the economic profitability of REE recovery. The higher the value of this coefficient, the higher the expected profitability, as critical REEs have a higher price than excessive ones [48]. For the analyzed samples, this parameter is very favorable. It varies in the range of 0.98–10.3, indicating that there is a high content of critical elements in the total REE concentration.
The obtained range of values for the E-factor for the PBD experiments is 48.1–2398, which does not follow the principles of green chemistry. Table 3 shows that the value of the atom economy is also unfavorable, as the highest calculated value is 2.2%, while the lowest one is only 0.04%. This result is expected, as the REEs in ash are found in low concentrations.
All independent process parameters were further analyzed using the Pareto diagram (Figure 4) and the main plots (Figure S2). The Pareto chart is a simplified graphical representation of the impacts of factors that makes it easier to compare the effects of various variables on responses and understand their effects.
The results show that the recovery of REEs from coal ash is mainly influenced by three parameters: the selection of a reagent for roasting (A), its concentration (D), and the duration of the acid leaching step (K). Because sodium hydroxide (NaOH) is a stronger base and more soluble in water, it performs significantly better when used as a roasting reagent than calcium oxide (CaO). Other studies have confirmed this [26,30].
Insoluble compounds that are part of the coal ash structure, such as magnetite (Fe2O3), quartz (SiO2), corundum (Al2O3), and mullite (3Al2O3·2SiO2), are transformed into water- and acid-soluble silicates (Na2SiO3), aluminates (NaAlO2), and aluminosilicate (NaAlSiO4) during the roasting process with NaOH [49]. These reactions are shown in Equations (5)–(9):
2 N a O H s + A l 2 O 3 s = 2 N a A l O 2 s + H 2 O g
2 N a O H s + S i O 2 s = N a 2 S i O 3 s + H 2 O g
N a A l O 2 s + S i O 2 s = N a A l S i O 4 s
6 N a O H s + 3 A l 2 O 3 · 2 S i O 2 s = 2 N a A l S i O 4 s + 4 N a A l O 2 s + 3 H 2 O g
2 N a O H s + F e 2 O 3 s = 2 N a F e O 2 s + H 2 O g
The results indicated that a lower concentration of the chemical agent for roasting is more suitable for recovery. In the leaching step, acids first neutralize the solution and then extract REEs from the ash structure. Regarding the duration of leaching, a longer time showed better results, which implies that 10 min is not enough for total recovery.
Regarding the outlook coefficient, the acid leaching duration was the most important factor for recovering critical REEs, followed by the base concentration and roasting time. While a longer reaction time is better for acid leaching, a shorter reaction time is better for roasting. A greater base concentration favors this process.
The concentration, volume, and the type of roasting reagent were the most influential parameters for the E-factor value. The sustainability of this process is demonstrated in the possibility that, in addition to the recovery of REEs, which is the focus of this work, it is possible to increase the recovery of Al and Si, which make up the largest part of the ash matrix, thus reducing the residual raw material [12,26]. Water leaching is shown to be an efficient process for dissolving sodium silicate products; therefore, the glassy phase is turned into a porous structure during this process. Their removal before acid leaching improves mass transfer, and acids diffuse more easily into the particles, thereby dissolving residues and REEs. In addition to recovering these significant raw materials, this step reduces the amount of acid required for further REE extraction [49]. The results indicate a favorable association between the recovery of Al and REEs, which may serve as an indicator of the potential recovery of REEs relative to Al. Similarly, the Al concentration may predict the REE content [26].
Analyzing the atom economy values in the PBD analysis showed that for the efficient conversion of reactants into desired products, the most important parameter is the acid concentration following the selection of the roasting reagent and its concentration. The higher the concentration, the larger the amount of residual products; in this regard, a lower concentration favors increasing the value of the atom economy. The selection of the roasting reagent is the second most important parameter when examining the atom economy as an output parameter. In this instance, NaOH also proved to be a better option. This result is explained by the larger molar mass of CaO (56.1 g/mol) compared with that of NaOH (40.0 g/mol); thus, for the same concentration and added volume, the mass of CaO is greater.
The duration of alkaline roasting was the most important characteristic in terms of energy use, which makes sense given that the longer the reaction, the more energy is used. It is noteworthy that the energy savings in US roasting is significantly improved compared with high-temperature ash roasting.
For the total response calculation, all parameters are weighed equally and given the same importance. For the total REE concentration, outlook coefficient, and atom economy, the maximum values are desired, whereas for the E-factor and energy consumption, the minimum values are desired. Accordingly, the optimized ultrasonic roasting was set up at 95 °C for 10 min, where the ratio of ash mass to 3M NaOH was 0.5:1 (m/V). A volume of 10 mL was adopted for the acid leaching step, while the acid type, temperature, and time were optimized in the next step.

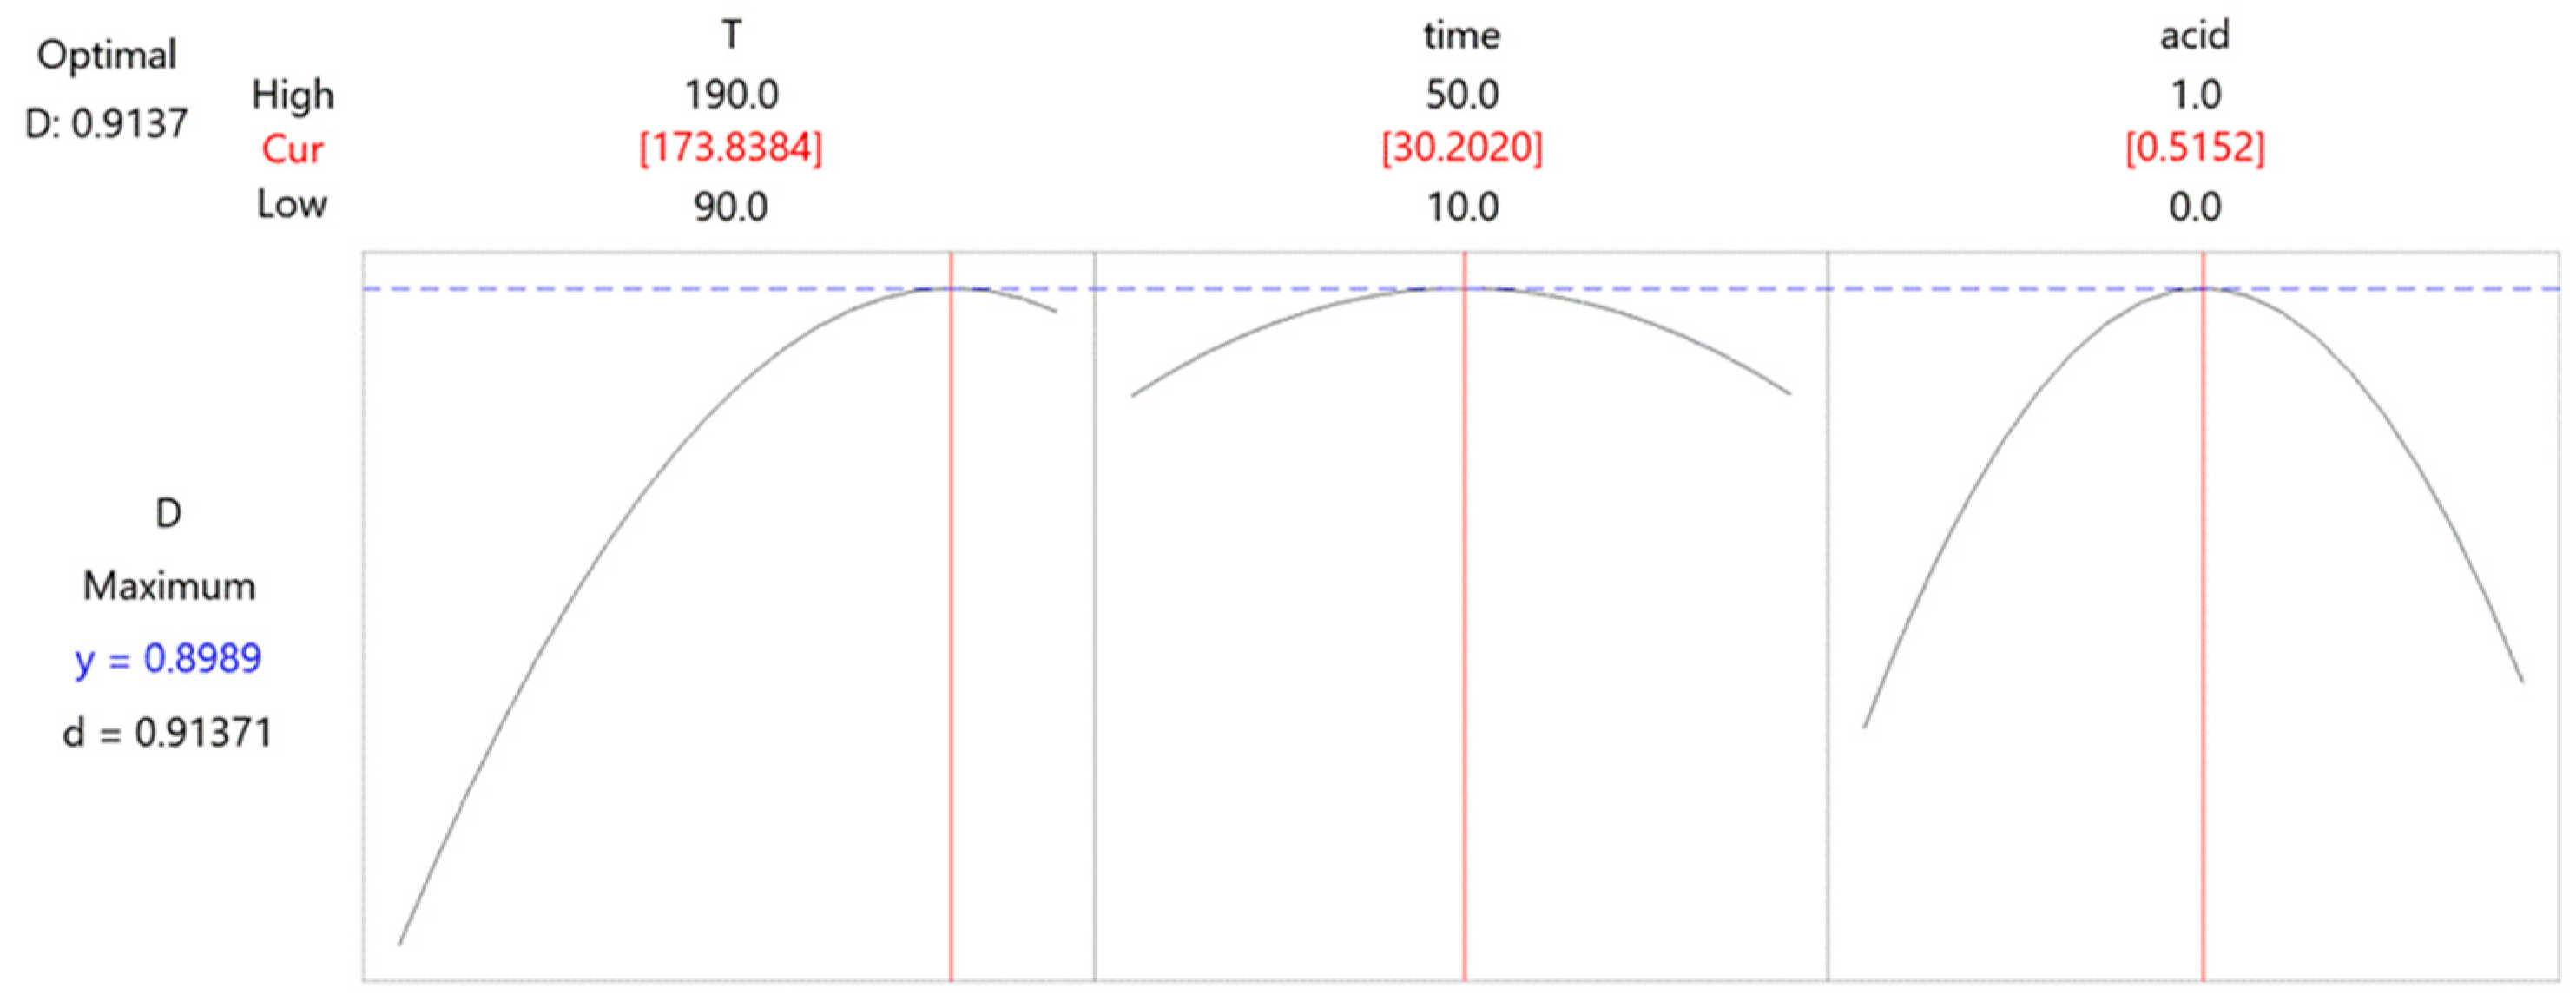
3.2.2. Response Surface Methodology—Box–Behnken Optimization

The adopted values of the selected parameters from the PBD were used as constants in further optimization. Within the Box–Behnken analysis, the acid leaching process was optimized in 15 experiments. Three selected variables, leaching temperature, time, and added acid(s) were investigated at three levels. The optimal conditions were determined by applying the response surface methodology (RSM) (Figure 5).
When all other parameters are held constant, three-dimensional response surfaces and contour plots are more useful for comprehending the main and combined impacts of the two elements [50]. The regression equation for the surface plots is as follows:
D = −1.58 + 0.0222 × T + 0.0162 × time + 1.17 × acid − 0.000064 × T × T − 0.000183 × time × time − 1.138 acid × acid − 0.000017 × T × time + 0.00079 × T × acid − 0.0045 × time × acid.
The shape of the response surface in Figure 5a shows an upward trend when the temperature is increased from 90 to 190 °C. Regarding the influence of the acid used, the graph indicates the existence of an optimal value. Mutual influence showed that the temperature affected the process to a greater extent. Figure 5b illustrates the same trend for the added acid as a peak that can be clearly distinguished. On the other hand, the reaction time is less important. Extending the reaction time can increase the efficiency of the process to a certain extent; however, because this difference is not significant, it is necessary to determine the optimal value for the process. The mutual influence of the temperature and reaction time on acid leaching is shown in Figure 5c, which shows that the influence of the reaction time is almost negligible, whereas the trend of increasing reaction temperature causes a sharp jump in the curve. After the analysis of the response surfaces, the optimal values of each parameter were adopted on the basis of the desirability graphs shown in Figure 6.
An analysis of the desirability graph showed that the optimal conditions for the acid leaching procedure were performed at 174 °C for 30 min, where the volume ratio of conc. HCl and HNO3 was 1:1 for a total amount of 10 mL.

3.3. Recovery of REEs from Coal Fly and Bottom Ashes

The recovery of REEs from 11 coal fly and bottom ash samples was examined at the optimal conditions previously determined in the process optimization step.
The effects of drying processes after roasting did not show a notable contribution to the increase in REE recovery. As their application requires energy consumption, the first set with successive ultrasonic roasting and microwave acid leaching processes was adopted as optimal.
Table 4 shows the total concentration of REEs for the studied samples of fly and bottom ashes and SRM, as well as the outlook coefficients and contents of critical, non-critical, excessive, light, medium, and heavy elements.
The analysis of the samples showed that the total content of REE varied in the range of 62.4–117 mg kg−1 for bottom ash and 73.7–267 mg kg−1 for fly ash. For all thermal power plants, a significantly higher REE content is found in fly ash than in bottom ash. The SRM has a concentration of 378 mg kg−1, which is significantly higher than that of the other samples. This difference may be because SRM particles (75 μm) are significantly smaller than the examined ash particles (125 μm). This result indicates that it is necessary to investigate the effect of particle size on REE recovery [51]. The highest recovery of REE from ash samples was achieved for fly ash originating from TPP Kolubara (CFA4), followed by TPP “Nikola Tesla” TENT A (CFA7) and TPP “Nikola Tesla” TENT B (CFA9). These values are 267, 254, and 209 mg kg−1, respectively. The smallest concentration was achieved for the bottom ash sample originating from TPP Kostolac (CBA2) at 62.4 mg kg−1, followed by the fly ash sample originating from TPP Kolubara (CFA3) at 73.7 mg kg−1. The remaining bottom ash samples, TPP Morava (CBA6), TPP “Nikola Tesla” TENT A (CBA8), and TPP “Nikola Tesla” TENT B (CBA10), had similar concentrations, namely 117 mg kg−1, 116, and 116 mg kg−1, respectively. The total recovery expressed over the total concentration obtained by alkaline fusion for all 11 examined ash samples and SRM varied in the range of 58–90%, with an average value of 80%.
Regarding the division of REE into critical, non-critical, and excessive elements for all samples, the content of excessive elements is higher than that of critical elements. In this regard, the outlook coefficient varies in the range of 0.72–0.92. This relationship favors the economic justification of the recovery method. Regarding the SRM, the value of the outlook coefficient is greater and amounts to 1.06. Using the outlook coefficient, the market value and appraisal of REE-bearing ores are assessed. The higher the value of this coefficient, the higher the profitability of the exploitation of a given source of REE. The results show satisfactory values of this coefficient, and if we consider that there are no additional mining costs, the investigated ash samples can be potentially economically justified alternative sources of REE [14].
The analysis of the distribution of REE as light, medium, and heavy elements in the studied samples showed that the recovery of these elements and their contents in the samples are directly related to their atomic masses. Thus, the highest concentrations in all studied samples were recorded for light elements, where the total concentration varied in the range of 48.5–221 mg kg−1, with an average value of 124 mg kg−1. This is followed by concentrations for medium REEs in the range of 12.0–40.8 mg kg−1 and a mean value of 24.0 mg kg−1, and finally, for heavy elements with significantly lower concentrations in the range of 1.7–5.6 mg kg−1 and a mean value of 3.5 mg kg−1. Light REEs account for an average of 81% of the total concentration of recovered elements. For the SRM, all examined values were greater, namely 277 mg kg−1, 88.4 mg kg−1, and 12 mg kg−1 for light, medium, and heavy elements, respectively. The same abundance trend was recorded in the groundwater near the ash landfill [52].
In addition to analyzing the total recovery of REEs, an analysis of individual elements was also carried out. Figure 7 shows the mean values of REE recovery per individual element for 11 examined ash samples with standard deviations. The critical elements are marked in red, and all others are marked in blue. The concentrations of recovered elements per sample are given in Table S5.
The average concentrations of REEs were in the following order: Ce (54.2 mg kg−1), La (24.7 mg kg−1), Nd (21.8 mg kg−1), Y (15.6 mg kg−1), Sc (12.8 mg kg−1), Pr (5.78 mg kg−1), Sm (4.39 mg kg−1), Gd (4.04 mg kg−1), Dy (3.13 mg kg−1), Er (1.46 mg kg−1), Yb (1.17 mg kg−1), Eu (0.84 mg kg−1), Ho (0.44 mg kg−1), Tb (0.43 mg kg−1), Tm (0.20 mg kg−1), and Lu (0.17 mg kg−1). The most abundant element for all samples was Ce, accounting for 32.0–37.1% of the total REE concentration.
The highest recovery for each sample was achieved for cerium (Ce), which is expected if we consider that it is the most abundant REE element in the Earth’s crust [53]; its concentration varied in the range of 20.0–98.5 mg kg−1 with a standard deviation of 54.2. The lowest return was achieved for lutetium (Lu), 0.09–0.27 mg kg−1, with a standard deviation of 0.06. The critical element recovered to the greatest extent was neodymium (Nd), with a range of 8.28–39.6 mg kg−1 and a standard deviation of 21.8.
The standard deviation follows the recovery trend, so it is the greatest for the most leached element, Ce, and the smallest for the least leached element, Lu. Such large standard deviations indicate that the structure of the ash itself has a significant influence on the extraction of rare earth elements.

3.4. Green Aspects: E-Factor, Atom Economy, and Energy Consumption

The values of the E-factor and atom economy determined in the experiments performed in the process optimization step (initial) were influenced by the mass of reactants, whereas in the set of experiments with 11 ash samples (final), these values were only affected by the total concentration of the recovered REEs (Table S6). The value of the E-factori varies in the range of 48.1–2398, whereas the range for the E-factorf was 28.0–123. These values indicate that the optimized method is more suitable not only for a higher recovery of REE, but is also environmentally justified for application, considering that a smaller amount of waste material is generated compared with the original experiments.
The value of the atom economy was also more favorable for the final set of experiments (0.81–3.45%) than for the initial set (0.04–2.18%). In general, the value of the atom economy in all experiments did not show favorable values because the percentage return was very small; in the best case, it was 3.45%. However, such results can be explained by the very low content of these elements in fly ash in relation to its total mass, which is the value of the atom economy.
Regarding energy consumption for the initial set of experiments, the values varied in the range of 25–1825 Wh, with an average value of 600 Wh. In the final experiments, the total energy consumption was 963 Wh. Although the final energy consumption is slightly higher than the average consumption for the initial set of experiments, this value is justified for use.
To strengthen environmental protection, reducing the amount of acid and alkali waste generated is desirable. By optimizing the process (using the minimum required chemicals), carrying out waste exchange (using waste acid to neutralize alkali waste), and recycling (turning used hydrochloric acid and calcium hydroxide sludge into calcium chloride), it is possible to reduce the amount of waste requiring disposal [54,55].
The total REE content in the analyzed samples was in the range of 83.6 to 300 mg kg−1. An average recovery of 80% was achieved by applying the developed method. The outlook coefficient varied in the range of 0.72–0.92. According to the data for 2023, the prices of REE vary in a wide range; the La and Ce oxides are valued at USD 1 per kg; for Eu, Nd, and Dy oxides, the prices are USD 27, 80, and 323 per kg, respectively. The most expensive is Tb oxide, costing USD 1300 per kg [56]. Regarding the available reserves of coal fly ash in Serbia, the current amount of deposited ash is more than 200 million tons. Considering that CFA does not carrys mining cost, this source could be potentially viable from both economic and environmental viewpoints.

4. Conclusions

A dual-step methodology involving ultrasonic roasting followed by microwave acid leaching was used to extract REEs from fly and bottom coal ash samples. The Plackett–Burman design was used for the initial set of experiments to evaluate the parameters that were significant for the process. After adopting the roasting parameter setup, the acid leaching procedure was optimized using the Box–Behnken design. The response surface methodology and desirability function emphasized the optimal acid leaching values. The optimized ultrasonic roasting was set up at 95 °C for 10 min, where the ratio of ash mass to 3M NaOH was 0.5:1 (m/V). For the acid leaching procedure, optimal conditions were reached at 174 °C for 30 min, where the volume ratio of conc. HCl and HNO3 was 1:1.
The effectiveness of the procedure was tested, resulting in an average recovery of 80%. Higher recoveries were achieved for fly ash than for bottom ash samples, and they varied in the ranges of 73.7–267 mg kg−1 and 62.4–117 mg kg−1, respectively. The outlook coefficient results (0.72–0.92) indicated the presence of a significant amount of critical elements. Light REEs account for 81% of the total concentration of recovered REE elements. At the individual level, the highest average recovery values were achieved for Ce (54.2 mg kg−1), La (24.7 mg kg−1), and Nd (21.8 mg kg−1), whereas the lowest recovery values were achieved for Tb (0.43 mg kg−1), Tm (0.20 mg kg−1), and Lu (0.17 mg kg−1).

Supplementary Materials

The following supporting information can be downloaded at https://www.mdpi.com/article/10.3390/met14040371/s1, Table S1: Plackett–Burman design for screening set of experiments; Table S2: Box–Behnken design for response surface methodology set of experiments; Table S3: The D50 and D90 values for the studied coal ash samples (μm); Table S4: Total REE content in studied fly and bottom coal ashes after alkaline fusion (mg kg−1); Table S5: REE content recovered from fly and bottom coal ashes (mg kg−1); Table S6: Green metrics for initial (i) and final (f) sets of experiments; Figure S1: Microscopic images of coal fly and bottom ashes; Figure S2: Main plot analyses for screening experiments (response is REE content, mg kg−1).

Author Contributions

Conceptualization, A.O.; Methodology, M.R.; Software, A.O.; Validation, M.R.; Formal Analysis, M.Đ.; Investigation, M.S.; Resources, A.P.G.; Data Curation, M.S.; Writing—Original Draft Preparation, M.S.; Writing—Review and Editing, A.O.; Visualization, M.Đ.; Supervision, A.O.; Project Administration, A.P.G.; and Funding Acquisition, A.P.G. All authors have read and agreed to the published version of the manuscript.

Funding

This research was supported by the Science Fund of the Republic of Serbia (Program Ideas; SIW4SE—Serbian Industrial Waste towards Sustainable Environment: Resource of Strategic Elements and Removal Agent for Pollutants, grant no. 7743343).

Data Availability Statement

The raw data supporting the conclusions of this article will be made available by the authors on request.

Conflicts of Interest

The authors declare no conflicts of interest.

References

  1. Voncken, J.H.L. The Rare Earth Elements—A Special Group of Metals. In The Rare Earth Elements; SpringerBriefs in Earth Sciences: Cham, Switzerland, 2016; pp. 1–13. [Google Scholar] [CrossRef]
  2. Wall, F. Rare Earth Elements. In Critical Metals Handbook; John Wiley & Sons, Inc.: Hoboken, NJ, USA, 2013; pp. 312–339. [Google Scholar] [CrossRef]
  3. Rybak, A.; Rybak, A. Characteristics of Some Selected Methods of Rare Earth Elements Recovery from Coal Fly Ashes. Metals 2021, 11, 142. [Google Scholar] [CrossRef]
  4. Fu, B.; Hower, J.C.; Zhang, W.; Luo, G.; Hu, H.; Yao, H. A Review of Rare Earth Elements and Yttrium in Coal Ash: Content, Modes of Occurrences, Combustion Behavior, and Extraction Methods. Prog. Energy Combust. Sci. 2022, 88, 100954. [Google Scholar] [CrossRef]
  5. Hoshino, M.; Sanematsu, K.; Watanabe, Y. REE Mineralogy and Resources. Handb. Phys. Chem. Rare Earths 2016, 49, 129–291. [Google Scholar] [CrossRef]
  6. Seredin, V.V.; Dai, S.; Sun, Y.; Chekryzhov, I.Y. Coal Deposits as Promising Sources of Rare Metals for Alternative Power and Energy-Efficient Technologies. Appl. Geochem. 2013, 31, 1–11. [Google Scholar] [CrossRef]
  7. München, D.D.; Veit, H.M. Neodymium as the Main Feature of Permanent Magnets from Hard Disk Drives (HDDs). Waste Manag. 2017, 61, 372–376. [Google Scholar] [CrossRef] [PubMed]
  8. Cun, Z.; Xing, P.; Wang, C.; Li, H.; Ma, S.; Sun, Z.; Wang, Q.; Guan, X. Stepwise Recovery of Critical Metals from Spent NCM Lithium-Ion Battery via Calcium Hydroxide Assisted Pyrolysis and Leaching. Resour. Conserv. Recycl. 2024, 202, 107390. [Google Scholar] [CrossRef]
  9. Weshahy, A.R.; Gouda, A.A.; Atia, B.M.; Sakr, A.K.; Al-Otaibi, J.S.; Almuqrin, A.; Hanfi, M.Y.; Sayyed, M.I.; El Sheikh, R.; Radwan, H.A.; et al. Efficient Recovery of Rare Earth Elements and Zinc from Spent Ni–Metal Hydride Batteries: Statistical Studies. Nanomaterials 2022, 12, 2305. [Google Scholar] [CrossRef] [PubMed]
  10. Balaram, V. Rare Earth Elements: A Review of Applications, Occurrence, Exploration, Analysis, Recycling, and Environmental Impact. Geosci. Front. 2019, 10, 1285–1303. [Google Scholar] [CrossRef]
  11. Bispo, F.H.A.; de Menezes, M.D.; Fontana, A.; Sarkis, J.E.d.S.; Gonçalves, C.M.; de Carvalho, T.S.; Curi, N.; Guilherme, L.R.G. Rare Earth Elements (REEs): Geochemical Patterns and Contamination Aspects in Brazilian Benchmark Soils. Environ. Pollut. Barking Essex 1987 2021, 289, 117972. [Google Scholar] [CrossRef] [PubMed]
  12. Wu, L.; Ma, L.; Huang, G.; Li, J.; Xu, H. Distribution and Speciation of Rare Earth Elements in Coal Fly Ash from the Qianxi Power Plant, Guizhou Province, Southwest China. Minerals 2022, 12, 1089. [Google Scholar] [CrossRef]
  13. Dai, S.; Finkelman, R.B. Coal as a Promising Source of Critical Elements: Progress and Future Prospects. Int. J. Coal Geol. 2018, 186, 155–164. [Google Scholar] [CrossRef]
  14. Seredin, V.V.; Dai, S. Coal Deposits as Potential Alternative Sources for Lanthanides and Yttrium. Int. J. Coal Geol. 2012, 94, 67–93. [Google Scholar] [CrossRef]
  15. Jankovic, A.; Cujic, M.; Stojkovic, M.; Djolic, M.; Zivojinovic, D.; Onjia, A.; Ristic, M.; Peric-Grujic, A. Impact of Leaching Procedure on Heavy Metals Removal from Coal Fly Ash. Hem. Ind. 2024, 1–12. [Google Scholar] [CrossRef]
  16. Slavković-Beškoski, L.; Ignjatović, L.; Ćujić, M.; Vesković, J.; Trivunac, K.; Stojaković, J.; Perić-Grujić, A.; Onjia, A. Ecological and Health Risks Attributed to Rare Earth Elements in Coal Fly Ash. Toxics 2024, 12, 71. [Google Scholar] [CrossRef] [PubMed]
  17. Wang, N.; Sun, X.; Zhao, Q.; Yang, Y.; Wang, P. Leachability and Adverse Effects of Coal Fly Ash: A Review. J. Hazard. Mater. 2020, 396, 122725. [Google Scholar] [CrossRef] [PubMed]
  18. Pires, A.; Martinho, G. Waste Hierarchy Index for Circular Economy in Waste Management. Waste Manag. 2019, 95, 298–305. [Google Scholar] [CrossRef] [PubMed]
  19. Balangao, J.K.; Caingles, V.K.; Baguhin, I. Morphological and environmental characterization of lime sludge/fly ash stabilized sub-base materials. Sci. Int. 2023, 35, 283–290. [Google Scholar]
  20. Li, G.; Zhou, C.; Ahmad, W.; Usanova, K.I.; Karelina, M.; Mohamed, A.M.; Khallaf, R. Fly Ash Application as Supplementary Cementitious Material: A Review. Materials 2022, 15, 2664. [Google Scholar] [CrossRef]
  21. Ge, J.C.; Yoon, S.K.; Choi, N.J. Application of Fly Ash as an Adsorbent for Removal of Air and Water Pollutants. Appl. Sci. 2018, 8, 1116. [Google Scholar] [CrossRef]
  22. Ghosh, A.K.; Kumar, D. Use of Fly ash in Agriculture: A Way to Improve Soil Fertility and Its Productivity. Asian J. Agric. Res. 2010, 4, 1–14. [Google Scholar] [CrossRef]
  23. Zhang, W.; Noble, A.; Yang, X.; Honaker, R. A Comprehensive Review of Rare Earth Elements Recovery from Coal-Related Materials. Minerals 2020, 10, 451. [Google Scholar] [CrossRef]
  24. Pan, J.; Zhou, C.; Liu, C.; Tang, M.; Cao, S.; Hu, T.; Ji, W.; Luo, Y.; Wen, M.; Zhang, N. Modes of Occurrence of Rare Earth Elements in Coal Fly Ash: A Case Study. Energy Fuels 2018, 32, 9738–9743. [Google Scholar] [CrossRef]
  25. Kashiwakura, S.; Kumagai, Y.; Kubo, H.; Wagatsuma, K.; Kashiwakura, S.; Kumagai, Y.; Kubo, H.; Wagatsuma, K. Dissolution of Rare Earth Elements from Coal Fly Ash Particles in a Dilute H2SO4 Solvent. Open J. Phys. Chem. 2013, 3, 69–75. [Google Scholar] [CrossRef]
  26. Pan, J.; Hassas, B.V.; Rezaee, M.; Zhou, C.; Pisupati, S.V. Recovery of Rare Earth Elements from Coal Fly Ash through Sequential Chemical Roasting, Water Leaching, and Acid Leaching Processes. J. Clean. Prod. 2021, 284, 124725. [Google Scholar] [CrossRef]
  27. Stopic, S.; Friedrich, B. Advances in Understanding of the Application of Unit Operations in Metallurgy of Rare Earth Elements. Metals 2021, 11, 978. [Google Scholar] [CrossRef]
  28. Liu, P.; Huang, R.; Tang, Y. Comprehensive Understandings of Rare Earth Element (REE) Speciation in Coal Fly Ashes and Implication for REE Extractability. Environ. Sci. Technol. 2019, 53, 5369–5377. [Google Scholar] [CrossRef] [PubMed]
  29. Tang, M.; Zhou, C.; Pan, J.; Zhang, N.; Liu, C.; Cao, S.; Hu, T.; Ji, W. Study on Extraction of Rare Earth Elements from Coal Fly Ash through Alkali Fusion—Acid Leaching. Miner. Eng. 2019, 136, 36–42. [Google Scholar] [CrossRef]
  30. Taggart, R.K.; Hower, J.C.; Hsu-Kim, H. Effects of Roasting Additives and Leaching Parameters on the Extraction of Rare Earth Elements from Coal Fly Ash. Int. J. Coal Geol. 2018, 196, 106–114. [Google Scholar] [CrossRef]
  31. Wen, Z.; Zhou, C.; Pan, J.; Cao, S.; Hu, T.; Ji, W.; Nie, T. Recovery of Rare-Earth Elements from Coal Fly Ash via Enhanced Leaching. Int. J. Coal Prep. Util. 2020, 27, 2–3. [Google Scholar] [CrossRef]
  32. Slavković-Beškoski, L.; Ignjatović, L.; Bolognesi, G.; Maksin, D.; Savić, A.; Vladisavljević, G.; Onjia, A. Dispersive Solid–Liquid Microextraction Based on the Poly(HDDA)/Graphene Sorbent Followed by ICP-MS for the Determination of Rare Earth Elements in Coal Fly Ash Leachate. Metals 2022, 12, 791. [Google Scholar] [CrossRef]
  33. Nascimento, M.; Lemos, F.; Guimarães, R.; Sousa, C.; Soares, P. Modeling of REE and Fe Extraction from a Concentrate from Araxá (Brazil). Minerals 2019, 9, 451. [Google Scholar] [CrossRef]
  34. Pan, J.; Nie, T.; Vaziri Hassas, B.; Rezaee, M.; Wen, Z.; Zhou, C. Recovery of Rare Earth Elements from Coal Fly Ash by Integrated Physical Separation and Acid Leaching. Chemosphere 2020, 248, 126112. [Google Scholar] [CrossRef]
  35. Shoppert, A.; Valeev, D.; Napol’skikh, J.; Loginova, I.; Pan, J.; Chen, H.; Zhang, L. Rare-Earth Elements Extraction from Low-Alkali Desilicated Coal Fly Ash by (NH4)2SO4 + H2SO4. Materials 2023, 16, 6. [Google Scholar] [CrossRef]
  36. Sun, J.; Shang, H.; Zhang, Q.; Liu, X.; Cai, L.; Wen, J.; Yang, H. A Novel Two-Stage Method of Co-Leaching of Manganese–Silver Ore and Silver-Bearing Pyrite Based on Successive Chemical and Bio Treatments: Optimization and Mechanism Study. Metals 2023, 13, 438. [Google Scholar] [CrossRef]
  37. Wang, Z.; Dai, S.; Zou, J.; French, D.; Graham, I.T. Rare Earth Elements and Yttrium in Coal Ash from the Luzhou Power Plant in Sichuan, Southwest China: Concentration, Characterization and Optimized Extraction. Int. J. Coal Geol. 2019, 203, 1–14. [Google Scholar] [CrossRef]
  38. Tadić, T.; Marković, B.; Radulović, J.; Lukić, J.; Suručić, L.; Nastasović, A.; Onjia, A. A Core-Shell Amino-Functionalized Magnetic Molecularly Imprinted Polymer Based on Glycidyl Methacrylate for Dispersive Solid-Phase Microextraction of Aniline. Sustainablity 2022, 14, 9222. [Google Scholar] [CrossRef]
  39. Chang, J.; Srinivasakannan, C.; Sun, X.; Jia, F. Optimization of Microwave-Assisted Manganese Leaching from Electrolyte Manganese Residue. Green Process. Synth. 2020, 9, 1–11. [Google Scholar] [CrossRef]
  40. Costa, N.R.; Lourenço, J.; Pereira, Z.L. Desirability Function Approach: A Review and Performance Evaluation in Adverse Conditions. Chemom. Intell. Lab. Syst. 2011, 107, 234–244. [Google Scholar] [CrossRef]
  41. Lučić, M.; Potkonjak, N.; Sredović Ignjatović, I.; Lević, S.; Dajić-Stevanović, Z.; Kolašinac, S.; Belović, M.; Torbica, A.; Zlatanović, I.; Pavlović, V.; et al. Influence of Ultrasonic and Chemical Pretreatments on Quality Attributes of Dried Pepper (Capsicum annuum). Foods 2023, 12, 2468. [Google Scholar] [CrossRef] [PubMed]
  42. Kuhn, M. The Desirability Package. 2016. Available online: https://cran.r-project.org/web/packages/desirability/vignettes/desirability.pdf (accessed on 12 March 2024).
  43. Anastas, P.; Eghbali, N. Green Chemistry: Principles and Practice. Chem. Soc. Rev. 2009, 39, 301–312. [Google Scholar] [CrossRef]
  44. Sheldon, R.A. The E Factor 25 Years on: The Rise of Green Chemistry and Sustainability. Green Chem. 2017, 19, 18–43. [Google Scholar] [CrossRef]
  45. Trost, B.M. On Inventing Reactions for Atom Economy. Acc. Chem. Res. 2002, 35, 695–705. [Google Scholar] [CrossRef]
  46. Adamczyk, Z.; Komorek, J.; Kokowska-Pawłowska, M.; Nowak, J. Distribution of Rare-Earth Elements in Ashes Produced in the Coal Combustion Process from Power Boilers. Energy 2023, 16, 2696. [Google Scholar] [CrossRef]
  47. Strzałkowska, E. Ashes Qualified as a Source of Selected Critical Elements (REY, Co, Ga, V). Energy 2023, 16, 3331. [Google Scholar] [CrossRef]
  48. Tsachouridis, A.; Pavloudakis, F.; Kiratzis, N. Development of Rare Earth Elements Separation Processes from Coal Fly Ash. Mater. Proc. 2021, 5, 69. [Google Scholar] [CrossRef]
  49. Wu, G.; Wang, T.; Chen, G.; Shen, Z.; Pan, W.P. Coal Fly Ash Activated by NaOH Roasting: Rare Earth Elements Recovery and Harmful Trace Elements Migration. Fuel 2022, 324, 124515. [Google Scholar] [CrossRef]
  50. Puri, S.; Beg, Q.K.; Gupta, R. Optimization of Alkaline Protease Production from Bacillus Sp. By Response Surface Methodology. Curr. Microbiol. 2002, 44, 286–290. [Google Scholar] [CrossRef] [PubMed]
  51. Jiang, P.; Chen, J.; Li, Y.; Li, X.; Qi, X.; Wang, J.; Chen, P.; Liu, W.; Wang, R. Partitioning and Migration of Trace Elements during Coal Combustion in Two Coal-Fired Power Plants in Hefei City, Anhui Province, Eastern China. Minerals 2023, 13, 152. [Google Scholar] [CrossRef]
  52. Vesković, J.; Lučić, M.; Ristić, M.; Perić-Grujić, A.; Onjia, A. Spatial Variability of Rare Earth Elements in Groundwater in the Vicinity of a Coal-Fired Power Plant and Associated Health Risk. Toxics 2024, 12, 62. [Google Scholar] [CrossRef]
  53. Dahle, J.T.; Arai, Y. Environmental Geochemistry of Cerium: Applications and Toxicology of Cerium Oxide Nanoparticles. Int. J. Environ. Res. Public Health 2015, 12, 1253–1278. [Google Scholar] [CrossRef] [PubMed]
  54. Xie, F.; Zhang, T.A.; Dreisinger, D.; Doyle, F. A Critical Review on Solvent Extraction of Rare Earths from Aqueous Solutions. Miner. Eng. 2014, 56, 10–28. [Google Scholar] [CrossRef]
  55. Behera, S.; Kumari, U.; Meikap, B. A Review of Chemical Leaching of Coal by Acid and Alkali Solution. J. Min. Metall. Min. 2018, 54, 1–24. [Google Scholar] [CrossRef]
  56. Mineral Commodity Summaries 2024; U.S. Geological Survey: Reston, VA, USA, 2024. [CrossRef]
Figure 1. Microscopic images of coal fly and bottom ash samples.
Metals 14 00371 g001
Figure 2. Particle size distribution of analyzed coal fly and bottom ash samples.
Metals 14 00371 g002
Figure 3. XRF screening of coal fly and bottom ash samples.
Metals 14 00371 g003
Figure 4. A Pareto chart of the effects from the screening experiments (response is REE; α = 0.05).
Metals 14 00371 g004
Figure 5. Response surface plots: (a) acid and temperature, (b) acid and time, and (c) time and temperature.
Metals 14 00371 g005
Figure 6. Box–Behnken design–desirability graphs.
Metals 14 00371 g006
Figure 7. Average concentrations of recovered REE with standard deviations for examined ash samples.
Metals 14 00371 g007
Table 1. Plackett–Burman process parameters.
ParametersSymbolLevel
LowHigh
Chemical agent for roastingbaseNaOHCaO
Volume of roasting agent (mL)Vb15
Concentration of roasting agent (M)Cb110
Roasting temperature (°C)Tb2595
Roasting time (min)tb1060
Acid for leachingacidHClHNO3
Acid volume (mL)Va1030
Acid concentration (M)Ca110
Leaching temperature (°C)Ta2595
Leaching time (min)ta1060
Heating method for roastingHUSMW
US—ultrasonic; MW—microwave.
Table 2. Major element contents of fly and bottom coal ash samples (%).
No.SiO2Al2O3Fe2O3K2OCaOMgOTiO2Na2OLOI
CFA146.422.910.43.15.32.40.61.46.6
CBA218.111.53.41.22.30.90.30.659.1
CFA346.625.07.43.84.52.61.01.36.9
CFA458.619.06.34.54.61.60.60.92.0
CFA551.924.16.14.05.61.50.62.02.6
CBA619.110.03.11.21.30.80.30.462.4
CFA749.126.12.46.37.24.60.80.71.6
CBA833.323.63.84.24.92.40.70.724.9
CFA954.024.85.44.14.02.10.80.71.9
CBA1027.715.74.22.51.41.00.50.443.3
CFA1149.928.27.54.52.51.70.80.81.1
SRM46.827.610.46.41.30.81.21.03.3
Table 3. Response parameter values for PBD experiments.
No. of Exp.REE
Recovered
(mg kg−1)
Outlook
Coefficient
E-FactorAtom Economy (%)Energy
Consumption (Wh)
145.41.0154.91.82785
220.51.085940.17625
32.0410.323980.0425
442.50.9872.71.371800
520.71.0792.61.08468
630.31.142540.39325
737.01.011310.761825
839.30.995080.20385
924.61.218920.11118
1030.71.0848.12.1885
114.373.4417070.06435
1211.81.0818,5530.54325
Table 4. Total REE concentration (mg kg−1), total REE recovered (mg kg−1), portion of recovered REEs (%), outlook coefficient, and contents of critical, non-critical, excessive, light, medium, and heavy elements for examined ash samples and SRM (NIST 1633c).
No. of SampleTotal REE
(mg kg−1)
Total REE Recovered
(mg kg−1)
R (%)OutlookCriticalNon-CriticalExcessiveLightMediumHeavy
CFA1152115760.8834.626.639.591.320.73.4
CBA210762.4580.9219.414.321.148.512.02.0
CFA383.673.7880.7921.719.127.459.612.41.7
CFA4300267890.7475.271.010222140.85.6
CFA5190154810.7744.039.257.512724.03.4
CBA6161117730.7532.629.743.396.417.92.6
CFA7282254900.7270.466.797.321237.35.2
CBA8138116840.7934.130.043.093.519.52.9
CFA9262209800.8061.454.077.217034.55.0
CBA10156116740.7231.631.244.296.417.22.4
CFA11206178860.7751.046.466.214628.23.9
SRM448378841.0613788.613027788.412.1
Disclaimer/Publisher’s Note: The statements, opinions and data contained in all publications are solely those of the individual author(s) and contributor(s) and not of MDPI and/or the editor(s). MDPI and/or the editor(s) disclaim responsibility for any injury to people or property resulting from any ideas, methods, instructions or products referred to in the content.

