Abstract
The study presented in this paper was undertaken in response to two instances of unexpected blade breakage in the cutting blade used in a Carton Wrap machine (CW). Failure of the Al7075 alloy blade occurred at an indentation during typical operational loading conditions. Subsequent metallographic examinations of the fractured samples confirmed that both cases were attributed to fatigue failure. The main objective of this study is to investigate potential causes of fatigue failure in the CW blade using simplified linear elastic static numerical simulations through Finite Element Analysis (FEA). In this research, we employed the well-established Theory of Critical Distance (TCD), and this case study provided a contextualization at an industrial level. Furthermore, the analysis focused on a second key aspect: proposing a new blade geometry aimed at mitigating the identified issues and eliminating possible causes of failure. In this context, the actual stress concentration at the indentation was determined using the TCD with Line Method (LM). The results from the numerical simulations indicated that the new blade geometry significantly reduced stress concentration, resulting in a risk factor reduction of approximately four compared to the original blade design, even under non-optimal operating conditions. Overall, in conjunction with simple linear static FEA, the proposed numerical approach provided substantial support for designers, especially in fault analysis and when comparing different industrial solutions.
1. Introduction
In industrial engineering and materials science, the continued pursuit of improving the reliability and efficiency of machinery and components remains a central focus. This is particularly critical in scenarios where unexpected failures can abruptly disrupt or halt production processes. Understanding the root causes of these failures and proposing actionable solutions is paramount to preventing their recurrence.
In this context, the present study delves into the investigation of a recurrent fatigue failure that has plagued carton-cutting production lines. In particular, the failures that have affected the Carton Wrap (CW) cutting blade have consistently manifested in a specific location on the blade where there is a notch. These instances of failure, characterized by fractures originating at notches, present a matter of significant scientific and industrial interest.
If one indeed speaks in a general manner about fatigue testing of a component or entire structure, whether subjected to monotonic cyclic loads or random vibrations, different methodologies are currently employed for the fatigue assessment [1,2]. For instance, the modern unified mechanics theory is used to derive a constitutive model for fatigue life prediction using a three-dimensional computational model [3,4]. Other methodologies, while not a recent development but more industrially established, exploit the frequency domain to rapidly assess the damage caused by the fatigue phenomenon [5,6], even in cases of multiaxial loading [7,8].
To date, there is no universally recognized valid procedure for numerical evaluation through Finite Element Modelling (FEM) in the industrial design of components involving components with notches. Reliance on the designer’s expertise is common or on very complex nonlinear plastic analysis. This is due to the well-known limitations of finite element simulation and numerical solutions in accurately resolving stress states at notch apexes, especially when ductile materials are involved. Consequently, scientific literature has introduced various methodologies to address this issue [9]. Many of these methods were initially developed for assessing notches in brittle materials but have evolved to become general techniques for evaluating the structural weakening caused by notches also for ductile materials. These methodologies include criteria based on different approaches: the material’s deformation energy storage capacity [10,11,12]. This approach relies on evaluating the intrinsic characteristics of materials, measuring their ability to store energy during the deformation process to predict potential fracture [13,14]. The cohesive zone technique [15,16,17,18,19] involves analyzing the region near the fracture, focusing on assessing the cohesion between material surfaces. This approach provides a detailed understanding of interactions between fracture surfaces and aids in predicting fracture propagation. The foundational principles of fracture mechanics [20,21] are also used as a prediction methodology. This approach is based on analyzing the mechanical characteristics of the material, focusing on properties that influence fracture propagation. Employing principles of fracture mechanics provides a robust theoretical framework for understanding material behavior under fracture conditions and methods based on the Theory of Critical Distance (TCD) [22,23,24]. These methodologies are based on the principle that assessing the stress state at the notch is possible by considering a certain distance from its apex [25,26], specifically defined as the critical distance [27,28,29,30,31].
Some of these methodologies can be complex to implement and may not fit well with the stringent time constraints of the industrial context. However, others, such as the TCD, have demonstrated their effectiveness in quickly analyzing notch-related static stress states and fatigue behavior through simple linear elastic finite element simulations, even for highly ductile materials [32,33]. These methodologies rely on defining a length parameter related to notch geometry and material-specific parameters, facilitating straightforward determination of effective stress at the notch, which can be directly compared to material strength characteristics.
In conclusion, looking at the industrial landscape, we can assert that there is an extreme lack of capability for assessing the stress state in notched components. Outdated methodologies, leading to overestimated results, are still being used today due to the absence of validated and applicable alternatives. On the other hand, the scientific community proposes numerous criteria based on different concepts, some of which would align well with the actual industrial needs if their applicability were demonstrated. In response to these challenges, our study embarks on a multifaceted investigation with two primary objectives. Firstly, it aims to assess the possible causes of CW blade failures through fracture surface analysis and by applying the TCD with Line Method (LM), leveraging linear elastic static numerical simulations. Secondly, the study seeks to propose a novel blade geometry designed to mitigate the identified issues and eliminate potential failure causes. We aimed to reduce stress concentrations at critical notches by focusing on blade redesign. This contribution has the potential to enhance the operational reliability of the CW blade, leading to cost savings and improved efficiency for the company, but it also defines a procedure to be used by designers in the design phase.
2. Case Study: Technical Failure Analysis
Packaging machines are used to encase objects of varying sizes and weights. Each box is created within the machine production line and tailored to the specific product to be packaged, starting from a paperboard sheet that is appropriately cut and shaped to give it a three-dimensional form. During the cutting phase, certain grooves are excavated on the paperboard. Figure 1 illustrates the placement of the following elements—marked between brackets ()—within the rotor. A pair of rapidly rotating blades (1), impacting the sheet’s surface at high speed, are capable of slicing the material without causing local deformations or damage to the cut edges. The cutting system can be described as a rotor, where the rotating blades are connected to the drive shaft (2), and an electric motor (3) drives the rotation. A gear reducer (4) links both shafts, and an elastic joint (5) is positioned between the electric motor and the gear reducer.
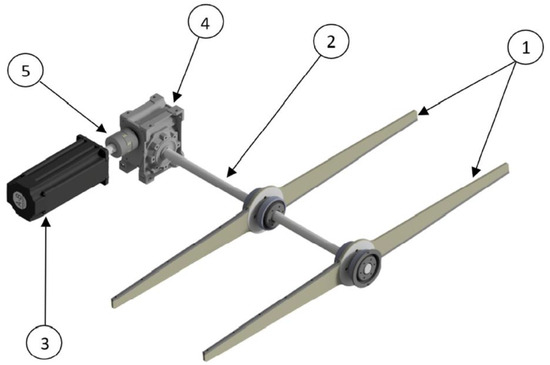
Figure 1.
Key components of the die-cutting system.
Incidents of failure occurred during the operational lifespan of the blades, resulting in significant delays in shipments for machine maintenance. Nevertheless, upon comparing the number of broken blades (only two instances occurred after approximately eight million operational cycles) to the number of intact and still operational blades (360), it is conceivable that non-standard breakage conditions may have contributed to these failures. Figure 2 displays the real image of the rolling blade under investigation, visualizing its key dimensions. Watching the blade in Figure 2 through a microscope, it is possible to confirm that what appears to be a perfectly sharp notch possesses instead a small fillet radius due to the tool path during the blade manufacturing process. Therefore, a 0.2 mm radius will be used instead of an ideal sharp edge in subsequent analyses. A larger radius fitting on the notch would not allow the installation of a sufficiently long cutting edge, visible in Figure 2, reducing the maximum depth of the grooves made on the cardboard and making the production of larger boxes impossible.
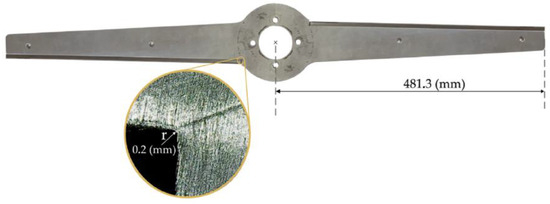
Figure 2.
A real model of the rolling blade under investigation with a detail of fillet radius.
2.1. Material Characterization
The cutting system blades are made of Al7075-T6 alloy, and in order to identify the failure causes, the following material and fracture analysis were carried out: (i) microstructural analysis in cross-section close to the fracture, (ii) fracture surface analysis, and (iii) semi-quantitative chemical analysis on the fracture surface and on the cross-section.
The microstructure was examined through optical microscopy (OM—Eclipse LV150 NL, Nikon, Tokyo, Japan) with the aim of identifying possible microstructural defects present in the material. After mechanical polishing and etching, the observations were carried out using Keller reagent for 20 s. The fracture surface analysis was conducted using a stereo-microscope (Nikon SMZ745T) and a Field-Emission Scanning Electron Microscope (FE-SEM—Zeiss, Gemini Supra 25, Jena, Germany) to determine the nature of the fracture phenomena. The chemical analysis was carried out in selected areas using the FE-SEM with an Energy-Dispersive X-ray Spectroscopy (EDS) probe.
The following description was useful in defining the real cause of component failure.
In Figure 3, the fracture surface extracted from the component after failure is reported.
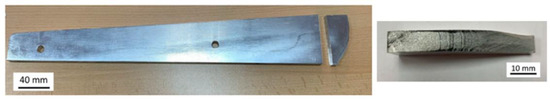
Figure 3.
Detail of the extraction of the fracture surface of the cutting system blade.
Therefore, from the complete analysis of the cutting system blades, it emerged that there is a trigger of fracture on the specular part of the component. In Figure 4, it is evident that in the non-fractured portion of the cutting system, there is a crack (a and b) starting from the cutting notch.
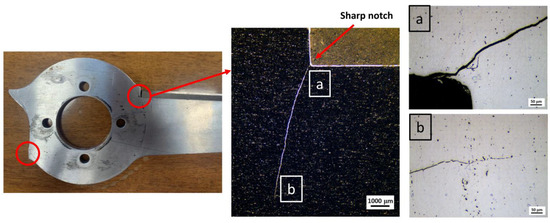
Figure 4.
Detail of the sharp notch with evidence of a crack.
From the fracture surface analysis shown in Figure 5, a mix of morphologies distinguishable in 3 different zones is evident, indicated as zone A (starting from the sharp notch of the component), zone B (central zone), and zone C.
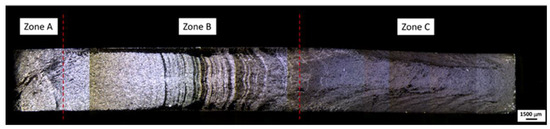
Figure 5.
Micrographic analysis of the fracture surface through the stereo-microscope.
From the high magnification micrographic analysis, it emerged that for zone A (Figure 6), the surface is smooth and deformation-free. Beach lines are clearly evident in the central area (Zone B in Figure 7) and for more than half of the fractured surface. Finally, the third zone (zone C in Figure 8) presents a typical morphology of a fracture due to plastic deformation (dimples) on a plane inclined at approximately 45° compared to the rest of the fracture (Figure 9). This morphology is typical of a fracture due to fatigue stress. The fracture trigger section is Zone A, in which the smooth appearance of the surface is attributable to the repeated impacts due to the alternation of traction-compression stresses during the operation of the component. The fracture has propagated to the right (see directionality of the beach lines in Figure 7), and Zone C corresponds to the portion in which the resistant section is insufficient, and the component breaks under the action of static stress, as expected from a fatigue failure.
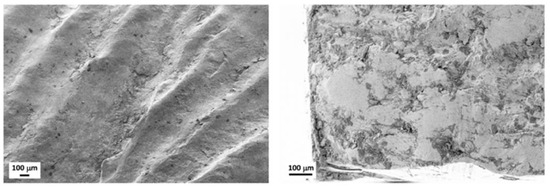
Figure 6.
SEM analysis of zone A referred to in Figure 5.
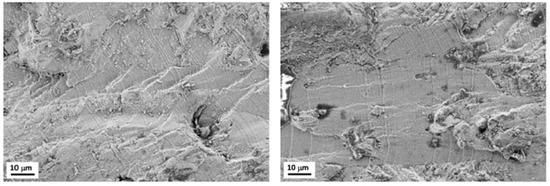
Figure 7.
SEM analysis of zone B referred to in Figure 5.
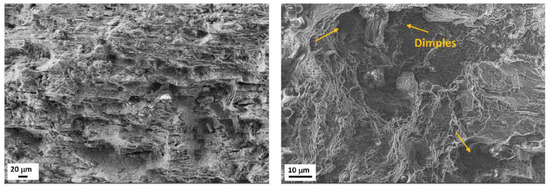
Figure 8.
SEM analysis of zone C referred to in Figure 5.
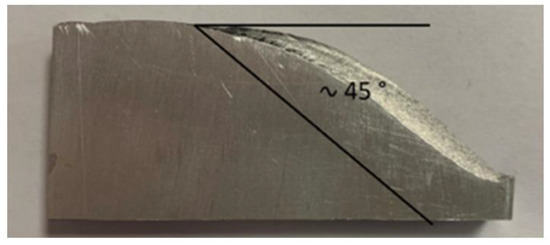
Figure 9.
Evidence of the final fracture in zone C which occurred on a plane at 45° with respect to the plane of propagation of the fracture.
Before etching specimens were analyzed using OM for an inclusion state check, the analysis revealed no critical issues in terms of non-metallic inclusion. Following that, specimens were etched, and the micrographic and EDS analysis conducted in cross-section on a sample extracted near the fracture are reported respectively in Figure 10 and Figure 11. The microstructure turned out to be homogeneous and compliant with a tempered Al7075 alloy [34,35,36,37], with Zn, Cu, and Mg precipitates homogeneously dispersed. In addition, segregation bands were not revealed.
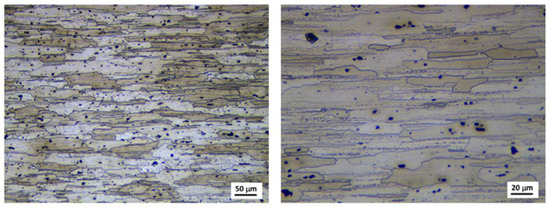
Figure 10.
OM micrographic analysis of a cross-section near the fracture.
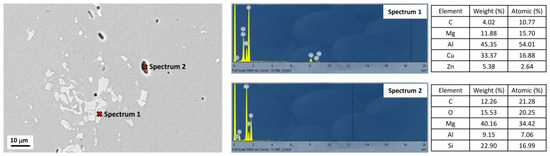
Figure 11.
EDS analysis of a cross-section near the fracture.
Finally, from the EDS analysis conducted on the fracture surface (Figure 12), only the presence of Al oxides attributable to the operation of the component emerged, with growth on the surface due to the propagation of the fracture.
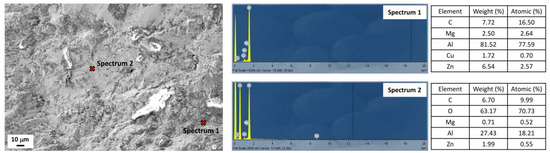
Figure 12.
EDS analysis on the fracture surface.
Hence, based on the conducted analysis, it is possible to conclude that the cause of the component failure was fatigue-induced, pinpointing a triggering locus within the notch region.
2.2. Mechanical Characteristics
The mechanical and physical properties obtained from the literature [38,39,40,41,42], which are useful for the description of the material and for the investigations reported in the following paragraphs, are shown in Table 1.

Table 1.
Physical and mechanical properties of Al7075-T6 [38,39,40,41,42].
3. Analysis of Operational Loads and Constraints
The uncertainty surrounding the force exerted by the blade upon impacting the paperboard has posed a significant challenge in accurately determining the true stress value on the component. By referring to the motor’s datasheet, it is possible to confirm that the rated torque, the maximum that can be sustained continuously, amounts to 13.38 Nm. This value can serve as the upper limit for our analysis. It is important to note that, in normal conditions, the motor’s torque is distributed between two blades simultaneously engaged in cutting the paperboard. Therefore, it is necessary to halve the aforementioned value to calculate the torque applied to an individual blade. However, any backlash and misalignments in the assembly can lead to brief moments where only one blade encounters the paperboard, causing the entire load to concentrate on it. For this reason, thinking in a safe manner, rated torque was not halved in order to consider this possible critical situation.
A more realistic torque value was obtained through an experimental campaign on the CW. Figure 13 presents the torque curve over time during the cutting test. In the initial segment of the same figure, the curve shows the torque generated by the motor while the blades rotate at a constant speed. As we can see, approximately 10% of the rated torque is necessary to overcome system friction. However, as the blades engage with the paperboard, the torque rapidly escalates to approximately 100% of the rated torque. Therefore, the torque jump, visible in Figure 13, which amounts to 12 Nm, can be considered as that value used by the motor to cut the paperboard (about 90% of the rated torque). The highest peak in Figure 13 has been excluded from consideration because its origin is attributed to the combined impact of two rapid instances involving the blade and cardboard. As discussed earlier, this value is halved to calculate the load for a single blade. Consequently, the torque value for a single blade is established at 6 Nm. We denoted this load condition as the “experimental torque.” It is essential to emphasize that this result may vary depending on the type of paperboard used for testing. Nevertheless, these values can be regarded as beneficial for quantitatively assessing loads resembling the operational conditions of the system. To determine the torques at the blades, all the defined values must be multiplied by the transmission ratio, τ = 10. The outcomes are presented in Table 2.
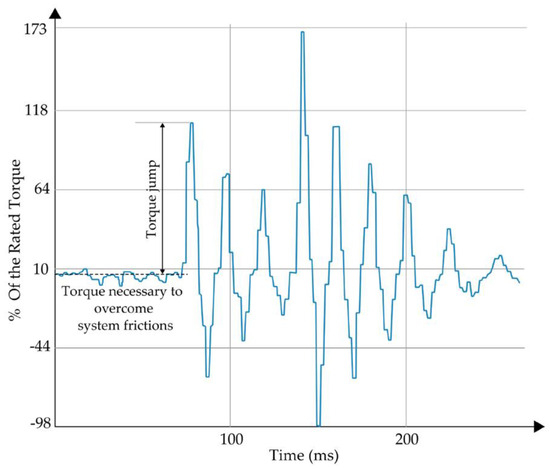
Figure 13.
Measure of the experimental load on the blade.
Table 2.
Load cases definition.
The blade torques mentioned above can be regarded as impact forces conveniently applied to the tip, and their calculation can be easily performed using the geometric measurement of the arm presented in Figure 2. As a result, the arm of the force was defined as the distance between the tip and the center of gravity of the four bolts used to constrain the blade. Figure 2 illustrates the holes excavated on the blade to allocate bolts and establish the connection with the rolling shaft. In the subsequent sections, detailed information on the force modules applied will be provided in the tables. With a comprehensive understanding of the element’s geometry, the applied forces, and the nature of constraints, it becomes possible to construct a blade model in order to investigate the root causes of faults.
4. Theoretical Background
As can be inferred from Section 2, which describes the geometry under examination, before applying the Finite Element Analysis (FEA) methodology, it is necessary to present the theoretical concepts used to determine the actual stress state in the presence of a notch. It is well known that evaluating the actual stress state in the presence of a notch is analytically challenging. The result obtained from a simple linear-elastic, static, or dynamic analysis performed using finite element software typically does not accurately represent the real stress state at the apex of the notch. For this reason, scientific literature offers various methodologies that, based on energetic and/or punctual geometric concepts, precisely define the stress state of a notched component under static or dynamic loading. In this calculation report, the TCD will be employed, specifically its LM applicative, described in detail below.
4.1. Theory of Critical Distance (TCD)
The origin of TCD can be attributed to the works of Neuber and Peterson [28,29]. In general terms, TCD states that the failure of a notched component can be avoided as long as the effective stress (calculated based on material-specific parameters) remains below an intrinsic strength value (stress related to the applied loading and the material itself), as stated in Equation (1).
In other words, the entire linear-elastic stress field around the notch apex is represented by an appropriate effective stress , while the material strength is represented by a suitably designed stress value based on the type of loading or material in use.
The effective stress can be calculated using various methodologies [31], all of which involve a length parameter known as the critical distance .
In the case of fatigue fracture, the critical distance can be calculated as:
where represents the threshold value of the stress intensity factor and coincides with the fatigue limit full stress range of the material In this scenario, the application of TCD does not require any calibration.
The TCD method can be formalized using different methodologies [30], one of which is the LM, widely employed in the industrial context due to its applicative simplicity and accuracy. This methodology suggests that the effective stress is evaluated as the average stress over a length of along the bisector of the notch, as described by Equation (3) based on Figure 14.
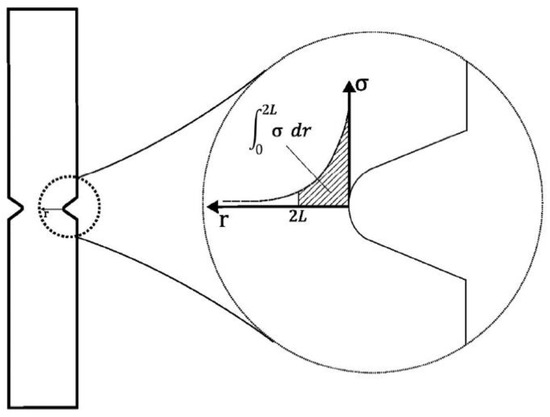
Figure 14.
Stress-distance curve from the notch apex and definition of the LM.
In the present real case, the methodology described will be developed with the support of FEA, which allows the replication of the loading conditions and the evaluation of stress distribution around the studied notch. The choice of the stress parameter to consider primarily depends on the type of loading, and in our case, we will refer to the maximum principal stress as a state of plane stress that has been observed.
As mentioned earlier, regardless of the chosen TCD method to apply, an accurate prediction relies on the proper definition of the and parameters, which should ideally be derived from dedicated experimental tests. The parameters, obtained as much as possible from scientific literature and presented in detail in Section 2.2, will be subsequently used for the theoretical application in the specific case of interest presented in the next section.
4.2. Theory Application in the Current Real Case: Definition of the Critical Distance for Fatigue Assessment
For the case analyzed in this report, the definition of in Equation (2) is straightforward. It is possible to easily determine the values of and , based on the parameter definitions provided in Section 2.2 and consequently the values of and . These values will be useful to mediate the stress distribution along the notch bisector evaluated using FEA, applying the LM methodology expressed in Equation (3).
5. Finite Element Analysis
The company provided the CAD model of the cutting blade, and it has been imported into the Ansys 2023–R2 workbench software for analysis. Given the blade’s symmetric shape, only one side of the geometry has been imported into the software. It is important to note that, in order to preserve all the bolt holes, the section line does not align with the symmetrical axis of the component. Furthermore, some lines have been projected onto the surface to define the force application point and establish the notch’s stress control path, which is 0.8 mm long, see Figure 15. The model was completed by inserting translational constraints to fix each bolt hole, simulating the bolts’ behavior. Using a Cerig command, a rigid region is delineated around each bolt hole by generating constraint equations to correlate nodes on the internal surface of each hole. These slave nodes are rigidly connected to the central master node, which, as specified, is prohibited from translating. Given the blade’s flat shape, the use of shell elements during the meshing phase is recommended to provide high result accuracy with low computational cost. Shell 181 element, used in this paper, is suitable for analyzing thin to moderately thick shell structures; it is a well-known four-node element with six degrees of freedom at each node. Three types of mesh sizing were employed [43]: a coarse mesh for discretizing the largest part of the surface and two additional refinement levels applied to enhance result precision around the notch, as shown in Figure 15a,b. Both presented load cases were considered, as indicated in Table 2. It should be noted that the stress values along the control path in the subsequent images are referenced, for simplicity, to the rated case. Figure 16 illustrates the distribution of maximum stress around the notch in a plane stress state hypothesis. Consequently, the maximum principal stress is evaluated along the control path, where 202 nodes are located, using a static structural linear elastic solution. Notably, from Figure 16, it is possible to underline that stress increases as the node approaches the apex of the notch. As previously explained, mathematical equations underlying the FEA linear elastic solution for notches or defects overestimated the stress values at the notch’s apex, particularly for non-rounded notches [44]. These findings are subject to the influence of the mesh size employed. Therefore, it is imperative to evaluate the dispersion of the results when the mesh surrounding the control path undergoes variations. The stress pattern along the bisector of the notch, denoted as σ(r), exhibits variations as the mesh size is modified, and the attainment of result convergence is realized with a 0.01 mm element size (as employed in our simulations), which strikes a suitable balance between result precision and computational resource utilization [43].
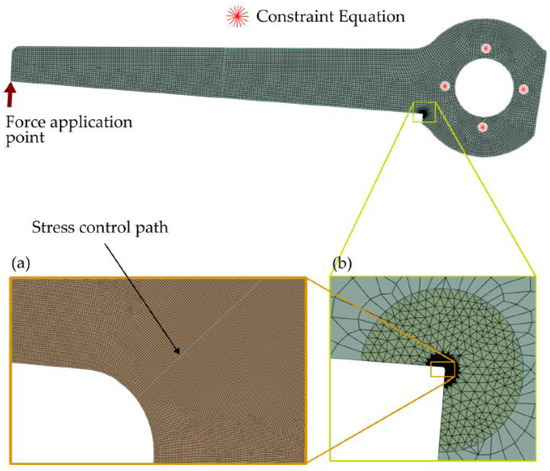
Figure 15.
Locations of constraints and forces in the blade model. Detail of the stress control path (a) and the mesh sizes around the notch (b).
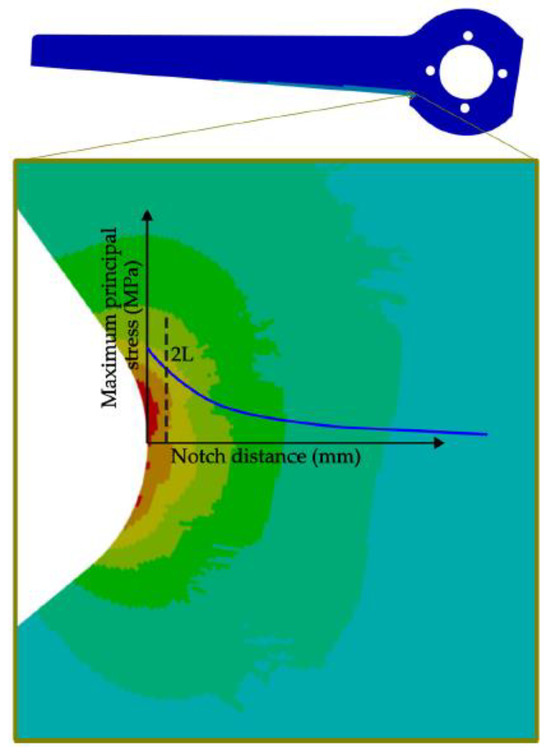
Figure 16.
Maximum principal stress shape on notch and definition of the amplitude of the effective stress according to the Line Method.
Table 3 reports the effective maximum stress σeff_LM calculated through Equation (3) using LM for both cases of load.
Table 3.
Maximum principal stress on notch according to LM in each load case.
From the material data reported in Table 1, the maximum stress value for the fatigue strength limit depends on the typology of the load applied. Its value is 159 MPa for R = −1 and 229 MPa for R = 0; these values conventionally guarantee 5 × 10⁶ load cycles before the fatigue break [38]. Since it is not possible to define with certainty the type of load applied to the blade, it is necessary to carry out a combined comparison of the two fatigue limits (R = 0 and R = −1) with the corresponding σeff_LM derived from the maximum principal stress analysis. Thus, the following results reported in Table 4 can be highlighted.
Table 4.
Fatigue resistance of the rolling blade under different load conditions.
Based on the previous considerations shown in Table 4, it can be concluded that the rolling blade is not susceptible to fatigue failure, which explains why the majority of them did not break. It is evident, therefore, that under standard operating conditions, the blade does not experience failure. The root cause of the breakage remains unidentified. Therefore, further investigation is required to identify any potential phenomena that may alter the loads or constraint conditions.
6. Possible Cause of Failure
The connection of the blade system to the shaft is supported by four bolts, as shown in Figure 17. In order to investigate a possible cause of blade breakage attributable to incorrect loading of the component, the conformation of each bolt hole was studied. Figure 17 shows in detail the images of the four holes from which it is clear that the holes called 1, 2, and 3 present an oval shape with evident plastic deformation in the vertical or horizontal direction (see the white arrows). Hole 4 presents a little plastic deformation localized on the entire perimeter and does not present any geometric alteration. Therefore, the evident ovalization and plastic deformation along the perimeter of holes 1, 2, and 3 is indicative of a possible misalignment of the coupling attributable to an incorrect grip of the bolts on the component. The hypothesis that the component was coupled only by bolt 4 is therefore relevant, thus resulting in an incorrect distribution of loads.
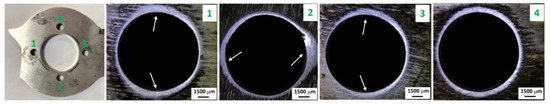
Figure 17.
Detail of the bolt holes.
6.1. Finite Element Analysis in the Hypothesised Constrain Condition
In this paragraph, an unconventional working condition was investigated. Maintaining the same load cases as presented in Table 2 and utilizing the identical mesh size depicted in Figure 18, modifications are introduced to the number of holes where translational constraints are applied. This adjustment allows the emulation of a specific scenario in which one or more bolts are unscrewed, enabling assessing the resulting stress changes along the control path. It is worth noting that the control path referred to in the subsequent analysis pertains to the force application for the rated case, though the same procedure is equally applicable to the other load case (the results are reported for both conditions). The FEA of the rolling blade, considering observations made regarding bolt holes, is suitably adjusted. With reference to Figure 15, illustrating the use of four bolts to connect the blade to the rolling shaft, constraint equations are now applied exclusively to hole 4. However, it is crucial to recognize that merely restraining the translational movements of a single bolt does not guarantee the complete stabilization of the model. Consequently, an additional constraint is necessary to fix rotations. Because the rolling blade retains the capability to rotate about the bolt axis, a node constraint between the shaft surface and the blade central hole is used to achieve equilibrium, as illustrated in Figure 18.
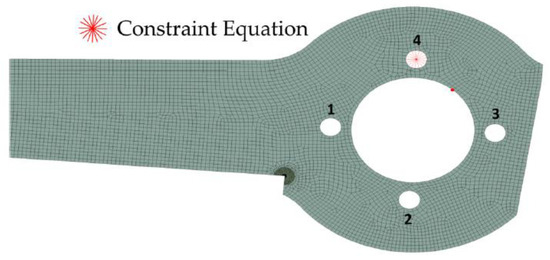
Figure 18.
Modified constraint conditions to emulate a single socket of hole number 4.
6.2. Results and Discussions
Table 5 shows that stress significantly escalates in the stress control path for both load cases when only one bolt is fastened.
Table 5.
Maximum principal stress on notch for a single bolt fastened according to LM.
In the experimental load case, the stress on the notch increases, decreasing safety margins, without, however, reaching the fatigue limit (159 MPa for R = −1 or 229 MPa for R = 0). However, this load condition does not appear to be more plausible; in fact, due to the misalignments induced by unscrewing the bolts, applying the torque to a single blade will be more plausible.
If we consider, therefore, the rated load condition case (highlighted in red in Table 5), the fatigue stress limit was exceeded under the hypothesis of fully reversed load condition (R = −1), and it dangerously approaches the fatigue limit for (R = 0).
In conclusion, it can be affirmed that the examined constraint condition can reasonably induce fatigue failure in the rolling blade.
7. New Proposed Geometry
The conventional approach used to alleviate stress on the notch involves replacing the sharp edge with a rounded one. To maximize stress reduction on the notch, the maximum possible radius is employed, minimizing connection issues between the rolling blade and the cutting edge and minimizing the size reduction of the produced boxes as much as possible. For these reasons, the proposed geometric model implements a 10 mm radius for the notch under investigation, see Figure 19. As a result of this modification, an increased area exposed to high-stress values due to the presence of a larger notch is obtained; however, as a beneficial effect, the magnitude of the maximum stress should be reduced.
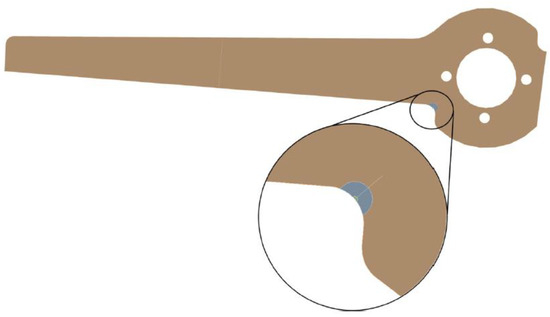
Figure 19.
New blade geometry proposed.
7.1. New Geometry Analysis
The new geometry is analyzed using the same loads as analyzed in paragraph 3 and incorporating the constraints described in paragraph 6. The mesh is generated in a manner similar to the one proposed previously, with the objective of enabling an accurate comparison of the model’s results.
The size of the mesh along the stress control path has been refined; even in this case, the result’s stability is verified by varying the mesh size around the notch. Also, this analysis confirms the good accuracy of the results using 0.01 mm elements.
Table 6 demonstrates that in no instance does fatigue failure occur in the proposed geometry. Indeed, the fatigue limit is not reached under each of the assessed load and constraint conditions. Furthermore, when examining the values of σeff_LM for the new geometry, a substantial safety margin against fatigue failure is achieved.
Table 6.
Maximum principal stress on the modified geometry notch according to LM.
7.2. Comparison of the Obtained Results
Both the stress distributions along the path, with reference to the sharp notch and the rounded one, can be visually compared when the force of the rated case is applied to the rolling blade, as depicted in Figure 20.
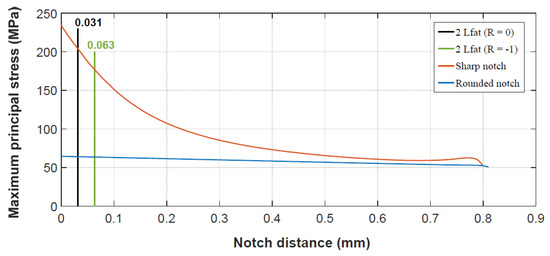
Figure 20.
Stress distributions along the path with reference to the sharp and rounded notch. According to Equation (2), 2 represents the double value of the critical length of the TCD method for the cases R = 0 and R = −1.
Based on Figure 20, a substantial decrease in stress levels around the notch is evident. This effect becomes more pronounced when observing the stress differential in proximity to the notch apex in relation to the proposed blade geometry. The black vertical line, as well as the green line, establishes the boundary with which the effective maximum stress σeff_LM (MPa) was computed. In fact, all node stresses located on the left side of the corresponding line must be used as per Equation (3). A stress reduction factor can be calculated from the ratio of the effective maximum stresses of the two cases reported. This factor serves as a valuable parameter for assessing how much the new blade geometry can abate stress on the notch. Table 7 summarizes the effective maximum stresses calculated using LM for various load and constraint conditions.
Table 7.
Fatigue behavior of the rolling blade under different load conditions.
8. Conclusions
This study comprehensively analyzed factors contributing to the failure of some paperboard cutting blades. Metallographic investigation revealed that fatigue load conditions caused the breakage. Only through the implementation of TCD via FEA was it possible to identify the potential failure causes, with bolt loosening identified as a triggering factor.
Additionally, a geometric modification involving a rounded notch design was analyzed thanks to the proposed method. Numerical simulations employing the TCD Line method significantly reduced the stress concentration compared to the sharp-notch design.
The potential of the methodology proposed lies in being able to quantify this reduction. The rounded notch design exhibited a maximum reduction factor of around 3, enhancing the overall blade resistance without compromising operational performance.
In conclusion, this real case study aims to fill the literature gap by demonstrating the method’s validity on real case studies and emphasizing the potential for industrial designers and scientific researchers to utilize numerical methodologies like the TCD method for predicting fatigue failure in notched components.
Author Contributions
Conceptualization, G.M., L.L. and L.B.; Formal analysis, G.M., L.L. and L.B.; Investigation, G.M., L.L., L.B. and G.S.; Methodology, G.M.; Software, L.B.; Validation, G.M., L.B. and G.S.; Visuali-zation, G.F.; Writing—original draft, G.M., L.B. and G.S.; Writing—review & editing, G.M., L.L., L.B., G.S., G.F., A.D.S., F.C. and C.B.; Supervision, L.L., A.D.S., F.C. and C.B. All authors have read and agreed to the published version of the manuscript.
Funding
This research received no external funding.
Institutional Review Board Statement
Not applicable.
Informed Consent Statement
Not applicable.
Data Availability Statement
The data presented in this study are available on request from the corresponding author due to restrictions.
Conflicts of Interest
Author Gianluca Foffi was employed by the company C.M.C. S.p.A. The remaining authors declare that the research was conducted in the absence of any commercial or financial relationships that could be construed as a potential conflict of interest.
References
- Lee, H.W.; Basaran, C. A Review of Damage, Void Evolution, and Fatigue Life Prediction Models. Metals 2021, 11, 609. [Google Scholar] [CrossRef]
- Lee, H.W.; Basaran, C. Predicting High Cycle Fatigue Life with Unified Mechanics Theory. Mech. Mater. 2022, 164, 104116. [Google Scholar] [CrossRef]
- Basaran, C. Introduction to Unified Mechanics Theory with Applications; Springer International Publishing: Cham, Germany, 2021; ISBN 978-3-030-57771-1. [Google Scholar]
- Canale, G.; Lepore, M.; Bagherifard, S.; Guagliano, M.; Maligno, A. An Experimental Validation of Unified Mechanics Theory for Predicting Stainless Steel Low and High Cycle Fatigue Damage Initiation. Forces Mech. 2023, 10, 100162. [Google Scholar] [CrossRef]
- Lee, H.W.; Djukic, M.B.; Basaran, C. Modeling Fatigue Life and Hydrogen Embrittlement of Bcc Steel with Unified Mechanics Theory. Int. J. Hydrog. Energy 2023, 48, 20773–20803. [Google Scholar] [CrossRef]
- Lee, H.W.; Basaran, C.; Egner, H.; Lipski, A.; Piotrowski, M.; Mroziński, S.; Bin Jamal, M.N.; Lakshmana Rao, C. Modeling Ultrasonic Vibration Fatigue with Unified Mechanics Theory. Int. J. Solids Struct. 2022, 236–237, 111313. [Google Scholar] [CrossRef]
- Morettini, G.; Braccesi, C.; Cianetti, F.; Razavi, N.; Solberg, K.; Capponi, L. Collection of Experimental Data for Multiaxial Fatigue Criteria Verification. Fatigue Fract. Eng. Mater. Struct. 2020, 43, 162–174. [Google Scholar] [CrossRef]
- Braccesi, C.; Morettini, G.; Cianetti, F.; Palmieri, M. Development of a New Simple Energy Method for Life Prediction in Multiaxial Fatigue. Int. J. Fatigue 2018, 112, 1–8. [Google Scholar] [CrossRef]
- Berto, F.; Lazzarin, P. Recent Developments in Brittle and Quasi-Brittle Failure Assessment of Engineering Materials by Means of Local Approaches. Mater. Sci. Eng. R Rep. 2014, 75, 1–48. [Google Scholar] [CrossRef]
- Foti, P.; Razavi, N.; Berto, F. Fracture Assessment of U-Notched PMMA under Mixed Mode I/II Loading Conditions by Means of Local Approaches. Procedia Struct. Integr. 2021, 33, 482–490. [Google Scholar] [CrossRef]
- Sánchez, M.; Cicero, S.; Arrieta, S.; Torabi, A.R. Fracture Load Prediction of Non-Linear Structural Steels through Calibration of the ASED Criterion. Metals 2023, 13, 1211. [Google Scholar] [CrossRef]
- Milone, A.; Foti, P.; Filippi, S.; Landolfo, R.; Berto, F. Evaluation of the Influence of Mean Stress on the Fatigue Behavior of Notched and Smooth Medium Carbon Steel Components through an Energetic Local Approach. Fatigue Fract. Eng. Mater. Struct. 2023, 46, 4315–4332. [Google Scholar] [CrossRef]
- Foti, P.; Razavi, N.; Marsavina, L.; Berto, F. Volume Free Strain Energy Density Method for Applications to Blunt V-Notches. Procedia Struct. Integr. 2020, 28, 734–742. [Google Scholar] [CrossRef]
- Ding, K.; Yang, Y.; Wang, Z.; Zhang, T.; Guo, W. Relationship between Local Strain Energy Density and Fatigue Life of Riveted Al-Li Alloy Plate. Theor. Appl. Fract. Mech. 2023, 125, 103672. [Google Scholar] [CrossRef]
- Dugdale, D.S. Yielding of Steel Sheets Containing Slits. J. Mech. Phys. Solids 1960, 8, 100–104. [Google Scholar] [CrossRef]
- Barenblatt, G.I. The Formation of Equilibrium Cracks during Brittle Fracture. General Ideas and Hypotheses. Axially-Symmetric Cracks. J. Appl. Math. Mech. 1959, 23, 622–636. [Google Scholar] [CrossRef]
- Hillerborg, A.; Modéer, M.; Petersson, P.-E. Analysis of Crack Formation and Crack Growth in Concrete by Means of Fracture Mechanics and Finite Elements. Cem. Concr Res. 1976, 6, 773–781. [Google Scholar] [CrossRef]
- Gómez, F.J.; Elices, M.; Valiente, A. Cracking in PMMA Containing U-shaped Notches. Fatigue Fract. Eng. Mater. Struct. 2000, 23, 795–803. [Google Scholar] [CrossRef]
- Jahanshahi, S.; Chakherlou, T.N.; Rostampoureh, A.; Aalami, M.R. Evaluating the Validity of the Cohesive Zone Model in Mixed Mode I + III Fracture of Al-Alloy 2024-T3 Adhesive Joints Using DBM-DCB Tests. Int. J. Fract. 2023, 240, 143–165. [Google Scholar] [CrossRef]
- Ritchie, R.O.; Knott, J.F.; Rice, J.R. On the Relationship between Critical Tensile Stress and Fracture Toughness in Mild Steel. J. Mech. Phys. Solids 1973, 21, 395–410. [Google Scholar] [CrossRef]
- Liu, Y.; Mahadevan, S. Threshold Stress Intensity Factor and Crack Growth Rate Prediction under Mixed-Mode Loading. Eng. Fract. Mech. 2007, 74, 332–345. [Google Scholar] [CrossRef]
- Taylor, D. The Theory of Critical Distances: A New Perspective in Fracture Mechanics; Elsevier: Amsterdam, The Netherlands; Boston, MA, USA, 2007. [Google Scholar]
- Susmel, L.; Taylor, D. On the Use of the Theory of Critical Distances to Predict Static Failures in Ductile Metallic Materials Containing Different Geometrical Features. Eng. Fract. Mech. 2008, 75, 4410–4421. [Google Scholar] [CrossRef]
- Susmel, L.; Taylor, D. The Theory of Critical Distances to Predict Static Strength of Notched Brittle Components Subjected to Mixed-Mode Loading. Eng. Fract. Mech. 2008, 75, 534–550. [Google Scholar] [CrossRef]
- Taylor, D.; Merlo, M.; Pegley, R.; Cavatorta, M.P. The Effect of Stress Concentrations on the Fracture Strength of Polymethylmethacrylate. Mater. Sci. Eng. A 2004, 382, 288–294. [Google Scholar] [CrossRef]
- Cicero, S.; Arroyo, B.; Álvarez, J.A.; González, P.; Flores, L.A. Development of a Theory of Critical Distances Based Methodology for Environmentally Assisted Cracking Analyses. In Advances in Accelerated Testing and Predictive Methods in Creep, Fatigue, and Environmental Cracking; ASTM International: West Conshohocken, PA, USA, 2023; pp. 277–299. [Google Scholar]
- Madrazo, V.; Cicero, S.; Carrascal, I.A. On the Point Method and the Line Method Notch Effect Predictions in Al7075-T651. Eng. Fract. Mech. 2012, 79, 363–379. [Google Scholar] [CrossRef]
- Neuber, H. Theory of Notch Stresses: Principles for Exact Calculation of Strength with Reference to Structural Form and Material, 2nd ed.; Springer: Berlin/Heidelberg, Germany, 1958; Volume 292. [Google Scholar]
- Peterson, R.E. Notch-Sensitivity. In Metal Fatigue; Sines, G., Waisman, J.L., Eds.; McGraw Hill: New York, NY, USA, 1959; Volume 12, pp. 293–306. [Google Scholar]
- Taylor, D. The Theory of Critical Distances. Eng. Fract. Mech. 2008, 75, 1696–1705. [Google Scholar] [CrossRef]
- Taylor, D. Geometrical Effects in Fatigue: A Unifying Theoretical Model. Int. J. Fatigue 1999, 21, 413–420. [Google Scholar] [CrossRef]
- Kinloch, A.J.; Shaw, S.J.; Hunston, D.L. Crack Propagation in Rubber-Toughened Epoxy. In Proceedings of the International Conference on Yield, Deformation and Fracture, Buffalo, NY, USA, 29 March–1 April 1982; Cambridge Plastics and Rubber Institute: London, UK, 1982; pp. 1–6. [Google Scholar]
- Morettini, G.; Razavi, S.M.J.; Staffa, A.; Palmieri, M.; Berto, F.; Cianetti, F.; Braccesi, C. On the Combined Use of Averaged Strain Energy Density Criteria (ASED) and Equivalent Material Concept (ECC) for the Fracture Load Prediction of Additively Manufactured PLA v-Notched Specimens. Procedia Struct. Integr. 2023, 47, 296–309. [Google Scholar] [CrossRef]
- Li, G.; Jadhav, S.D.; Martín, A.; Montero-Sistiaga, M.L.; Soete, J.; Sebastian, M.S.; Cepeda-Jiménez, C.M.; Vanmeensel, K. Investigation of Solidification and Precipitation Behavior of Si-Modified 7075 Aluminum Alloy Fabricated by Laser-Based Powder Bed Fusion. Metall. Mater. Trans. A 2021, 52, 194–210. [Google Scholar] [CrossRef]
- Goswami, R.; Lynch, S.; Holroyd, N.J.H.; Knight, S.P.; Holtz, R.L. Evolution of Grain Boundary Precipitates in Al 7075 Upon Aging and Correlation with Stress Corrosion Cracking Behavior. Metall. Mater. Trans. A 2013, 44, 1268–1278. [Google Scholar] [CrossRef]
- Di Schino, A.; Montanari, R.; Testani, C.; Varone, A. Dislocation Breakaway Damping in AA7050 Alloy. Metals 2020, 10, 1682. [Google Scholar] [CrossRef]
- Angella, G.; Di Schino, A.; Donnini, R.; Richetta, M.; Testani, C.; Varone, A. AA7050 Al Alloy Hot-Forging Process for Improved Fracture Toughness Properties. Metals 2019, 9, 64. [Google Scholar] [CrossRef]
- Torabi, A.R.; Campagnolo, A.; Berto, F. Mixed Mode I/II Crack Initiation from U-Notches in Al 7075-T6 Thin Plates by Large-Scale Yielding Regime. Theor. Appl. Fract. Mech. 2016, 86, 284–291. [Google Scholar] [CrossRef]
- Tokaji, K.; Ogawa, T.; Kameyama, Y. The Effects of Stress Ratio on the Growth Behaviour of Small Fatigue Cracks in an Aluminium Alloy 7075-T6. Fatigue Fract. Eng. Mater. Struct. 1990, 13, 411–421. [Google Scholar] [CrossRef]
- Smith, C.R. S-N Characteristics of Notched Specimens; NASA: Washington, DC, USA, 1966. [Google Scholar]
- Akio, O.; Keiichiro, T.; Hidenobu, M. Fatigue Crack Initiation and Growth under Mixed Mode Loading in Aluminum Alloys 2017-T3 and 7075-T6. Eng. Fract. Mech. 1987, 28, 721–732. [Google Scholar]
- Santus, C.; Taylor, D.; Benedetti, M. Experimental Determination and Sensitivity Analysis of the Fatigue Critical Distance Obtained with Rounded V-Notched Specimens. Int. J. Fatigue 2018, 113, 113–125. [Google Scholar] [CrossRef]
- Foti, P.; Berto, F. Evaluation of the Effect of the TIG-Dressing Technique on Welded Joints through the Strain Energy Density Method. Procedia Struct. Integr. 2020, 25, 201–208. [Google Scholar] [CrossRef]
- Torabi, A.R.; Alaei, M. Mixed-Mode Ductile Failure Analysis of V-Notched Al 7075-T6 Thin Sheets. Eng. Fract. Mech. 2015, 150, 70–95. [Google Scholar] [CrossRef]
Disclaimer/Publisher’s Note: The statements, opinions and data contained in all publications are solely those of the individual author(s) and contributor(s) and not of MDPI and/or the editor(s). MDPI and/or the editor(s) disclaim responsibility for any injury to people or property resulting from any ideas, methods, instructions or products referred to in the content. |
© 2024 by the authors. Licensee MDPI, Basel, Switzerland. This article is an open access article distributed under the terms and conditions of the Creative Commons Attribution (CC BY) license (https://creativecommons.org/licenses/by/4.0/).