
Investigation on the Corrosion Resistance of 3003 Aluminum Alloy in Acidic Salt Spray under Different Processing States


Abstract
1. Introduction
2. Materials and Methods
2.1. Materials
2.2. Preparation of Homogenized and Hot Extruded 3003 Aluminum Alloy
2.3. Acid Salt Spray Test
2.4. Electrochemical Measurements
2.5. Microstructure Examination
3. Results
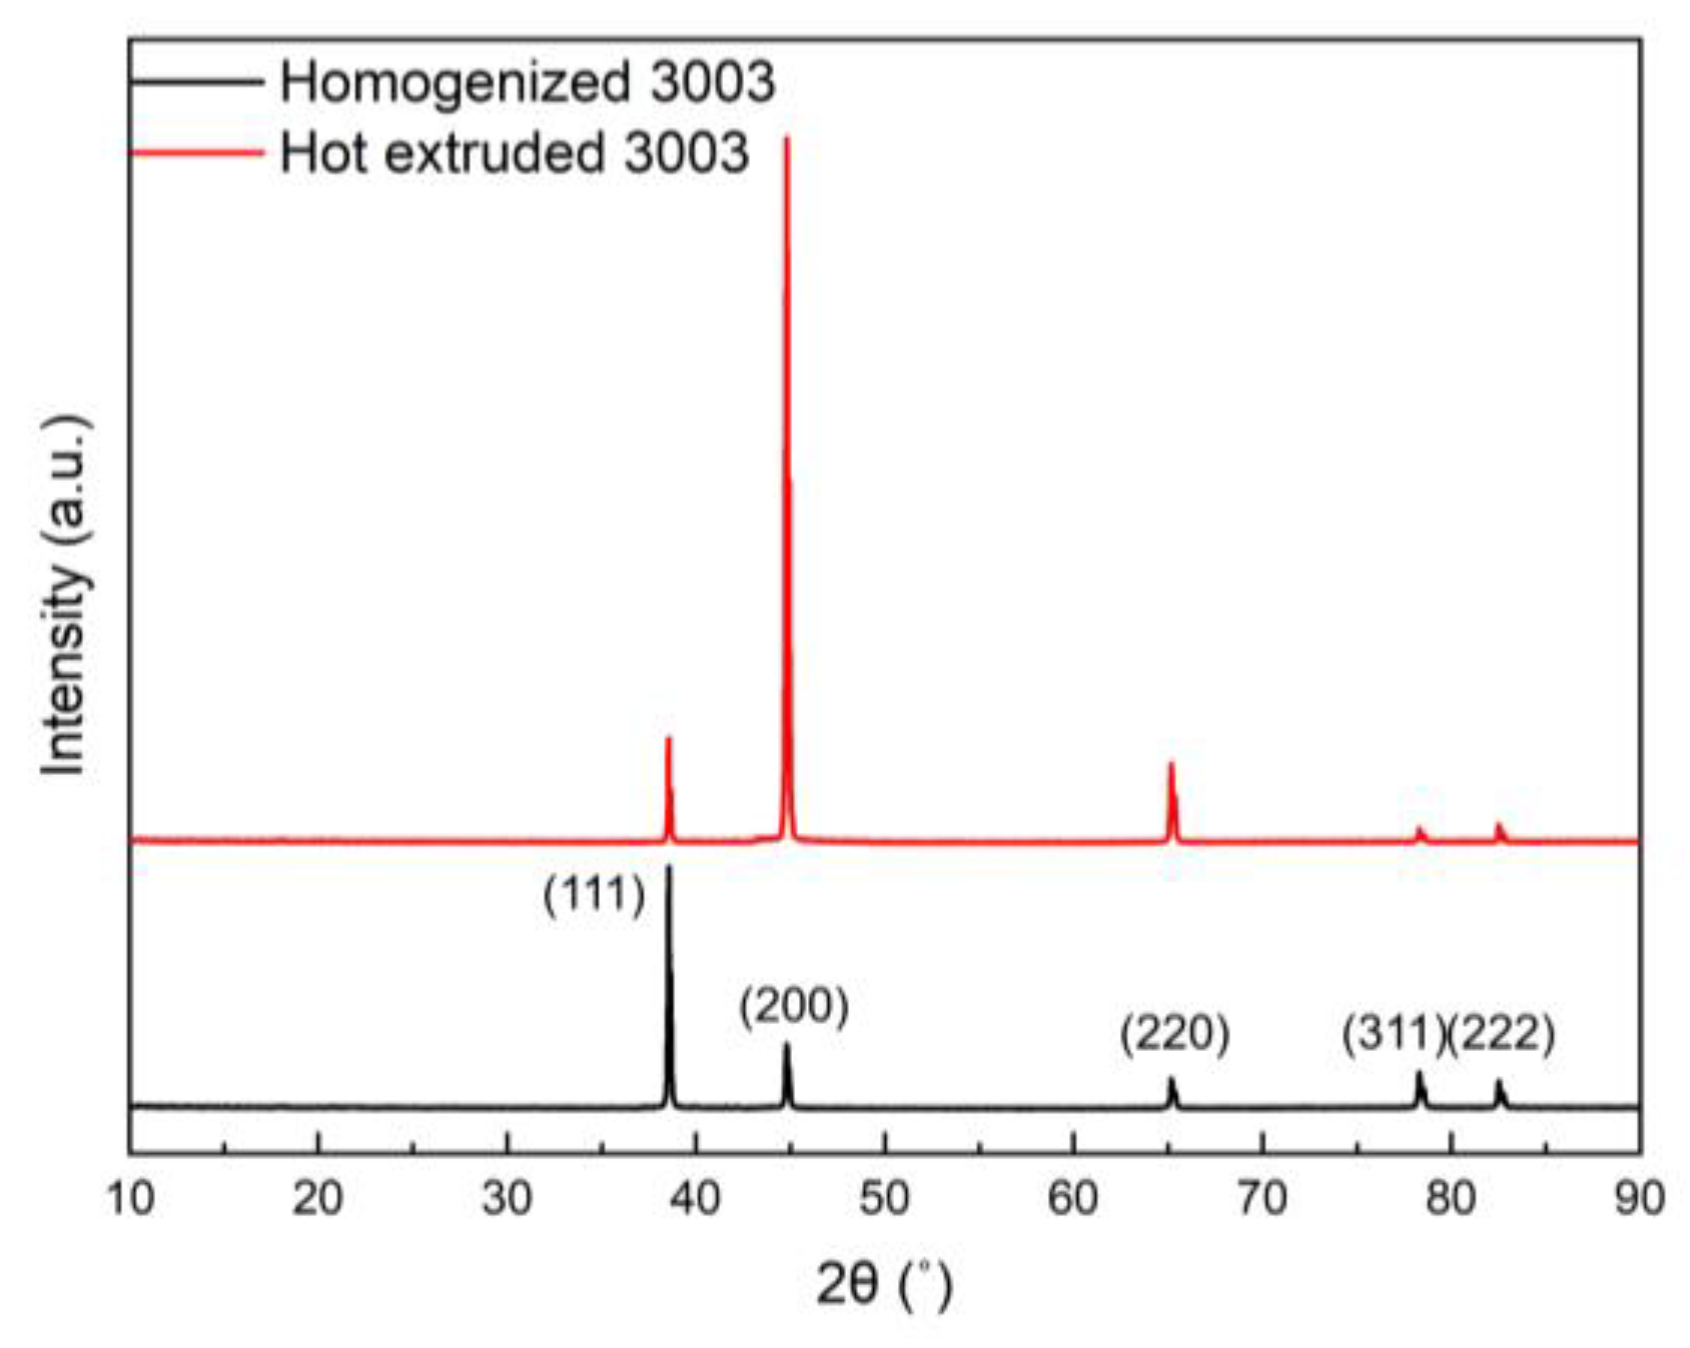
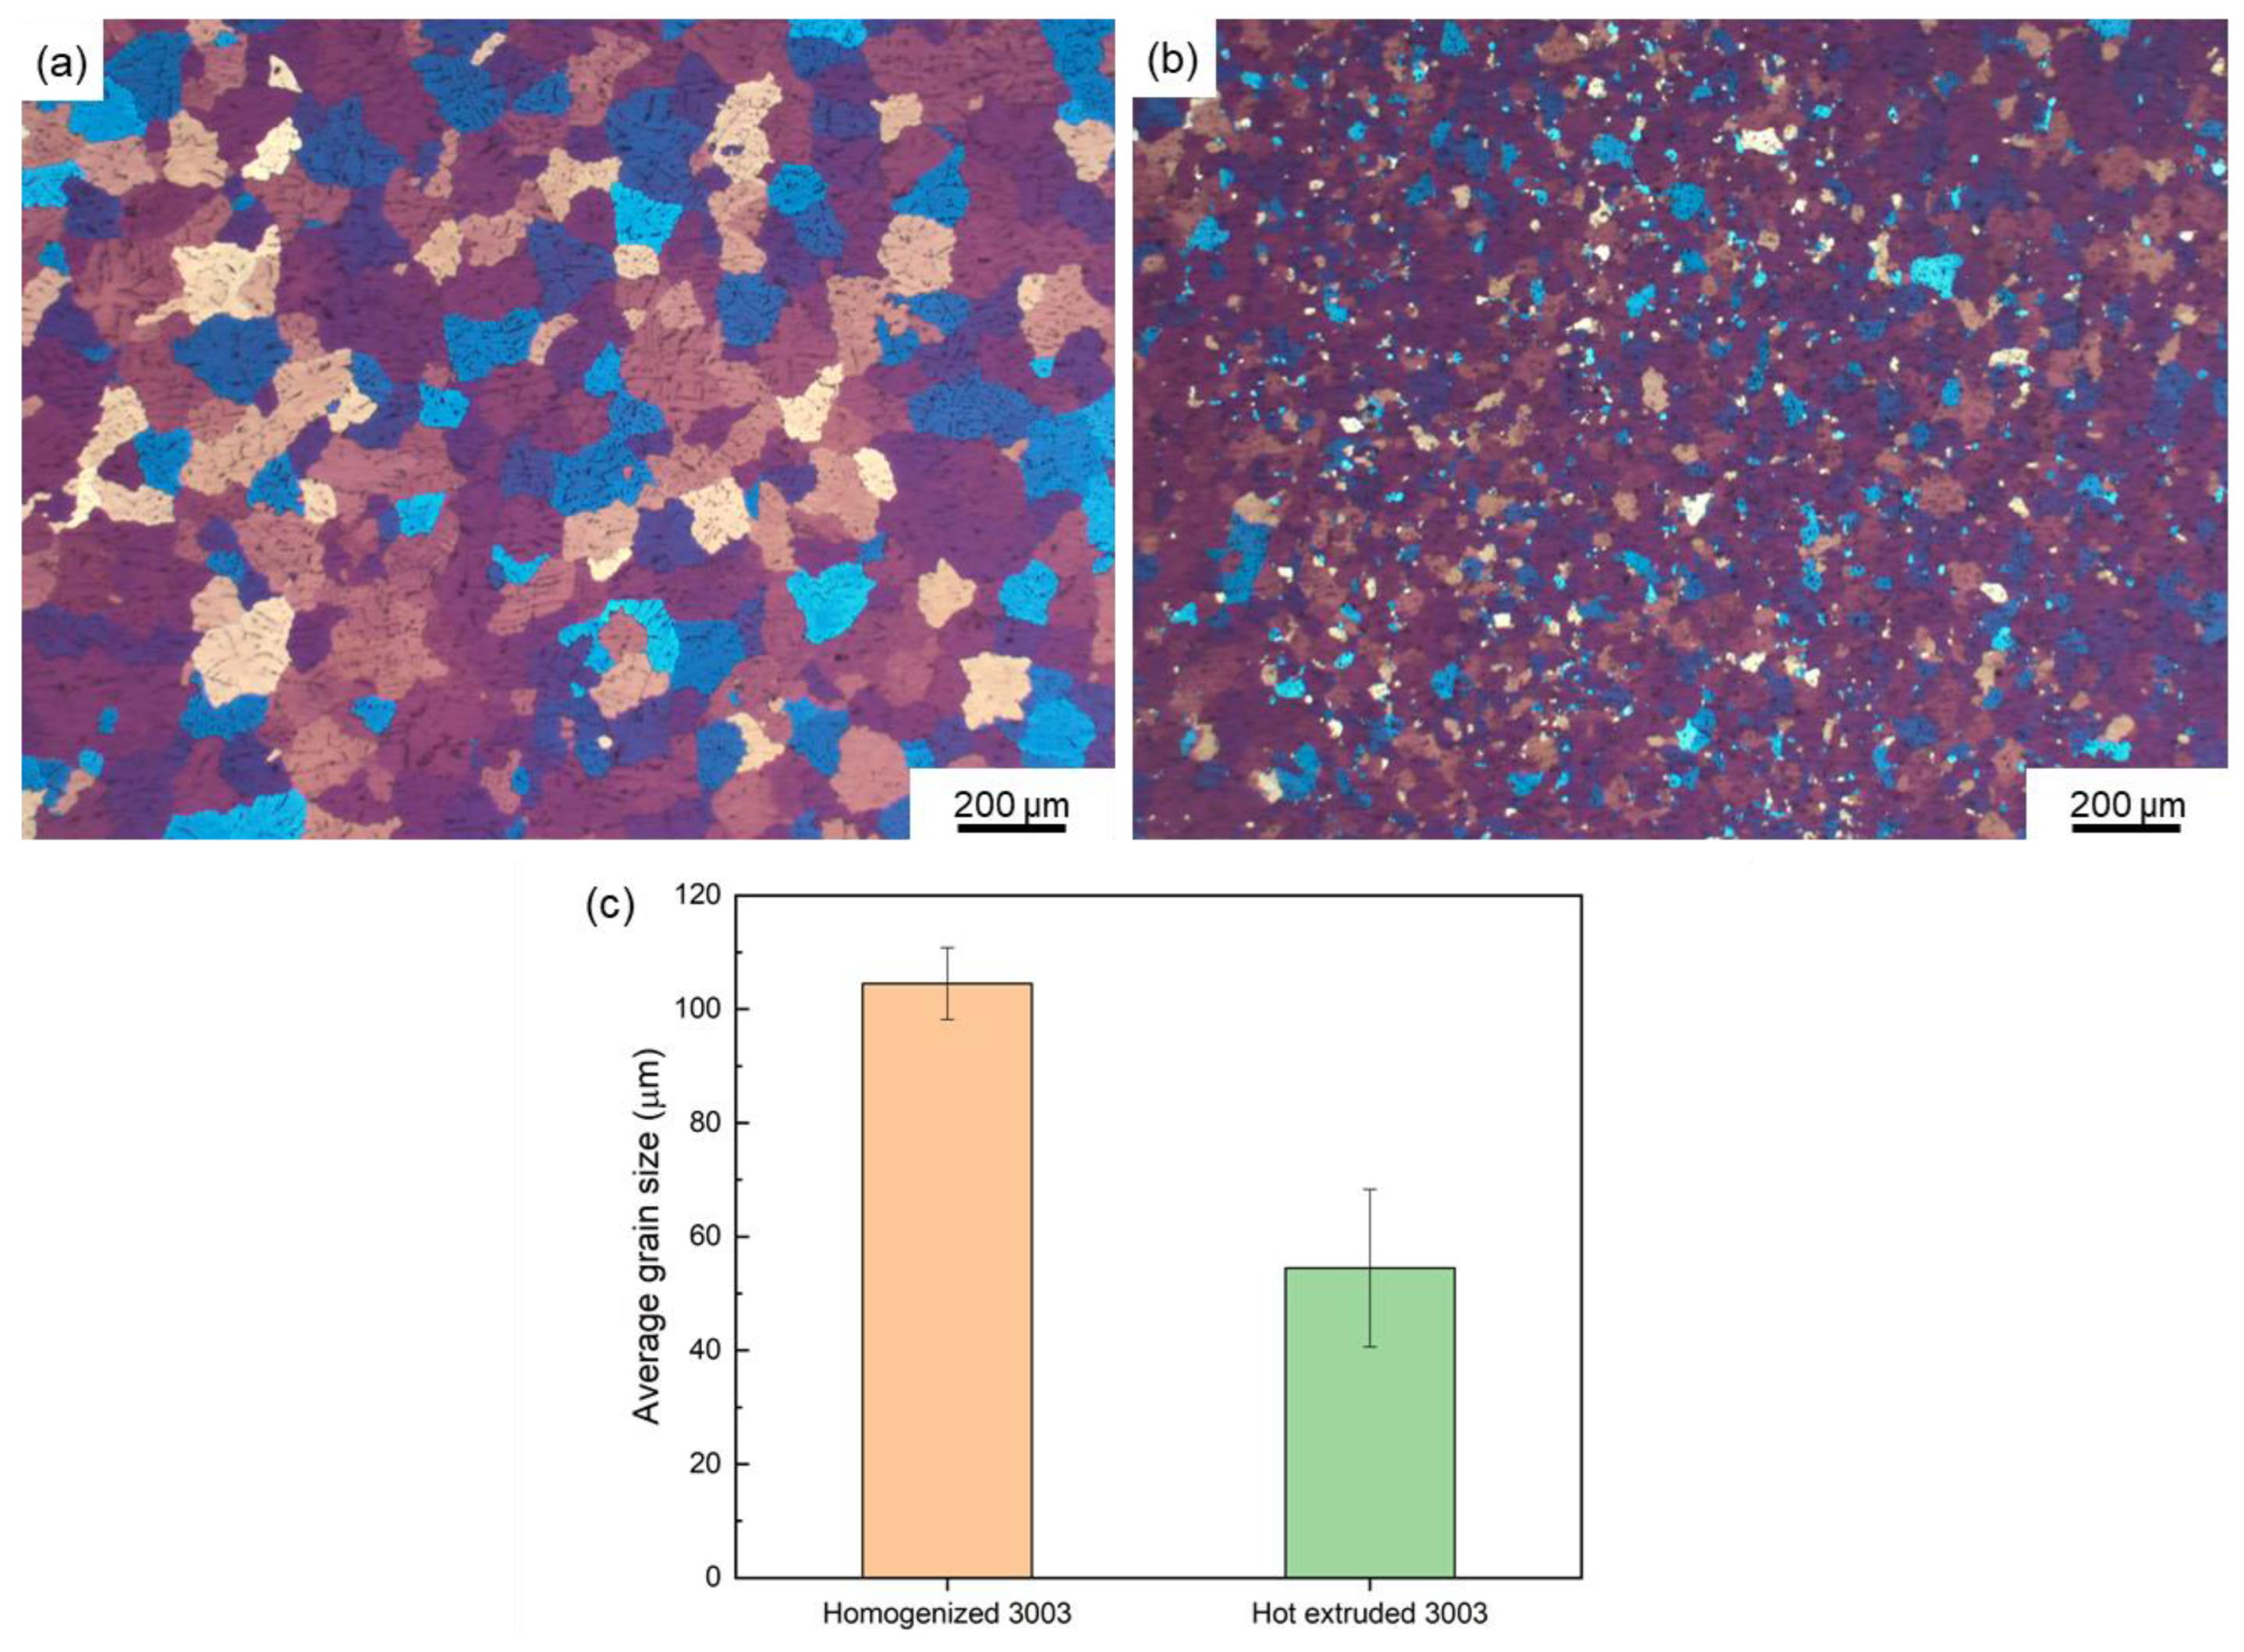
3.1. Microstructure
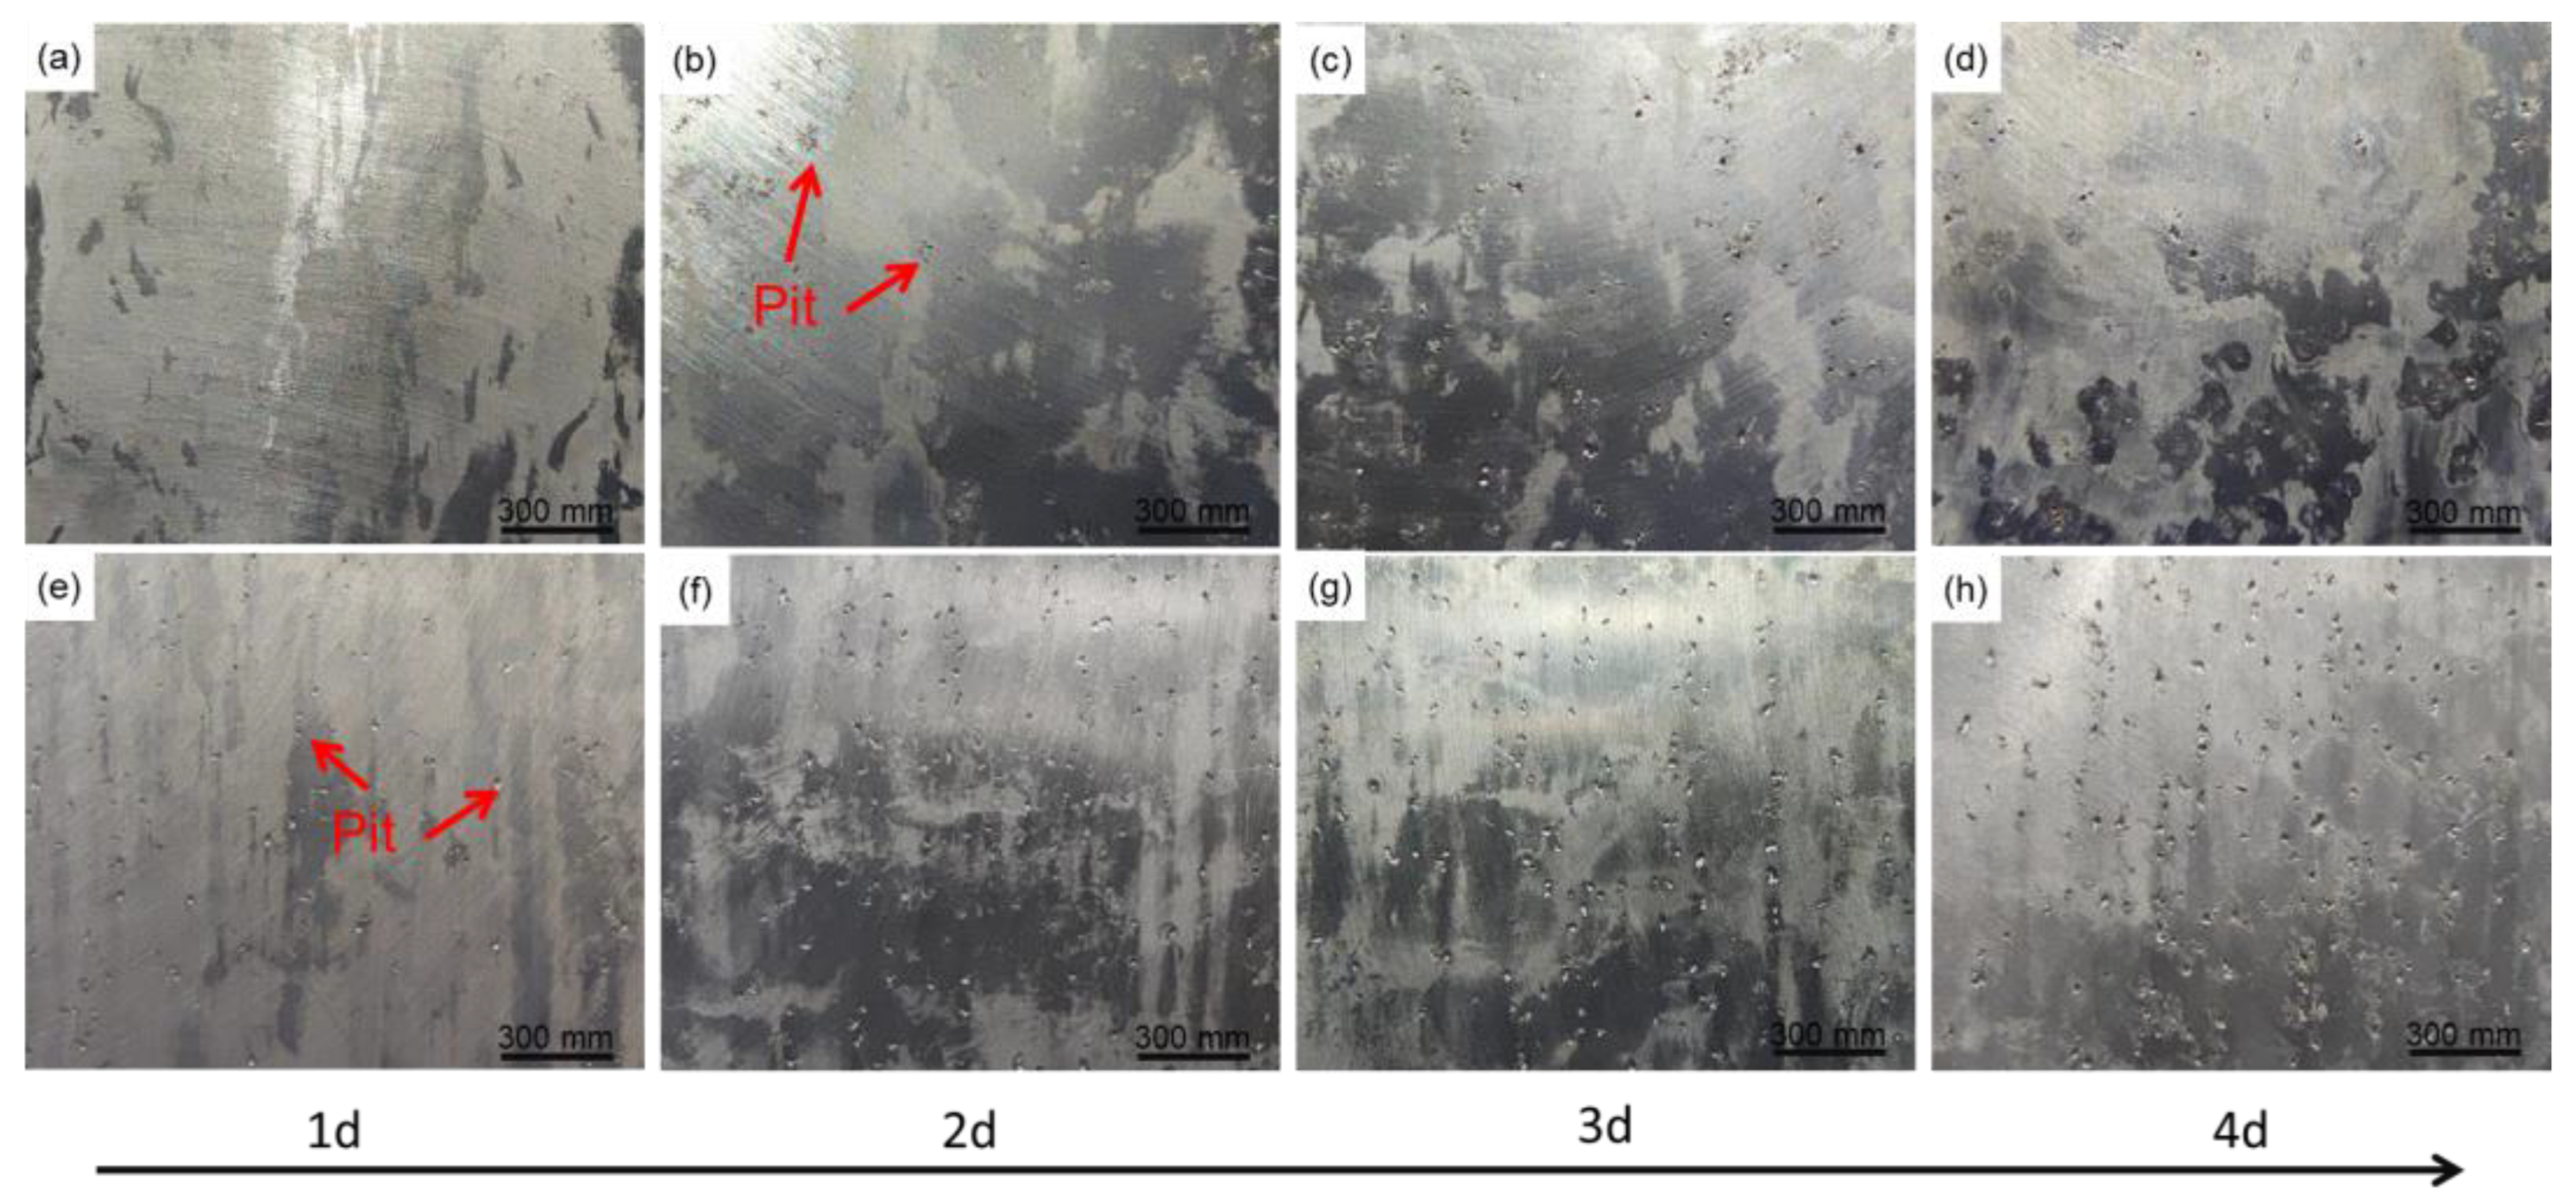
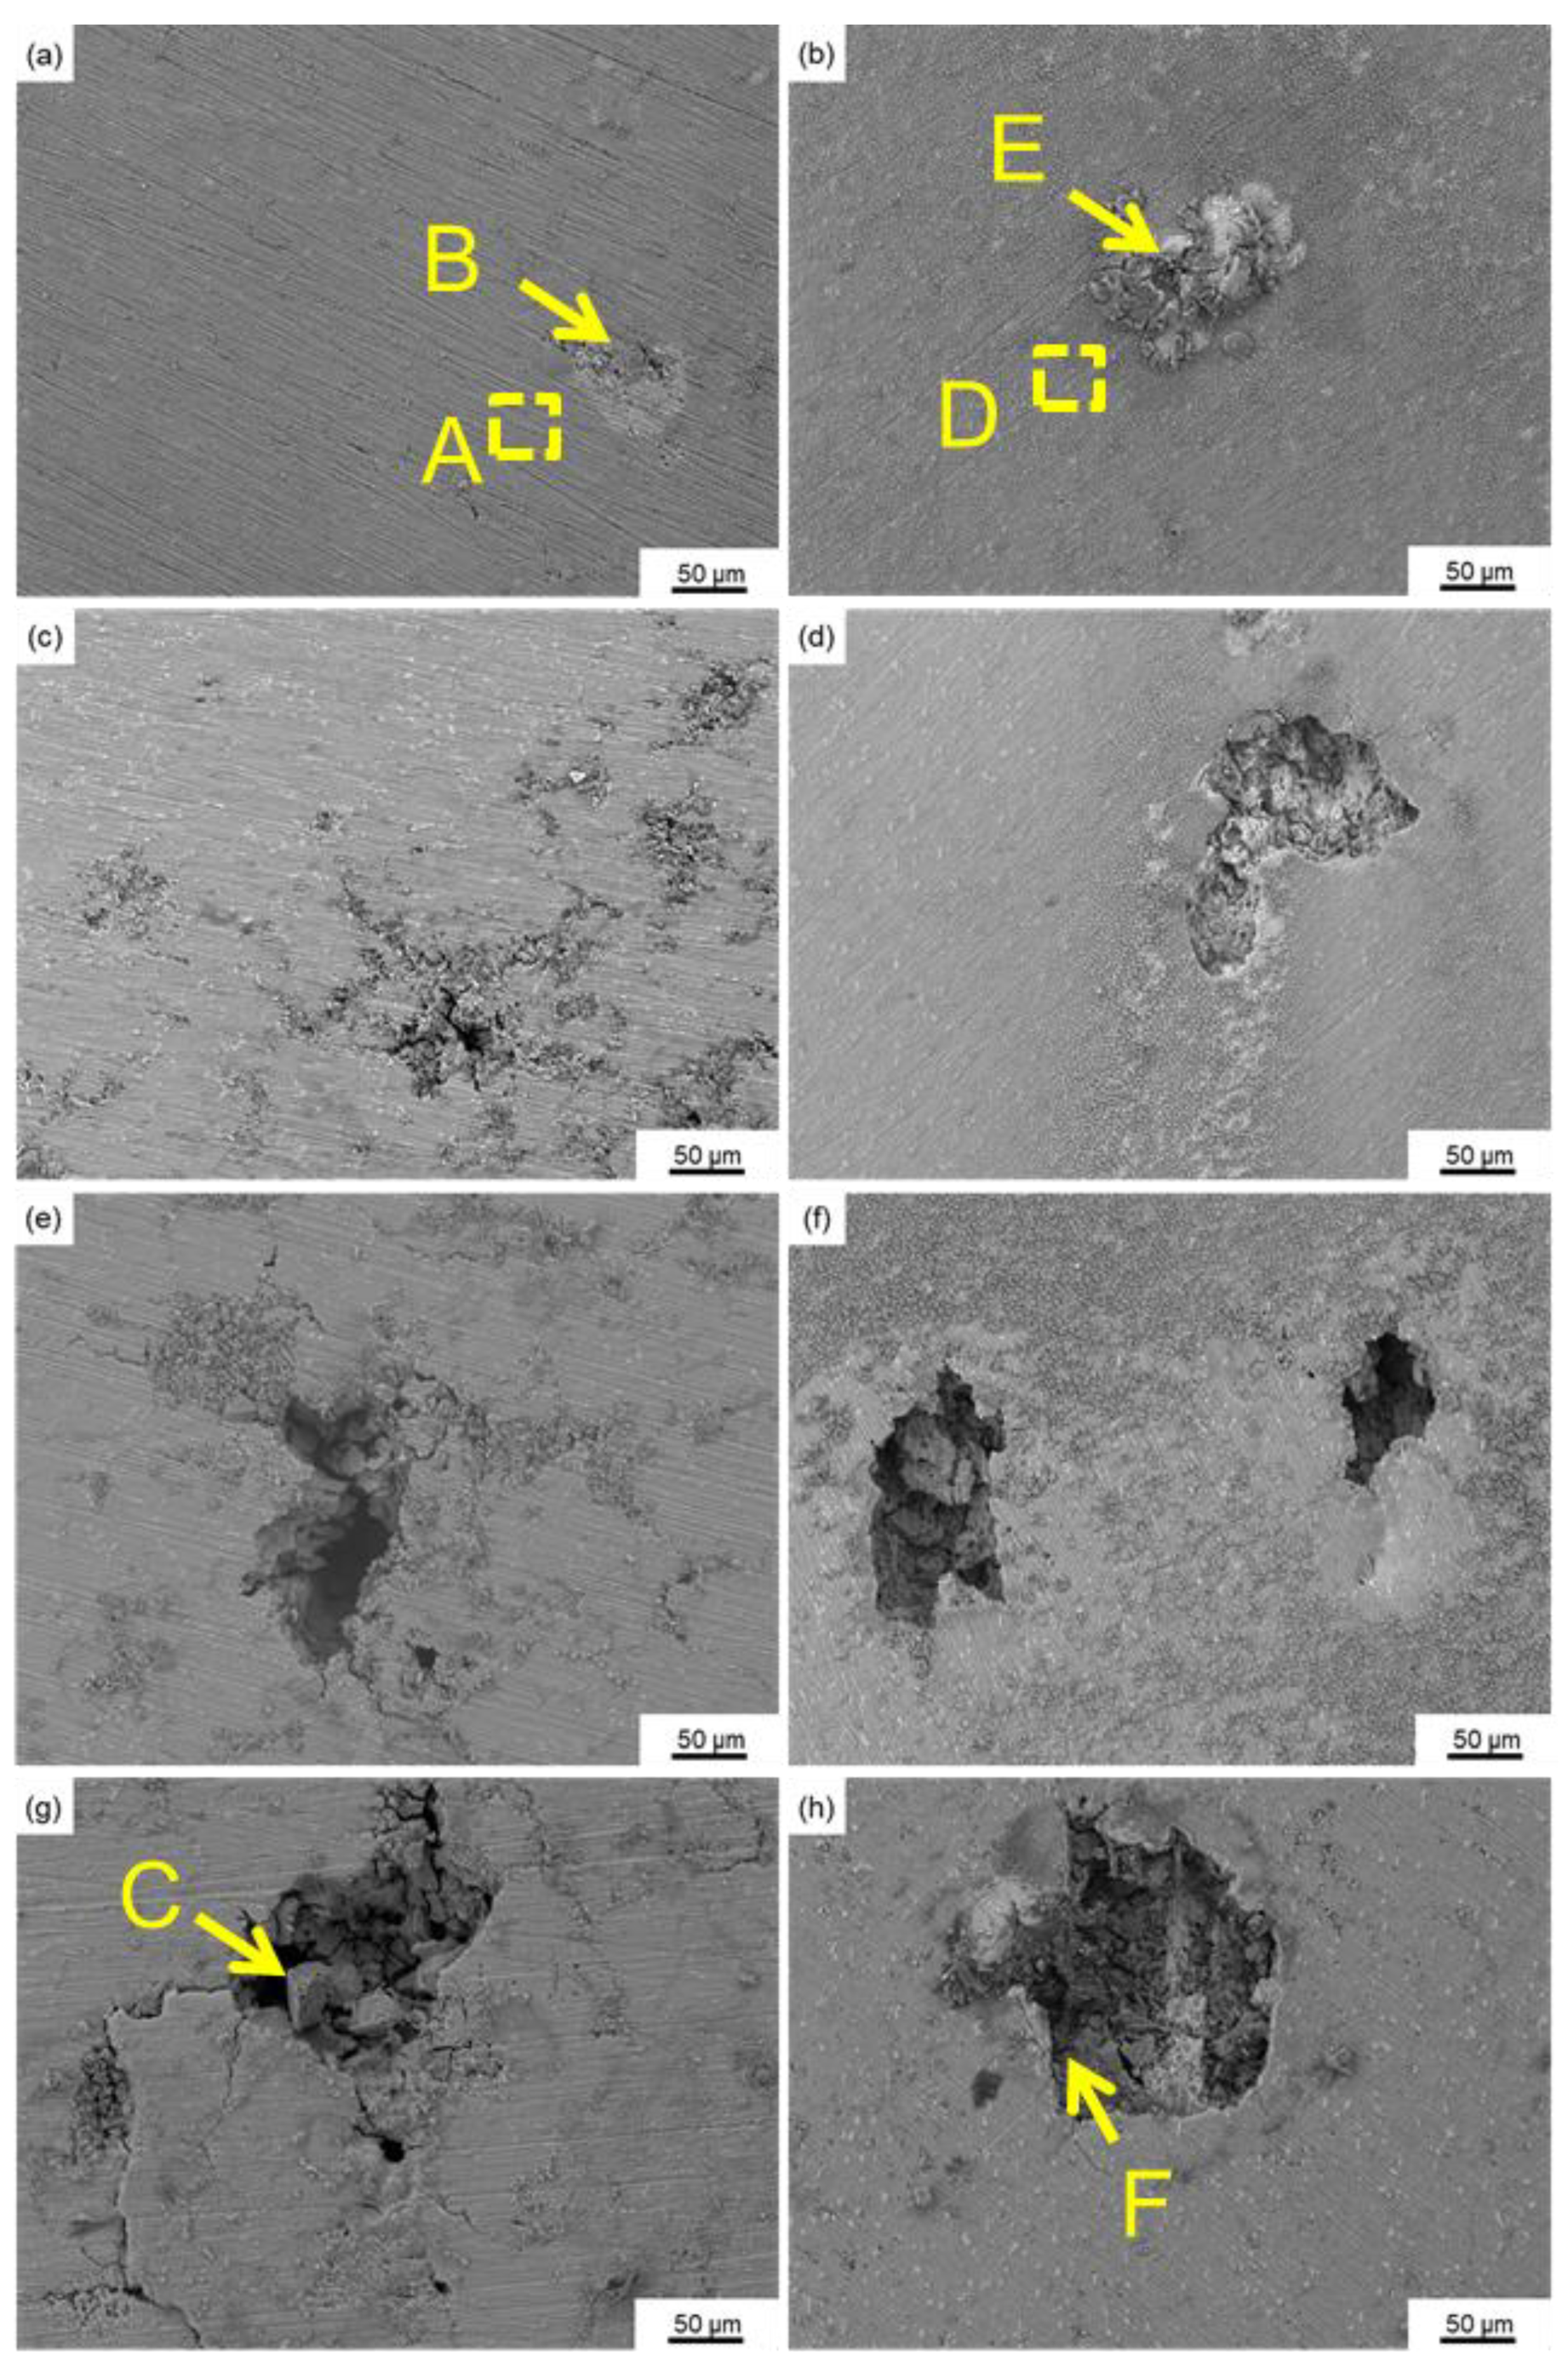
3.2. Surface Morphologies and Corrosion Products
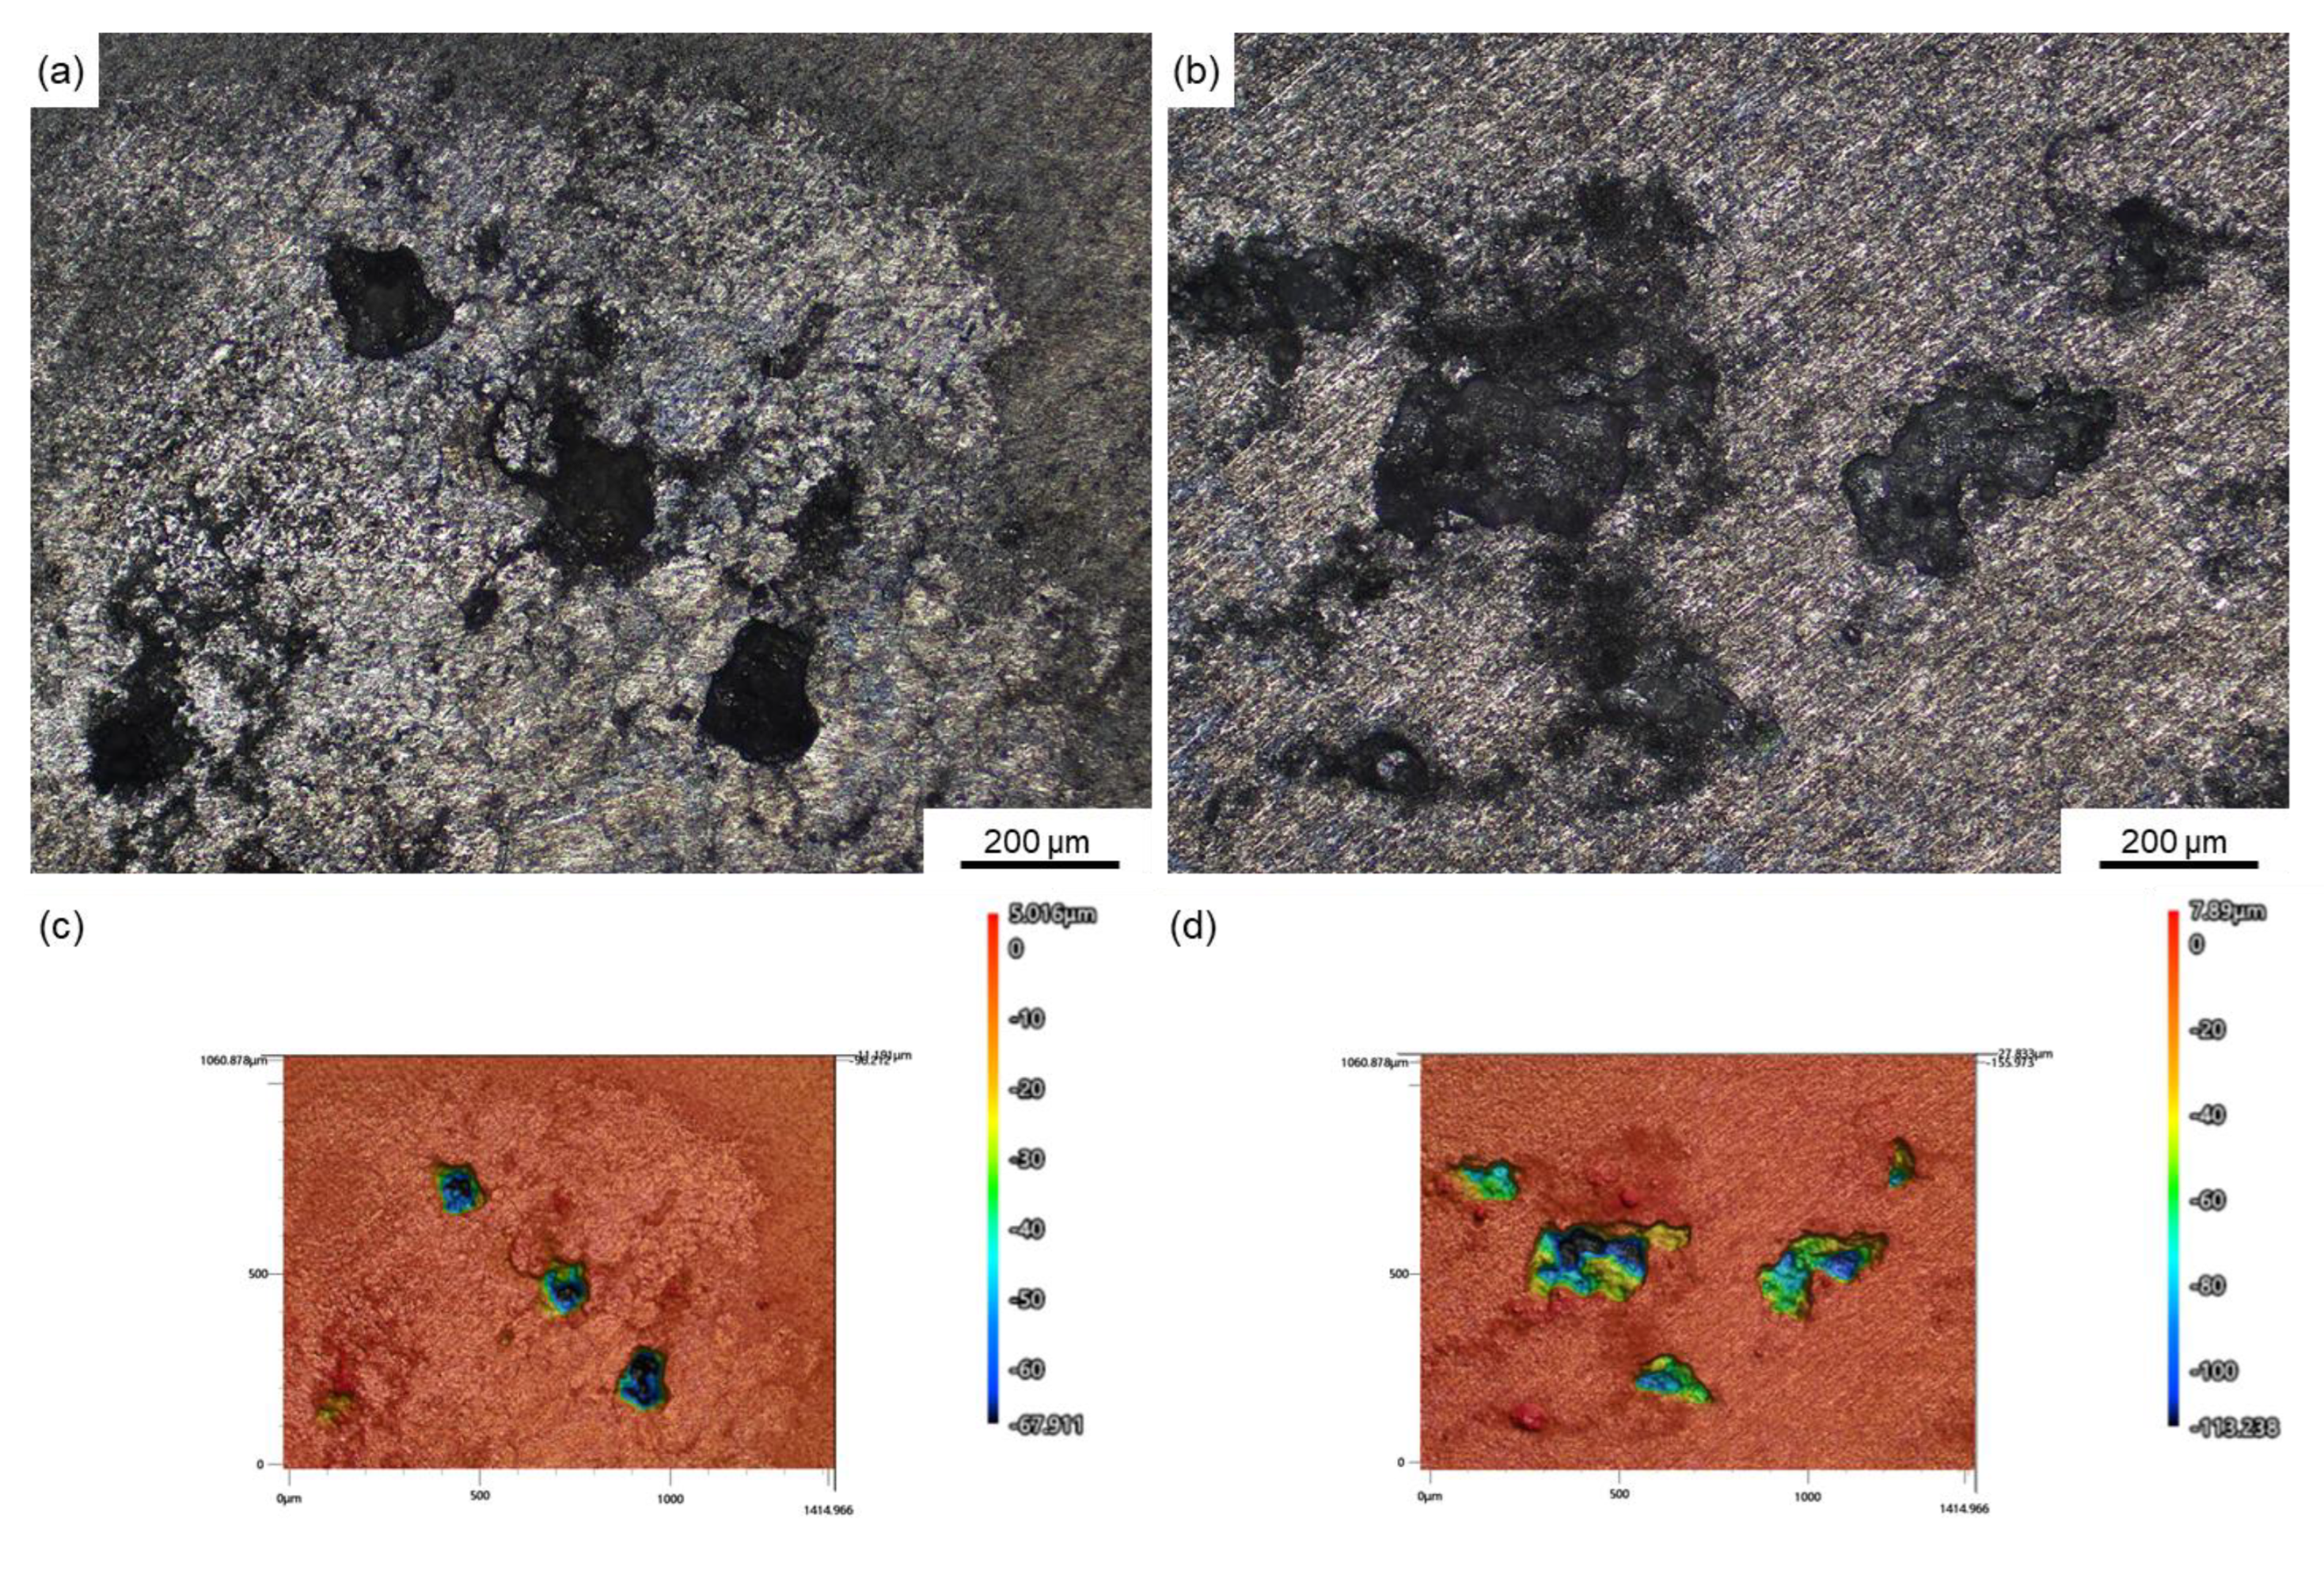
3.3. Density and Depth of Pitting Corrosion
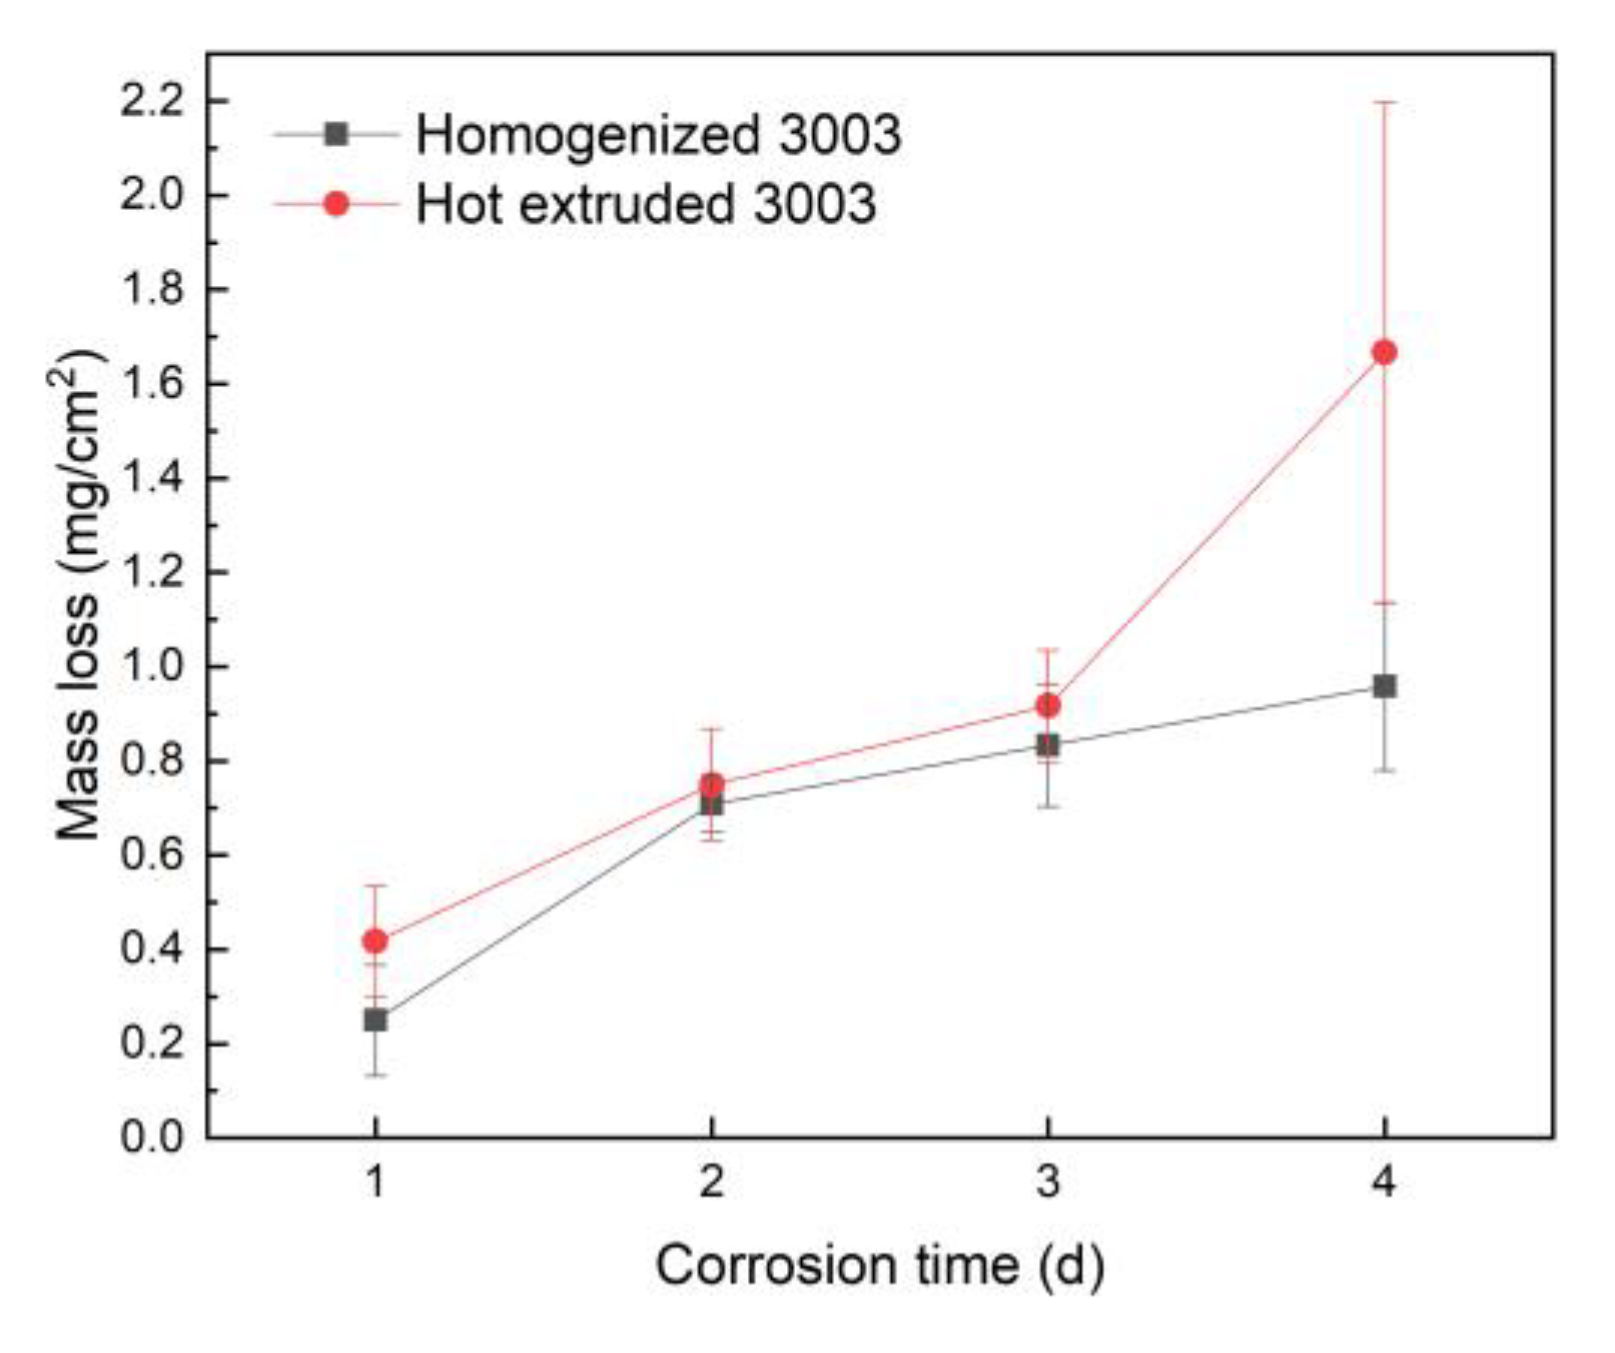
3.4. Weight Loss
3.5. Electrochemical Tests
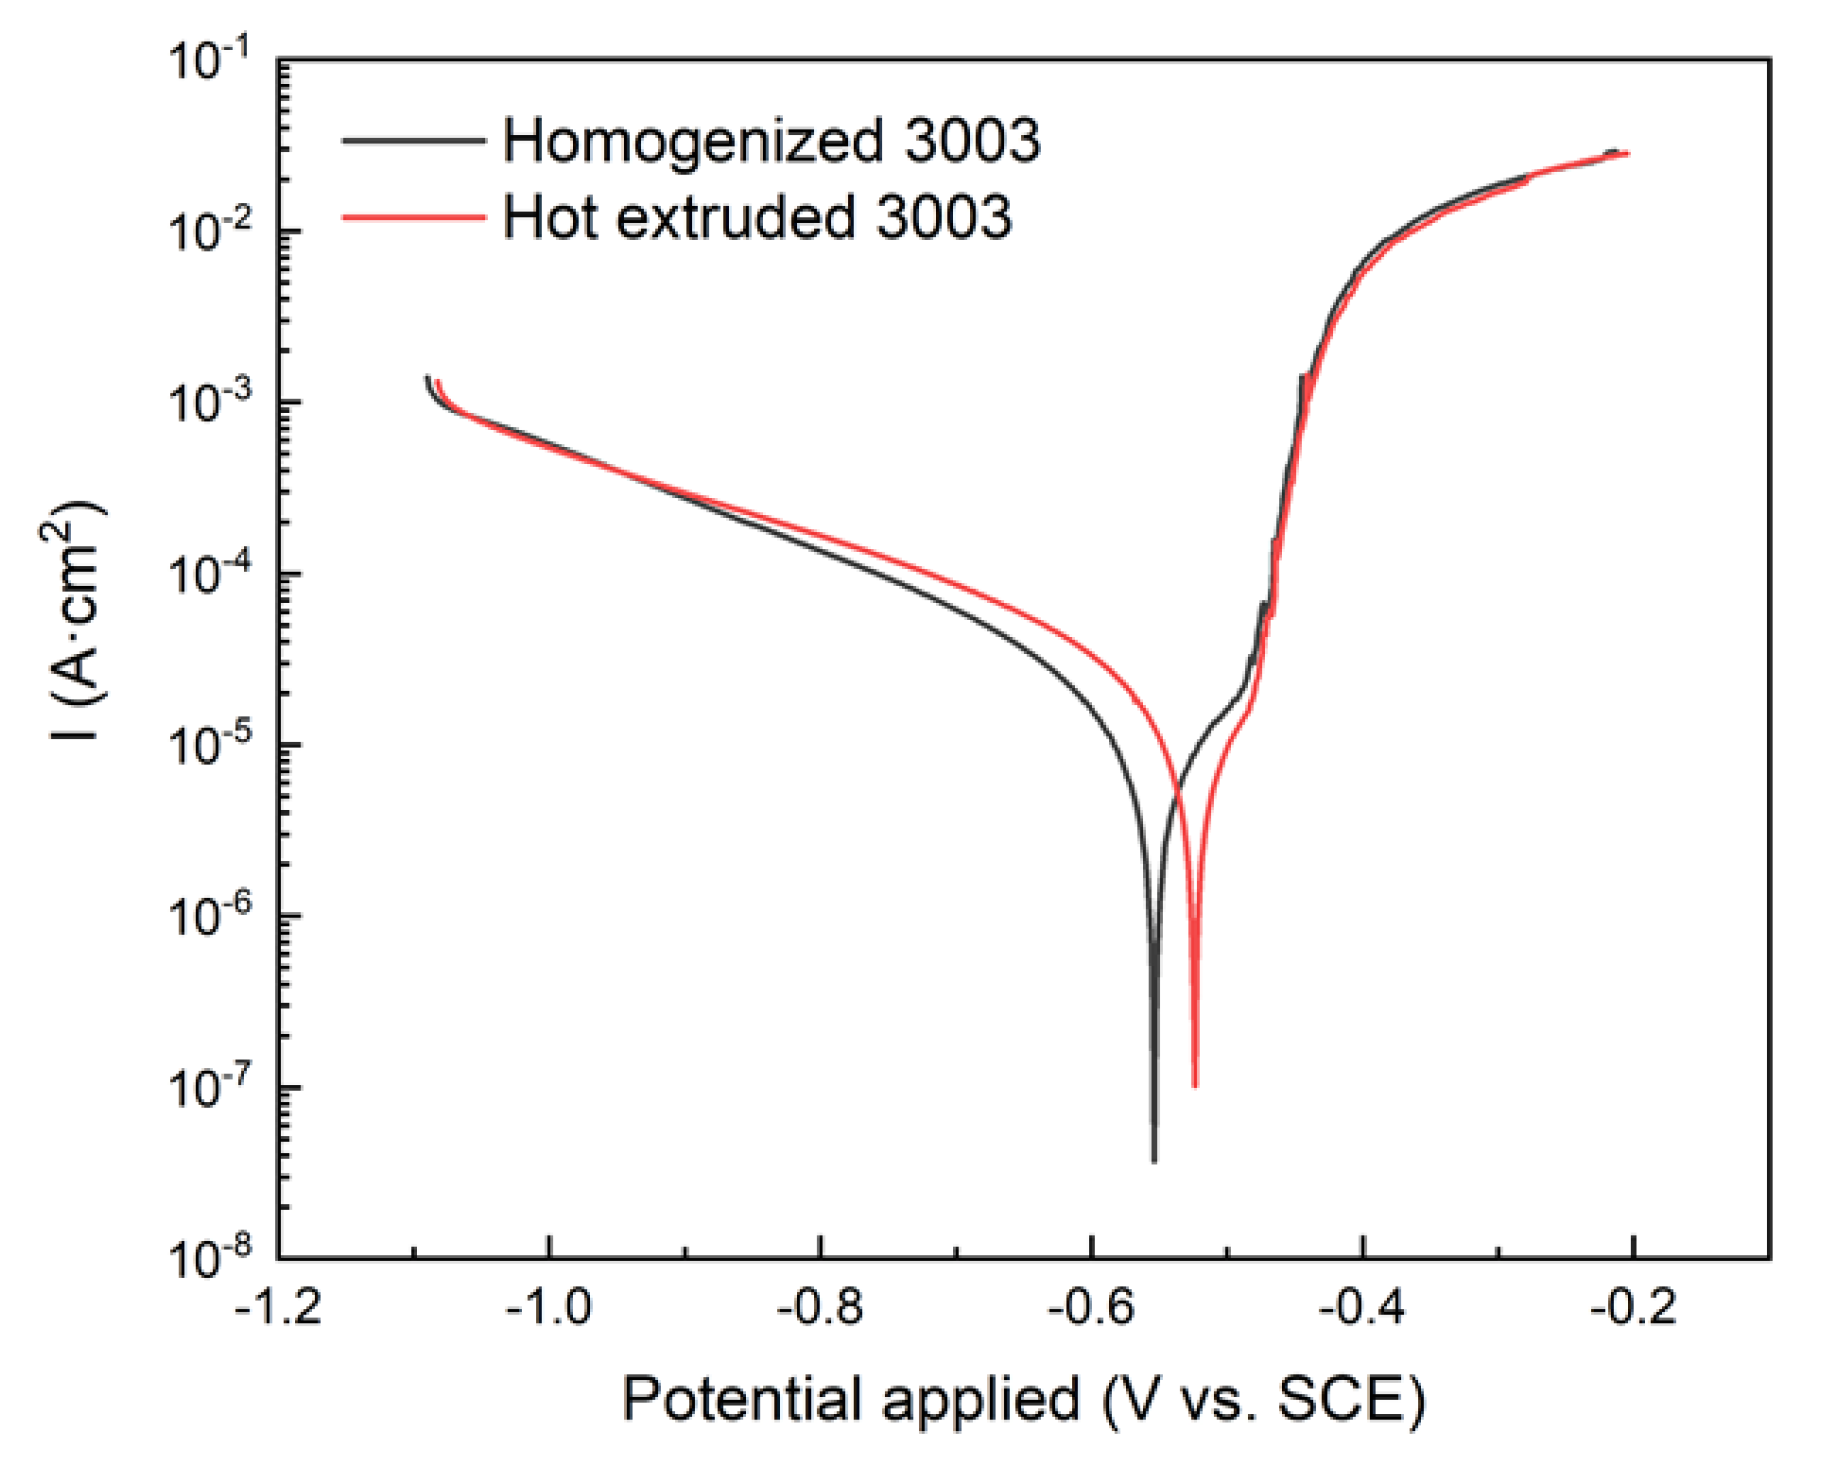
3.5.1. Polarization Analysis
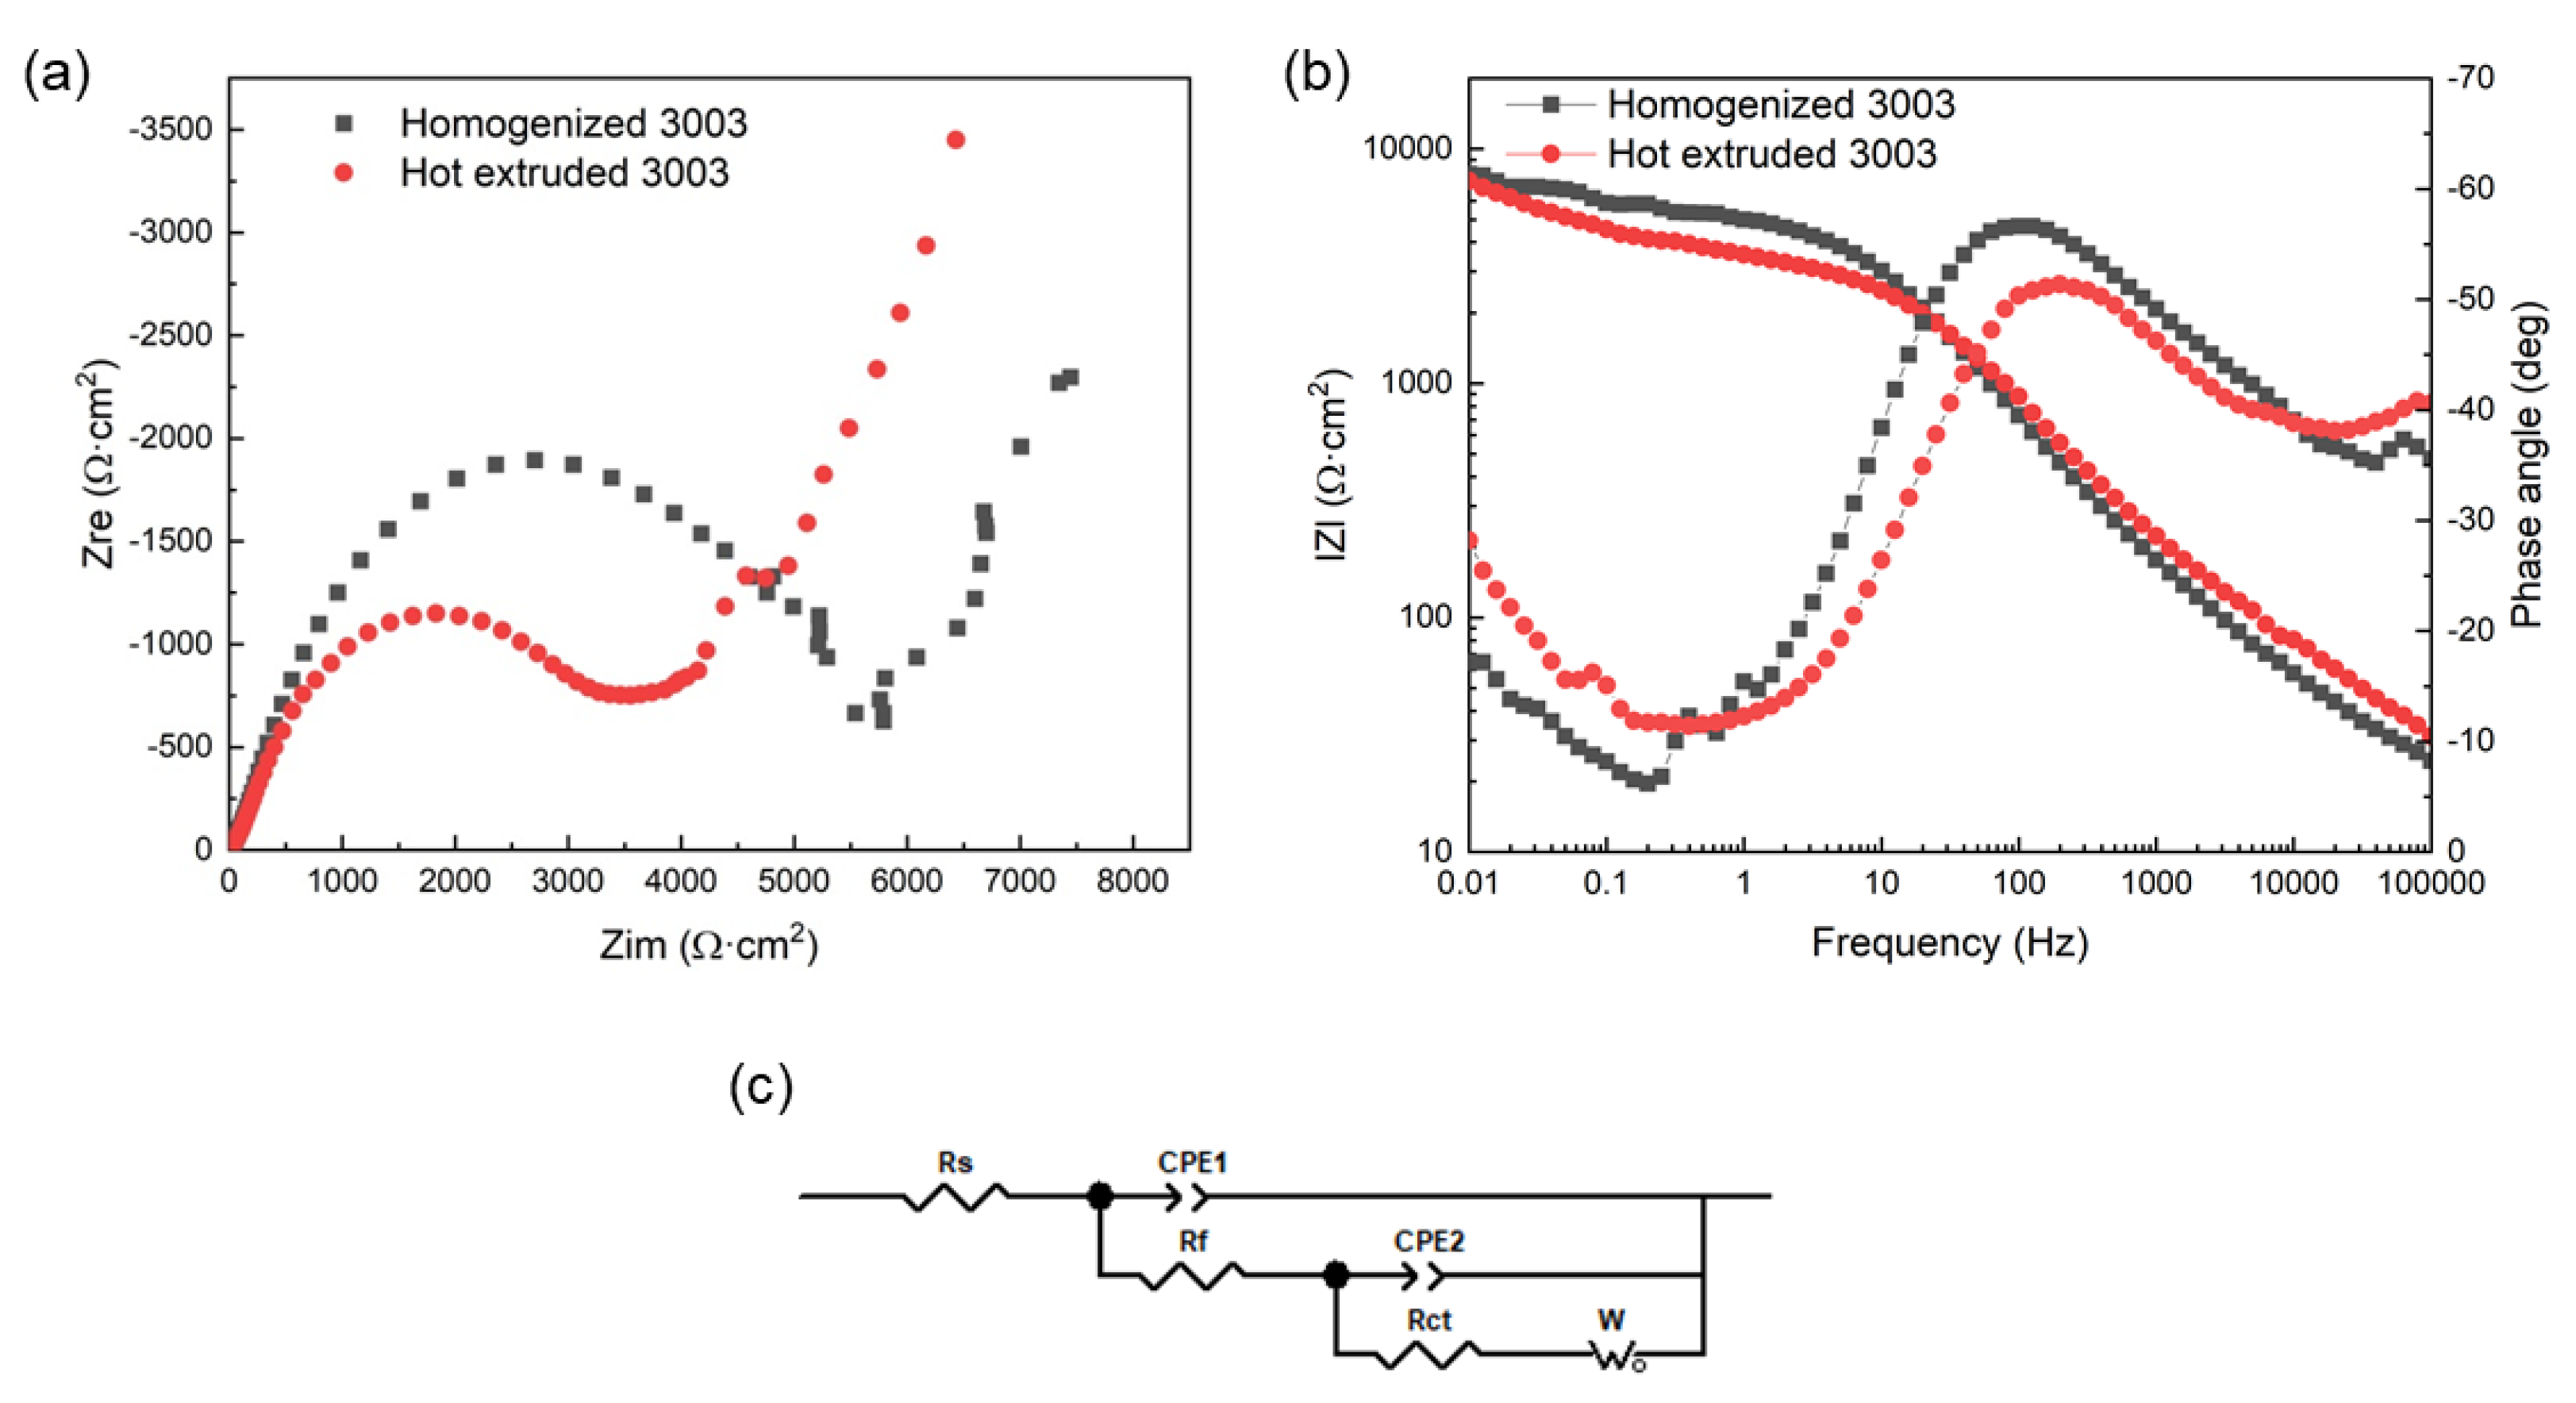
3.5.2. Electrochemical Impedance Spectroscopy Test
4. Discussion
4.1. Corrosion Mechanism
4.2. Effect of Hot Extrusion on Corrosion Resistance of 3003 Aluminum Alloy
5. Conclusions
- The average grain size of 3003 aluminum alloy in the homogenized state is larger, and the second phase is mainly distributed in the form of a network; after hot extrusion, the grain size of 3003 aluminum alloy is significantly reduced compared with the homogenized state, and the distribution of the second phase is more uniform, mainly along the extrusion direction.
- In acidic salt spray environments, the corrosion resistance of the homogenized 3003 aluminum alloy is better than that of the hot extruded state, and the pitting density and weight loss of the hot extruded 3003 aluminum alloy are higher. After 4 days of acidic salt spray test, the pitting density of homogenized 3003 was about 17/cm2, and that of hot extruded 3003 was 42/cm2; the maximum corrosion depth of homogenized 3003 was 108.9 μm, and hot extruded 3003 was 156.0 μm; the homogenized state of 3003 showed a weight loss of about 0.96 mg/cm2, and hot extruded 3003 was about 1.67 mg/cm2.
- As the acidic salt spray corrosion time increases, the corrosion of the homogenized 3003 aluminum alloy includes the increase of corrosion pit size and the formation of a reticular corrosion pit pattern, while the hot extrusion state is mainly the increase of corrosion pit size.
- In acidic environments, the original oxide film on the surface of 3003 aluminum alloy is easily damaged, and corrosion mainly occurs in the aluminum alloy matrix. The corrosion product layer can provide a certain protective effect. The higher the grain boundary density, the higher the corrosion activity. Therefore, the hot extruded 3003 aluminum alloy has more corrosion pits and deeper pitting compared to the homogenized 3003 aluminum alloy.
Author Contributions
Funding
Institutional Review Board Statement
Informed Consent Statement
Data Availability Statement
Acknowledgments
Conflicts of Interest
References
- Sun, Y. The use of aluminum alloys in structures: Review and outlook. Structures 2023, 57, 105290. [Google Scholar] [CrossRef]
- Berlanga-Labari, C.; Biezma-Moraleda, M.V.; Rivero, P.J. Corrosion of Cast Aluminum Alloys: A Review. Metals 2020, 10, 1384. [Google Scholar] [CrossRef]
- de la Fuente, D. Corrosion of Aluminum, Aluminum Alloys, and Composites; Elsevier: Amsterdam, The Netherlands, 2022; pp. 160–169. [Google Scholar]
- Bajat, J.B.; Milošev, I.; Jovanović, Ž.; Jančić-Heinemann, R.M.; Dimitrijević, M.; Mišković-Stanković, V.B. Corrosion protection of aluminium pretreated by vinyltriethoxysilane in sodium chloride solution. Corros. Sci. 2010, 52, 1060–1069. [Google Scholar] [CrossRef]
- Dursun, T.; Soutis, C. Recent developments in advanced aircraft aluminium alloys. Mater. Des. (1980–2015) 2014, 56, 862–871. [Google Scholar] [CrossRef]
- Wei, W.; Wei, K.X.; Du, Q.B. Corrosion and tensile behaviors of ultra-fine grained Al–Mn alloy produced by accumulative roll bonding. Mater. Sci. Eng. A 2007, 454–455, 536–541. [Google Scholar] [CrossRef]
- Hu, T.; Yin, D.; Yu, X.; Cheng, R.; Cao, H. Evolution of Microstructure in Al-Mn Alloy with a Low Ratio of Fe/Si During Homogenization. Rare Met. Mater. Eng. 2018, 47, 2631–2636. [Google Scholar]
- Lacaze, J.; Tierce, S.; Lafont, M.C.; Thebault, Y.; Pébère, N.; Mankowski, G.; Blanc, C.; Robidou, H.; Vaumousse, D.; Daloz, D. Study of the microstructure resulting from brazed aluminium materials used in heat exchangers. Mater. Sci. Eng. A 2005, 413–414, 317–321. [Google Scholar] [CrossRef]
- Gao, Z.; Qin, Z.; Lu, Q. Controlled Atmosphere Brazing of 3003 Aluminum Alloy Using Low-Melting-Point Filler Metal Fabricated by Melt-Spinning Technology. Materials 2022, 15, 6080. [Google Scholar] [CrossRef]
- Hong, M.-S.; Park, I.-J.; Kim, J.-G. Alloying effect of copper concentration on the localized corrosion of aluminum alloy for heat exchanger tube. Met. Mater. Int. 2017, 23, 708–714. [Google Scholar] [CrossRef]
- Yan, P.; Zhang, Z.; Zhou, C.; Xiao, Q.; Fang, J.; Si, H.; Wang, W.; Yang, Y. Enhancement of corrosion resistance of a high Zn-yttrium aluminum alloy. J. Alloys Compd. 2020, 817, 152744. [Google Scholar] [CrossRef]
- Cao, C.; Chen, D.; Ren, J.; Shen, J.; Meng, L.; Liu, J. Improved strength and enhanced pitting corrosion resistance of Al–Mn alloy with Zr addition. Mater. Lett. 2019, 255, 126535. [Google Scholar] [CrossRef]
- Kim, Y.; Buchheit, R.G. A characterization of the inhibiting effect of Cu on metastable pitting in dilute Al–Cu solid solution alloys. Electrochim. Acta 2007, 52, 2437–2446. [Google Scholar] [CrossRef]
- Xhanari, K.; Finšgar, M. Organic corrosion inhibitors for aluminum and its alloys in chloride and alkaline solutions: A review. Arab. J. Chem. 2019, 12, 4646–4663. [Google Scholar] [CrossRef]
- Li, Q.; Xia, T.; Lan, Y.; Zhao, W.; Fan, L.; Li, P. Effect of in situ γ-Al2O3 particles on the microstructure of hypereutectic Al–20%Si alloy. J. Alloys Compd. 2013, 577, 232–236. [Google Scholar] [CrossRef]
- Zykova, A.; Martyushev, N.; Skeeba, V.; Zadkov, D.; Kuzkin, A. Influence of W Addition on Microstructure and Mechanical Properties of Al–12%Si Alloys. Materials 2019, 12, 981. [Google Scholar] [CrossRef]
- Lachowicz, M. Role of microstructure in corrosion of microchannel heat exchangers. Inżynieria Mater. 2018, 1, 4–9. [Google Scholar] [CrossRef]
- Fontana, M.G.; Greene, N.D. A Critical Analysis of Pitting Corrosion. Corros. Eng. 2014, 8, 298–307. [Google Scholar]
- Szklarska-Smialowska, Z. Pitting corrosion of aluminum. Corros. Ence 1999, 41, 1743–1767. [Google Scholar] [CrossRef]
- Song, D.; Ma, A.-B.; Jiang, J.-H.; Lin, P.-H.; Yang, D.-H. Corrosion behavior of ultra-fine grained industrial pure Al fabricated by ECAP. Trans. Nonferr. Met. Soc. China 2009, 19, 1065–1070. [Google Scholar] [CrossRef]
- Yasakau, K.A.; Zheludkevich, M.L.; Ferreira, M.G.S. Role of intermetallics in corrosion of aluminum alloys. Smart corrosion protection. Intermet. Matrix Compos. 2018, 425–462. [Google Scholar] [CrossRef]
- Liu, Y.; Cheng, Y.F. Role of second phase particles in pitting corrosion of 3003 Al alloy in NaCl solution. Mater. Corros. 2010, 61, 211–217. [Google Scholar] [CrossRef]
- Melchers, R.E. Time Dependent Development of Aluminium Pitting Corrosion. Adv. Mater. Sci. Eng. 2015, 2015, 215712. [Google Scholar] [CrossRef]
- Zaid, B.; Saidi, D.; Benzaid, A.; Hadji, S. Effects of pH and chloride concentration on pitting corrosion of AA6061 aluminum alloy. Corros. Sci. 2008, 50, 1841–1847. [Google Scholar]
- Loto, R.T. Effect of SO42− and Cl− anionic attack on the localized corrosion resistance and morphology of 409 ferritic stainless steel. Results Phys. 2019, 12, 738–742. [Google Scholar] [CrossRef]
- Chen, X.; Tian, W.; Li, S.; Yu, M.; Liu, J. Effect of temperature on corrosion behavior of 3003 aluminum alloy in ethylene glycol–water solution. Chin. J. Aeronaut. 2016, 29, 1142–1150. [Google Scholar] [CrossRef]
- Liu, Y.; Meng, G.Z.; Cheng, Y.F. Electronic structure and pitting behavior of 3003 aluminum alloy passivated under various conditions. Electrochim. Acta 2009, 54, 4155–4163. [Google Scholar] [CrossRef]
- Yin, M.; Ma, L.; Wang, J.; Ma, Y.; Ding, Y. Effect of homogenizing treatment on the corrosion resistance of 3003 aluminum alloy ingot. Spec. Cast. Nonferr. Alloys 2012, 32, 775–778. [Google Scholar]
- Liu, Y.; Cheng, Y.F. Characterization of passivity and pitting corrosion of 3003 aluminum alloy in ethylene glycol-water solutions. J. Appl. Electrochem. 2011, 41, 151–159. [Google Scholar] [CrossRef]
- Paredes-Dugarte, S.Y.; Hidalgo-Prada, B. Statistical Analysis of the Optical Interferometry of Pitting Process in Aluminum 3003 Sheets Exposed to Saline Environment. Procedia Mater. Sci. 2015, 8, 82–90. [Google Scholar] [CrossRef]
- Sun, Z.; Liang, C.; Chen, Y.; Ma, Z.; Li, Q.; Yin, Z.; Ling, Y.; Xu, Y.; Liu, Z. Corrosion characteristics and prediction model of aluminum alloys in saturated Na2SO4 solution. Mater. Chem. Phys. 2023, 308, 128273. [Google Scholar] [CrossRef]
- Dudina, D.V.; Kuchumova, I.D.; Batraev, I.S.; Bokhonov, B.B.; Ondar, A.A.; Grigoreva, T.F.; Shtertser, A.A. Morphological and structural changes of sintered Cu-10 wt% Al materials with different alloying levels in salt spray environment. Mater. Lett. 2024, 354, 135405. [Google Scholar] [CrossRef]
- Usman, B.J.; Scenini, F.; Curioni, M. The effect of exposure conditions on performance evaluation of post-treated anodic oxides on an aerospace aluminium alloy: Comparison between salt spray and immersion testing. Surf. Coat. Technol. 2020, 399, 126157. [Google Scholar] [CrossRef]
- ASTM G85-2011; Standard Practice for Modified Salt Spray (Fog) Testing. ASTM International: West Conshohocken, PA, USA, 2011.
- Chen, J.; Xiao, J.; Poplawsky, J.; Michel, F.M.; Deng, C.; Cai, W. The origin of passivity in aluminum-manganese solid solutions. Corros. Sci. 2020, 173, 108749. [Google Scholar] [CrossRef]
- Zhang, Y.; Chen, Y.; Zhang, Y.; Bian, G.; Wang, C.; Wang, A. Initial corrosion behavior and mechanism of 7B04 aluminum alloy under acid immersion and salt spray environments. Chin. J. Aeronaut. 2022, 35, 277–289. [Google Scholar] [CrossRef]
- Graedel, T.E. Corrosion Mechanisms for Aluminum Exposed to the Atmosphere. J. Electrochem. Soc. 1989, 136, 204C–212C. [Google Scholar] [CrossRef]
- Abdulstaar, M.; Mhaede, M.; Wagner, L.; Wollmann, M. Corrosion behaviour of Al 1050 severely deformed by rotary swaging. Mater. Des. 2014, 57, 325–329. [Google Scholar] [CrossRef]
- Takakuwa, O.; Soyama, H. Effect of Residual Stress on the Corrosion Behavior of Austenitic Stainless Steel. Adv. Chem. Eng. Sci. 2015, 5, 62–71. [Google Scholar] [CrossRef]


| Element | Si | Fe | Cu | Mn | Zn | Al |
|---|---|---|---|---|---|---|
| % | 0.12 | 0.36 | 0.15 | 1.08 | 0.10 | Balance |
| Processing Status | Points | Mn | Fe | Si | Al |
|---|---|---|---|---|---|
| Homogenized | A | 11.84 | 7.20 | 80.96 | |
| B | 11.29 | 7.39 | 3.49 | 77.83 | |
| C | 9.18 | 5.90 | 84.92 | ||
| Standard Deviation | 1.40 | 0.81 | 3.55 | ||
| Hot extruded | D | 11.92 | 7.82 | 80.25 | |
| E | 8.07 | 6.80 | 85.13 | ||
| F | 10.11 | 7.90 | 81.99 | ||
| Standard Deviation | 1.93 | 0.61 | 2.47 |
| Processing Status | Points | O | Al | Cl |
|---|---|---|---|---|
| Homogenized | A | 51.95 | 48.05 | |
| B | 53.33 | 36.59 | 10.08 | |
| C | 56.14 | 38.29 | 5.57 | |
| Standard Deviation | 2.14 | 6.18 | 3.19 | |
| Hot extruded | D | 56.31 | 43.69 | |
| E | 64.91 | 33.31 | 1.78 | |
| F | 53.85 | 44.25 | 1.91 | |
| Standard Deviation | 5.81 | 6.17 | 0.01 |
| Specimen | Ecorr (VSCE) | Icorr (μA·cm−2) | Epit (VSCE) | Epit-Ecorr (V) |
|---|---|---|---|---|
| Homogenized 3003 | −0.553 | 21.36 | −0.486 | 0.065 |
| Hot extruded 3003 | −0.523 | 28.22 | −0.483 | 0.041 |
| Specimen | Rs (Ω·cm2) | CPE1 y0 | n1 | Rf (Ω·cm2) | CPE2 y0 | n2 | Rct (Ω·cm2) | W (Ss1/2 × 10−3) | χ2 |
|---|---|---|---|---|---|---|---|---|---|
| Homogenized 3003 | 11.27 | 4.01 | 0.72 | 88.73 | 7.25 | 0.74 | 5415 | 1.28 | 1.93 × 10⁻³ |
| Hot extruded 3003 | 8.18 | 4.8 | 0.67 | 129.2 | 6.21 | 0.73 | 3407 | 0.88 | 7.33 × 10⁻⁴ |
Disclaimer/Publisher’s Note: The statements, opinions and data contained in all publications are solely those of the individual author(s) and contributor(s) and not of MDPI and/or the editor(s). MDPI and/or the editor(s) disclaim responsibility for any injury to people or property resulting from any ideas, methods, instructions or products referred to in the content. |
© 2024 by the authors. Licensee MDPI, Basel, Switzerland. This article is an open access article distributed under the terms and conditions of the Creative Commons Attribution (CC BY) license (https://creativecommons.org/licenses/by/4.0/).
Share and Cite
Lu, Q.; Zhao, Y.; Wang, Q.; Li, D. Investigation on the Corrosion Resistance of 3003 Aluminum Alloy in Acidic Salt Spray under Different Processing States. Metals 2024, 14, 196. https://doi.org/10.3390/met14020196
Lu Q, Zhao Y, Wang Q, Li D. Investigation on the Corrosion Resistance of 3003 Aluminum Alloy in Acidic Salt Spray under Different Processing States. Metals. 2024; 14(2):196. https://doi.org/10.3390/met14020196
Chicago/Turabian StyleLu, Qiang, Yuchao Zhao, Qudong Wang, and Dezhi Li. 2024. "Investigation on the Corrosion Resistance of 3003 Aluminum Alloy in Acidic Salt Spray under Different Processing States" Metals 14, no. 2: 196. https://doi.org/10.3390/met14020196
APA StyleLu, Q., Zhao, Y., Wang, Q., & Li, D. (2024). Investigation on the Corrosion Resistance of 3003 Aluminum Alloy in Acidic Salt Spray under Different Processing States. Metals, 14(2), 196. https://doi.org/10.3390/met14020196