
A First-Time Investigation into Ecofriendly and Biocompatible Mg-Se Binary System for a Greener Earth


Abstract
1. Introduction
2. Materials and Methods
2.1. Materials
2.2. Synthesis
2.3. Materials Characterisation
2.3.1. Microstructure
2.3.2. X-ray Diffraction
2.3.3. Density and Porosity
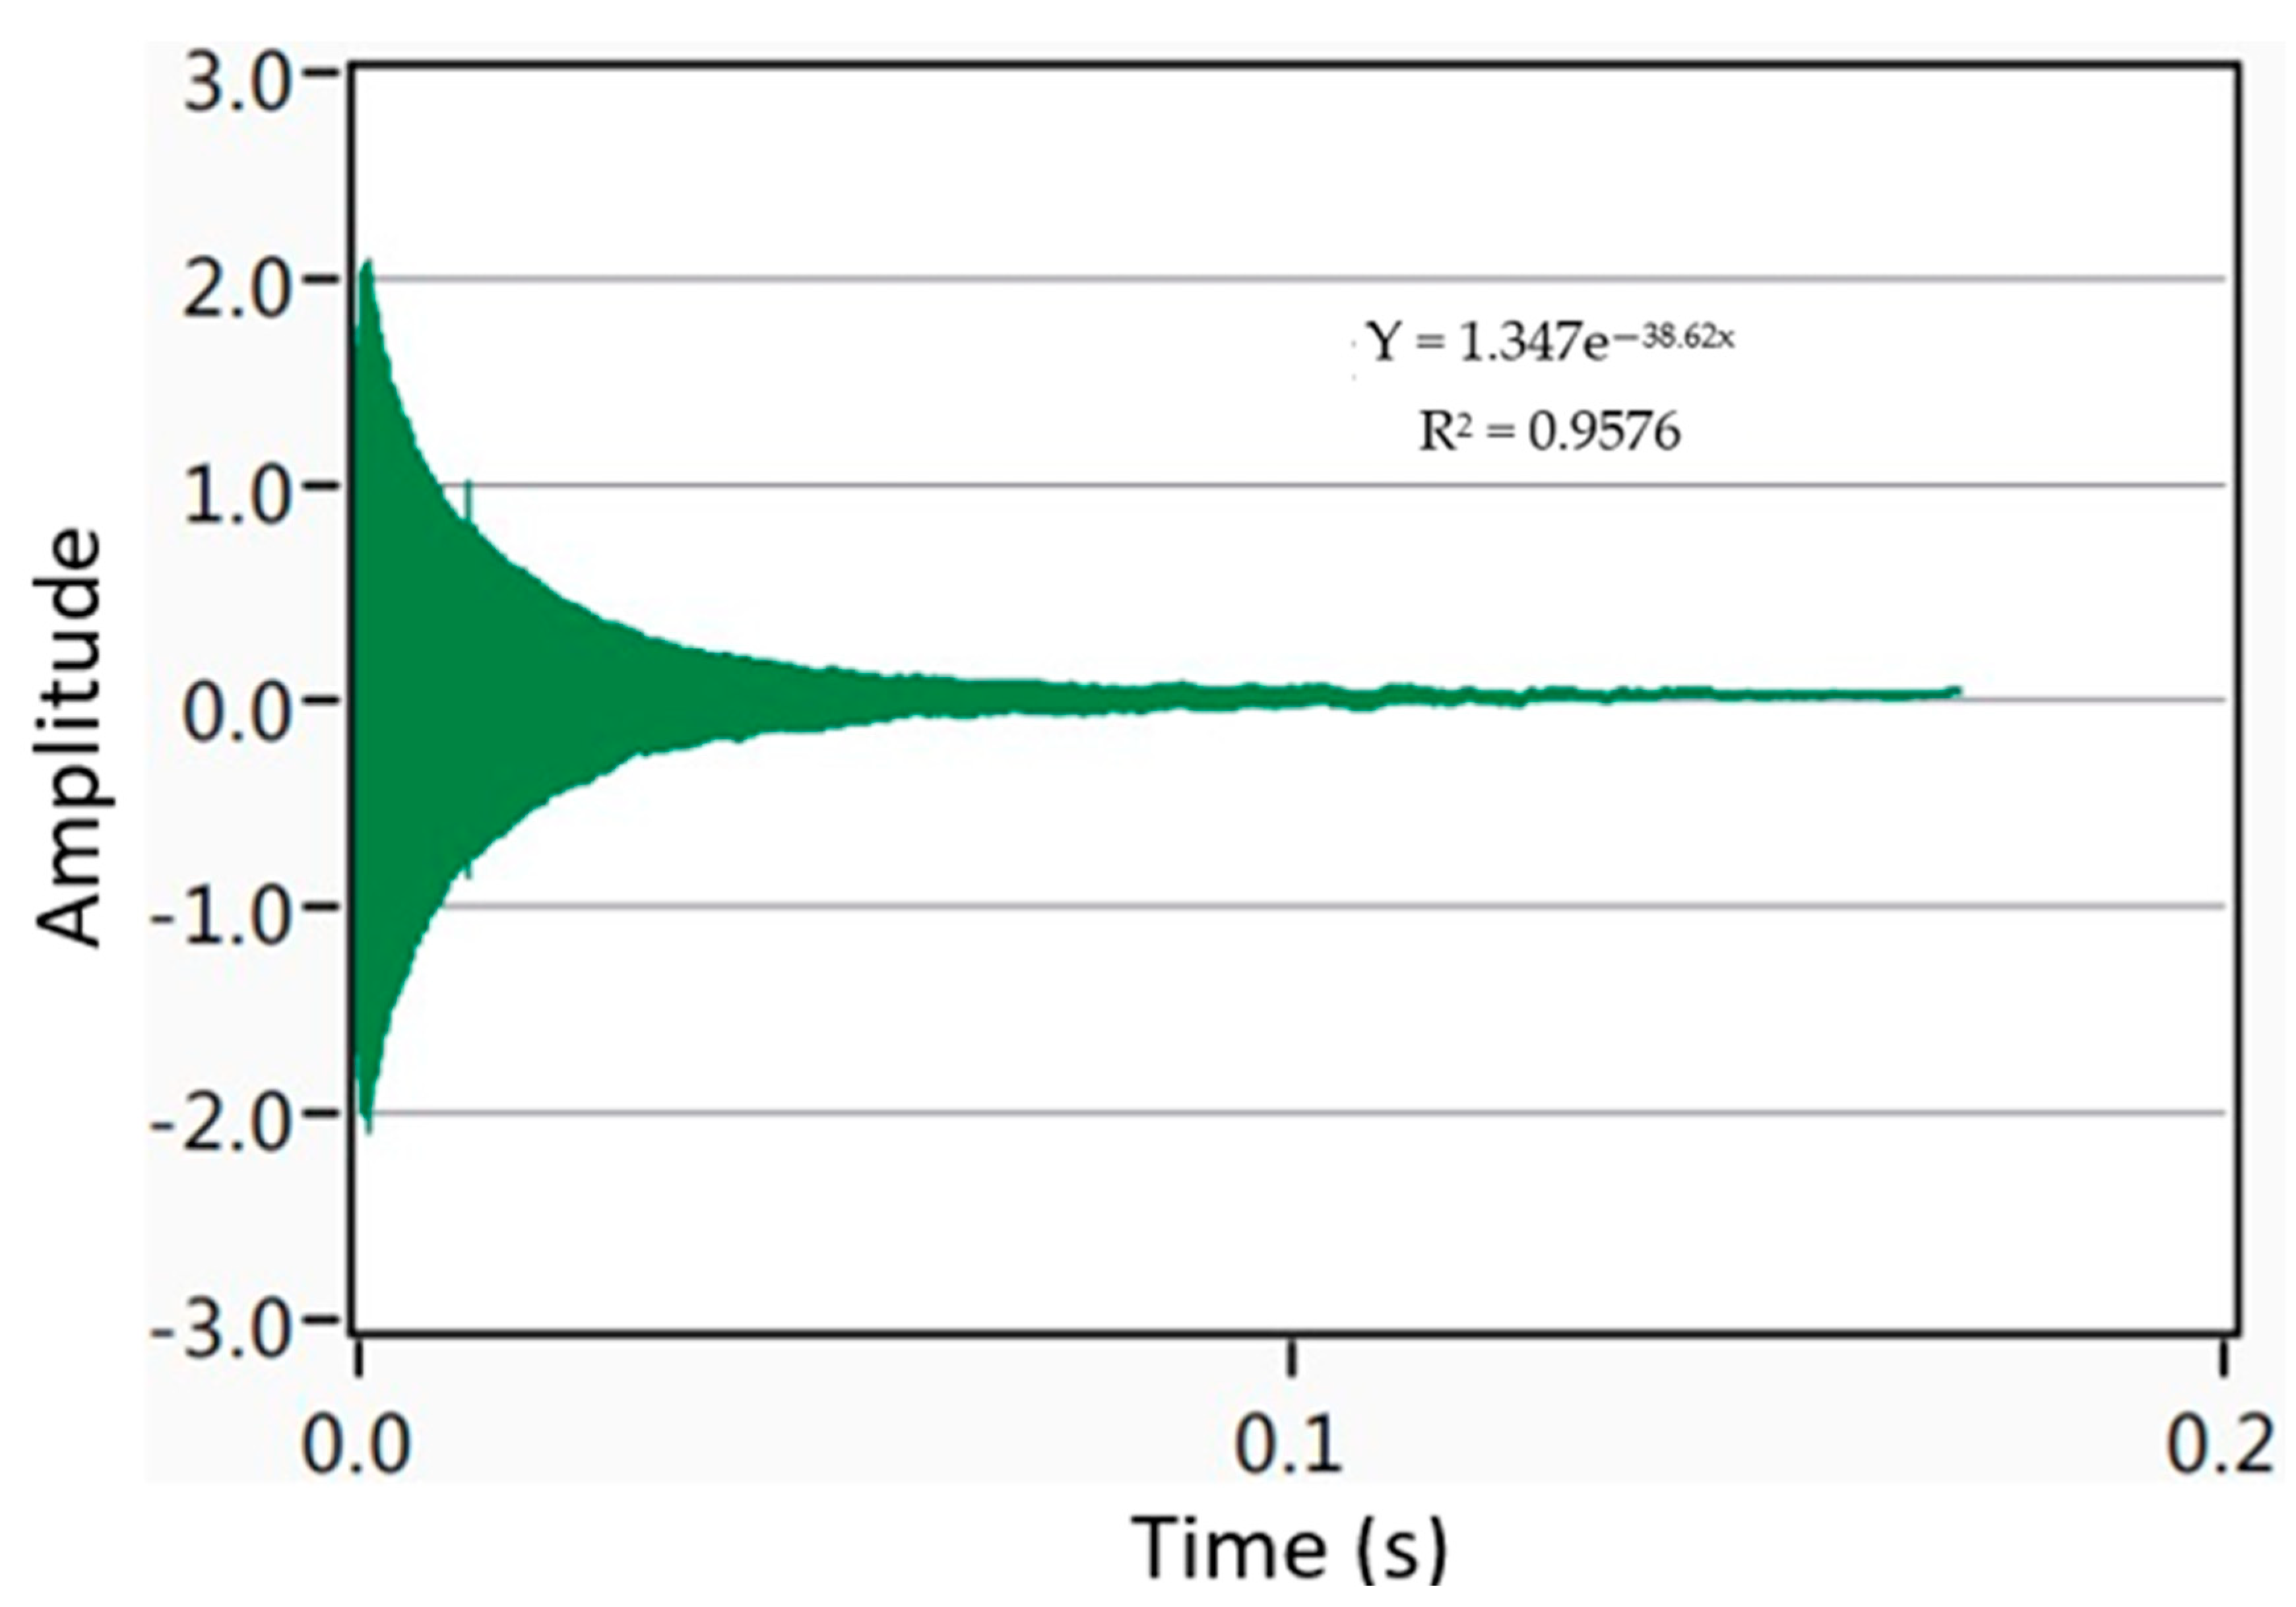
2.3.4. Damping Analysis
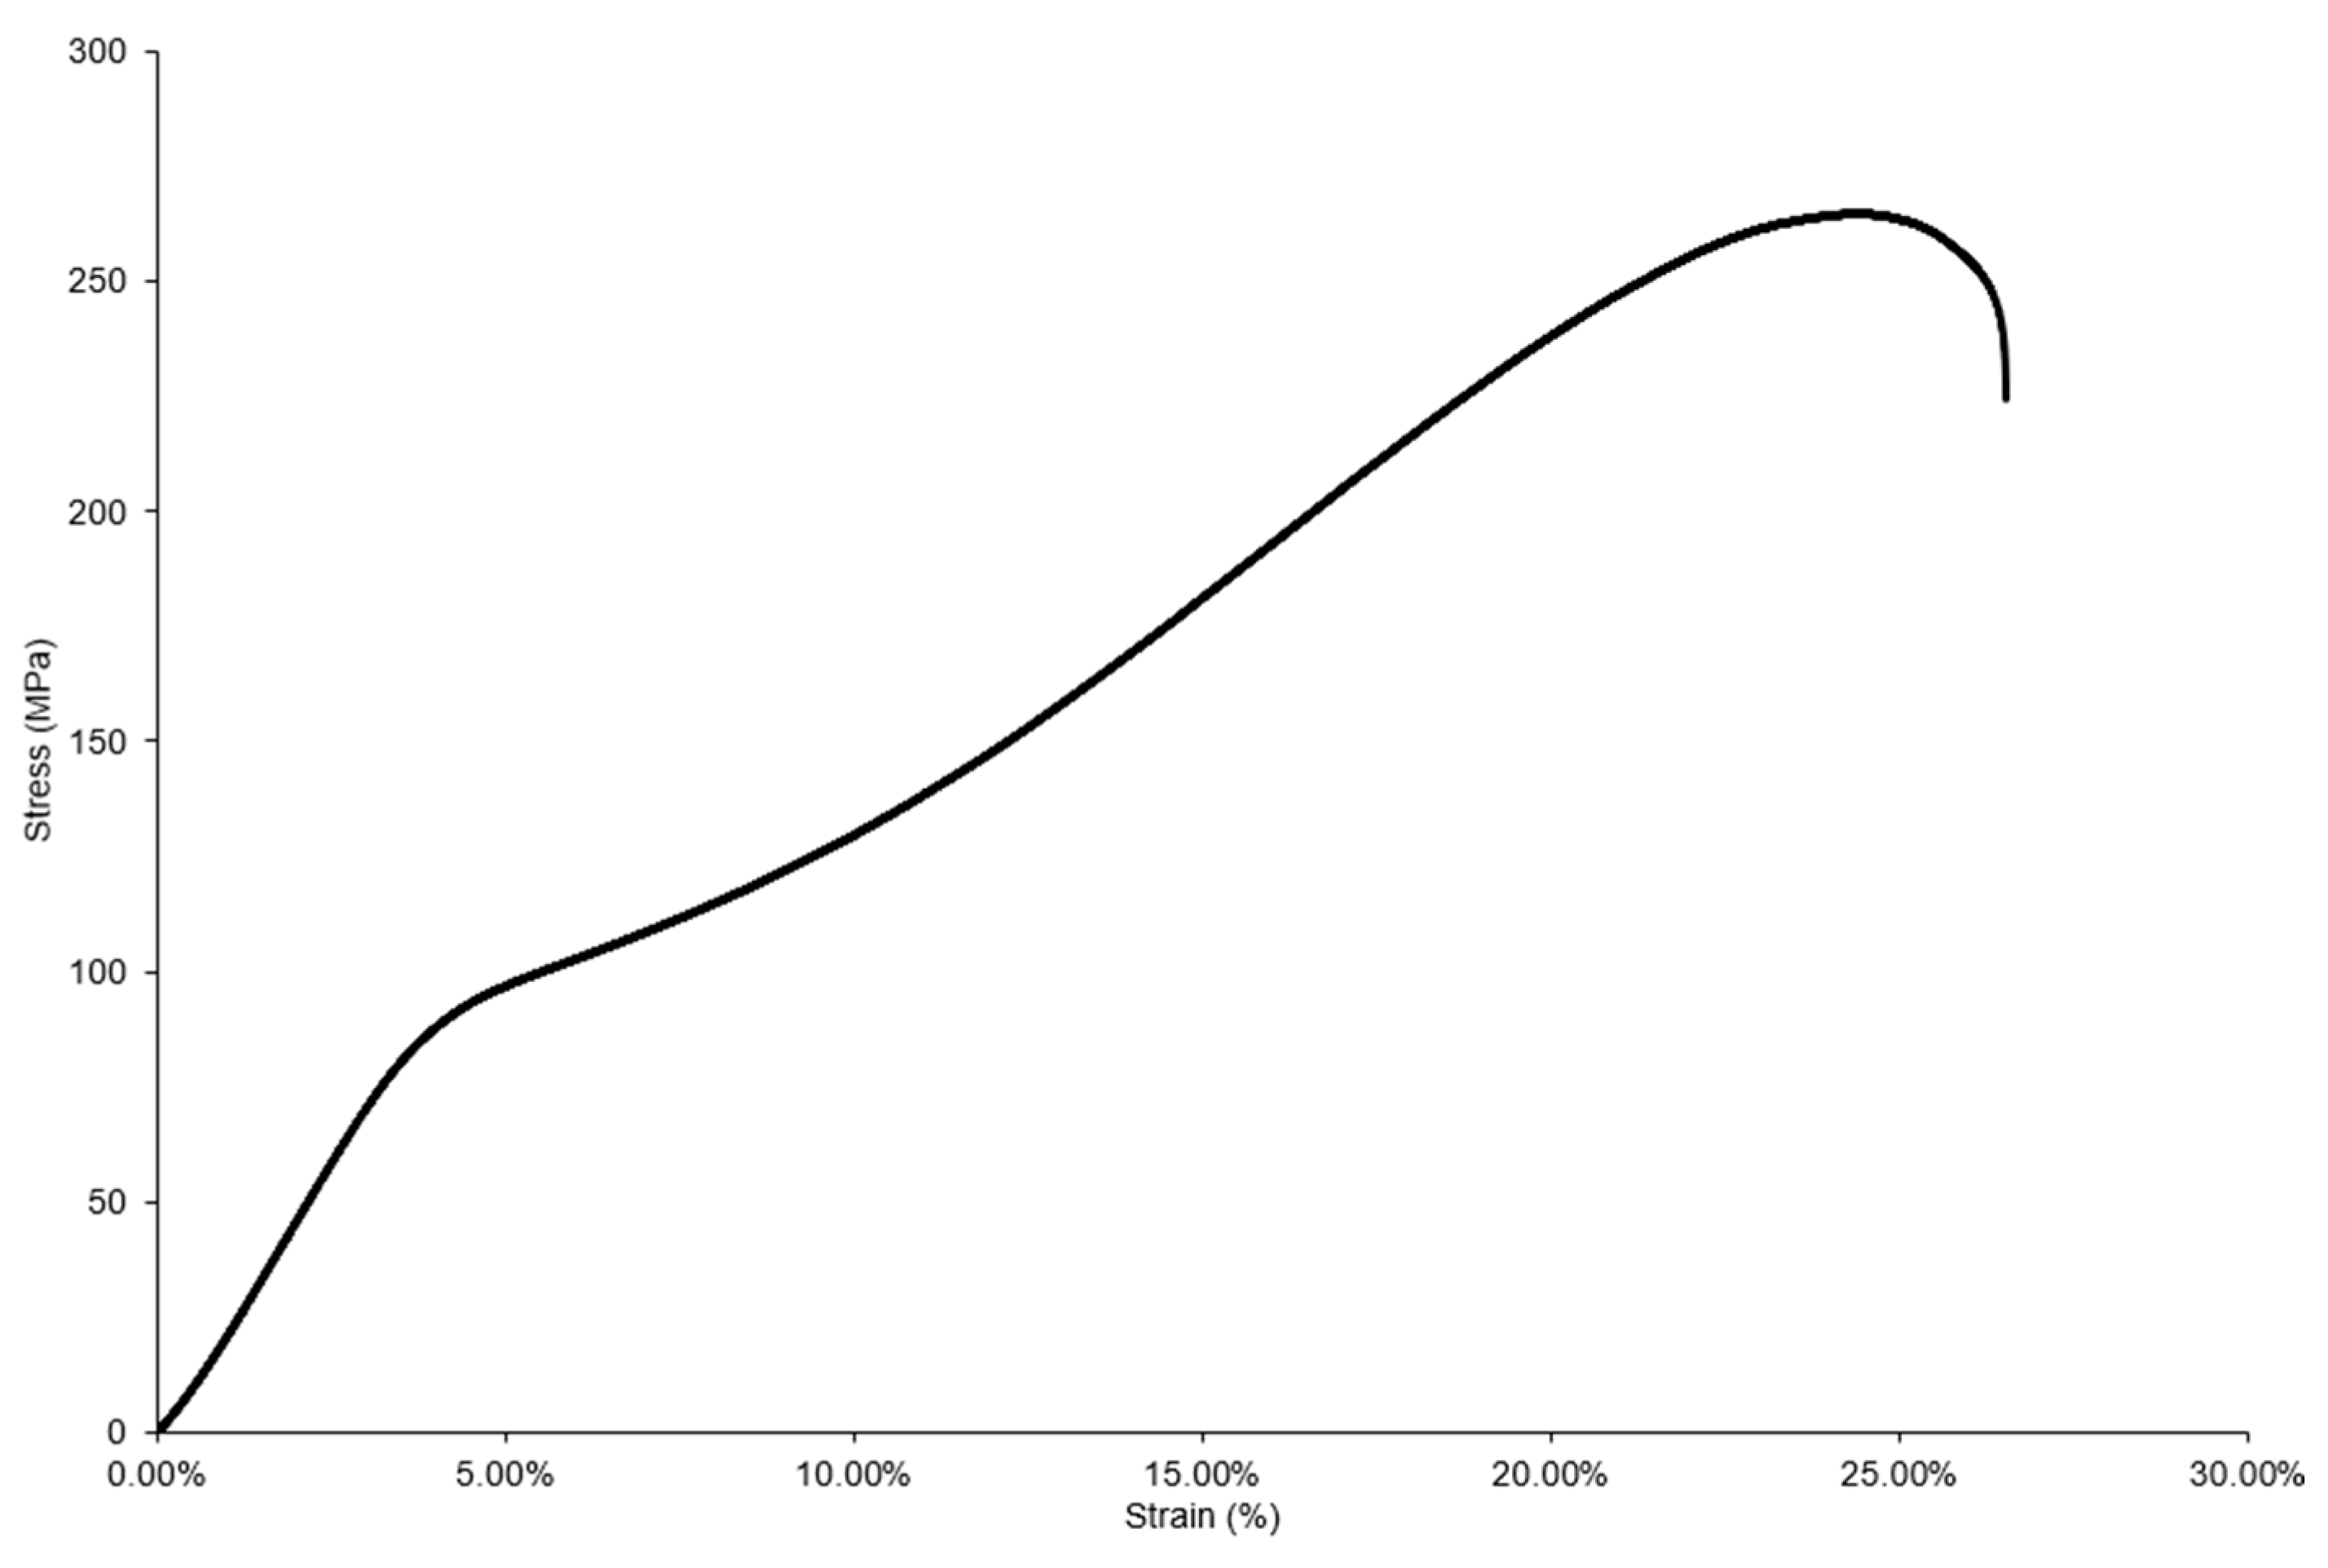
2.3.5. Mechanical Properties
2.3.6. Thermal Properties
2.3.7. Corrosion Response
3. Results
3.1. Synthesis
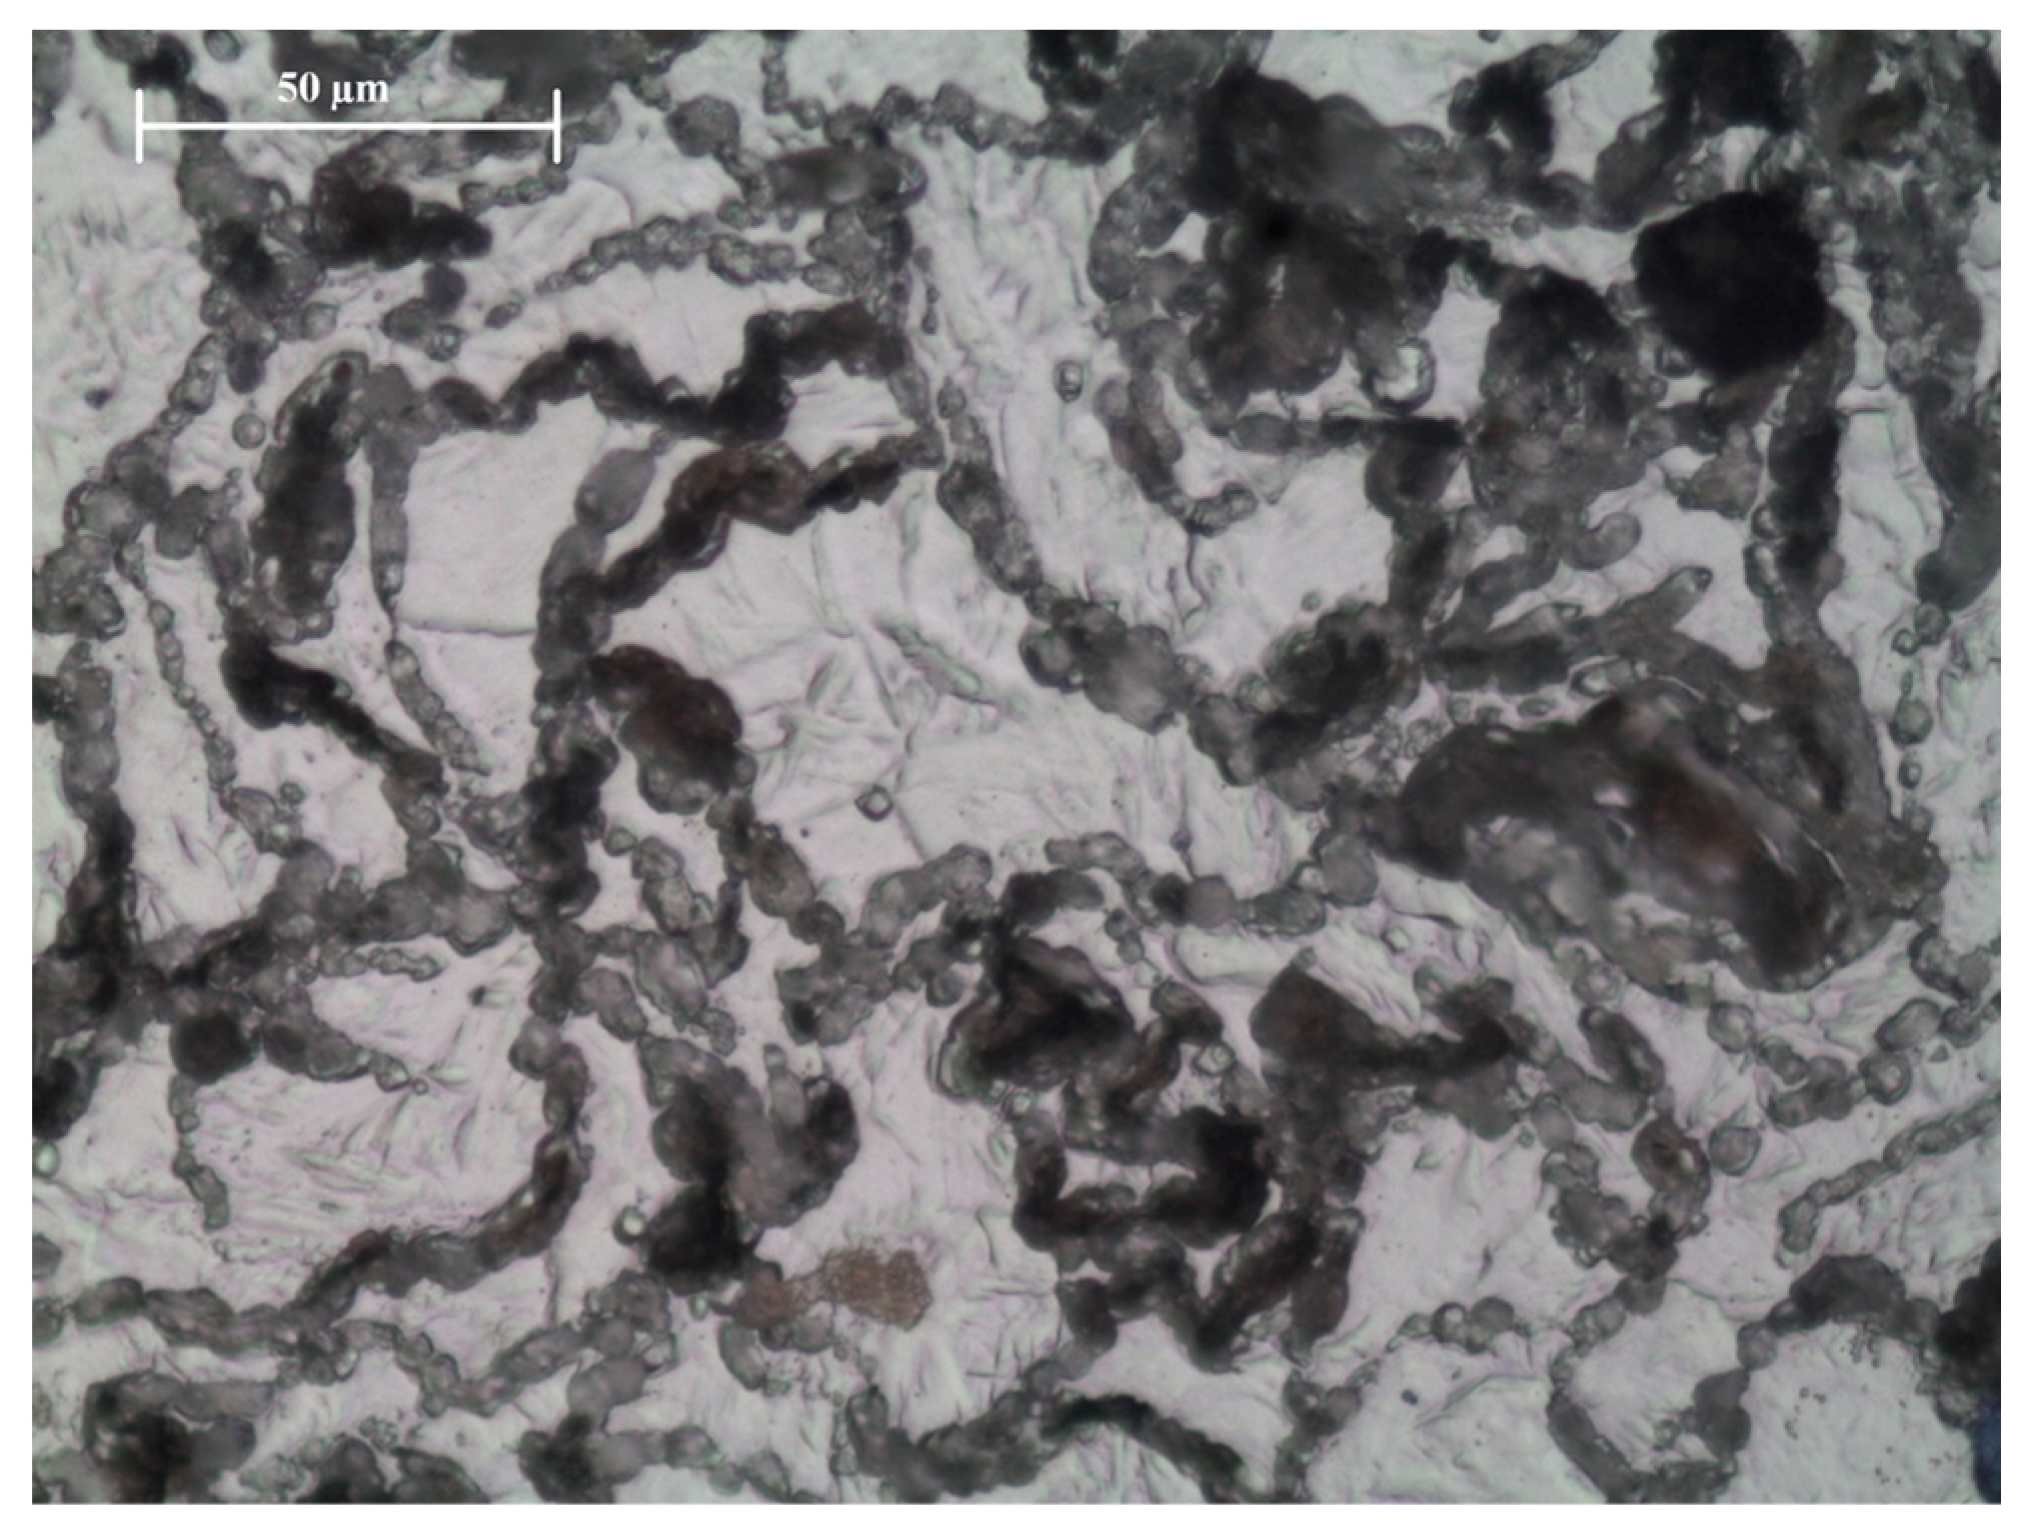
3.2. Microstructure
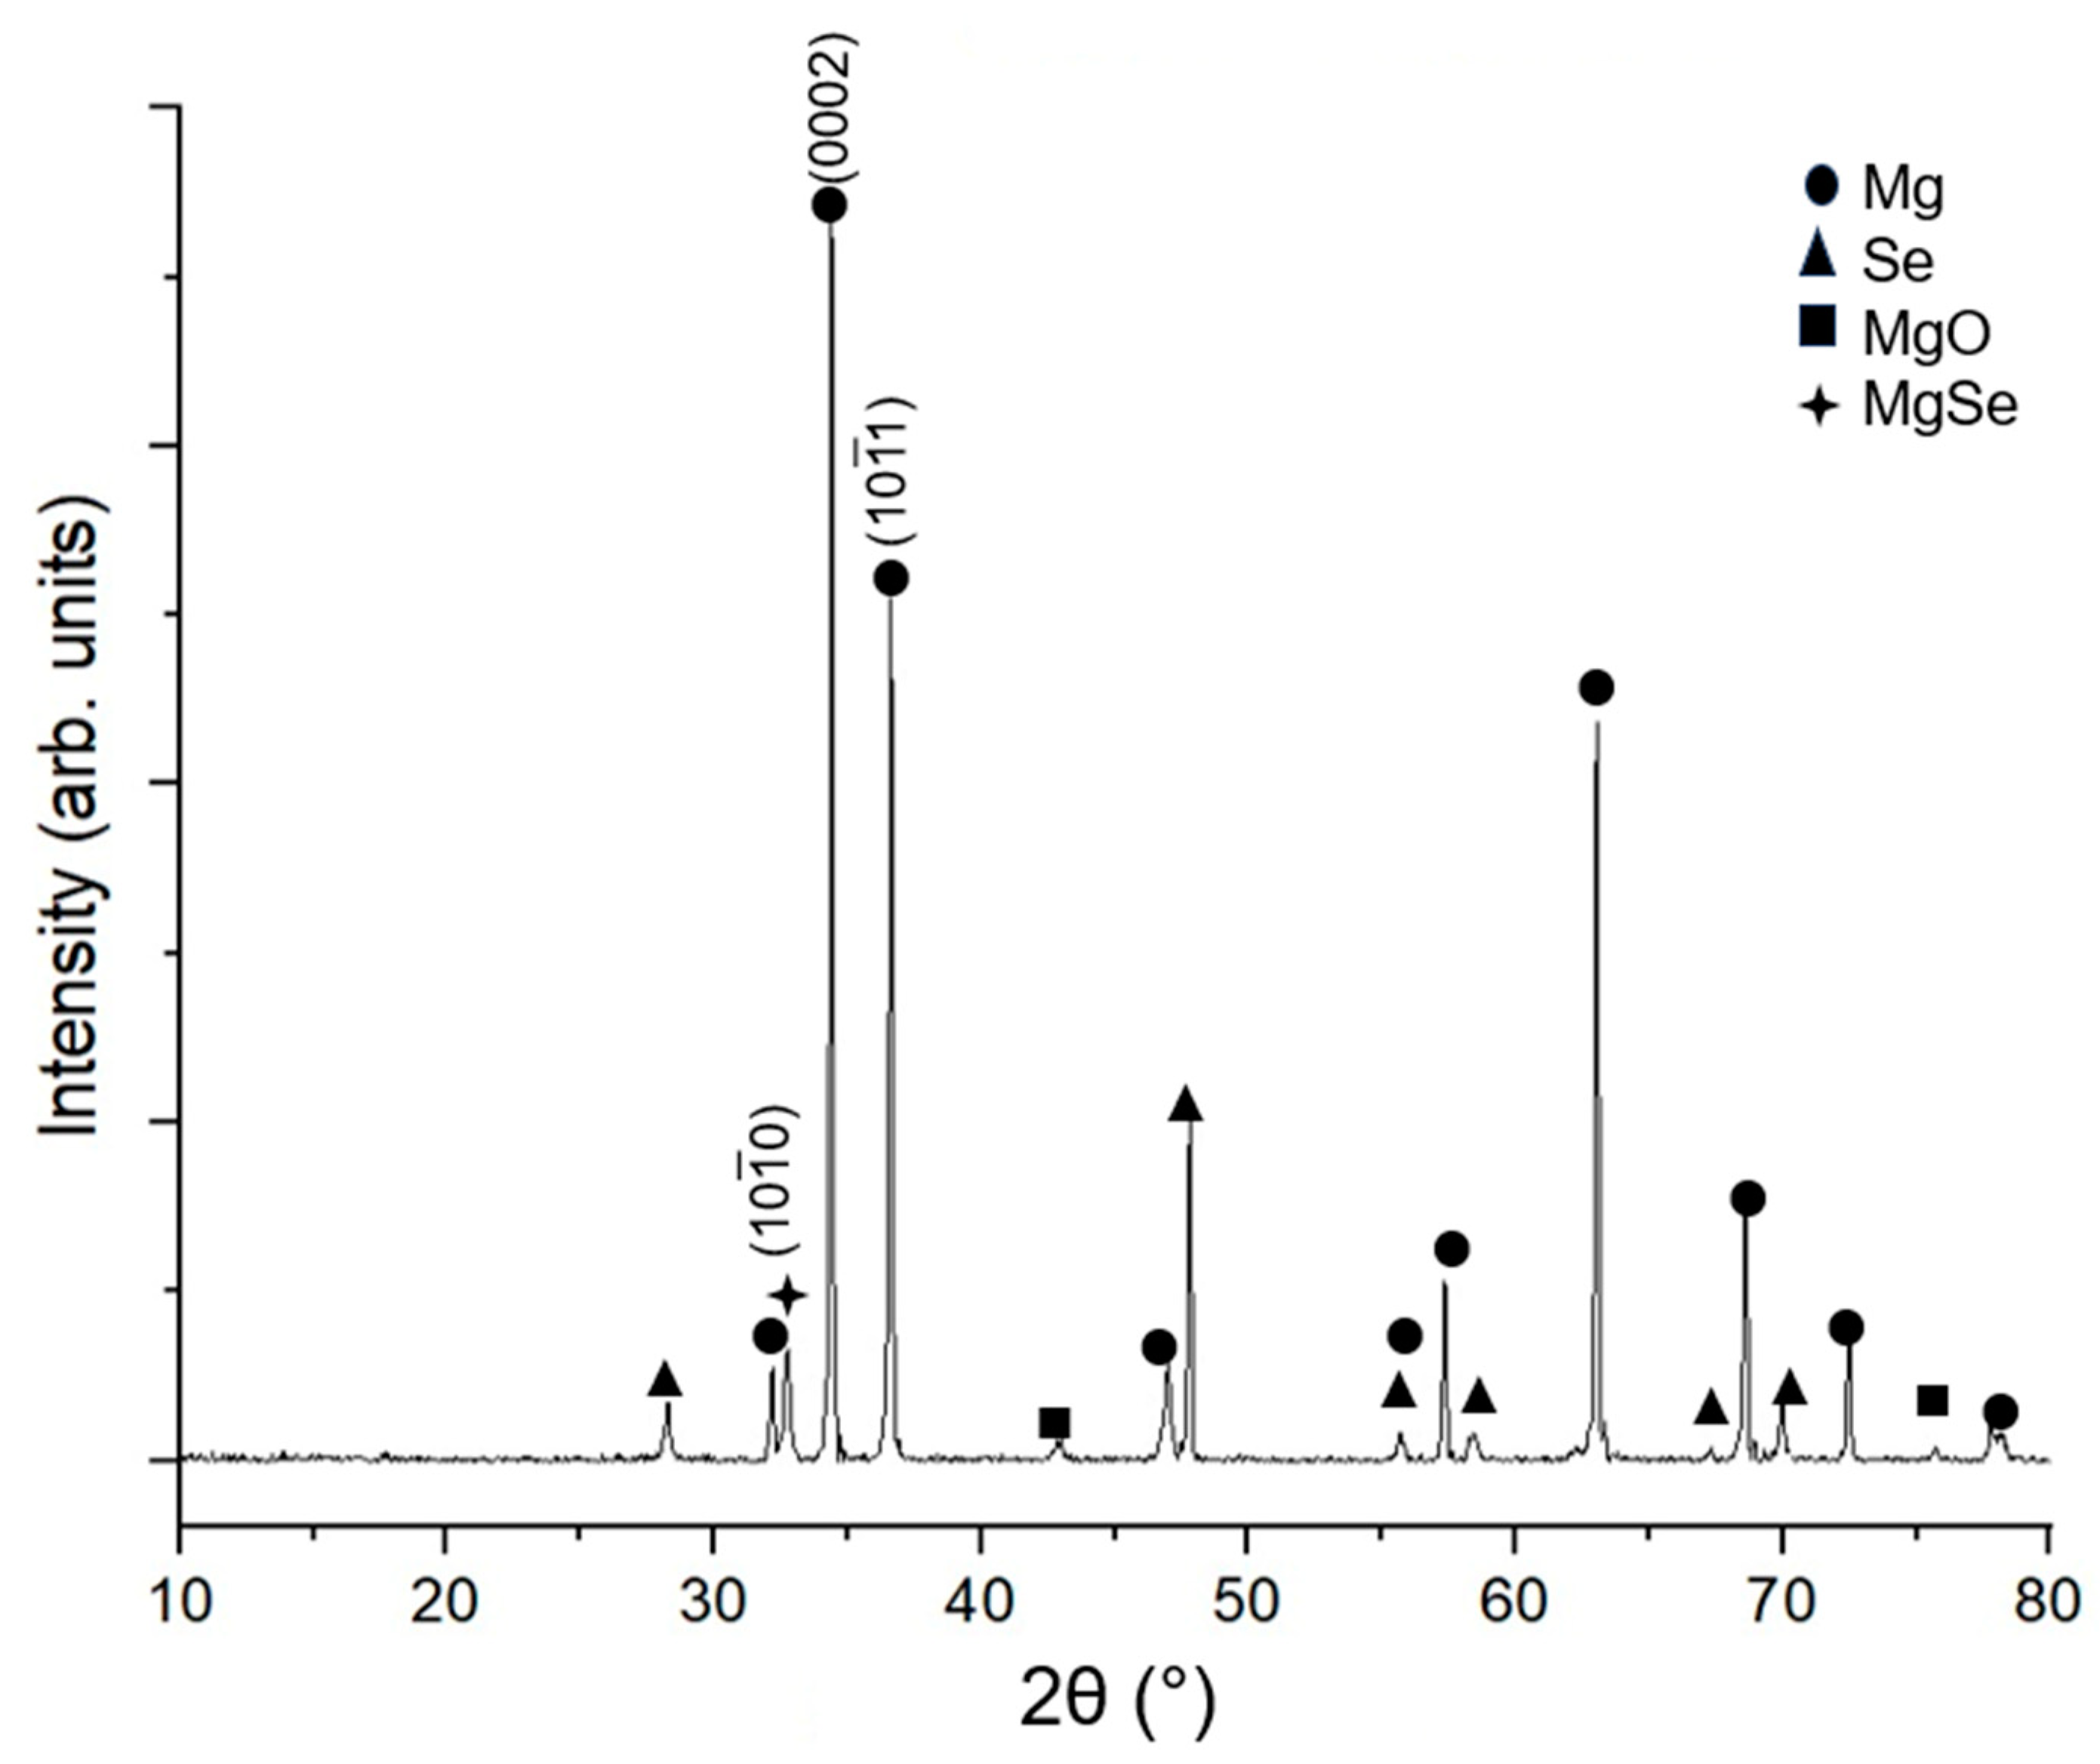
3.3. X-ray Diffraction
3.4. Density and Porosity
3.5. Damping Analysis
3.6. Mechanical Properties
3.6.1. Hardness
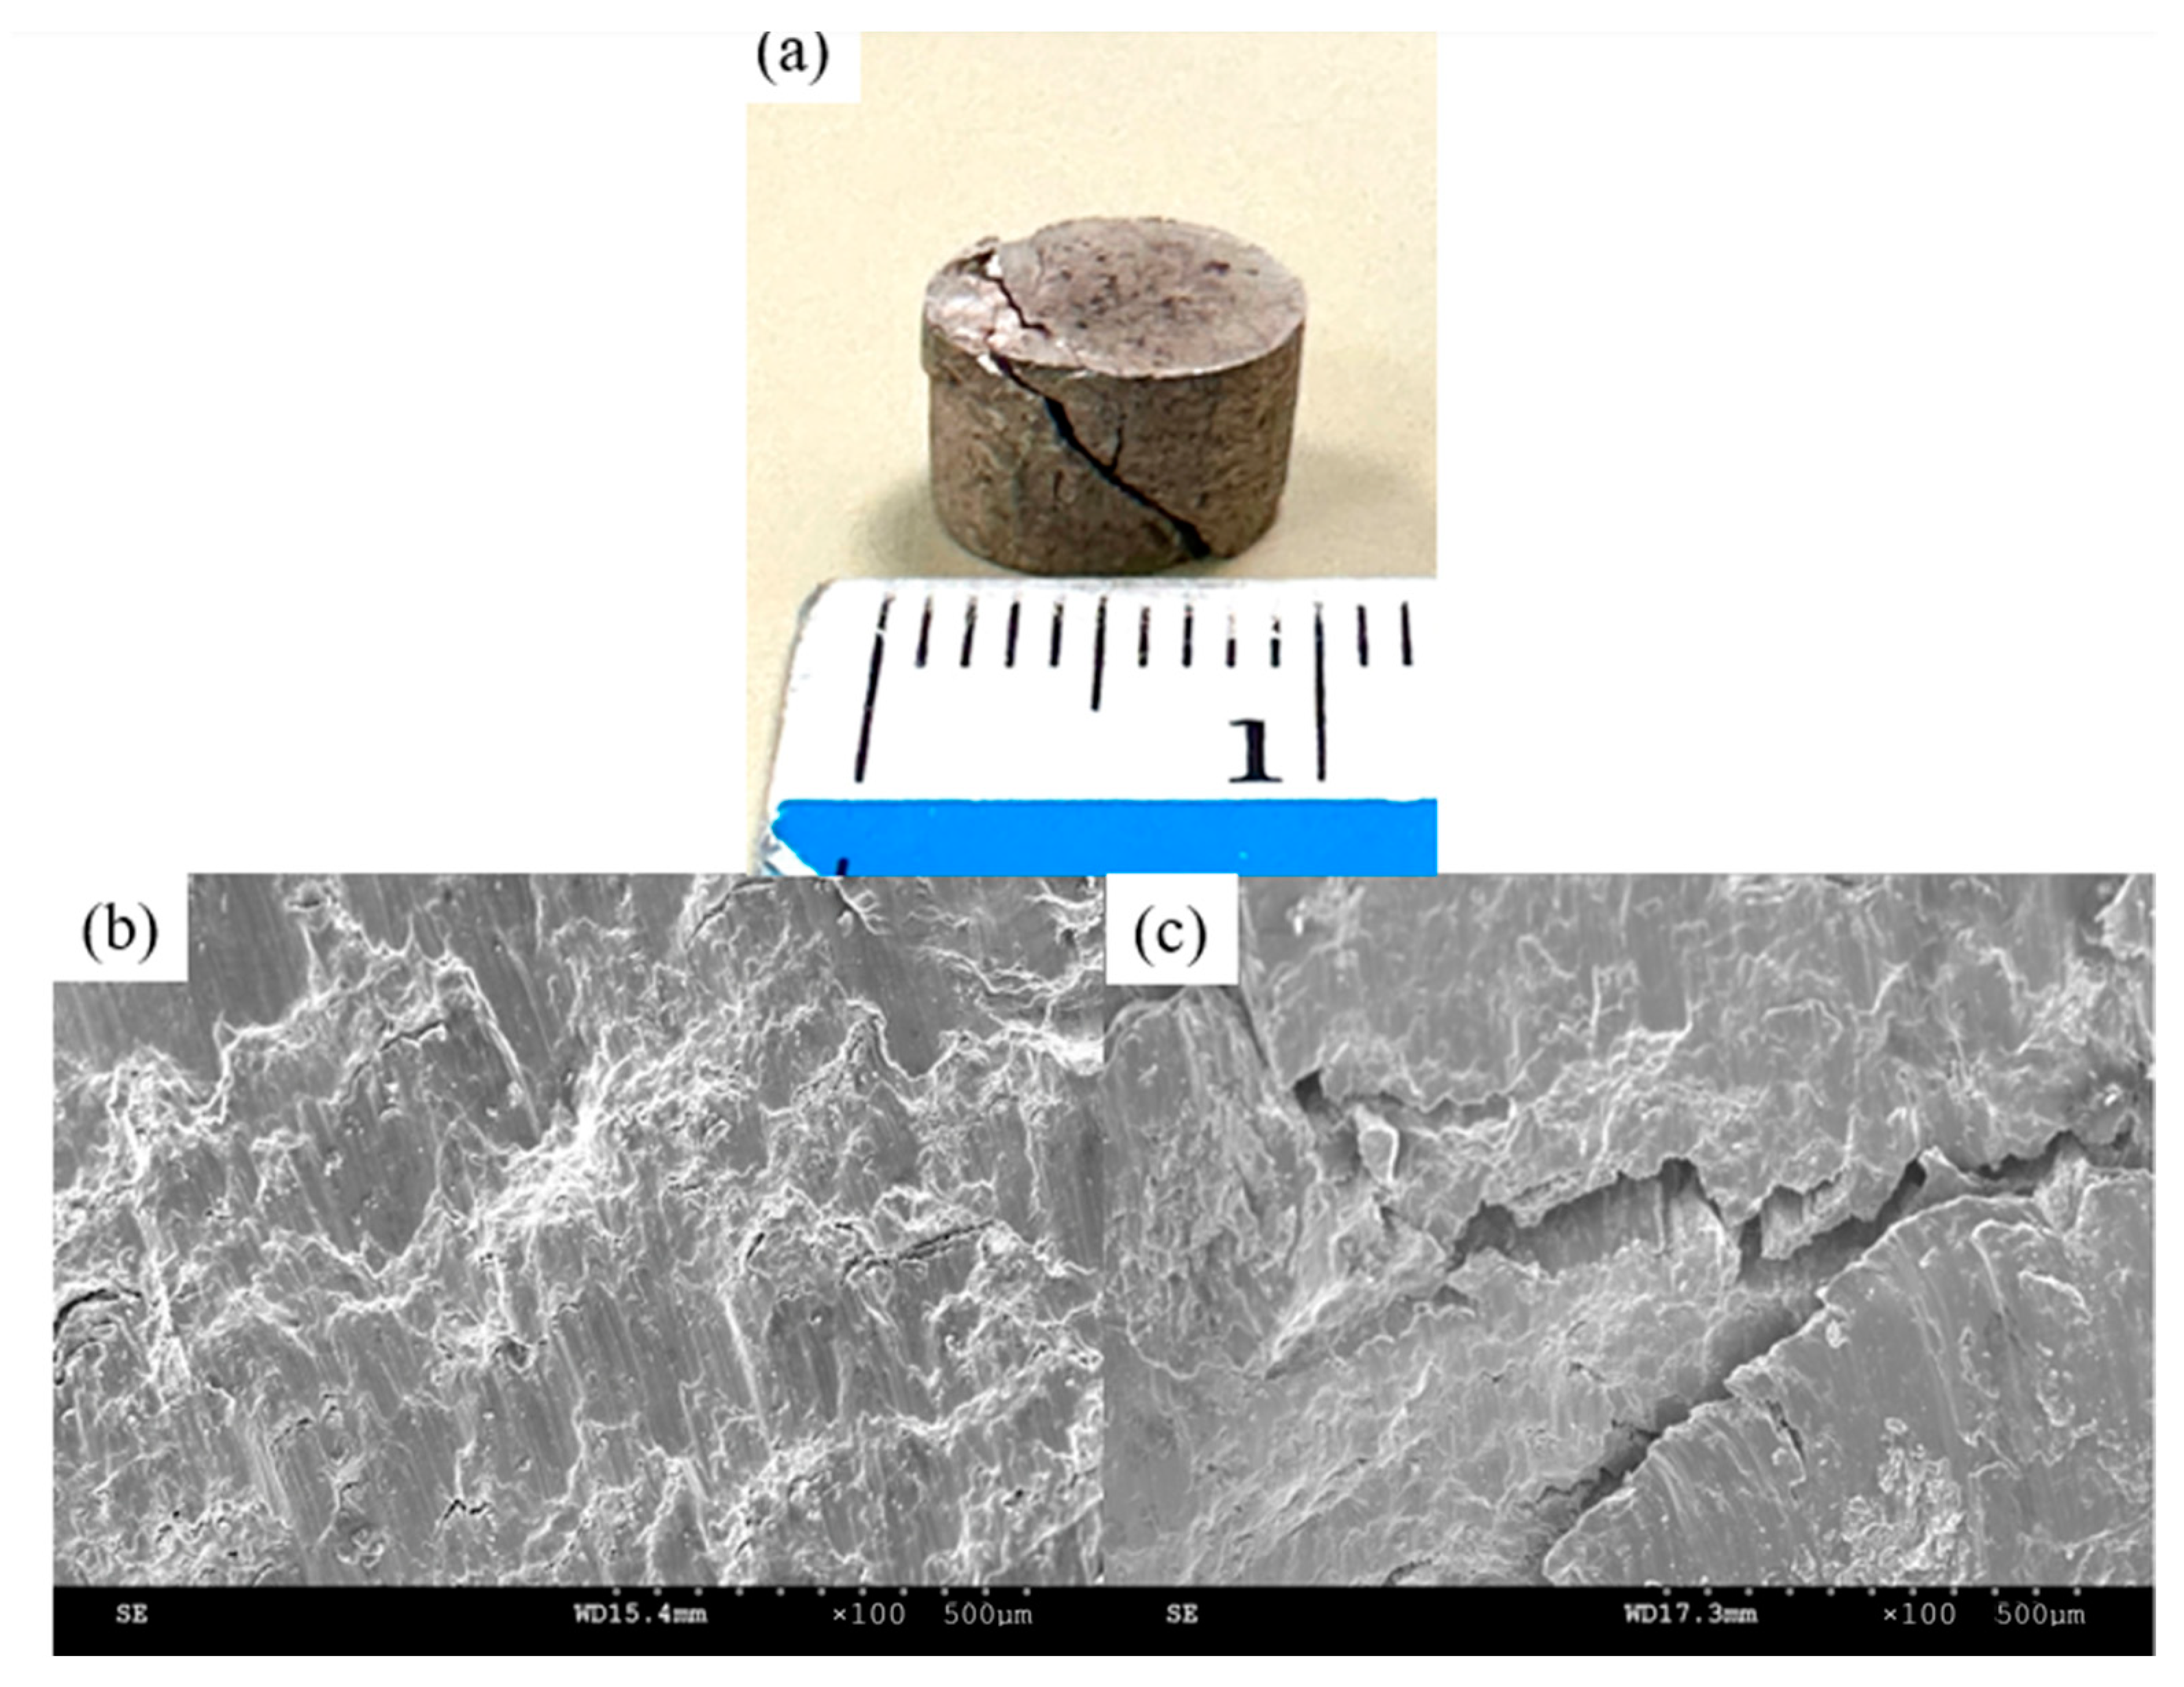
3.6.2. Compressive Properties
3.7. Thermal Properties
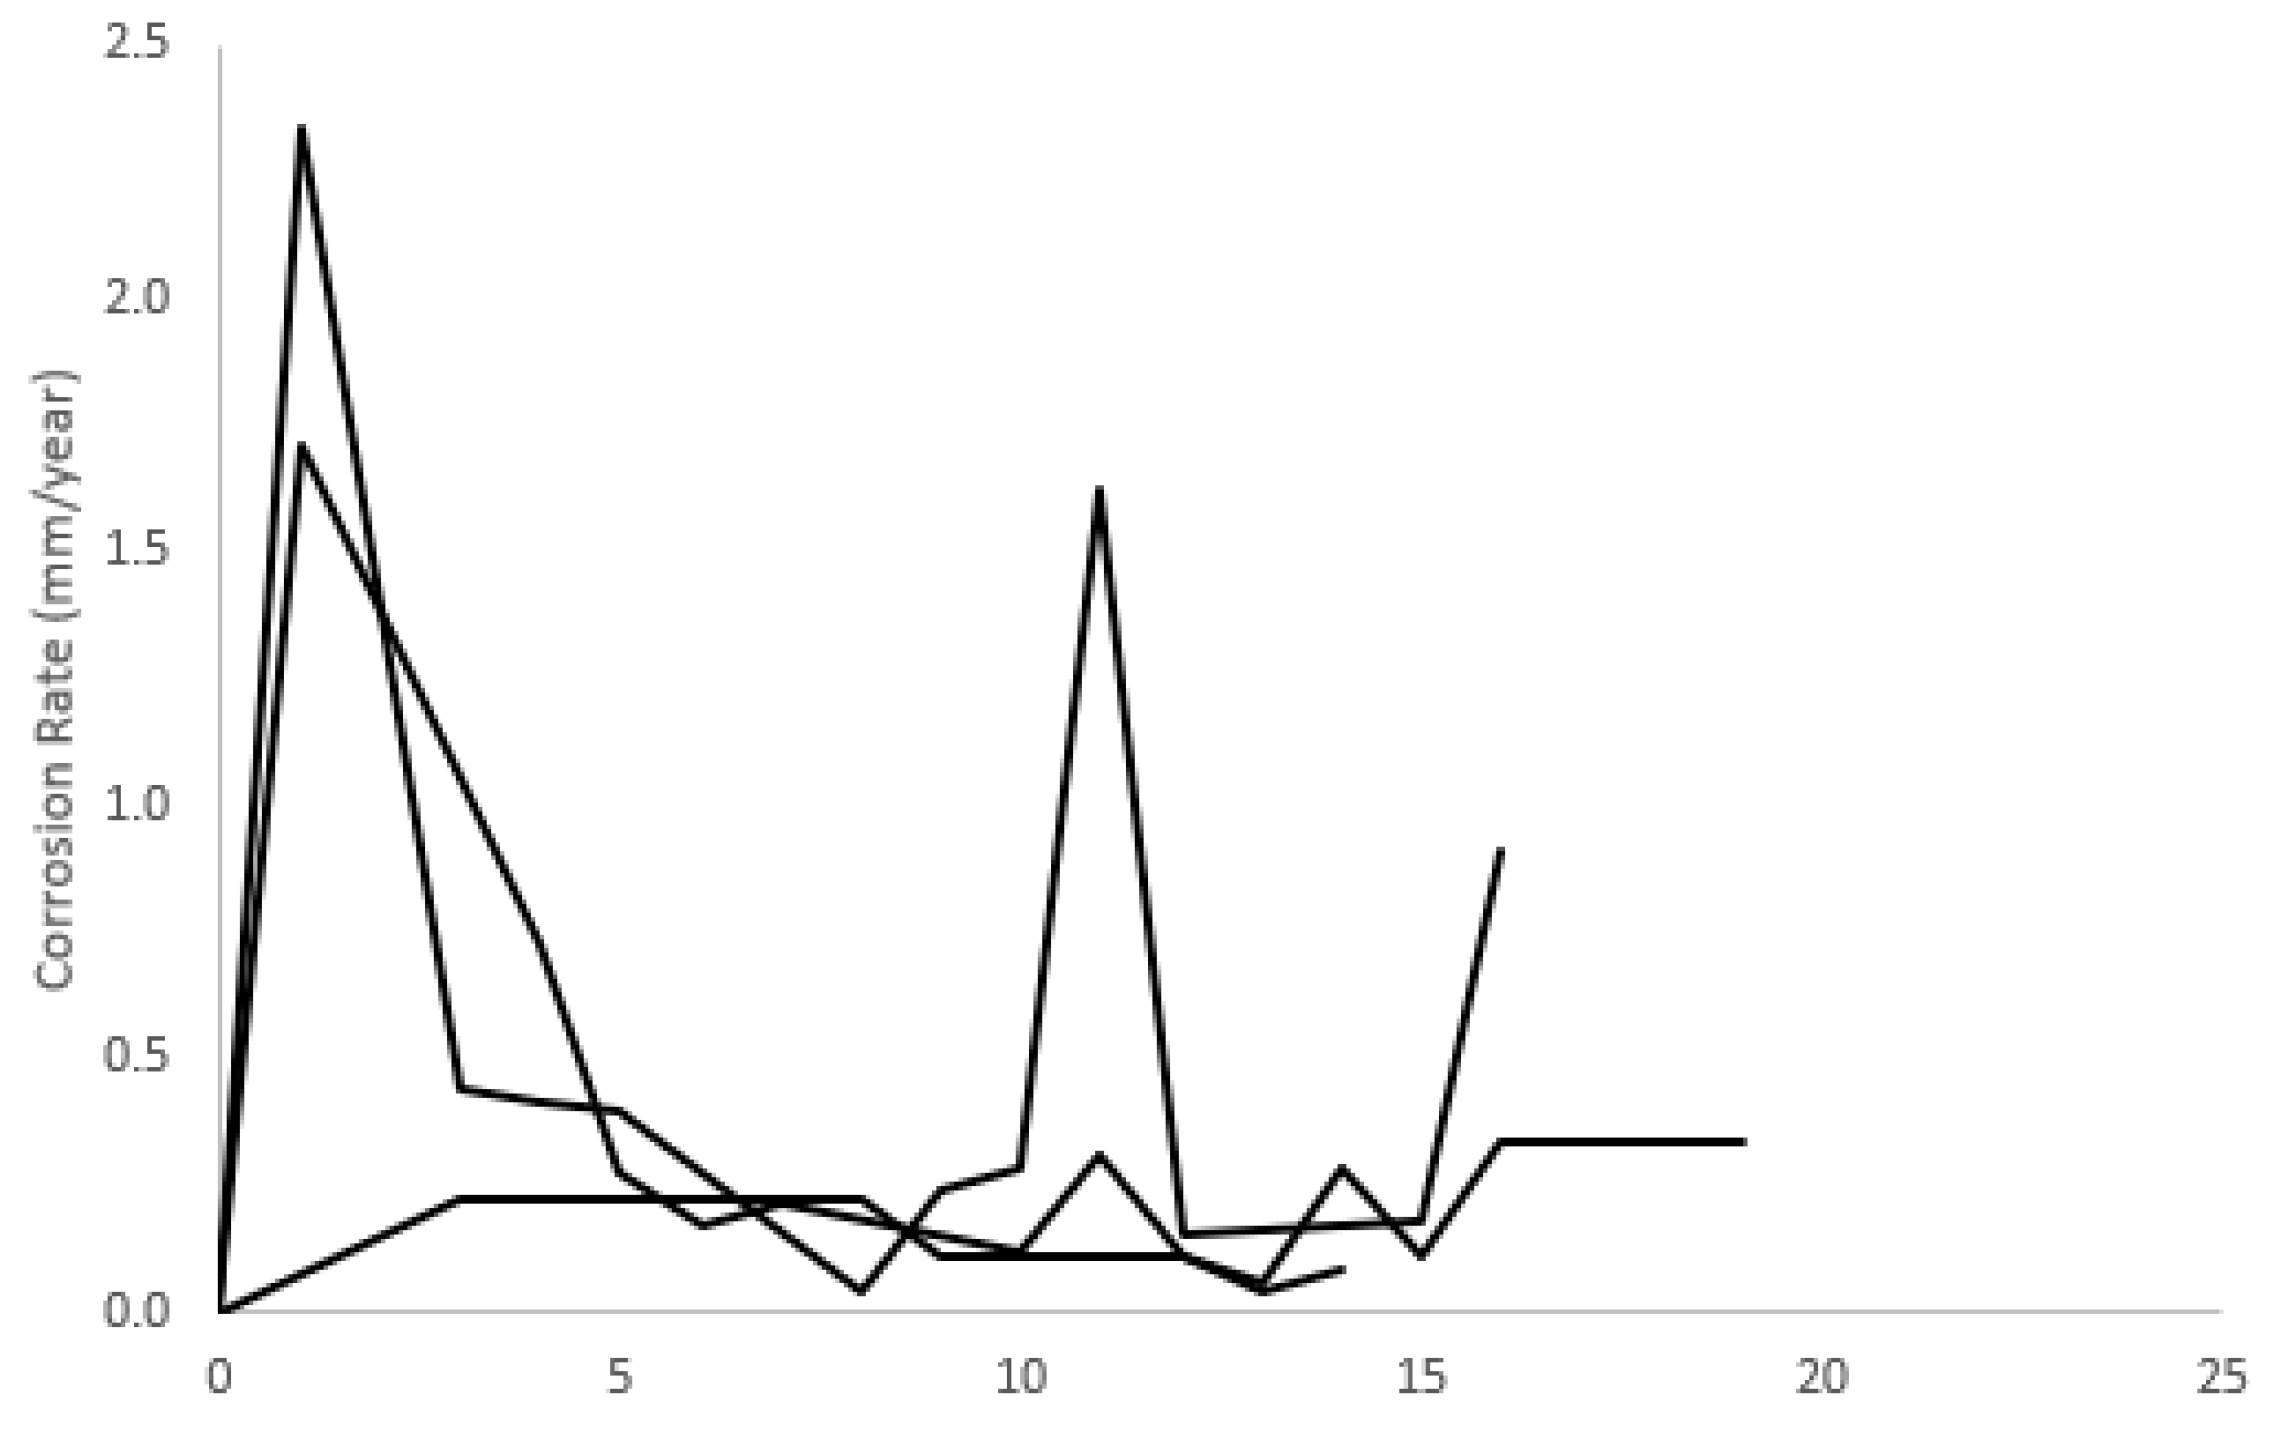
3.8. Corrosion Response
4. Discussion
4.1. Synthesis
4.2. Microstructure
4.3. X-ray Diffraction
4.4. Density and Porosity
4.5. Damping Analysis
4.6. Mechanical Properties
4.6.1. Hardness
4.6.2. Compressive Properties
4.7. Thermal Properties
4.8. Corrosion Response
5. Conclusions
- The resulting Mg-15Se material had a higher porosity (2.91%) when compared to pure magnesium (0.21%). This can be attributed to the partial loss of selenium primarily during the extrusion stage.
- The resulting Mg-15Se material exhibited a relatively stronger basal texture than that of pure Mg, and it also underwent significant grain refinement (74% smaller grain diameter than pure Mg).
- Mg-15Se had a superior damping capacity to pure Mg (76% increase).
- Mg-15Se had superior hardness (57% increase) as well as compression properties (21% increase for 0.2% yield strength, at least 50% increases for ultimate compressive strength, failure strain, and energy absorbed).
- The average corrosion rate for Mg-15Se is comparable with extruded pure Mg from multiple works, despite its high porosity, due to the high PBR of Se at 1.69, showcasing the lack of compromise in corrosion resistance whilst possessing a superior mechanical response.
- Thermal analysis also indicated that Mg-15Se is more ignition-resistant than pure Mg despite its much higher porosity.
- In this study, it was discovered that Se loss occurred during the extrusion stage; additional steps to reduce Se loss by use of a lower temperature in processing or further protective/containment measures is possible, but this would have to be studied to see if there is an adverse effect on the final material.
Author Contributions
Funding
Data Availability Statement
Acknowledgments
Conflicts of Interest
References
- Meenashisundaram, G.K.; Gupta, M. Emerging Environment Friendly, Magnesium-Based Composite Technology for Present and Future Generations. JOM 2016, 68, 1890–1901. [Google Scholar] [CrossRef]
- U.S. Geological Survey. Mineral commodity summaries 2023. In Mineral Commodity Summaries; U.S. Geological Survey: Reston, VA, USA, 2023; Report. Available online: http://pubs.er.usgs.gov/publication/mcs2023 (accessed on 3 January 2024).
- Gupta, S.; Parande, G.; Tun, K.S.; Gupta, M. Enhancing the Physical, Thermal, and Mechanical Responses of a Mg/2 wt.%CeO2 Nanocomposite Using Deep Cryogenic Treatment. Metals 2023, 13, 660. [Google Scholar] [CrossRef]
- Garcés, G.; Pérez, P.; Adeva, P. Effect of the extrusion texture on the mechanical behaviour of Mg–SiCp composites. Scr. Mater. 2005, 52, 615–619. [Google Scholar] [CrossRef]
- Garcés, G.; Rodríguez, M.; Pérez, P.; Adeva, P. Effect of volume fraction and particle size on the microstructure and plastic deformation of Mg–Y2O3 composites. Mater. Sci. Eng. A 2006, 419, 357–364. [Google Scholar] [CrossRef]
- Umeda, J.; Kawakami, M.; Kondoh, K.; Ayman, E.L.S.; Imai, H. Microstructural and mechanical properties of titanium particulate reinforced magnesium composite materials. Mater. Chem. Phys. 2010, 123, 649–657. [Google Scholar] [CrossRef]
- Goh, C.S.; Wei, J.; Lee, L.C.; Gupta, M. Development of novel carbon nanotube reinforced magnesium nanocomposites using the powder metallurgy technique. Nanotechnology 2006, 17, 7–12. [Google Scholar] [CrossRef]
- Jin, W.; Chu, P.K. Orthopedic Implants. In Encyclopedia of Biomedical Engineering; Narayan, R., Ed.; Elsevier: Oxford, UK, 2019; pp. 425–439. [Google Scholar]
- Chouirfa, H.; Bouloussa, H.; Migonney, V.; Falentin-Daudré, C. Review of titanium surface modification techniques and coatings for antibacterial applications. Acta Biomater. 2019, 83, 37–54. [Google Scholar] [CrossRef] [PubMed]
- Sadati, M.; Ghofrani, S.; Mehrizi, A.A. Investigation of porous cells interface on elastic property of orthopedic implants: Numerical and experimental studies. J. Mech. Behav. Biomed. Mater. 2021, 120, 104595. [Google Scholar] [CrossRef]
- Das, P.; Kumar, T.S.S.; Sahu, K.; Gollapudi, S. Corrosion, Stress Corrosion Cracking and Corrosion Fatigue Behavior of Magnesium Alloy Bioimplants. Corros. Rev. 2022, 40, 289–333. [Google Scholar] [CrossRef]
- Pacheco, K.A. Allergy to Surgical Implants. Clin. Rev. Allergy Immunol. 2019, 56, 72–85. [Google Scholar] [CrossRef]
- Charyeva, O.; Dakischew, O.; Sommer, U.; Heiss, C.; Schnettler, R.; Lips, K.S. Biocompatibility of magnesium implants in primary human reaming debris-derived cells stem cells in vitro. J. Orthop. Traumatol. 2016, 17, 63–73. [Google Scholar] [CrossRef]
- Sandler, G.; Nguyen, L.; Lam, L.; Manglick, M.P.; Soundappan, S.S.V.; Holland, A.J.A. Trampoline Trauma in Children: Is It Preventable? Pediatr. Emerg. Care 2011, 27, 1052–1056. [Google Scholar] [CrossRef] [PubMed]
- Wang, J.; Chen, M.; Zhang, Z.; Ma, L.; Chen, T. Selenium: From fluorescent probes to biomedical application. Coord. Chem. Rev. 2023, 493, 215278. [Google Scholar] [CrossRef]
- Huang, Y.; Su, E.; Ren, J.; Qu, X. The recent biological applications of selenium-based nanomaterials. Nano Today 2021, 38, 101205. [Google Scholar] [CrossRef]
- Rataan, A.O.; Geary, S.M.; Zakharia, Y.; Rustum, Y.M.; Salem, A.K. Potential Role of Selenium in the Treatment of Cancer and Viral Infections. Int. J. Mol. Sci. 2022, 23, 2215. (In English) [Google Scholar] [CrossRef]
- Kuršvietienė, L.; Mongirdienė, A.; Bernatonienė, J.; Šulinskienė, J.; Stanevičienė, I. Selenium Anticancer Properties and Impact on Cellular Redox Status. Antioxidants 2020, 9, 80. (In English) [Google Scholar] [CrossRef]
- Radomska, D.; Czarnomysy, R.; Radomski, D.; Bielawski, K. Selenium Compounds as Novel Potential Anticancer Agents. Int. J. Mol. Sci. 2021, 22, 1009. (In English) [Google Scholar] [CrossRef]
- Zhang, Q.; Qian, Z.-Y.; Zhou, P.-H.; Zhou, X.-l.; Zhang, D.-L.; He, N.; Zhang, J.; Liu, Y.-H.; Gu, Q. Effects of oral selenium and magnesium co-supplementation on lipid metabolism, antioxidative status, histopathological lesions, and related gene expression in rats fed a high-fat diet. Lipids Health Dis. 2018, 17, 165. [Google Scholar] [CrossRef]
- Ferro, C.; Florindo, H.F.; Santos, H.A. Selenium Nanoparticles for Biomedical Applications: From Development and Characterization to Therapeutics. Adv. Healthc. Mater. 2021, 10, 2100598. [Google Scholar] [CrossRef]
- Singh, I.B.; Singh, M.; Das, S. A comparative corrosion behavior of Mg, AZ31 and AZ91 alloys in 3.5% NaCl solution. J. Magnes. Alloys 2015, 3, 142–148. [Google Scholar] [CrossRef]
- Parande, G.; Manakari, V.; Meenashisundaram, G.K.; Gupta, M. Enhancing the hardness/compression/damping response of magnesium by reinforcing with biocompatible silica nanoparticulates. Int. J. Mater. Res. 2016, 107, 1091–1099. [Google Scholar] [CrossRef]
- Gates-Rector, S.; Blanton, T. The Powder Diffraction File: A quality materials characterization database. Powder Diffr. 2019, 34, 352–360. [Google Scholar] [CrossRef]
- Gates-Rector, S.; Blanton, T. PDF-4+ 2023. Available online: https://www.cambridge.org/core/journals/powder-diffraction/article/powder-diffraction-file-a-quality-materials-characterization-database/3C1FDF449C7A82A8E6FBC8F76342187A (accessed on 19 December 2023).
- Parande, G.; Manakari, V.; Meenashisundaram, G.K.; Gupta, M. Enhancing the tensile and ignition response of monolithic magnesium by reinforcing with silica nanoparticulates. J. Mater. Res. 2017, 32, 2169–2178. [Google Scholar] [CrossRef]
- Atrens, A.; Shi, Z.; Mehreen, S.U.; Johnston, S.; Song, G.; Chen, X.; Pan, F. Review of Mg alloy corrosion rates. J. Magnes. Alloys 2020, 8, 989–998. [Google Scholar] [CrossRef]
- Dvorský, D.; Kubásek, J.; Voňavková, I.; Vojtěch, D. Structure, mechanical and corrosion properties of extruded Mg-Nd-Zn, Mg-Y-Zn and Mg-Y-Nd alloys. Mater. Sci. Technol. 2019, 35, 520–529. [Google Scholar] [CrossRef]
- Jia, G.; Chen, C.; Zhang, J.; Wang, Y.; Yue, R.; Luthringer-Feyerabend, B.J.C.; Willumeit-Roemer, R.; Zhang, H.; Xiong, M.; Huang, H.; et al. In vitro degradation behavior of Mg scaffolds with three-dimensional interconnected porous structures for bone tissue engineering. Corros. Sci. 2018, 144, 301–312. [Google Scholar] [CrossRef]
- Turan, M.E.; Sun, Y.; Aydin, F.; Zengin, H.; Turen, Y.; Ahlatci, H. Effects of carbonaceous reinforcements on microstructure and corrosion properties of magnesium matrix composites. Mater. Chem. Phys. 2018, 218, 182–188. [Google Scholar] [CrossRef]
- Doherty, R.D.; Hughes, D.A.; Humphreys, F.J.; Jonas, J.J.; Jensen, D.J.; Kassner, M.E.; King, W.E.; McNelley, T.R.; McQueen, H.J.; Rollett, A.D. Current issues in recrystallization: A review. Mater. Sci. Eng. A 1997, 238, 219–274. [Google Scholar] [CrossRef]
- Van Aken, D.C.; Krajewski, P.E.; Vyletel, G.M.; Allison, J.E.; Jones, J.W. Recrystallization and grain growth phenomena in a particle-reinforced aluminum composite. Metall. Mater. Trans. A 1995, 26, 1395–1405. [Google Scholar] [CrossRef]
- Nayeb-Hashemi, A.A.; Clark, J.B. The Mg−Se (Magnesium-Selenium) system. J. Phase Equilibria 1987, 8, 118–119. [Google Scholar] [CrossRef]
- Nie, J.F.; Shin, K.S.; Zeng, Z.R. Microstructure, Deformation, and Property of Wrought Magnesium Alloys. Metall. Mater. Trans. A 2020, 51, 6045–6109. [Google Scholar] [CrossRef]
- Johanes, M.; Gupta, M. An Investigation into the Potential of Turning Induced Deformation Technique for Developing Porous Magnesium and Mg-SiO2 Nanocomposite. Materials 2023, 16, 2463. [Google Scholar] [CrossRef]
- Avci, U.; Güleç, A. Effect of Different Sintering Temperatures on Microstructure and Mechanical Properties for Pure Al Material Produced by Powder Metallurgy. El-Cezeri J. Sci. Eng. 2021, 8, 462–470. [Google Scholar]
- Wahi, A.; Muhamad, N.; Sulong, A.B.; Ahmad, R.N. Effect of Sintering Temperature on Density, Hardness and Strength of MIM Co30Cr6Mo Biomedical Alloy. J. Jpn. Soc. Powder Powder Metall. 2016, 63, 434–437. [Google Scholar] [CrossRef]
- American Elements. Selenium Metal. American Elements. Available online: https://www.americanelements.com/selenium-metal-7782-49-2. (accessed on 3 January 2024).
- Mirzaali, M.J.; Schwiedrzik, J.J.; Thaiwichai, S.; Best, J.P.; Michler, J.; Zysset, P.K.; Wolfram, U. Mechanical properties of cortical bone and their relationships with age, gender, composition and microindentation properties in the elderly. Bone 2016, 93, 196–211. [Google Scholar] [CrossRef]
- Rho, J.-Y.; Tsui, T.Y.; Pharr, G.M. Elastic properties of human cortical and trabecular lamellar bone measured by nanoindentation. Biomaterials 1997, 18, 1325–1330. [Google Scholar] [CrossRef]
- Xie, Z.-K.; Tane, M.; Hyun, S.-K.; Okuda, Y.; Nakajima, H. Vibration–damping capacity of lotus-type porous magnesium. Mater. Sci. Eng. A 2006, 417, 129–133. [Google Scholar] [CrossRef]
- Li, B.; Lavernia, E.J. Spray Forming of MMCs. In Comprehensive Composite Materials, 1st ed.; Kelly, A., Zweben, C., Eds.; Elsevier: Amsterdam, The Netherlands, 2000; Volume 3, pp. 617–653. [Google Scholar]
- Taha, A.S.; Hammad, F.H. Application of the Hall-Petch Relation to Microhardness Measurements on Al, Cu, Al-MD 105, and Al-Cu Alloys. Phys. Status Solidi (A) 1990, 119, 455–462. [Google Scholar] [CrossRef]
- Meenashisundaram, G.K.; Nai, M.H.; Gupta, M. Effects of Primary Processing Techniques and Significance of Hall-Petch Strengthening on the Mechanical Response of Magnesium Matrix Composites Containing TiO2 Nanoparticulates. Nanomaterials 2015, 5, 1256–1283. [Google Scholar] [CrossRef]
- Yu, H.; Xin, Y.; Wang, M.; Liu, Q. Hall-Petch relationship in Mg alloys: A review. J. Mater. Sci. Technol. 2018, 34, 248–256. [Google Scholar] [CrossRef]
- Wang, Y.; Choo, H. Influence of texture on Hall–Petch relationships in an Mg alloy. Acta Mater. 2014, 81, 83–97. [Google Scholar] [CrossRef]
- Ross, R.B. Selenium Se. In Metallic Materials Specification Handbook; Ross, R.B., Ed.; Springer US: Boston, MA, USA, 1992; pp. 282–283. [Google Scholar]
- ChemicalBook Inc. Magnesium Selenide. ChemicalBook. Available online: https://www.chemicalbook.com/ChemicalProductProperty_EN_CB6937531.htm (accessed on 26 December 2023).
- Olin, Å.; Noläng, B.I.; Öhman, L.; Osadchii, E.G.; Rosén, E. Chemical Thermodynamics of Selenium; Elsevier: Amsterdam, The Netherlands, 2005. [Google Scholar]
- Mills, K.C. Thermodynamic Data for Inorganic Sulphides, Selenides and Tellurides; John Wiley & Sons, Inc: Hoboken, NJ, USA, 1974. [Google Scholar]
- Syvertsen, M. Oxide Skin Strength on Molten AA5XXX Aluminum Alloy—Effect of Beryllium and Alternatives. In Light Metals 2017; Springer International Publishing: Cham, Switzerland, 2017; pp. 1451–1455. [Google Scholar]


| Raw Material | Supplier | Purity | Density (g/cc) |
|---|---|---|---|
| Magnesium Powder, 60–300 µm | Merck | ≥98.5% | 1.738 |
| Selenium Powder, 200 mesh (~74 µm) | Alfa Aesar | 99.999% | 4.28 |
| Raw Material | Average Powder Diameter (µm) |
|---|---|
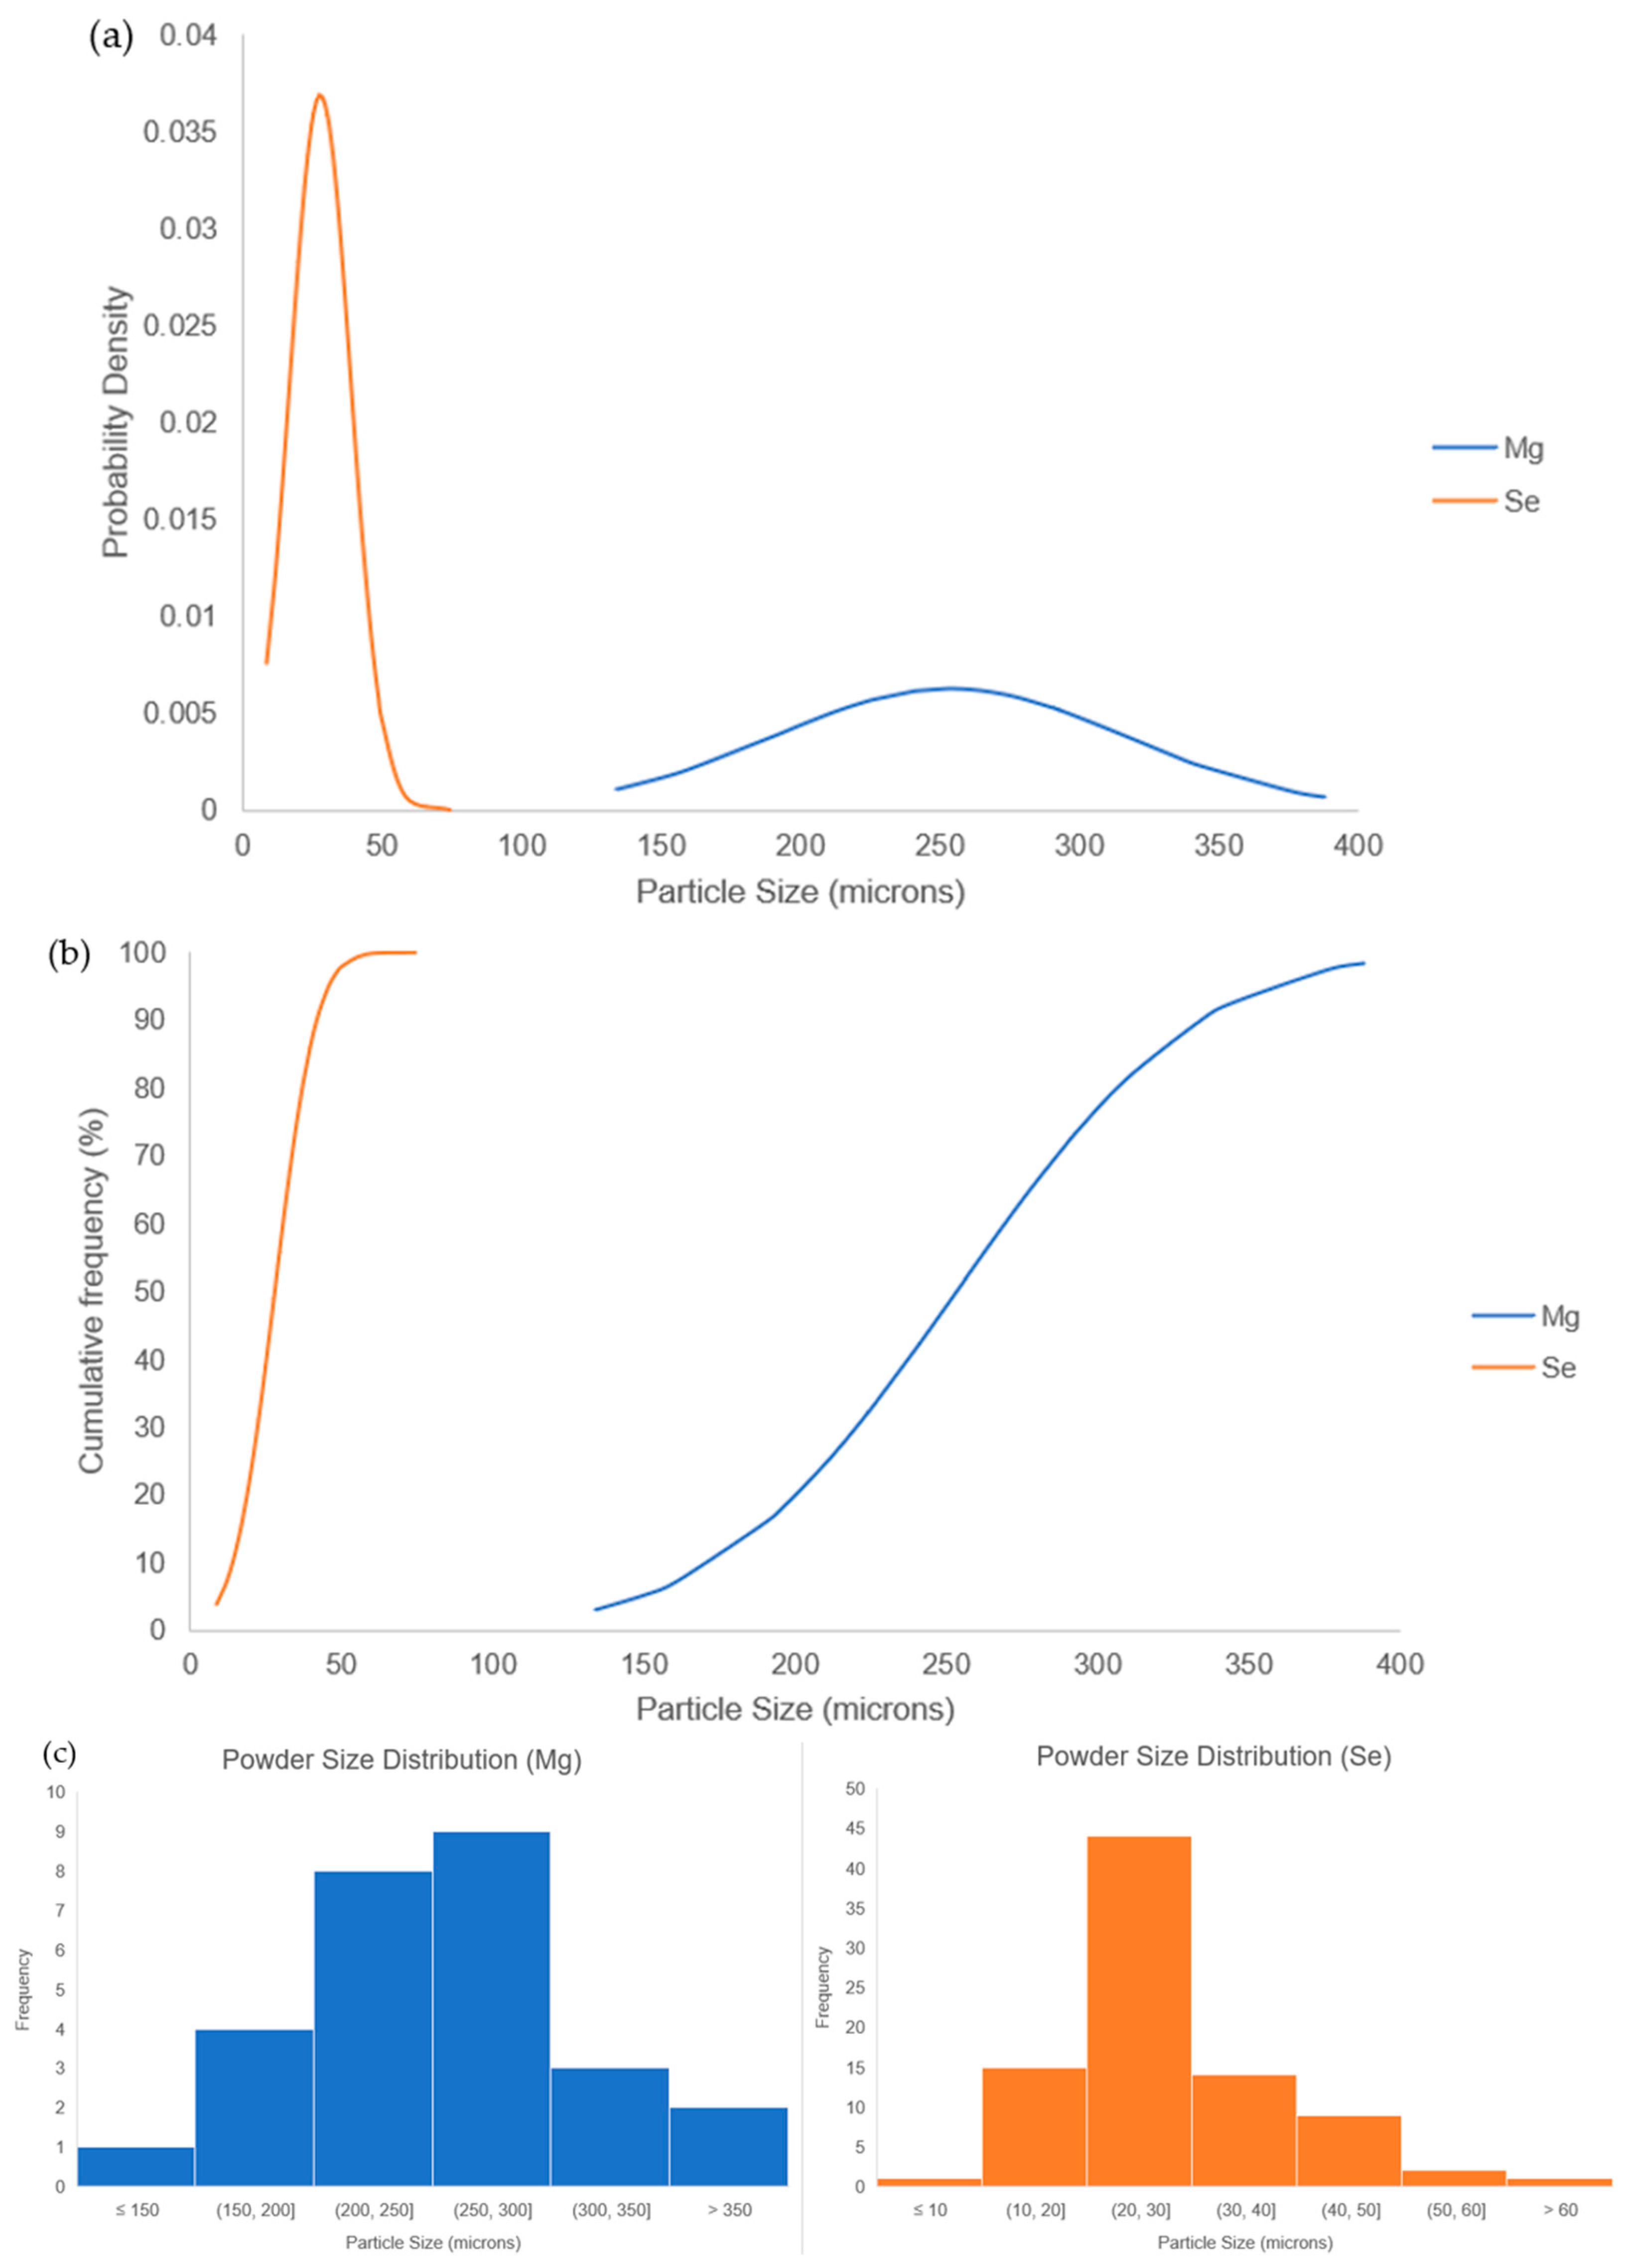
| Mg powder | 254 ± 63 |
| Se powder | 28 ± 11 |
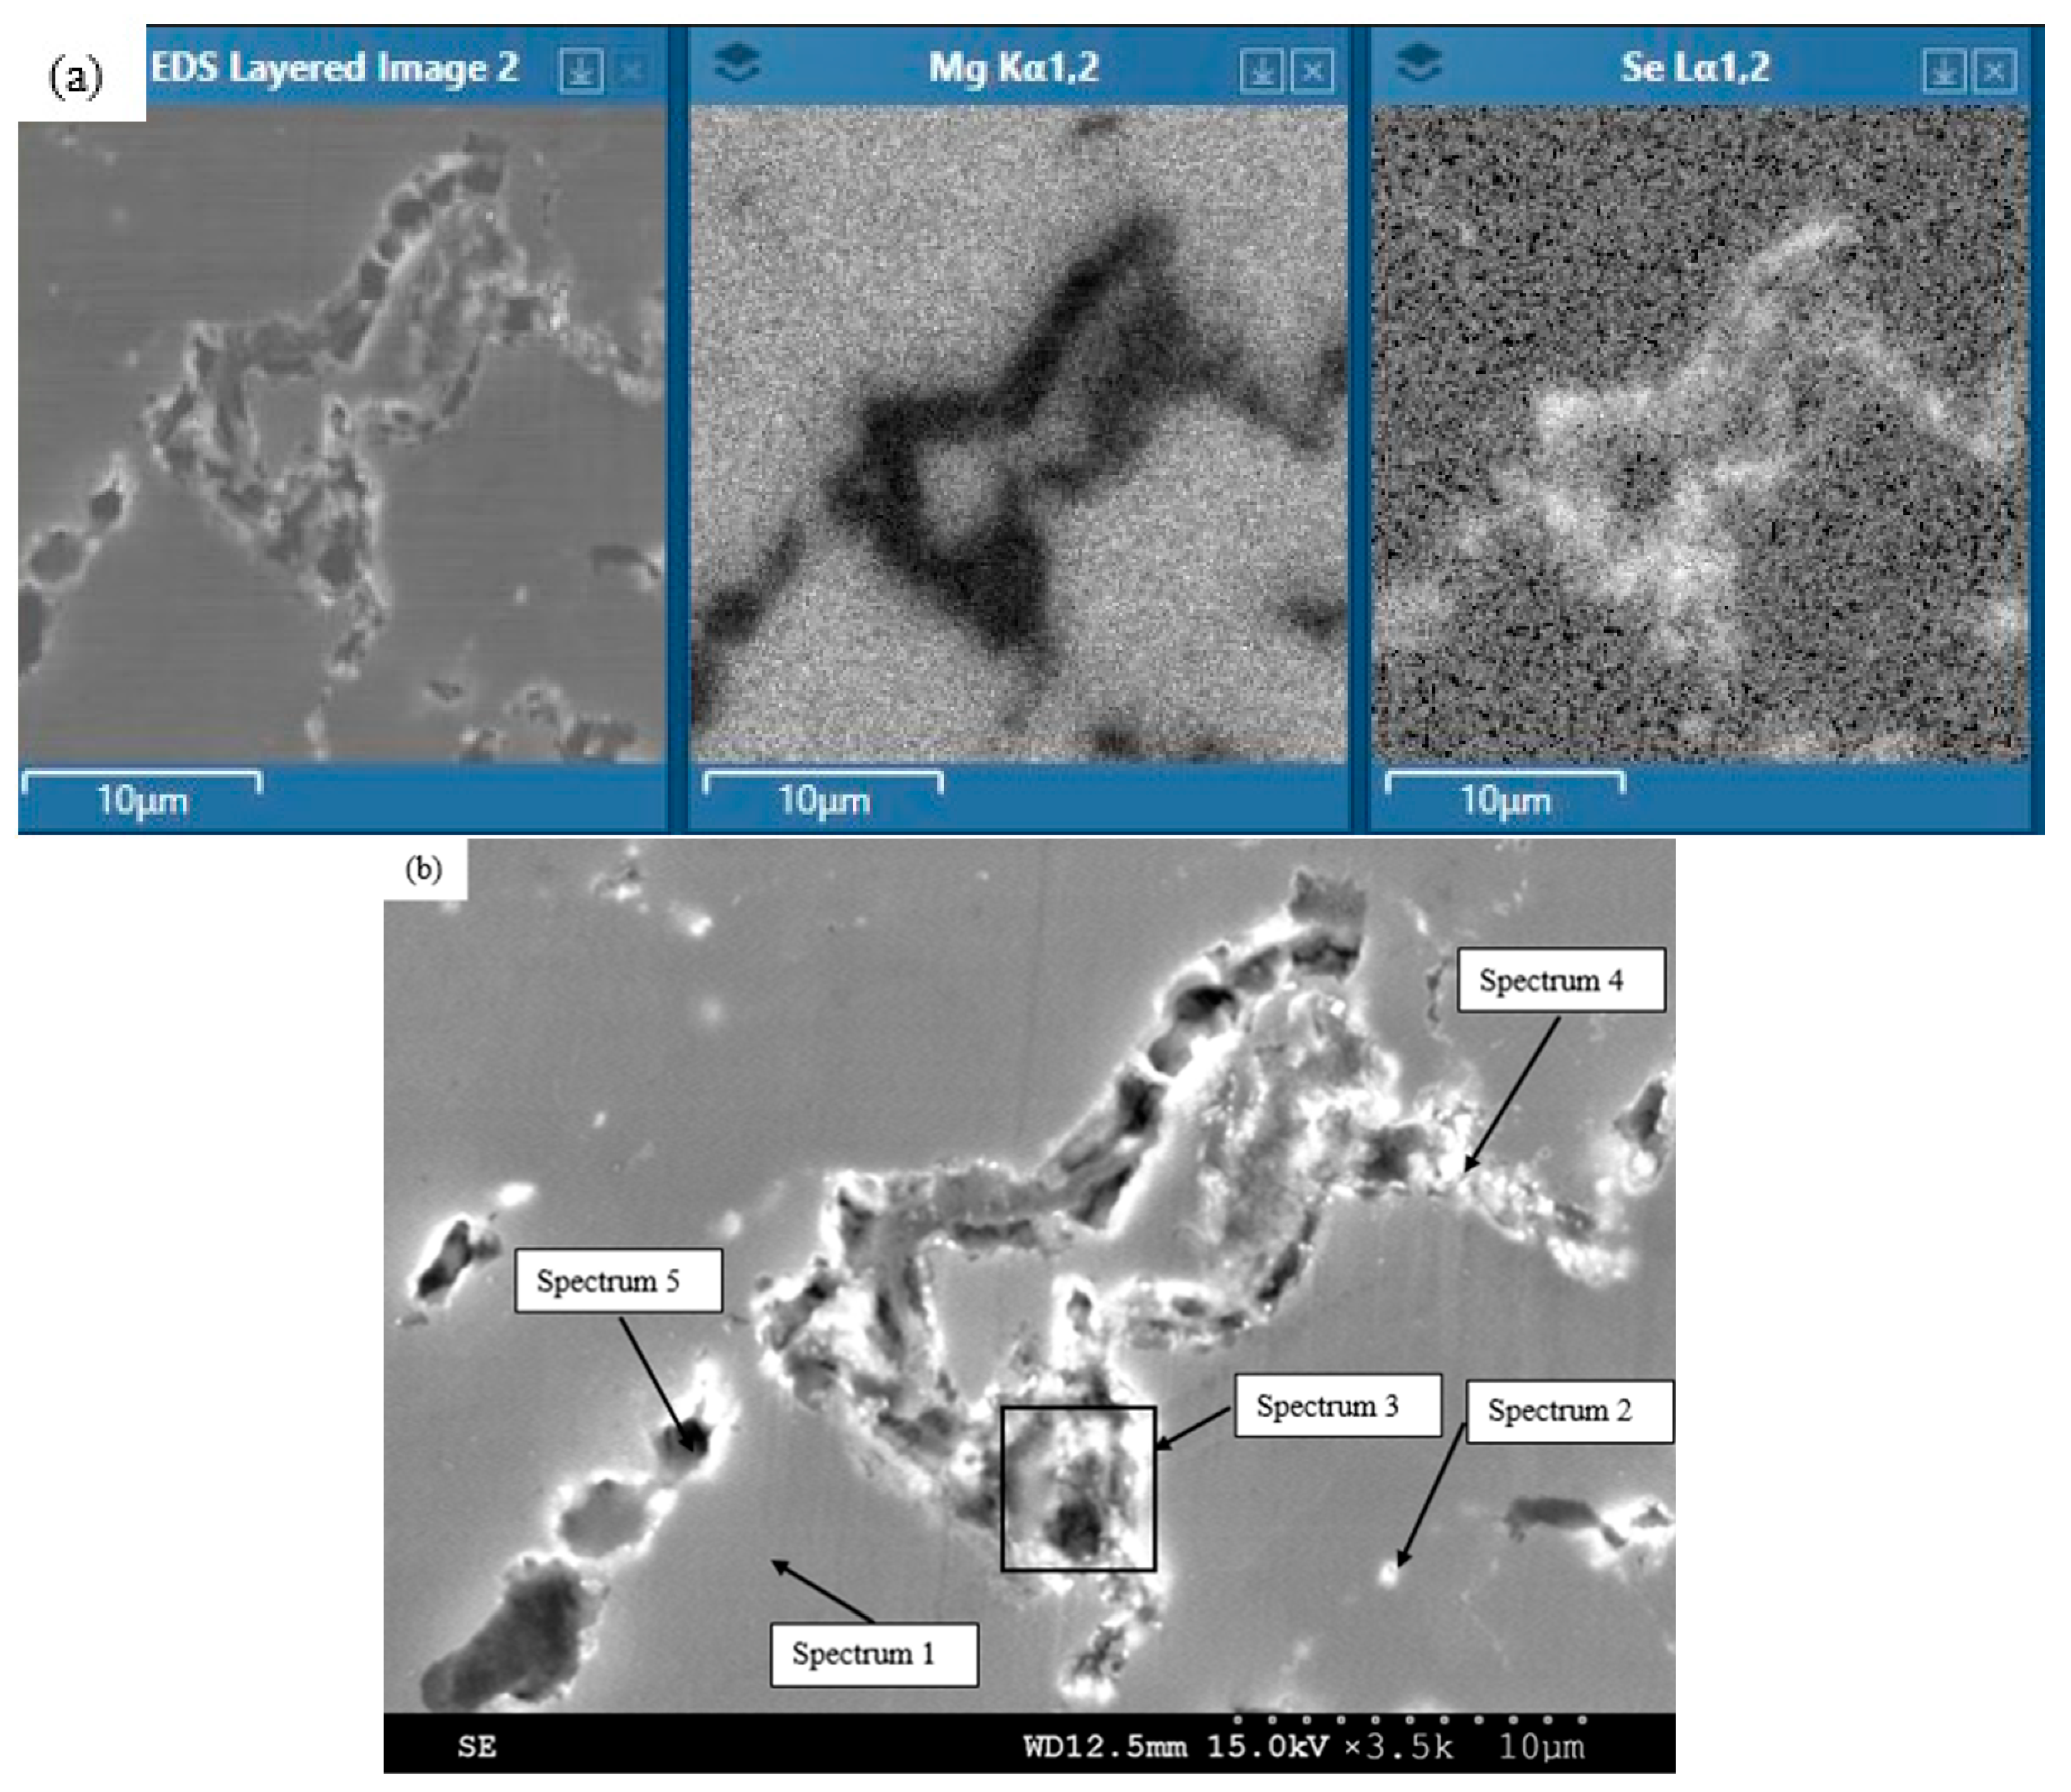
| Spectrum | Detected Element (wt. %) | |
|---|---|---|
| Mg | Se | |
| 1 | 99.4 | 0.6 |
| 2 | 78.9 | 21.1 |
| 3 | 53.1 | 46.9 |
| 4 | 69.1 | 30.9 |
| 5 | 79.4 | 20.6 |
| Material | Average Grain Diameter (µm) |
|---|---|
| Pure Mg [23] | 34 ± 2 |
| Mg-15Se | 9 ± 3 (↓74%) |
| Material | Plane | I/Imax |
|---|---|---|
| Pure Mg [26] | 10-10 Prism | 0.147 |
| 0002 Basal | 1 | |
| 10-11 Pyramidal | 0.794 | |
| Mg-15Se | 10-10 Prism | 0.074 |
| 0002 Basal | 1 | |
| 10-11 Pyramidal | 0.692 |
| Material | Theoretical Density (g/cm3) | Experimental Density (g/cm3) |
|---|---|---|
| Mg-15Se, green compact | 1.9079 | 1.6962 |
| Mg-15Se, microwave sintered compact | 1.9079 | 1.6956 |
| Material | Initial Theoretical Density (g/cm3) | Adjusted Theoretical Density (g/cm3) | Porosity (%) |
|---|---|---|---|
| Mg-15Se | 1.908 | 1.854 | 2.91 * |
| Material | Experimental Density (g/cm3) | Retained Se Content (%) | Porosity (%) |
|---|---|---|---|
| Pure Mg [22] | 1.736 | - | 0.21 |
| Mg-15Se | 1.823 | 12.5 | 2.91 * |
| Material | Attenuation Coefficient | Damping Capacity | Young’s Modulus (GPa) |
|---|---|---|---|
| Pure Mg [23] | - | 0.000656 | 44.7 |
| Mg-15Se | 38.62 | 0.001155 (↑76%) | 42.9 (↓4%) |
| Material | Average Microhardness (HV) |
|---|---|
| Pure Mg [23] | 46 ± 3 |
| Mg-15Se | 72 ± 5 (↑57%) |
| Material | 0.2% Compressive Yield Strength (MPa) | Ultimate Compressive Strength (MPa) | Fracture Strain (%) | Energy Absorbed (MJ/m3) |
|---|---|---|---|---|
| Pure Mg [23] | 72 ± 5 | 174 ± 7 | 16 ± 2 | 23 ± 2 |
| Mg-15Se | 87 ± 3 (↑21%) | 263 ± 12 (↑51%) | 24 ± 2 (↑50%) | 39 ± 6 (↑70%) |
| Material | Ignition Temperature (°C) |
|---|---|
| Pure Mg [26] | 581 |
| Mg-15Se | 645.5 ± 1.5 (↑ 11.1%) |
| Material | Average Coefficient of Thermal Expansion (×10−6/K) |
|---|---|
| Pure Mg [26] | 25.3 |
| Mg-15Se | 24.2 ± 0.5 (↓4.8%) |
| Material | Average Corrosion Rate (mm/Year) |
|---|---|
| Pure Mg, extruded and cold drawn [27] | 2.2 |
| Pure Mg, extruded [27] [28] | 1.2 |
| Pure Mg, porous (scaffolds) [29] | 0.5–3.7 |
| AZ91, powder metallurgy [27,30] | 1.6 |
| AZ91-0.5CNT (vol.%), powder metallurgy [30] | 12.5 |
| AZ91-0.5Graphene (vol.%), powder metallurgy [30] | 3.5 |
| AZ91-0.5Fullerine (vol.%), powder metallurgy [30] | 2.2 |
| Mg-15Se (current study) | 1.5 ± 1.1 |
Disclaimer/Publisher’s Note: The statements, opinions and data contained in all publications are solely those of the individual author(s) and contributor(s) and not of MDPI and/or the editor(s). MDPI and/or the editor(s) disclaim responsibility for any injury to people or property resulting from any ideas, methods, instructions or products referred to in the content. |
© 2024 by the authors. Licensee MDPI, Basel, Switzerland. This article is an open access article distributed under the terms and conditions of the Creative Commons Attribution (CC BY) license (https://creativecommons.org/licenses/by/4.0/).
Share and Cite
Johanes, M.; Sonawane, V.; Gupta, M. A First-Time Investigation into Ecofriendly and Biocompatible Mg-Se Binary System for a Greener Earth. Metals 2024, 14, 163. https://doi.org/10.3390/met14020163
Johanes M, Sonawane V, Gupta M. A First-Time Investigation into Ecofriendly and Biocompatible Mg-Se Binary System for a Greener Earth. Metals. 2024; 14(2):163. https://doi.org/10.3390/met14020163
Chicago/Turabian StyleJohanes, Michael, Vasuudhaa Sonawane, and Manoj Gupta. 2024. "A First-Time Investigation into Ecofriendly and Biocompatible Mg-Se Binary System for a Greener Earth" Metals 14, no. 2: 163. https://doi.org/10.3390/met14020163
APA StyleJohanes, M., Sonawane, V., & Gupta, M. (2024). A First-Time Investigation into Ecofriendly and Biocompatible Mg-Se Binary System for a Greener Earth. Metals, 14(2), 163. https://doi.org/10.3390/met14020163