Abstract
A large number of MIG welding tests were carried out on a 3 mm thick 7075 aluminum alloy plate prepared by the self-developed jet forming–extrusion–drawing process of 7075 high-strength aluminum alloy welding wire, and the welding process of the welding wire and the change in the performance of the welded joint after T6 heat treatment were studied. The results show that the self-developed wire has a good forming joint and a wide welding process window: the welding speed is 5–7 mm/s, and the welding current is 100–150 A. The main precipitated phases in the joint were η(MgZn2), S(CuMgAl2), Mg2Si, and Al13Fe4, which were continuously distributed at the grain boundaries in the form of coarse networks or long strips, which was an important reason for the weak performance of the joints. After the heat treatment of T6, the precipitated phase in the joint was greatly reduced, the element segregation phenomenon was improved, and the residual precipitated phase was mainly Al13Fe4 and a small amount of insoluble phase Fe and Si, and the recrystallization size of the heat-affected zone was refined. Through heat treatment, the average microhardness of the joint was increased from 110 HV to 150.24 HV, and the tensile strength was increased from 326 MPa to 536 MPa, reaching 97.5% of the strength of the base metal, indicating that the softening phenomenon was significantly improved after heat treatment, and the joint had excellent performance.
1. Introduction
In recent years, in the process of new energy vehicles being rapidly developed, the use of aluminum alloy materials has accounted for nearly 1/3 of the overall materials used in lightweight vehicles [1]. Among them, the 7XXX series high-strength aluminum alloy with Al-Zn-Mg-Cu as the main alloying elements has gradually replaced traditional steel and has become the main material for manufacturing automotive parts with high strength requirements such as front longitudinal members, crash ring doors, and anti-collision beams for passenger cars due to its advantages of low density, good corrosion resistance, and high specific strength [2,3]. An example of its usage is in the s701 automotive steel launched by Novelis in 2021, wherein the main body is made of T6 state 7075 aluminum alloy; additionally, in Shanghai Rail Transit, 7XXX series aluminum alloy has also begun to be used as the main material for the traction beams, sleeper beams, and some load-bearing parts including the underframe of some models [4].
However, many difficulties in the preparation and welding process of aluminum alloy welding wire have become bottlenecks that limit its further widespread application [5,6]. For example, due to the high thermal conductivity of 7XXX series aluminum alloy, it is often necessary to supply a larger heat input during welding, which brings different degrees of burning loss to the alloying elements and affects the performance; furthermore, the current research on aluminum alloy welding wire is mainly focused on 5XXX series welding wire, while 7XXX series welding wire has relatively few studies and high preparation cost, so that many application scenarios of 7XXX series plates often choose some 5XXX series welding wire with good versatility, such as ER5356 welding wire for welding [7,8,9]. But the weld area after welding of 5XXX series welding wire is mainly α-Al solid solution, and the differences in microstructure composition directly leads to a huge difference between the strength of the weld zone and the 7XXX series base metal. At the same time, in the 5XXX series of welding wire, the absence of alloying elements like Cu and Zn makes it difficult to further improve the strength of joints through heat treatment. Consequently, it becomes difficult to satisfy the increasing market demands for weldments such as strength, hardness, and corrosion resistance [10,11,12].
On the one hand, the difficulties in the preparation of 7XXX series aluminum alloy wire materials lie in the complexity of the processing techniques. Multiple links such as smelting and processing need to be precisely controlled, resulting in high production costs. On the other hand, heat treatment is required after welding to obtain reliable performance, which limits its application range [13]. Wang et al. [14] found that increasing the contents of Zn and Mg elements in spray-formed 7055 aluminum alloy wire can offset the burning loss of alloy elements during the welding of 7XXX series aluminum alloys and obtain joints with stronger toughness. Oropeza et al. [15] used 7075 welding wires with added TiC for TIG welding of 7075 aluminum alloy. After heat treatment, the strength of the joint was able to reach up to 84% of the strength of the base metal. Zhang et al. [16] used self-made 7075 welding wires to conduct TIG welding on 7075 aluminum alloy. Subsequently, the joint was heat-treated, and its tensile strength reached 424.5 MPa while its elongation was 9.83%.
Considering the above difficulties, the lack of 7XXX series aluminum alloy welding wire, and the immature preparation process on the market, this research employed the 7075 aluminum alloy welding wire fabricated via the spray forming–extrusion–drawing process to perform MIG welding on 7075 aluminum alloy plates. An exhaustive investigation was conducted to methodically examine the weldability of the self-developed welding wire as well as the service performance of the welded joints. The findings of this research provide new ideas for the welding of 7xxx series aluminum alloys.
2. Materials and Methods
Firstly, with the assistance of the injection-forming process (SFZD500, Jiangsu Haoran, Najing, China), the powder prepared in advance according to the specific gravity of the elements is converted into 7075 aluminum alloy billets. Then, the Φ1.2 mm 7075 aluminum alloy welding wire required for welding is produced through hot extrusion, multi-channel drawing, and other processes. The specific process parameters for extrusion and drawing are as follows: The extrusion temperature is precisely set at 400 °C (KF1200, Hengli Company, Najing, China), and the extrusion ratio is fixed at 30. Regarding the vacuum annealing process, the annealing temperature is maintained at 300 °C for an extended period of 12 h, after which the material is cooled in the furnace environment. In the drawing process, the reduction ratio is confined within the range of 5–8%. Through a total of 18 passes, the Φ3.2 mm wire is gradually drawn down to Φ1.2 mm, ensuring a meticulous and controlled transformation.
As displayed in Figure 1, the base metal is 7075-T6 rolled aluminum alloy plate. The size is 150 mm × 75 mm × 3 mm. The MIG welding process is carried out through non-groove butt welding. The welding apparatus utilized is a WSME315-type digital DC square wave argon arc welding machine (Jasic Technology, Shenzhen, China). The shielding gas is argon with a purity of 99.99%. The chemical compositions of both the welding wires and plates were quantitatively determined by means of inductively coupled plasma optical emission spectrometry (ICP-OES, Agilent 725, Santa Clara, CA, USA), and the results are presented in Table 1.
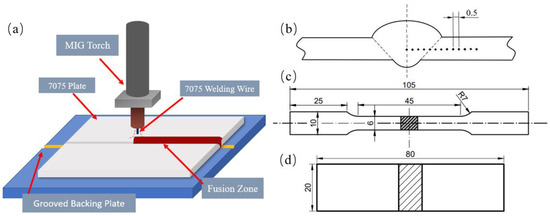
Figure 1.
Welding schematic diagram and schematic diagram: (a) schematic diagram of welding method; (b) hardness point; (c) tensile specimens; (d) bending specimens.

Table 1.
Chemical composition of plate and filler wire (wt, %).
Before welding, an angle grinder, wire brush, and acetone reagent were used to remove the oxide film and residue on the surface to be welded. Then, the plate was sent to the 80 °C constant-temperature furnace for preheating. Preheating can reduce the cooling rate of the molten pool, decrease the internal stress and defects in the weld, and help to form a good metallurgical bond.
In the MIG welding process test, the welding current and welding speed, which had the greatest impact on the weld effect, were selected as the main variables [17,18]. The variation in welding current can directly influence the size of the heat input, which determined whether the plate could be welded successfully. Moreover, the welding speed can also influence the size of the heat input per unit area and thus impact the welding quality. To explore the appropriate current parameters, the minimum current was set at 80 A during welding, and it was increased by 10 A when welding was carried out the next time. When obvious macroscopic defects appeared, the current was not increased. The welding speed ranged from 4 to 7 mm/s. The argon flow rate was maintained at 17.5–20 L/min, the dry elongation was 12 mm, and the wire feeding speed was 150 cm/min.
Subsequently, the well-formed joint sections were sampled by the EDM wire cutting equipment (Taizhou Minks, Taizhou, China). Some of these samples were then subjected to heat treatment, with the heat treatment process being T6 (480 °C × 1 h + Quench + 120 × 24 h). The metallographic structure was observed using WSME630 light microscopy (Keyence, Mechelen, Belgium). X-ray diffraction (XRD, Rigaku Corporation, Tokyo, Japan) was used to detect the phase composition, with a scanning range of 10–90° and a scanning rate of 4°/min. SEM and EDS analysis were performed using the Sigma500 field emission scanning electron microscope (Sigma, Waltham, MA, USA). The stress layer on the surface of the sample was removed by electrolytic polishing equipment (LectroPol-5, Struers Company, Copenhagen, Denmark), and then EBSD observation was performed using the electron backscatter diffraction instrument ((EBSD, Bruker, Beijing, China). The grain size and recrystallization fraction were processed and analyzed by Channel 5 software (Version: 5.0.9.0).
Finally, we conducted mechanical property tests, including a tensile test (Wanchen Company, Jinan, China), microhardness test (Sony IRIS CCD, Tokyo, Japan), and bending test, to evaluate the comprehensive performance indices of the joint. In compliance with “Test Methods for Tensile Testing of Welded Joints” (GB/T 2651-2023) [19] and “Test Methods for Bend Testing of Welded Joints” (GB/T 2653-2008) [20], taking into account the dimensions of the test materials and the subsequent experimental arrangements, and to ensure the consistency of the process, non-standard tensile specimens were used in the tests. The specific cutting dimensions are shown in Figure 1.
3. Results and Discussion
3.1. Technological Process Analysis
3.1.1. Macroscopic Topography Analysis
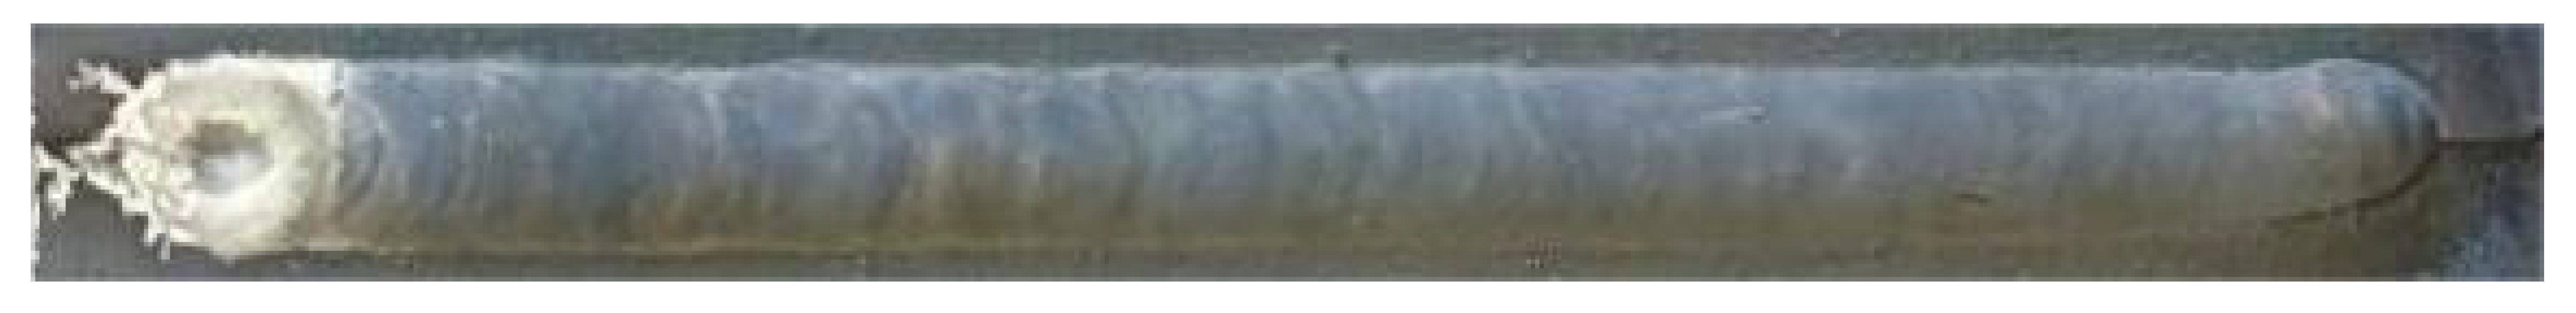
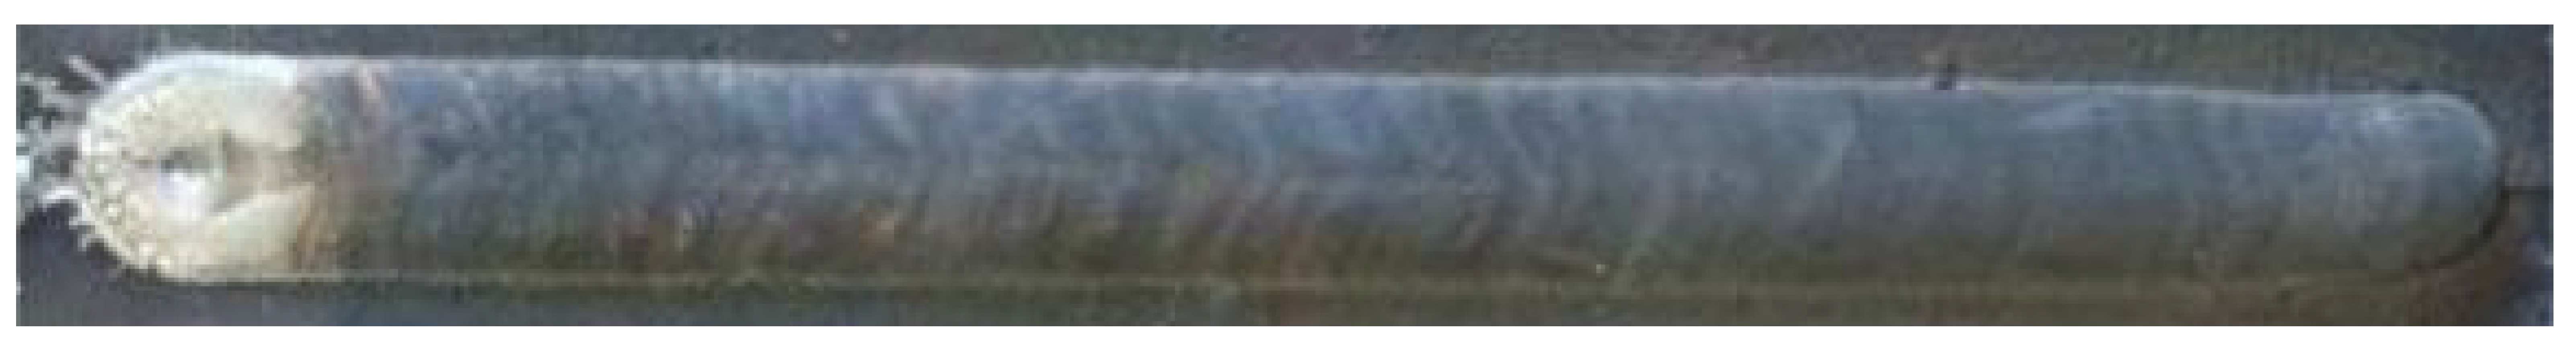
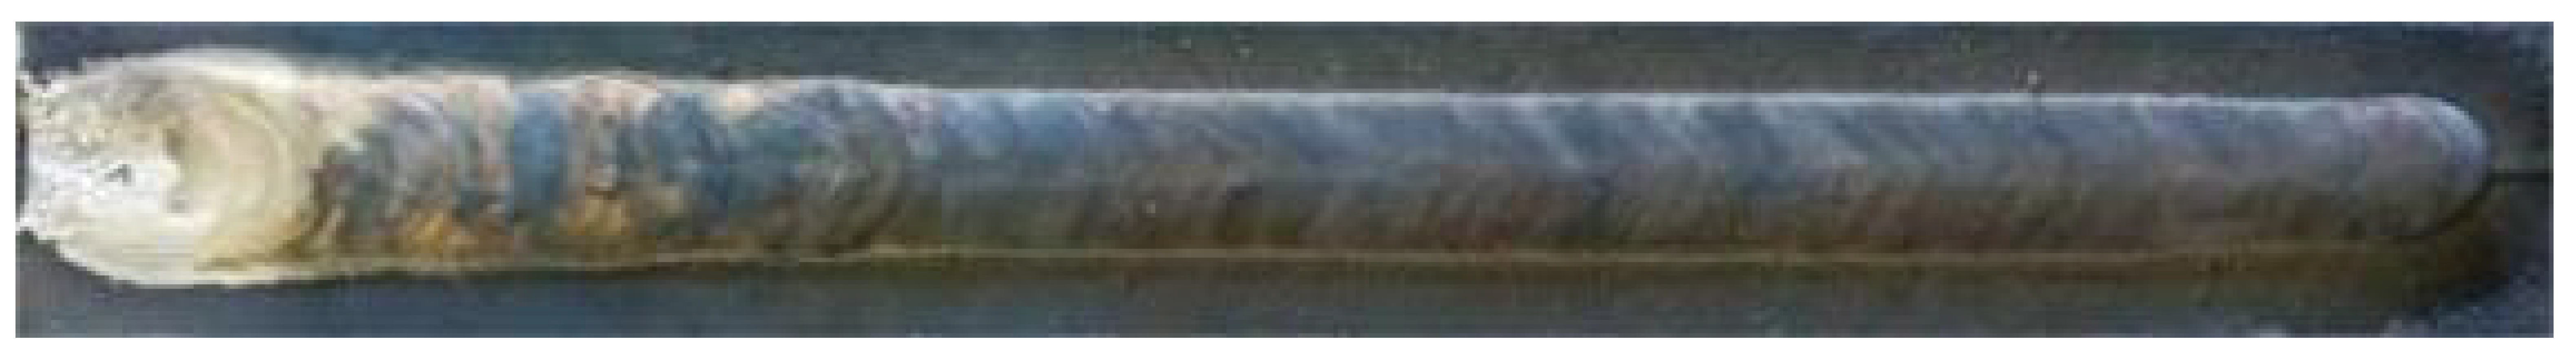
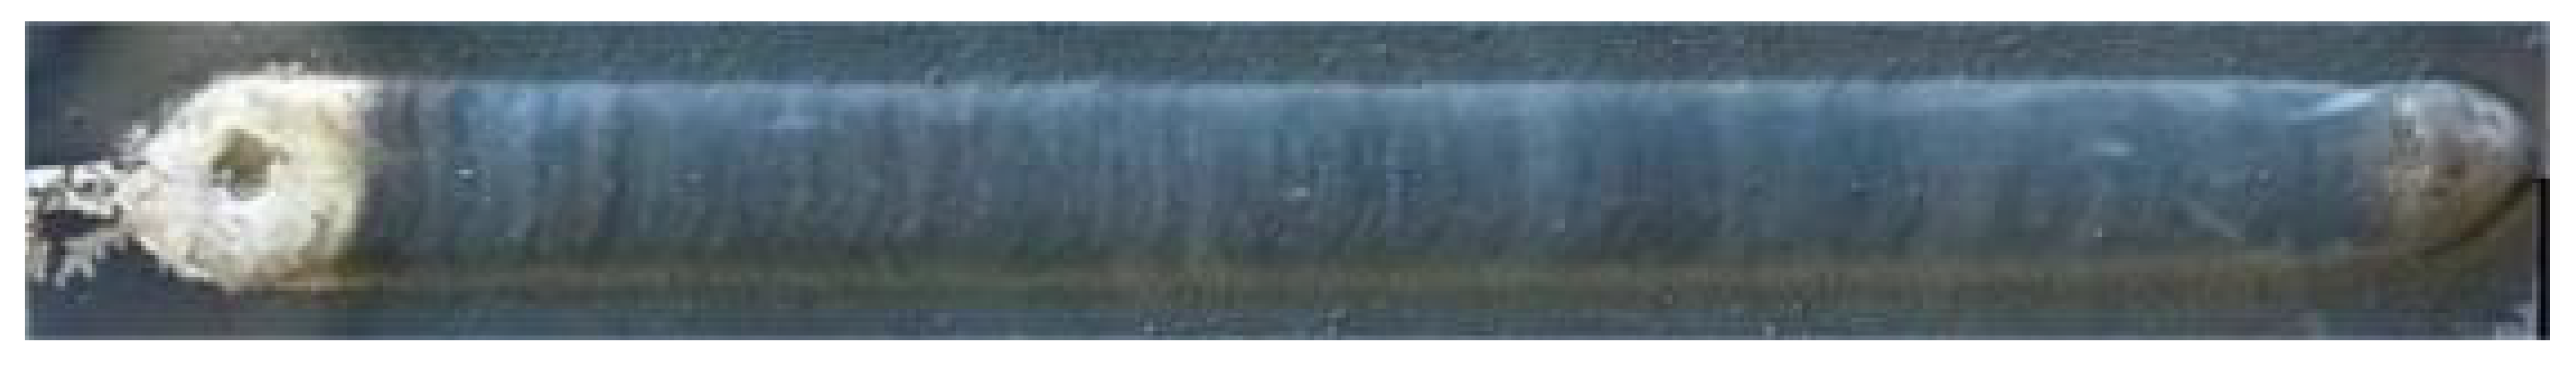
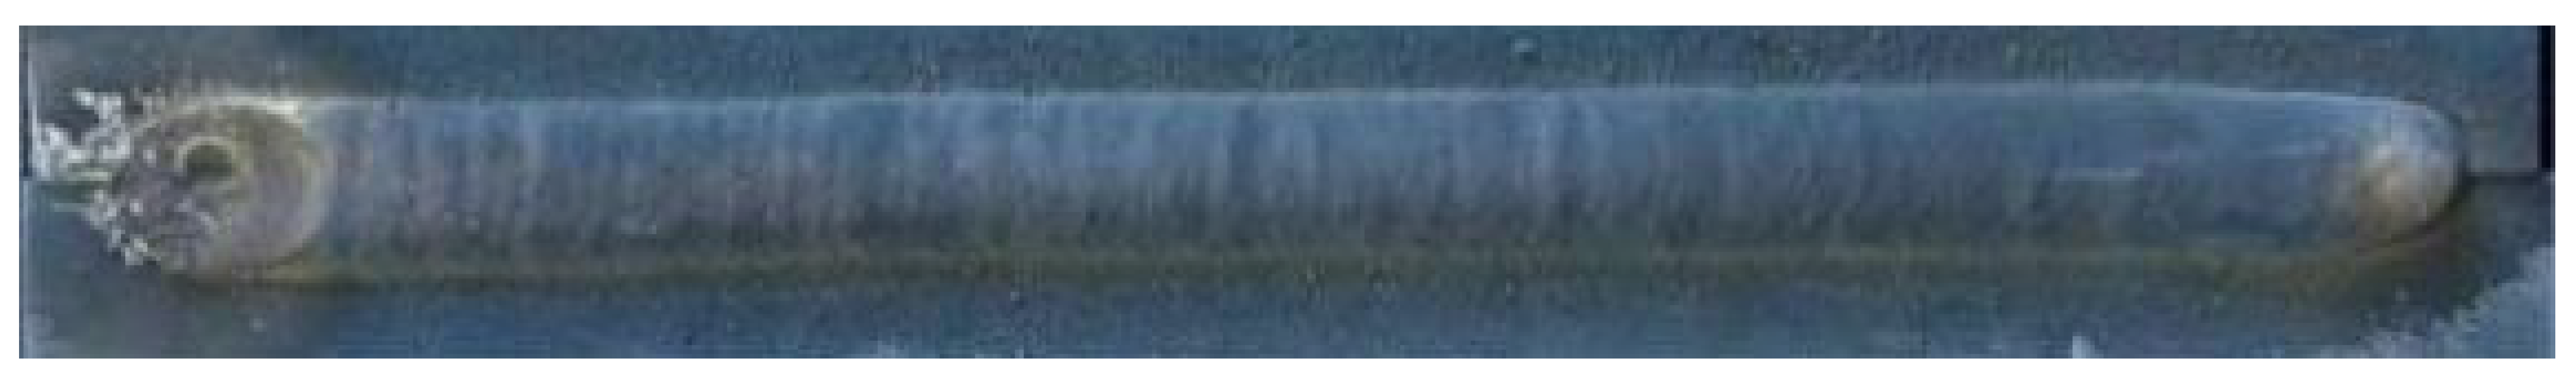
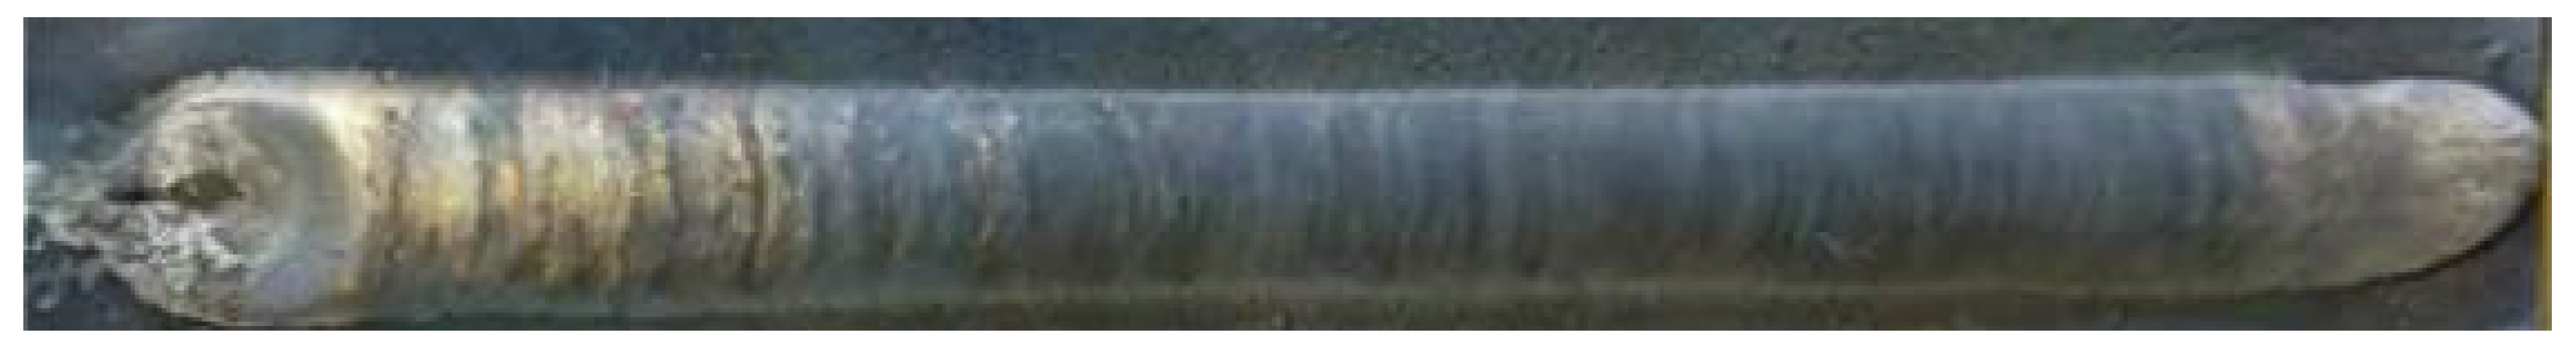
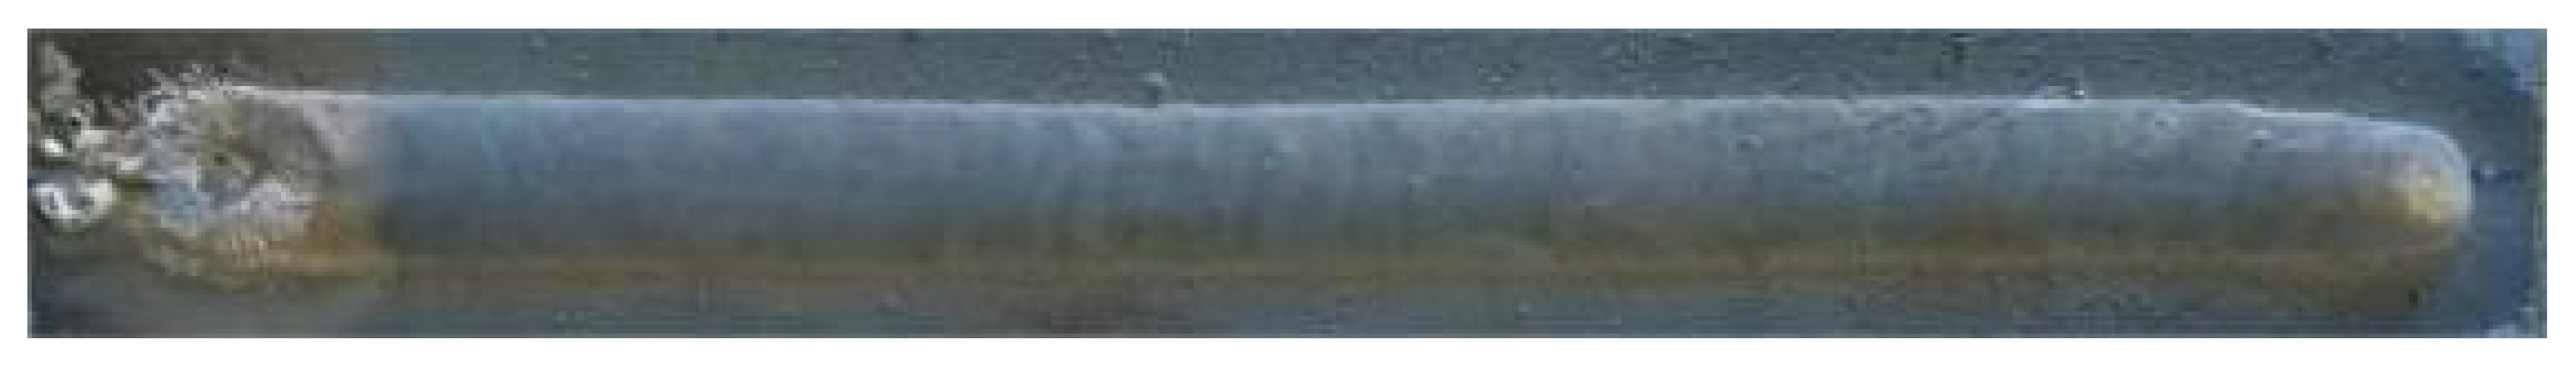
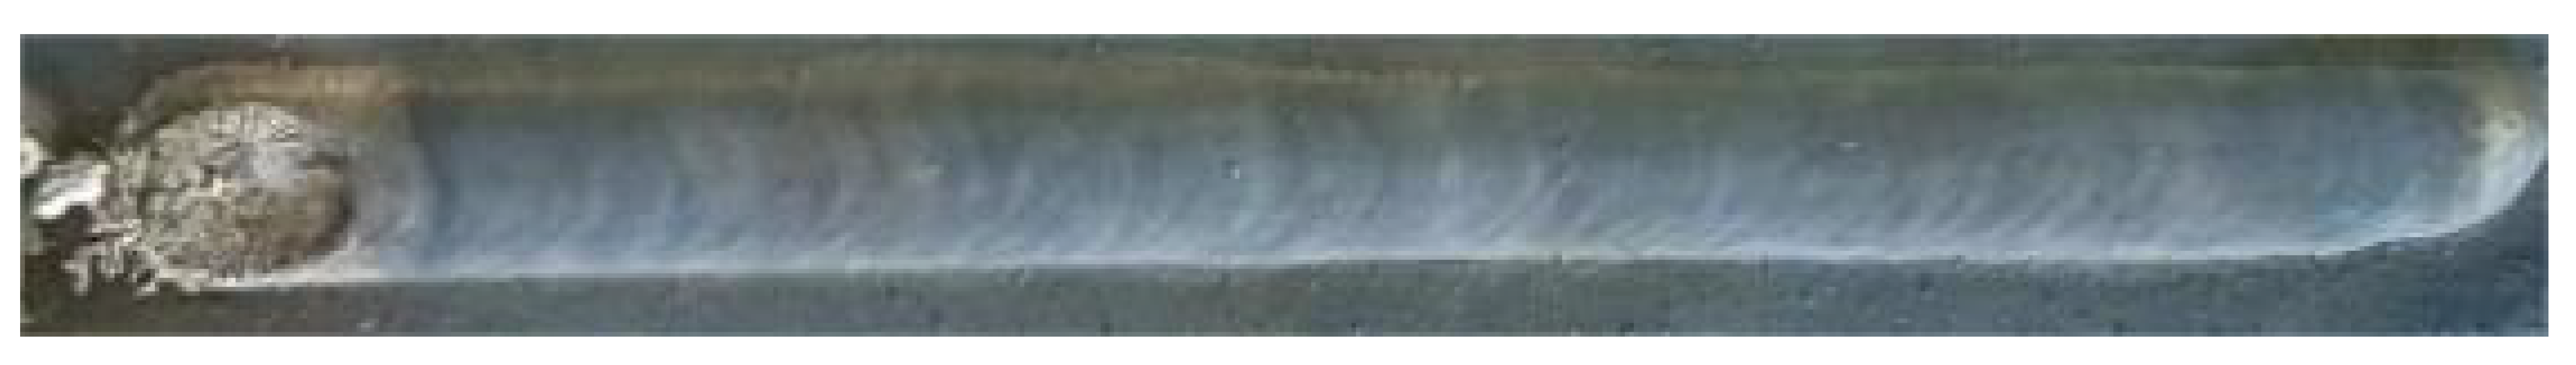
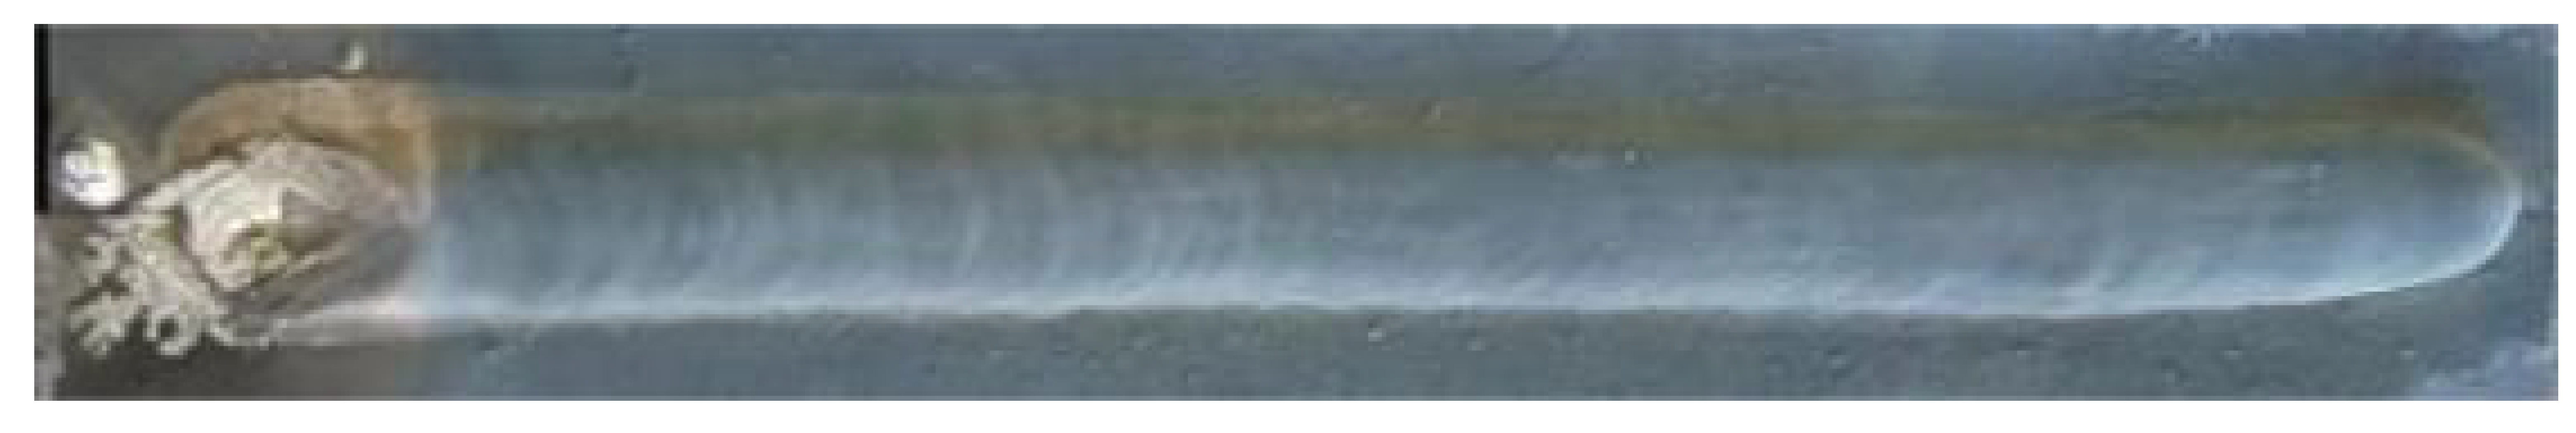
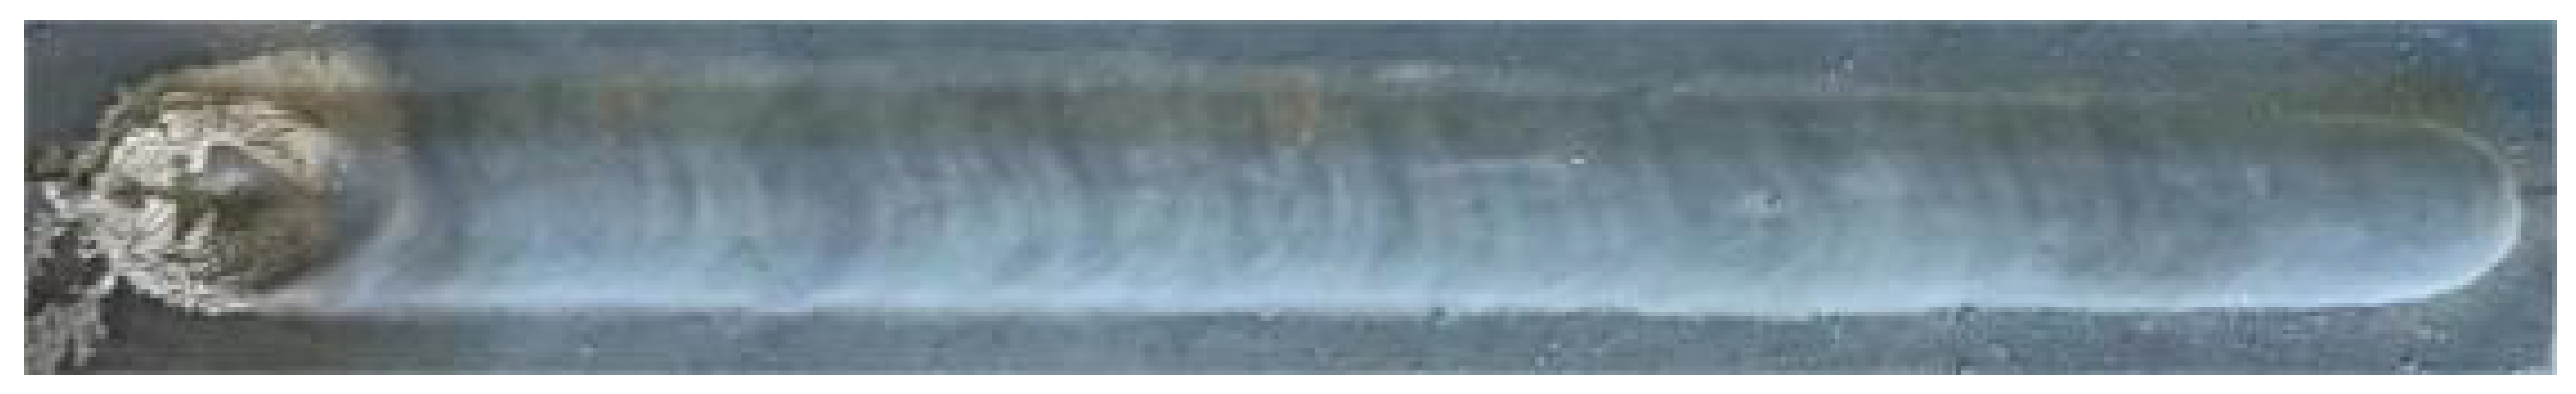
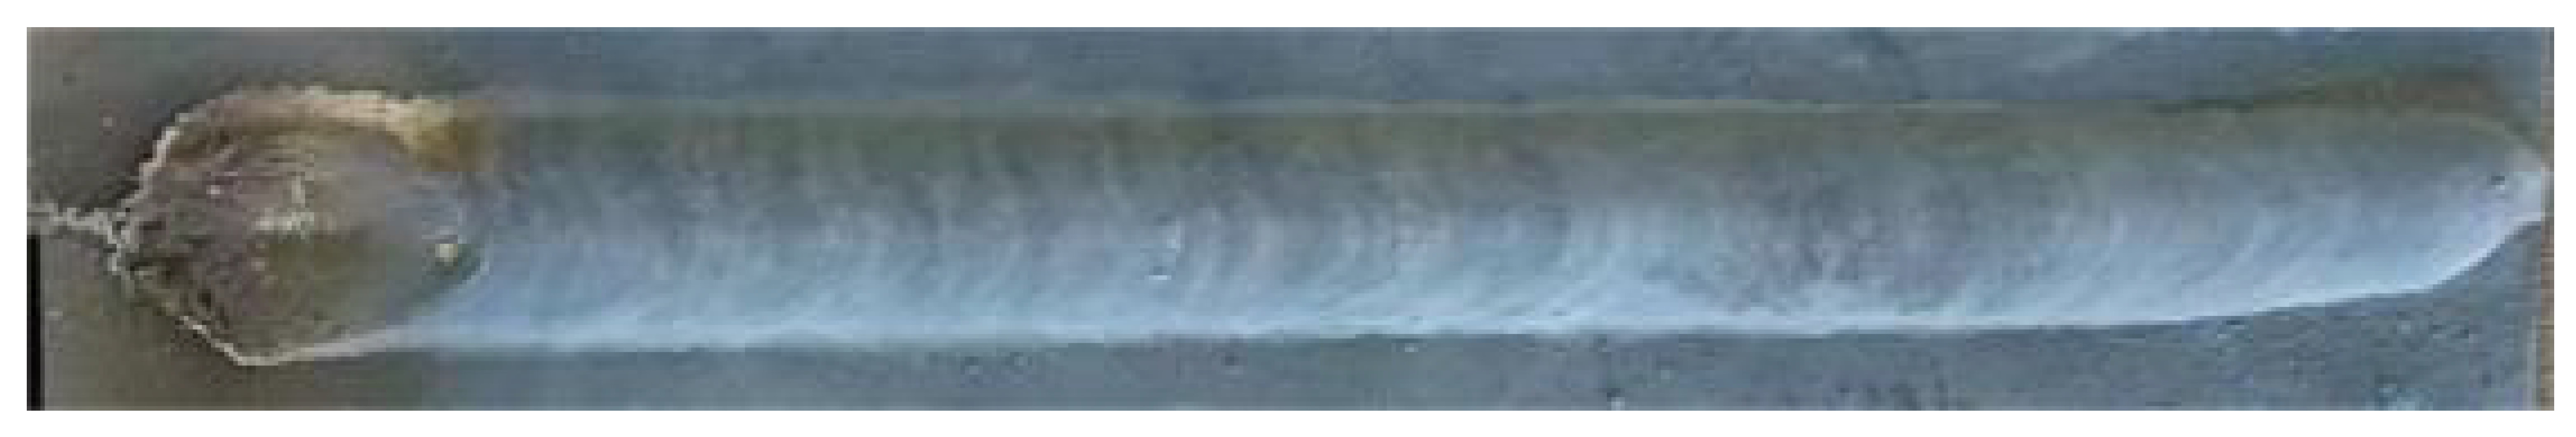
We referred to the ISO 17639:2022 “Macro and Micro Inspection of Welds” [21] standard to observe the macroscopic morphology of the welded joint. According to the analysis, the macroscopic morphology after welding is divided into four types: unable to form, terribly formed, poorly formed, and well-formed, as shown in Figure 2. In the weld formability test, the weld must meet the requirements of good formability evaluation if the weld has been completely penetrated and there are no obvious macroscopic defects such as collapse and cracks.
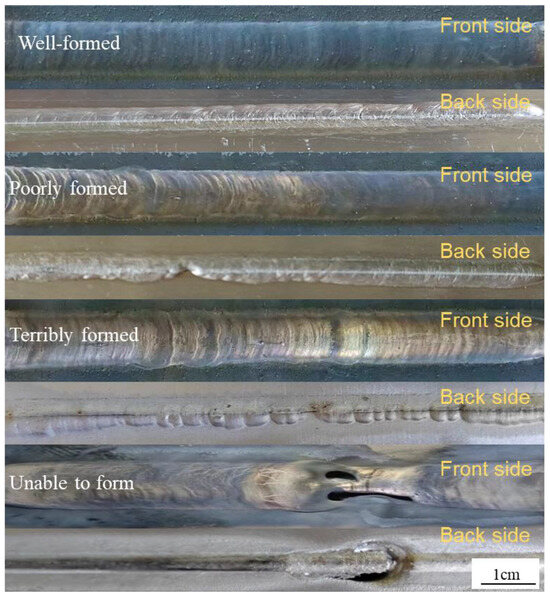
Figure 2.
Macroscopic formability of the weld.
The experimental results were then summarized and shown in Figure 3 and Table 2. As the welding current increased, the heat input rose and the width of the weld gradually expanded. However, the melting height decreased with an increase in the current. When the welding speed is 4 mm/s, all welded joints had weld collapse formability, which failed to meet the requirements. This was because at low welding speeds molten droplets at the arc easily accumulate. Additionally, as the current increased, too many molten droplets built up in the molten pool, which readily blocked the contact tip and caused arcing, thereby preventing the weld from being completed [22].
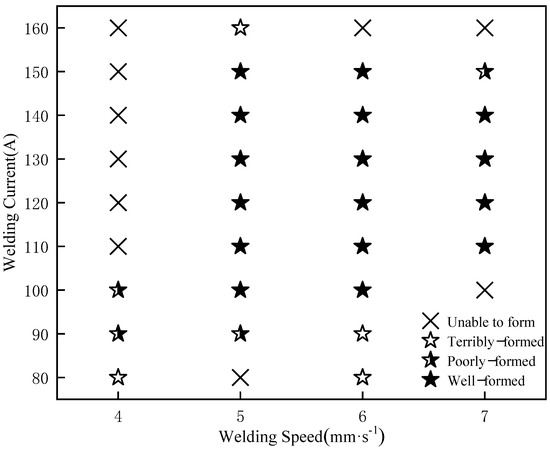
Figure 3.
Macroscopic morphology results of welds.
Table 2.
Influence of process parameters on weld morphology.
When the welding speed is 5–6 mm/s, excellent weld forming quality can be obtained in a wide range of parameters, and the welding torch moving speed and wire feeding speed are also well-matched when the plate is welded. Moreover, when the current was between 120 A and 130 A, the macroscopic morphology of the weld is the best.
At a high welding speed of 7 mm/s, the weld requires a larger current to maintain a larger heat input in order to preserve a stable forming, and the melt width is larger than that of the welded joint at a medium welding speed, which undoubtedly increases the instability of the heat input and makes the weld more prone to collapse.
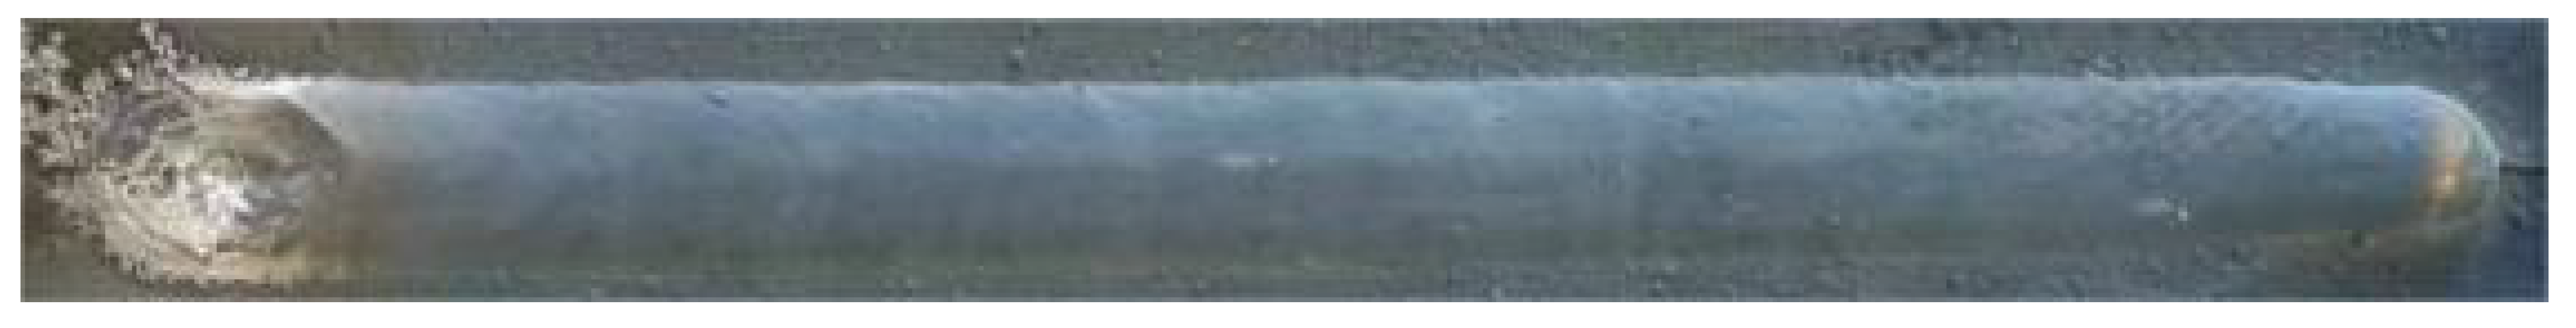
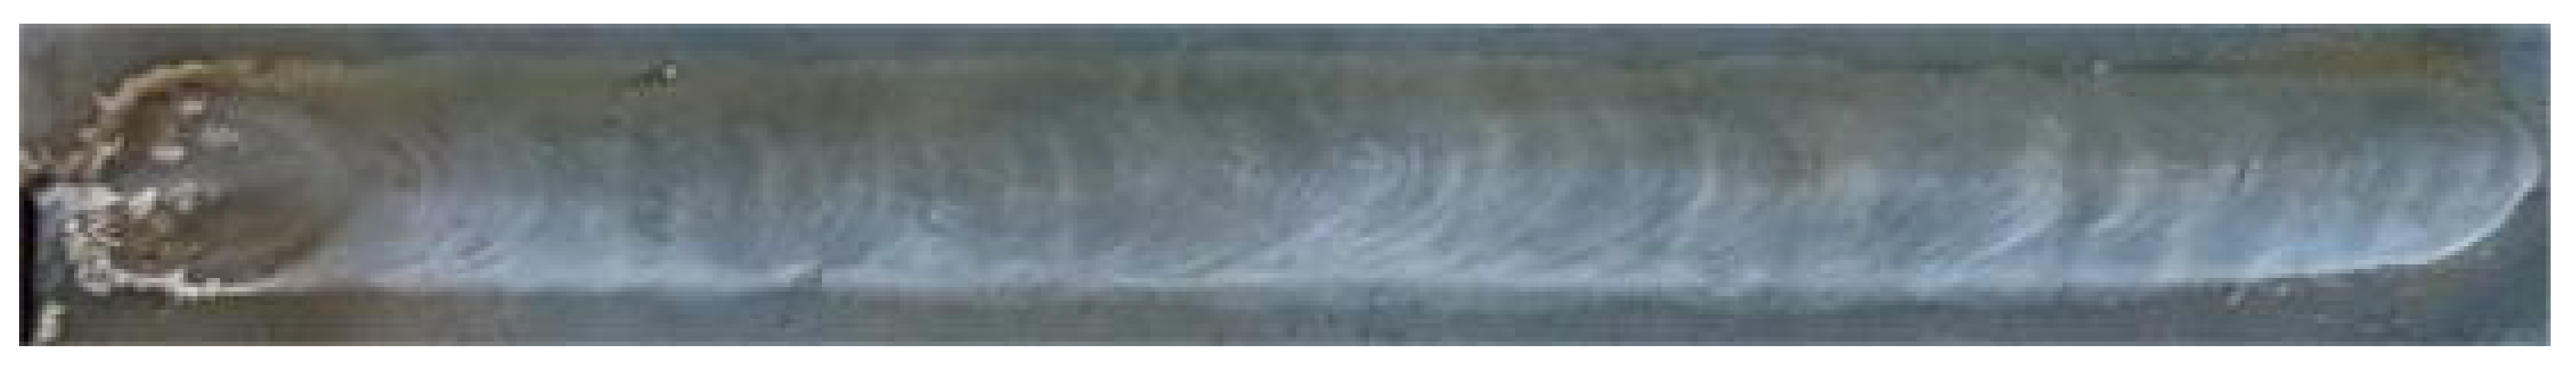
As shown in Figure 4, a large amount of black buildup was found on the surface of the 7XXX series weld after the MIG welding test, which was quite different from the silvery-white surface of the 5XXX series weld [23,24]. In order to explore the composition of the deposit, the surface of the weld was scraped with an aluminum brush, and then the obtained black powder was detected by the inductively coupled plasma (ICP) elemental analysis method. From the results in Table 3, it can be seen that, compared with the proportion of welding wire components, the content of other elements in the powder except for aluminum elements basically increased, which indicated that the alloy components in the welding wire were not completely melted into the joint during the welding process. The main reason for the analysis was that the 7XXX series Al-Zn-Mg-Cu alloy had more alloying elements than the 5XXX series Al-Mg alloy. They will inevitably burn out and then volatilize to the surface of the weld at the high arc temperature. Among these, the Zn and Mg elements with low melting point are the most seriously burned and become the main components in the powder. Mg and Zn elements are the main strengthening phase elements of 7XXX series aluminum alloy, and their burning loss will have a great impact on the mechanical properties of 7XXX series aluminum alloy joints.
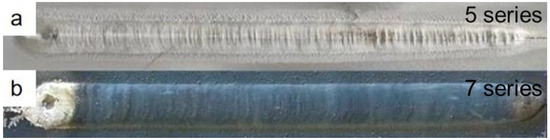
Figure 4.
Comparison of weld morphology: (a) 5XXX; (b) 7 XXX.
Table 3.
Detection of ICP elements of black powder on the surface of 7075 welds.
3.1.2. Microscopic Topography Analysis
Cracks and porosity are the two most common microscopic defects in 7075 aluminum alloy welded joints. Li et al. [25] pointed out that the presence of porosity is one of the main causes of fatigue crack initiation. Taking the welding process of group 7 (welding speed 6 mm/s, welding current 100 A) as an example, the welded joints meet the good forming conditions under the process parameters of this group, but observing the metallographic structure diagrams of the welds of this group in Figure 5, it can be found that although there are no microscopic cracks in the weld zone (WZ) and fusion zone (FZ) of the joint after MIG welding, there are more pores in both areas. Among them, the weld zone is dominated by irregularly dispersed pores due to the flow effect of the weld pool, while the pores in the fusion zone are mainly distributed near the weld seam, and show a linear distribution. This distribution of pores will cause the mechanical properties of the fusion zone to deteriorate, which will become the weak zone of the joint.
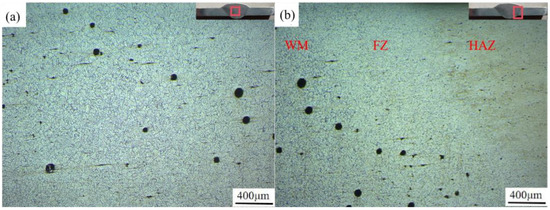
Figure 5.
Metallographic structure of welded joints: (a) the center of the weld; (b) fusion zone.
Then, all joints in Table 2 that met the conditions of good formability and above were sampled. The porosity and defect evaluation were performed using Image J software (version, manufacturer’s name, city, country), and the results are shown in Figure 6. It was observed that the fusion effect of the welding wire and the base metal was good, and there were no micro-crack defects in the joint. The porosity of the joint was proportional to the welding speed, and the welding current decreased first and then increased.
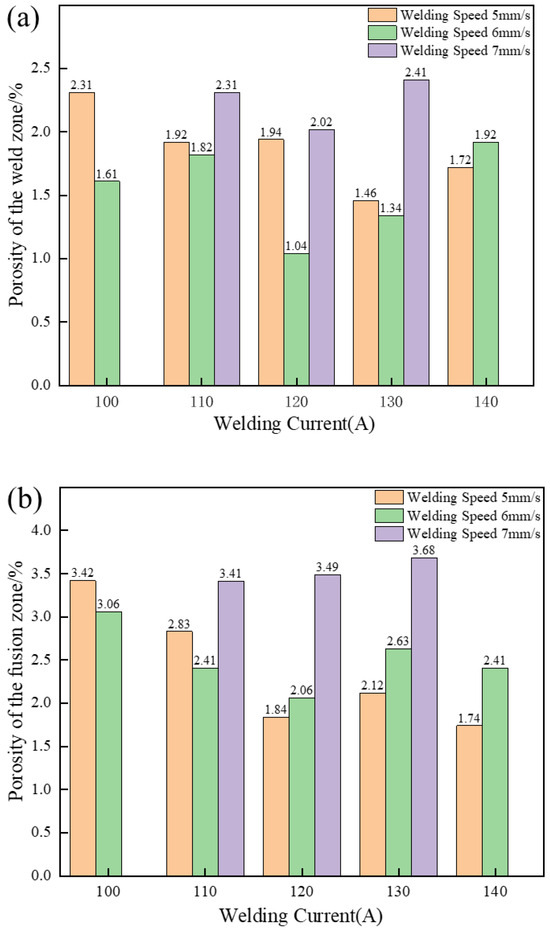
Figure 6.
Statistics of joint porosity: (a) porosity of the weld zone; (b) porosity of the fusion zone.
As the welding speed increases, the solidification speed of the molten pool will also accelerate, reducing the escape time of the gas in the molten pool and thus increasing the porosity. Meanwhile, appropriately increasing the current can make the molten pool more active, which is beneficial for the gas dissolved in the liquid metal to float up and escape, thereby reducing the porosity. Through horizontal comparison, the porosity of the weld zone is slightly lower than that of the fusion zone. This is because during the welding process the solid base metal and the liquid molten pool coexist. The solidification rate of the fusion zone is faster and the escape time for the volatile gas is shorter, resulting in more gas remaining in the joint to form pores [26].
3.2. Organizational Analysis
3.2.1. Metallographic Structure Analysis
A group of joints with the best welding formability (welding speed 5 mm/s, welding current 130 A) were selected for T6 heat treatment. The metallographic structure before and after heat treatment is shown in Figure 7 and Figure 8. It was observed that the weld area (WZ) before heat treatment was dominated by equiaxed dendrites, showing as-cast microstructure characteristics. In some areas, a small number of columnar crystals appeared, which was due to the excessive temperature gradient along the weld direction caused by arc movement during welding, and the grain front grew to the center of the weld during crystallization. The fusion zone (FZ), situated between the weld and heat-affected zones, is crucial for joint performance. As only local melting occurs here during welding, its internal microstructure and morphology differ significantly. However, the fusion zone is close to the weld, and due to the excessive temperature gradient, many columnar crystals pointing to the center of the weld are generated. The heat-affected zone is mainly the incomplete phase-change recrystallization zone, in which part of the structure retains the flat microstructure characteristics of the original base metal, and the other part is the fine equiaxed crystal structure formed by recrystallization.
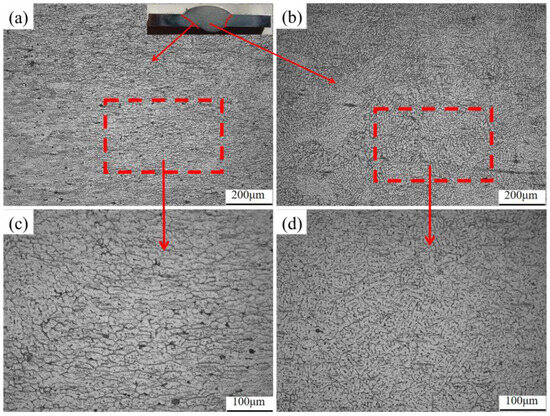
Figure 7.
Metallographic structure of welded joints before heat treatment: (a) fusion zone (100×); (b) weld zone (100×); (c) fusion zone (200×); (d) weld zone (200×).
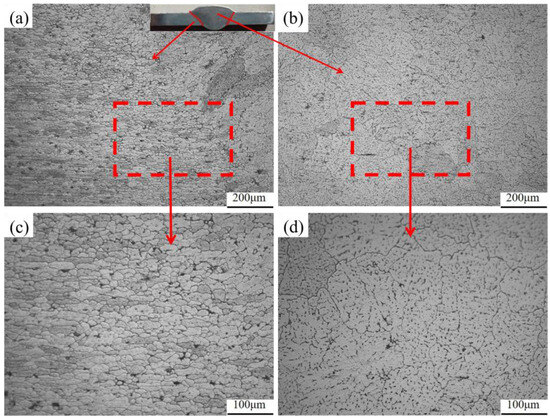
Figure 8.
Grains in each area of the welded joint after heat treatment: (a) fusion zone (100×); (b) weld zone (100×); (c) fusion zone (200×); (d) weld zone (200×).
Compared with the situation before heat treatment, the grains in the weld area grew significantly after heat treatment, but there was no overburning phenomenon, and the microstructure distribution became more uniform. The black precipitated phases that were originally distributed in a network-like layer on the grain boundaries in various regions of the joint basically disappeared after heat treatment. Only some second-phase particles in the form of dispersed dot clusters remained, and the grain boundaries were no longer visible. During artificial aging, more of these strengthening phases are precipitated inside the grain, resulting in fewer precipitated phases being observed between the grains [27,28]. It can be seen from the metallographic structure of the weld that the welded joint has initially formed a solid solution + aging strengthening.
Figure 9 shows electron backscatter diffraction (EBSD) grain orientation distribution diagrams of the joints before and after heat treatment. Each color in the figure represents an orientation difference of 2°–15° between the crystal and the adjacent grains, which can more intuitively indicate the size and morphology changes of the joint grains before and after heat treatment. According to the coloring diagram of each area before and after the heat treatment of the joint, it is found that the grains in each region did not exhibit significantly growth after heat treatment under the IPF diagram. Additionally, the calibration grains in the fusion zone are refined to a certain extent, indicating that the recrystallization occurs in the fusion zone of the welded joint after heat treatment. New fine grains are generated.
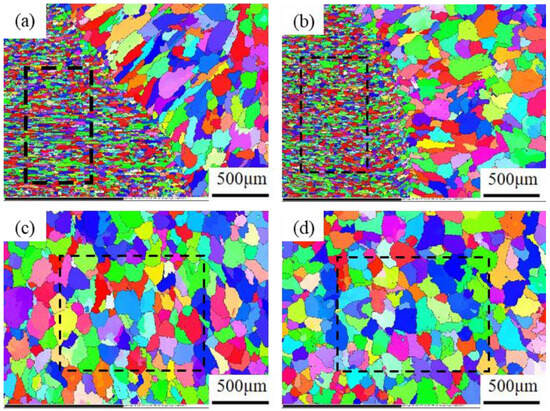
Figure 9.
EBSD grain orientation distribution diagrams of the joints before and after heat treatment: (a) fusion zone; (b) fusion zone (T6); (c) weld area; (d) weld zone (T6).
Figure 10 below shows the grain size statistics of the joint, and the grain statistics area is the heat-affected zone and the weld zone in the red box in Figure 9. According to the statistics, the proportion of small-sized grains in the joints before and after heat treatment was relatively high. The average grain sizes in the heat-affected zone and weld zone before heat treatment were 26.17 μm and 88.35 μm, respectively. After heat treatment, the average grain size of the heat-affected zone decreased by 22.58 μm, while the average grain size of the weld zone did not change significantly by 88.02 μm. Compared with Figure 10a, the specific gravity of the overall data in Figure 10c shifts to the direction of small grains, indicating that with the progress of the solution’s heat treatment, the heat-affected zone undergoes a recrystallization reaction, resulting in varying degrees of grain refinement degrees, with an average size reduction of 13%. Although the average size of the weld zone changed by only 0.3%, it can be seen from Figure 10d that the proportion of large grains has increased compared with that before heat treatment. At the same time, comparing the coloring Figure 9a,c, it can be seen that the orientation of the columnar grains growing in the direction of the vertical fusion line in the weld area on the right side of the fusion line has changed significantly after heat treatment. This alteration serves as an indication that the grains in the fusion zone have also recrystallized and grown during the heat treatment process. Figure 11 shows the joint grain pole diagram, in which it can be seen that the maximum density of grain distribution in the weld zone and the fusion zone decreases after heat treatment, the fusion zone decreases from 5.40 to 4.94, and the weld zone decreases from 2.78 to 2.69. This is because the T6 heat treatment makes the second phase particles remelt into the matrix, reducing the obstacles to grain growth, and the new regenerated grain breaks the original texture orientation, resulting in a decrease in texture strength [29,30].
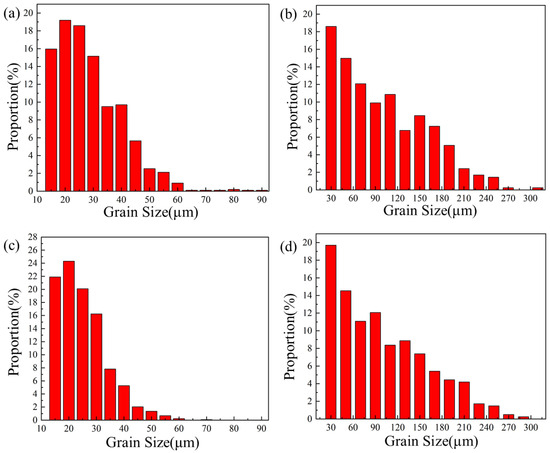
Figure 10.
Grain size distribution of welded joints before and after heat treatment: (a) heat-affected zone; (b) weld zone (c); heat-affected zone (T6); (d) weld zone (T6).
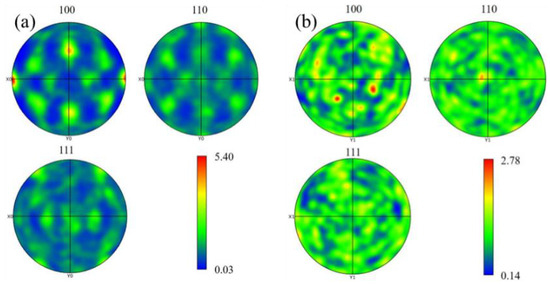
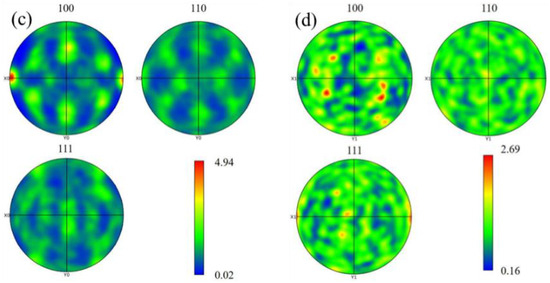
Figure 11.
Grain pole diagram of welded joints before and after heat treatment: (a) fusion zone; (b) weld area; (c) fusion zone (T6); (d) weld zone (T6).
3.2.2. Precipitate Phase Analysis
Traditional 7XXX series aluminum alloys will precipitate a series of strengthening phases during the aging process. The precipitation sequence is as follows: supersaturated solid solution → Guinier−Preston (GP) zones → semi-coherent precipitated phase MgZn2(η’) → incoherent precipitated phase MgZn2(η) → incoherent precipitated phase Mg3Zn3Al12(T). Among these phases, the η’ phase is the main strengthening phase of the 7XXX series aluminum alloys in the peak-aged (T6) state. It has a semi-coherent relationship with the matrix and is evolved from the GP zones when aging at relatively high temperatures. These strengthening phases are dispersed in the aluminum alloy matrix, impeding the movement of dislocations and thus enhancing the strength of the alloys [31,32].
In order to further understand the composition and change in precipitates in the joints after welding of 7075 wire, XRD diffraction analysis was carried out on the joints before and after weld heat treatment. In Figure 12, the five peaks of the α-Al matrix were detected, indicating that there was no obvious grain preference in the joint structure. Before heat treatment, a large number of η(MgZn2) phase and S(CuMgAl2) phase, as well as a small amount of Mg2Si phase, Al13Fe4, and other Fe-containing insoluble impurity phases, were distributed in the joint. However, after heat treatment, due to the fact that most of the non-equilibrium second phase was dissolved back into the matrix, the phases of η(MgZn2) and S(CuMgAl2) decreased sharply and could not be detected. Component detection is required by subsequent EDS point scanning. The insoluble impurity phase of Al13Fe4, whose melting point is much higher than the solution temperature, is difficult to dissolve during solid solution and remains after heat treatment.
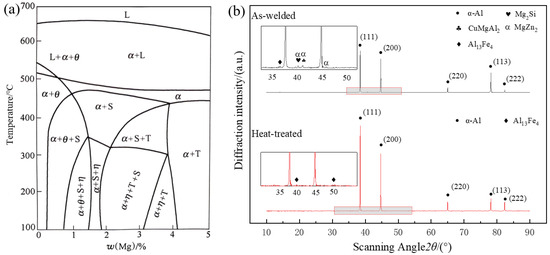
Figure 12.
Phase Diagram of Alloys: (a) Equilibrium diagram of Al-Zn-Mg-Cu series alloys; (b) X-ray diffraction patterns of the weld zone.
In order to analyze the element distribution and precipitated element composition of the self-developed 7075 welding wire after MIG welding, SEM analysis was carried out on the pre- and post-heat-treatment welding joints. According to the EDS surface scanning results of the welded joint in Table 4, it can be seen that the main alloy components in the weld zone and fusion zone are Zn, Mg, Cu, Fe, Si, etc., and the content of alloying elements in the fusion zone is slightly higher than that in the weld zone. After heat treatment, the contents of Zn, Mg, Cu, and other elements in the weld zone and fusion zone increased, while the content of impurity elements such as Fe and Si did not change significantly. As can be seen from Figure 13a,b, the main alloying elements in the welded joint are enriched in large quantities near the grain boundary, among which the segregation of Zn and Cu elements is obvious, and the segregation of Mg element is less. After heat treatment, the segregation of elements was greatly reduced. The Zn element was predominantly and almost entirely dissolved. Merely a minute quantity of Zn was re-precipitated in a diffuse dot pattern. Additionally, the precipitated phases that contained Mg and Cu in punctate and small block forms vanished. But some large bulk and large elongated strips containing Mg and Cu precipitated phases did not successfully form a solid solution, and the second phase particles containing Fe and Si were difficult to dissolve, with some segregation phenomenon still existing after heat treatment.
Table 4.
EDS surface scanning of welded joints (wt. %).
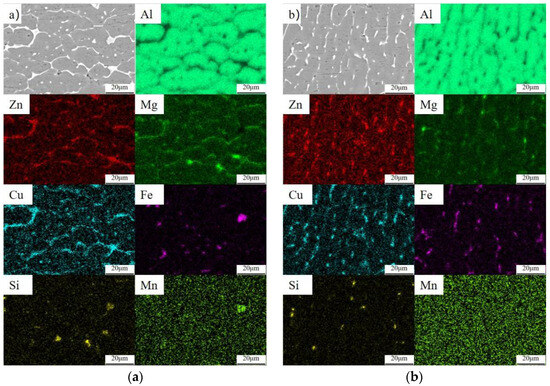
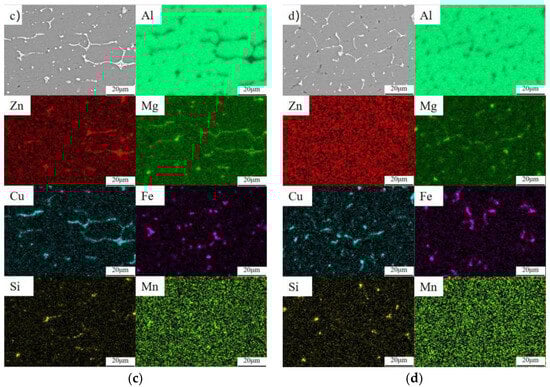
Figure 13.
EDS surface scanning of welded joints before and after heat treatment: (a) fusion zone; (b) weld zone (c); fusion zone (T6); (d) weld zone (T6).
It can be seen from Figure 14 that compared with the welded joint organization, the precipitated phases in both the weld zone and the fusion zone are greatly reduced after heat treatment. Moreover, these results are consistent with the observation of the metallographic structure. Before heat treatment, there were a large number of reticulated long phases (E) and fine punctate (D) precipitated phases in the weld area. However, after heat treatment, only some small elongated phases (at I and K) and diffusely distributed punctate (J) precipitated phases remained. Prior to heat treatment, a significant quantity of banded and punctate precipitated phases were present in the fusion zone. After heat treatment, the precipitated phases in the fusion zone underwent a transformation, changing from the continuous precipitated phases before heat treatment to diffusely distributed point (H) and strip (F) precipitated phases. Moreover, the precipitated phases in both regions were more uniform after heat treatment. The EDS point scan analysis of the precipitated phase in Figure 14 is shown in Table 5. It can be seen that the main body of the weld is composed of α-Al. It can be inferred that a large number of the second phases continuously and densely distributed in the joint before heat treatment are mainly MgZn2, CuMgAl2, and other compounds containing Mg, Zn, and Cu (A, C, D) and insoluble impurity phases containing Fe and Si (at B and E). After heat treatment, most of the η(MgZn2) phases and S(CuMgAl2) phases are solidly dissolved into the matrix, with a few η(MgZn2) phases (K) and S(Al2CuMg) phases (G)that did not solidify into the matrix or re-precipitated, mainly showing rod-like or granular shapes. The morphology of the Fe-containing phases in the weld zone and fusion zone before and after heat treatment is characterized by deep white elongated shapes and regularly shaped blocks [33]. Based on the XRD detection outcomes and the proportion of spot-swept elements, it is determined that the Fe-containing phase (F, H, I) is Al13Fe4. In conjunction with the EDS map of the Si element presented in Figure 13, it is observed that the concentration regions of the Si element and the Mg element exhibit a certain degree of overlap. In addition, some of the black inclusion areas of the joint specimen are also Si-rich regions. So, it is speculated that the overlapping regions of slender strips of Mg and Si elements are Si-containing impurities such as Mg2Si, which have difficulty becoming solid-soluble. The areas designated as (J), where Si is enriched without being Mg-rich, are SiO2, which formed as a result of oxidation following heat treatment [34].
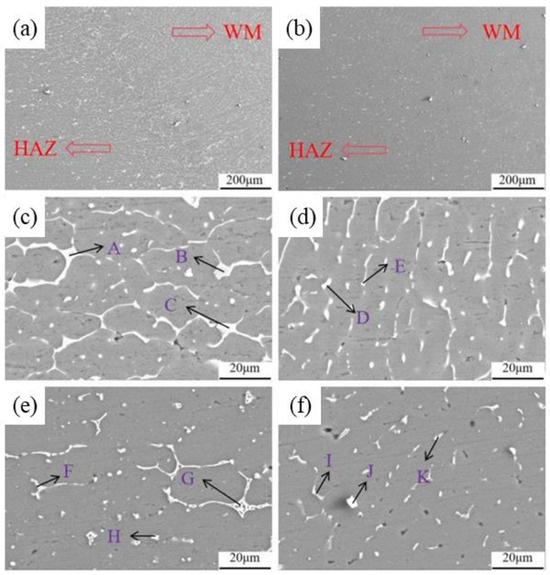
Figure 14.
SEM diagram of the precipitated phase of the welded joint before and after heat treatment: (a) fusion zone; (b) fusion zone (T6); (c) fusion zone; (d) weld zone; (e) fusion zone (T6); (f) weld zone (T6).
Table 5.
EDS spot scanning of welded joints (at.%).
3.3. Analysis of Mechanical Properties
3.3.1. Microhardness Analysis
As depicted in Figure 15, the microhardness profile of the aluminum alloy joint prior to heat treatment exhibits a rather complex nature. The average hardness within the weld area measures 110 HV. Notably, the hardness in the fusion line area attains a minimum value of 95 HV. The hardness of the heat-affected zone is found to be higher than that of both the weld zone and the fusion zone. Moreover, in the direction of the base metal, the hardness displays a tendency of initially increasing and subsequently decreasing at a slow rate. In conjunction with the microstructural analysis, it is evident that the reduction in strength within the weld and fusion zones, as compared to the base material region prior to heat treatment, can be attributed to the substantial burn-off and segregation of strengthening-phase elements. This phenomenon leads to an alteration in the microstructural characteristics and a subsequent degradation in the mechanical properties of these zones. The burn-off of elements disrupts the optimal composition and distribution of the strengthening phases, while the segregation further compromises the homogeneity and integrity of the microstructure, ultimately resulting in a diminished strength performance. The fusion zone exhibits the most severe element segregation. A large number of successive strips of precipitated phases cause the vicinity of the fusion zone to be the lowest point of the overall welded joint performance. The decreasing hardness of the heat-affected zone is due to the softening phenomenon of the aging area, which is composed of two parts, the solution zone and the aging zone. During the welding thermal cycle, the temperature within the over-aging zone remains at a relatively lower level. This insufficient temperature is incapable of dissolving the elements present in the base material, thereby leading to a severe segregation of the strengthening phase and a coarsening in its size. In addition, during the heat cycle, the external gas atoms are easy to gather in the dislocation during thermal processing to form gas masses, resulting in the embrittlement of the material. Recrystallization softening + aging softening under the thermal cycle makes the hardness value of the heat-affected zone slowly decrease. After heat treatment, the hardness of each region was obviously similar; the average hardness was 150.24 HV, and the highest microhardness reached 163 HV. Compared with before heat treatment, the hardness of each area of the joint has been significantly improved, which is due to the reduction of element segregation in each area after the solution aging treatment of the joint. During the aging process, the precipitation phase, which was originally in a continuous bulk distribution, is re-precipitated in the form of diffusion points. Under the combined effect of second-phase strengthening and diffusion strengthening, the hardness of the welded joint is remarkably enhanced and reaches the average hardness of the base metal. In terms of hardness, 7075 welded joints have met the performance requirements. It is worth mentioning that there is a huge difference in the hydrogen solubility of aluminum alloys between the liquid and solid states. The hydrogen precipitation in the weld is inevitable, which will lead to fluctuations of the hardness in the joint area within a certain range. As can be seen from Figure 6, the porosity in the fusion zone is higher. Therefore, compared with the weld zone, the hardness value in the fusion zone is more unstable, and the fluctuation value reaches nearly 15 HV.
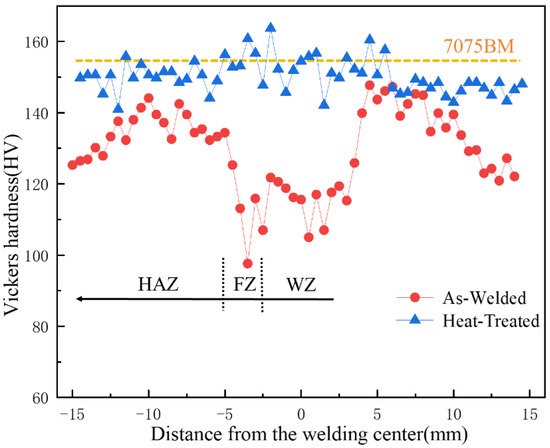
Figure 15.
The distribution of microhardness of welded joints of non-heat-treated and heat-treated.
3.3.2. Analysis of Tensile and Flexural Properties
Figure 16 below shows the stress–strain curves of the tensile test of the welded joint before and after heat treatment. It can be observed that after T6 heat treatment, both the strength and ductility of 7075 aluminum alloy welded joints are significantly improved, exhibiting a “double increase effect”. Moreover, the tensile strength increased from 326 MPa to 536 MPa, and the elongation after fracture is increased from 4.02% to 6.95%. This indicates that T6 heat treatment can simultaneously enhance the strength and plasticity of the aluminum alloy joint. The originally severely segregated strengthening phases, such as MgZn2, were re-dissolved into the matrix and re-precipitated in a dispersed, point-like form. Combining the results of EBSD analysis, it is evident that the grain refinement of the welding joint, along with second-phase strengthening and dispersion strengthening, led to a significant increase in overall strength. Ultimately, the tensile strength of the joint approached that of the base material, meeting the principle of equal strength during welding.
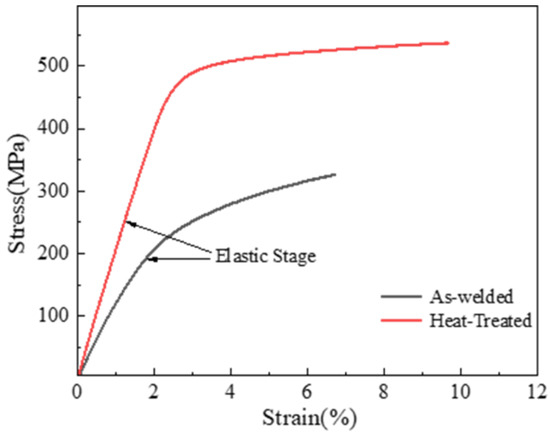
Figure 16.
Stress–strain curves.
As shown in Figure 17, the metallographic position of the joint fracture after heat treatment, the tensile fracture position occurs near the weld side of the fusion zone. As can be observed from Figure 17, the structure in the vicinity of the fusion line exhibits a characteristic equiaxed crystal structure that develops along the direction of the heat dissipation. Notably, certain structures at the fracture site display evident deformation, and the fracture mode is determined to be a transgranular fracture. The change in the fracture position of the tensile specimen combined with the stress–strain curve also indicates an increase in the overall mechanical properties of the welded joint.
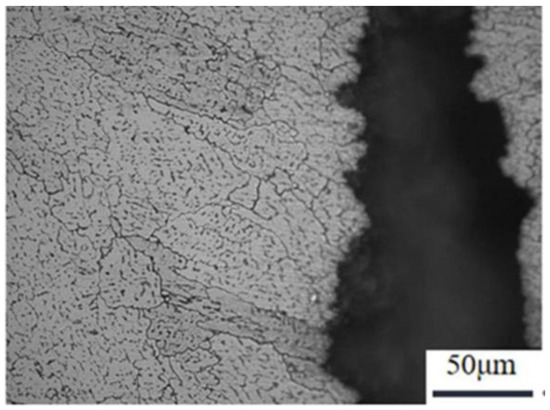
Figure 17.
Metallographic positions of welded joints after heat treatment.
As shown in Figure 18, the SEM diagram of the tensile fracture of the joint before and after heat treatment, it can be seen that the fracture morphology of the joint before and after heat treatment is similar as a whole, and the ductile fracture is the main one. The fracture morphology before heat treatment is mainly composed of dimples of different sizes and depths. In some areas, the fracture surface will have large dimples and quasi-cleavage surfaces, and a small part of the area will have river-like tear ridges, which are plastic fracture characteristics. After heat treatment, the characteristics of the solution are reduced, and the size of the dimple is reduced compared with that before heat treatment. The fracture surface is densely populated with a substantial quantity of fine and uniformly distributed dimples. This manifestation implies that, in comparison to the pre-heat-treatment state, the tensile strength of the joint has been enhanced following heat treatment. Although a cleavage surface persists after heat treatment, its dimensions have been diminished relative to those of the cleavage surface prior to the heat treatment process. There is continuous rock-sugar-like morphology attachment on the fracture surface of the joint, which is caused by the oxidation of the fracture surface in the air. Some of the dimple cavities contain pores or black inclusions. The coexistence of the cleavage surface and a large number of dimples, along with the elongation after fracture, suggests that the plasticity improvement of the joint after heat treatment is not pronounced.
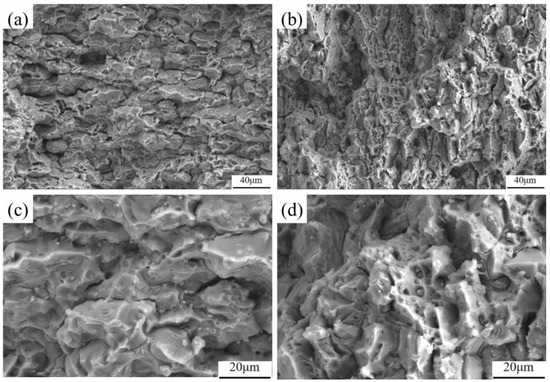
Figure 18.
Morphology of SEM fractures of welded joints before and after heat treatment: (a,c) fracture morphology before heat treatment; (b,d) fracture morphology after heat treatment.
It can be seen from the tensile test of the welded joint that the joint can significantly improve the strength of the joint after heat treatment, but the plasticity improvement is limited. Therefore, the three-point bending test was carried out on the spray formed 7075 welded joint to further detect the flexural strength of the joint. The test results are shown in Table 6 and Figure 19. Before heat treatment, the plasticity of the welded joint was poor, and the joint could not be bent into a U-shaped or V-shaped configuration, with an average bending cracking angle of 22° and a bending strength of 311.4 MPa. After heat treatment, the bending cracking angle was slightly increased to 49°, and the bending strength was significantly increased to 481.5 MPa. At the same time, it was observed that the non-heat-treated samples in the tensile and flexure tests were damaged near the fusion line. The underlying reason for such a result is that the presence and accumulation of pores and inclusions in the vicinity of the fusion zone give rise to a more intricate internal stress magnitude and direction. This, in turn, directly leads to a reduction in the mechanical properties of the joint during the testing process, thereby manifesting as a relatively low performance level.
Table 6.
Results of joint flexure test before and after heat treatment.
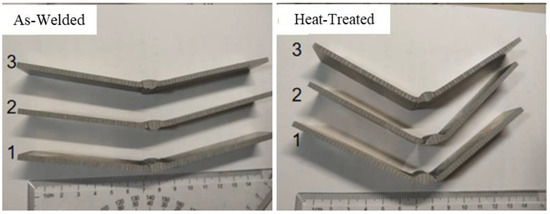
Figure 19.
Bending specimens of welded joints before and after heat treatment.
4. Conclusion
- (1)
- The injection molding–extrusion–drawing 7075 aluminum alloy welding wire offers a wide welding process window, with a shielding gas flow ranging from 17.5 to 20 L/min, welding speed between 5 mm/s and 7 mm/s, and welding current from 100 A to 150 A. This results in well-formed joints without defects, effectively addressing the issue of poor weldability and ensuring reliable welding operations in industrial applications.
- (2)
- Before heat treatment, the presence of MgZn2, CuMgAl2, Mg2Si, and Al13Fe4, along with other Fe-containing insoluble impurity phases, mainly concentrated in the grain boundary in a coarse network or long strip, which became the main reason for the softening of the joint. After heat treatment, although the coarsening of the joint grains is still obvious, most of the precipitated phases in the joint are dissolved, and the element segregation phenomenon is improved. The residual precipitated phase is mainly Al13Fe4 and a small amount of Fe and Si insoluble phases; the heat-affected zone is recrystallized during solid solution, which makes the average grain size refined and improves the weak area of the joint.
- (3)
- Using the 7075 welding wire prepared by the spray forming–extrusion–drawing process for 7075 aluminum alloy butt MIG welding, a welded joint with hardness performance much higher than that of 5XXX welding wire can be obtained [35]. The tensile strength is increased from 326 MPa to 536 MPa, reaching 97.5% of that of the 7075 base metal. Meanwhile, the average microhardness is further increased from 110 HV to 150.24 HV. Thus, under suitable heat-treatment conditions, 7XXX series welding wire can replace 5XXX series welding wire, providing joints with enhanced performance and solving the problem of limited performance in welded joints of aluminum alloys.
Author Contributions
Conceptualization, X.L. and G.H.; methodology, C.Z., X.L. and G.H.; writing—original draft preparation, C.Z. and G.H.; formal analysis, C.Z. and G.H.; funding acquisition, X.L. validation, X.L.; writing—review and editing, X.L. and C.Z.; date collection and analysis, G.H. and C.Z. All authors have read and agreed to the published version of the manuscript.
Funding
This research was supported by the Postgraduate Research & Practice Innovation Program of Jiangsu Province (Grant No.: XSJCX23_76).
Data Availability Statement
The original contributions presented in the study are included in the article, further inquiries can be directed to the corresponding author.
Acknowledgments
The authors are grateful to H. Zhang and R. Tong for providing technical assistance. The authors also thank H. Kang and H. Sun for their valuable discussions.
Conflicts of Interest
The authors declare that they have no known competing financial interests or personal relationships that could have appeared to influence the work reported in this paper.
References
- Ni, W.Y.; Yang, S.L.; Jia, J. Structure and properties of high-strength A7N01 aluminum alloy welded joints for high-speed trains. Therm. Process Technol. 2014, 43, 22–25. [Google Scholar]
- Yang, Y.; Zhao, M.Y.; Wang, G.Y. Application of aluminum alloy lightweight in automobiles. Res. Longjiang 2022, 13, 42–44. [Google Scholar]
- Zhang, L.J. Research on the application and development trend of aerospace high-strength aluminum alloy materials. Adv. Mater. Ind. 2021, 3, 7–11. [Google Scholar]
- Gu, K.D.; Gao, Z.L.; Li, S.J. Application status and applicability analysis of 7 series aluminum alloy in Shanghai rail transit vehicles. Urban Rail Transit Res. 2022, 25, 141–145. [Google Scholar]
- Guo, X.; Zhao, Z.H. Research status of aluminum alloy welding wire production. Light Alloy Process. Technol. 2023, 51, 1–6. [Google Scholar]
- Xing, Y.H. Effect of Extrusion Speed on Microstructure and Hardness of Al-Zn-Mg-Cu High-strength Aluminum Alloy. Hot Process Technol. 2021, 50, 88–90. [Google Scholar]
- Xiong, L.B. Discussion on production technology of high-quality 5356 aluminum welding wire. Des. Res. Nonferrous Metall. 2022, 43, 25–29+51. [Google Scholar]
- Chen, J.W.; Ling, K.; Pan, D.; Mo, W.F.; Tang, C.L. Effect of Mg Content on Microstructure and Properties of ER5356 Aluminum Alloy Welding Wire Lamination. Ordnance Mater. Sci. Eng. 2024, 47, 108–113. [Google Scholar]
- Lu, P. Effect of the annealing process on the microstructure and performance of 5056 aluminum alloy wires. Metals 2022, 12, 823. [Google Scholar] [CrossRef]
- Fang, H.J.; Liu, H.; Sun, J. Research status and development trend of 5xxx series aluminum alloy. Mater. Rep. 2023, 37, 211–220. [Google Scholar]
- Wang, J.; Chen, X.; Yang, L.; Zhang, G. Effect of preheat & post-weld heat treatment on the microstructure and mechanical properties of 6061-T6 aluminum alloy welded sheets. Mater. Sci. Eng. A 2022, 841, 143081. [Google Scholar]
- Ogunsemi, B.T.; Abioye, T.E.; Ogedengbe, T.I.; Zuhailawati, H. A review of various improvement strategies for joint quality of AA 6061-T6 friction stir weldments. J. Mater. Res. Technol. 2021, 11, 1061–1089. [Google Scholar] [CrossRef]
- Dong, J.; Zhang, D.; Zhang, W.; Cao, G.; Qiu, C. Effect of post-weld heat treatments on the microstructure and mechanical properties of underwater friction stir welded joints of 7003-T4/6060-T4 aluminum alloys. Mater. Sci. Eng. A 2023, 862, 144423. [Google Scholar] [CrossRef]
- Wang, Z.Z.; Li, X.P.; Liu, X.; Wang, C.Y. Study on Microstructure and Properties of 7075 Aluminum Alloy Joints. Hot Work. Technol. 2024, 1, 1–6. [Google Scholar]
- Oropeza, D.; Hofmann, D.C.; Williams, K.; Firdosy, S.; Bordeenithikasem, P.; Sokoluk, M.; Liese, M.; Liu, J.; Li, X. Welding and Additive Manufacturing with Nanoparticle-Enhanced Aluminum 7075 Wire. J. Alloys Compd. 2020, 834, 154987. [Google Scholar] [CrossRef]
- Zhang, K.; Liu, Z. Effect of Solution Treatment on Microstructure and Mechanical Properties of Homogeneous TIG Welded Joint of 7075 Aluminum Alloy. Hot Work. Technol. 2019, 3, 83–88. [Google Scholar]
- Song, Y.B.; Li, L.; Lv, J.M.; Yan, A.; Zhou, D.J. Research Status and Prospect of 7xxx Series Aluminum Alloy Welding. Chin. J. Nonferrous Met. 2018, 28, 492–501. [Google Scholar]
- Wang, C.Y.; Li, X.P.; Liu, X. Comparative Study on Performance of 7075 and ER5356 Aluminum Alloy Welding Wire for 7075 Aluminum Alloy MIG Welding Joint. World Nonferrous Met. 2023, 1, 145–147. [Google Scholar]
- GB/T 2651-2023; General Administration of Quality Supervision, Inspection and Quarantine of the People’s Republic of China. Destructive testing of welds on metallic materials—Transverse tensile testing. Standards Press of China: Beijing, China, 2023.
- GB/T 2653-2008.; General Administration of Quality Supervision, Inspection and Quarantine of the People’s Republic of China. Bend test methods on welded joints. Standards Press of China: Beijing, China, 2008.
- ISO 17639:2022; International Organization for Standardization. Destructive tests on welds in metallic materials — Macroscopic and microscopic examination of welds. ISO: Geneva, Switzerland, 2022.
- Coniglio, N.; Cross, C.E. Effect of weld travel speed on solidification cracking behavior. Part 1: Weld metal characteristics. Int. J. Adv. Manuf. Technol. 2020, 107, 5011–5023. [Google Scholar] [CrossRef]
- Yan, S.H.; Chen, H.; Ma, C.P. Local corrosion behavior of hybrid laser-MIG welded Al-Zn-Mg alloy joints. Mater. Des. 2015, 88, 1353–1365. [Google Scholar] [CrossRef]
- Zhang, Y.; Song, X.P.; Chang, L.Y.; Wu, S.C. Fatigue lifetime of Laser-MIG hybrid welded joint of 7075–T6 aluminum alloy by in-situ observation. Rare Met. Mater. Eng. 2017, 46, 2411–2416. [Google Scholar]
- Li, L.; Meng, S.; Peng, J. Correlation Analysis of Bubble Motion and Porosity in Molten Pool of Aluminum Alloy Laser Welding. J. Weld. Sci. 2018, 39, 1–6+129. [Google Scholar]
- Gao, Z.A.; Yan, W.Q.; Liu, D.; Hu, Y.L.; Nan, J. Analysis on porosity distribution and formation causes of MIG welding of aluminum-magnesium alloy. Met. Process. 2022, 1, 29–32. [Google Scholar]
- Wang, L. Effect of Impurity Element Content on Microstructure and Properties of 7075 Aluminum Alloy. Cast. Technol. 2014, 35, 1029–1031. [Google Scholar]
- Guo, L.X.; Li, X.P.; Liu, X.; Wang, B.; Wang, Z.Z. Structure and properties of 7075 aluminum alloy TIG weld welds with corrosion resistance. Trans. China Weld. Inst. 2022, 43, 104–112. [Google Scholar]
- Zeng, H.; Wang, Z.; Chen, D. Effect of Sc on Microstructure and Properties of ER5356 Welding Wire Joint. Ordnance Mater. Sci. Eng. 2024, 7, 1–9. [Google Scholar]
- Fu, X.Q.; Ji, Y.C.; Cheng, X.Q.; Dong, C.F.; Fan, Y.; Li, X.G. Effect of Grain Size and Its Uniformity on Corrosion Resistance of Rolled 316L Stainless Steel by EBSD and TEM. Mater. Today Commun. 2020, 25, 101429. [Google Scholar] [CrossRef]
- Löffler, H.; Kovács, I.; Lendvai, J. Decomposition processes in Al-Zn-Mg alloys. J. Mater. Sci. 1983, 18, 2215–2240. [Google Scholar] [CrossRef]
- Rometsch, P.A.; Zhang, Y.; Knight, S. Heat treatment of 7xxx series aluminium alloys-Some recent developments. Trans. Nonferrous Met. Soc. China 2014, 24, 2003–2017. [Google Scholar] [CrossRef]
- Zou, Y.; Cao, L.; Wu, X.; Mou, C.; Tang, S.; Lin, X. Unusual Secondary Precipitation within the Primary Precipitation Free Zone Substantially Enhances the Ductility of Al-Zn-Mg-Cu Alloy. Mater. Sci. Eng. A 2023, 881, 145384–145390. [Google Scholar] [CrossRef]
- Peng, X.; Li, Y.; Xu, G.; Huang, J.; Yin, Z. Effect of Precipitate State on Mechanical Properties, Corrosion Behavior, and Microstructures of Al-Zn-Mg-Cu Alloy. Met. Mater. Inter. 2018, 24, 1046–1057. [Google Scholar] [CrossRef]
- Choundraj, J.D.; Kacher, J. Influence of Misorientation Angle and Local Dislocation Density on β-Phase Distribution in Al 5xxx Aloys. Sci. Rep. 2022, 12, 1817. [Google Scholar]


Disclaimer/Publisher’s Note: The statements, opinions and data contained in all publications are solely those of the individual author(s) and contributor(s) and not of MDPI and/or the editor(s). MDPI and/or the editor(s) disclaim responsibility for any injury to people or property resulting from any ideas, methods, instructions or products referred to in the content. |
© 2024 by the authors. Licensee MDPI, Basel, Switzerland. This article is an open access article distributed under the terms and conditions of the Creative Commons Attribution (CC BY) license (https://creativecommons.org/licenses/by/4.0/).