Article

Thermal Evolution of Expanded Phases Formed by PIII Nitriding in Super Duplex Steel Investigated by In Situ Synchrotron Radiation

by
Bruna Corina Emanuely Schibicheski Kurelo
1,*,
João Frederico Haas Leandro Monteiro
2,
Gelson Biscaia de Souza
1,
Francisco Carlos Serbena
1,
Carlos Maurício Lepienski
3,
Rodrigo Perito Cardoso
4 and
Silvio Francisco Brunatto
5
1
Laboratory of Mechanical Properties and Surfaces, Department of Physics, State University of Ponta Grossa, Campus Uvaranas, Ponta Grossa 84030-000, Brazil
2
Interdisciplinary Center of Fluid Dynamics, Federal University of Rio de Janeiro, Rio de Janeiro 21941-594, Brazil
3
Postgraduate Program in Mechanical and Materials Engineering, Federal Technological University of Paraná, Campus Ecoville, Curitiba 81280-340, Brazil
4
LabMat, Department of Mechanical Engineering, Federal University of Santa Catarina, Campus Trindade, Florianópolis 88040-900, Brazil
5
Department of Mechanical Engineering, Federal University of Paraná, Curitiba 81531-980, Brazil
*
Author to whom correspondence should be addressed.
Metals 2024, 14(12), 1396; https://doi.org/10.3390/met14121396
Submission received: 31 October 2024 / Revised: 29 November 2024 / Accepted: 2 December 2024 / Published: 5 December 2024

Abstract

:
The Plasma Immersion Ion Implantation (PIII) nitriding was used to form a modified layer rich in expanded austenite (γN) and expanded ferrite (αN) phases in super duplex steel. The thermal stability of these phases was investigated through the in situ synchrotron X-ray diffraction. All the surfaces were analyzed by SEM, EDS, and nanoindentation. During the heating stage of the thermal treatments, the crystalline structure of the γN phase expanded thermally up to a temperature of 350 °C and, above this temperature, a reduction in the lattice parameter was observed due to the diffusion of nitrogen into the substrate. During the isothermal heating, the gradual diffusion of nitrogen continued and the lattice parameter of the γN phase decreased. Increasing the treatment temperature from 450 °C to 550 °C, a greater reduction in the lattice parameter of the γN phase occured and the peaks related to the CrN, α, and αN phases became more evident in the diffractograms. This phenomenon is associated with the decomposition of the γN phase into CrN + α + αN. After the heat treatments, the thickness of the modified layers increased and the hardness values close to the surface decreased, according to the diffusion of the nitrogen to the substrate.

Graphical Abstract

1. Introduction

Low-temperature plasma nitriding (up to 400 °C) is generally used on stainless steels to improve mechanical properties and wear resistance without compromising corrosion resistance [1,2,3,4]. Plasma immersion ion implantation (PIII) is a technique that allows working in this temperature range and combines ion implantation with plasma immersion effects, being advantageous to the production of uniform modified layers and the possibility of treating of samples with complex geometries [5,6].
Most of the research on nitriding by PIII focuses on austenitic stainless steels. In this case, within the temperature range of 300 °C to 400 °C, a modified layer predominantly containing expanded austenite (γN) phase is formed, with up to 38% at. of nitrogen in solid solution [1,7]. In duplex stainless steels, that have a microstructure based on the mixture of ferrite (α) and austenite (γ) phases, the results on the identification of the phases formed in the previously ferritic grains are still controversial and there is no consensus on the mechanism of phase formation after nitriding. Some articles identify the formation of the γN phase and expanded ferrite (αN), which is also a nitrogen-rich in solid solution phase [8,9,10,11], while other works indicate a transition from ferrite (α) to γ in previously ferritic grains due to nitrogen being an austenitizing element [12,13,14,15]. Other works indicate the formation of nitrides, especially in ferritic grains [16,17].
The αN and γN phases correspond to several superimposed FeN sub-stoichiometries of the nitrogen in solid solution. In general, these phases are desirable because they give stainless steels high hardness and wear resistance properties without compromising corrosion resistance. However, these phases are metastable and decompose with increasing temperature. Furthermore, the UNS S32750 super duplex stainless steel used in this work is generally used in deep-water oil extraction and in the Brazilian pre-salt layer where temperatures can reach 150 °C [18,19], but when applied in the chemical industry, this material can be subjected to high temperatures. Therefore, for the applicability of nitriding in these materials, there is a need for studies on the thermal stability of the γN phase in duplex steels.
There are some thermal stability studies on the γN phase that have been conducted in austenitic stainless steels. In this case, according to Manova et al. (2017), for the decay of the γN phase at 400 °C, 10 h of annealing at 400 °C is required [1]. While annealing in the temperature range of 200 °C to 300 °C, it is estimated that the decay of the γN phase occurs in an interval between 1000 and 10,000 h, depending on the activation energy [1]. Already in the work of Maistro et al. (2017), also conducted on austenitic steels, it is estimated that at a temperature of 450 °C, the total decomposition of the γN phase occurs after an annealing period of 1000 h [20]. Several works cite the following decomposition reaction for the γN phase: γ N C r N + α + γ [1,20,21,22,23,24]. In ferritic steel nitrided by PIII at 300 °C, containing only ε nitride, after annealing at 400 °C for 4 h, the ε phase is almost completely converted to αN [25]. In super-ferritic steel, the αN phase has its lattice parameter reduced due to the diffusion of nitrogen from the layer to the substrate, and the γN phase is partially converted to CrN + α after annealing at 450 °C for 124 min [26].
Compared to austenitic steels, in duplex steels, the high nitrogen diffusion coefficient in ferrite can lead to lower thermal stability of the phases formed [21]. In a ferritic grain, not only the phase formed during nitriding but, also, the thermal decomposition is strongly dependent on the chemical composition [21,25]. Furthermore, in duplex steels, there is a complex effect of lateral diffusion of nitrogen from ferrite to austenite, which can interfere with the thermal evolution of the phases present in the modified layers [9].
In the diffractograms, the peaks of ε-Fe2-3N, γ′-Fe4N, and CrN nitrides are generally overlapped with peaks related to expanded γN and αN phases, making indexing these phases difficult. Heat treatments combined with the X-ray diffraction technique on nitrided samples can aid in the detection of nitrides since the metastable phases γN and αN can decompose at lower temperatures and treatment times.
The in situ synchrotron X-ray diffraction (ISS-XRD) technique allows for the gradual monitoring of the material’s evolution, since the tests are carried out in a relatively short time [26]. Using the PIII technique, we performed the nitriding process on UNS S32750 super duplex steel, causing the formation of a layer over the ferrite and austenite phases, and we investigated the influence of heat treatment using ISS-XRD on the microstructure of this layer.

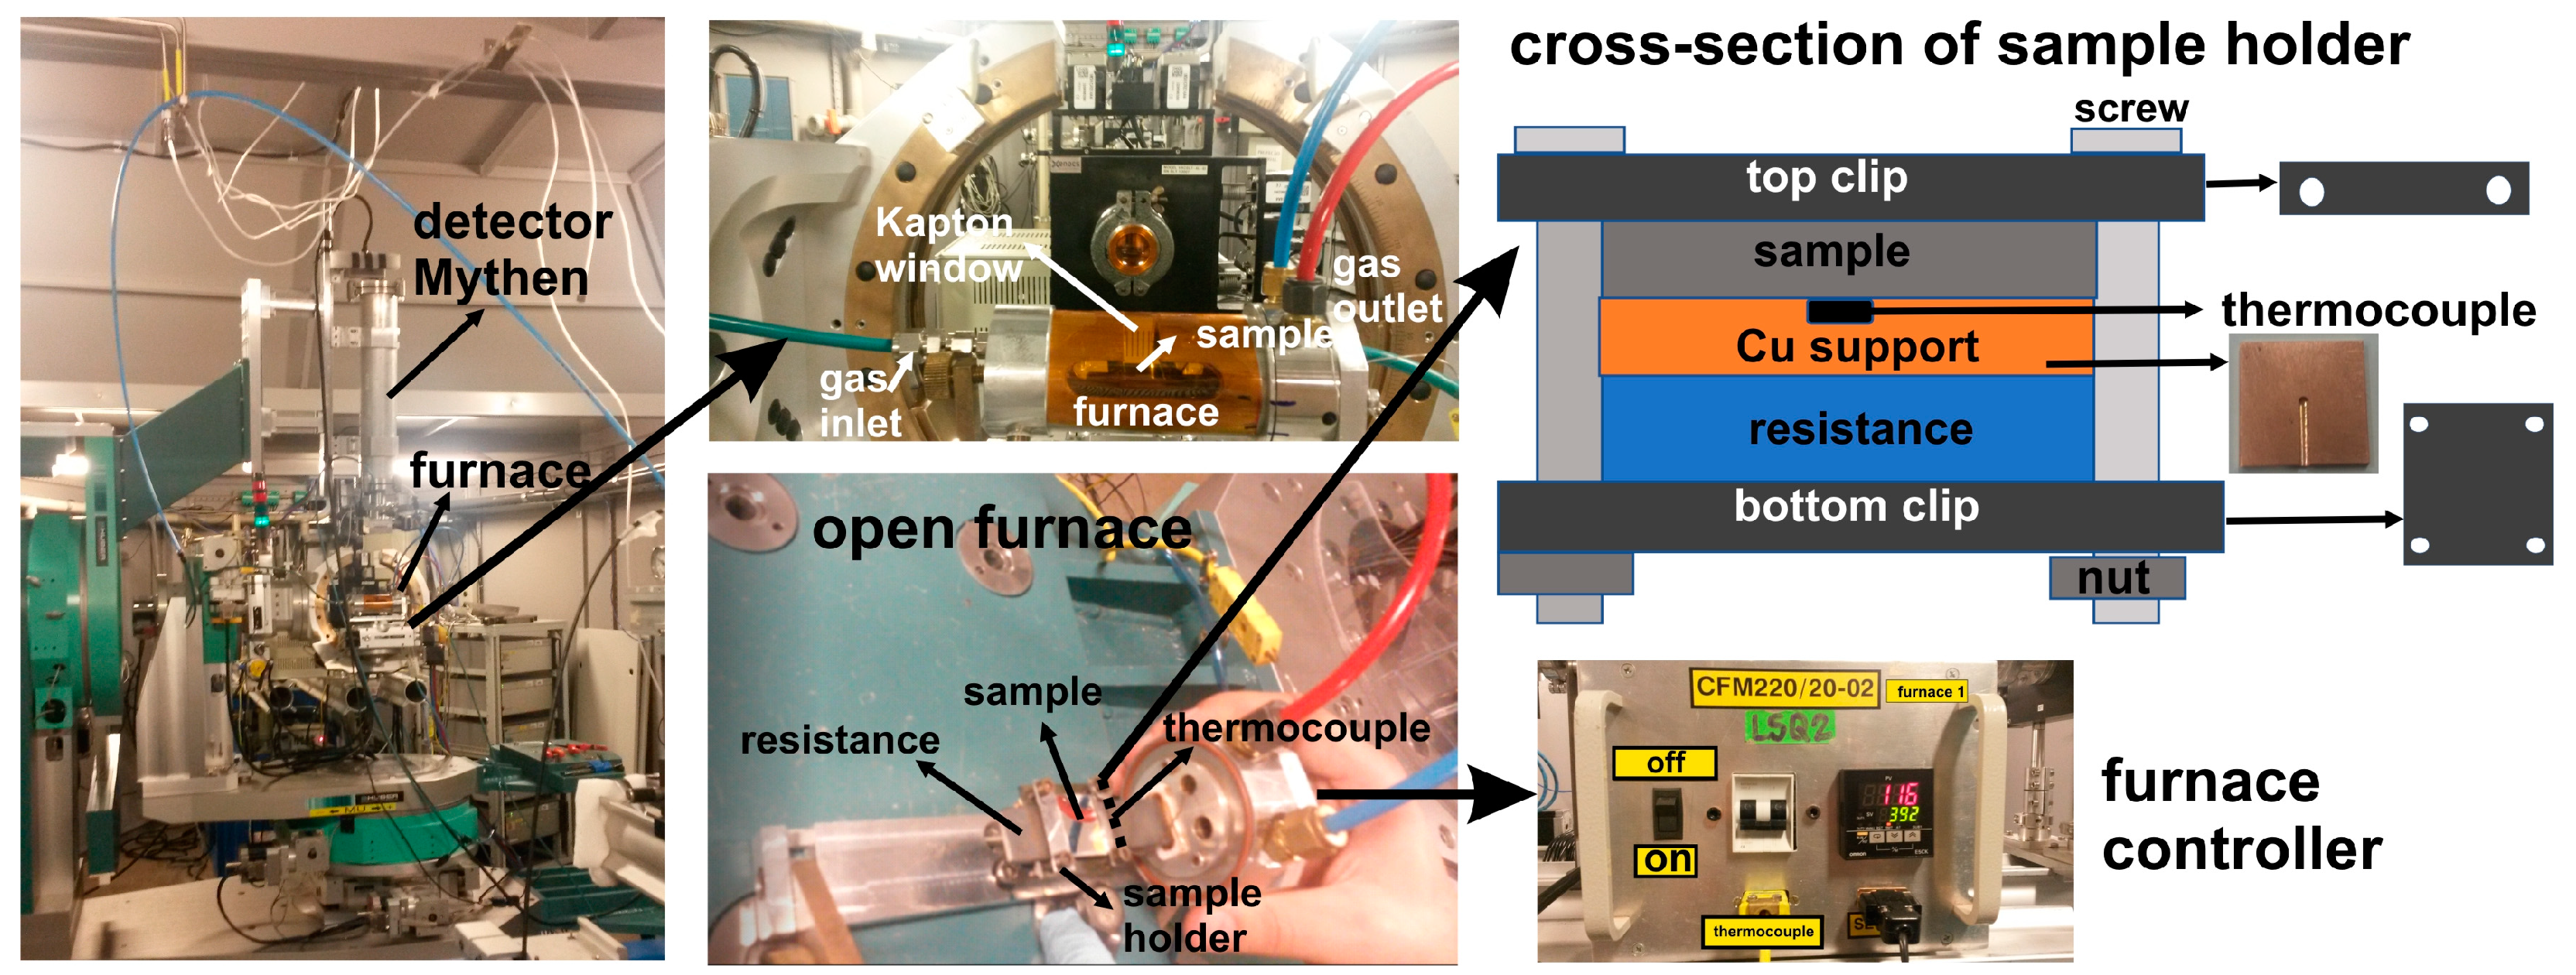
2. Materials and Methods

The chemical composition of the UNS S32750 super duplex stainless steel, presented in Table 1, was obtained using wavelength dispersive X-ray spectroscopy (WDS, Rigaku ZSX Primus II, Rigaku, Tokyo, Japan) analysis. Samples measuring 20 × 20 × 2 mm were mechanically polished to a specular finish using SiC sandpapers, diamond pastes, and colloidal silica down to 0.05 µm. Then, the samples were cleaned in ultrasonic bath prior to nitriding in a plasma immersion ion implantation equipment (PIII-25/Plasma-LIITS, Villares Metals Company, Sumaré, Brazil). The equipment diagram was previously presented in Oliveira et al. (2018) [16].
The treatment parameters were selected from a separate experiment, still to be published, where the same steel was plasma nitrided at different temperatures (300–400 °C) and times (2–8 h) by varying ion fluences and pulse energies. Among all the studied conditions, the condition of 350 °C and 3 h showed the most similar modifications in both ferrite and austenite grains, with predominance of the expanded phases. This condition was chosen as the basis for a more in-depth investigation in the present study.
The first step of the nitriding procedure was a surface cleaning process by ion sputtering in a plasma atmosphere of 1.75 sccm Ar + 0.75 sccm H2 for 20 min, at temperatures below 250 °C. Then, nitriding was performed in a 2.85 sccm N2 + 1.9 sccm H2 atmosphere, achieving a pressure of 3 Pa for 4 h at 350 °C. This starting condition was labeled as 350-4. Table 2 shows the sample’s nomenclature and the corresponding treatment conditions.
After nitriding, samples were cross-sectioned and the exposed region was polished and etched with Murakami’s reagent (3 g KOH, 3 g K3Fe(CN)6, and 6 mL H2O) at 80 °C for 5 min. The morphological characteristics of the layers were analyzed through field emission scanning electron microscopy (FEG-SEM) Tescan-MIRA 3, coupled with an energy dispersive spectroscopy (EDS) system for chemical composition analysis.
The crystalline structure was characterized by in situ synchrotron X-ray diffraction (ISS-XRD) technique, with energy of 7 keV (λ = 0.1773 nm) and incidence angle fixed at 2° and 10°, produced at the XRD2 beamline of the Brazilian Synchrotron Light Laboratory (LNLS, Campinas, Brazil). The specimens were positioned in a furnace model F1000 (accuracy of 1 °C) with a Kapton window for the X-ray transmission, submitted to an inert He flux and a heating rate of 10 °C/min. The schematic diagram of the experimental arrangement was presented previously [26]. Figure 1 presents the experimental setup for thermal treatments using in situ synchrotron X-ray diffraction.
The samples heat-treated at 450 °C and 550 °C were labeled as TT450 and TT550, respectively, as summarized in Table 2. These two temperatures were chosen to provide insights into the thermal evolution of different phases produced in ferrite and austenite grains, as well as into the expanded phase decay at high temperatures. With one of the samples positioned on the holder, a sequence of diffractograms was taken: (i) at room temperature; (ii) during heating; (iii) at the isothermal stage, holding the maximum temperature; and (iv) after the system has been cooled back spontaneously to room temperature.
The time under the constant temperature of 450 °C was 124 min. In the 550 °C experiment, it was interrupted after 94 min, when most of metastable phases had decayed, as evidenced by the in situ monitoring.
The XRD patterns were analyzed using the crystallographic PDF cards of the phases, precipitates and oxides, as well as considering the thermal expansion coefficients of the phases from the literature [23,27,28,29,30]. Furthermore, the FityK 1.3.1 software allowed the nonlinear curve fitting of the diffractograms [31] by employing pseudo-Voigt functions, while area-weighted averages were applied to determine the central position of each peak, as previously reported [26,32].
The mechanical properties, namely hardness and elastic modulus, were measured through nanoindentation analyses with a UNAT instrumented indenter (Zwick-Roell/Asmec) and Berkovich-type diamond tip. The maximum load used was 400 mN and applied in approximately 36 different regions on the surfaces by following the quasi-continuous stiffness measurement method. The tip area function was calibrated with quartz and sapphire standards.

3. Results and Discussions
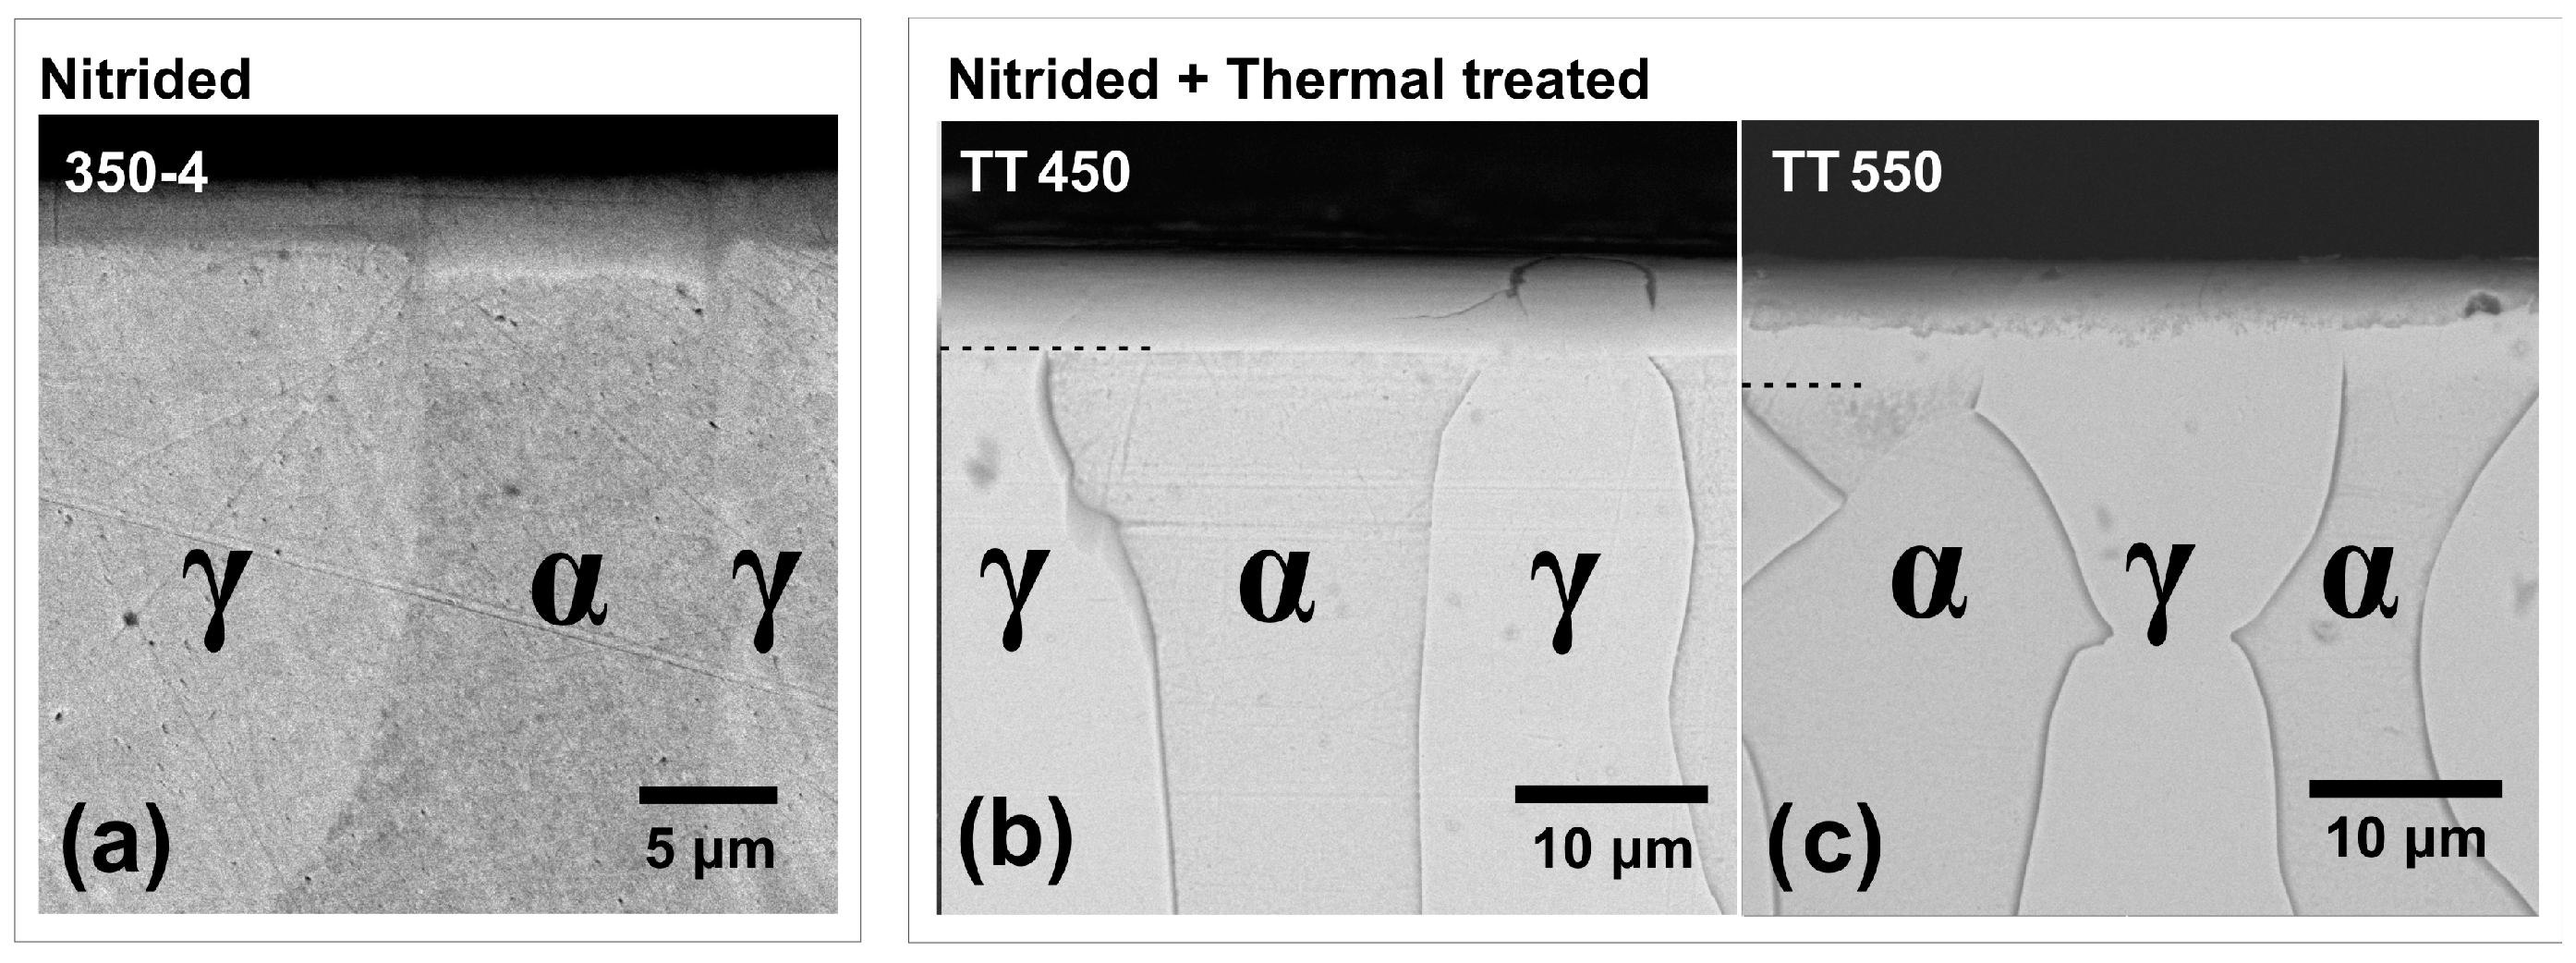
3.1. Microstructure

Figure 2 shows the modified layers formed after nitriding and the heat treatments. In Figure 2a, the layer thickness of the nitrided-only condition, sample 350-4, was measured as 3.7 ± 0.3 µm in regions over the ferrite phase (α) and approximately 2.9 ± 0.4 µm over the austenite phase (γ). The difference in layer thicknesses in each phase relates to the well-known higher nitrogen diffusion in ferrite, similarly as reported in other works [2,8,10]. However, nitrogen diffusion in duplex steels is a complex phenomenon that involves lateral diffusion between grains of different phases, as well as a nitrogen-mediated ferrite to expanded austenite transformation [1,2,14]. Therefore, there is still no consensus on layer growth in distinct phases of duplex steels. In some studies, unlike what is observed here, the layer thickness was reported to be similar ferrite and austenite grains, while, in other studies, the thickness is greater in austenite grains as compared to original ferrite grains [12,13,16]. Under the heat-treated condition at 450 °C, Figure 2b, the layer thickness was estimated to be around 5.1 ± 0.2 µm. In this case, the heat treatment increased and uniformized the modified layer thickness due to nitrogen diffusion. The same effect occurred in the 550 °C heat treatment, Figure 2c. In this case, the layer thickness was estimated at 5.9 ± 0.7 µm, because of the temperature-enhanced nitrogen diffusion. This is not the sole effect, as the formation of nitride precipitates, as CrN, hinders the N diffusion during heat treatment [33]. This subject will be taken up again in the XRD analyses.
The content of retained nitrogen was measured by point EDS and WDS at the top of the 350-4 condition. The austenite and ferrite grains differed by the Ni, Mo, and Cr contents in each phase. The nickel content was higher in austenite grains while chromium and molybdenum percentages exceeded in ferrite grains, following the stabilizing role of these elements in the respective phases. The nitrogen measurements by EDS added up to 8.5 wt.% in austenite grains and 7.5 wt.% over ferrite regions. In agreement, the WDS counts were 10.3 wt.% in austenite and 8.6 wt.% in ferrite grains. EDS is faster and was the technique of choice to delineating the N-concentration profiles at the cross-sectioned 350-4 sample, in a region with austenite and ferrite grains (Figure 3a).
The nitrogen profile was ~25 at. % near the surface in both ferrite and austenite grains, remaining constant in deeper regions in the former. Typically, such plateaus feature S-phase regions, followed by a transition case where the nitrogen concentration decreases with depth [1,4,16]. The nitrogen plateau was deeper in ferrite grains compared to austenite grains. The depths at which the nitrogen content decays to substrate values are consistent with the layer thickness measured by chemical etching (see Figure 2 and Table 2). In Figure 3b, a comparison between the nitrogen concentration of the nitrided (350-4) condition with the one thermally treated at 550 °C (TT550) is presented. After heat treatments, the nitrogen concentration reduced the TT550 near the surface due to nitrogen diffusion into the substrate.

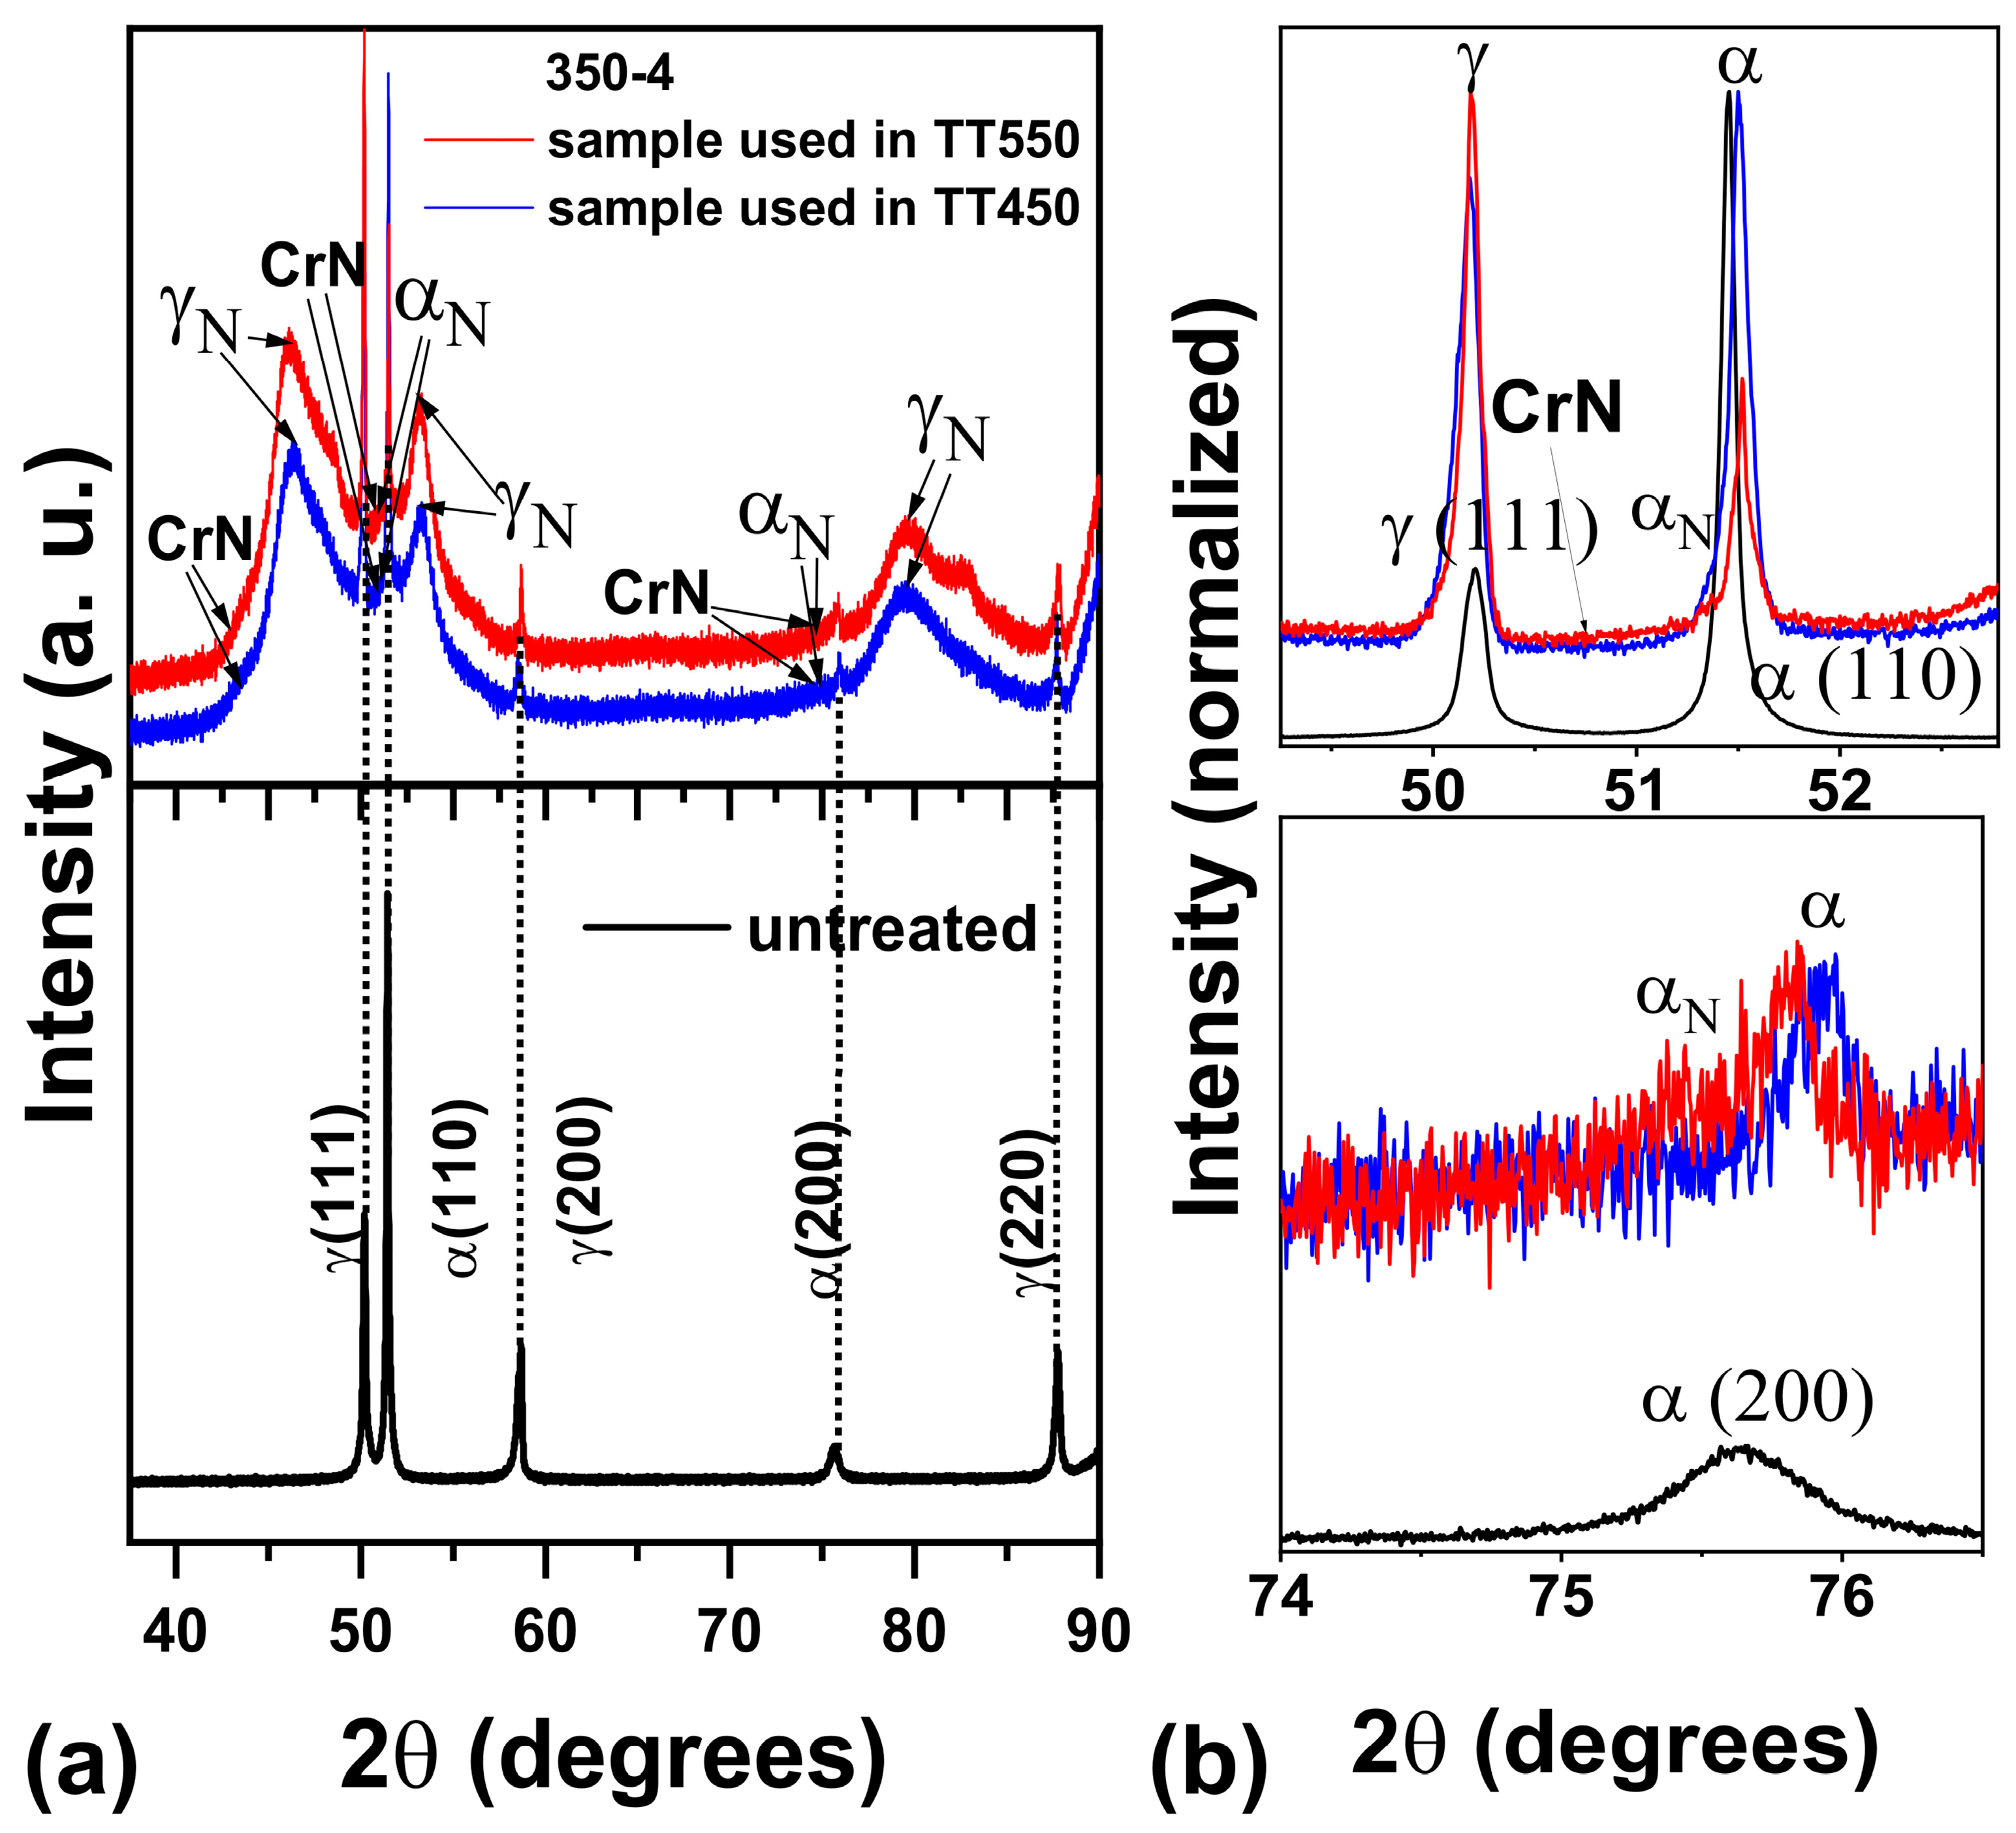
3.2. XRD of the Nitrided Surfaces

Figure 4 presents the diffractograms of the UNS S32750 untreated and nitrided at 350 °C for 4 h (350-4), before heat treatments. The untreated material presented only the expected austenite and ferrite phases. The diffractograms of the two nitrided samples were very similar, showing that they were virtually identical. Peaks related to the austenite and ferrite phases in the modified conditions indicate that information provided by X-rays came indeed from regions beyond the nitrided layer. The most prominent peaks in the diffractograms correspond to the expanded austenite (S-phase, γN), which appear broad and asymmetrical due to micro deformations introduced in the lattice by the nitrogen solid solution [1,4,34].
Trickier was inferring the formation of the expanded ferrite phase, αN. Part of this is due to the significantly reduced nitrogen solubility in ferrite, leading to a smaller variation of the αN interplanar spacing relative to α when compared to the γN change relative to γ. In general, the αN (110) is detected by the peak broadening, as shown in Figure 3b, even though it is difficult to clearly distinguish α and αN peaks [8,10,11]. In the (200) plane, the αN peak displacement relative to α is greater, making it easier to distinguish them [8,11]. To mitigate this, the αN phase was identified and quantified here through the deconvolutions of peaks close to the ferrite 2θ position, as will be shown below, similarly as carried out in other studies with duplex steels [8,10,11]. Some studies reported the absence of the αN phase in duplex steels, a result of the transformation of ferrite into austenite mediated by the introduction of nitrogen, which is an austenitizing element [12,14]. In this research, the analysis techniques used did not allow us to identify whether the γN phase was formed only in the previously austenite grains or also in the previously ferrite grains. Therefore, the presence of the γN phase in ferrite grains was not ruled out.
In addition to the narrow 2θ proximity of α and αN, the overlapping of γN and nitride peaks, also makes it difficult to assertively characterize such modified surfaces simply by the XRD analysis. The possible contribution of CrN nitrides to the diffractograms is highlighted in Figure 4a. The in situ structure characterization during the material’s heating at 450 °C and 550 °C provided substantial insights for this matter, as discussed next.

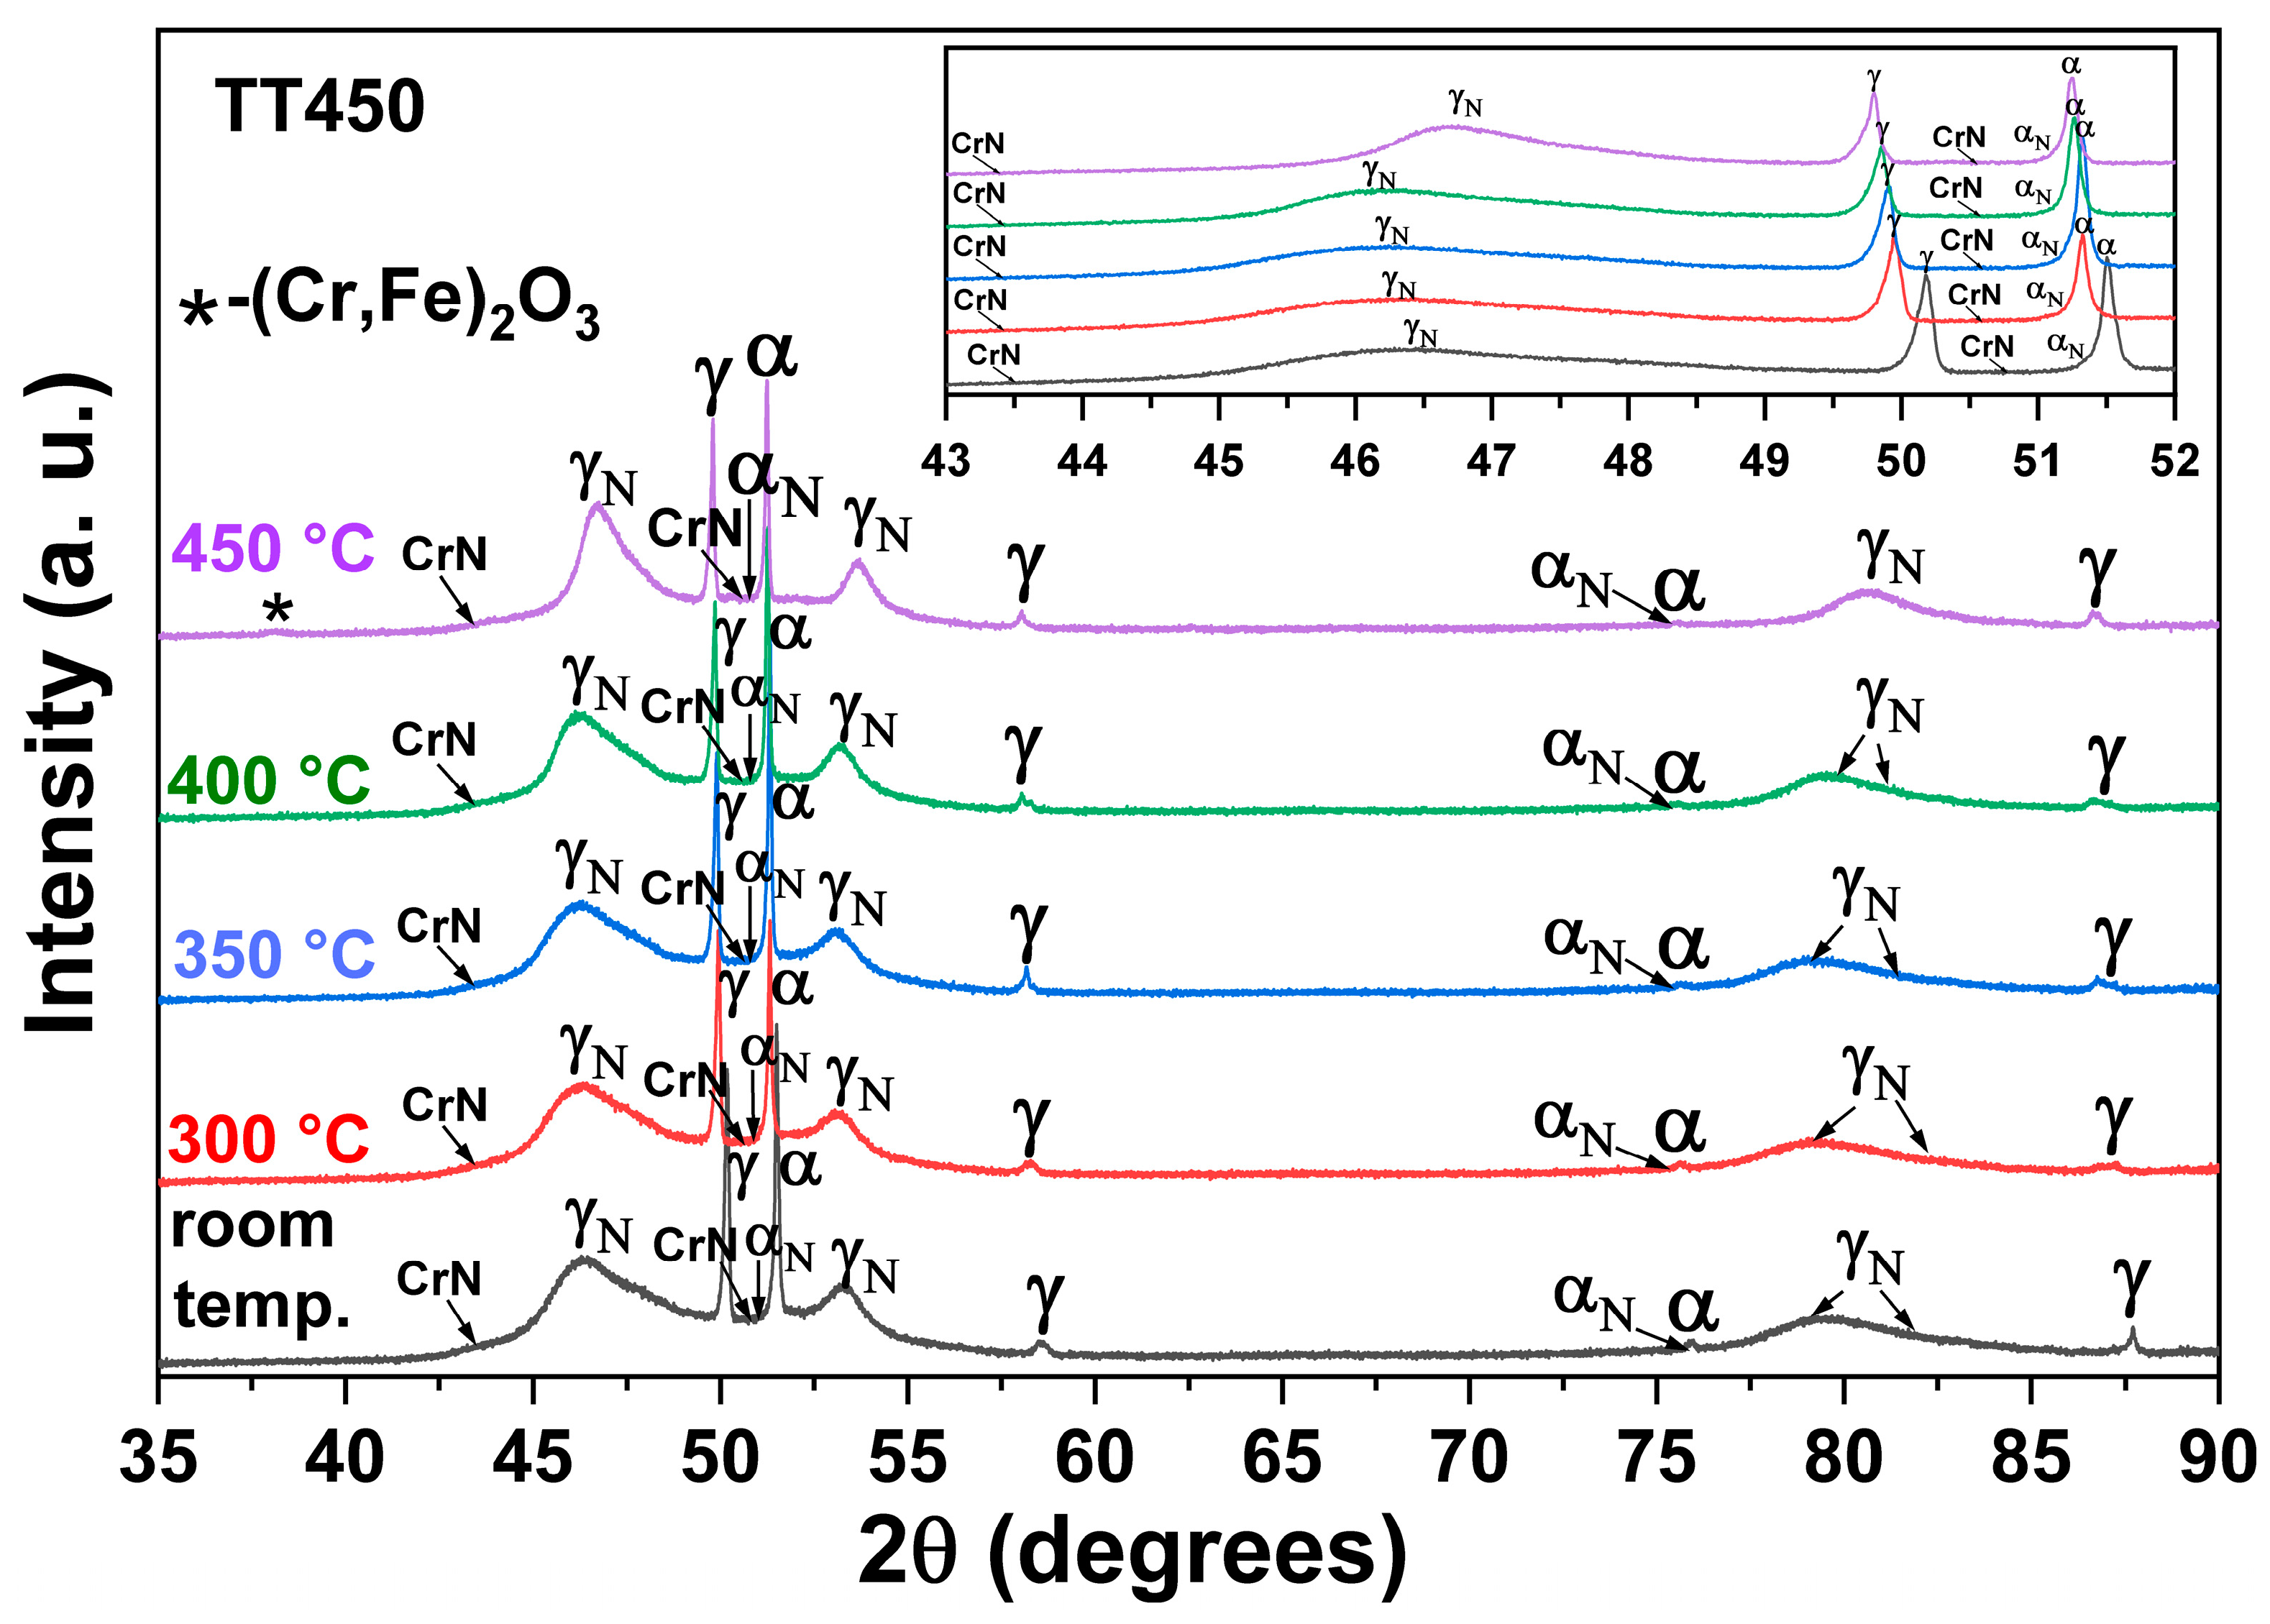
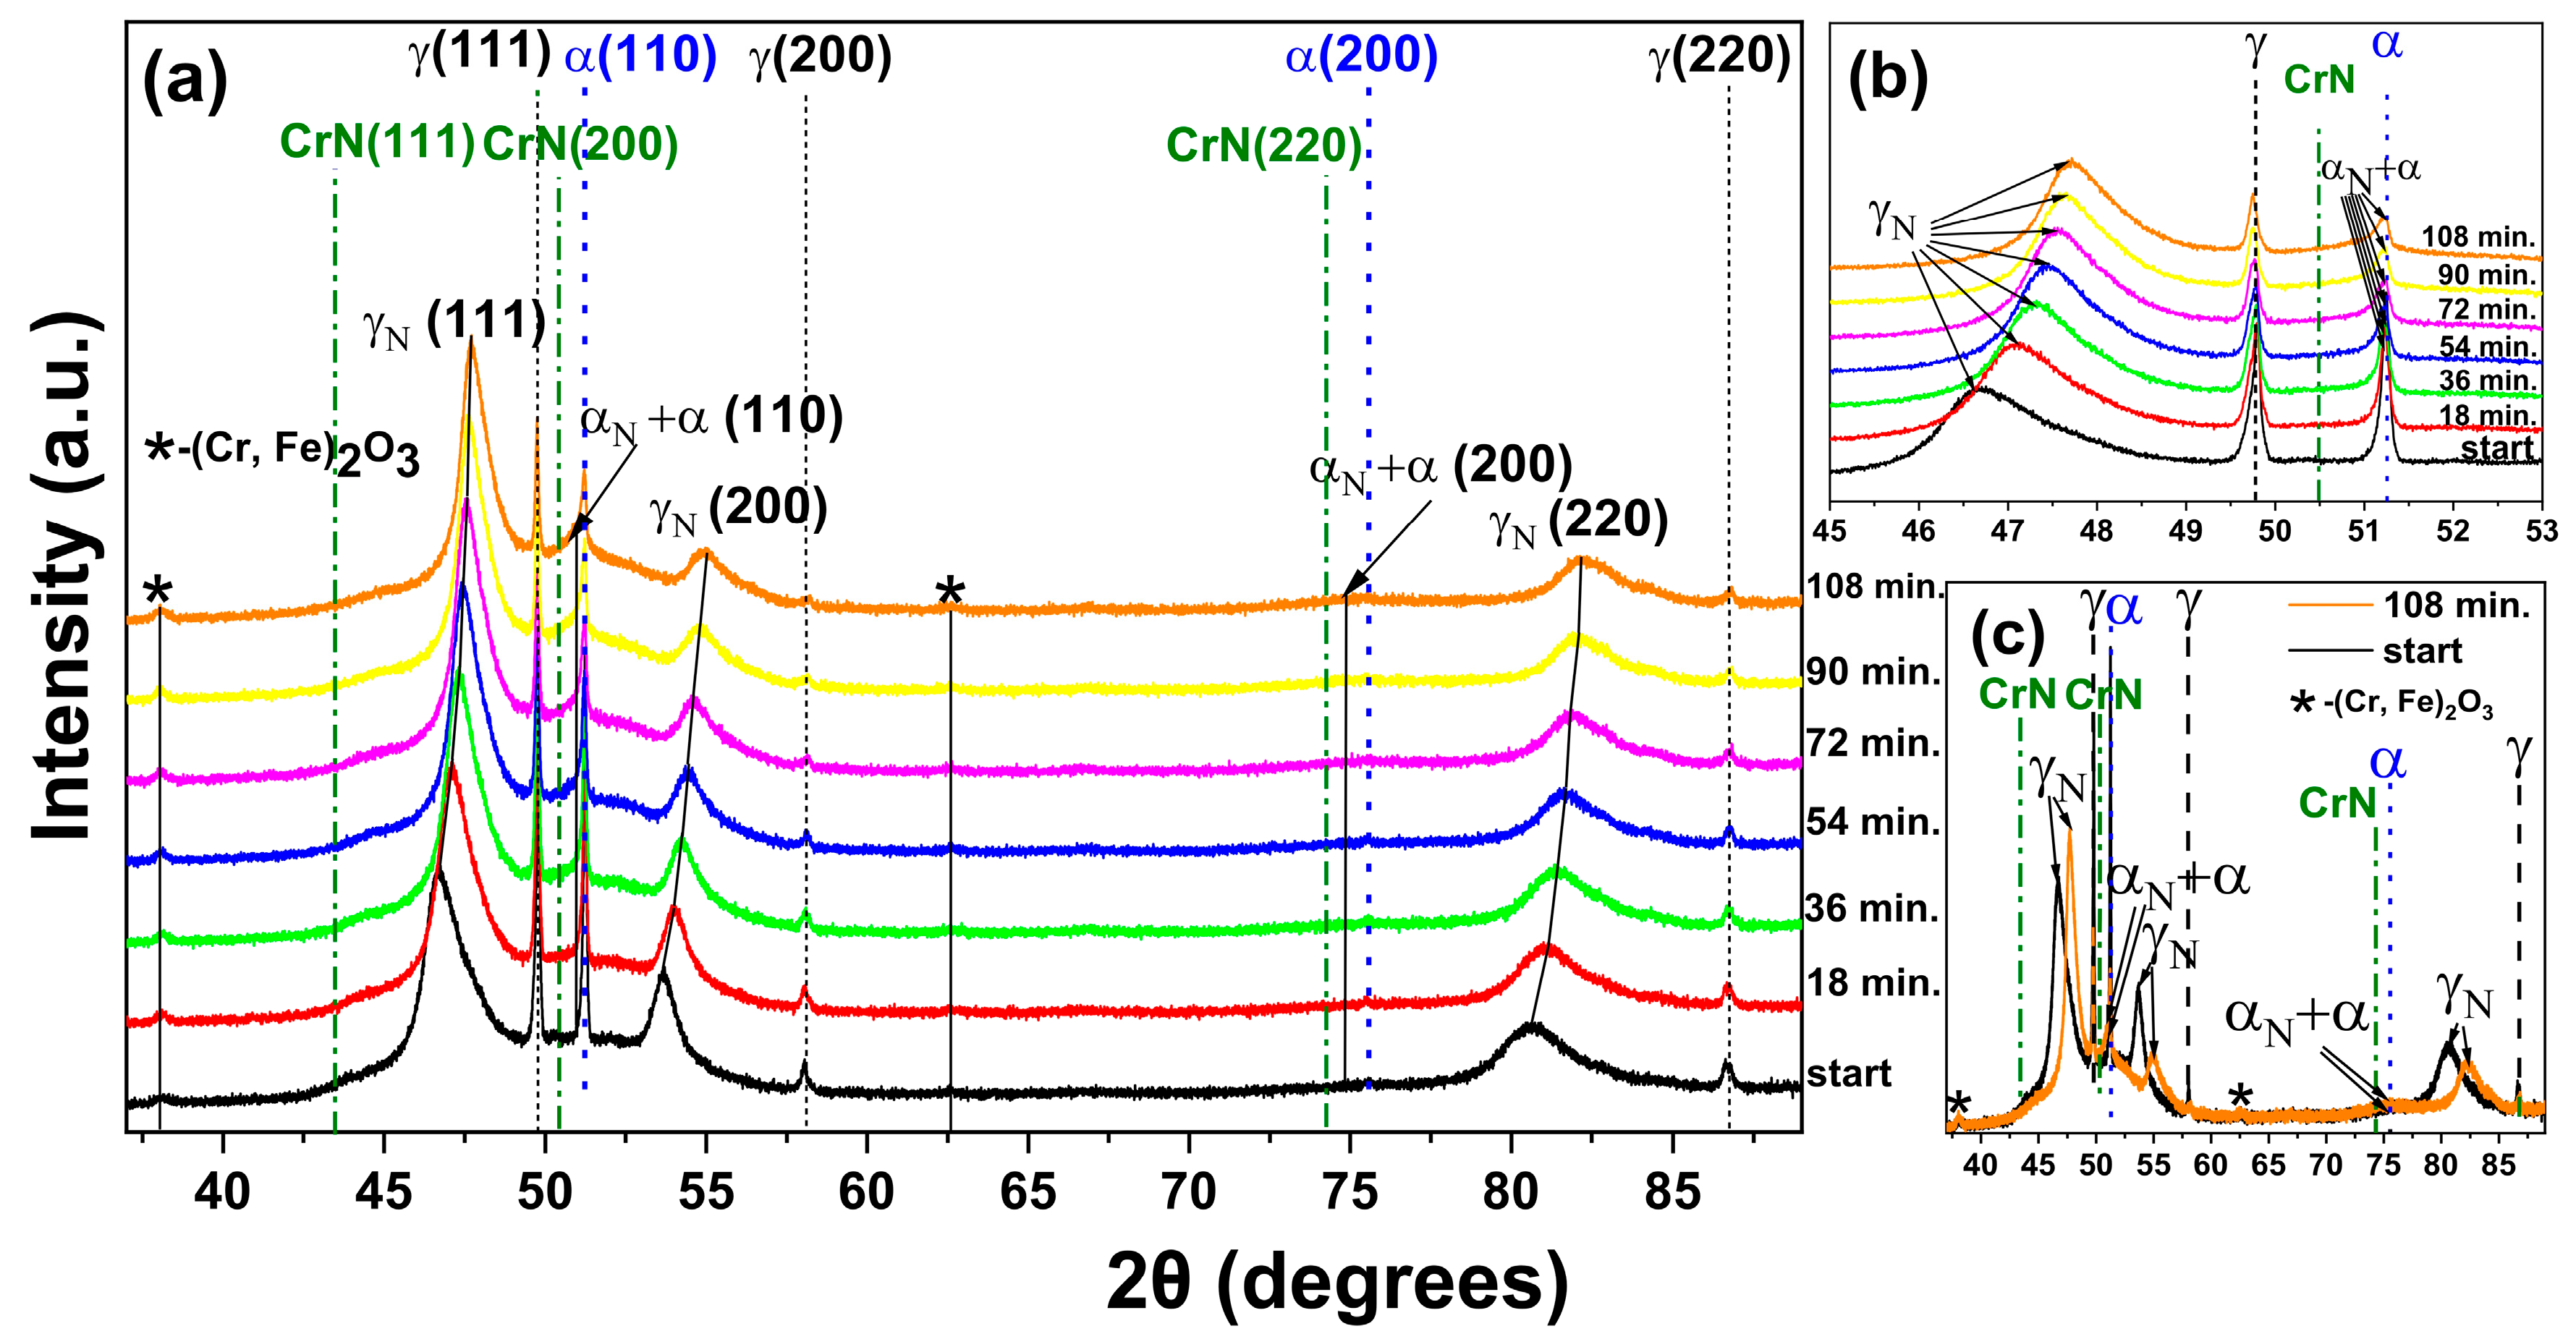
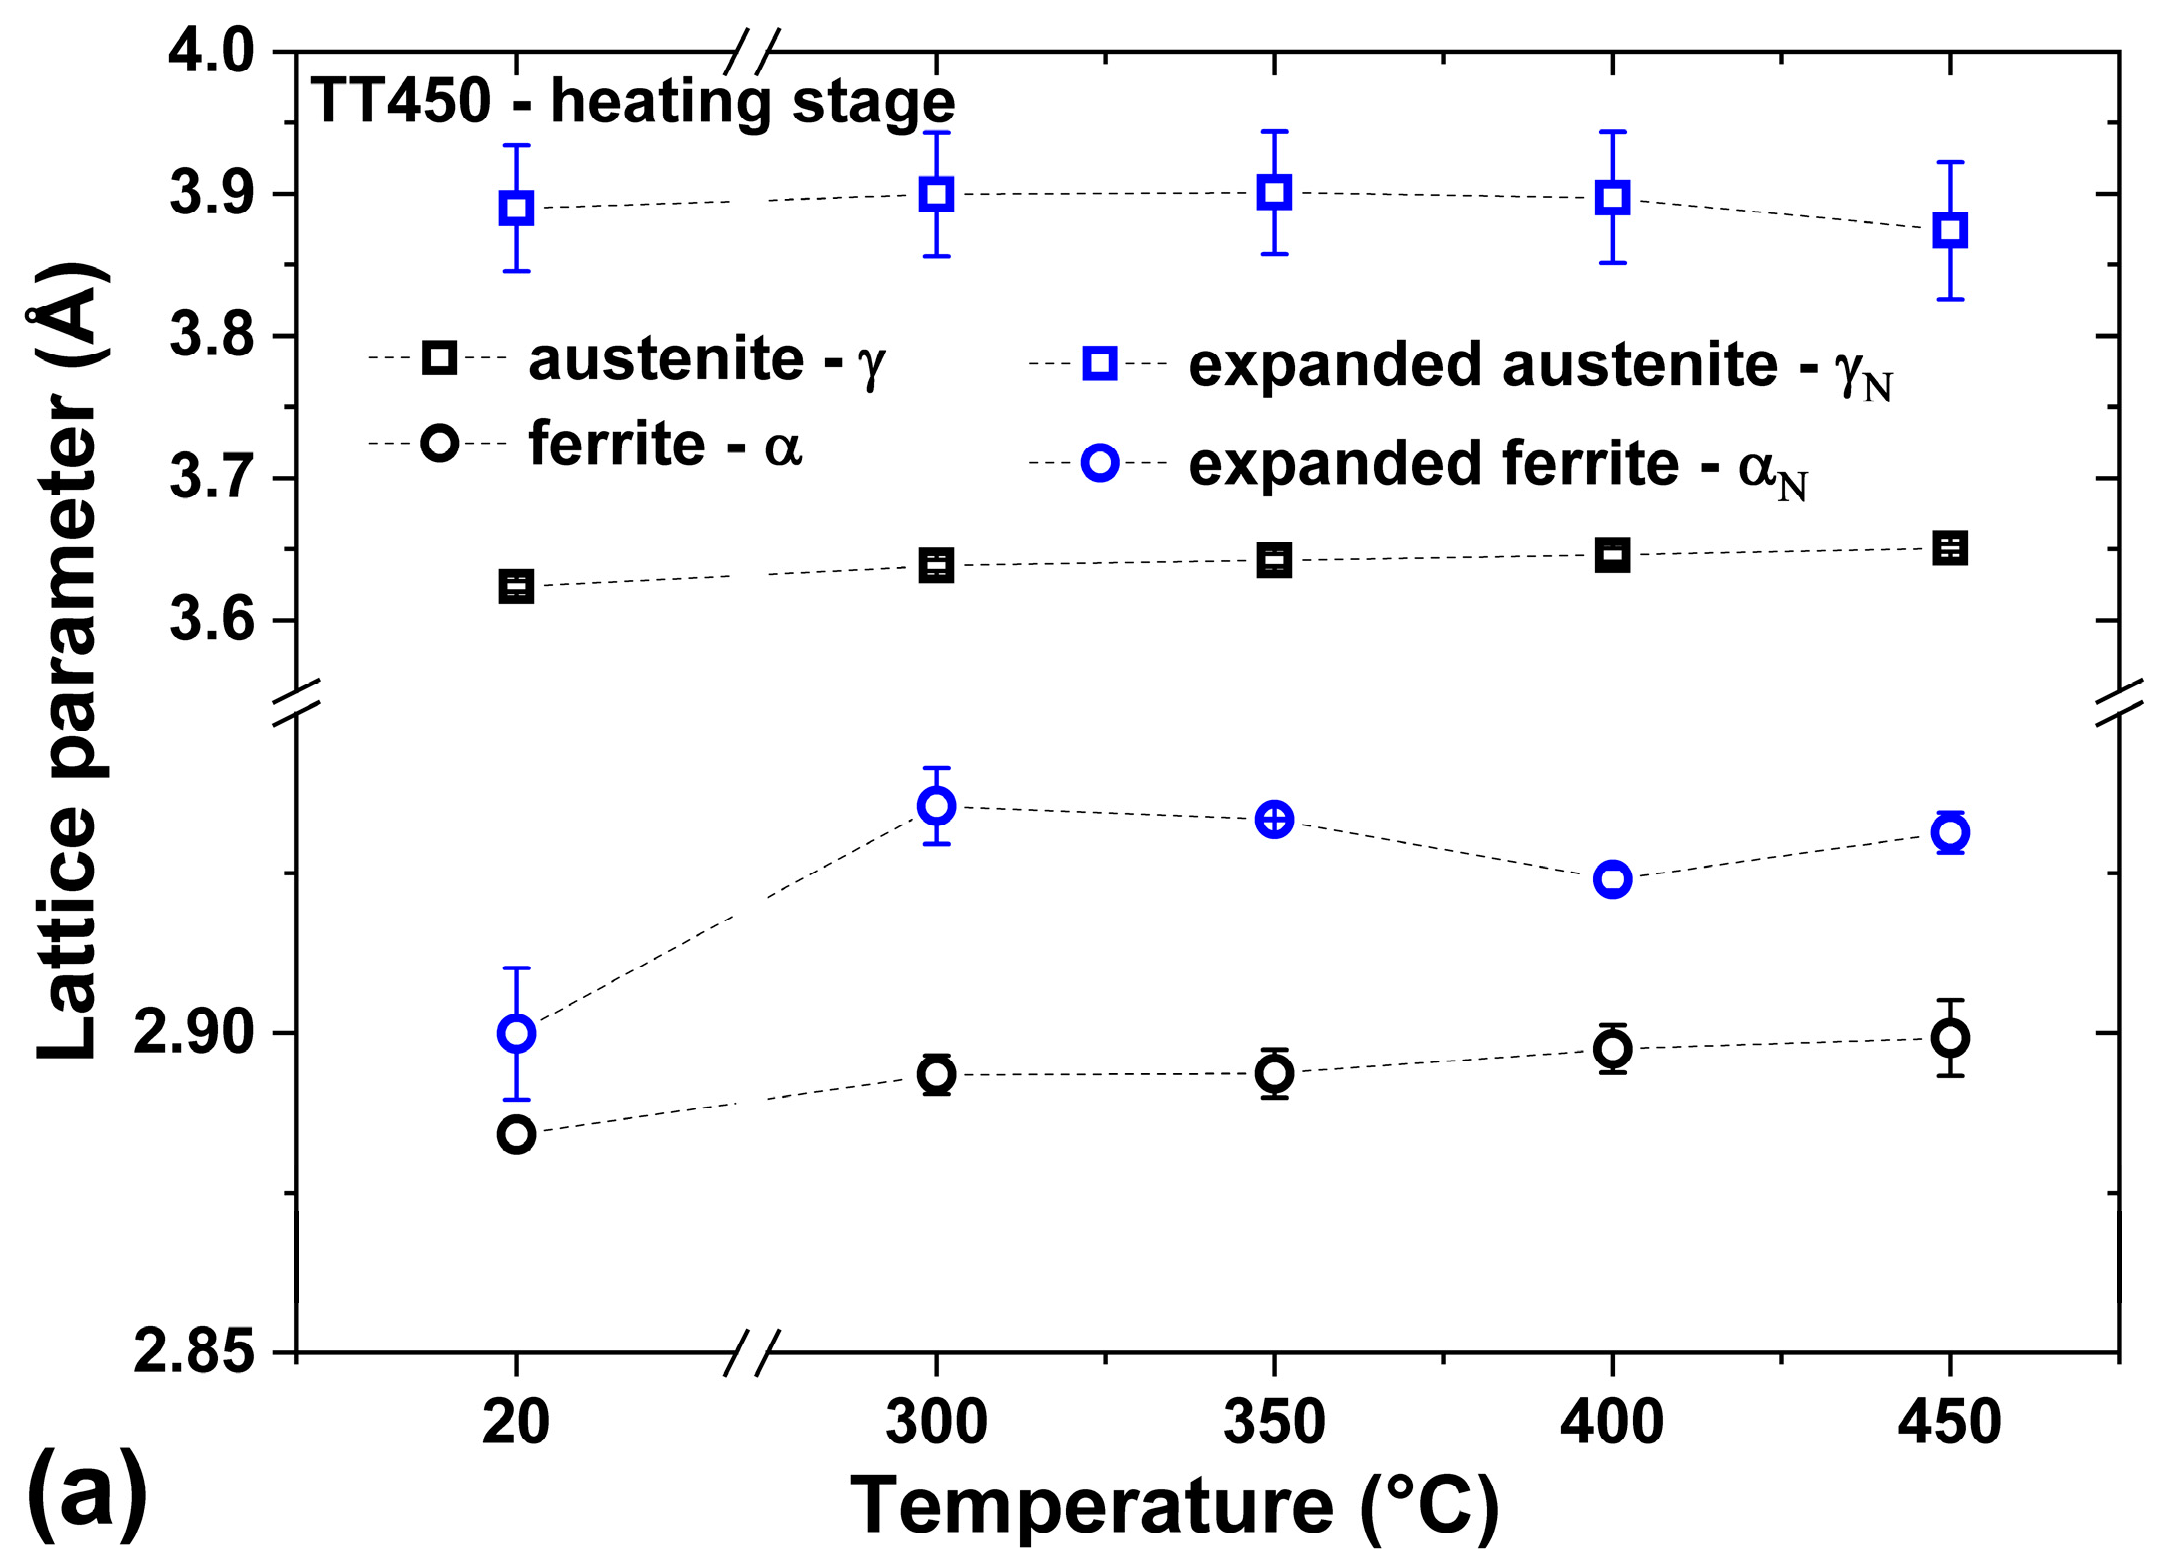
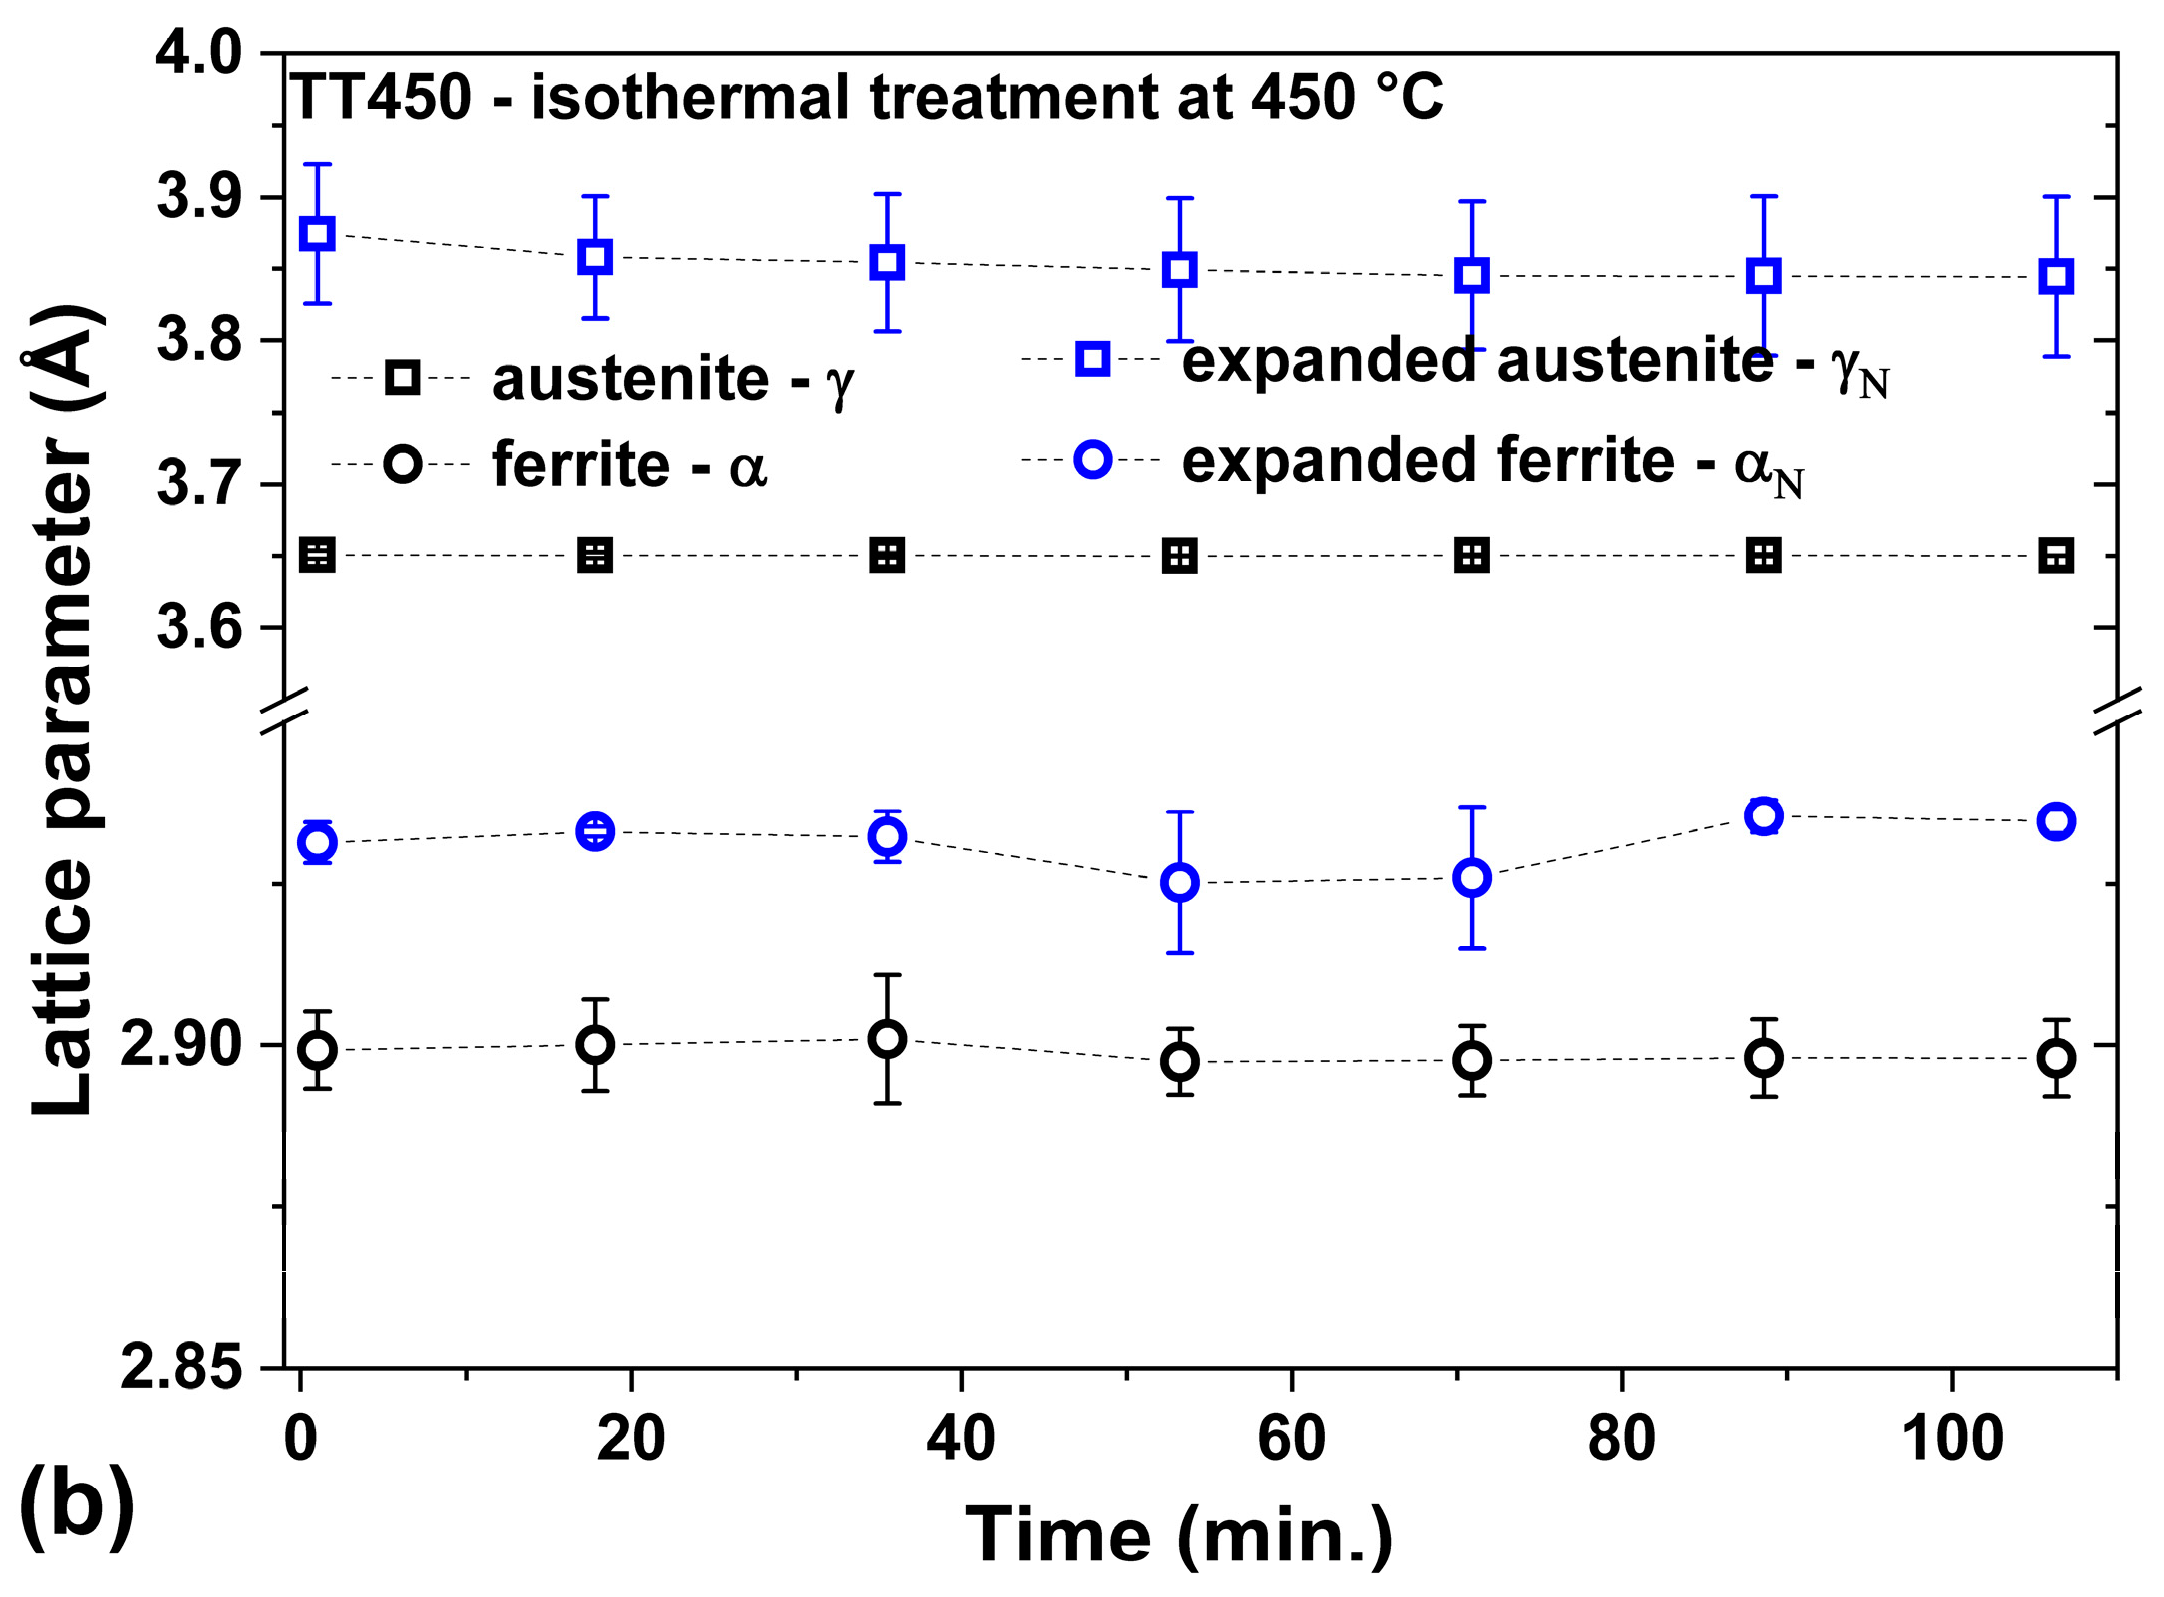
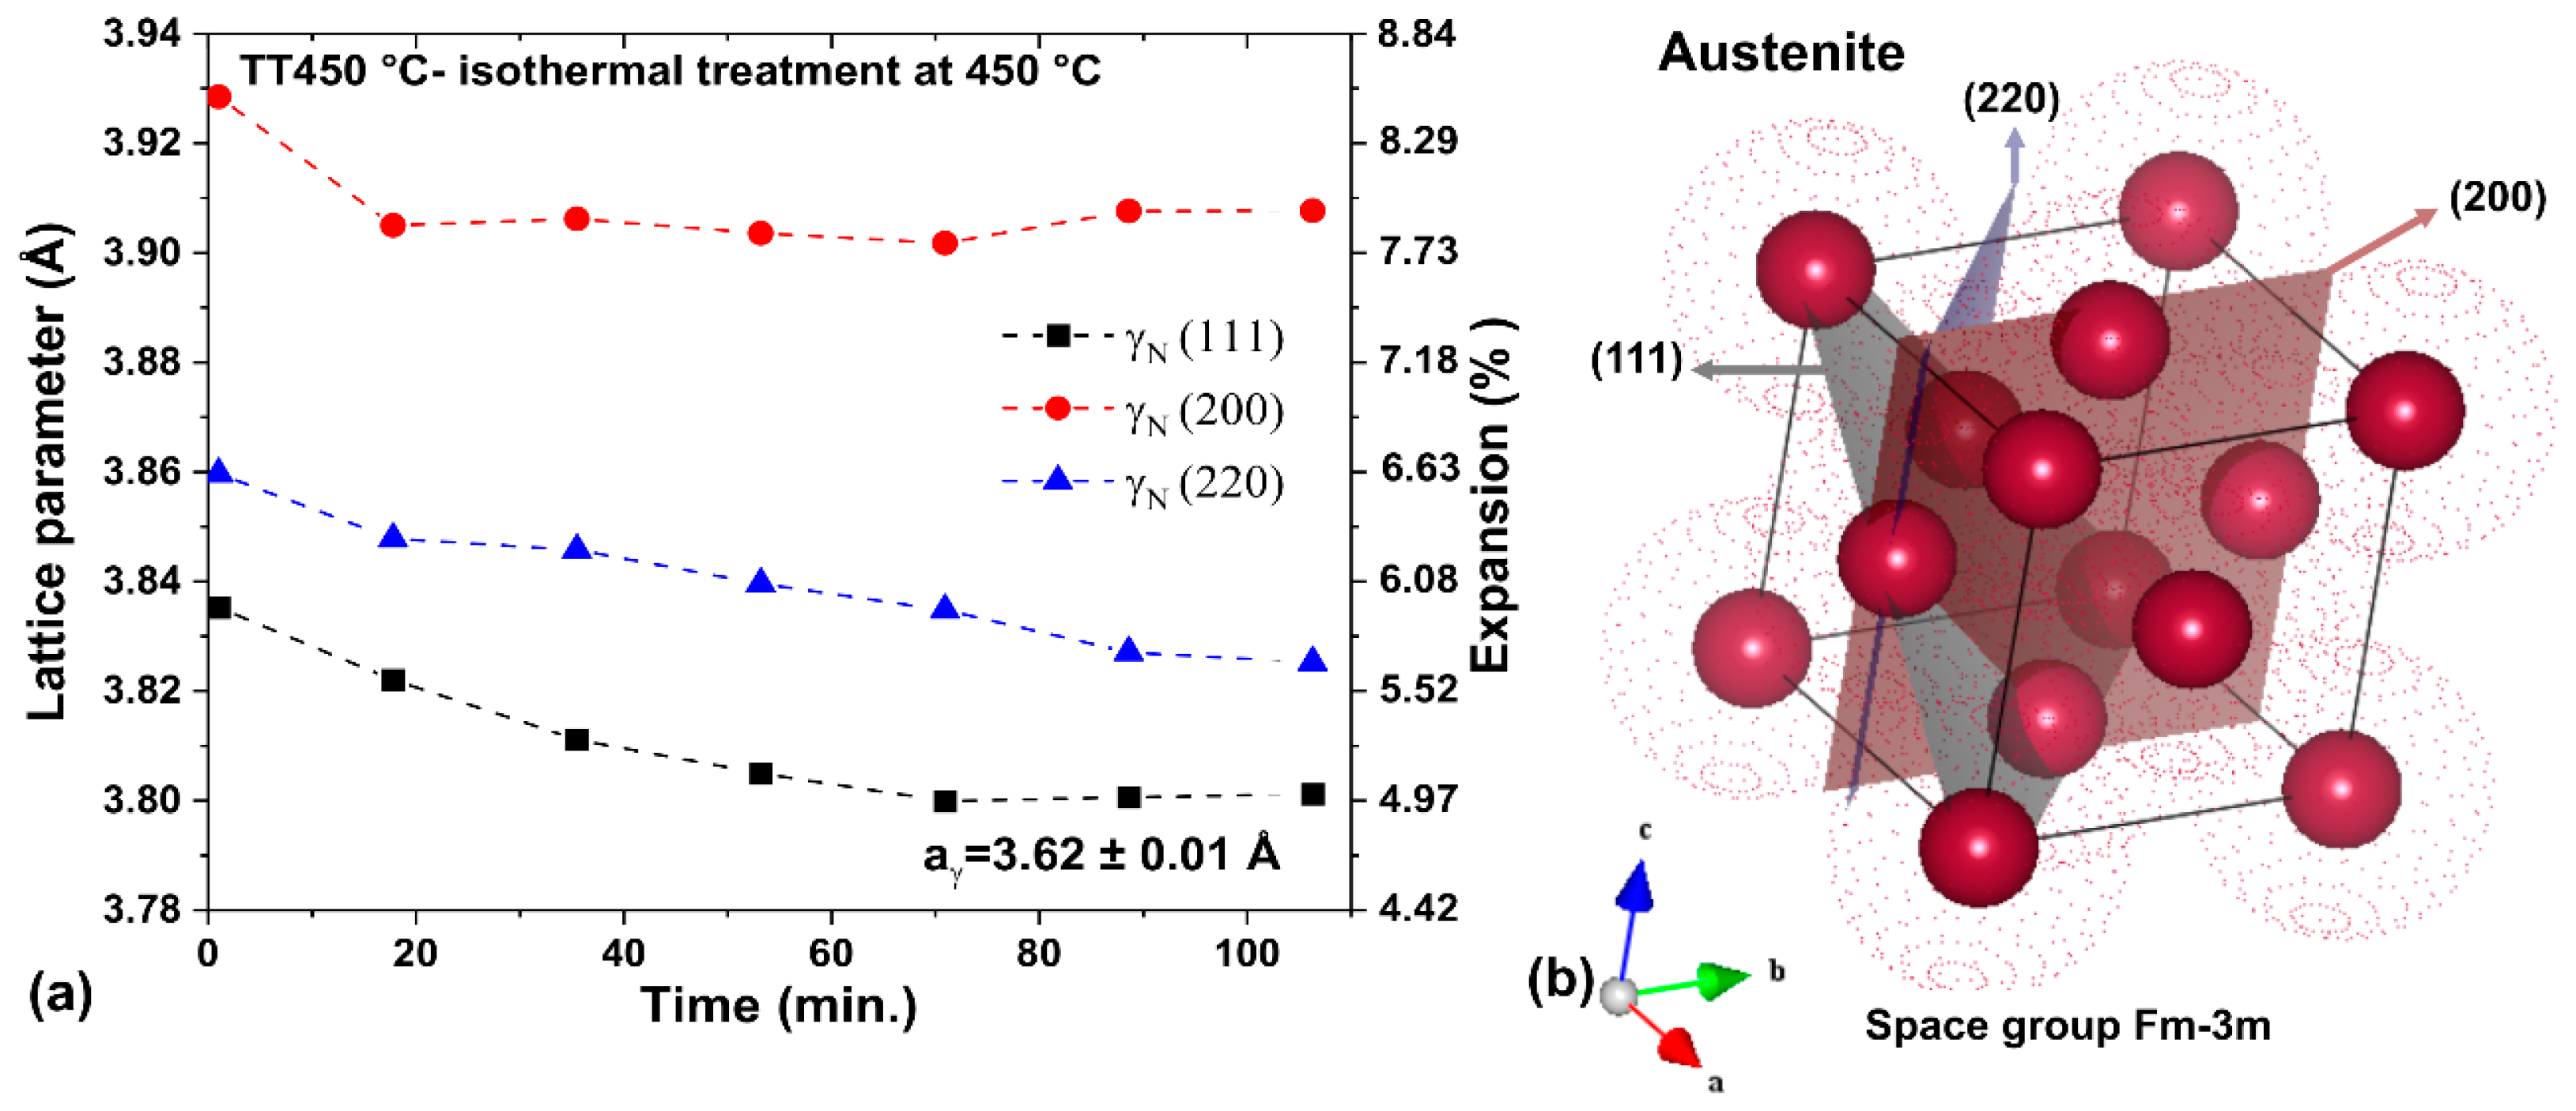
3.3. Heating at 450 °C

Figure 5 shows the X-ray diffraction data collected during the heating process up to 450 °C. The γ and α phases’ peaks shift to smaller angles as temperature increased up to 450 °C, evidence of thermal dilation, since diffraction angles are inversely proportional to interplanar distances. The region with the main peaks of the α and γ phases, around 43°–52°, was highlighted to improve visualization. On the contrary, the γN phase peaks changed little until 400 °C. At 450 °C, they exhibited a slight shift towards the opposite direction. This fact is in agreement with other studies, which reported an apparently small or no thermal evolution of expanded phases up to 400 °C, until 4 h of heating [23,24,26].
The shift of the γN phase peaks to higher 2θ when the temperature reached 450 °C indicates a reduction in interplanar distances and lattice parameters due to nitrogen diffusion into the substrate. These effects disclose a clear competition between thermal expansion and nitrogen diffusion. An additional finding was the appearance of iron oxides at 450 °C, despite the treatment being conducted under inert He atmosphere. It is possibly a result of residual amount of oxygen within the furnace, which reacted rapidly with the heated sample.
When the system reached the temperature of 450 °C, it was kept fixed for the isothermal part of the experiment. Figure 6 shows the diffractograms of these analyses. The α and γ phases peaks remained almost unchanged regarding their diffraction angular positions, as expected. In contrast, the intensities of these peaks decreased over time, which corresponded to an increase in the nitrided layer thickness due to nitrogen diffusion, favored by thermal energy, in agreement with the inspections by electron microscopy in Figure 2b. This effect is plausible, since the experimental conditions of the XRD analysis remained unchanged, leading to minimal changes in the X-rays depth of analyses as the heating process continued. To verify this, consider the mass absorption coefficient (MA) of the bare material, calculated for the elements given in Table 1 and the employed beam energy, which is M A = 151   c m 2 / g , while it changes to the mass absorption coefficient of nitrided steel, which is M A w i t h   N = 141   c m 2 / g , after the insertion of ~7.5 wt.% of nitrogen in the surface layer (as measured by point EDS). This results in M A w i t h   N M A 0.93 . The mass absorption value is the weighted average of the constituent elements of the alloy; hence, it is almost independent of the distribution gradient of nitrogen for a given depth of analysis.
In Figure 6b,c, it is observed that the γN phase diffraction peaks, which had already shifted to higher angles when the temperature varied from 400 °C to 450 °C, continued to shift in the same direction, although the temperature remained constant. Furthermore, the peaks at the position ascribed to CrN became slightly more defined over time, indicating that there was precipitation of CrN due to the γN thermal decomposition, even though this effect was not so significant. These observations, combined with the reduction in intensity of γ and α peaks, indicate that nitrogen diffusion increased the layer thickness, preserving the expanded austenite (with reduced lattice parameter) as the predominant phase, and decreasing crystal lattice stresses and defects. Contrary to observations, some studies mention that the decomposition of the γN phase into CrN + α may occur together with the formation of the γ phase [23,35]. The hypothesis of the formation of the γ phase inside the modified layer was excluded due to the gradual reduction in intensity of the peaks of this phase after heat treatment.
Another interesting phenomenon occurred during isothermal heating. While the γN (111) peak intensity increased over time, the γN (200) and γN (220) ones decreased. It reflects the nitrogen contribution to the diffracted wave. To date, there is no consensus on the crystal structure of expanded austenite; however, TEM analyses identified a Fe4N-like ordered structure as a base model for the expanded austenite [36,37]. Fe4N is an FCC iron lattice with a body-centered N atom. In this study, this model fits very well to explain changes in intensities. The structure factor for the FCC lattice is [38] as follows:
S h k l , i = f i j = 1 4 e 2 π i h x j + k y j + l z j = f i 1 + 1 h + k + 1 k + l + 1 h + l .
In the equation, f i is the atomic form factor for each type of atom. The scattering amplitude is F h k l = N i S h k l , i , where N is the number of unit cells. For a basic unit with Fe atoms at the positions 0 , 0 , 0 , 1 2 , 0 , 1 2 , 0 , 1 2 , 1 2 and 1 2 , 1 2 , 0 , and one N atom at 1 2 , 1 2 , 1 2 , it yields as follows:
F 111   ~   F F e F N ,
F 200   a n d   F 220   ~   F F e + F N .
Thus, due to nitrogen diffusion, the FN contribution decreases, leading to an increase in intensity of the (111) plane and a decrease in the (200) and (220) directions.
Figure 7 presents the comparison of the diffractograms before and after the heat treatment at 450 °C, with θ = 10° and θ = 2° at room temperature. The relative positions of the CrN, ε, and γ′ peaks are indicated for comparison. It is possible to directly observe, in Figure 6a, the decrease in intensity of the substrate related peaks (α and γ) phases, as well as the change of the γN peaks profiles, in addition to the formation of (Cr,Fe)2O3 oxides.
Figure 7b, with θ = 2°, shows that the contribution of peaks related to CrN and ε phase were identified before and after the heat treatment. The nitride ε phase resisted to the heat treatment since it is stable under this temperature range [23]. The precipitation of nitrides on stainless steel surfaces subjected to PIII nitriding, even at low temperatures, can occur because of the implantation/diffusion competitive effects that can cause a supersaturation of interstitial nitrogen at shallow depths [7]. Therefore, they are mainly detectable under low grazing incidence θ angles in XRD analyses, contributing much less to the diffractograms for higher incidence angles.
Figure 8 shows the lattice parameter variation as a function of temperature and time during heat treatment, computed by the peak’s deconvolution. The ferrite and austenite phases presented the highest relative error of around 0.6% for all the crystallographic directions, while the expanded austenite presented a maximum relative error of around 3.6%. In this way, to facilitate comparison between the distinct phases, a simple average between crystal directions was considered.
The α and γ microstructures expanded thermally with the temperature increase, while they remained with constant lattice parameters during the isothermal heating at 450 °C. On the other hand, there was a correlation between thermal expansion and nitrogen loss for the expanded austenite γN phase. Initially, the thermal expansion prevailed, as evidenced by the lattice parameter increase from 20 °C to 350 °C; that is, if there was any nitrogen diffusion, the net effect was secondary as compared to thermal expansion. From 400 °C on, the lattice parameter reduced significantly with the increasing temperature, making it evident that N diffusion predominated over thermal expansion. This effect continued during the isothermal processing.
Regarding the expanded ferrite αN, its lattice parameter changed more than γN with the increasing temperature. In addition to the competitive effects of nitrogen diffusion and the αN thermal expansion, there was an additional phenomenon related to the transition of the γN phase to α + CrN, previously observed in other steels [1,21,22,23,24]. In addition, the α phase formed inside the modified layer can convert to αN, since there is nitrogen diffusing into the material during heating. Then, the decay of the γN phase is better expressed as γN → α + αN + CrN. Another complex effect that occurs in duplex steels and contributes to the variation of the lattice parameter of expanded phases is the lateral diffusion, in which nitrogen flows from ferrite to austenite along grain boundaries [9].
The variation of the lattice parameter during the isothermal treatment of the expanded austenite phase is present in Figure 9a. Figure 9b shows the crystal structure of austenite, simulated by the Vesta 3 software [39], highlighting the diffraction planes (111), (200) and (220).
The lattice parameter gradually decreased over time in all crystal directions. In addition, the lattice parameter of the [200] direction (perpendicular to the (200) plane) was larger than those obtained for the [220] and [111] directions. It evidences the anisotropy of the lattice expansion by N insertion at octahedral sites, which varies by following the order 200 > 220 > 111. This anisotropic expansion behavior of the γN phase has already been observed in nitrided samples [1,2] and, as demonstrated here, it maintains during the γN phase decay by heating. The effect is related to the elastic anisotropy of austenite, which interferes with stresses in the crystal structure, as well as to the surface energy anisotropy, which depends on the crystal orientation and favors the diffusion of solutes in certain orientations [40,41]. In the case of austenite, the (100) orientation is the most favorable for nitrogen diffusion [40,41].

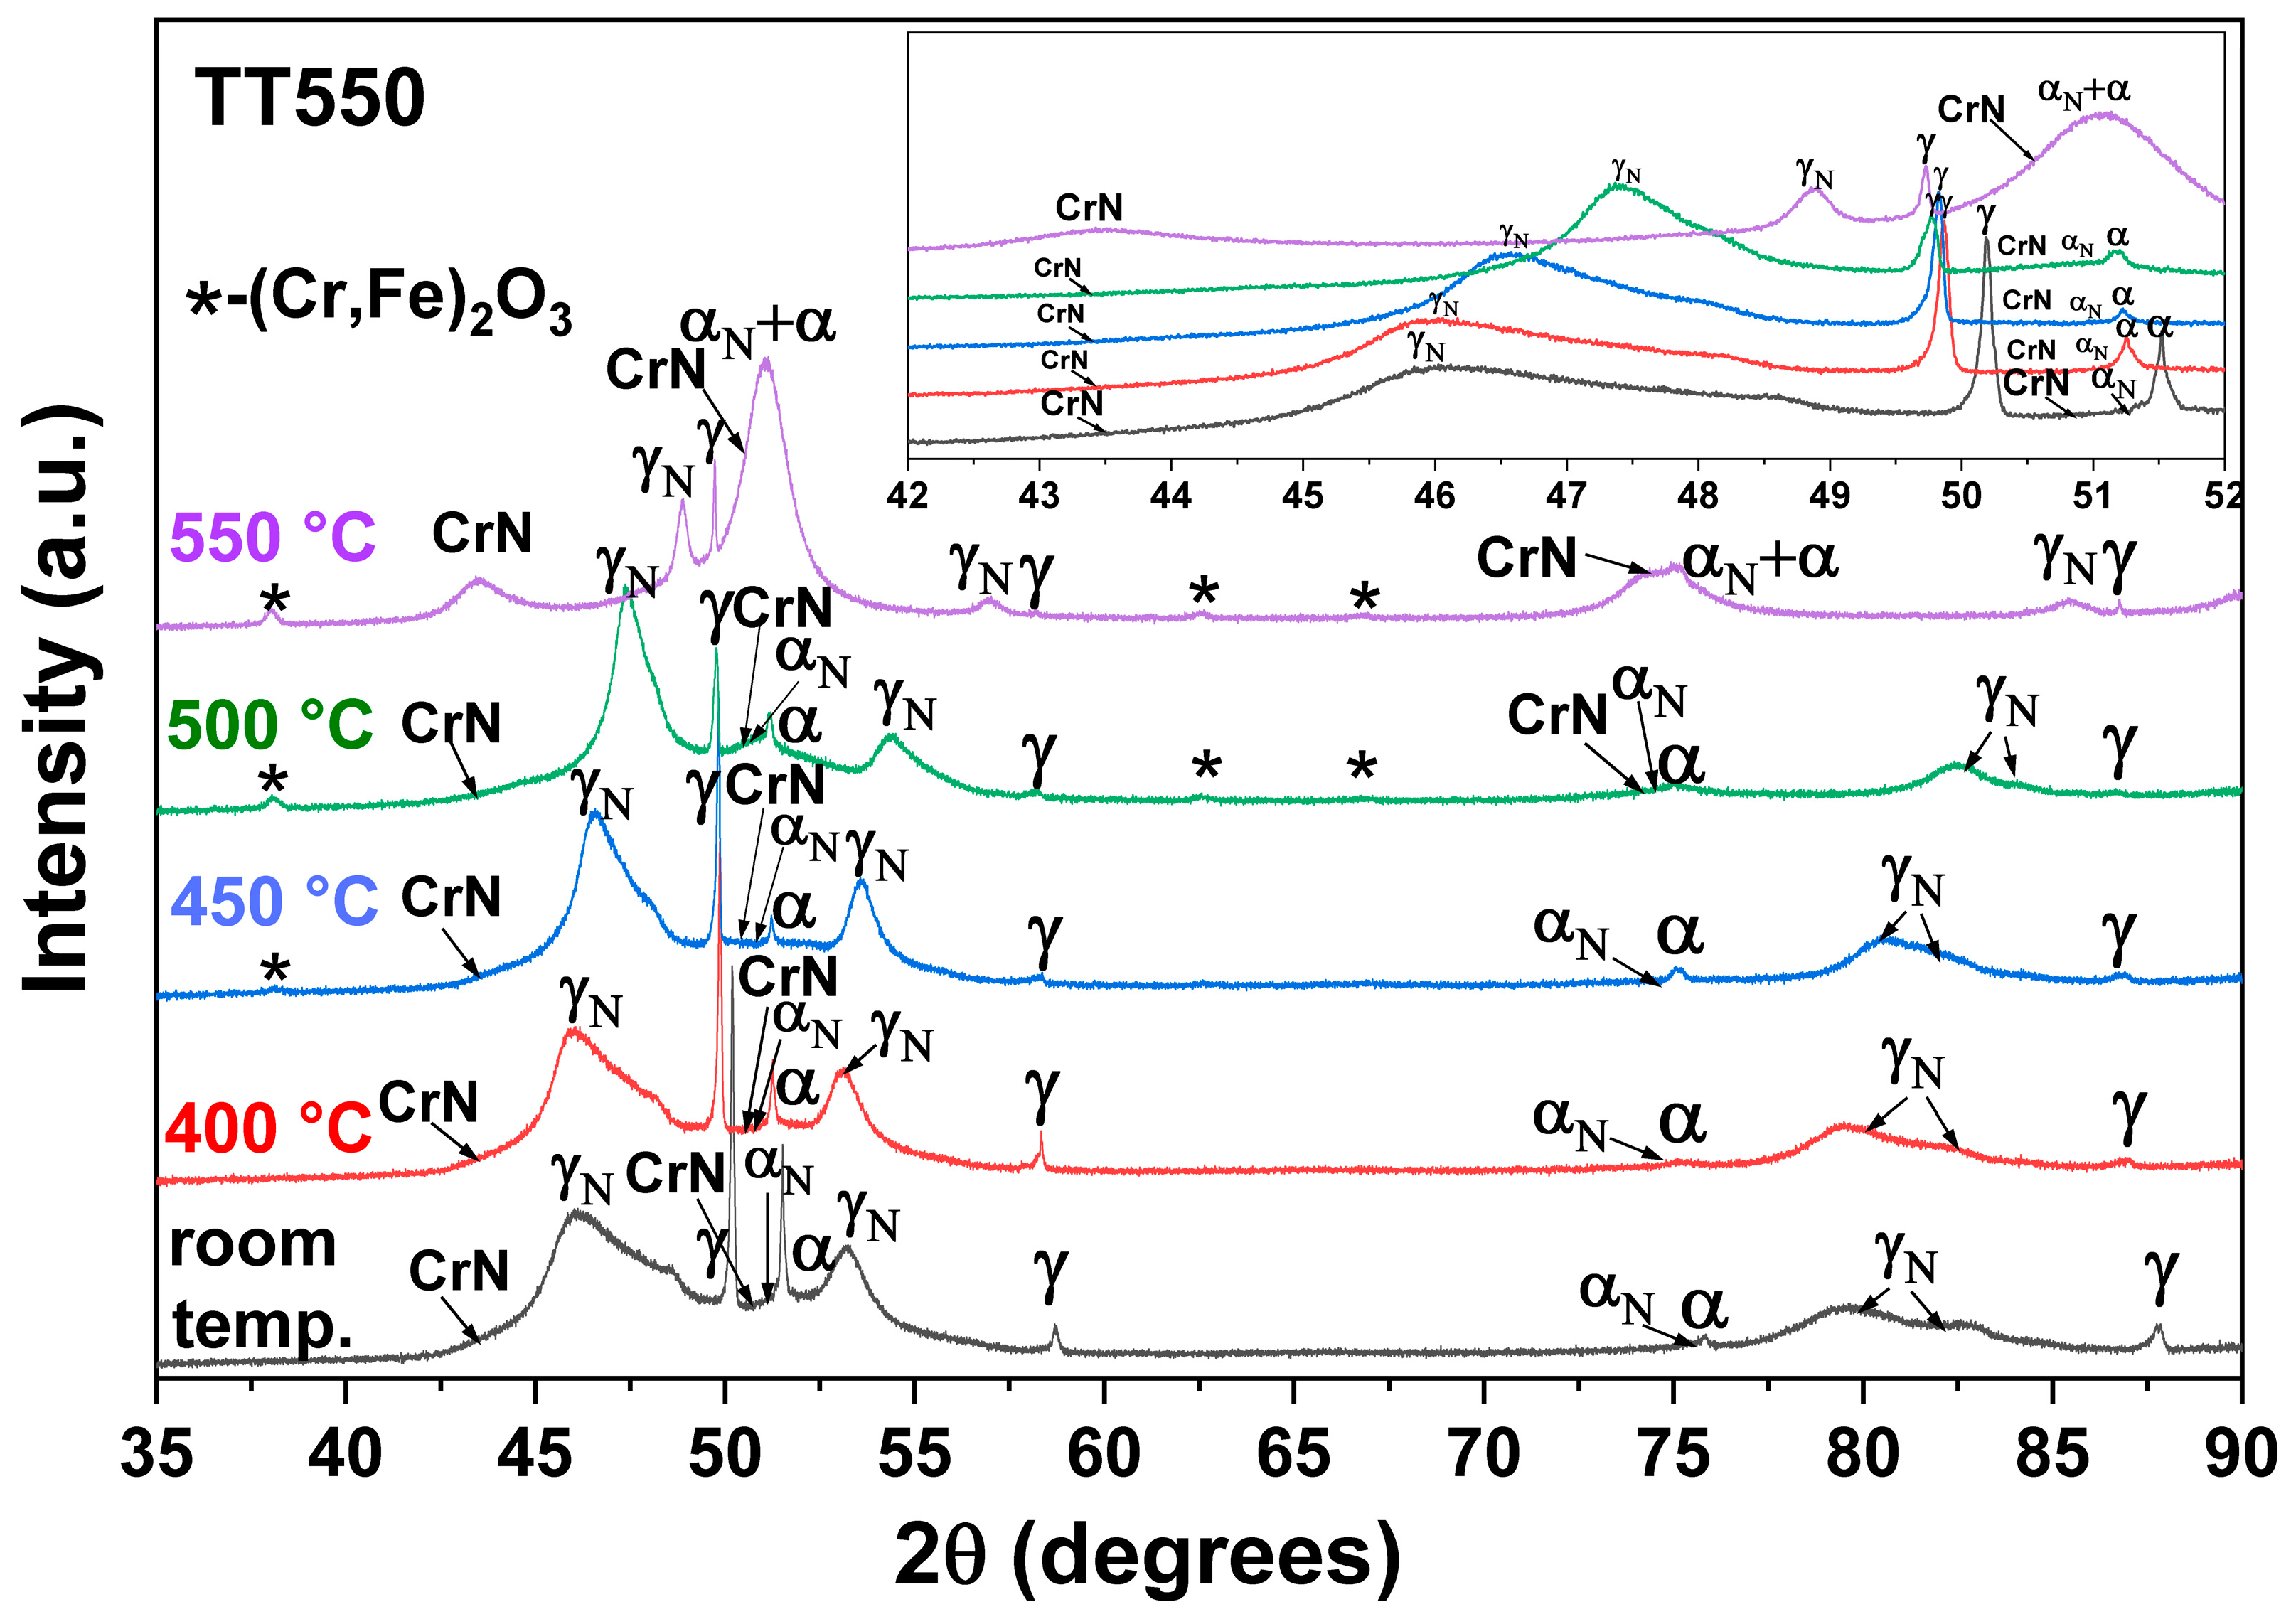
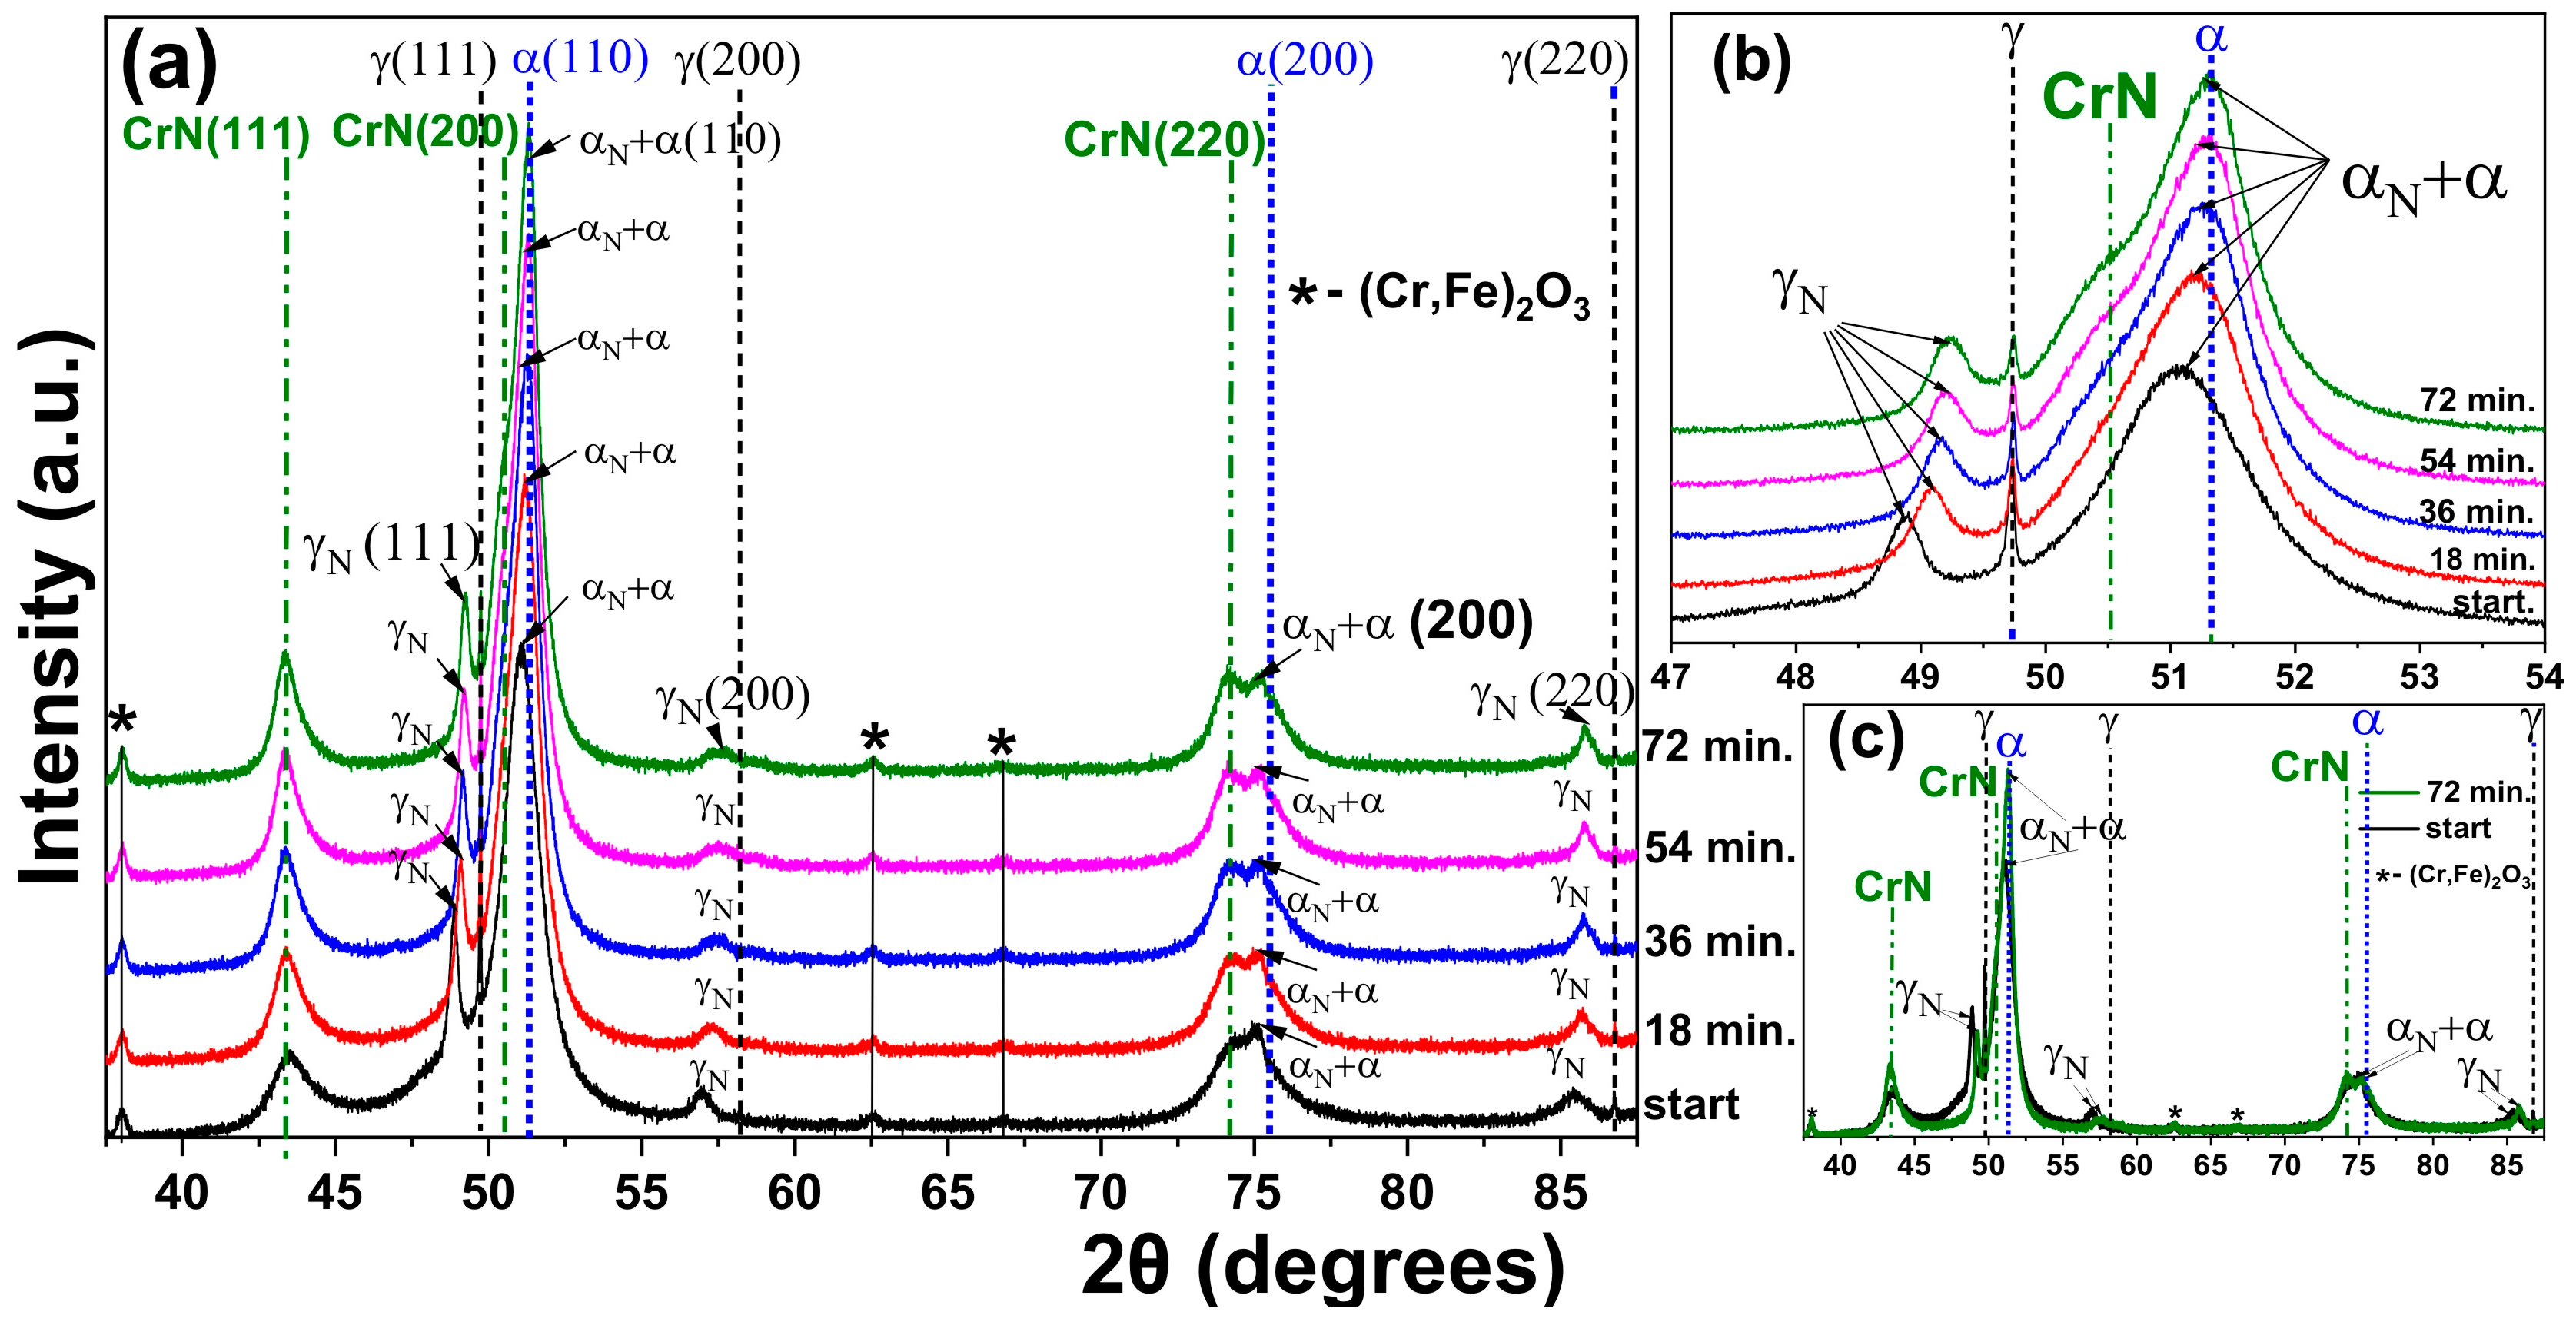
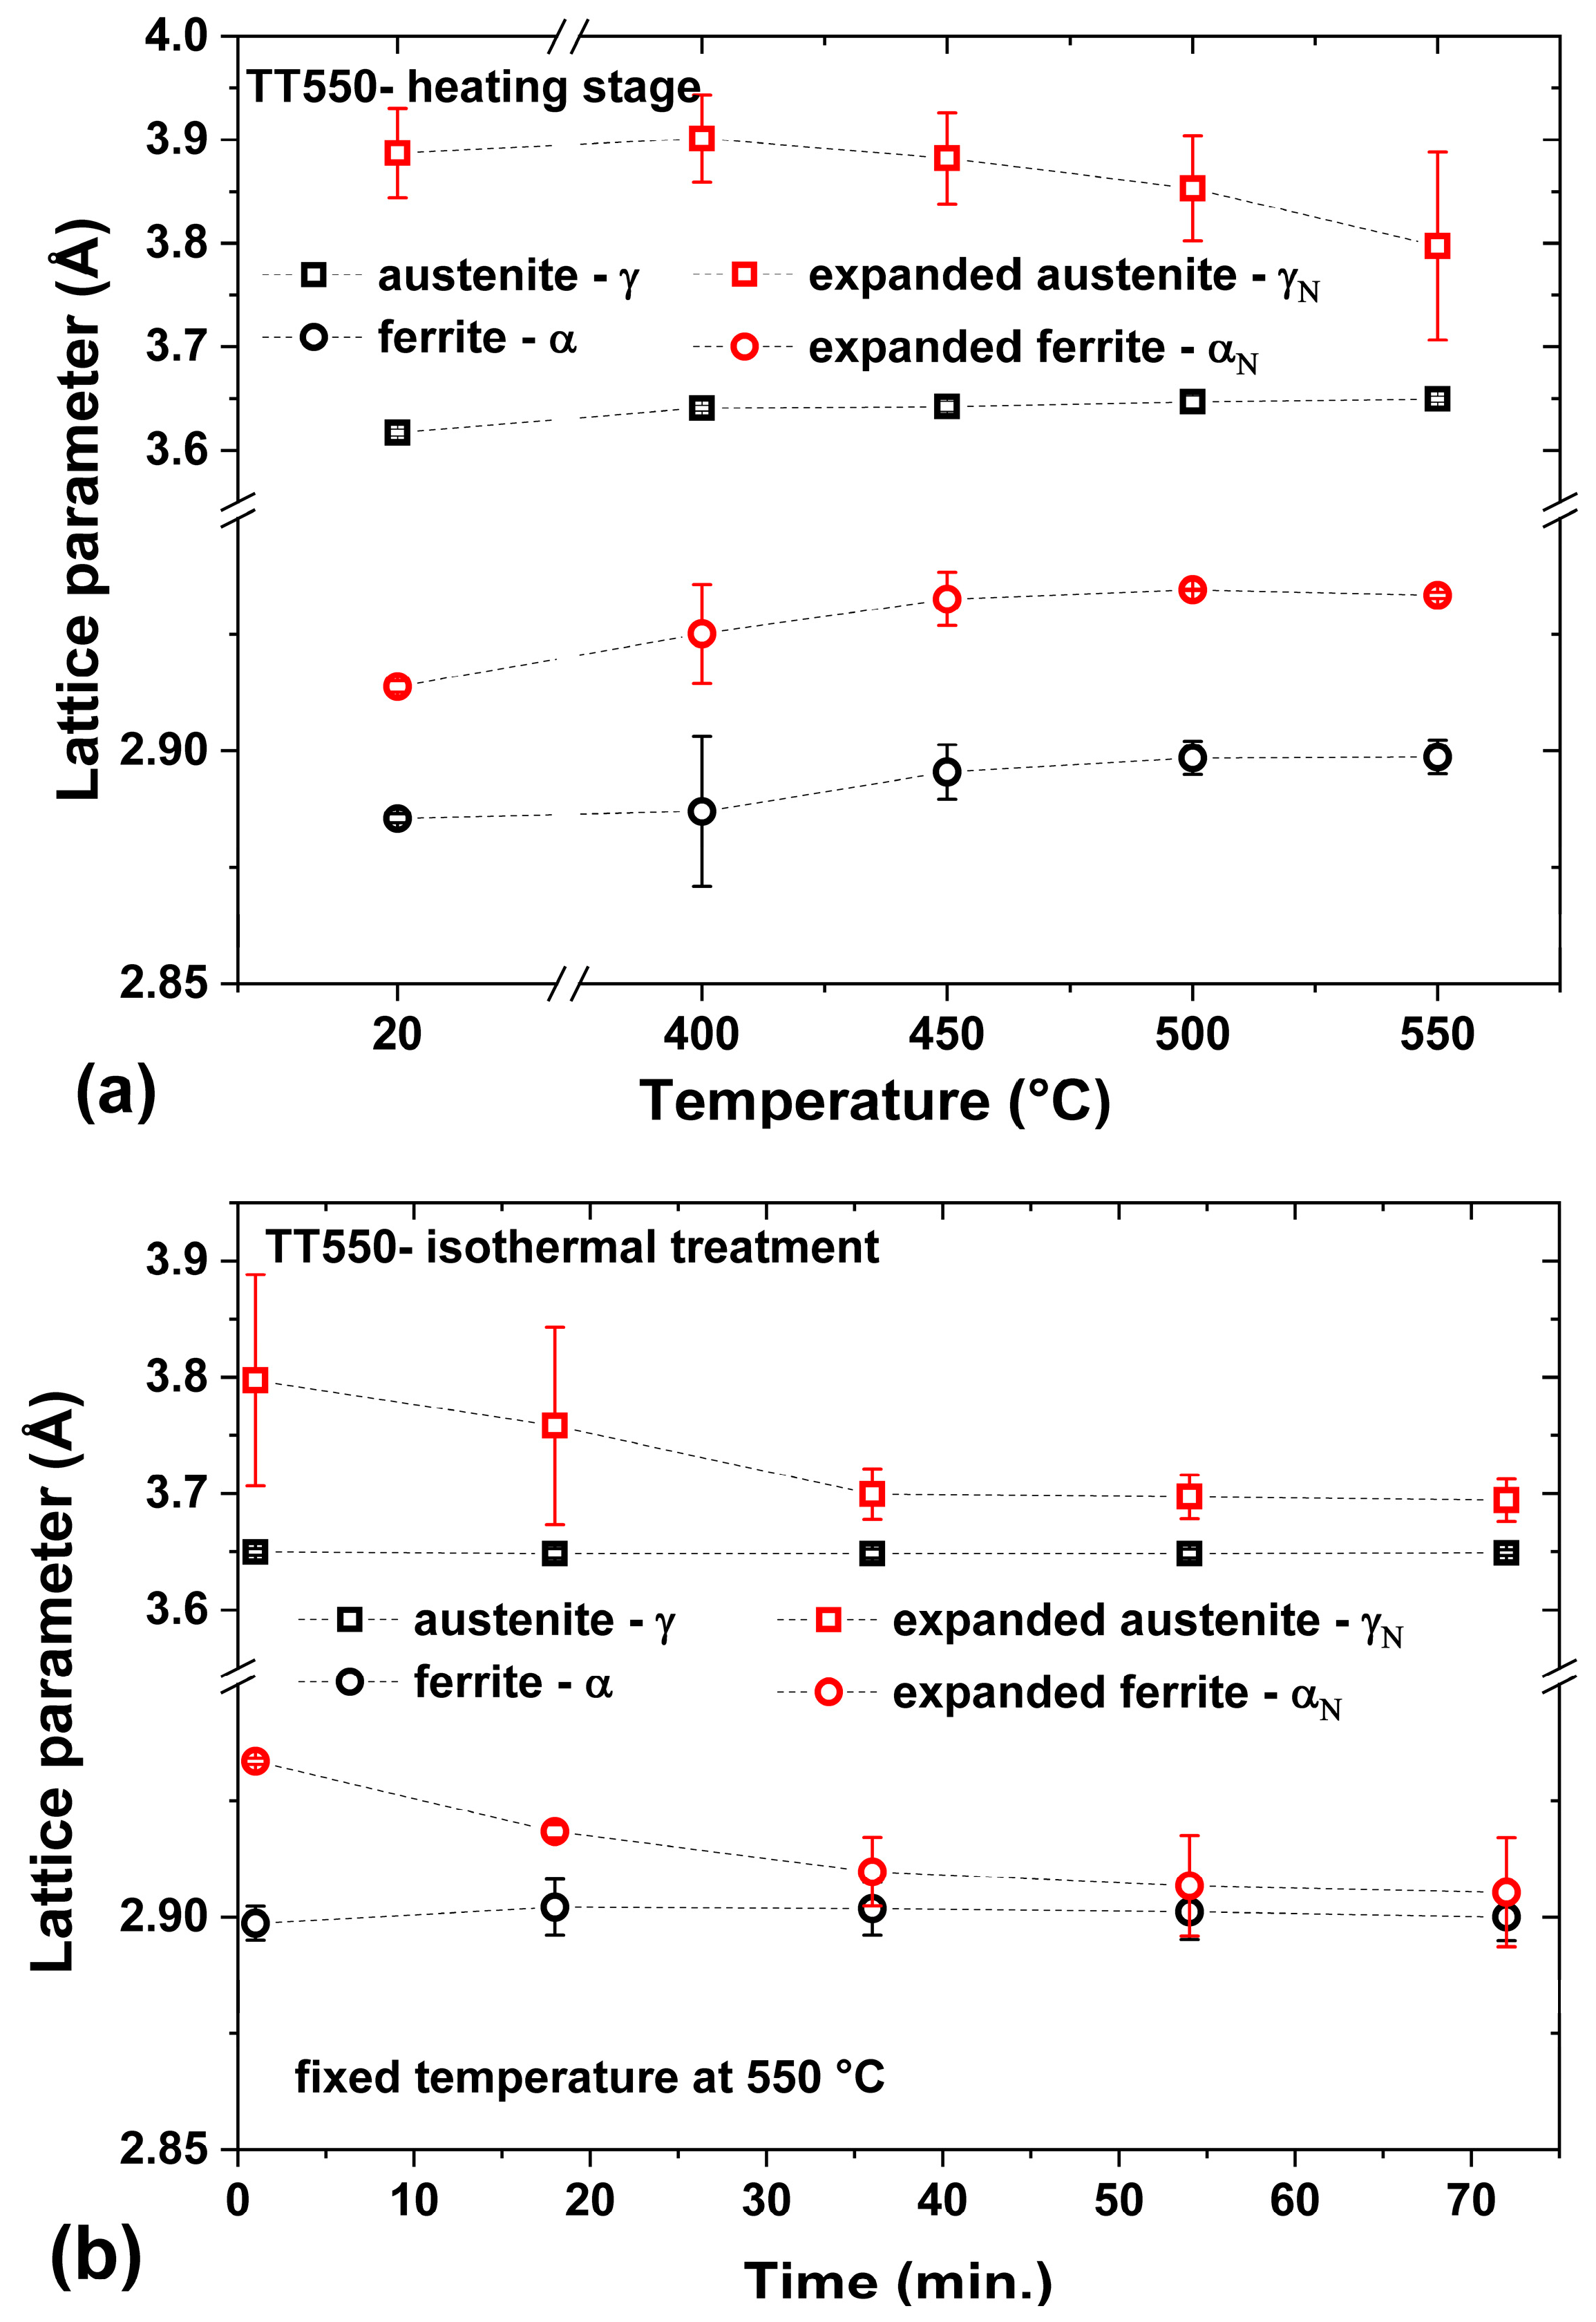
3.4. Heating at 550 °C

Figure 10 displays the X-ray diffraction data of the sample heat-treated at 550   ° C . Similarly to TT450 condition, α and γ peaks shift to smaller 2θ angles due to the thermal expansion of the crystalline structure.
In the γN phase, thermal expansion was the predominant phenomenon up to a temperature of 400 °C, leading the corresponding peaks to shift to smaller 2θ values. Above this temperature, nitrogen diffusion was facilitated, and it was observed that the peaks started to shift to higher 2θ angles, due to the lattice parameter reduction caused by nitrogen diffusion into the substrate and the subsequent layer expansion. The formation of oxides is also observed from 450 °C.
At a temperature of 550   ° C , the result falls outside the pattern seen so far. An expressive formation of peaks relative to CrN + αN + α phases occurred. In addition, there was an important shift of γN peaks toward higher 2θ angles, which was much more significant than the phenomenon observed at the TT450. It indicates a large reduction in the lattice parameter of this phase, already at the heating stage. These effects can be explained by the decay/transformation of γN phase into CrN and α [1,21,22,23,24,26]. These results are similar to those observed by Tschiptschin et al. (2017) in nitrided AISI 316 steel samples, which shows that, in heat treatments carried out at 550 °C, the decomposition of the γN phase into CrN is much more pronounced than that observed at 450 °C.
The broad α + αN peaks observed at 550 °C was a result of the intense γN decay occurring in the modified layer, according to the proposed decay γN → CrN + α + αN. Furthermore, the α to αN phase conversion can occur and the α phase formed in the austenite grains has a different chemical composition than that formed in the previously ferrite grains. Thus, a variation in the lattice parameters of the α and αN phase may occur, contributing to the broadening of the peak relative to these phases.
Figure 11 shows diffractograms of the TT550 sample obtained during the isothermal phase. As the decay of the expanded austenite phase started intensely even during the temperature ramp, the main changes at constant temperature involved the CrN and α + αN phases peaks, which became more intense and better defined in the course of time. These observations corroborate the thermal decomposition of the γN phase into CrN + α + αN in the duplex steel, similarly to what was previously observed in austenitic and ferritic steels [1,21,22,23,24,26]. In Figure 11b,c, it is evident that the αN peaks did continue to shift towards higher 2θ values, indicating a reduction in the lattice parameter throughout the isothermal treatment.
The intensity of the peaks of the γ phase gradually decreases further over time in Figure 11. As commented in the previous section, the same studies that note that the decomposition of the γN phase into CrN + α occurs also mention the formation of the γ phase [23,35]. In our study, a reduction in the intensity of the peaks was observed related to the γ phase during the treatments TT450 and TT550 caused by growth of the modified layer after thermal treatments. If the γ phase was formed inside the modified layer, it may recombine quickly with nitrogen to form the γN phase, making its detection difficult.
In Figure 12, the diffractograms of the sample before and after heat treatment at 550 °C and cooling of the sample, obtained under incident angle θ = 10° and 2° at room temperature, highlight the main structural changes caused to the modified layer. In Figure 12a, the formation of CrN and α + αN after heat treatment became more evident. At θ = 10°, it is difficult to exclude the contribution of ε and γ′ nitride peaks in the diffractograms because their position is often overlapped by peaks related to other phases. However, if they were formed, it would be close to the surface where the nitrogen content was the highest. At θ = 2°, in Figure 12b, there are no peaks related to these phases that could undoubtedly characterize them. Therefore, it was not possible to rule out its presence on the surface of the samples before and after the heat treatment.
The evolution of the lattice parameters of the γ, α, γN, and αN phases as a function of temperature and time is presented in Figure 13. The crystalline structures of the α and γ phases expanded with the temperature increase in a similar trend as seen before (Figure 8a), while they remained stable during the isothermal heating. The average γN lattice parameter began to reduce during heating at a temperature of 450 °C and varied from 3.8 to 3.7 Å in isothermal treatment. Oppositely, the αN phase disclosed an increase in the average lattice parameter during heating because of the thermal expansion and, possibly, the γN → α + αN + CrN conversion. The subsequent reduction of the mean αN lattice parameter that occurred under isothermal conditions may express the continuity of the decay process with different phases balance, along with nitrogen diffusion to the substrate and to neighboring austenite grains (as previously discussed).
In Table 3, it is possible to compare the αN and γN expansions, calculated from the lattice parameters before and after heating. The average expansion was calculated from the following equation:
A v e r a g e   e x p a n s i o n   % = a ¯ x N a ¯ x a ¯ x × 100 ,
where x = γ   o r   x = α . The crystal structure of the γN phase was considered an FCC structure, similar to the γ phase (based on the Fe4N model for γN [36,37]), and that of the αN phase was considered to be a BCC structure, like the α phase. In this equation, a ¯ γ and a ¯ γ N are the lattice parameters obtained by averaging the lattice parameter values calculated from the interplanar distances between crystallographic planes (111), (200), and (220). Similarly, for the calculation of the average values of a ¯ α and a ¯ α N , the crystallographic planes (110) and (200) were used.
In line with the diffractograms, in relation to the γN phase, there was a reduction in the expansion, from 7.35% to 5.37%, after treatment at 450 °C. After treatment at 550 °C, the reduction was much greater, from 7.35% to 1.40%. In the αN phase, the variation of the average expansion was much smaller than that observed for the γN phase after heat treatments.

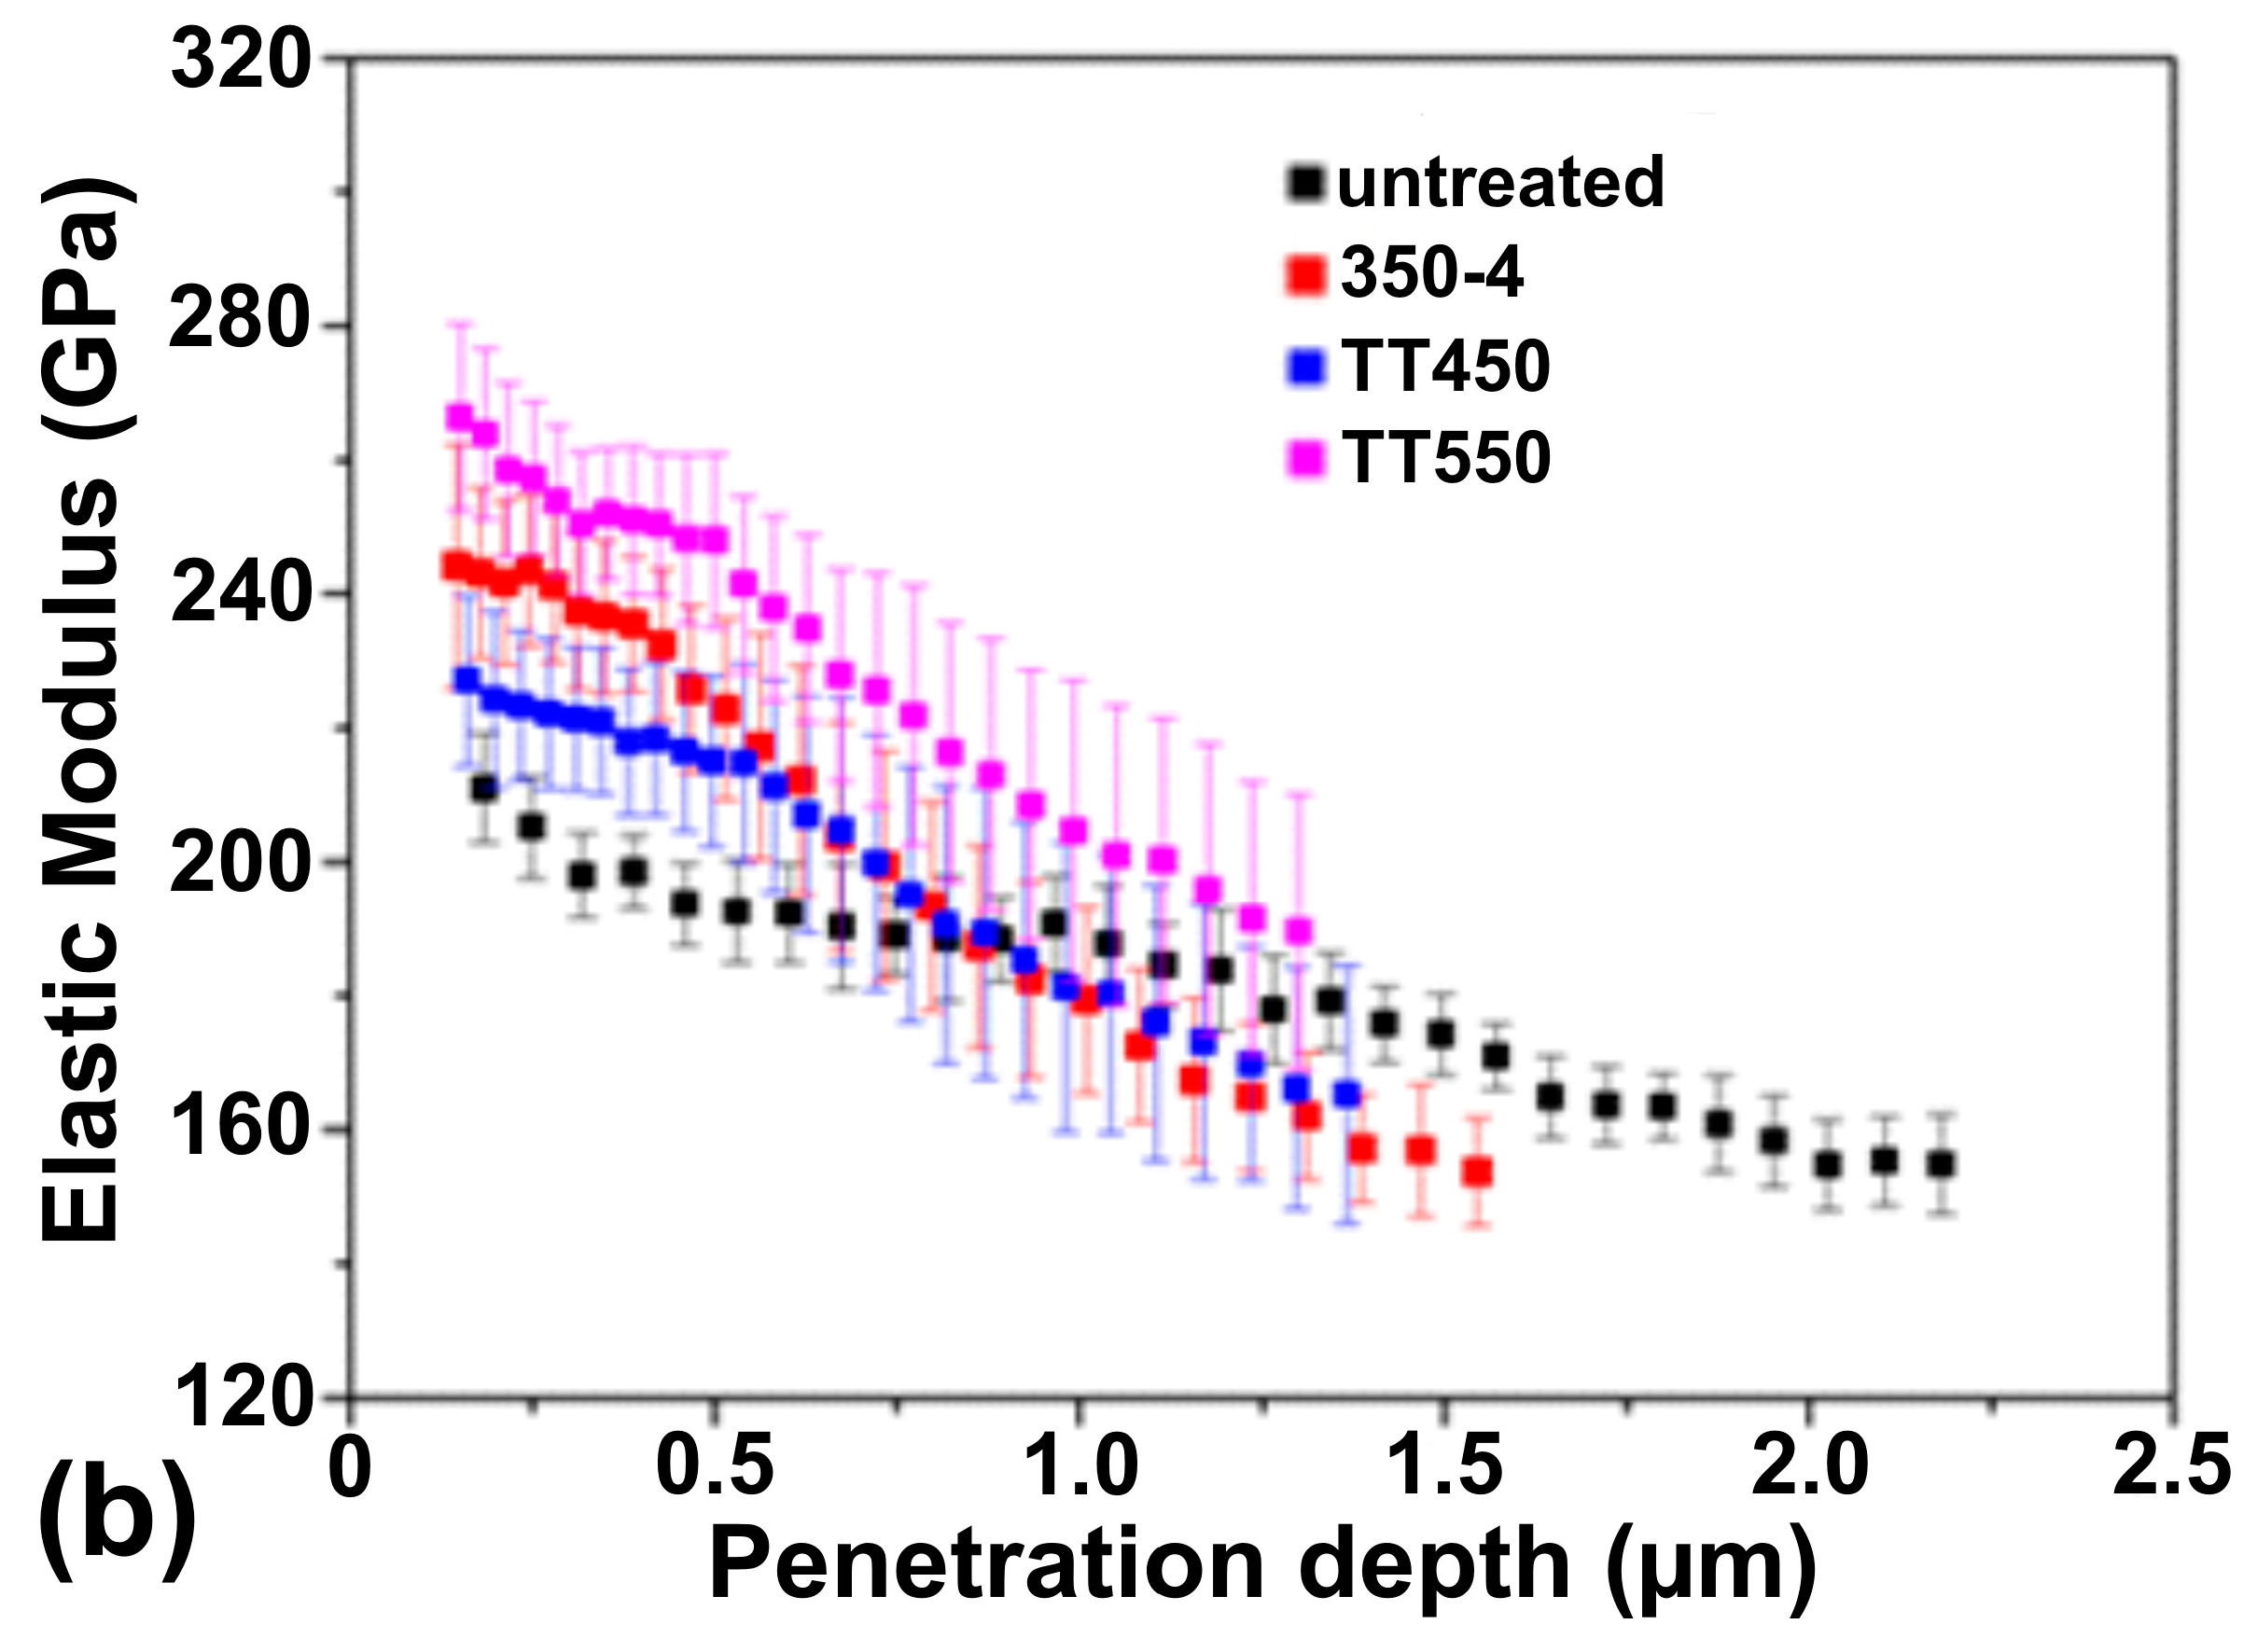
3.5. Mechanical Properties

Figure 14a shows the hardness analysis as a function of penetration depth. The horizontal dashed line indicates the hardness of the UNS S32750 untreated sample, which corresponds to the hardness value of the substrate of the samples. It is possible to see that the nitriding process increased the hardness of the material around four times near the surface and doubled the hardness value at a depth of 1.5 μm. It is stressed that the nanoindentation tests were carried out directly on the top surfaces, so that the results are composed of mechanical responses from both layer and substrate within the elastic and plastic strain zones.
The hardening mechanism associated with the presence of nitrogen in solid solution is called “Cottrell atmosphere”. In this mechanism, nitrogen can migrate to dislocation sites, hindering their movement and reducing sliding systems. Thus, it results in the hardness increase, or the improved resistance to plastic deformation, in the layer composed of γN and αN phases compared to the substrate. The hardness values of the 350-4 sample decrease as the nitrogen content in the layer is reduced and as the influence of the substrate increases at greater indenter penetration depths.
The heat treatments performed caused a decrease in hardness, concerning the sample only nitrided in the region close to the surface. However, in deeper regions, heat treatment caused an increase in hardness due to the increased layer thickness (see Table 2). This result agrees with the nitrogen profile obtained for sample TT550 compared to the nitrided sample 350-4, Figure 3b, where the nitrogen content reduced at near-surface region and increased at deeper regions. In agreement with what was observed in the diffractograms, sample TT550, which presented a more significant formation of the CrN phase, also presented a higher hardness profile on the surface than the TT450 condition.
The hardness profile of the 350-4 showed a plateau with approximately constant values up to ~0.35 μm. This value, according to the 10% rule [42], corresponds to approximately 10% of the of the modified layer thickness and agrees with the thickness evaluated after the chemical etching (Table 2). Accordingly, after heat treatments, the plateaus of the hardness profiles became larger due to the expansion of the N-containing layer.
The elastic modulus profiles as a function of the penetration depth are presented in Figure 14b. The 350-4 nitrided sample showed a higher elastic modulus than the untreated sample due to the presence of the γN phase. In the TT450 treatment, the decomposition of the γN phase occurred predominantly by the nitrogen diffusion from the layer to the substrate, therefore reducing the nitrogen solid solution content at near surface. Besides, there was little formation of Cr nitrides in this case. This is why the elastic modulus profile of the TT450 surface was lower than that obtained for sample 350-4. In the TT550, the elastic modulus profile was the highest one due to the massive formation of Cr nitrides in the modified layer, which is in accordance with a previous study [7].

4. Conclusions

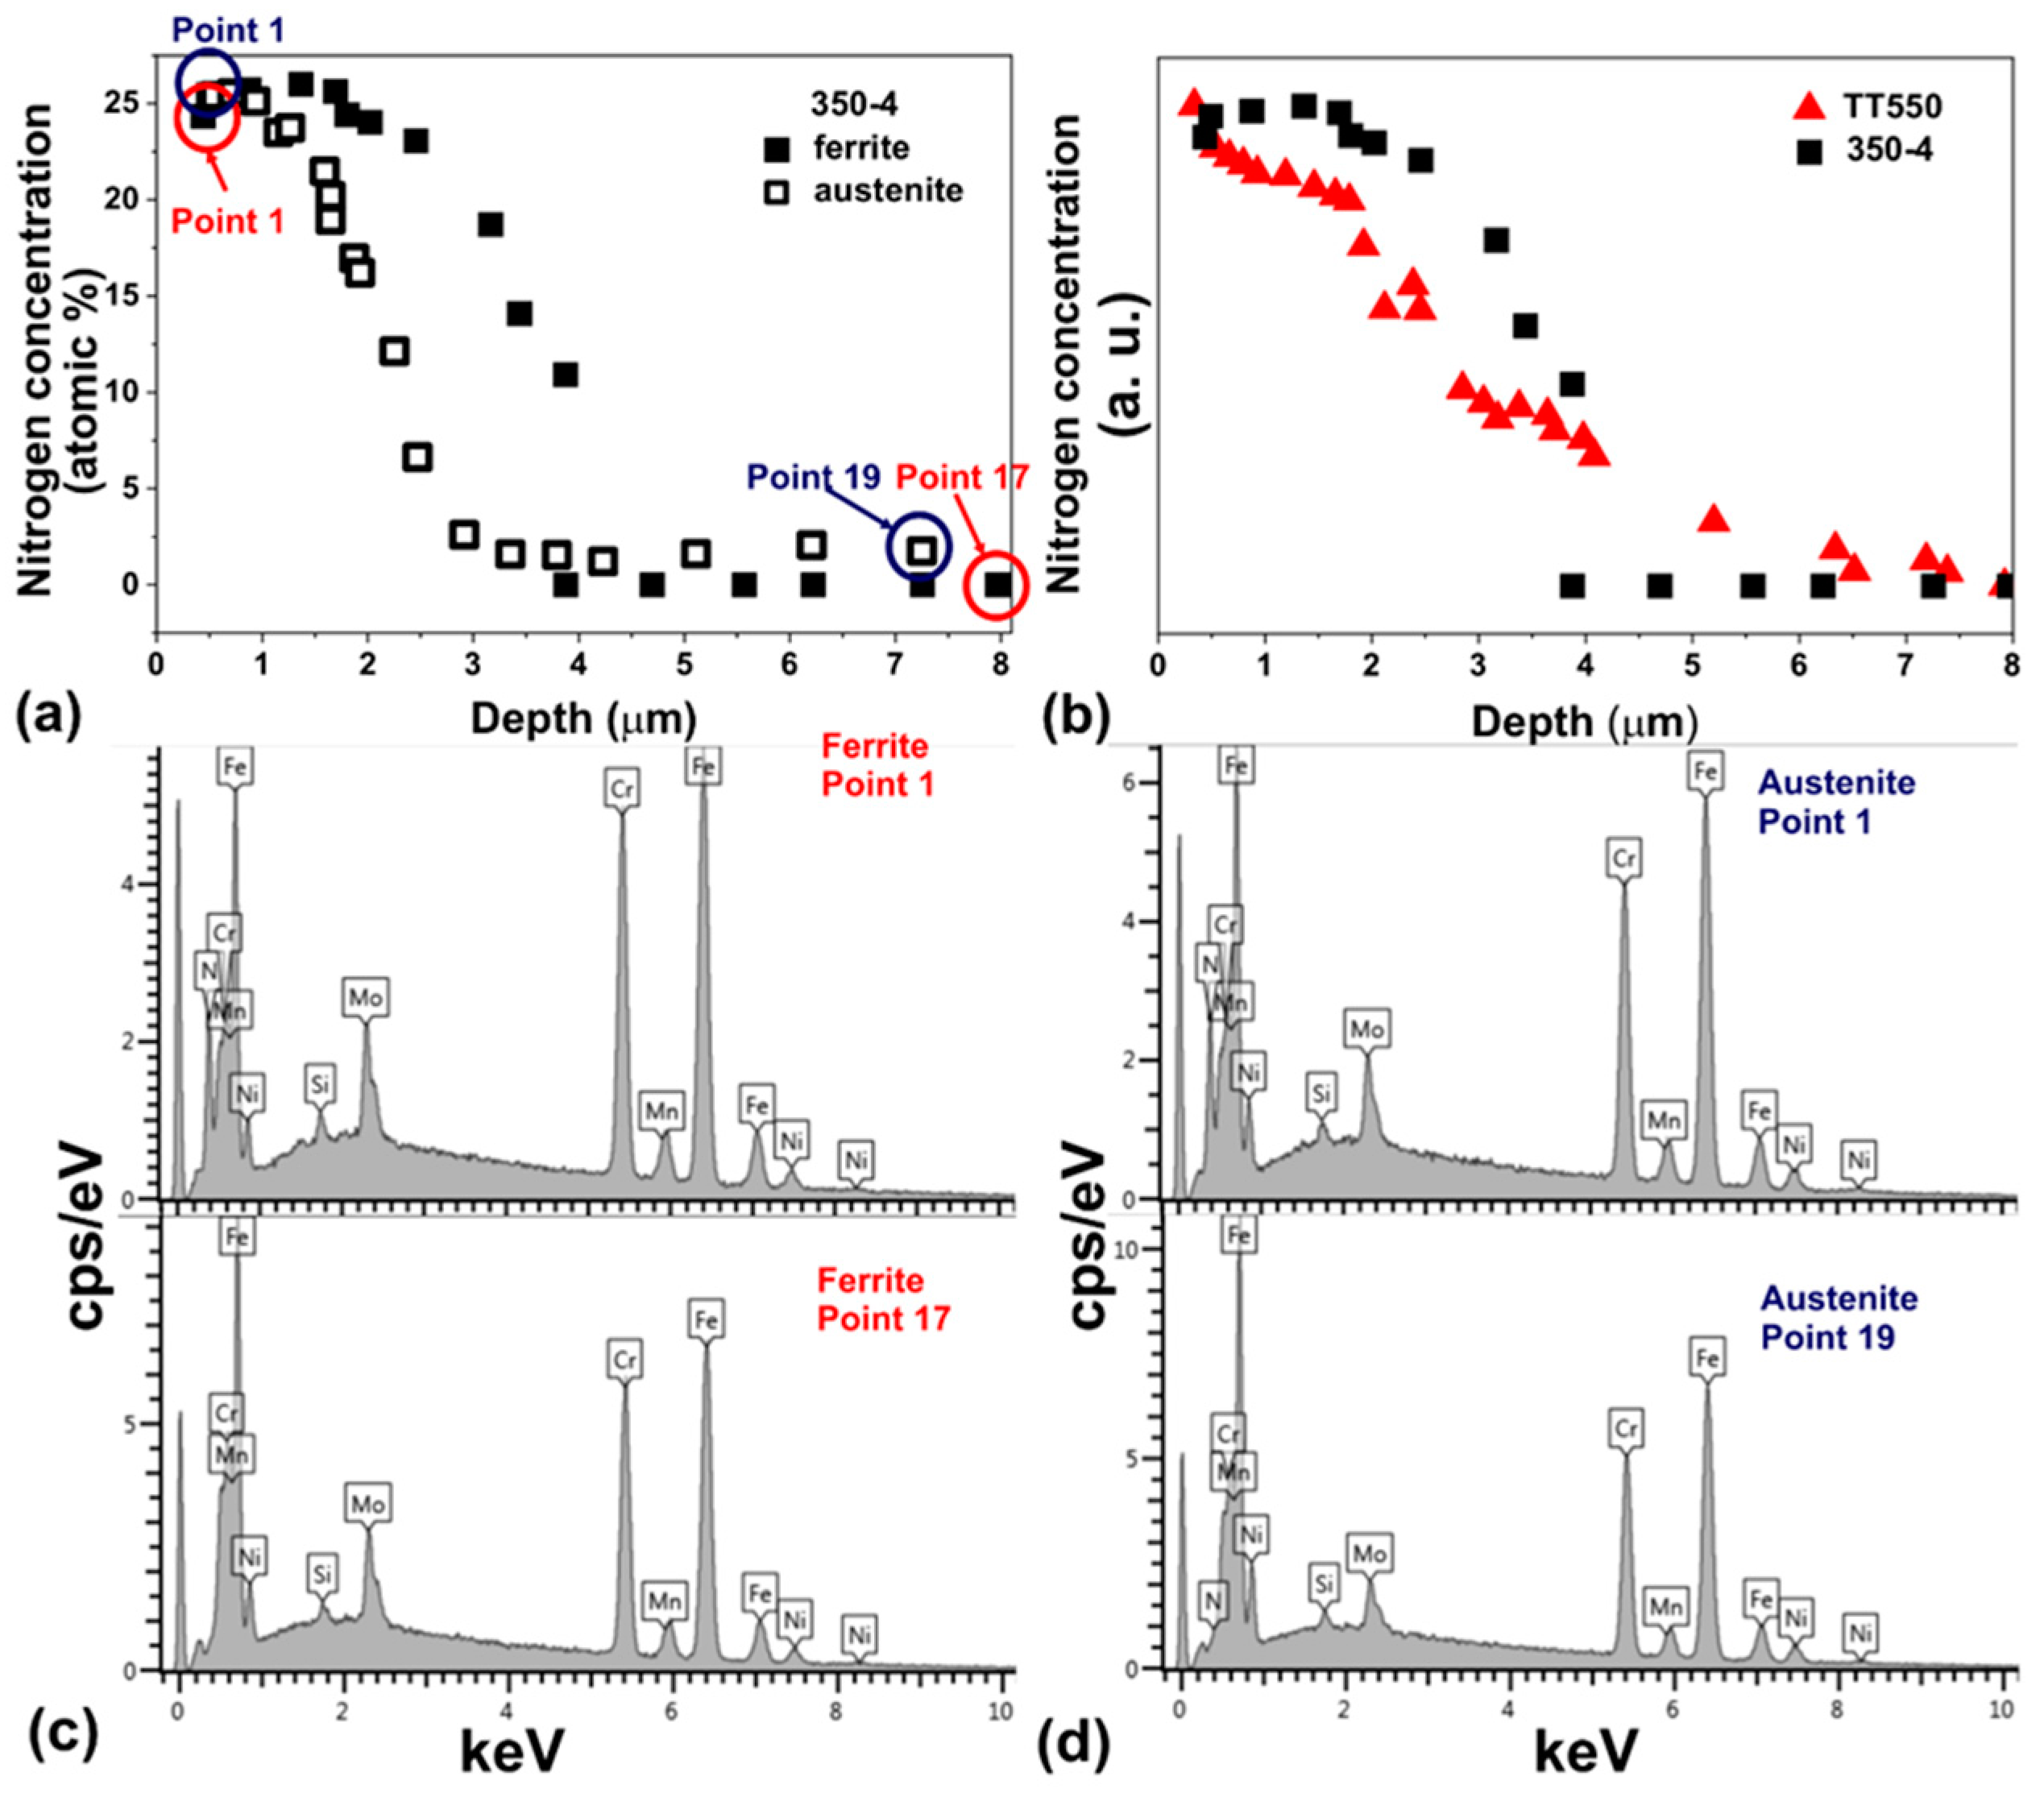
  • The nitriding of UNS S32750 steel by PIII at 350 °C for 4 h was sufficient to form a modified layer with varying thicknesses on the ferrite (3.7 ± 0.3) and austenite (2.9 ± 0.4) phases.
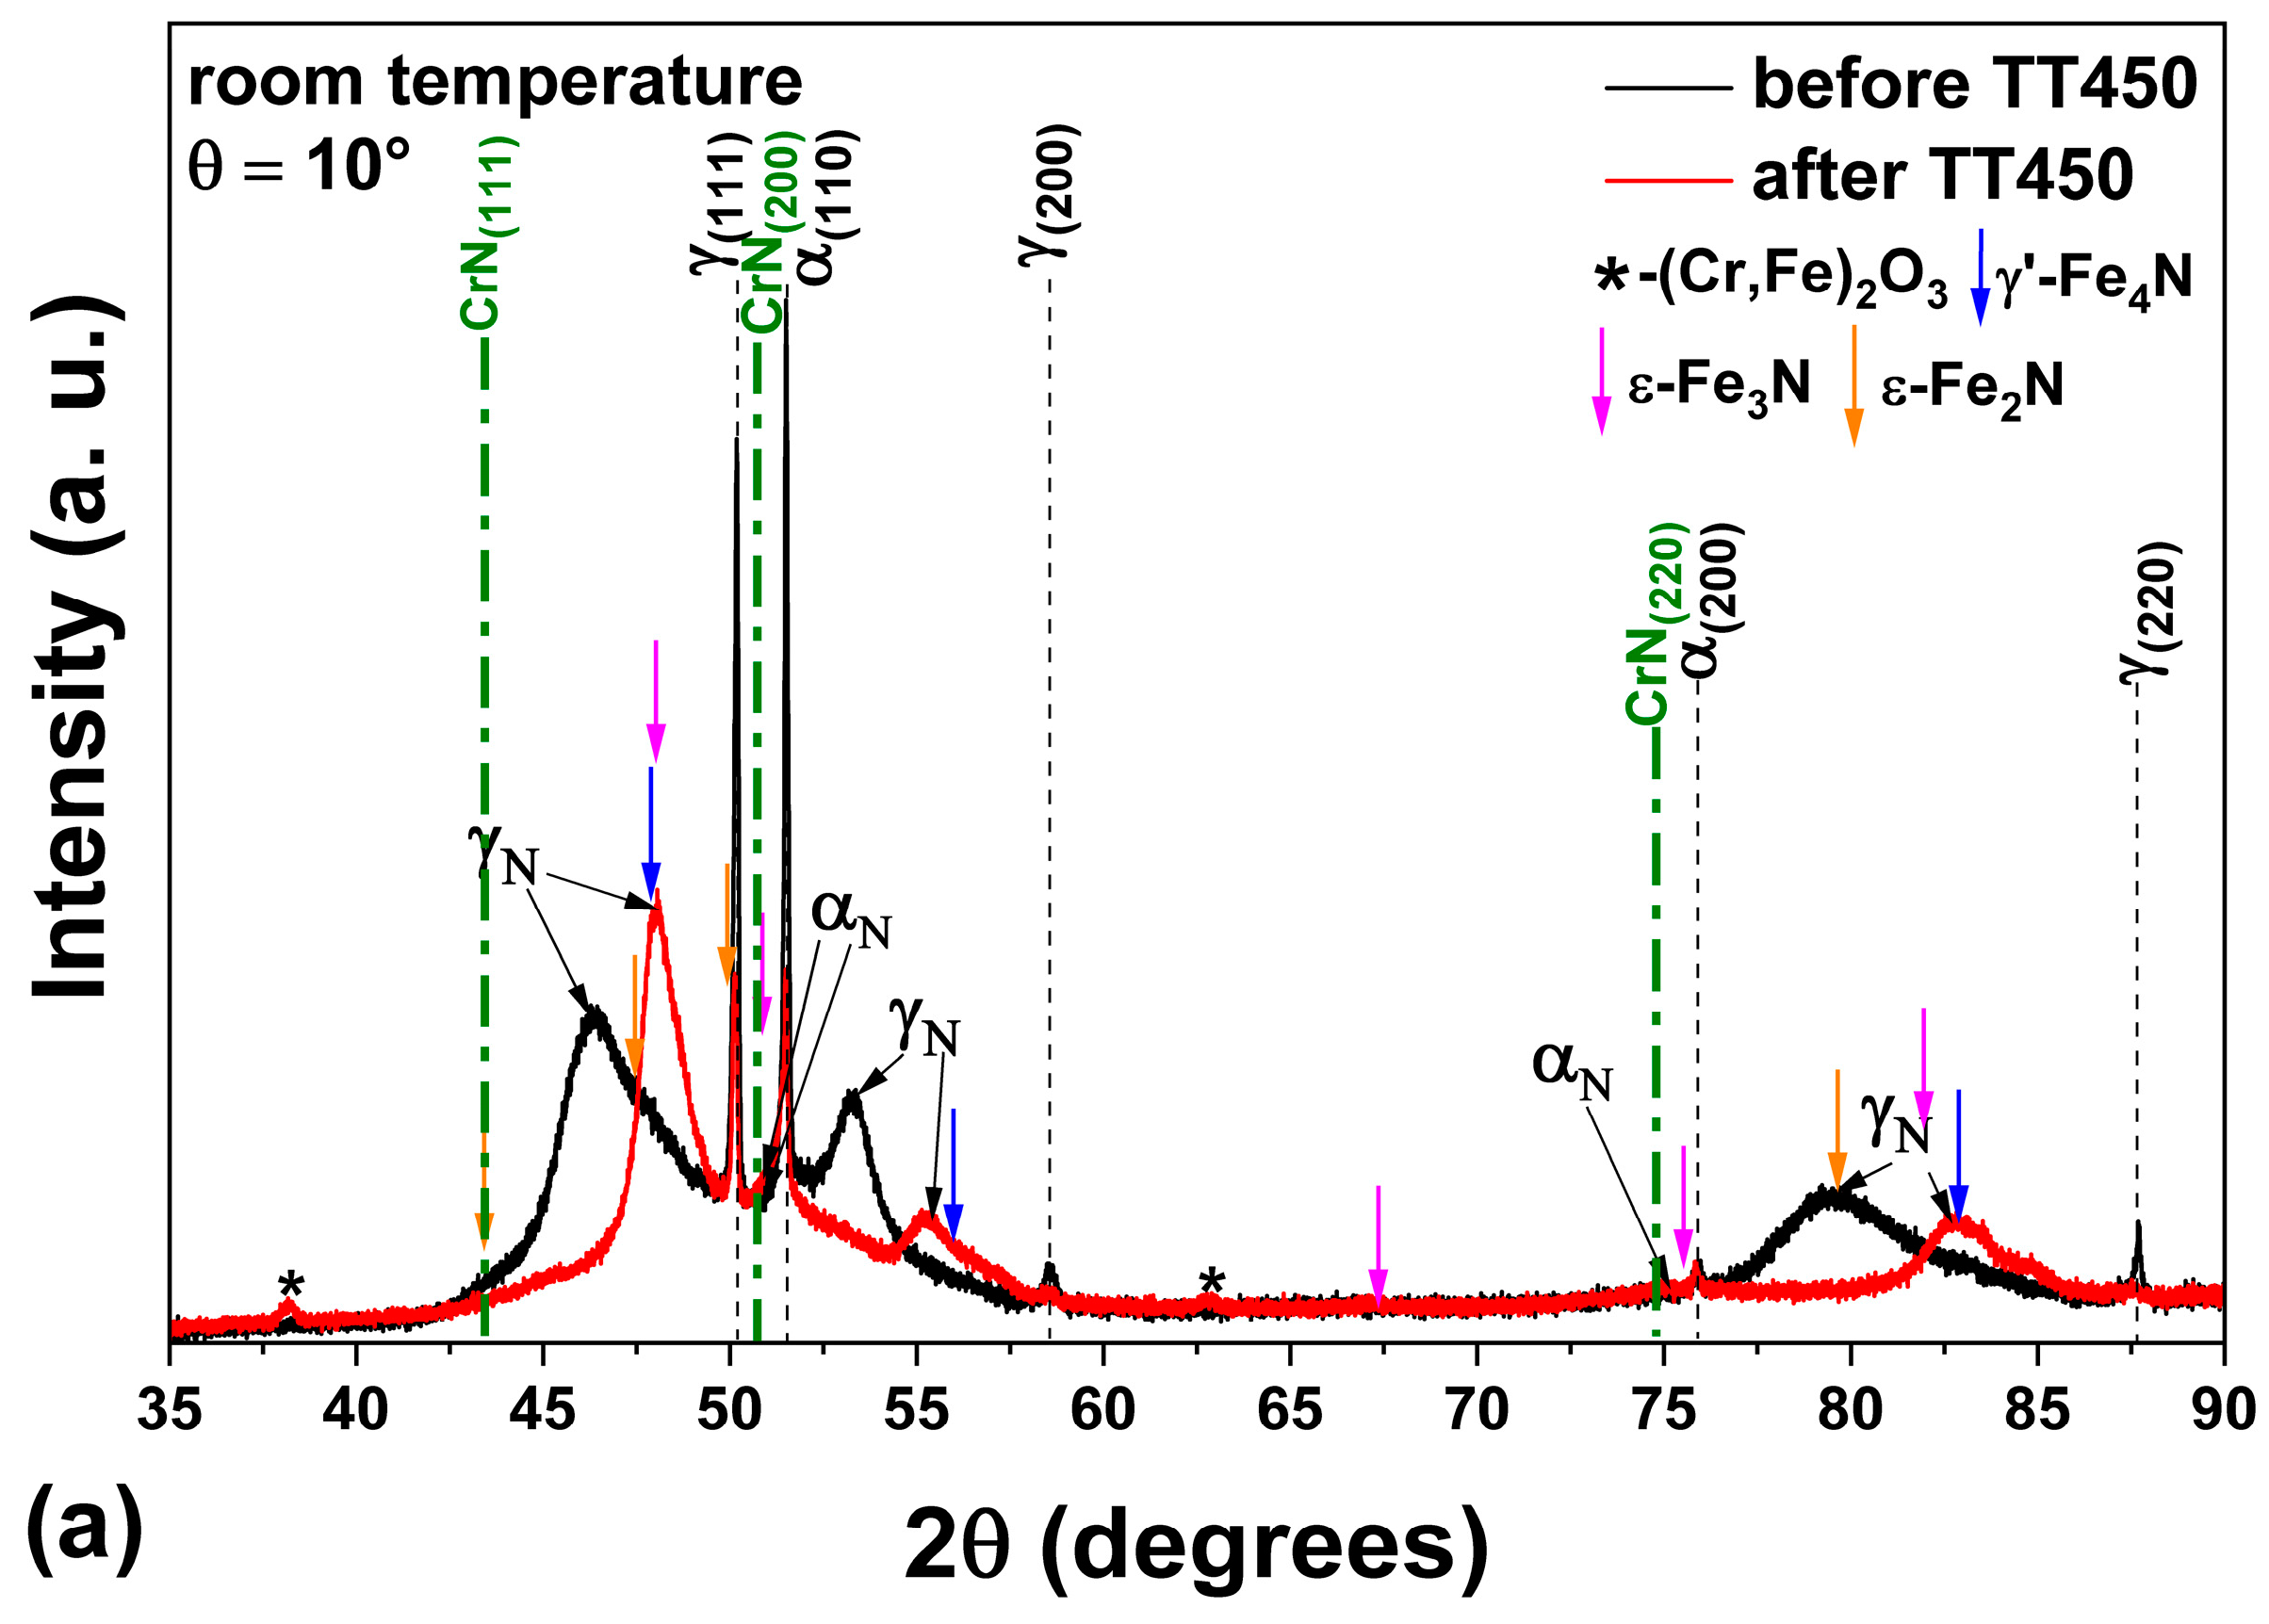
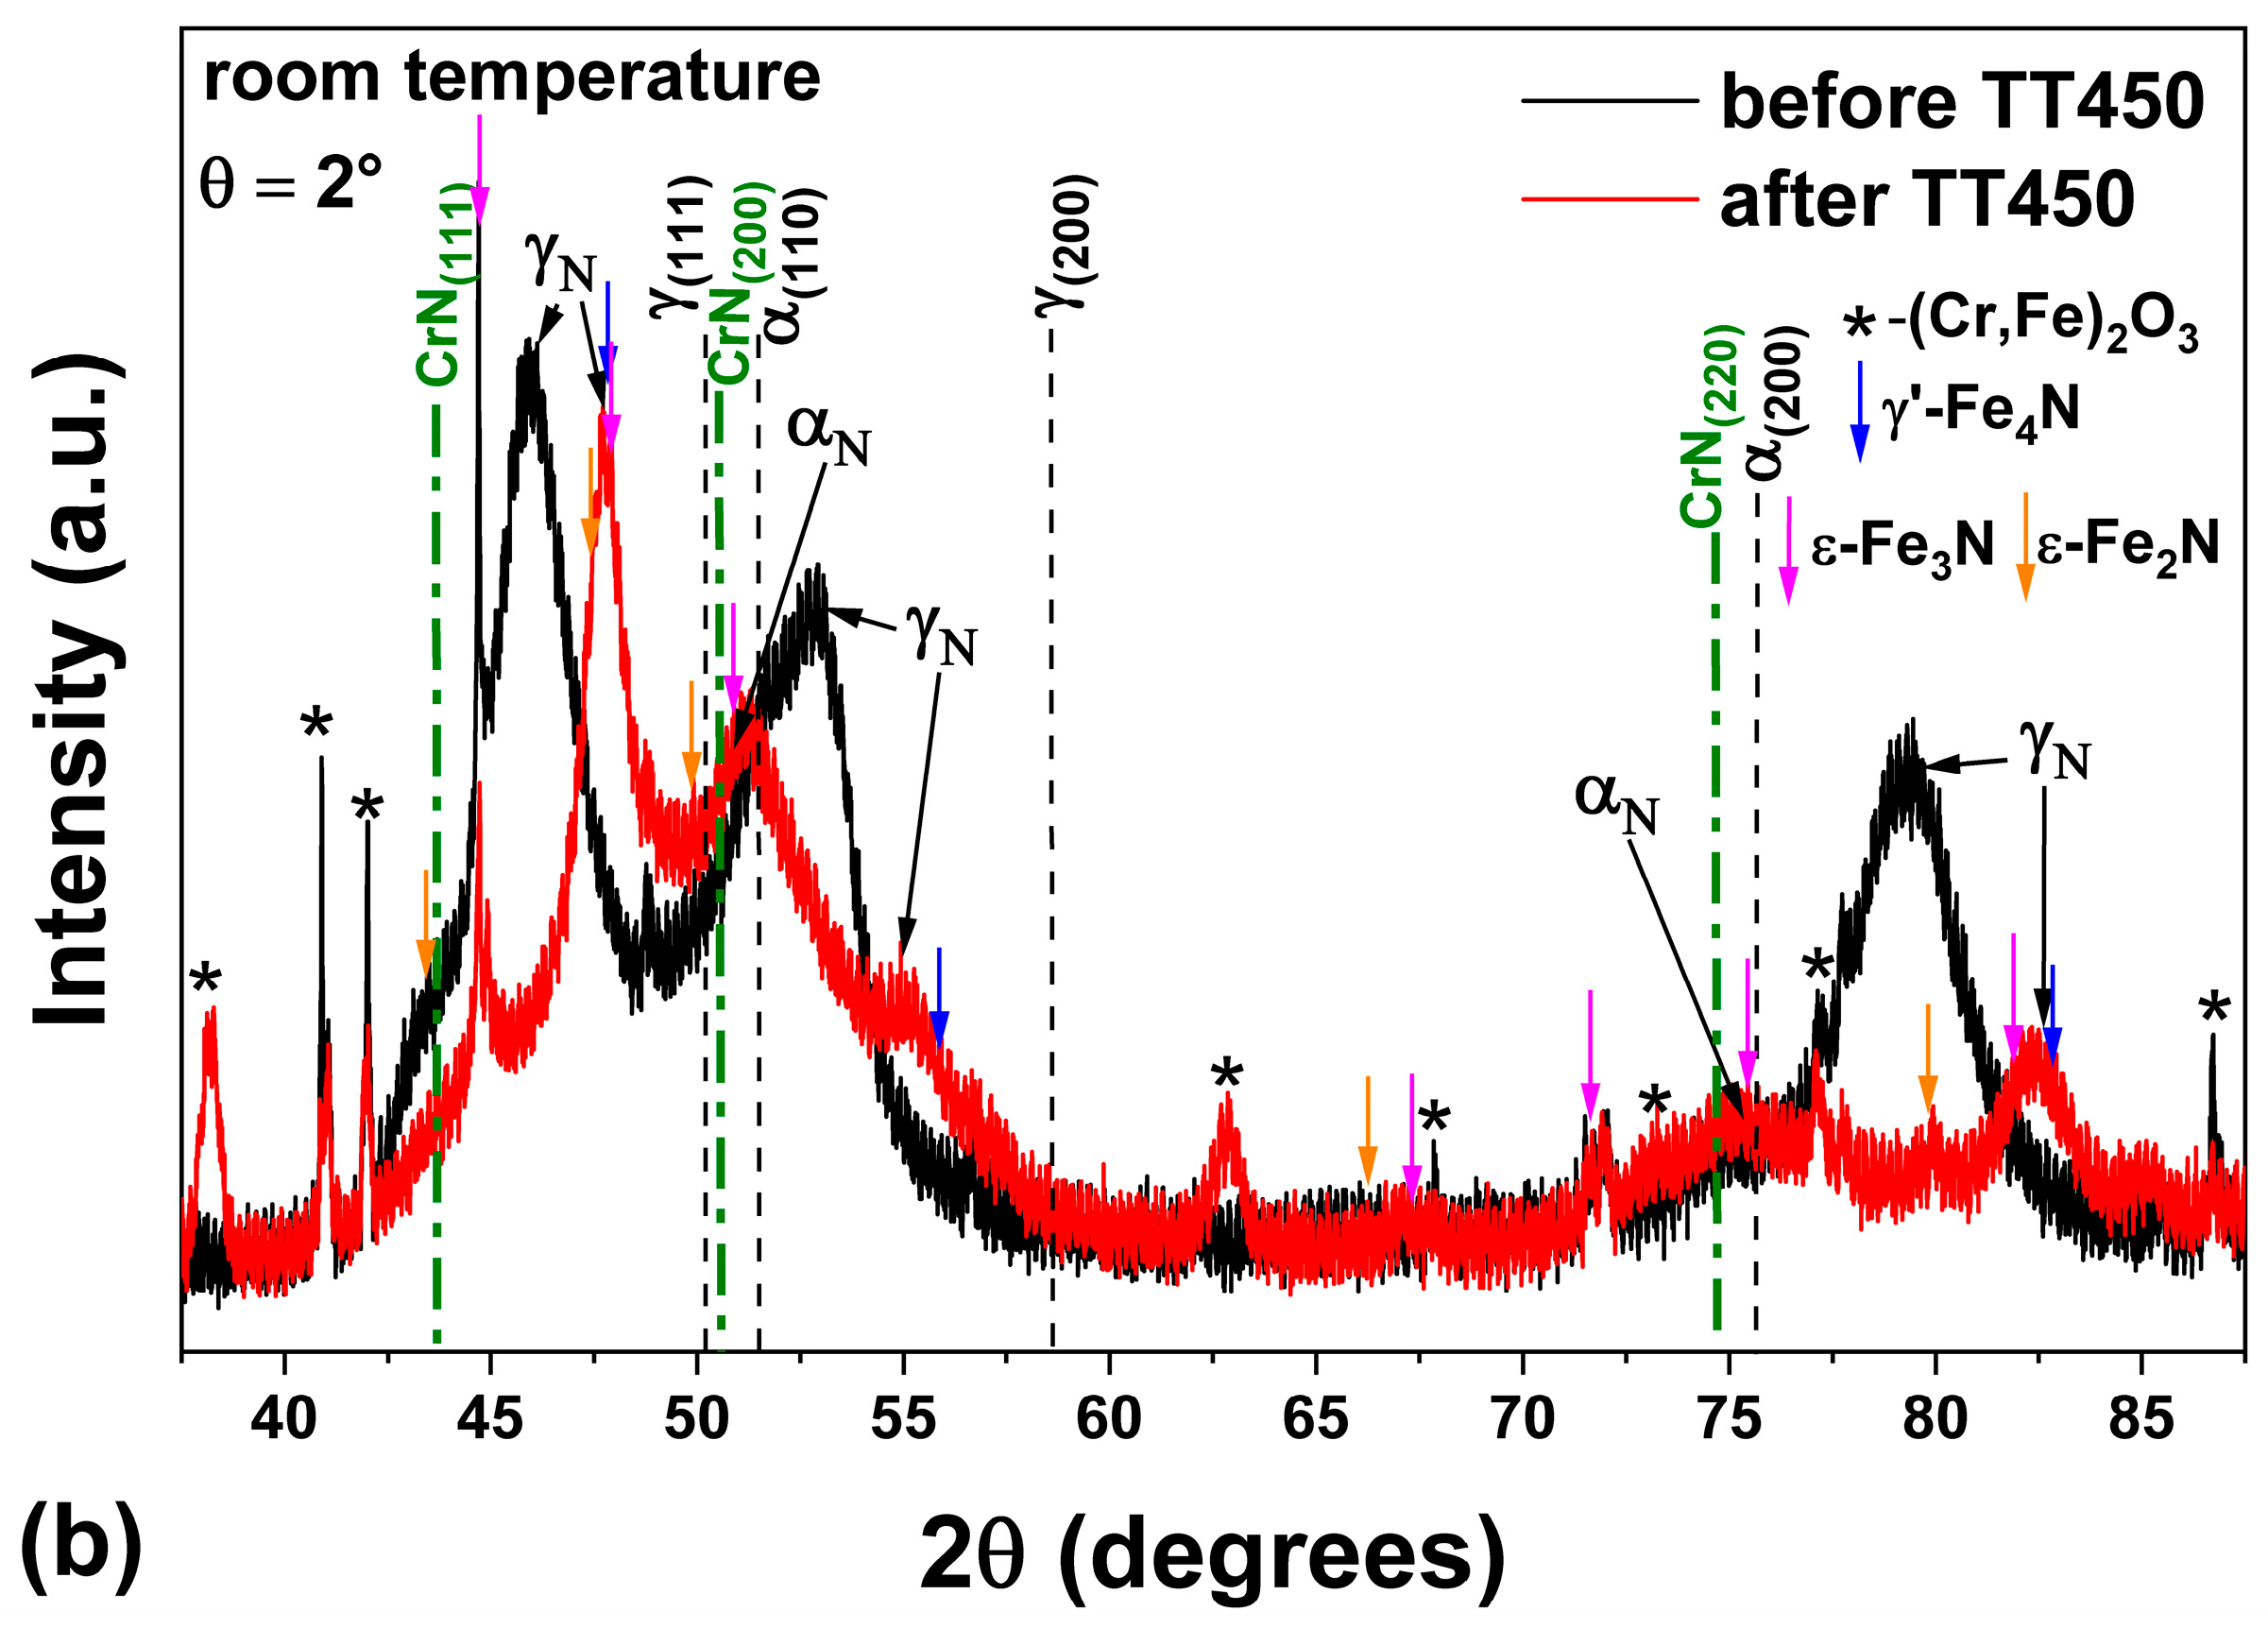
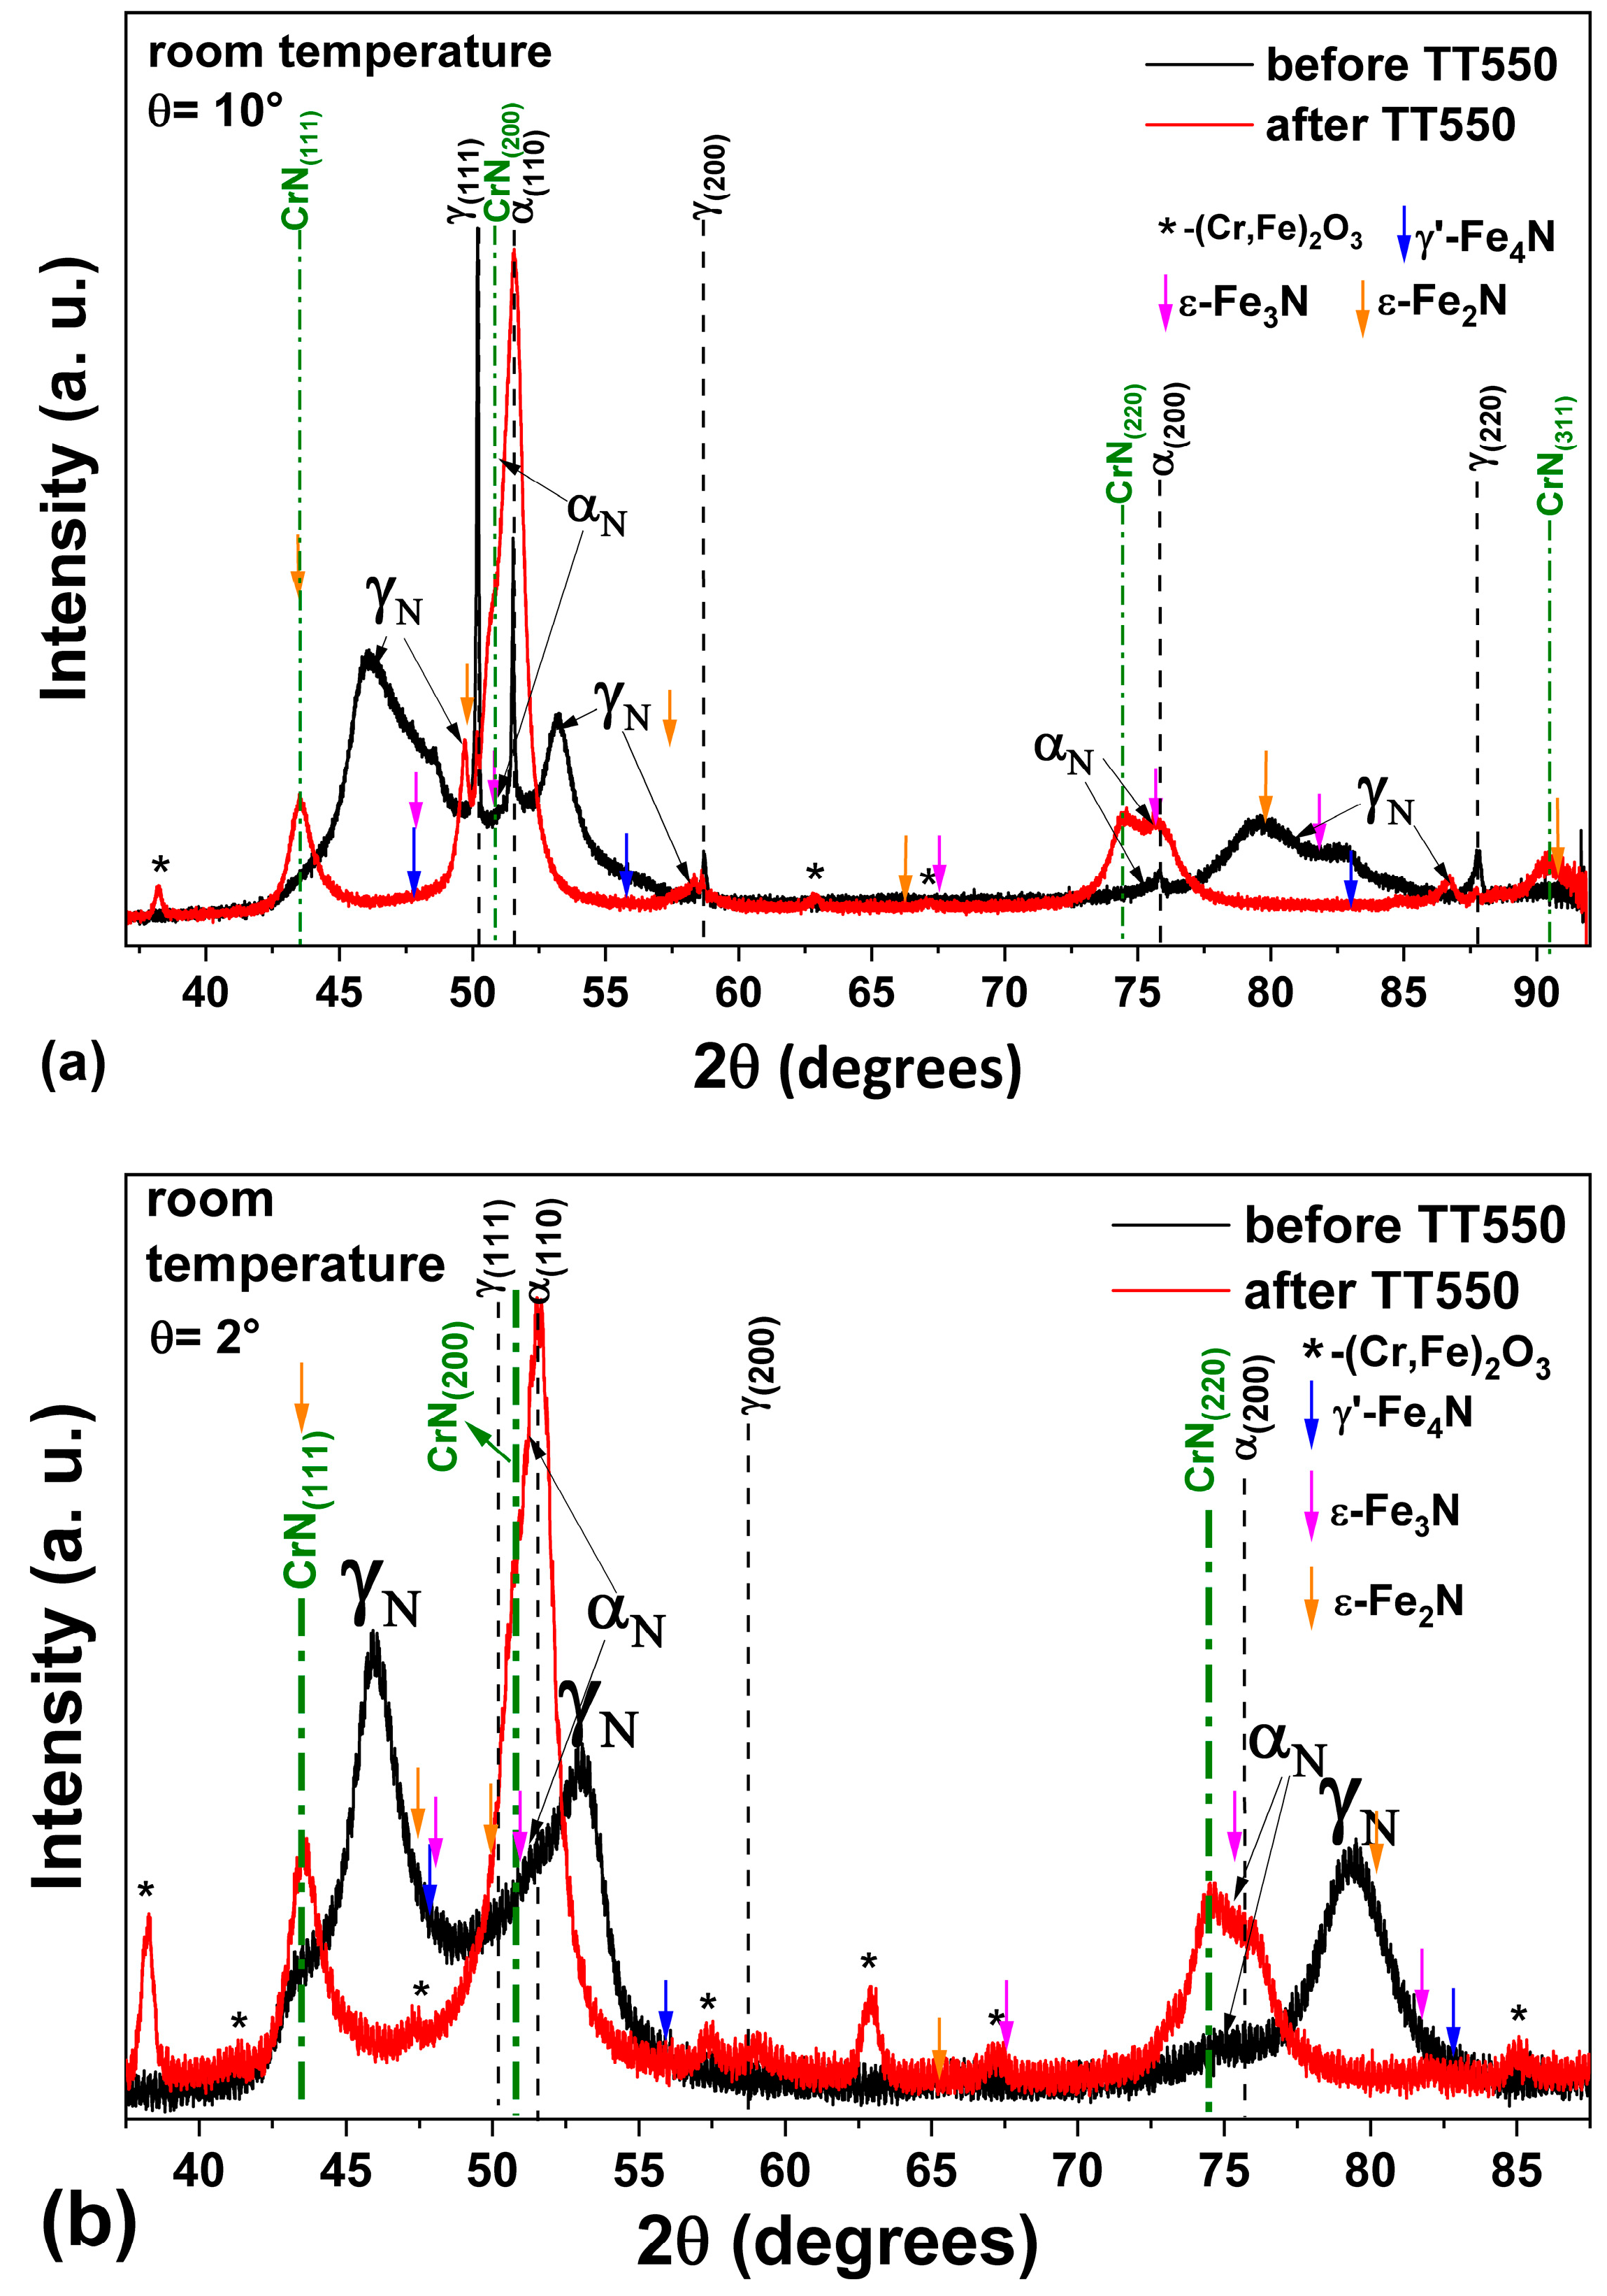
  • The modified layer was composed of γN and αN with minor contributions of CrN and ε phase observed on the surface of the samples.
  • The heat treatment up to 450 °C results an increase in layer thickness, maintaining the microstructure composed predominantly of γN and αN, while the heat treatment at higher temperatures, up to 550 °C, causes the substantive decay/transformation of expanded austenite into CrN, α and αN.
  • In both heat treatments, the appearance of chromium nitrides and iron oxides was observed.
  • The close monitoring of the phases decay enabled the identification of the reactions involving αN, as well as γN → α + αN + CrN.
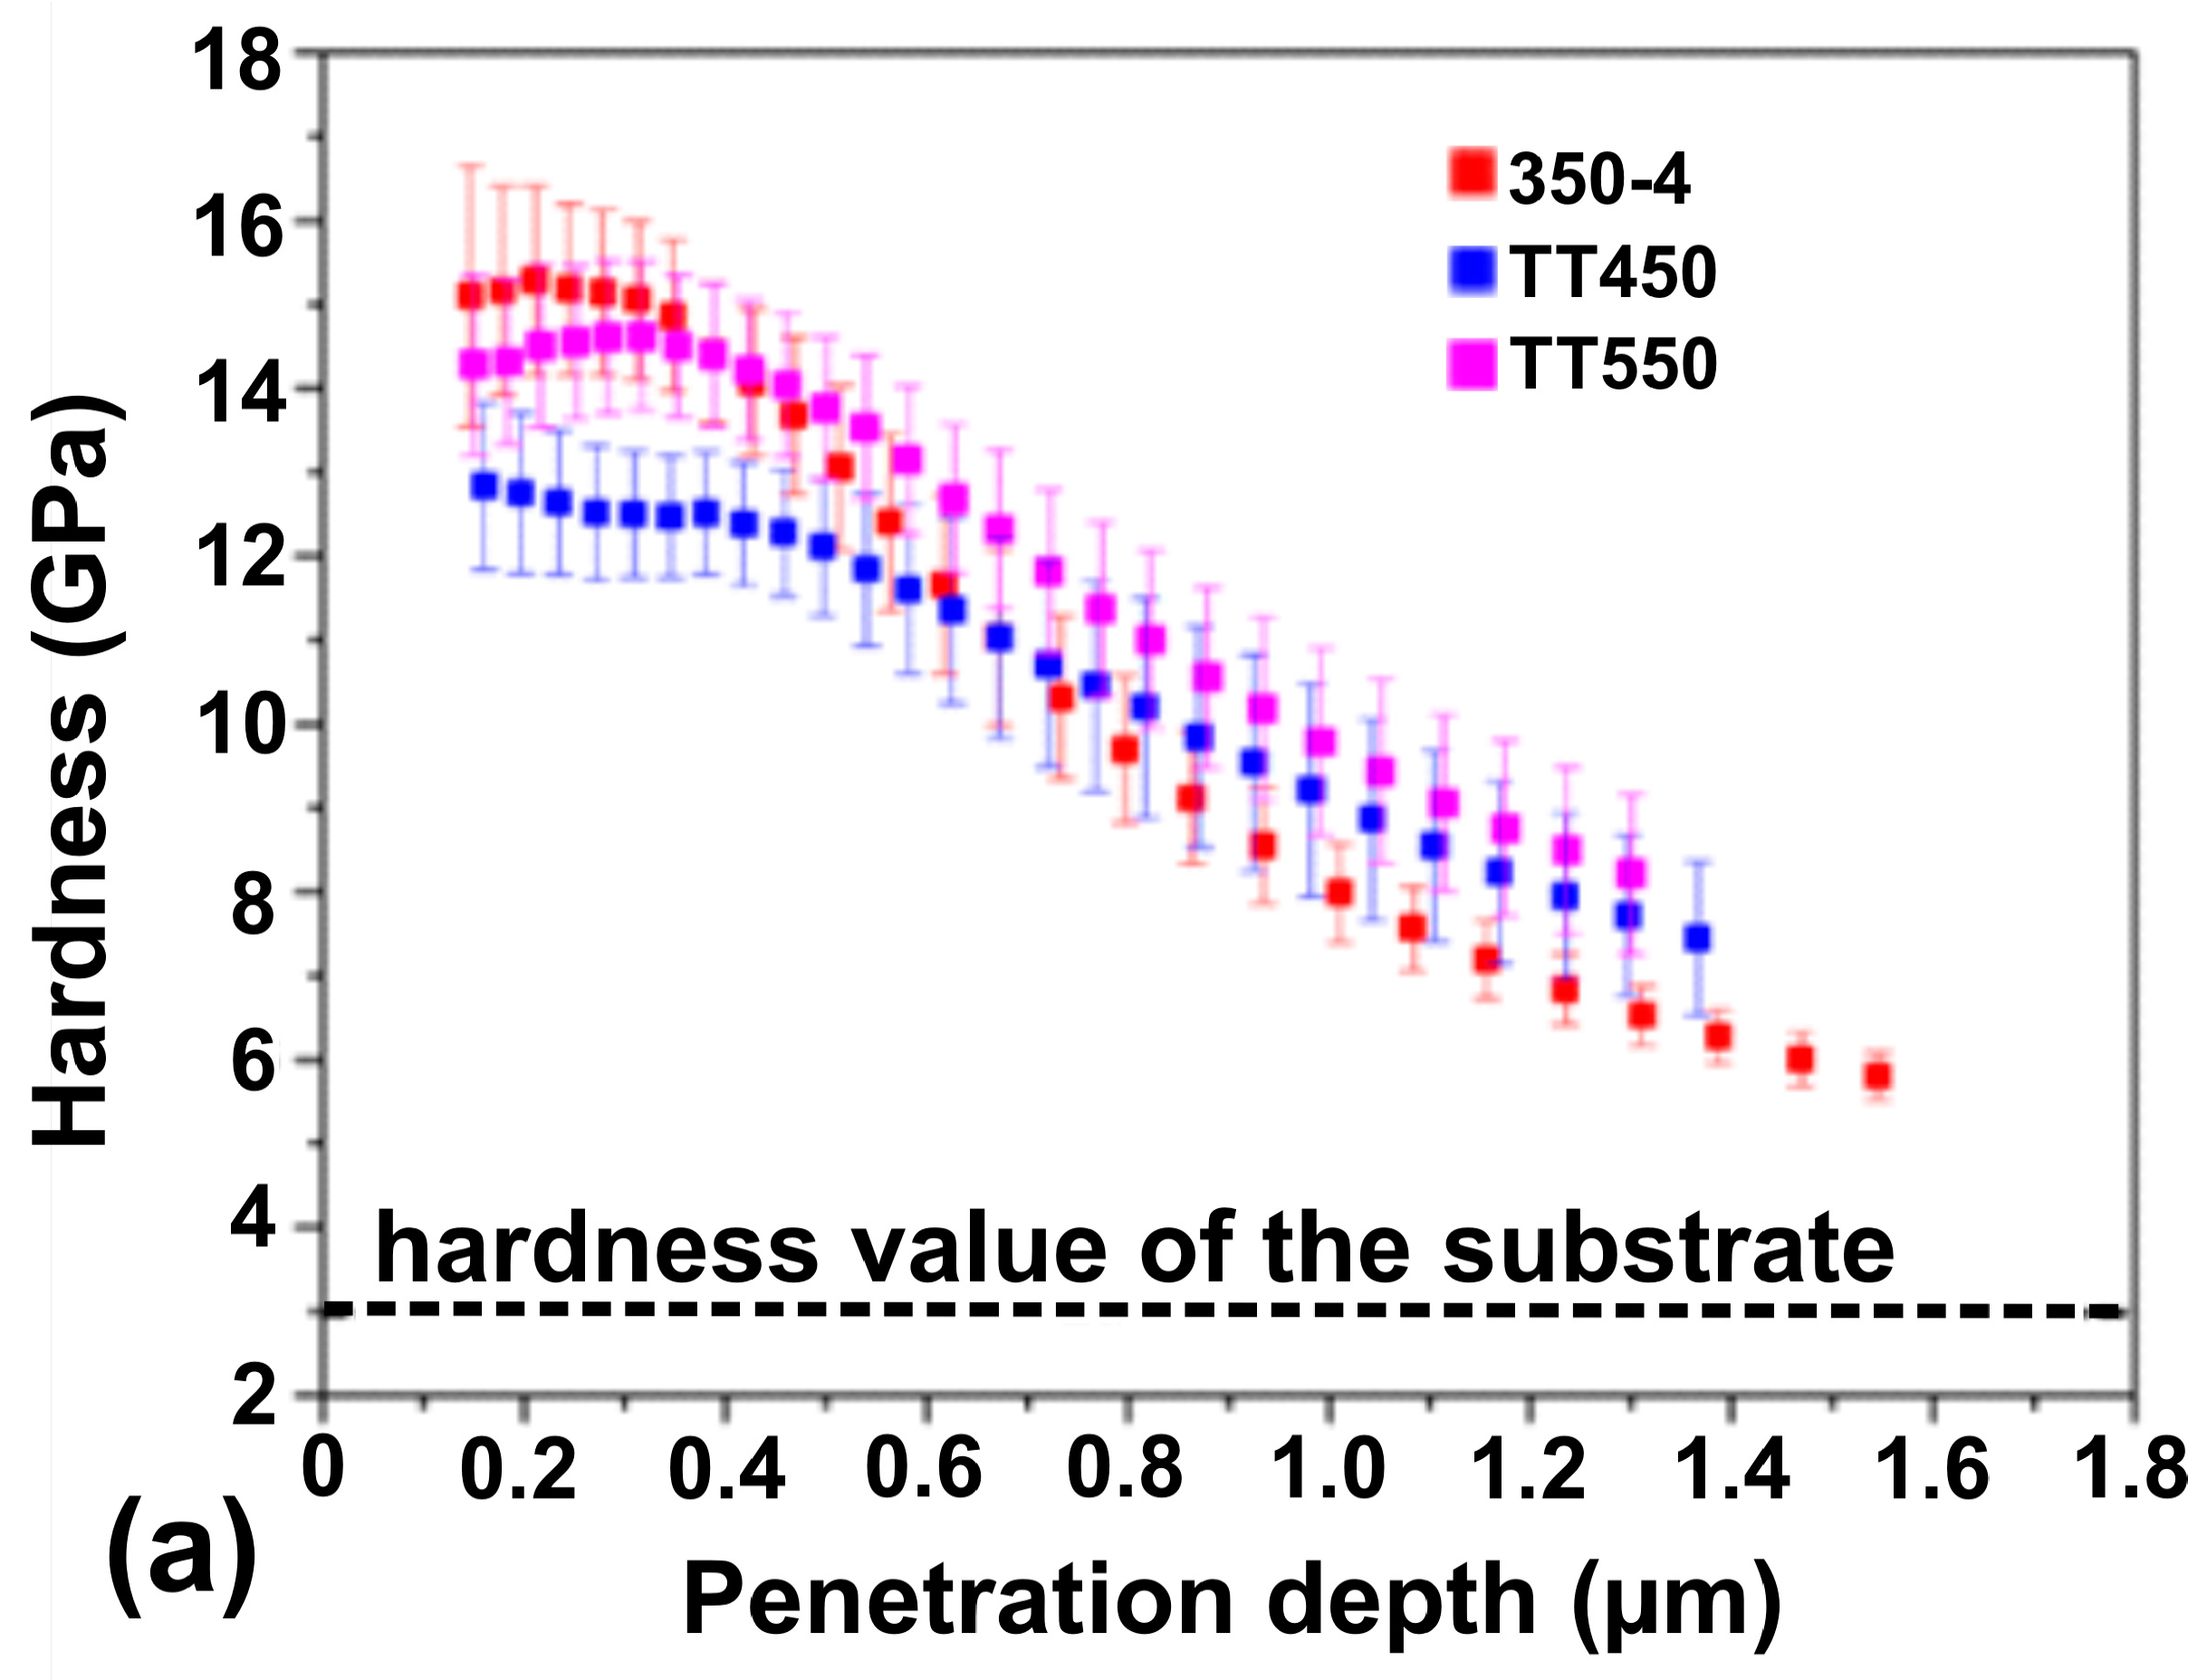
  • The nitriding process increases the surface hardness of the material by up to four times the value of the untreated sample.
  • Heat treatments decrease the hardness near the surface due to nitrogen diffusion while simultaneously increasing it in the deeper regions at a gradual rate with increasing thickness of the modified layer.

Author Contributions

Conceptualization, G.B.d.S., F.C.S., C.M.L., R.P.C. and S.F.B.; methodology, B.C.E.S.K., J.F.H.L.M., G.B.d.S., F.C.S., C.M.L., R.P.C. and S.F.B.; investigation, B.C.E.S.K., J.F.H.L.M., G.B.d.S., C.M.L., R.P.C. and S.F.B.; formal analysis, B.C.E.S.K., J.F.H.L.M., G.B.d.S. and F.C.S.; resources: C.M.L.; data curation, B.C.E.S.K. and J.F.H.L.M.; writing—original draft preparation, B.C.E.S.K. and J.F.H.L.M.; writing—review and editing, B.C.E.S.K., J.F.H.L.M., G.B.d.S. and F.C.S. All authors have read and agreed to the published version of the manuscript.

Funding

This work was part of the NESAP project (PRONEX CNPq/Fundação Araucária 15/2017). Bruna Kurelo was supported by a postdoctoral research scholarship, PDPG-POSDOC, granted by the Coordination for the Improvement of Higher Education Personnel (CAPES). G. B. de Souza thanks CNPq for the research productivity grant (306779/2021-8).

Data Availability Statement

The original contributions presented in this study are included in the article. Further inquiries can be directed to the corresponding author.

Acknowledgments

The authors wish to thank Dair G. Ditzel for the plasma nitriding of the samples and Willian Rafael de Oliveira for his valuable assistance with the formal analysis of the data. The authors thank the C-LABMU/UEPG, and CMCM/UTFPR for the use of characterization facilities and LNLS for the synchrotron XRD analyses (proposal 20190153). The authors also thank the Coordination for the Improvement of Higher Education Personnel—CAPES.

Conflicts of Interest

The authors declare no conflicts of interest.

References

  1. Manova, D.; Mändl, S.; Neumann, H.; Rauschenbach, B. Formation of Metastable Diffusion Layers in Cr-Containing Iron, Cobalt and Nickel Alloys after Nitrogen Insertion. Surf. Coat. Technol. 2017, 312, 81–90. [Google Scholar] [CrossRef]
  2. Borgioli, F. The “Expanded” Phases in the Low-Temperature Treated Stainless Steels: A Review. Metals 2022, 12, 331. [Google Scholar] [CrossRef]
  3. Borgioli, F.; Galvanetto, E.; Bacci, T.; Pradelli, G. Influence of the Treatment Atmosphere on the Characteristics of Glow-Discharge Treated Sintered Stainless Steels. Surf. Coat. Technol. 2002, 149, 192–197. [Google Scholar] [CrossRef]
  4. Dong, H. S-Phase Surface Engineering of Fe-Cr, Co-Cr and Ni-Cr Alloys. Int. Mater. Rev. 2010, 55, 65–98. [Google Scholar] [CrossRef]
  5. Anders, A. Handbook of Plasma Immersion Ion Implantation and Deposition; John Wiley & Sons: New York, NY, USA, 2000. [Google Scholar]
  6. Blawert, C.; Mordike, B.L. Industrial Applications of Plasma Immersion Ion Implantation. Surf. Coat. Technol. 1997, 93, 274–279. [Google Scholar] [CrossRef]
  7. Schibicheski Kurelo, B.C.E.; de Souza, G.B.; Serbena, F.C.; Lepienski, C.M.; Chuproski, R.F.; Borges, P.C. Improved Saline Corrosion and Hydrogen Embrittlement Resistances of Superaustenitic Stainless Steel by PIII Nitriding. J. Mater. Res. Technol. 2022, 18, 1717–1731. [Google Scholar] [CrossRef]
  8. Pinedo, C.E.; Varela, L.B.; Tschiptschin, A.P. Low-Temperature Plasma Nitriding of AISI F51 Duplex Stainless Steel. Surf. Coat. Technol. 2013, 232, 839–843. [Google Scholar] [CrossRef]
  9. Bobadilla, M.; Tschiptschin, A.; Bobadilla, M.; Tschiptschin, A. On the Nitrogen Diffusion in a Duplex Stainless Steel. Mater. Res. 2015, 18, 390–394. [Google Scholar] [CrossRef]
  10. Tschiptschin, A.P.; Varela, L.B.; Pinedo, C.E.; Li, X.Y.; Dong, H. Development and Microstructure Characterization of Single and Duplex Nitriding of UNS S31803 Duplex Stainless Steel. Surf. Coat. Technol. 2017, 327, 83–92. [Google Scholar] [CrossRef]
  11. Dib, J.; Gómez, B.; Strubbia, R.; Ares, A.; Méndez, C.; Fuster, V.; Hereñú, S. Characterization of Plasma Nitrided Duplex Stainless Steel: Influence of Prior Shot Peening and Nitriding Atmosphere. J. Mater. Eng. Perform. 2023, 32, 406–414. [Google Scholar] [CrossRef]
  12. Palma Calabokis, O.; Núñez de la Rosa, Y.; Lepienski, C.M.; Perito Cardoso, R.; Borges, P.C. Crevice and Pitting Corrosion of Low Temperature Plasma Nitrided UNS S32750 Super Duplex Stainless Steel. Surf. Coat. Technol. 2021, 413, 17–20. [Google Scholar] [CrossRef]
  13. Possoli, F.A.A.; Souza, A.P.N.; Bernardelli, E.A.; Borges, P.C. Tribocorrosion Assessment of Low-Temperature Plasma Nitrided Super Duplex Stainless Steel. Surf. Coat. Technol. 2024, 479, 130572. [Google Scholar] [CrossRef]
  14. Lima, J.F.V.; Scheuer, C.J.; Brunatto, S.F.; Cardoso, R.P. Kinetics of the UNS S32750 Super Duplex Stainless Steel Low-Temperature Plasma Nitriding. Mater. Res. 2022, 25, 17–28. [Google Scholar] [CrossRef]
  15. Blawert, C.; Mordike, B.L.; Jirásková, Y.; Schneeweiss, O. Structure and Composition of Expanded Austenite Produced by Nitrogen Plasma Immersion Ion Implantation of Stainless Steels X6CrNiTi1810 and X2CrNiMoN2253. Surf. Coat. Technol. 1999, 116–119, 189–198. [Google Scholar] [CrossRef]
  16. de Oliveira, W.R.; Kurelo, B.C.E.S.; Ditzel, D.G.; Serbena, F.C.; Foerster, C.E.; de Souza, G.B. On the S-Phase Formation and the Balanced Plasma Nitriding of Austenitic-Ferritic Super Duplex Stainless Steel. Appl. Surf. Sci. 2018, 434, 1161–1174. [Google Scholar] [CrossRef]
  17. Li, X.; Dou, W.; Tian, L.; Dong, H. Combating the Tribo-Corrosion of LDX2404 Lean Duplex Stainless Steel by Low Temperature Plasma Nitriding. Lubricants 2018, 6, 93. [Google Scholar] [CrossRef]
  18. Pinheiro, R.S.; Santos, A.R.; Marques, M.; Schnitzler, E.; Signorini, D.; Tomita, R.A. Well Construction Challenges in the Pre-Salt Development Projects. In Proceedings of the Offshore Technology Conference; Offshore Technology Conference, Houston, TX, USA, 4 May 2015; Volume 4–7, pp. 1–13. [Google Scholar]
  19. Oliveira, J.J.M.; Filho, J.R.B.Z. O Pré-Sal Brasileiro e o Problema Da Corrosão Por CO2. Rev. Pós-Graduação Fac. Cent. Leste 2016, 1, 1–10. [Google Scholar] [CrossRef]
  20. Maistro, G.; Pérez-García, A.; Norell, M.; Nyborg, L.; Cao, Y. Thermal Decomposition of N-Expanded Austenite in 304L and 904L Steels. Surf. Eng. 2017, 33, 319–326. [Google Scholar] [CrossRef]
  21. Jirásková, Y.; Blawert, C.; Schneeweiss, O. Thermal Stability of Stainless Steel Surfaces Nitrided by Plasma Immersion Ion Implantation. Phys. Stat. Sol. 1999, 175, 537–548. [Google Scholar] [CrossRef]
  22. Christiansen, T.; Somers, M.A.J. Decomposition Kinetics of Expanded Austenite with High Nitrogen Contents. Int. J. Mater. Res. 2006, 97, 79–88. [Google Scholar] [CrossRef]
  23. Brink, B.; Ståhl, K.; Christiansen, T.L.; Somers, M.A.J. Thermal Expansion and Phase Transformations of Nitrogen-Expanded Austenite Studied with in Situ Synchrotron X-Ray Diffraction. J. Appl. Crystallogr. 2014, 47, 819–826. [Google Scholar] [CrossRef]
  24. Tschiptschin, A.P.; Nishikawa, A.S.; Varela, L.B.; Pinedo, C.E. Thermal Stability of Expanded Austenite Formed on a DC Plasma Nitrided 316L Austenitic Stainless Steel. Thin Solid Films 2017, 644, 156–165. [Google Scholar] [CrossRef]
  25. Schreiber, G.; Rensch, U.; Oettel, H.; Blawert, C.; Mordike, B.L. Thermal Stability of PI 3 Nitrided Surface Layers on Ferritic Steels. Surf. Coat. Technol. 2003, 170, 447–451. [Google Scholar] [CrossRef]
  26. Schibicheski Kurelo, B.C.E.; Lepienski, C.M.; de Oliveira, W.R.; de Souza, G.B.; Serbena, F.C.; Cardoso, R.P.; Neves, J.C.K.; Borges, P.C. Identification of Expanded Austenite in Nitrogen-Implanted Ferritic Steel through In Situ Synchrotron X-Ray Diffraction Analyses. Metals 2023, 13, 1744. [Google Scholar] [CrossRef]
  27. Somers, M.A.J.; van der Pers, N.M.; Schalkoord, D.; Mittemeijer, E.J. Dependence of the Lattice Parameter of γ′ Iron Nitride, Fe4N, on Nitrogen Content; Accuracy of the Nitrogen Absorption Data. Metall. Trans. A 1989, 20, 1533–1539. [Google Scholar] [CrossRef]
  28. Mayrhofer, P.H.; Tischler, G.; Mitterer, C. Microstructure and Mechanical/Thermal Properties of Cr-N Coatings Deposited by Reactive Unbalanced Magnetron Sputtering. Surf. Coat. Technol. 2001, 142–144, 78–84. [Google Scholar] [CrossRef]
  29. Chen, H.Y.; Tsai, C.J.; Lu, F.H. The Young’s Modulus of Chromium Nitride Films. Surf. Coat. Technol. 2004, 184, 69–73. [Google Scholar] [CrossRef]
  30. Bian, L.; Chen, Z.; Wang, L.; Li, F.; Chou, K. Oxidation Resistance, Thermal Expansion and Area Specific Resistance of Fe-Cr Alloy Interconnector for Solid Oxide Fuel Cell. J. Iron Steel Res. Int. 2017, 24, 77–83. [Google Scholar] [CrossRef]
  31. Wojdyr, M. Fityk: A General-Purpose Peak Fitting Program. J. Appl. Crystallogr. 2010, 43, 1126–1128. [Google Scholar] [CrossRef]
  32. de Oliveira, W.R.; Chuproski, R.F.; Valadão, G.M.; Cintho, O.M.; de Souza, E.C.F.; Serbena, F.C.; de Souza, G.B. Symmetry between the Anisotropic N Behavior in the Lattice under High Pressures and the Formation of Expanded Austenite. J. Alloys Compd. 2021, 871, 159509. [Google Scholar] [CrossRef]
  33. Manova, D.; Lotnyk, A.; Mändl, S.; Neumann, H.; Rauschenbach, B. CrN Precipitation and Elemental Segregation during the Decay of Expanded Austenite. Mater. Res. Express 2016, 3, 066502. [Google Scholar] [CrossRef]
  34. Borgioli, F. From Austenitic Stainless Steel to Expanded Austenite-S Phase: Formation, Characteristics and Properties of an Elusive Metastable Phase. Metals 2020, 10, 187. [Google Scholar] [CrossRef]
  35. Espitia, L.A.; Dong, H.; Li, X.Y.; Pinedo, C.E.; Tschiptschin, A.P. Scratch Test of Active Screen Low Temperature Plasma Nitrided AISI 410 Martensitic Stainless Steel. Wear 2017, 376–377, 30–36. [Google Scholar] [CrossRef]
  36. Stróz, D.; Psoda, M. TEM Studies of Plasma Nitrided Austenitic Stainless Steel. J. Microsc. 2010, 237, 227–231. [Google Scholar] [CrossRef]
  37. Che, H.L.; Lei, M.K. Microstructure of Perfect Nitrogen-Expanded Austenite Formed by Unconstrained Nitriding. Scr. Mater. 2021, 194, 113705. [Google Scholar] [CrossRef]
  38. Ashcroft, N.W.; Mermin, N.D. Solid State Physics; Harcourt College Publishing: San Diego, CA, USA, 1976. [Google Scholar]
  39. Momma, K.; Izumi, F. VESTA 3 for Three-Dimensional Visualization of Crystal, Volumetric and Morphology Data. J. Appl. Crystallogr. 2011, 44, 1272–1276. [Google Scholar] [CrossRef]
  40. Moskalioviene, T.; Galdikas, A. Kinetic Model of Anisotropic Stress Assisted Diffusion of Nitrogen in Nitrided Austenitic Stainless Steel. Surf. Coat. Technol. 2019, 366, 277–285. [Google Scholar] [CrossRef]
  41. Martinavičius, A.; Abrasonis, G.; Möller, W. Influence of Crystal Orientation and Ion Bombardment on the Nitrogen Diffusivity in Single-Crystalline Austenitic Stainless Steel. J. Appl. Phys. 2011, 110, 074907. [Google Scholar] [CrossRef]
  42. Saha, R.; Nix, W.D. Effects of the Substrate on the Determination of Thin Film Mechanical Properties by Nanoindentation. Acta Mater. 2002, 50, 23–38. [Google Scholar] [CrossRef]
Figure 1. Experimental setup for thermal treatments using in situ synchrotron X-ray diffraction.
Metals 14 01396 g001
Figure 2. Scanning electron microscopy images of cross-sectioned samples to visualize the layers formed by nitriding: (a) 350-4; (b) TT450; and (c) TT550.
Metals 14 01396 g002
Figure 3. Nitrogen concentration, in at.%, for (a) the 350-4 condition measured in the ferrite and austenite grains, and (b) a comparison between nitrogen concentrations of the nitrided sample (350-4) and the thermally treated sample at 550 °C (TT550). (c,d) The EDS spectra for selected points in (a). N1s peaks are clearly seen at top surfaces while, in measurements taken deeper, they are indistinguishable from the background.
Metals 14 01396 g003
Figure 4. (a) Diffractograms of duplex steel UNS S32750 in the untreated condition and of two samples nitrided at 350 °C for 4 h (350-4). These nitrided samples were subsequently and separately submitted to heat treatments at 450 °C (TT450) and 550 °C (TT550). In the inset (b), the normalized diffractograms are presented for better visualization of the contribution of the αN phase peaks in the diffractograms.
Metals 14 01396 g004
Figure 5. X-ray diffractograms of the TT450 condition at various temperatures during the heating stage, up to 450 °C. The inset shows the enlarged region with the main peaks of austenite and ferrite.
Metals 14 01396 g005
Figure 6. (a) X-ray diffractograms of the TT450 condition at various times during the isothermal heating at 450 °C. The inset (b) shows the enlarged region of the main peaks of austenite and ferrite. In (c), a comparison is shown between the first (start) and the last (108 min) diffractograms at 450 °C.
Metals 14 01396 g006
Figure 7. X-ray diffractograms of the TT450 condition at room temperature, taken before and after heat treatment, with incidence angles (a) θ = 10° and (b) θ = 2°.
Metals 14 01396 g007aMetals 14 01396 g007b
Figure 8. Variation of the average lattice parameters of the austenite, ferrite, expanded austenite, and expanded ferrite phases during (a) the heating stage and (b) the isothermal treatment, as a function of temperature and time, respectively, for the TT450 condition.
Metals 14 01396 g008aMetals 14 01396 g008b
Figure 9. (a) Variation of the lattice parameter of the expanded austenite phase during the isothermal treatment, calculated from the interplanar distances of different crystallographic orientations, for the TT450 condition. In (b), the crystal structure of austenite simulated by the Vesta 3 software [39] is shown, highlighting the diffraction planes (111), (200), and (220).
Metals 14 01396 g009
Figure 10. X-ray diffractograms during the heating stage at various temperatures for the condition heat-treated up to 550 °C (TT550). The inset shows the region of the main peaks of austenite (γ), ferrite (α), expanded austenite (γN), expanded ferrite (αN), and CrN.
Metals 14 01396 g010
Figure 11. (a) X-ray diffractograms of the TT550 condition at various times during the isothermal treatment at 550 °C. The inset (b) shows the enlarged region of the main peaks of austenite and ferrite and (c) shows a comparison between the first and the last diffractogram obtained at 550 °C.
Metals 14 01396 g011
Figure 12. X-ray diffractograms of the TT550 condition at room temperature, taken before and after heat treatment, with incidence angles (a) θ = 10° and (b) θ = 2°.
Metals 14 01396 g012
Figure 13. Variation of the lattice parameter of the austenite, ferrite, expanded austenite, and expanded ferrite phases during (a) the heating stage and (b) the isothermal treatment, as a function of temperature and time, respectively, for the TT550 condition.
Metals 14 01396 g013
Figure 14. (a) Hardness and (b) elastic modulus profiles of the nitrided duplex steel compared with the heat-treated conditions TT450 and TT550. The dashed line in (a) indicates the substrate hardness value.
Metals 14 01396 g014aMetals 14 01396 g014b
Table 1. Composition, in weight percent, of the super duplex stainless steel, as measured by WDS.
ElementFeCrNiMoMnSiCuPC
wt.%61.8425.606.453.880.760.280.160.031.00
Table 2. Sample nomenclature and corresponding treatment conditions.
SampleNitriding Temp. (°C)Nitriding Time (h)Maximum Temperature During In Situ XRD (°C)Time at the Maximum Temperature During In Situ XRD (min)Layer Thickness
350-43504--3.7 ± 0.3 (α)
2.9 ± 0.4 (γ)
TT45035044501245.1 ± 0.2
TT5503504550945.9 ± 0.7
Table 3. Ratios of average lattice expansion between the γN phase and γ, and between the αN phase and α, expressed as percentages.
AmostraAverage Expansion (%)
γN in Relation to γαN in Relation to α
350-47.350.55
TT4505.370.84
TT5501.400.64
Disclaimer/Publisher’s Note: The statements, opinions and data contained in all publications are solely those of the individual author(s) and contributor(s) and not of MDPI and/or the editor(s). MDPI and/or the editor(s) disclaim responsibility for any injury to people or property resulting from any ideas, methods, instructions or products referred to in the content.

