Article

Effect of Annealing Temperature on Microstructure and Mechanical Properties of 00Cr21CuTi Stainless Steel Cold-Rolled Sheets

1
State Key Laboratory of Advanced Processing and Recycling of Nonferrous Metals, Lanzhou University of Technology, Lanzhou 730050, China
2
School of Materials Science and Engineering, Lanzhou University of Technology, Lanzhou 730050, China
3
Jiuquan Iron and Steel Group, Jiayuguan 735000, China
*
Authors to whom correspondence should be addressed.
Metals 2024, 14(12), 1367; https://doi.org/10.3390/met14121367
Submission received: 14 October 2024 / Revised: 22 November 2024 / Accepted: 25 November 2024 / Published: 29 November 2024

Abstract

:
To investigate the evolution of microstructure and mechanical properties in cold-rolled sheets of Ferritic Stainless Steel (FSS) during annealing, a series of annealing tests were performed on 00Cr21CuTi at different temperatures of 930, 990, and 1050 °C. The changes in microstructure at these annealing temperatures were characterized by optical microscopy (OM), scanning electron microscopy (SEM), transmission electron microscopy (TEM), and electron back-scattered diffraction (EBSD). The influence of annealing temperature on mechanical properties was assessed utilizing a universal tensile testing machine and a laser confocal microscope. The results indicated a gradual decrease in yield strength and tensile strength with increasing annealing temperature, whereas elongation exhibited an upward trend. At an annealing temperature of 930 °C, the yield strength, tensile strength, and elongation of the steel were 251 MPa, 409 MPa, and 30.9%, respectively, with a high product of strength plastic 12.64 GPa·%. This result represented an optimal balance between comprehensive strength and plasticity.

1. Introduction

Ferritic Stainless Steel (FSS) boasted high thermal conductivity, exceptional corrosion resistance and formability, a low thermal expansion coefficient, and superior oxidation resistance. It was extensively utilized in household appliances, automotive, construction, and seawater desalination sectors [1,2]. 00Cr21CuTi steel was a kind of high chromium and high purity, corrosion-resistant stainless steel with reduced nickel content and was widely applied in architectural ornamentation and household appliances. Owing to its outstanding corrosion resistance, formability, weldability, and high-temperature performance, it served as an ideal substitute for 304 austenitic stainless steel [3,4,5] (σb ≥ 520 MPa, σs ≥ 205 MPa and δ ≥ 40%). Advances in ultra-low carbon nitrogen smelting and continuous casting technologies have enhanced the purity of FSS [6,7]. By employing ultra-purification techniques and micro-alloying with elements like Nb, Ti, and V, the content of C and N in FSS had been significantly reduced, thereby addressing some of its shortcomings [8,9]. There was no phase change during heating and cooling in FSS, so it couldn’t be strengthened by heat treatment methods. Annealing could improve its mechanical properties [10]. The annealing process following hot rolling considerably influenced the microstructure, texture, and mechanical properties of cold-rolled plates. However, there were no comprehensive reports on the influence of post-cold rolling annealing temperatures on the microstructure and mechanical properties of ultra-pure FSS [11,12]. In recent years, many scholars have conducted research on the heat treatment process of FSS. Tanure et al. studied the microstructure and mechanical properties of Nb-containing 430 and Nb-Ti stabilized 439 FSS during the recrystallization process [13]. During the recrystallization annealing process of 430Nb and ASTM 439 stainless steels, the changes in microstructure and properties are mainly reflected in the distribution of precipitates, the uniformity of texture, and the final mechanical properties. It was found that the recrystallization rate of 430Nb steel was faster. Due to the considerable amounts of C and N in the chemical composition of 430Nb steel, it promoted the formation of fine and densely distributed precipitates and enhanced the recrystallization rate. C. Chen et al. carried out heat treatment on a 430 FSS hot-rolled plate at 800~1150 °C and investigated the effect of heat treatment temperature on its microstructure and mechanical properties [14]. The microstructure of the annealed plate was uniformly sized equiaxed ferrite grains, which were fully recrystallized and had a strong texture of {111}//ND at 950 °C. Z.Y. Liu performed hot rolling, annealing, cold rolling, and other processes for Cr17 FSS and studied the evolution laws of its organization and texture [15,16]. Rapid dynamic recovery during hot rolling made it difficult for recrystallization to occur. Thus, the hot rolling texture was the mainly rotational cubic texture [17]. An α texture would be formed after hot rolling. Heat treatment would weaken the generated α texture, which could improve the uniformity of grain orientation and promote the transition from α texture to γ texture [18]. However, an excessively high annealing temperature could reduce the γ texture intensity and deteriorate the formability.

2. Materials and Methods

2.1. Experimental Materials

Hot rolled 00Cr21CuTi steel plates were produced and annealed at 980 °C for 3 min, followed by cooling to room temperature and pickling before cold rolling [19]. The chemical compositions of the steels were analyzed using a PDA-5500S optical emission spectrometer (Shimadzu Corporation, Kyoto, Japan). The chemical composition test was carried out by taking one specimen with a size of 20 × 20 × 5 mm from the top, middle, and bottom of the cylindrical ingot after smelting, respectively. For each specimen, five positions were randomly selected for testing, and the average value was calculated. Finally, the average values of the chemical compositions of these three specimens were further averaged to obtain the final chemical composition results. The chemical composition of the steel is summarized in Table 1. The full composition phase diagram simulated by the Thermodynamics calculation software Thermo-calc 2024a (Thermo-Calc Software AB, Stockholm, Sweden) with a database of TCFE12: Steels/Fe-Alloys v12.0 was shown in Figure 1a. When the temperature began to decrease and dropped to approximately 1500 °C, the liquid phase started to transform into the ferrite phase. At 1479 °C, the liquid phase completely transformed into the solid phase. When the temperature decreased to 625 °C, the σ phase precipitated with a maximum content of approximately 15%, and the α-Fe content slightly decreased at this time. As the temperature further dropped to 492 °C, the σ phase re-dissolved into the matrix. At 498 °C, the α′ phase precipitated, and as the temperature continued to decrease, the α′ phase gradually increased while the α-Fe content gradually decreased, with a minimum content of 77%. The steels contained a relatively high concentration of Cr, which formed the α′ phase at 495 °C, with the maximum content reaching 22%. In Figure 1b, it was determined by calculations of Thermo-calc that the α′ phase was primarily a Cr-rich Fe-Cr intermetallic compound. The α′ phase was precisely the source of the brittleness observed in FSS at 475 °C [18,20].
The speed of the rolling mill was 0.4 m/min, the rolling speed was 15 r/min, and the reduction rate of each pass was 5%. The total rolling passes were 6, 8, and 14, respectively. The cut hot-rolled annealed plates were further rolled to thicknesses of 2.8, 2, and 1.2 mm at room temperature through multi-pass rolling, with rolling reduction rates of 30%, 50%, and 70%, respectively. By comparison of mechanical properties, cold-rolled sheets with a reduction rate of 70% were selected as the research object [21].
The grain size of steel was refined, vacancies and dislocations increased, and the grain boundary density increased after cold rolling. As the cold rolling reduction rate increased, the degree of work hardening also increased. To eliminate the residual stress in the cold-rolled sheets, subsequent annealing treatment was necessary [22]. The cold-rolled plates were cut by DK7763 Wire-cut Electrical Discharge Machining (Taizhou Lingmu Machinery Manufacturing Co., Ltd., Taizhou, China). The heating rate was 10 °C/min to 930, 990, and 1050 °C for 5 min, and then cooled to room temperature with the furnace.

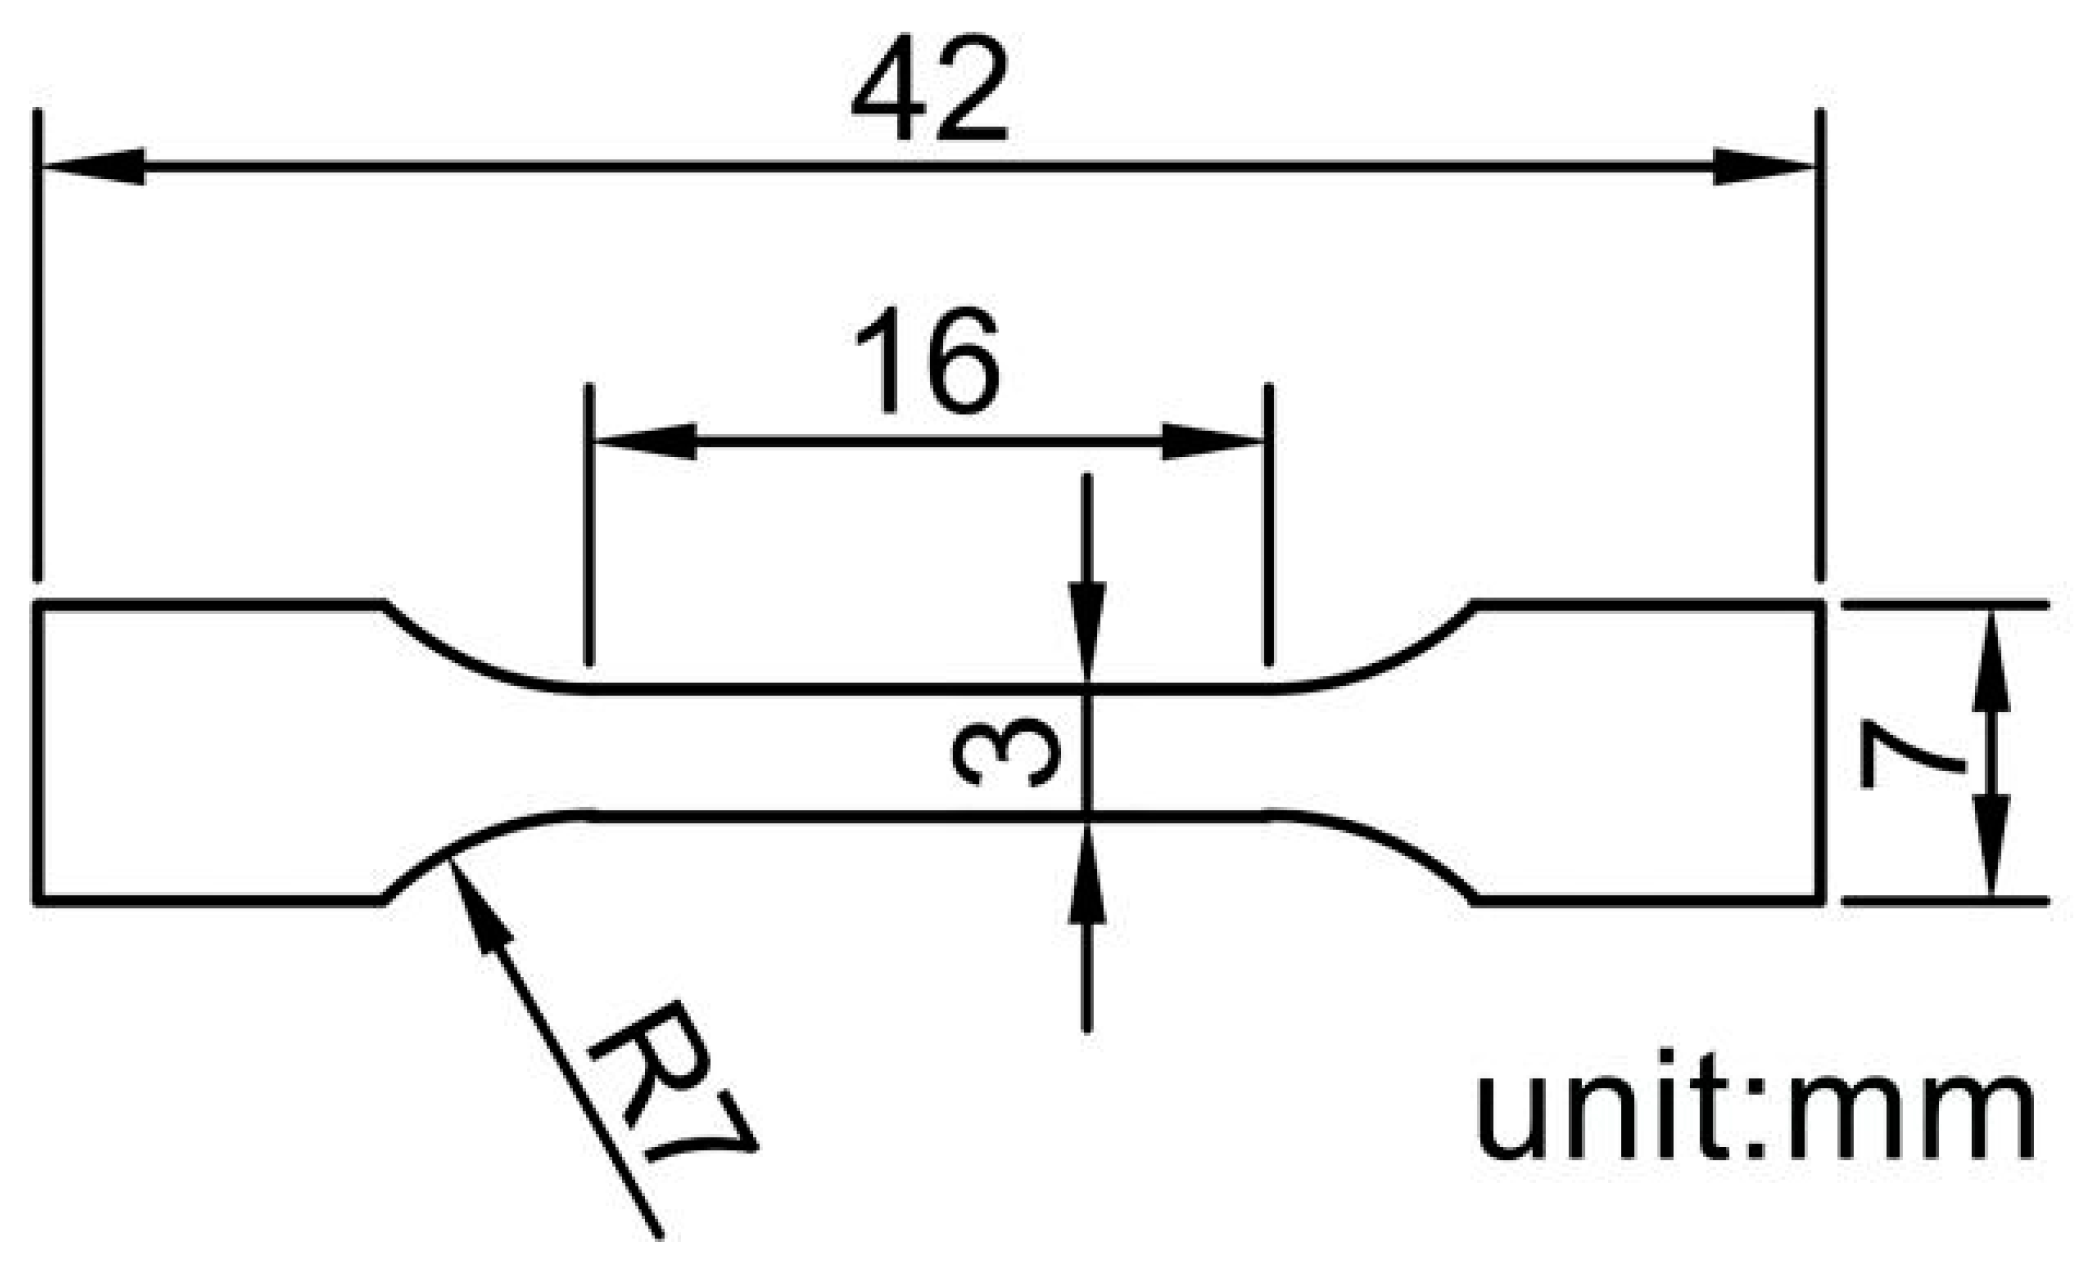
2.2. Testing Methods

The specimen was mechanically polished to a scratch-free finish after annealing. Phase analysis was conducted using a D8 Advance XRD (Bruker Corporation, Karlsruhe, German), and the scanning range (2θ) was 20° to 120°, and a scanning speed of 10 (°)/min. The corrosive solution used is a mixture of nitric acid, hydrochloric acid, glycerol, and hydrogen peroxide in a volume ratio of 1:2:2:1, with a corrosion time of 90 s. The microstructure and morphology were observed by Axio Scope A1 OM (Carl Zeiss AG, Jena, Germany) and Axia Chemi SEM (Thermo Fisher Scientific, Vacaville, CA, USA). According to the Chinese National Standard “Method for Determination of Average Grain Size of Metals” (GB/T 6394-2002) [23,24], the intercept method was used to calculate the average grain size. The tensile test was conducted using the WDW-100D microcontroller electronic universal testing machine (Dongchen Test Instrument Co., Ltd., Jinan, China), and the elongation was measured using a contact extensometer. The stretching rate was 0.5 mm/min, and the stretching direction was consistent with the rolling direction (RD). The shape and size of the tensile specimens are shown in Figure 2 [24]. The surface roughness of the steel was measured via an LSM800 Scanning Laser Confocal Microscope (Carl Zeiss AG, Oberkochen, Germany). Three acquisition areas with a size of 350 × 350 μm were selected. In each area, line segments at angles of 0°, 45°, and 90° to the rolling direction were chosen to measure the Ra and Rt values. Three line segments with a length of 200 μm were selected for testing in each of the three directions. Finally, the test results were statistically analyzed and averaged to obtain the final Ra and Rt values.
The texture, grain orientation, grain size, grain boundary state, and grain type of specimens were analyzed using EBSD technology with ZEISS Gemini SEM 300 (Carl Zeiss AG, Oberkochen, Germany) equipped with Oxford Symmetry S2 (Oxford Instruments Technology Co., Ltd., Shanghai, China) probe. The steel sheets were processed into a size of 12 × 10 mm by wire cutting. Polish the specimen in one direction with different types of water sandpaper until there are no scratches, then mechanically polish it. Next, perform electrolytic polishing on the specimen to remove the surface stress layer. The electrolyte used was a 10% perchloric acid ethanol solution with a voltage of 30 V and an electrolytic polishing time of 10 to 15 s. The test surfaces were cleaned with alcohol and blew dry for later use. The scanning area was 1500 × 1500 μm, with a step size of 5 μm (80 times), a voltage of 20 kV, and a current of 20 nA.

3. Results and Discussion
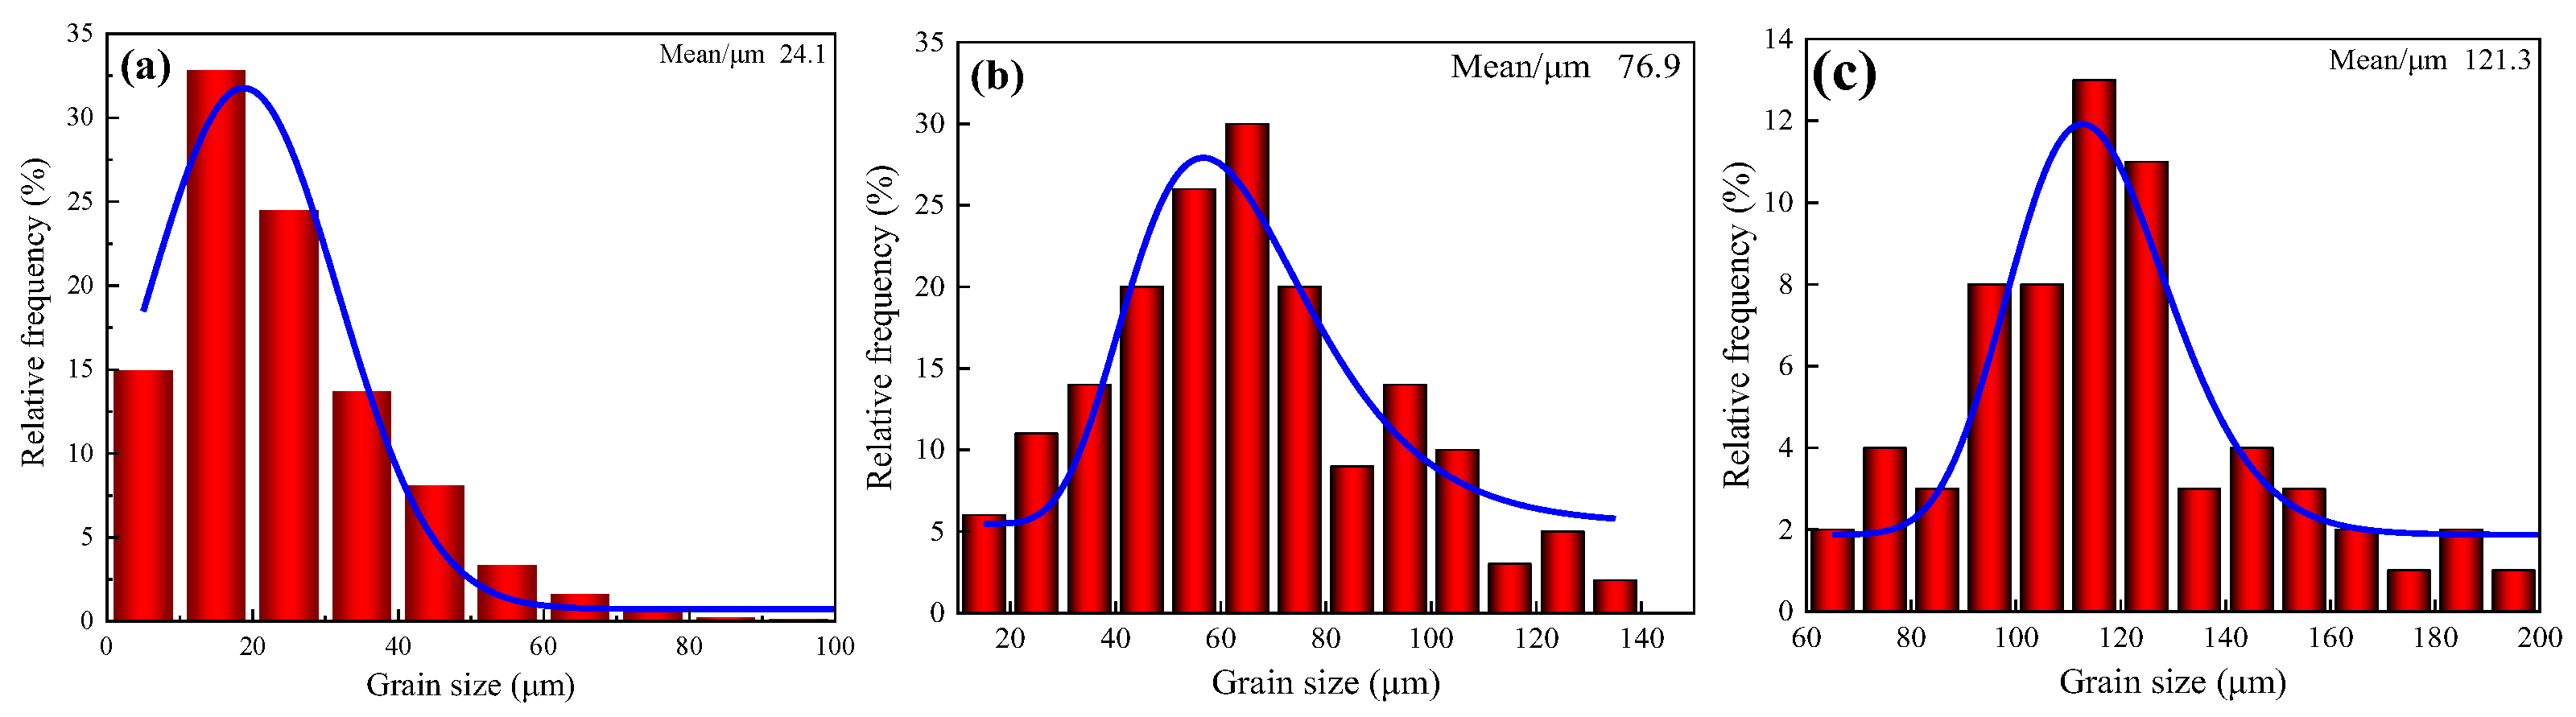
3.1. Microstructure

The metallographic structures of the three annealed tested steels are revealed in Figure 3. The matrix of steel was composed of irregular polygonal ferrite grains with a gray-white color. They were fully dense, homogenous, and with clear grain boundaries. Complete recrystallization occurred after annealing. Particles presented a polygonal shape. The grain boundaries exhibited a pronounced bowing towards the neighboring deformation bands in Figure 3a, which suggested that the growth of recrystallized grains occurred through the assimilation of these adjacent deformation zones shown. When the annealing temperature was raised to 990 °C, the already formed equiaxed grains grew rapidly, and fusion occurred between their grain boundaries. The new equiaxed grains continued to grow in Figure 3b, resulting in grains that were too coarse. During annealing, grain growth and recrystallization cause changes in grain size and orientation. The different orientations of grains resulted in different reflections and refractions of light, leading to varying shades of color. Larger crystals exhibited reduced light scattering, resulting in a brighter appearance, whereas smaller crystals demonstrated increased light scattering, leading to a darker appearance. It was indicated that finer and more uniform grains could be obtained during annealing at 930 °C.
Image Pro Plus 6.0 was employed to process and analyze the grain size in the metallograph. At least five metallographs of each specimen should be counted, and the distribution of the grain size should be plotted in Figure 4. The microstructure of the annealed steel at 930 and 990 °C consisted of uniformly sized equiaxed grains, as shown in Figure 4a,b. The average grain size was 24.1 μm with fine and uniform grains when annealed at 930 °C. When the annealing temperature rose to 990 and 1050 °C, the average grain sizes were 76.9 and 121.3 μm, respectively. As the temperature increased, the grains grew, and the grain size rating was grade 6 (63–125 μm) [25]. In Figure 4c, there were abnormally grown grains, and an uneven microstructure in the steel, and the ability to coordinate deformation during tensile deformation was relatively poor. When the annealing temperature exceeded 990 °C, the grains would undergo varying degrees of abnormal growth. Both overly fine and overly coarse grain sizes could affect the stamping performance of sheets. If the grain size was too small, it would produce an elongated ferrite grain structure, making cold deformation difficult and increasing the possibility of rebound defects after deformation. However, if the grain size was too large, stamping could easily produce orange peel defects or even lead to fracture, which was not conducive to formability [26,27].
The XRD diffraction patterns of the specimens subjected to annealing temperature are illustrated in Figure 5. After annealing at different temperatures, the primary structure of the steel remained mainly a single ferrite phase. Due to the minimal presence of carbides, they were undetectable in the XRD analysis. The diffraction peak positions of the three types of steel were the same, with only intensity differences. This indicated that the arrangement and number of atoms in the crystal were different. The higher the intensity of the diffraction peak, the greater the degree of crystallization, the larger the grain size, and the corresponding crystal plane grows orderly.
Microstructures were characterized by SEM under various annealing temperatures in Figure 6. It was observable that fine dispersed second phases were present in all three steels, and the second phases were distributed near grain boundaries and within the grains. The grain size of the experimental steel became uniform after annealing at 930 °C in Figure 6a. As the annealing temperature increased from 930 to 990 °C, the grain boundaries encountered these second-phase particles during their migration and coalescence in Figure 6b. The grain boundaries were pinned by the second phase, which impeded grain boundary motion and could restrain the growth of grains. As shown in Figure 6c, the elevated temperature provided adequate energy to overcome the pinning forces of the second-phase particles at an annealing temperature of 1050 °C. With an increase in the migration velocity of grain boundaries, the grain size became significantly larger.

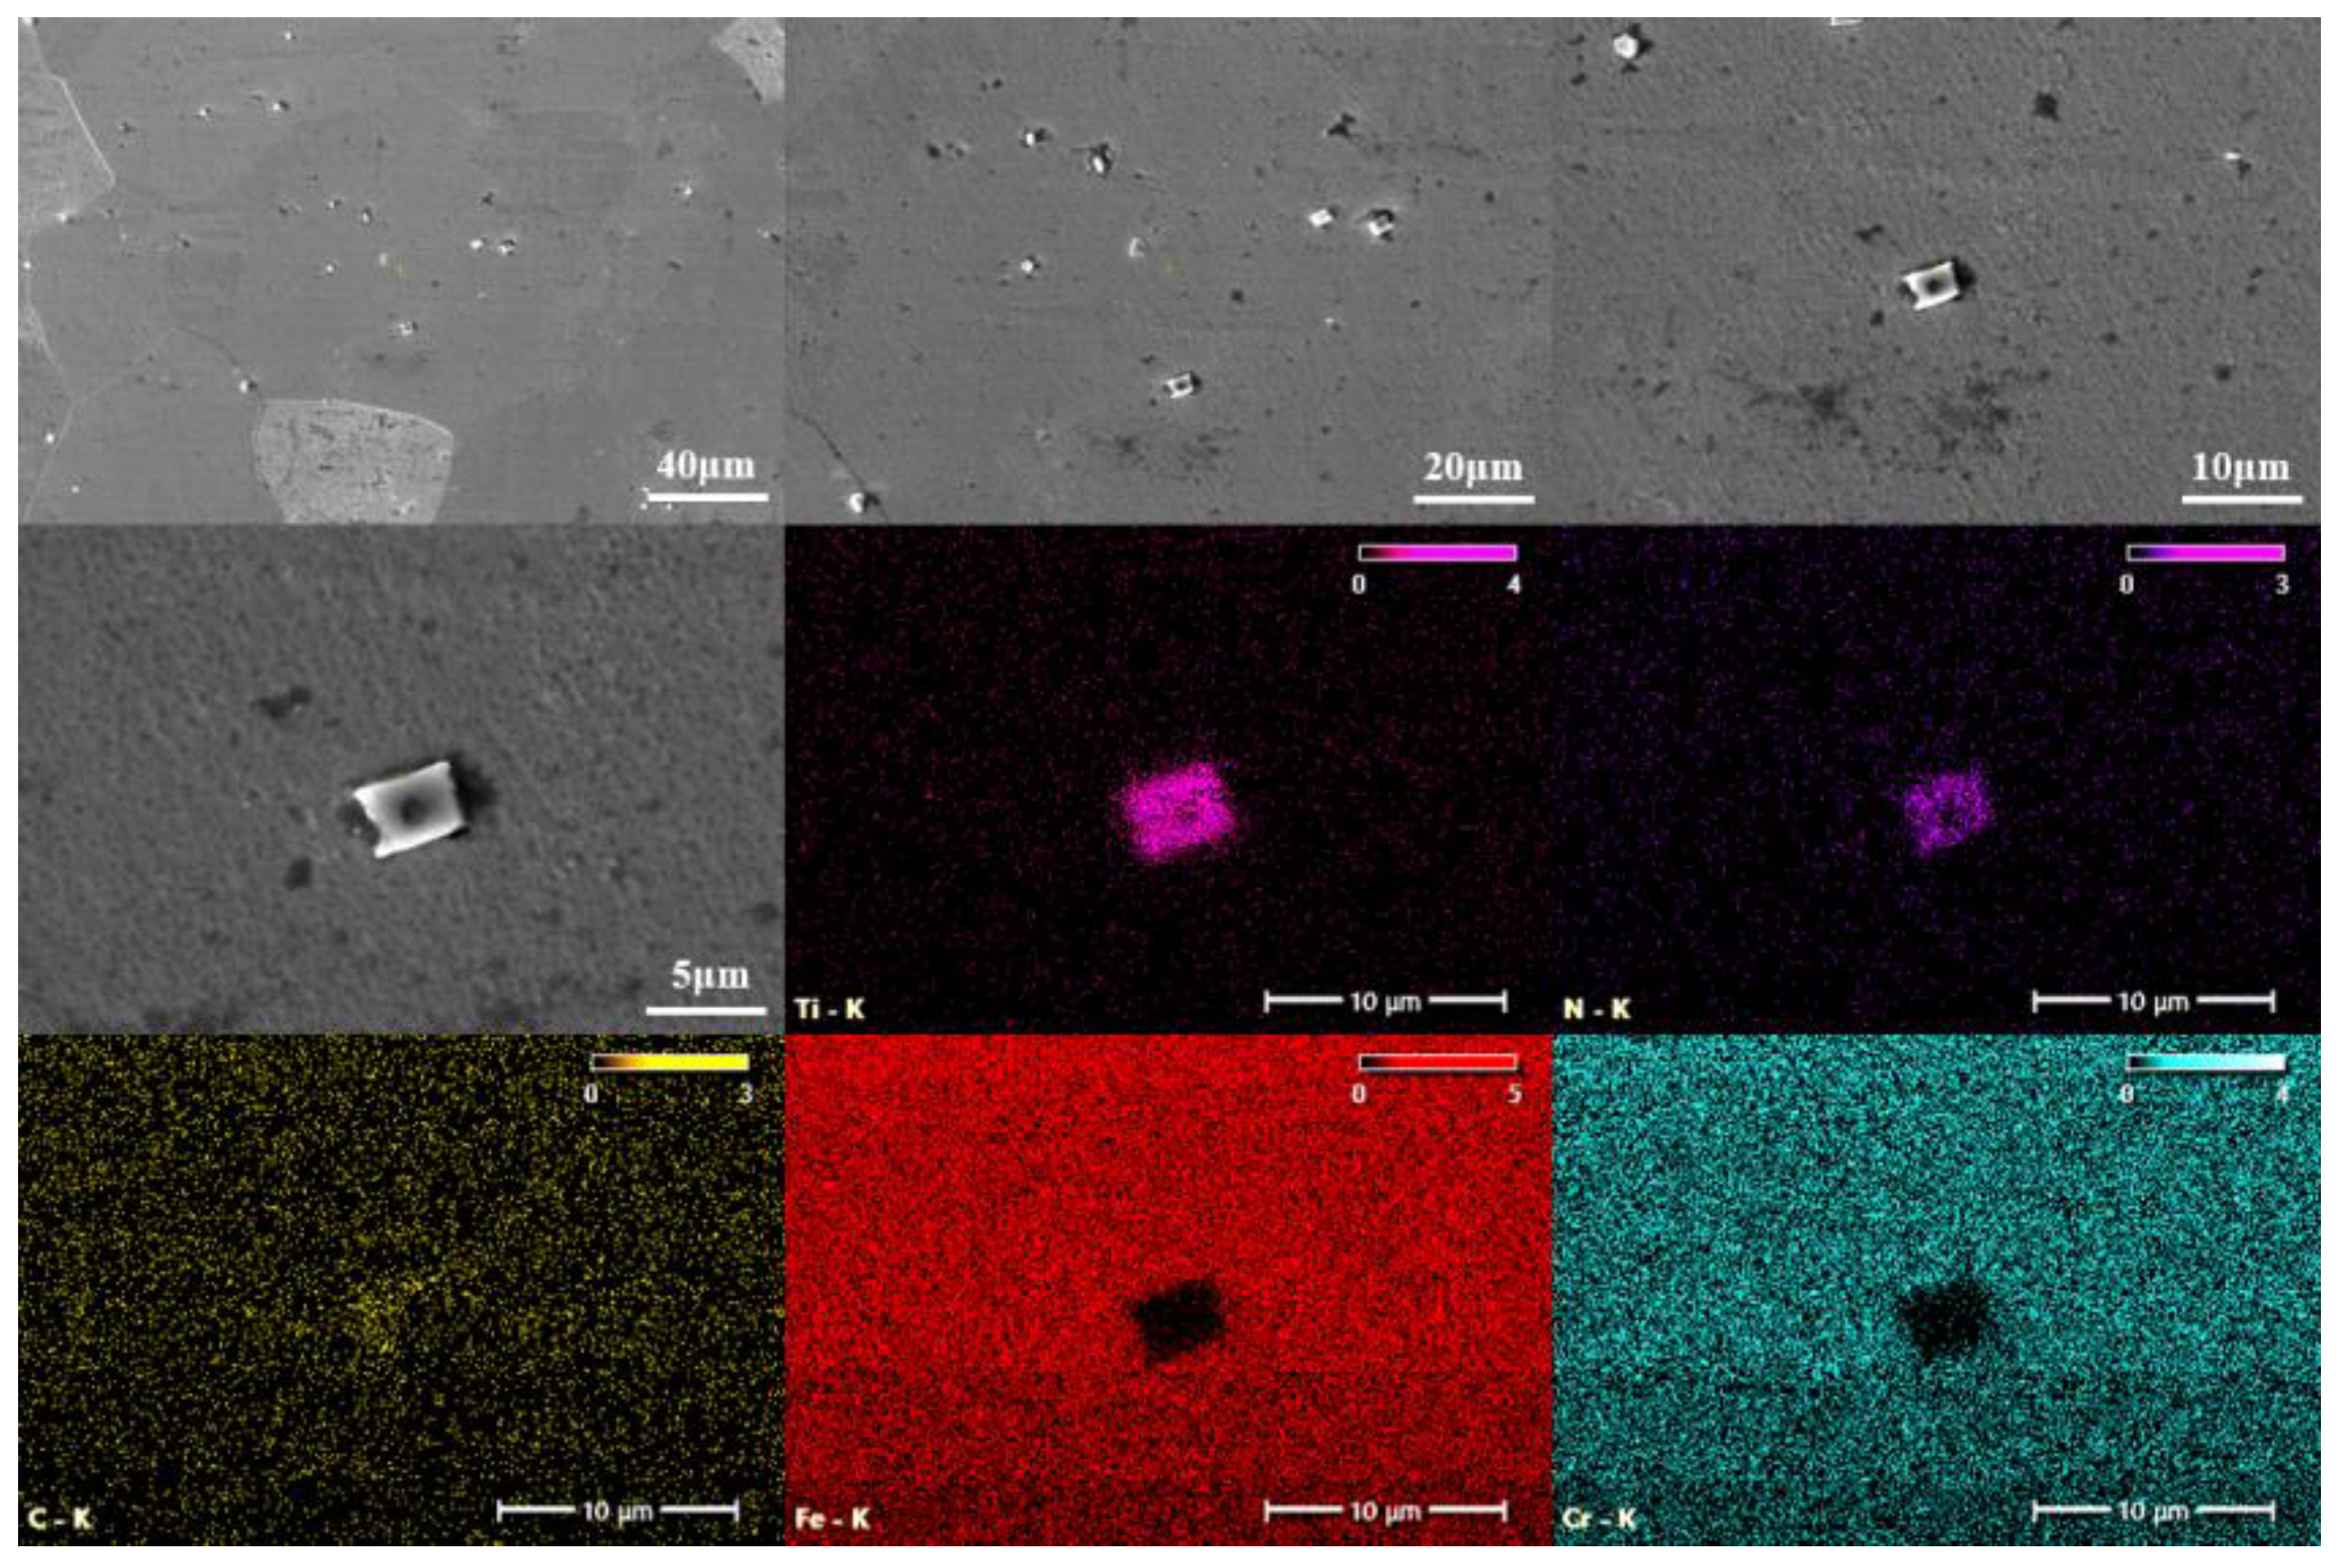
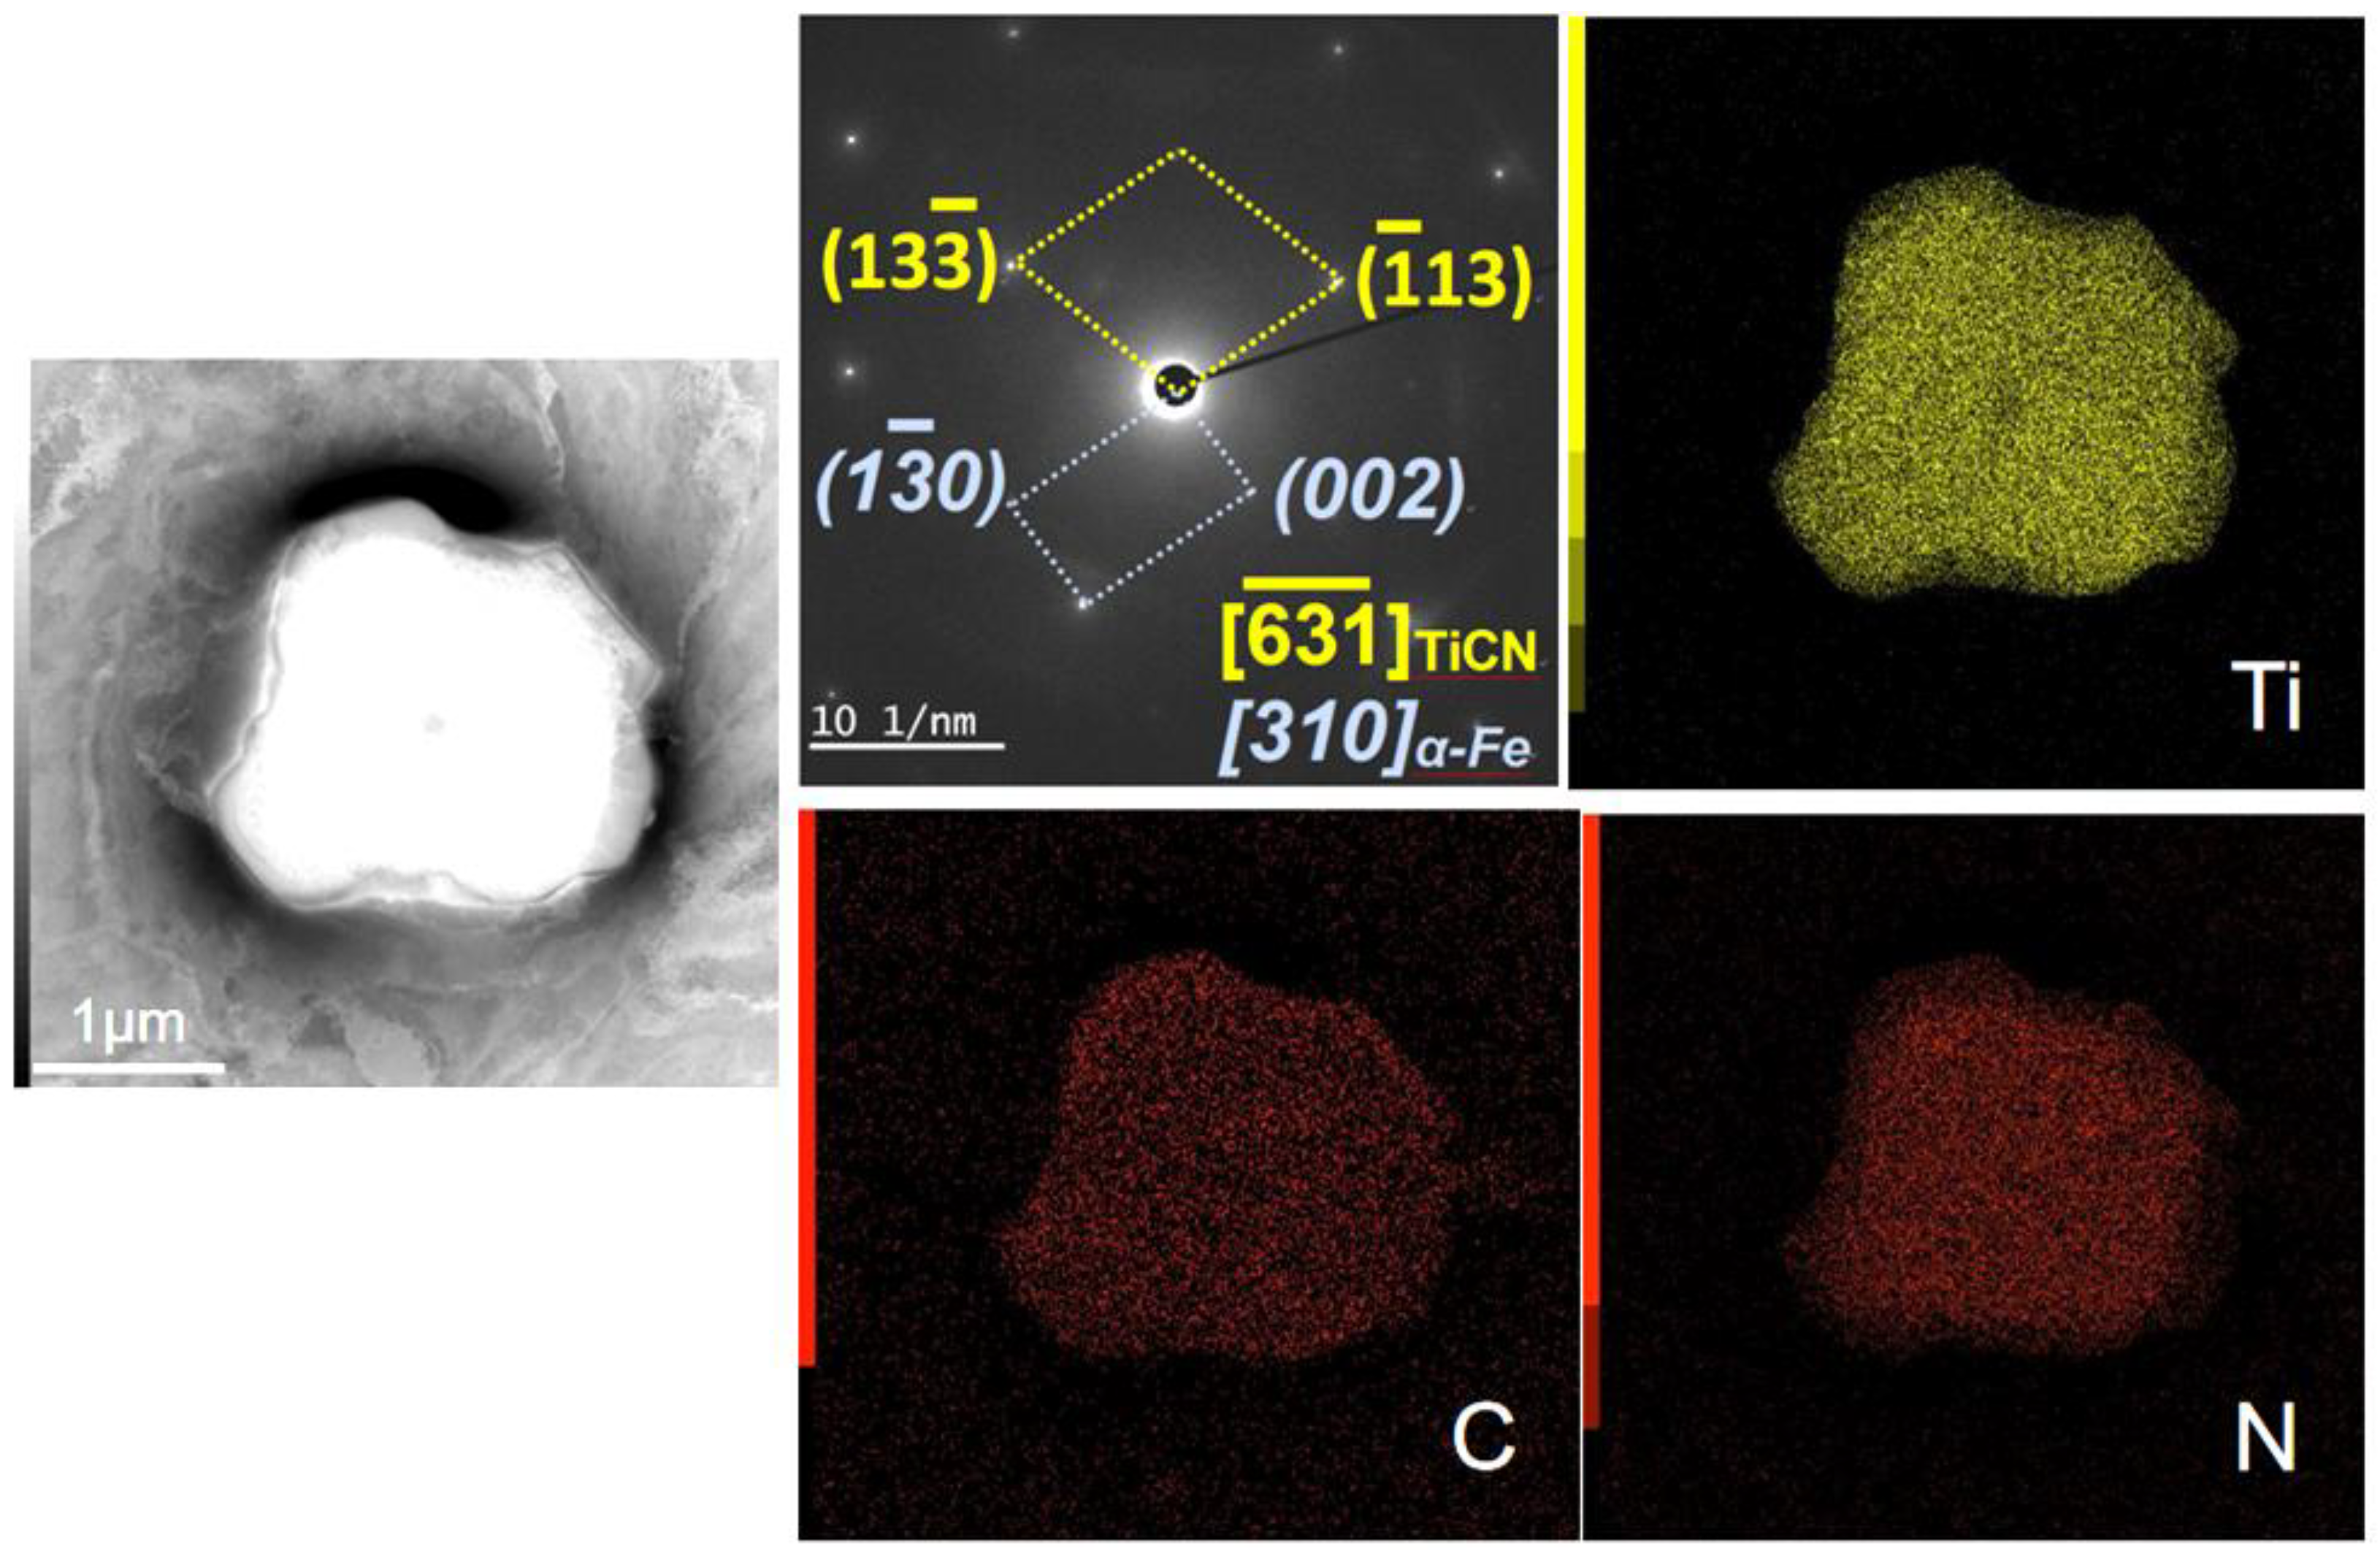
3.2. Analysis of Precipitate Phase

Analyses of the precipitate phase were conducted with SEM and Energy Dispersive Spectrometer (EDS) for 70–930 °C tested steel specimen to further characterize the type and features of the precipitate phase, as shown in Figure 7. It could be determined that the precipitate particles of the rectangular prism were Ti(C,N) with a size of approximately 4 μm. This was due to the strong affinity of Ti for the C and N impurity elements in the matrix, and the carbonitrides of Ti shared the same crystal structure, enabling an unlimited solid solution between them. Consequently, fine Ti(C,N) composite precipitate phases were readily formed within the matrix steel. MC-type particles were randomly distributed in Ti-containing FSS, which had a less detrimental effect on the performance of stainless steel and could also play a role in pinning grain boundaries. Previous studies have shown that these larger Ti(C,N) precipitates were mostly formed during the solidification process of the steel [28].
The morphology and structure of the precipitate phase for the 70–930 °C tested steel specimen via TEM bright field image are shown in Figure 8. It was observed that Ti, C, and N elements were uniformly distributed in the particles from the EDS energy spectrum analysis. Through single-crystal electron diffraction analysis, the matrix phase band axis [310]α-Fe and the precipitate phase band axis [ 631 ¯ ]TiCN were obtained, and the precipitate phase particles were determined as Ti(C, N).

3.3. Mechanical Properties

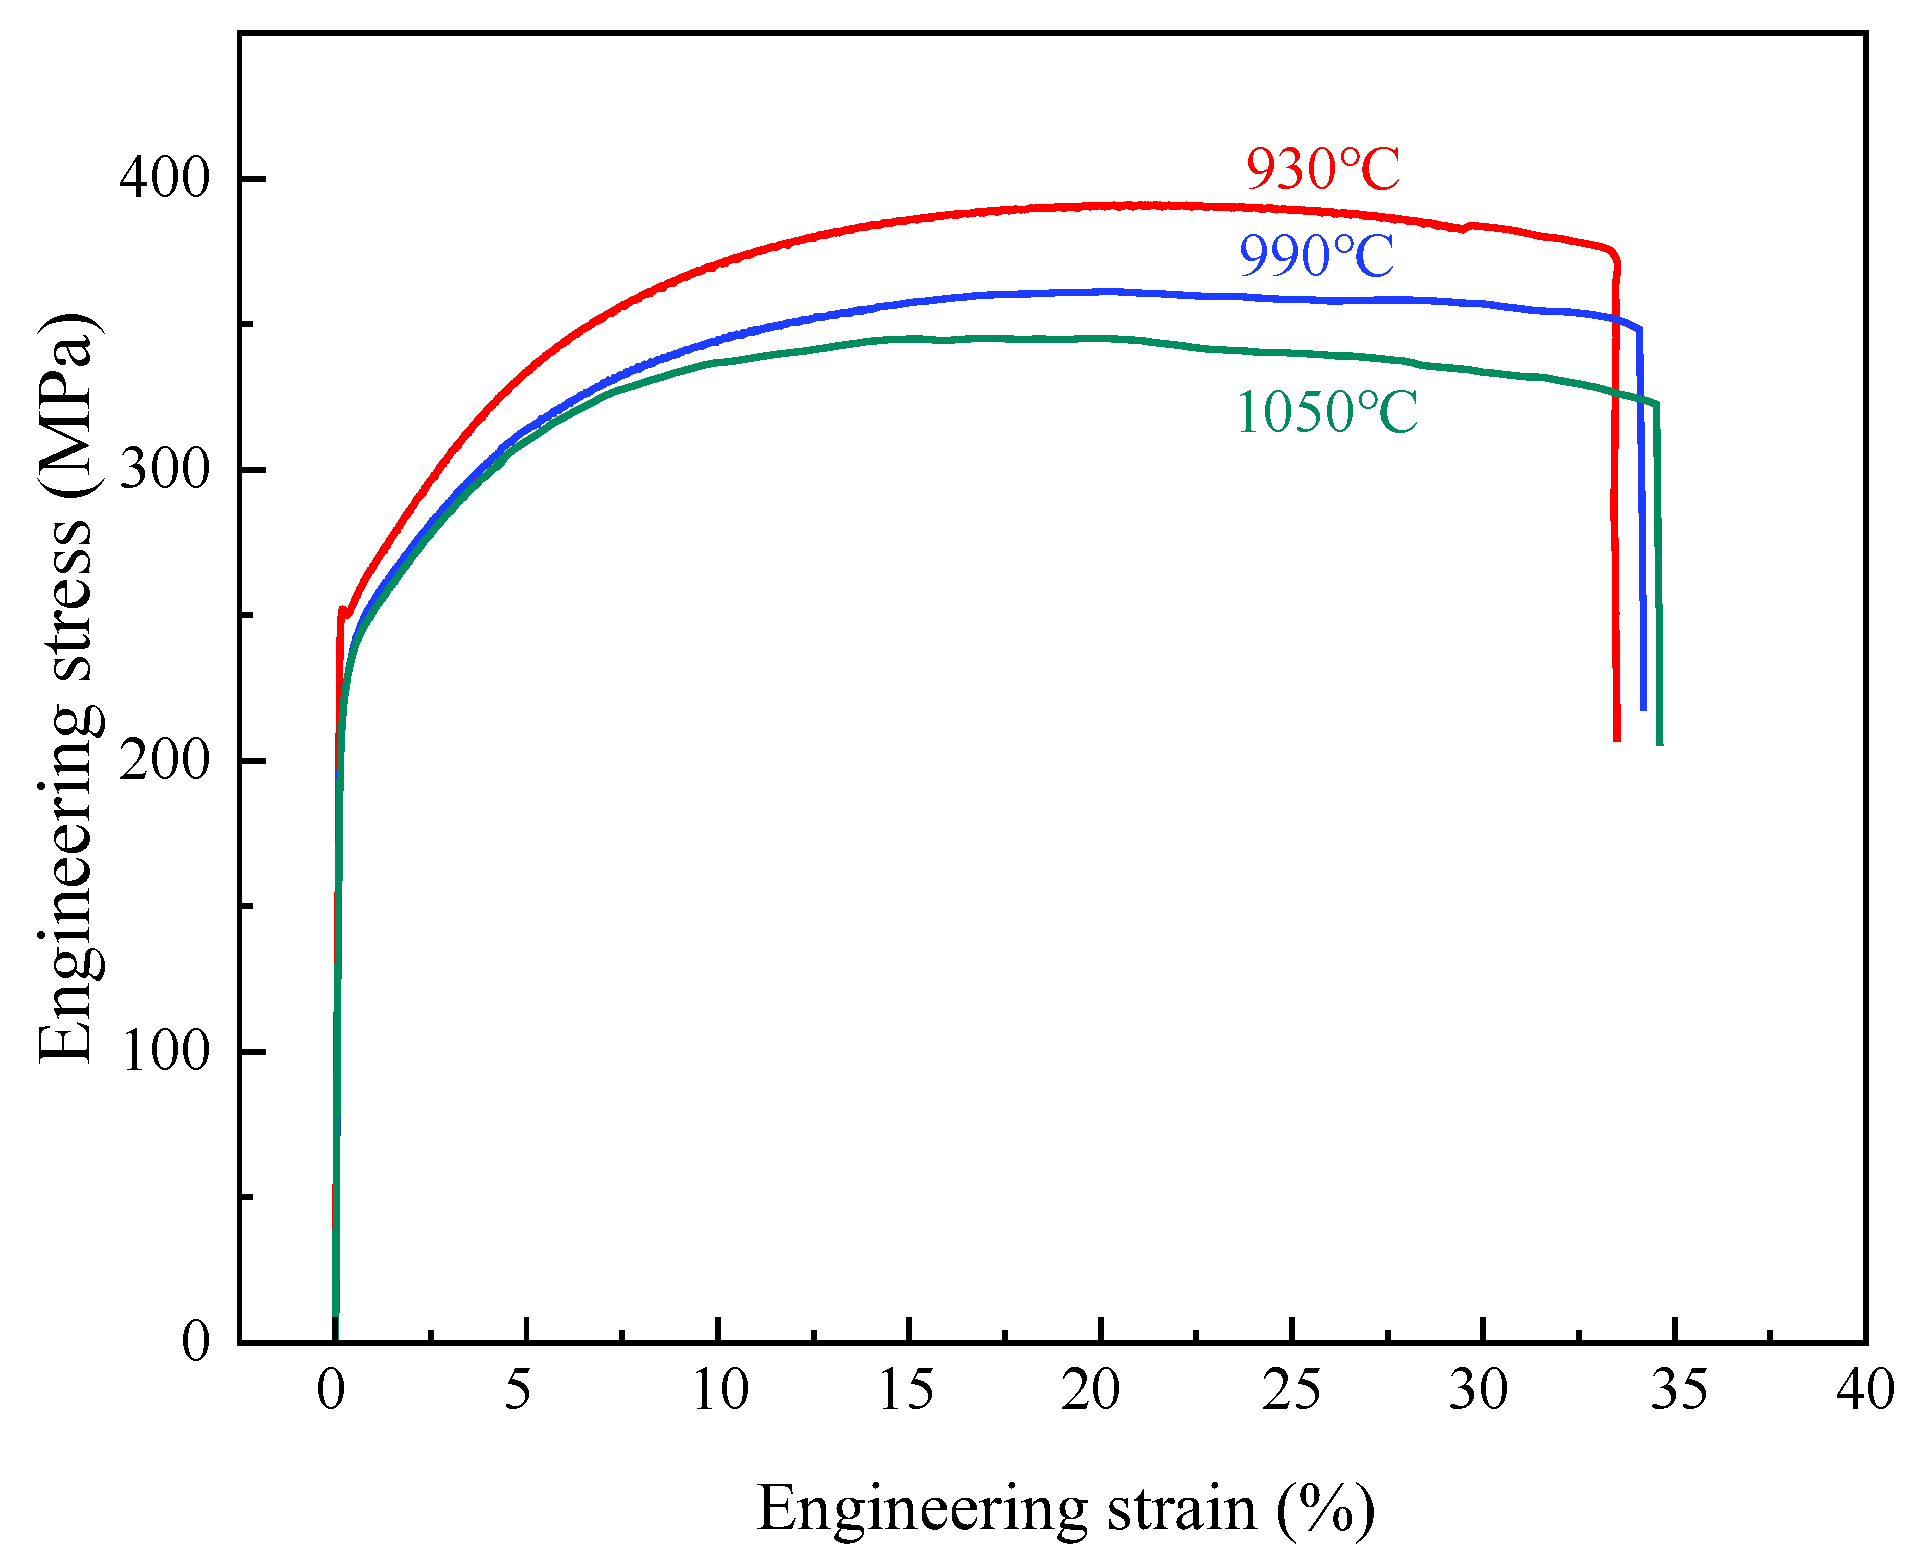
3.3.1. Tensile Properties

The tensile properties of tested steels were conducted on three stainless steel specimens, and the engineering stress-strain curves were drawn, as illustrated in Figure 9. With the increasing annealing temperature, the tensile strength gradually decreased, while the elongation presented an increased trend. From the stress-strain curves, it could be observed that all three types of steel had strengthening and necking without a distinct yield platform. The stress value with a residual deformation of 0.2% was regarded as its yield strength. The tensile strength, yield strength, and elongation of the three tested steels were 409.1 MPa, 251.4 MPa, 30.9%; 394.3 MPa, 232.1 MPa, 31.4%; 378.6 MPa, 230.2 MPa, and 33.4%, respectively. With the increase in annealing temperature, the grain size gradually increased, the tensile strength decreased, and the elongation slowly increased.
The area values under the engineering stress-strain curves, namely static toughness, were 122.75, 116.51, and 113.29, respectively. The area under the engineering stress-strain curve of the 930 °C annealed specimen was the largest. Therefore, the comprehensive mechanical properties of the 930 °C annealed tested steel achieved the best match. Here, the cold-rolled sheet had a reduction rate of 70%. At lower annealing temperatures, only a few regions within ultra-pure ferritic stainless steel can initiate recrystallization, and the number of new grains is small. However, as the temperature rises, the phenomena of recrystallization nucleation and grain growth occur over a large area inside the entire material. After recrystallization is completed, with the further increase in the annealing temperature, the diffusion ability of atoms is enhanced further, and grain boundaries possess stronger migration capabilities. Under such circumstances, large grains will continuously engulf the surrounding small grains by taking advantage of the relatively easy diffusion of atoms at their grain boundaries, thus enabling themselves to grow continuously. Moreover, at high temperatures, the migration rate of grain boundaries accelerates, which in turn makes the growth rate of grains increase, ultimately leading to a continuous increase in grain size. The increase in the cold-rolling annealing temperature promotes the grain growth and recrystallization of ultra-pure ferritic stainless steel. Changing the microstructure of the material finally results in changes in macroscopic mechanical properties, such as a decrease in tensile strength and an increase in elongation. The specimen with large deformation had more stored energy; thus, it was easier to recrystallize, and the grain growth rate was faster. Therefore, the annealing temperature should not be overly high [29]. In the context of industrial applications, our discovery of the optimal annealing temperature at 930 °C serves as crucial parameter guidance for the manufacturing process. Specifically, at this precise temperature, the experimental steel is capable of attaining the optimal balance between strength and plasticity. This balance is of great practical significance as it plays a vital role in enhancing the quality and performance of the final products.
In the tested steel, TiN and TiC precipitated by the combination of Ti with C and N, and these two precipitates were infinitely miscible in the form of Ti(C,N). The Ti in the steel mainly combined with C and N, with a small amount combining with Fe and other elements, and there was no solid solution of Ti in the matrix. Therefore, the solid solution strengthening effect of Ti was not taken into consideration. The primary focus was on the precipitation and dispersion strengthening effects of Ti(C,N) in the matrix. This implies that the material enhanced its strength by impeding the motion of dislocations when subjected to external forces. When the alloy is subjected to external forces, it could increase its strength by hindering the movement of dislocations. According to thermodynamic calculations by the property module of Thermo-calc, the theoretical yield strength of the steel under precipitation strengthening was 276.2 MPa, which was consistent with the test value. Furthermore, the Ti(C,N) particles in the steel precipitated from the supersaturated solid solution within the matrix during the heat treatment process. Therefore, it could be concluded that Ti(C,N) mainly improved the strength of the steel through precipitation strengthening.

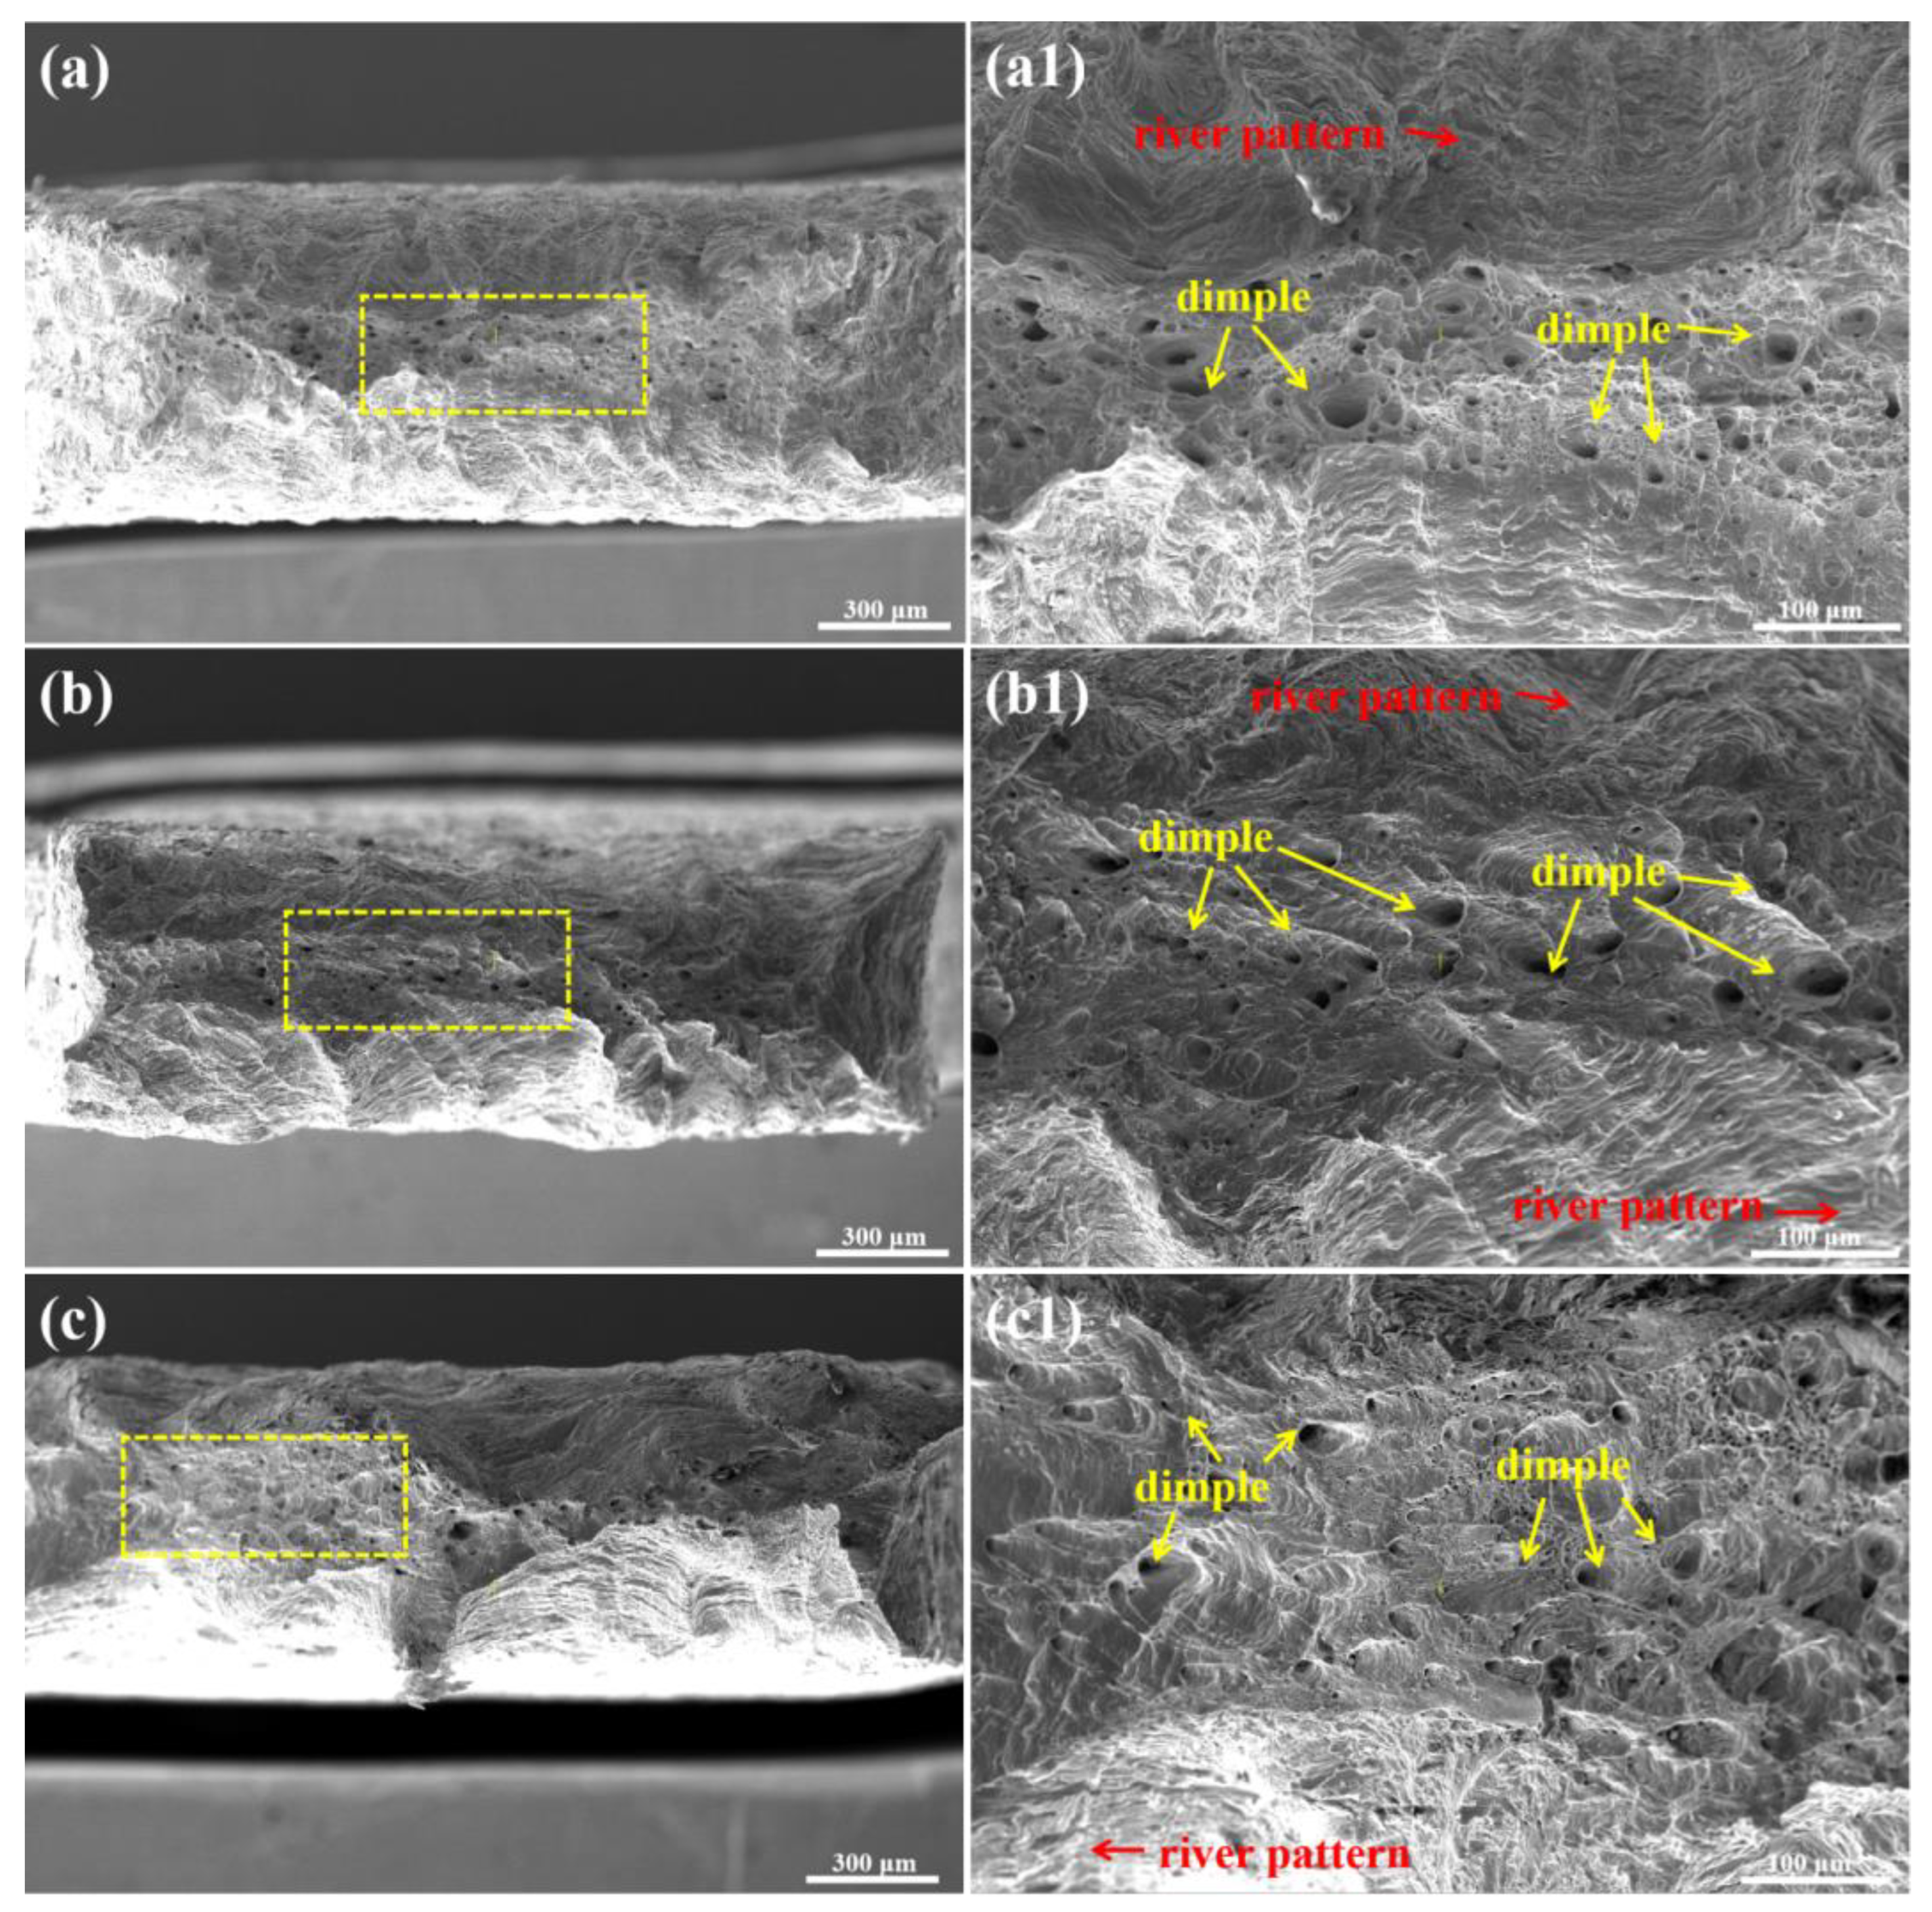
3.3.2. Fracture Morphology

Figure 10 illustrates the SEM image of the tensile fracture morphology of steel at different annealing temperatures. The fractures of the three specimens exhibited ductile fracture characteristics. The micro-morphology for the fracture surface was mainly composed of equiaxed dimples in different sizes, which could effectively alleviate the stress concentration generated at the crack and impede the movement of the crack. Some regions consisted of toughness pits and river patterns, which manifested obvious transgranular cleavage fractures. Overall, the fracture surface was uneven and had obvious signs of resistance to deformation. The interior of the fracture surface was gray and dull fibrous, with numerous toughness pockets located at the center of the fracture. The river-like patterns were mostly situated at the edge of the fracture, and there were intergranular cracks and a small and shallow amount of tearing edges formed by energy release in some areas of the fracture edge. In Figure 10(a,a1), the dimple shapes were notably round, equiaxed, relatively shallow, and evenly distributed. In Figure 10(b,b1), the size of the dimples increased and deepened, and they were no longer equiaxed circles. The area of dimples expanded, the height of the tear ridge of the tensile fracture rose, and the surface roughness intensified in Figure 10(c,c1). This indicated that the specimen had good plasticity at this time. The change in the size of dimples reflects the variation in the degree of local plastic deformation during the fracture process of the material. As the size of dimples increases, it implies that the material has undergone more significant plastic deformation at high temperatures. This is because high temperatures make it easier for atomic diffusion and dislocation movement to occur, which promotes the coordinated deformation within the material and consequently leads to the enlargement of the dimple size. The results demonstrated that the number of equiaxed dimples increased, and their distribution became more uniform with the increasing annealing temperature. This suggested that the plasticity of the steel continued to improve at this time. This phenomenon might be related to the gradually increasing proportion of recrystallization in the cold-rolled microstructure of specimens.
SEM observation disclosed the existence of fragmented inclusion particles at the bottom of the toughness dimples on the tensile fracture surface, as shown in Figure 11a. It was discovered that the main component of the precipitate was Ti(C,N) based on the analysis of SEM and EDS in Figure 11b.

3.3.3. Surface Roughness

The surface roughness of each steel sheet was typically assessed based on the average roughness (Ra), the maximum peak-to-valley height (Rt), and the determination of the surface roughness grade according to the Ra value.
The specimen annealed at 930 °C, the arithmetic mean deviation of the surface profile was Ra = 0.026 μm, the total height of the surface profile was Rt = 0.378 μm, and the grade of surface roughness was close to 13. Annealing temperature at 990 °C, Ra = 0.050 μm, Rt = 0.983 μm, and the grade of surface roughness was 12 [30]. Annealing at 1050 °C, Ra = 0.031 μm, Rt = 0.578 μm, and the grade of surface roughness was 12. The surface roughness of the steel annealed at 930 °C was the smallest, with a smooth surface and good wear resistance, which was beneficial for extending the service life and had good comprehensive mechanical properties. The appropriate annealing temperature could promote recrystallization and grain growth on the steel surface, thereby improving the surface quality [31]. Excessive annealing temperature may lead to excessive oxide scale and decarburization layer on the surface of the alloy, which increases the surface roughness [32]. Therefore, 930 °C was the suitable annealing temperature. Next, we would focus on the research objectives of tested steel cold-rolled with 70% deformation and annealed at 930 °C. For convenience and distinction, the following was labeled as 70–930 °C tested steel.

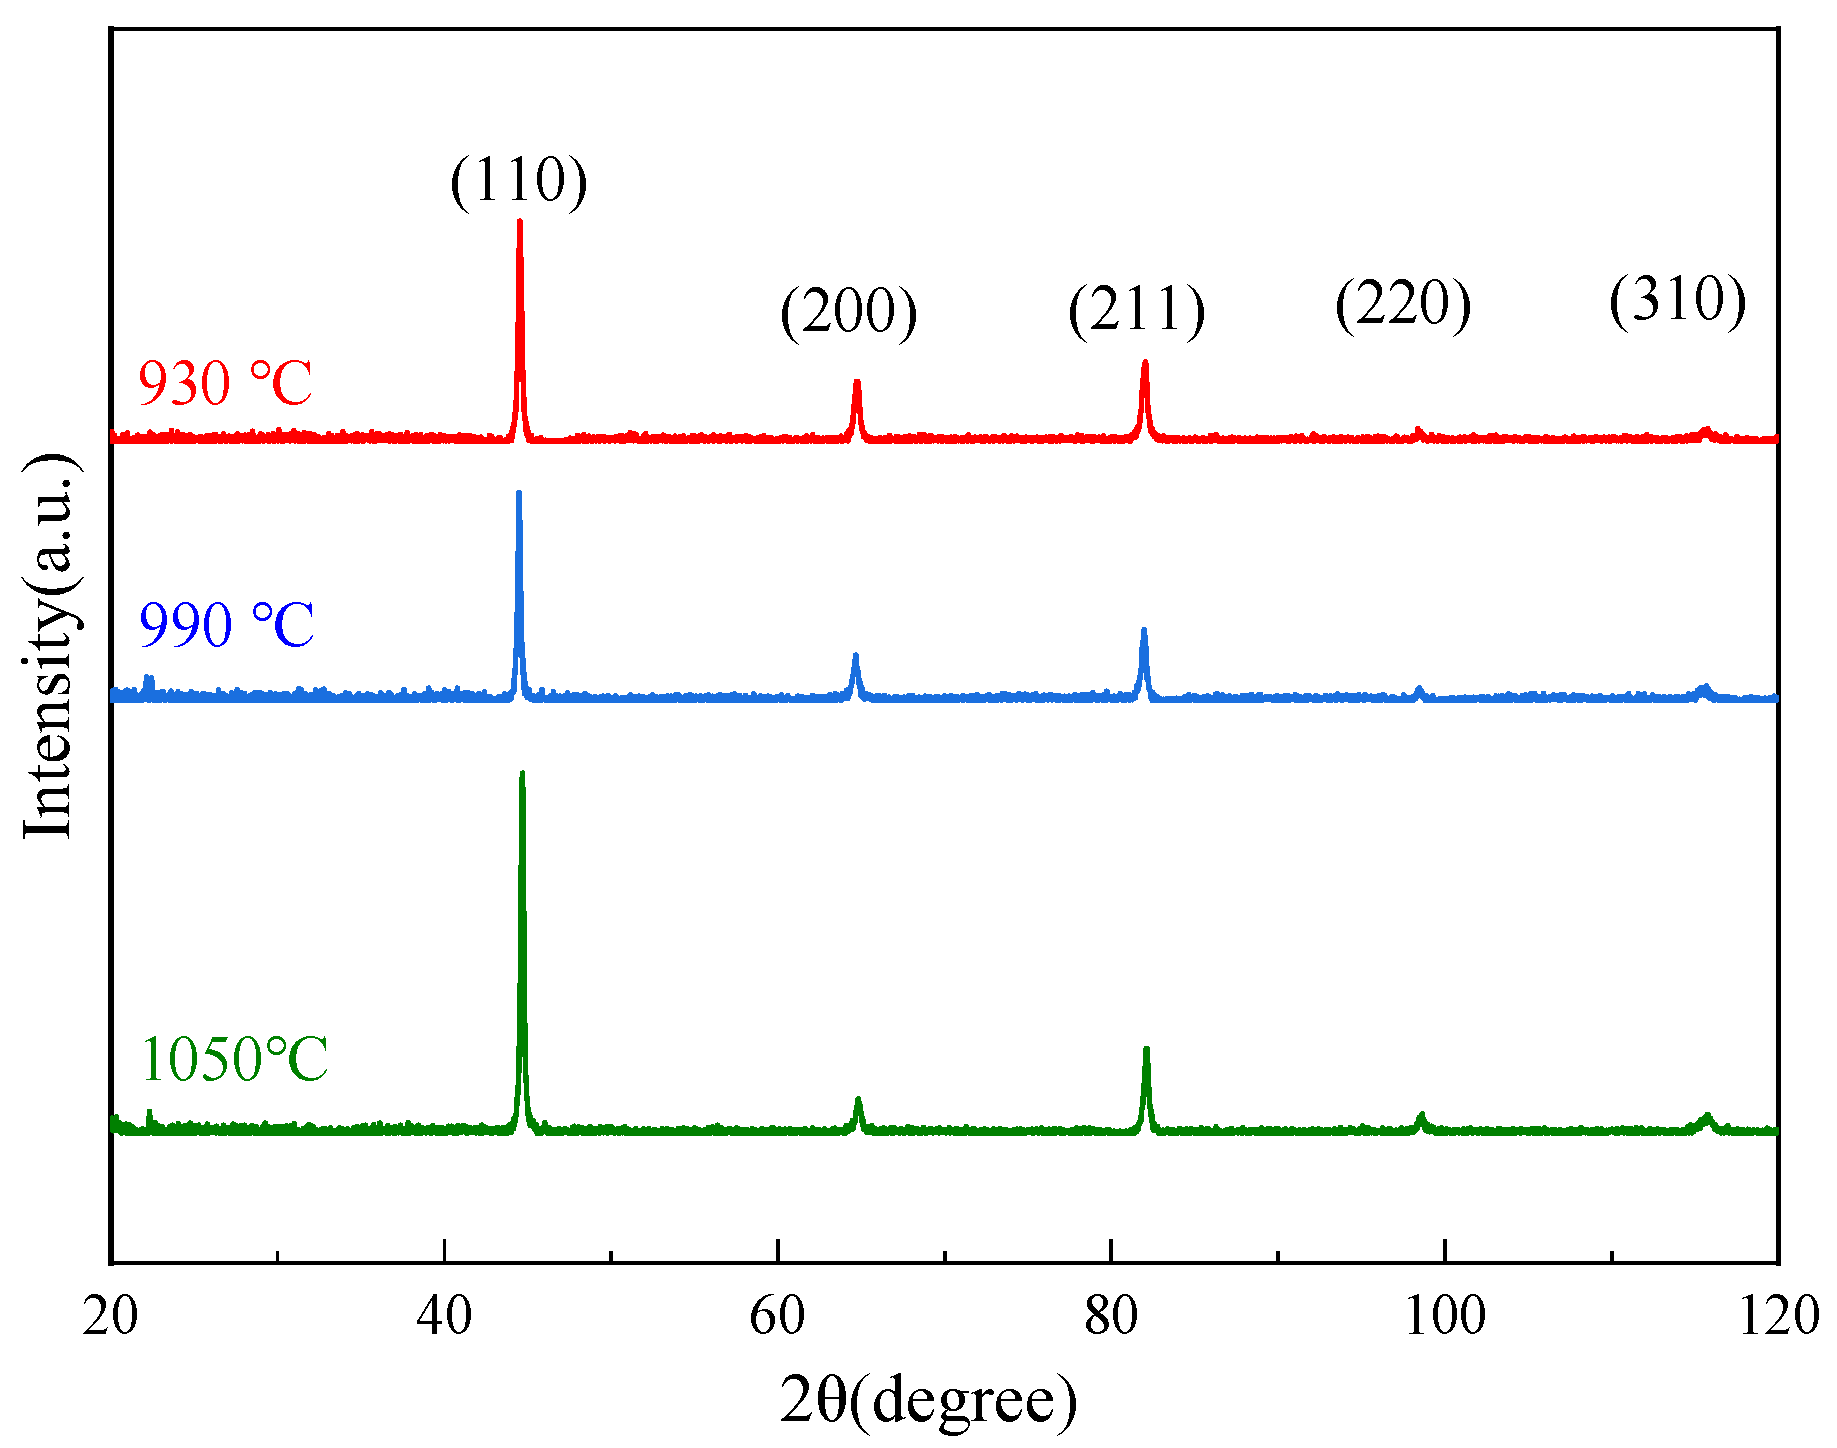
3.4. Microscopic Texture Measurement of 70–930 °C Tested Steel

Figure 12a shows the OIM map of 70–930 °C the tested steel. Different colors stood for different grain orientations. It could be observed that the number of grains with (111) orientation was evidently abundant. Moreover, the micro grain orientation along the rolling direction still presented a certain banded distribution characteristic. This implied that the grains of 70–930 °C tested steel would exhibit a (111) preferred orientation. The specimen contained grains with a particle size of less than 60.0 μm, accounting for as high as 97.3%, while only an extremely small number of coarse grains existed. Figure 12b was the inverse pole figure. On the inverse pole figure in the rolling direction, the rolling direction indices with relatively high orientation density were <100> and <110>. Among them, the orientation density at <110> reached 1.42, which indicated that the <110> direction of each grain in the steel was parallel to the rolling direction. The orientation density on the inverse pole figure normal to the rolling plane reached up to 2.61 at most. The rolling plane index was {111}, indicating that an obvious {111}<110> planar texture was formed after large-deformation cold rolling. According to the crystal zone law, a kind of fiber texture could be derived as (111) [ 1 1 ¯ 0 ] .
Figure 13 represents the distribution map of grain boundary states and the statistical chart of grain boundary orientation differences of the steel, respectively. In Figure 13a, the thin green lines revealed the small angle grain boundaries with the orientation difference of grains on both sides ranging from 2° to 15°, and the thick black lines represented the large angle grain boundaries with the orientation difference of grains on both sides greater than 15°. It was observed that the black large-angle grain boundaries occupied the majority of the figure. According to the statistical results in Figure 13b, the microstructure of cold-rolled annealed steel showed that small angle grain boundaries accounted for 11.4%, and large angle grain boundaries greater than 15° accounted for 88.6%. There were no sub-angle grain boundaries less than 2°. The orientation difference between adjacent grains increased and became a small angle grain boundary (2–15°) after static recovery. The driving force for recrystallization was the unreleased deformation storage energy after recovery, and its nucleation mechanisms included grain boundary arching mechanism, subgrain migration mechanism, and subgrain merging mechanism. The orientation difference between adjacent grains further increased and became large angle grain boundaries after recrystallization. Most of the grains in the microstructure had completed static recovery and recrystallization, with only a small number of grains in the recovery stage, and there were basically no deformed grains that had not undergone static recovery and recrystallization.
Figure 14 shows the ODF section (φ2 = 45°) of 70–930 °C tested steel. The steel obtained a relatively complete fiber texture after cold rolling and annealing, with the strong points of the texture mainly concentrated near {334} < 0 4 ¯ 3 > and {554}<22 5 ¯ >. The texture orientation density of {334} < 0 4 ¯ 3 > was f(g) = 3.99, the texture orientation density of {554}<22 5 ¯ > was f(g) = 3.80. At the same time, there were still weak fiber textures remaining in the tissue. The strong {554}<22 5 ¯ > texture and a certain amount of {112}<110> texture would induce good formability. Previous research has demonstrated that the formation of the {554}<22 5 ¯ > texture primarily stems from “Zener” drag and selective growth. In the course of cold rolling and annealing procedures, these factors collaborate with each other, facilitating the emergence of this particular texture. Specifically, “Zener” drag was capable of impeding the migration of grain boundaries, which consequently exerted an impact on the growth and orientation of grains. Meanwhile, selective growth endows grains with specific orientations to take the upper hand in the competitive growth process. It was precisely under such a mechanism that the {554}<22 5 ¯ > texture was likely to be formed, and its distinctive orientation structure furnishes advantageous conditions for formability.

4. Conclusions

  • Three tested steels 00Cr21CuTi retain within the ferrite single phase region throughout both the cold rolling and annealing processes, thereby preventing any α→γ phase transformation. After annealing, the steel undergoes recrystallization. Grain size significantly increases with the increase in annealing temperature. After annealing at 930 °C, the grains are fine and uniform which are mainly composed of equiaxed grains. ( 1 ¯ 01 ) and ( 01 1 ¯ ) crystal orientations on the [111] crystal plane are determined.
  • As the annealing temperature increases, grain size and elongation gradually increase, tensile strength slowly decreases, and the surface roughness first increases and then decreases trend. The maximum strength plastic product of the specimen is obtained during annealing at 930 °C, and the tested steel gets the best match of strength and plasticity.
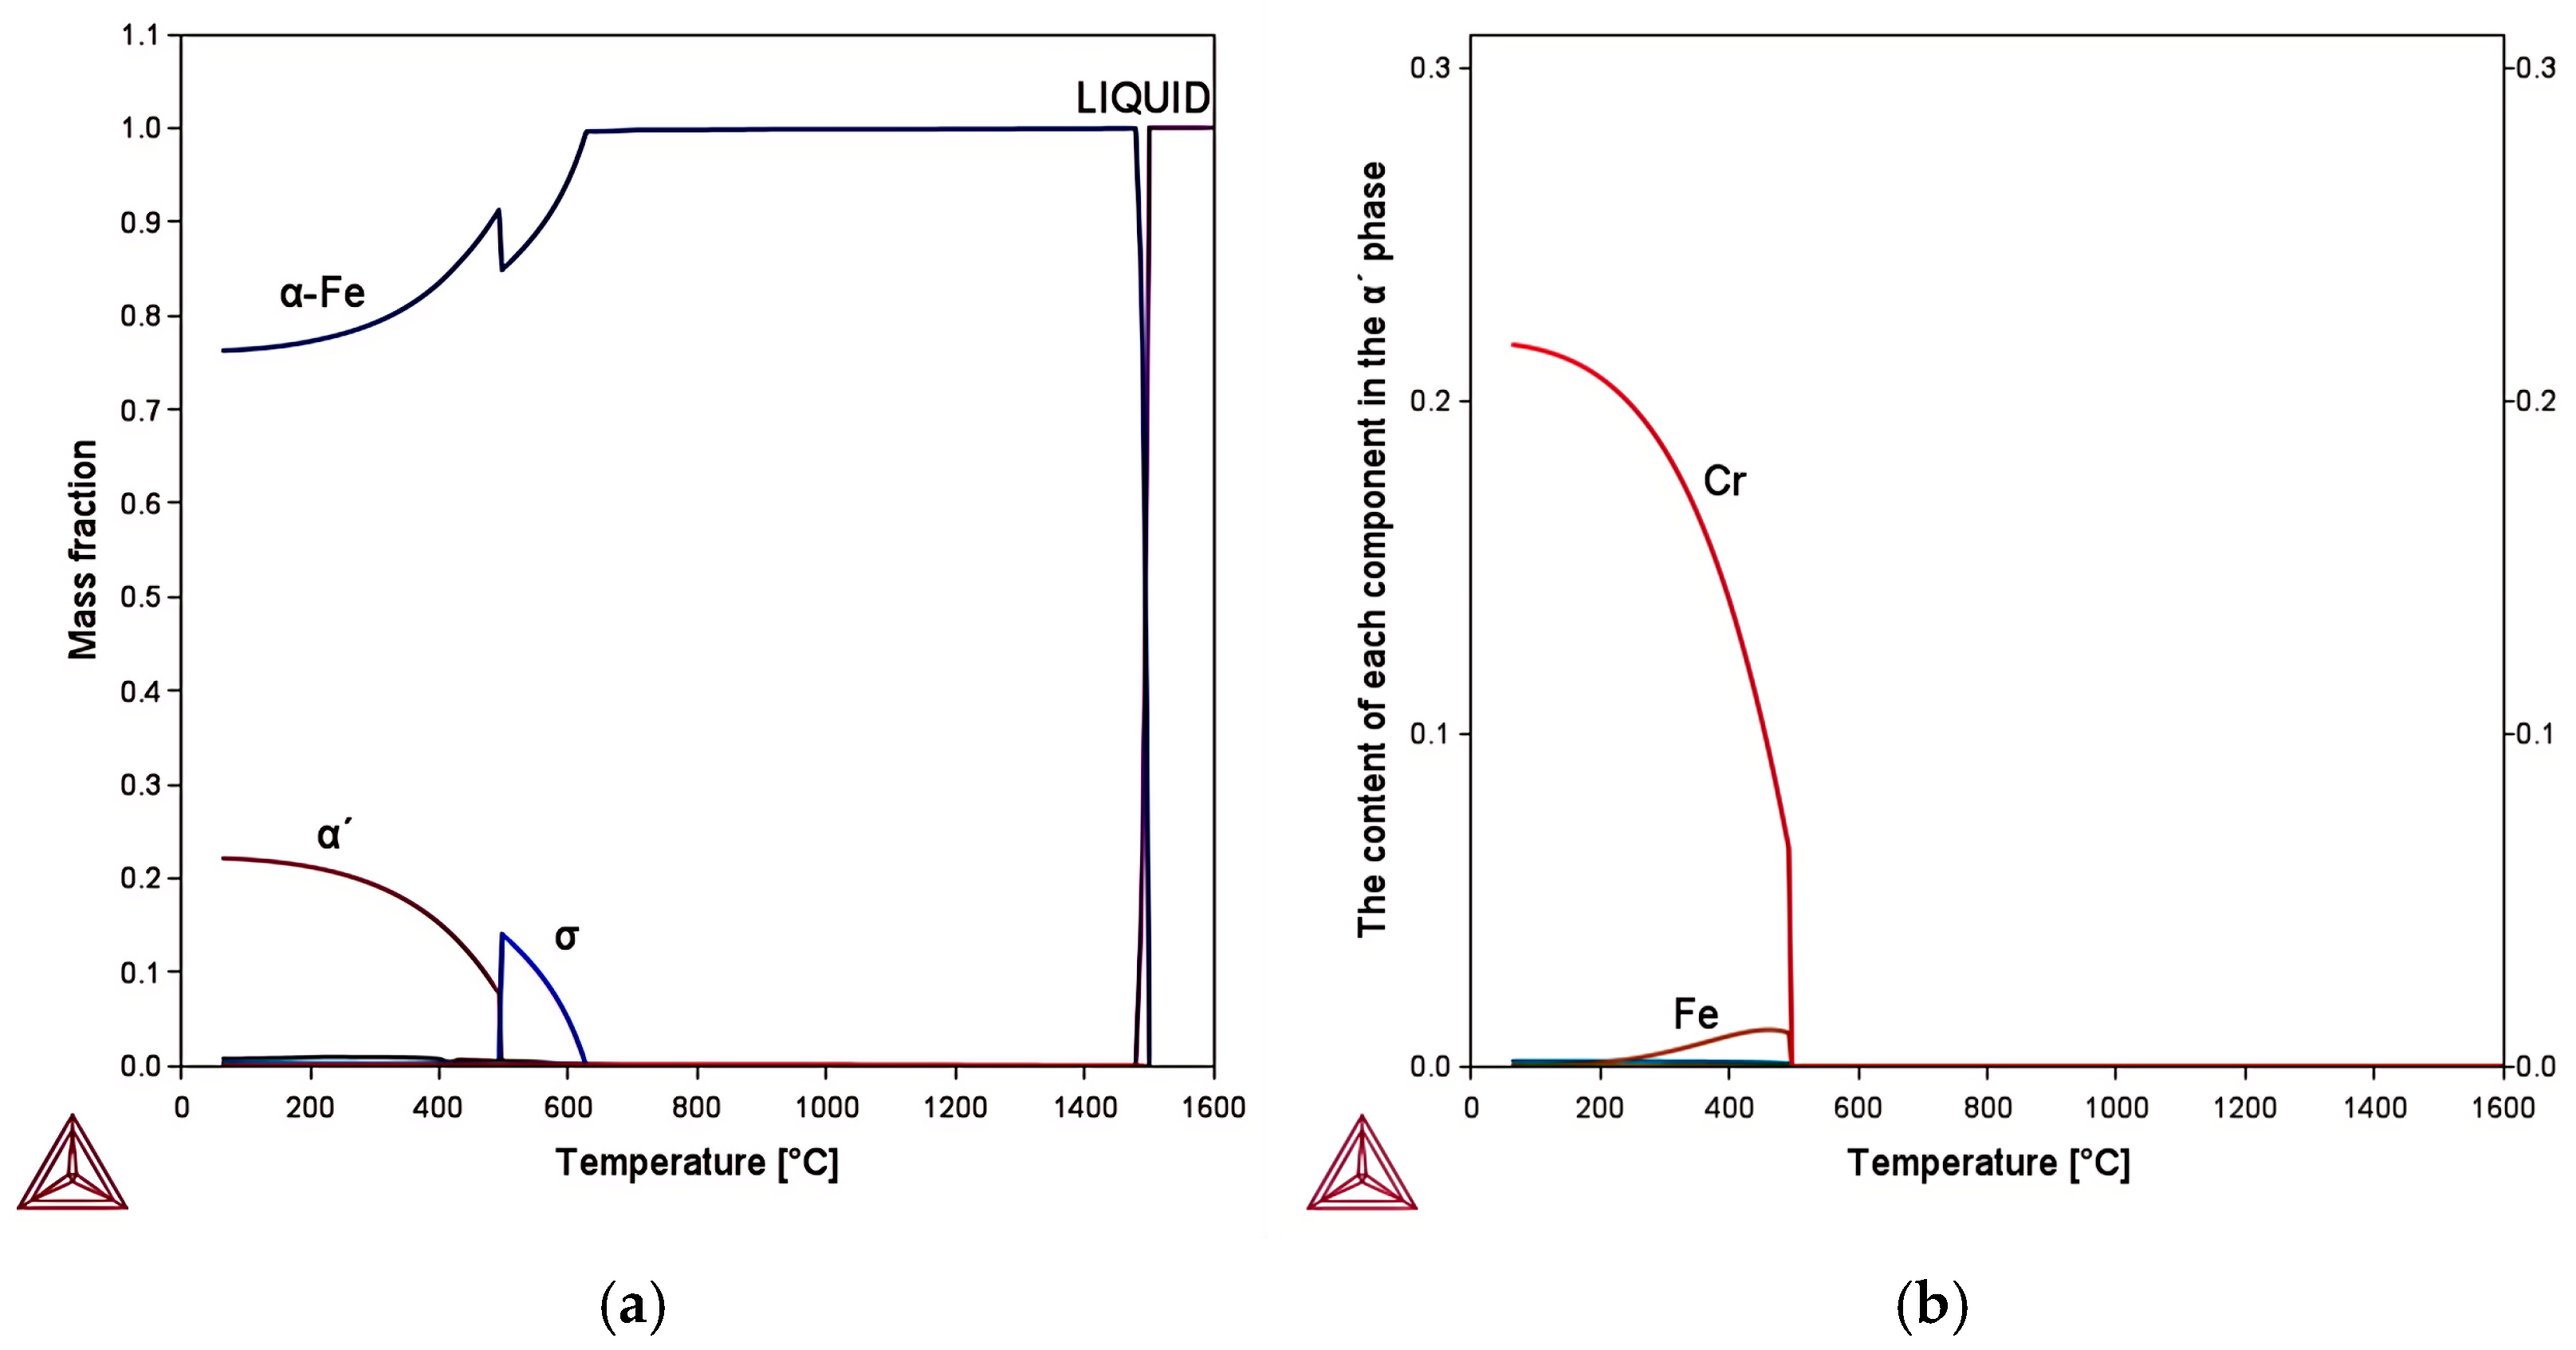
  • The analysis of the tensile fracture surface revealed the presence of fractured inclusion particles at the base of the tough pit, and it was determined that Ti(C,N) constituted the primary component of the precipitate. From the dimensions of these precipitates, it could be deduced that Ti(C,N) particles primarily form during the solidification process. Furthermore, thermodynamic calculations indicated that the theoretical yield strength of precipitation-strengthened steel was approximately 276.2 MPa, which closely corresponded with experimental measurements. Ti(C,N) functions predominantly as a precipitation-strengthening agent within the steel.
  • Most of the grains had completed static recovery and recrystallization in 70–930 °C tested steel, with only a small number of grains in the recovery stage, and there were basically no deformed grains that had not undergone static recovery and recrystallization. FSS obtained a relatively complete fiber texture after cold rolling and annealing, with the strong points of the texture mainly concentrated near {334}<0 4 ¯ 3> and {554}<22 5 ¯ >.

Author Contributions

Conceptualization and methodology, J.S., Y.L. and P.L.; validation, G.M., J.S. and Y.L.; formal analysis and investigation, G.M., Y.G. and L.T.; data curation, G.M., Y.L. and J.S.; writing—original draft preparation, G.M.; writing—review and editing, J.S.; visualization, Y.G. and L.T.; supervision, J.S. and P.L.; project administration and funding acquisition, J.S. and P.L. All authors have read and agreed to the published version of the manuscript.

Funding

This work was supported by the Science and Technology Major Project of Gansu Province (grant no. 22ZD6GA008); Science and Technology Plan Project of Gansu Province (grant no. 23JRRA758); Lanzhou Scientific and Technological Plane Projects (grant no. 2022-2-80).

Data Availability Statement

The original contributions presented in the study are included in the article, further inquiries can be directed to the corresponding authors.

Conflicts of Interest

Authors Guocai Ma, Jie Sheng and Yufeng Li were employed by the Jiuquan Iron and Steel Group. The remaining authors declare that the research was conducted in the absence of any commercial or finanical relationships that could be construed as a potential conflicts of interest.

References

  1. Wang, G.B.; Cheng, G.G.; Li, J.Y.; Ruan, Q.; Pan, J.X.; Chen, X.R. Decarburization modelling of VOD in ultra-pure ferritic stainless steel. J. Iron Steel Res. 2020, 32, 968–976. [Google Scholar]
  2. Shanmugam, K.; Lakshminarayanan, A.K.; Balasubramanian, V. Tensile and impact properties of shielded metal arc welded AISI 409M ferritic stainless steel joints. J. Mater. Sci. Technol. 2009, 25, 181–186. [Google Scholar]
  3. Sheng, J.; Wei, J.F.; Li, Z.N.; Man, K.; Chen, W.Q.; Ma, G.C.; Zheng, Y.H.; Zhan, F.Q.; La, P.Q.; Zhao, Y.C.; et al. Micro/nano-structure leads to super strength and excellent plasticity in nanostructured 304 stainless steel. J. Mater. Res. Technol. 2022, 17, 404–411. [Google Scholar] [CrossRef]
  4. Panfilova, L.M.; Smirnov, L.A. Structural features of structural steels microalloyed with nitrogen and vanadium. Metallurgist 2015, 58, 916–920. [Google Scholar] [CrossRef]
  5. Liu, J.Y.; Cheng, Z.; Huang, Y.H. Hot ductility of a Nb-microalloyed 1800 MPa grade hot-stamping steel. Iron Steel 2023, 58, 169–177. [Google Scholar]
  6. Singh, N.; Casillas, G.; Wexler, D.; Killmore, C.; Pereloma, E. Application of advanced experimental techniques to elucidate the strengthening mechanisms operating in microalloyed ferritic steels with interphase precipitation. Acta Mater. 2020, 201, 386–402. [Google Scholar] [CrossRef]
  7. Wang, H.C.; Li, Y.J.; Detemple, E.; Eggeler, G. Revealing the two-step nucleation and growth mechanism of vanadium carbonitrides in microalloyed steels. Scr. Mater. 2020, 187, 350–354. [Google Scholar] [CrossRef]
  8. Hu, J.J.; Ren, Y.; Zhang, L.F. Formation mechanism of NbC precipitates in micro-alloyed Nb high-strength steel. Chin. J. Eng. 2023, 45, 1729–1739. [Google Scholar]
  9. Liu, H.L.; Liu, L.L.; Li, X.; Chen, L.Q. Influence of cold rolling process on formability of a ferritic stainless steel. J. Northeast. Univ. (Nat. Sci.) 2019, 40, 1009–1104. [Google Scholar]
  10. Wang, Y.W.; Cai, Q.W.; Zhang, C. Effect of annealing temperatureon recrystallization microstructure and texture of ultra-pure ferritic stainless steel. In Proceedings of the 10th China Iron and Steel Annual Conference and the 6th Baosteel Academic Annual Conference, Shanghai, China, 21 October 2015. [Google Scholar]
  11. Su, H.D.; Fan, W.; Feng, Y.L. Effect of annealing temperature on microstructure and mechanical properties of cold-rolled Fe-0.4C-10Mn-6Al high strength steel. Heat Treat. Met. 2022, 47, 126–131. [Google Scholar]
  12. Tanure, L.P.D.A.R.; Alcântara, C.M.D.; Oliveira, T.R.D.; Santos, B.D.; Gonzalez, B.M. Microstructural characterization and mechanical behavior during recrystallization annealing of Nb-stabilized type ASTM 430 and Nb-Ti-stabilized ASTM 439 ferritic stainless steels. J. Mater. Res. Technol. 2019, 8, 4048–4065. [Google Scholar] [CrossRef]
  13. Chen, C. Effect of Rolling and Heat Treatment on Microstructure and Properties of Ferritic Stainless Steel. Master’s Thesis, Changchun University of Technology, Changchun, China, 2022. [Google Scholar]
  14. Gao, F.; Liu, Z.Y.; Zhang, W.N. Microstructure texture and deep drawability of ultrapurified ferritic stainless steel. J. Northeast. Univ. (Nat. Sci.) 2009, 30, 661–664. [Google Scholar]
  15. Liu, H.T.; Gao, F.; Ma, D.X.; Liu, Z.Y.; Wang, G.D. Effect of annealing temperature of an ultra-purified Cr17 ferritic stainless steel hot-rolled sheet on formability of cold-rolled and annealed sheet. Iron Steel 2010, 45, 75–79. [Google Scholar] [CrossRef]
  16. Park, S.H.; Kim, K.Y.; Lee, Y.D.; Yong, D. Evolution of microstructure and texture associated with ridging in ferritic stainless steels. ISIJ Int. 2002, 42, 100–105. [Google Scholar] [CrossRef]
  17. Shen, K.; Duggan, B.J. Microbands and crystal orientation metastability in cold-rolled interstitial-free steel. Acta Mater. 2007, 55, 1137–1144. [Google Scholar] [CrossRef]
  18. Yang, Y.G.; Luo, X.; Lei, M.G.; Fang, X.; Li, S.H.; Wu, Y.X.; Mi, Z.L. Microstructure evolution and strengthening mechanisim of air-hardening steel subuected to the austenitizing annealing treatment. Mater. Res. Express 2023, 10, 106502. [Google Scholar] [CrossRef]
  19. Li, B.Y.; Liu, K.; Feng, Y.L.; Li, T.; Wang, S.H.; Su, H.D. Effect of cold rolling reduction on microstructure and mechanical properties of Fe-10Mn-6Al-0. 4C steel. Iron Steel 2024, 59, 159–167. [Google Scholar]
  20. Meng, Y.H.; Sheng, J.; Ma, Z.W.; Gao, Y.; Tuo, L.X.; Duan, H.Y.; Man, K. The inffuence of the hot-rolling temperature on the microstructure and mechanical properties of Ti-Nb microalloyed 21%Cr ferritic stainless steel. Metals 2024, 14, 1099. [Google Scholar] [CrossRef]
  21. Choi, W.J.; Lee, S.Y.; Park, C.W.; Park, J.H.; Byun, J.M.; Kim, Y.D. Effect of titanium addition on mechanical properties of Mo-Si-B alloys. Int. J. Refract. Met. H. 2019, 80, 238–242. [Google Scholar] [CrossRef]
  22. Sheng, J.; Man, K.; Ma, G.C.; Meng, Y.H.; Li, Y.F.; Gao, Y.; Yang, P.H.; Wei, J.F.; La, P.Q. Effect of annealing temperature on properties and second phase characteristics of 443 stainless steel hot-rolled sheets. Ferroelectrics 2024, 618, 2181–2195. [Google Scholar] [CrossRef]
  23. Xu, S.K.; Sun, X.Y.; Chen, L.; Li, J.H.; Zhang, M.Y. Effect of annealing on microstructure and mechanical properties of cold-rolled 430 ferritic stainless steel. Chin. J. Process. Eng. 2024, 2–10+1. Available online: http://kns.cnki.net/kcms/detail/11.4541.TQ.20240711.1645.002.html (accessed on 24 November 2024).
  24. GB/T 6394-2002; Method for Determination of Average Grain Size of Metals. Standardization Administration of the People’s Republic of China: Beijing, China, 2002; p. 11.
  25. GB/T 228.2-2010; Method for Tensile Testing of Metallic Materials at Room Temperature. Standardization Administration of the People’s Republic of China: Beijing, China, 2010; p. 12.
  26. GB/T 1031-2009; Parameters and Values of Surface Roughness. Standardization Administration of the People’s Republic of China: Beijing, China, 2009.
  27. Park, J.T.; Szpunar, J.A. Evolution of recrystallization texture in non-oriented electrical steels. Acta Mater. 2003, 51, 3037–3051. [Google Scholar] [CrossRef]
  28. Liu, H.T.; Ma, D.X.; Gao, F.; Wang, G.D. Effect of annealing temperature on formability of cold-rolled ultra-purified Cr17 ferritic stainless steel sheet. J. Northeast. Univ. (Nat. Sci.) 2010, 31, 1266–1269. [Google Scholar]
  29. Yang, S.Q.; Li, W.H. Surface Roughnessing Theory and New Technology; Springer: Berlin/Heidelberg, Germany, 2018. [Google Scholar]
  30. Zhang, P.C.; Wu, H.B.; Tang, D.; Huang, J.G.; Wang, L.B. Dissolving behaviors of Carbonitrides in Nb-V-Ti and V-Ti microalloying steels. Acta Metall. Sin. 2007, 7, 753–758. [Google Scholar]
  31. Sun, H.; Ren, H.P.; Jin, Z.L.; Han, M. The affection of annealing on the recrystallization. In Proceedings of the 2nd National Conference on Backscatter Electron Diffraction (EBSD) Technology and Its Applications and the 6th National Conference on Materials Science and Image Technology, Baotou, China, 20 August 2007. [Google Scholar]
  32. Wang, K.L.; Wang, P.B.; Zhang, Y.; Qiao, C.B.; Li, Q.L. Microstructure and mechanical properties of Al-7Si alloy with trace AlFeCuTi alloy addition. Chin. J. Rare Met. 2024, 48, 922–932. [Google Scholar]
Figure 1. The steel of (a) full composition phase diagram, (b) elemental composition in α′ phase.
Metals 14 01367 g001
Figure 2. The shape and dimension of the tensile specimen.
Metals 14 01367 g002
Figure 3. OM images at different annealing temperatures (a) 930 °C, (b) 990 °C, and (c) 1050 °C.
Metals 14 01367 g003
Figure 4. Statistical chart of average grain size distribution at various annealing temperatures (a) 930 °C, (b) 990 °C, and (c) 1050 °C.
Metals 14 01367 g004
Figure 5. XRD patterns of the annealed steel at different temperatures.
Metals 14 01367 g005
Figure 6. SEM images at various annealing temperatures (a) 930 °C, (b) 990 °C, and (c) 1050 °C.
Metals 14 01367 g006
Figure 7. Morphology and map analyses with SEM and EDS of typical precipitates in 70–930 °C tested steel.
Metals 14 01367 g007
Figure 8. TEM bright field image, SEAD photograph, and EDS analysis of precipitate phase particles.
Metals 14 01367 g008
Figure 9. Engineering stress-strain curves of the steel at different annealing temperatures.
Metals 14 01367 g009
Figure 10. Tensile fracture morphology of the steel at different annealing temperatures (a) 930 °C, (b) 990 °C, and (c) 1050 °C. (a1), (b1), and (c1) are enlarged regions of the yellow boxes in Figures (a), (b), and (c), respectively.
Metals 14 01367 g010
Figure 11. Analysis of the tensile fracture energy spectrum of the tested steel. (a) tensile fracture surface, (b) EDS analysis of precipitates within the yellow box in (a).
Metals 14 01367 g011
Figure 12. (a) OIM map; (b) inverse pole figure of 70–930 °C tested steel.
Metals 14 01367 g012
Figure 13. (a) Grain boundary state distribution map, and (b) grain misorientation statistical map of 70–930 °C tested steel.
Metals 14 01367 g013
Figure 14. The ODF section (φ2 = 45°) of 70–930 °C tested steel.
Metals 14 01367 g014
Table 1. The chemical composition of 00Cr21CuTi (wt.%).
CrTiCuNiMnSiPSCNFe
20.670.310.380.160.160.280.0130.00080.010.008Bal.
Disclaimer/Publisher’s Note: The statements, opinions and data contained in all publications are solely those of the individual author(s) and contributor(s) and not of MDPI and/or the editor(s). MDPI and/or the editor(s) disclaim responsibility for any injury to people or property resulting from any ideas, methods, instructions or products referred to in the content.

